Article

LiDAR Data-Driven Deep Network for Ship Berthing Behavior Prediction in Smart Port Systems

1
Navigation College, Dalian Maritime University, Dalian 116026, China
2
China Energy Shipping Company, Beijing 100080, China
*
Author to whom correspondence should be addressed.
J. Mar. Sci. Eng. 2025, 13(8), 1396; https://doi.org/10.3390/jmse13081396
Submission received: 8 July 2025 / Revised: 21 July 2025 / Accepted: 21 July 2025 / Published: 23 July 2025
(This article belongs to the Section Ocean Engineering)

Abstract

Accurate ship berthing behavior prediction (BBP) is essential for enabling collision warnings and support decision-making. Existing methods based on Automatic Identification System (AIS) data perform well in the task of ship trajectory prediction over long time-series and large scales, but struggle with addressing the fine-grained and highly dynamic changes in berthing scenarios. Therefore, the accuracy of BBP remains a crucial challenge. In this paper, a novel BBP method based on Light Detection and Ranging (LiDAR) data is proposed. To test its feasibility, a comprehensive dataset is established by conducting on-site collection of berthing data at Dalian Port (China) using a shore-based LiDAR system. This dataset comprises equal-interval data from 77 berthing activities involving three large ships. In order to find a straightforward architecture to provide good performance on our dataset, a cascading network model combining convolutional neural network (CNN), a bi-directional gated recurrent unit (BiGRU) and bi-directional long short-term memory (BiLSTM) are developed to serve as the baseline. Experimental results demonstrate that the baseline outperformed other commonly used prediction models and their combinations in terms of prediction accuracy. In summary, our research findings help overcome the limitations of AIS data in berthing scenarios and provide a foundation for predicting complete berthing status, therefore offering practical insights for safer, more efficient, and automated management in smart port systems.

1. Introduction

In recent years, estimates from the International Maritime Organization (IMO) and relevant agencies indicate that approximately 80% of global goods trade depends on maritime transport [1]. Ports, as key nodes within the global logistics network, play an indispensable role in facilitating cargo transportation of goods and maintaining the resilience of international supply chains. However, with the continued expansion of global trade and the surge in maritime traffic, smart ports are facing unprecedented operational pressures. One of the most pressing challenges is managing the increasing density of ship movements, particularly during berthing activities, a highly sensitive and risk-prone phase of port operations. The integration of the Automatic Identification System (AIS) enables the acquisition of massive ship navigation data. The proliferation of AIS data has spurred the development of data-driven methods, such as machine learning and deep learning techniques, which have demonstrated considerable effectiveness in predicting ship trajectories, especially in open-water conditions. However, research specifically focusing on berthing scenarios remains relatively scarce. A ship’s motion status is more complex and more evidently affected by external factors during berthing, thereby imposing higher demands on prediction accuracy and robustness. The tasks of berthing behavior prediction (BBP) aim to analyze historical berthing data to predict the future berthing trajectory, angle, and speed. Studies on ship BBP hold substantial importance in smart port systems.
Overall, compared to traditional maritime surveillance methods, AIS data have advantages for remote maritime monitoring and large-scale trajectory prediction due to their wide coverage and high sampling rates. However, this update frequency, while sufficient for open-water navigation, proves critically insufficient for high-precision scenarios like ship berthing, where vessel dynamics change rapidly. Specifically, for the purpose of berthing analysis, AIS data are characterized by sparse and uneven update intervals, and relatively coarse positional accuracy. Furthermore, AIS data transmission is vessel-initiated and subject to delays, signal interference, and occasional data loss or incompleteness, further compromising the reliability and continuity of information during this critical phase. Most critically, the berthing phase involves intricate interactions between the ship and dynamic environmental factors, resulting in highly nonlinear and variable motion patterns that are not easily captured or predicted by AIS data-driven models. Therefore, there is a pressing need to develop novel methods well-suited for berthing scenarios capable of delivering comprehensive and accurate ship BBP.
To address these issues, integrating Light Detection and Ranging (LiDAR) presents a feasible and promising solution, which has demonstrated significant potential in enhancing the precision and timeliness of data acquisition in complex and dynamic maritime environments. LiDAR generates high-precision point cloud data that effectively captures the spatial structure and temporal changes of the target, which is particularly crucial for identifying subtle and frequent behavioral changes of ships during berthing. Furthermore, the high refresh rate of LiDAR enables real-time data updates, facilitating continuous monitoring and awareness of a ship’s berthing motion. Within this context, this paper proposes a novel solution for ship BBP tasks based on LiDAR data, aiming to enhance the accuracy, robustness, and stability of predictive models in berthing scenarios. Considering the absence of publicly available LiDAR-captured berthing datasets, we constructed a dedicated dataset by deploying a shore-based LiDAR system in an actual port environment, and designed a baseline for this dataset. The experimental results show that the performance of the proposed baseline is better than other commonly used methods. Visualization results further indicate that the predictions of the LiDAR data-driven method are acceptable in real berthing scenarios, especially for large ships. Hence, our findings in this study provide better services for a range of smart port applications, including collision warning, berthing route planning, and autonomous decision-making, thereby contributing to the development of smart port systems.
The main contributions of our work are summarized as follows:
(1)
To consider the limited research currently on ship status prediction during berthing, instead of using the AIS data typically employed, we innovatively propose a novel method for ship BBP using LiDAR data. Leveraging the high accuracy and high frequency of LiDAR data, our approach provides more reliable support for prediction models, thereby improving performance in berthing scenarios, which has rarely been addressed in previous studies.
(2)
A berthing behavior dataset is established that comprises 77 berthing activities to test our proposed method. All berthing data are collected using a shore-based LiDAR, and our previous algorithms are applied to extract berthing sequence data. Environmental variables are also introduced. The dataset provides a valuable support for subsequent research.
(3)
A baseline is designed that integrates CNN, BiGRU, and BiLSTM in a specific order for our dataset. The experimental results demonstrate its robustness, and it can serve as a foundation for further model optimization in ship BBP tasks.
More specifically, the remaining sections of this paper are structured as follows: Section 2 reviews and discusses the most relevant related work. Section 3 provides a detailed description of the overall framework and the theoretical foundations of the proposed baseline model. The dataset construction, experimental setup, results, and in-depth analysis are present in Section 4. Finally, Section 5 summarizes the paper outlines possible directions for future work.

2. Related Work

With the rising public demand for maritime transportation safety, accurate maritime traffic forecasting has become increasingly crucial. This task involves not only the large-scale prediction of routes and trajectories, but also more detailed predictions of finer aspects, such as berthing status. Currently, substantial research focuses on ship trajectory prediction based on AIS data, while the exploration of BBP remains relatively limited. The widespread application of LiDAR for monitoring ship berthing provides a feasible and promising solution to address this research gap. Therefore, the review of related work is centered on two primary aspects: (1) ship trajectory prediction based on AIS data and (2) application of LiDAR in ship berthing scenarios.

2.1. Ship Trajectory Prediction Based on AIS Data

Ship trajectory prediction is a rapidly developing and actively evolving field, with research efforts mainly focused on enhancing the accuracy and stability of prediction models [2]. With the widespread adoption of the AIS in the maritime sector, large volumes of high-frequency, high-precision spatiotemporal ship trajectory data have become available, thereby providing essential support for data-driven prediction methods. As a result, AIS data-driven methods are becoming increasingly popular in supporting ship trajectory prediction.
Traditional trajectory prediction techniques often relied on linear models [3,4,5,6], which perform adequately for short-term trajectory prediction when the ship sails in a straight line [7]. Nevertheless, as the prediction horizon extended, such linear models tended to overestimate uncertainty, leading to degraded accuracy. The advancement of machine learning methods has prompted researchers to progressively incorporate data-driven regression models and ensemble learning algorithms [8,9,10,11,12,13,14,15]. These algorithms, such as Random Forest (RF), Support Vector Regressor (SVR), and neural networks, provided enhanced ability to model nonlinear motion patterns and to handle high-dimensional inputs. Despite these improvements, their performance remained highly contingent on the identification of labels and physical knowledge.
More recently, advances in deep learning, combined with the availability of vast volumes of AIS data, have significantly accelerated research on ship trajectory prediction. Deep learning methods, with their powerful learning and adaptation capabilities, have achieved high-accuracy results when dealing with complex and dynamic trajectory data.
Among the deep learning-based methods for ship trajectory prediction based on AIS data, recurrent neural networks (RNNs), especially long short-term memory (LSTM), gate recurrent unit (GRU), and their variants are most commonly used. For instance, Zhao et al. [16] constructed a graph network of ship trajectories based on dependency relationships among trajectory points, employing a graph attention network (GAT) to extract spatial features and an LSTM to learn temporal dynamics. Forti et al. [17] investigated neural network sequence-to-sequence (Seq2Seq) models utilizing the LSTM encoder–decoder architecture designed to efficiently capture long-term temporal dependencies in continuous AIS data, thereby improving overall prediction performance. Likewise, You et al. [18] introduced an extended Seq2Seq model, with a GRU network serving as the decoder to output the target trajectory position sequence. Zeng et al. [19] proposed a spatiotemporal graph convolutional network enhanced with GRU and a self-attention mechanism for synchronized high-dimensional trajectory prediction in multi-ship encounters. Meanwhile, bidirectional variants (BiLSTM and BiGRU) have also been explored to make use of both past and future contexts during training. Liu et al. [20] developed a long-term accurate trajectory prediction model by improving the BiLSTM architecture. Song et al. [21] proposed a Seq2Seq prediction framework combining GAT and BiGRU to account for ship interaction behavior in densely trafficked maritime zones, and Bao et al. [22] proposed a high-precision ship trajectory prediction model based on a combination of multi-head attention mechanism and BiGRU to fully use the valuable information contained in AIS data.
In addition to the above methods, the generative adversarial network (GAN) and Transformer have also been applied in this domain recently. Wang and He [23] proposed a GAN network with an attention module and interaction module to predict the trajectories of multiple ships, and Zhang et al. [24] applied the trajectory GANs to enrich the historical trajectories, especially the abnormal trajectories, thereby improving prediction performance. In another study, Nguyen and Fablet [25] reframed ship trajectory prediction as a classification task, leveraging AIS data within a Transformer framework to capture long-term dependencies, which greatly enhanced prediction accuracy. Similarly, Huang et al. [26] designed a multi-scale convolution module based on a simplified Transformer and combined it with meteorological and AIS data to achieve more accurate ship trajectory predictions on a global scale.
Despite the significant advancements in trajectory prediction achieved by the aforementioned studies, most of them have concentrated on open seas or coastal navigation scenarios, where ship movements are relatively stable and paths are predictable. In contrast, ship berthing operations involve short distances and complex maneuvers, and are heavily influenced by environmental disturbances, presenting distinct trajectory characteristics. Consequently, existing AIS data-based prediction methods are insufficiently applicable in this context.

2.2. Application of LiDAR in Ship Berthing Scenarios

In smart port research, berthing safety is an important research direction. Ship BBP requires more precise and frequent motion data for support during this phase. LiDAR can generate high-resolution 3D point cloud data, which not only provides information about the ship’s spatial position relative to the berth but also accurately reflects real-time pose changes. At present, LiDAR is widely applied in monitoring the berthing of ships in inshore environments. Its real-time data acquisition capabilities enhance situational awareness and support decision-making processes for both manual and autonomous berthing operations.
Both onboard LiDAR and shore-based LiDAR play unique and irreplaceable roles within the ship berthing assistance system. Onboard LiDAR is primarily used in small ships to support the berthing process and provide real-time marine navigation information. For example, Wang et al. [27] proposed a 3D LiDAR berthing assistance system for autonomous surface vehicles, which fuses LiDAR and real-time kinematic (RTK) data to achieve precise ship positioning. Similarly, Hu et al. [28] introduced a LiDAR-based state-perception method for maritime autonomous surface ships (MASS). This method employed point cloud registration to estimate distance, speed, and approach angle. To further improve the localization accuracy of unmanned ships in berthing scenarios and accurately perceive scene information, Hu et al. [29] integrated semantic information into a LiDAR-SLAM framework, thereby improving scene understanding in complex berthing scenarios. Wang and Zhang [30] demonstrated that fusing LiDAR point clouds with millimeter-wave radar data yields robust berthing parameters, effectively monitoring the berthing process of the experimental Ro-Ro ship at Pikou Port.
Shore-based LiDAR systems, in contrast, provide extensive and stable coverage suitable for assisting larger vessels in their berthing operations. Chen and Li [31] developed a shore-based LiDAR system to extract the distance, angle, and speed of the ship relative to the berth. Building on this foundation, Chen et al. [32] conducted research on real-time tracking of berthing ships. A spatial analysis method was proposed by Wang et al. [33] for monitoring the ship’s motion state using a shore-based LiDAR. By incorporating GIS spatial analysis technology, this method can identify the motion status of ships from a spatial perspective and calculate key parameters related to berthing and unberthing. More recently, Wang and Li [34] further extended this technique to handle simultaneous multi-ship scenarios. Independently, Mentjes et al. [35] proposed a vessel-agnostic shore-based LiDAR assistant that relies on reference-point calibration to measure distance and velocity. Zhou et al. [36] utilized convex-hull algorithms and principal-component analysis for dynamic, real-time extraction of speed, angle, and distance parameters using LiDAR data.
Importantly, shore-based LiDAR systems can continuously record ship berthing data over the long term, capturing motion pose variations of ships under diverse environmental conditions. These accumulated historical data can provide a solid foundation for building accurate ship BBP models. Accordingly, in this work, we propose a ship BBP method based on LiDAR data, and establish a comprehensive dataset, which comprises sequence data with detailed berthing information. The proposed cascading network is used to extract and process key features from sequence data, aiming to achieve greater precision in ship BBP.

3. Methodology

3.1. Data Preprocessing

Data preprocessing is an essential step in any prediction method. In this study, our previous point cloud data processing flow is applied, including coordinate conversion, noise filtering, BEV image generation, and parameter extraction, as shown in Figure 1.
First, the raw point cloud data collected by a shore-based LiDAR is converted from the LiDAR coordinate system to the berth coordinate system to accurately reflect the motion of ships relative to the berth when berthing. Second, the noise points are filtered out from the converted data. The pass-through filtering is used to remove the fixed noise, such as bridge cranes and fender facilities, which often appear in the data as static points. The random noise may be mistaken for ship points and can be filtered out by the radial filtering, further enhancing the accuracy and reliability of the processed data.
The denoised point cloud data is then transformed into the BEV format to facilitate subsequent feature extraction. Specifically, the point cloud data is projected onto a 2D plane with the height information as the pixel value to generate BEV images. These images intuitively visualize the ship’s pose and trajectory changes in the horizontal plane. Finally, by analyzing the differences in pose between key points across two consecutive nodes, real-time parameters, including berthing position, angle, and speed are obtained and combined with environmental variables to form the equal-interval sequential dataset for further modeling.

3.2. The Network Architecture

In the berthing data used in this paper, the position, angle, and speed change over time. Hence, to establish a robust sequence baseline for our dataset, this study designs a combination of CNN, BiGRU, and BiLSTM as the basic network architecture for the ship BBP, to fully extract both the internal features and temporal dynamics inherent in sequence data. As shown in Figure 2, the proposed architecture consists of three main components: the CNN layer, the BiGRU and BiLSTM layers, and the fully connected layer.
The input layer takes the processed berthing sequence data as the input to the CNN layer, and after a series of convolution operations, local features are produced.
The output sequence from the CNN is first fed into a BiGRU layer for the initial stage of temporal feature learning. Then, the output sequence from the BiGRU layer is used as the input to the BiLSTM layer, where a second stage of deeper temporal feature learning is performed.
In the fully connected layer, features from the BiLSTM layer are mapped and pass through a ReLU activation function to introduce non-linearity, before being mapped to the output layer for final prediction.

3.2.1. Convolutional Neural Network

The CNN module is designed to automatically extract internal features from the sequence data, particularly capturing instantaneous behaviors during the ship berthing process, such as acceleration, deceleration, and turning maneuvers. Compared to traditional fully connected networks, CNN offers several advantages, including parameter sharing, local receptive fields, and spatial invariance. In the task of ship BBP, CNN progressively extracts key local features by performing multiple convolution operations, nonlinear activation functions, and pooling processes on the berthing behavior data.
Figure 3 illustrates the implementation workflow of the proposed CNN framework. The entire framework primarily comprises a two-layer stacked 1D CNN designed to process berthing sequence data. The first convolutional layer employs a kernel size of 3 and a stride of 1, with the padding method configured as ‘same’ to ensure that the input and output dimensions remain consistent. The convolutional layer functions to extract high-dimensional local features from the input data and achieves feature mapping by learning the parameters of the convolutional kernels. Then, to introduce non-linearity and enhance the network’s representational capacity, the ReLU function is applied following each convolutional operation. This enables the network to learn complex and non-linear patterns inherent in the ship berthing data. Max-pooling is subsequently used to reduce the dimensionality of feature maps, thereby decreasing computational complexity while retaining the most salient features. The batch normalization method is integrated after each pooling operation to normalize the intermediate feature representations. The second convolutional layer maintains the same kernel configuration but increases the number of kernels, enabling the extraction of more abstract and high-level features. In this configuration, X represents the input data of the CNN, and N represents the output feature of the CNN, which encapsulates the learned local features essential for accurate BBP.

3.2.2. Bidirectional Recurrent Network

In the ship BBP task, the contextual information of the time series is crucial. CNN is unable to analyze the temporal correlation within the input sequence data. Hence, BiGRU and BiLSTM models are used to handle both short-term and long-term dependencies in this experiment. As optimized variants of traditional RNN, BiLSTM and BiGRU are two common types of recurrent neural networks that both can perform bidirectional learning from the sequence data, differing primarily in their internal gating mechanisms.
BiLSTM effectively addresses the issues of vanishing and exploding gradients commonly faced by RNNs when handling long sequential data through introducing LSTM units. The core of LSTM lies in its gating mechanisms, including the input gate, forget gate, and output gate, which selectively regulate the retention and updating of long-term dependencies over extended time periods. By incorporating two independent LSTM units, BiLSTM can capture both past (forward) and future (backward) contextual information at each time step, making it particularly advantageous for tasks that require modeling complex temporal relationships, such as the nonlinear time dependencies found in ship berthing data. The structure of BiLSTM is shown in Figure 4.
In contrast, BiGRU is another variant of RNN that shares a similar bidirectional structure with BiLSTM but is more streamlined in its design. GRU units control the flow of information using the update gate and the reset gate, which reduces both the number of parameters and computational complexity compared to LSTM, making it particularly well-suited for resource-constrained or real-time applications. Similarly to BiLSTM, the bidirectional structure of BiGRU also enables it to learn from both past and future temporal contexts, enhancing its ability to capture sequential dependencies in the sequence data. The structure of BiGRU is shown in Figure 5.
The structure of the bidirectional recurrent network is shown in Figure 6. The first layer employs a BiGRU unit, which, with its simpler gating mechanism, acts as an efficient initial feature extractor. It is highly effective at capturing short-term temporal dependencies and rapidly changing dynamic features, allowing the network to respond quickly to rapid fluctuations in the data. The second layer then applies a BiLSTM unit. By operating on the pre-processed sequence from the BiGRU, the BiLSTM can leverage its more complex structure and dedicated memory cell to focus on modeling more abstract, long-term dependencies and capturing complex sequential patterns over extended time periods. This combination ensures that both short- and long-term temporal dynamics are comprehensively and hierarchically represented in the model.

4. Experimental Results and Analysis

4.1. Data Acquisition and Dataset Establishment

The data samples presented in this paper were captured using a shore-based LiDAR system to monitor the berthing process of large ships at the Dalian Port (China) during 2024 and 2025. For details of the experimental field, see Figure 7; the blue area represents the location of the port, the red area indicates the berthing zone, and the yellow lines denote the berth lines used in the experiments.
The berthing data collection focused on three representative large ships (the ship HuLuDao, the ship WanTongHai, and the ship ShengSheng2), as depicted in Figure 8, with the related parameters listed in Table 1. These vessels were selected based on factors such as their large size, frequent berthing activities, and stable berthing positions within the study area, making them suitable for an in-depth analysis of berthing processes. The point cloud data of berthing processes were recorded on multiple occasions during the following time periods: 4–5 A.M. and 17–20 P.M. The specifications of the shore-based LiDAR system used in the experiments are provided in Table 2, which was a 3D LiDAR customized by Shanghai Institute of Technical Physics of the Chinese Academy of Sciences. In collection experiments, the LiDAR system was strategically positioned slightly aft of the middle of the berth to maintain effective coverage of the berthing zone and eliminate blind spots, ensuring data integrity and comprehensiveness, as shown in Figure 9. Similarly, the installation height of the LiDAR system must be sufficient to avoid obstacles, such as bollards, ground, and other wharf facilities.
As presented in Table 3, the collected point cloud data consisted of multiple ship trajectories, each annotated with a series of time points at uniform intervals. The data was then subjected to a series of processing steps, and first converted into the BEV format as required for subsequent experiments, as detailed in Section 3.1. Moreover, the BEV image of each point was uniformly resized to the same size to ensure data consistency. In this experiment, the center point of the berth line, which also corresponds to the viewpoint of the shore-based LiDAR after coordinate conversion, was defined as the central point of the image to facilitate the comparison of the relative pose of ships in the berth area at different timestamp points.
Our previous research [37] was used to extract the position, angle, and speed information of the ship’s key points (the bow point, midship point, and stern point) in each frame of BEV images, and arranged them in chronological order to form the complete sequence dataset. Each position, angle, and speed data point underwent normalization to facilitate the prediction process, which generated the corresponding input and label data. Normalization unifies data of varying scales and magnitudes into a consistent relative range, thereby accelerating convergence and enhancing model performance. In this study, the min–max normalization method is applied to normalize the behavior data of each sample, scaling them to a range between 0 and 1, which is expressed as:
d a t a s t d = d a t a r a w d a t a min d a t a max d a t a min
where data represents the position, angle, and speed of the node, std indicates the normalised standard value, raw refers to the original data of the node, and min and max denote the minimum and maximum values of the data, respectively. Since the berthing angle in our dataset spans a small and non-periodic range, the circular nature is not considered here.
In addition, environmental factors have a significant impact on the ship’s dynamic behavior during berthing. In order to enhance the realism of our dataset, the wind direction, wind speed, and wave height data were introduced as additional features. These environmental variables were synchronized with the position, angle, and speed data in sequence form and simultaneously fed into the prediction model. In this experiment, a portable anemometer, as depicted in Figure 10, was applied to measure real-time wind direction and wind speed data, while wave height data was calculated and recorded through the built-in function. The anemometer was deployed at an appropriate location within the berth when ship berthing to minimize external interference. To enable effective processing of environmental features by prediction models, the min–max normalization was also applied to standardize wind speed and wave height. Due to the inherent cyclicality of wind direction, which is measured in degrees, we normalized the wind direction data using a sine and cosine coordinate transformation, which is expressed as:
( x , y ) = ( cos ( θ × π 180 ° ) , sin ( θ × π 180 ° ) )
where ( x , y ) represents the cosine and sine components of the wind direction, and θ indicates the wind direction.
Finally, the environmental variables, including wind direction, wind speed, and wave height, were integrated with the ship’s dynamic features, such as position, angle, and speed, to form a complete input sequence dataset with a time interval of 1 s. This dataset provides a comprehensive foundation for training and evaluation of prediction models. Furthermore, the dataset can be further segmented into different time intervals to accommodate varying berthing conditions. In this experiment, the time interval of the training data was uniformly set to 6 s. Sequence data exhibit continuous variation over time. Therefore, for time series prediction tasks, it is generally more appropriate to base predictions on the most recent observations. In this study, the dataset is processed using the sliding window technique. As shown in Figure 11, the sliding window size is set to 5, a choice that ensures that the prediction model focuses on the most recent data while still retaining sufficient information to capture meaningful temporal patterns. After applying the sliding window, the resulting sampling was partitioned into a training set, a validation set, and a test set according to the ratio of 8:1:1.

4.2. Hyperparameter Configuration and Evaluation Indexes

The experiments are conducted on a 64-bit Windows-based computer containing a GeForce RTX 3060 graphics card model with a total GPU display memory of 12 GB. The experiment programming is implemented using the open-source PyTorch 1.12 deep learning framework and developed in Python 3.8. The hyperparameters are important factors that significantly affect the convergence speed and accuracy. The primary parameter settings used in this experiment are listed in Table 4. In addition, the learning rate is adjusted to decrease gradually as the number of iterations increases to ensure fast and stable convergence during training.
After the network training was completed, an evaluation process was conducted to test the generalization ability of the prediction models on the self-constructed dataset. Sequence data from the validation set were used as inputs to the models, and the predicted results were then validated according to the corresponding ground truth annotations. This study utilized four evaluation metrics, namely Mean Square Error (MSE), Mean Absolute Error (MAE), Average Displacement Error (ADE), and Final Displacement Error (FDE). The smaller the MSE, MAE, ADE, and FDE values, the higher the prediction accuracy.
MSE and MAE were chosen to evaluate the prediction performance of the angle and speed because they effectively quantify the average deviation and dispersion between the predicted and true values. The expressions of MSE and MAE are as follows:
M S E = 1 N n = 1 N 1 T t = 1 T y t n y ^ t n 2
M A E = 1 N n = 1 N 1 T t = 1 T y t n y ^ t n
where N denotes the number of samples, T represents the number of time nodes, and y t n and y ^ t n represent the actual value and the predicted value of sample n at time node t, respectively.
The ADE comprehensively assesses the prediction accuracy over the entire sequence by calculating the average Euclidean distance between the predicted and ground truth positions at all time nodes, while the FDE measures the Euclidean distance between the predicted and actual positions at the final time node, reflecting the model’s ability to accurately predict the trajectory endpoint. Both metrics complement MSE and MAE to ensure a comprehensive assessment of the model’s performance. The ADE and FDE formulas are given by:
A D E = 1 N n = 1 N 1 T t = 1 T p t n p ^ t n 2
F D E = 1 N n = 1 N p f p ^ f 2
where p t n and p ^ t n represent the actual position and the predicted position of sample n at time node t, respectively, and p f and p ^ f represent the actual position and the predicted position at the final time node f of each sample, respectively.

4.3. Comparative Experiment

4.3.1. Ablation Experimental Analysis

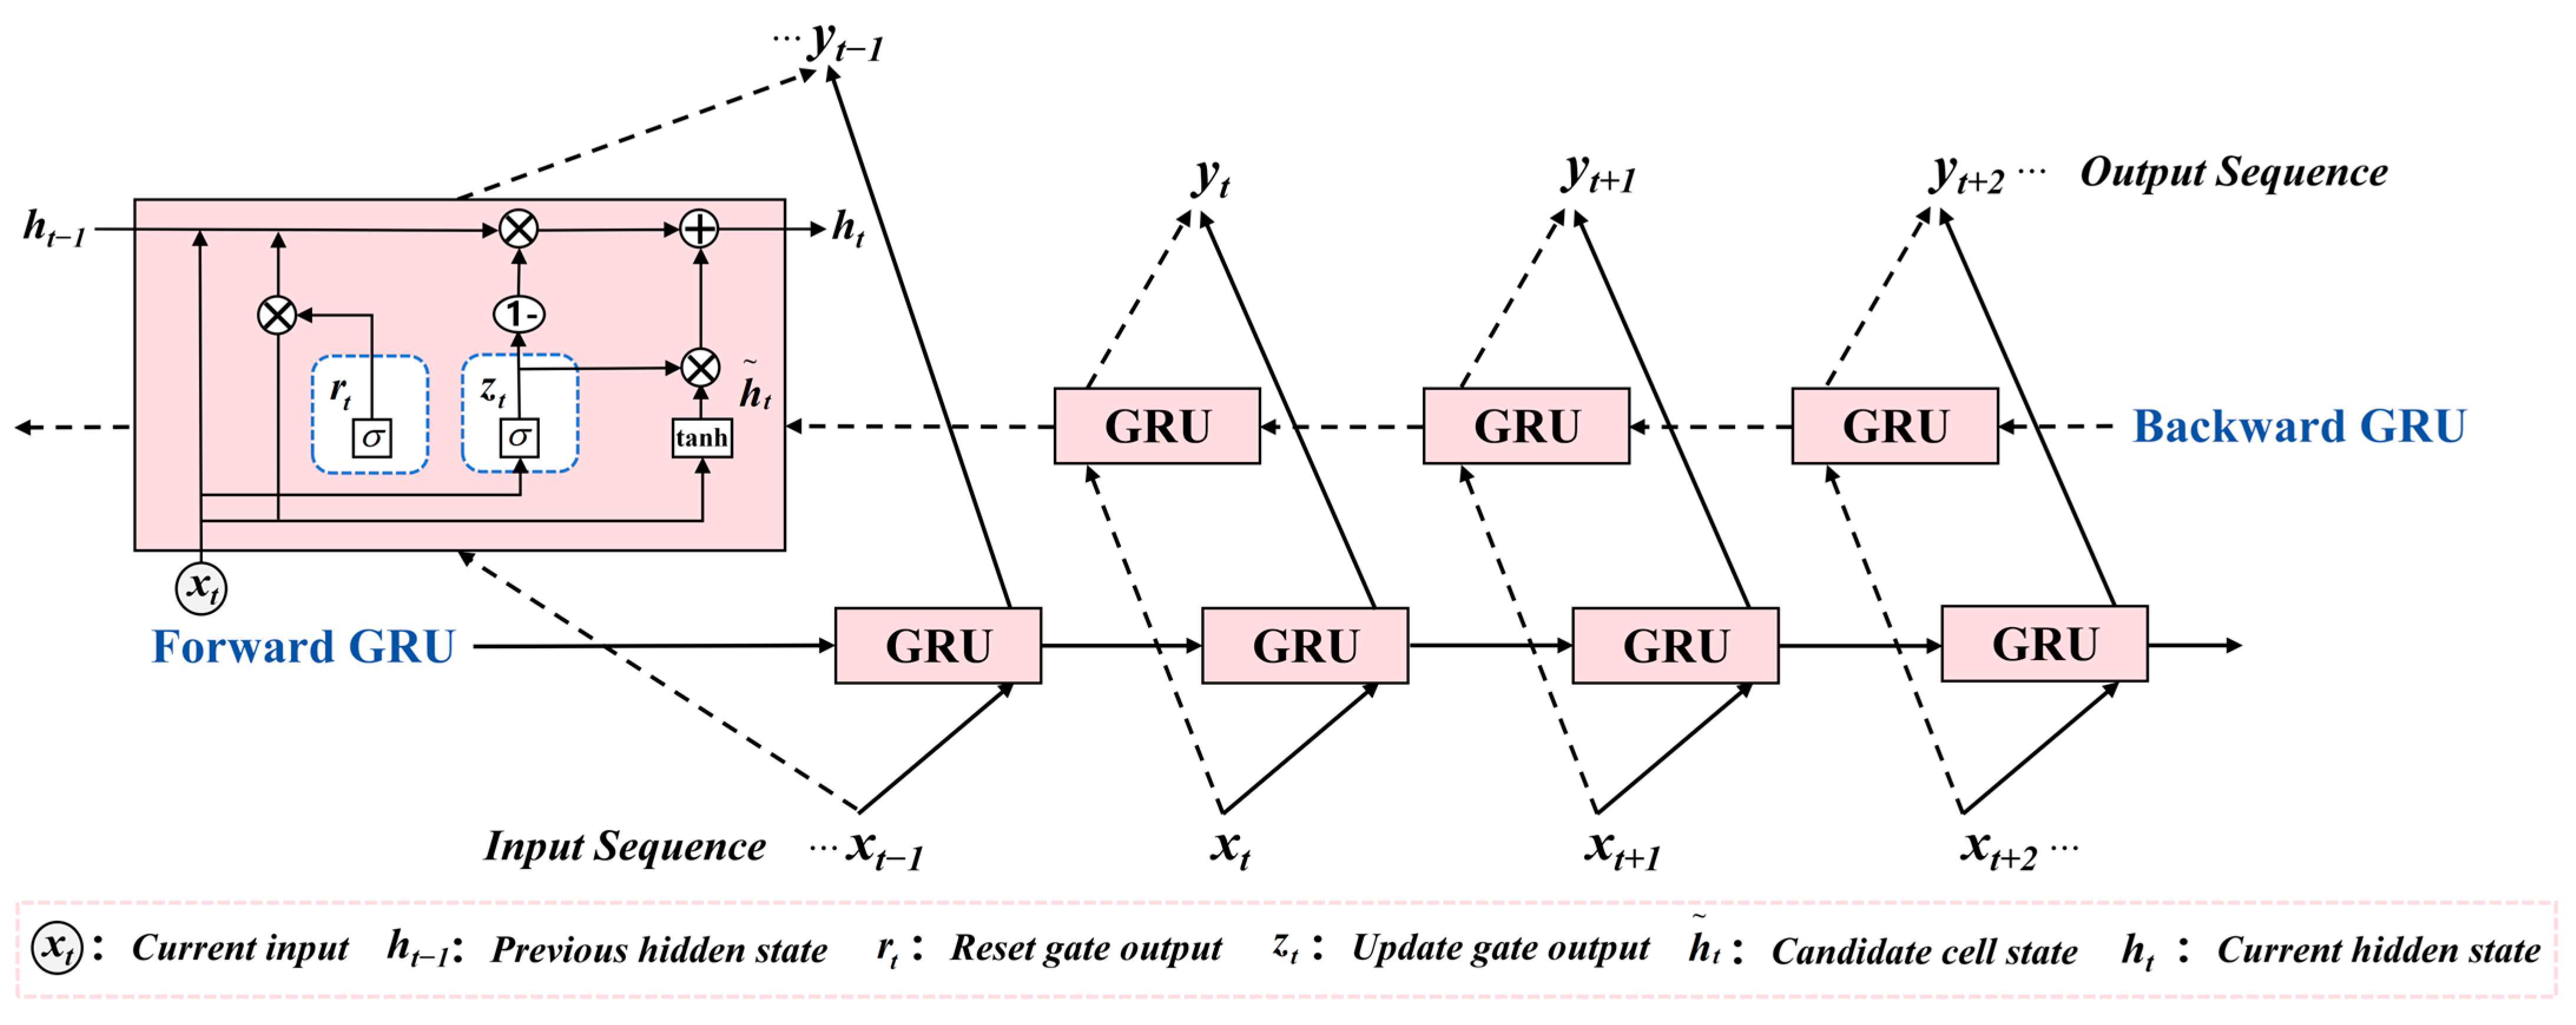
In addition to evaluating the designed baseline, this study also investigated other classical neural network architectures, including RNN, LSTM, GRU, BiLSTM, BiGRU, and Transformer, all of which are commonly applied in sequence prediction tasks due to their ability to capture temporal dependencies and contextual relationships.
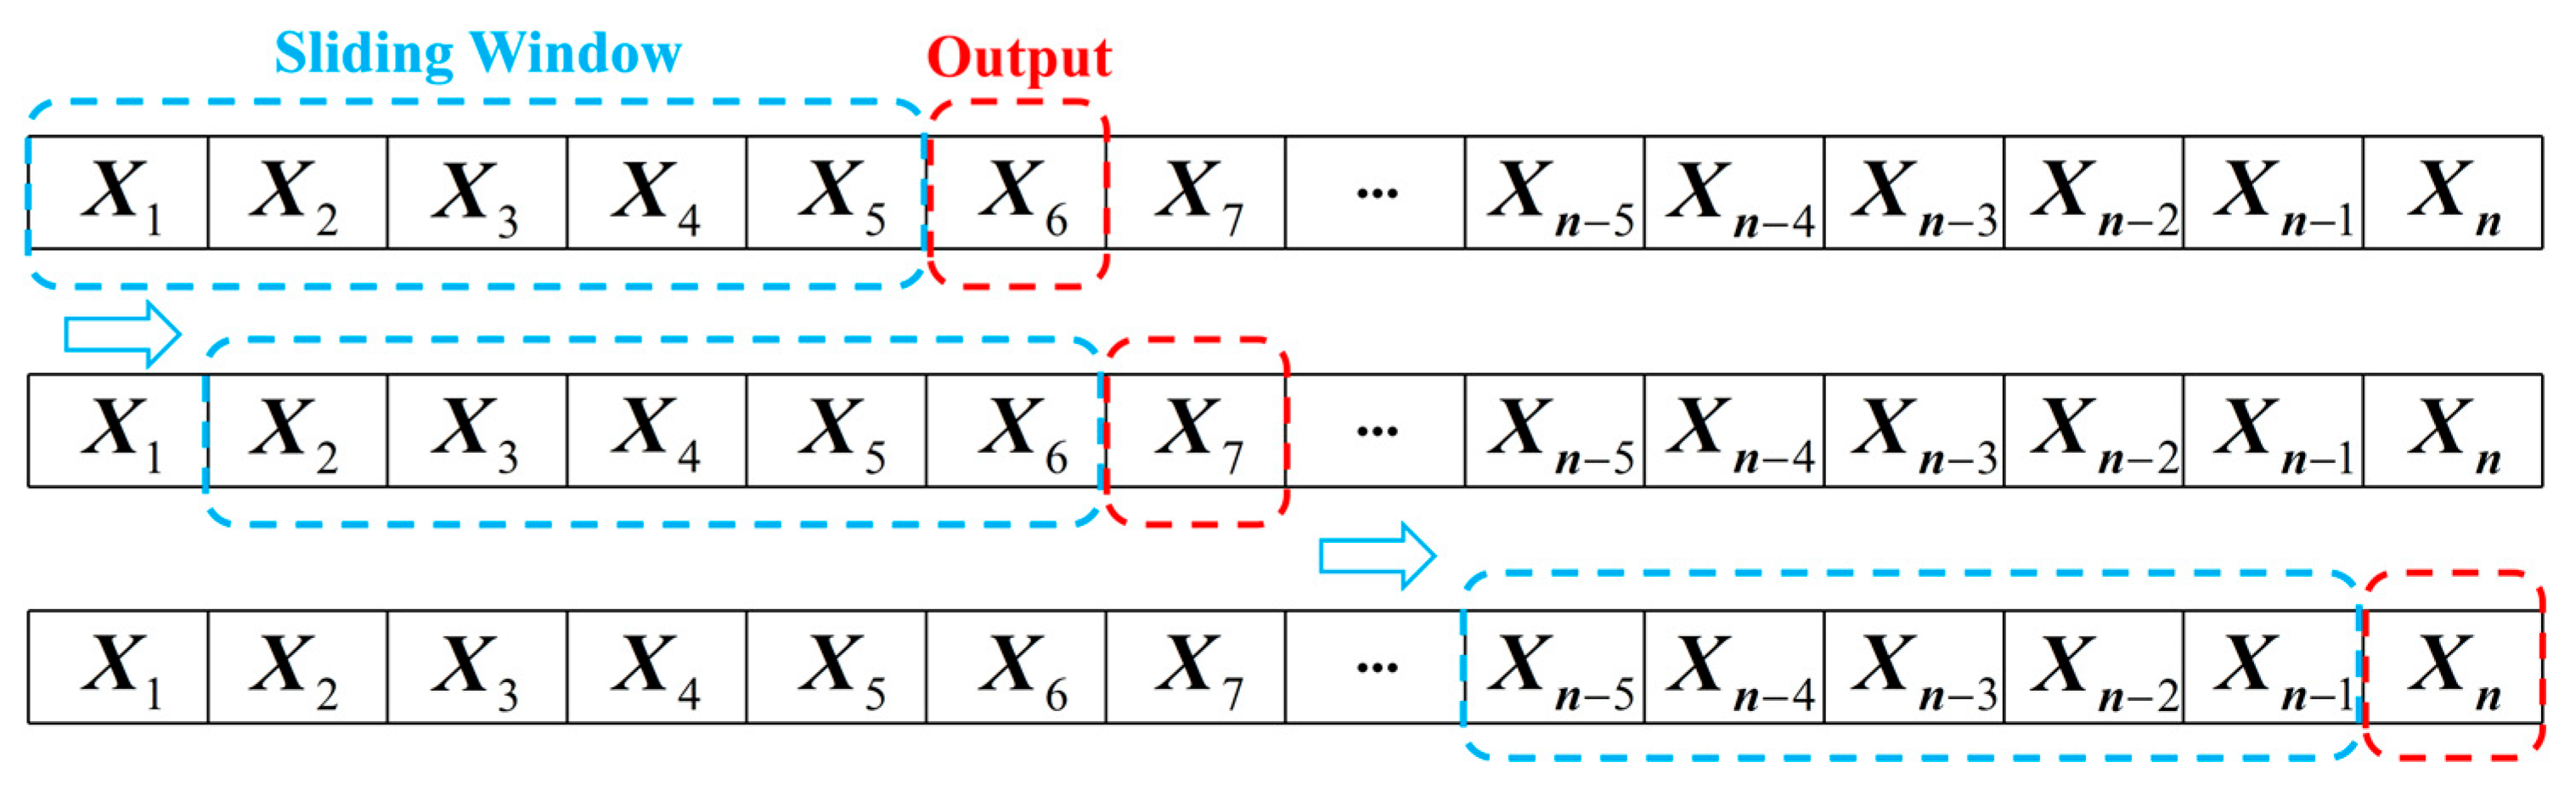
Each single-layer model was trained and tested on our dataset independently, with the main hyperparameter settings kept consistent. In the experiment, the initial 5 data nodes from each berthing sample served as models’ starting input, aiming to predict the berthing behavior for the next 60 nodes, which corresponds to approximately 6 min. MSE, MAE, ADE, and FDE were used as the evaluation metrics. The experimental results are shown in Table 5; among the six single-layer models, BiGRU exhibited the highest predictive accuracy, with BiLSTM also yielding comparable results. The enhanced performance of these bidirectional architectures is primarily due to their ability to process temporal input sequences in both forward and backward directions, thereby enabling more robust extraction of contextual dependencies—an essential aspect in time series forecasting. In contrast, the standard RNN performed less favorably across all evaluation metrics, indicating its struggles with complex nonlinear time series data. Although Transformer-based models have achieved notable success in various domains, their performance was not particularly impressive in this study. This discrepancy may be attributed to the self-attention mechanism’s reliance on large-scale training data to effectively model long-range dependencies, a condition not satisfied by the relatively small size of the ship berthing dataset used in this work. Future research can further validate the potential of Transformer-based in ship BBP by expanding the size of our dataset.
Furthermore, an in-depth analysis of data in Table 6, where ‘C’ indicates the inclusion of the CNN component for clarity, reveals that all evaluated models achieved varying degrees of improvement in prediction performance after integrating the CNN. Specifically, for the rates of improvement in four metrics, the highest was 19.84%, and the lowest was 6.75%. This improvement is due to the fact that CNN enhances the model’s ability to capture important local features, which is particularly effective when dealing with the sequence data. In this experiment, CNN performed convolution operations on the input berthing behavior data, enabling prediction models to identify local dynamic patterns that occur during berthing, such as acceleration, deceleration, and turning events. This allows subsequent sequence models to focus more effectively on learning long-term dependencies from the berthing behavior data. Hence, the integration of CNN and sequence models is tested as an effective modeling strategy for tasks involving complex dynamic processes, such as ship BBP.
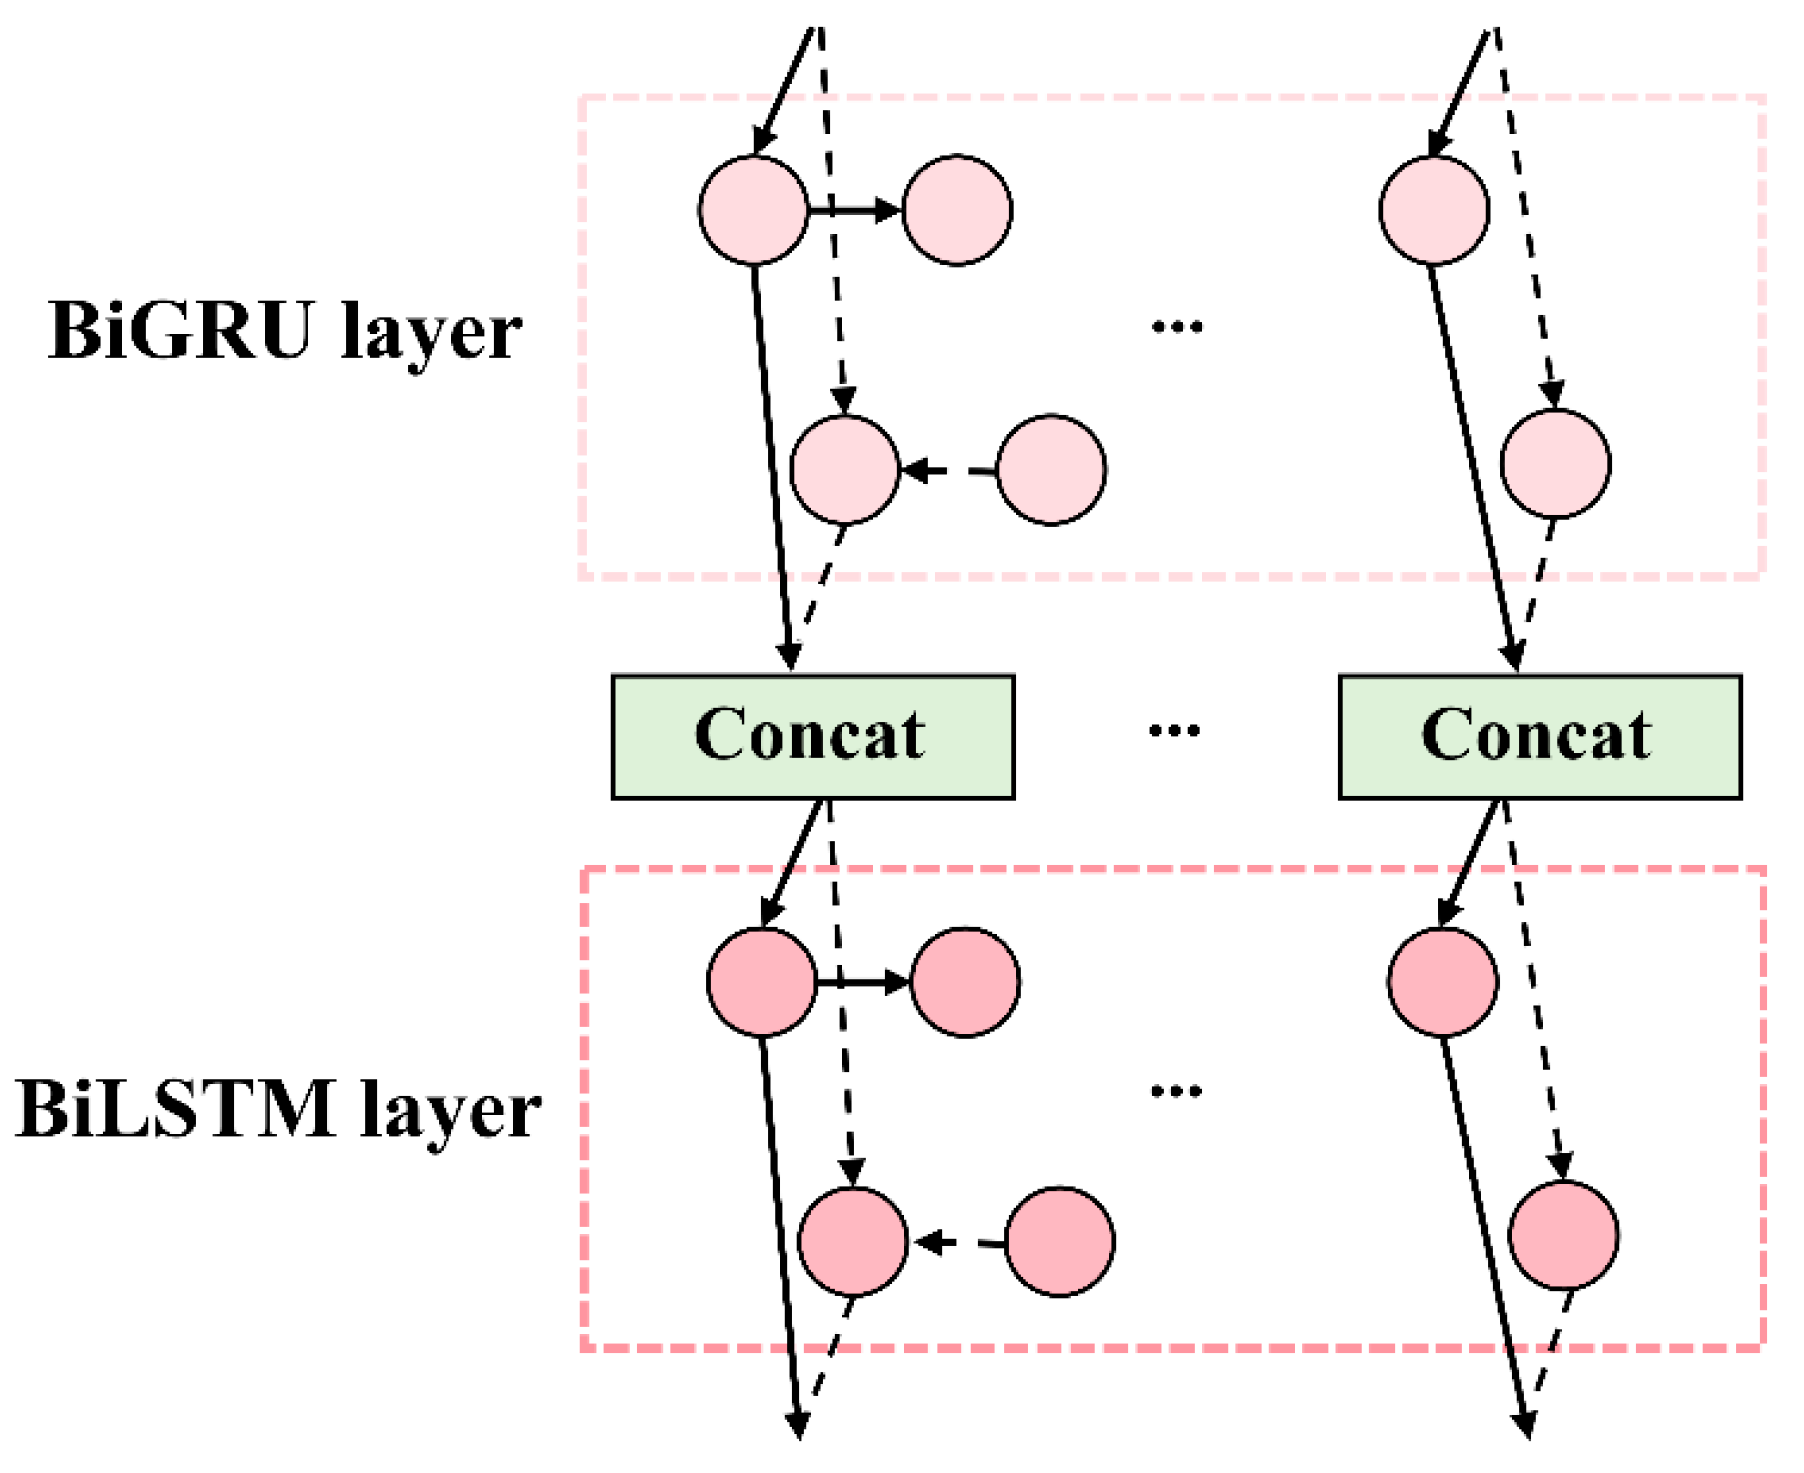
To further evaluate the performance of the two best-performing bidirectional recurrent units under different configurations, an ablation study was designed and conducted. Table 7 provides a comprehensive comparison of predictive accuracy for four combinations, with the lowest error values highlighted in bold. The results demonstrate that each combination outperforms the best-performing single-layer method, BiGRU, indicating the enhanced modeling capacity achieved by integrating multiple bidirectional units. Among the tested combinations, the proposed baseline (i.e., CNN-BiGRU-BiLSTM) delivered the best performance across all evaluation metrics. Specifically, the baseline achieved average improvements of 23.56% in MSE, 13.75% in MAE, 11.73% in ADE, and 10.4% in FDE, relative to other combinations. This advantage is attributed to the fact that the BiGRU, with its relatively simple gating structure, can efficiently extract short-term dynamics at the initial stage, and the BiLSTM can further enhance the representation of long-term dependencies through its sophisticated memory units. Hence, the CNN-BiGRU-BiLSTM architecture is designed to serve as a strong baseline for our dataset, offering a robust foundation for the subsequent in-depth analysis and model optimization in the ship BBP task.

4.3.2. Visualization Research and Analysis

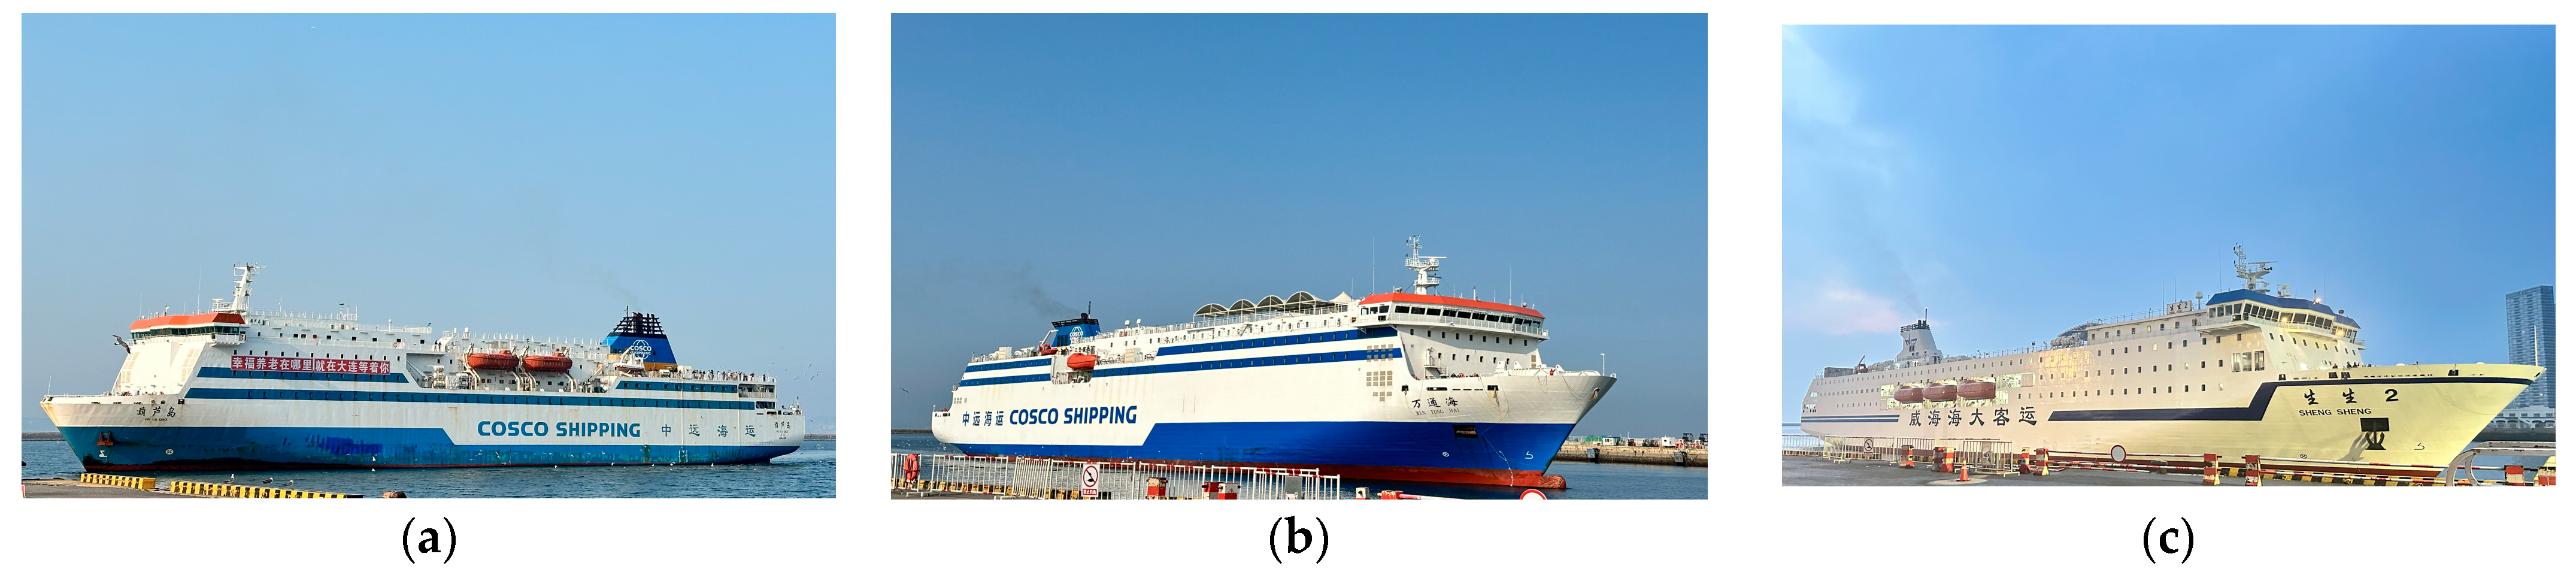
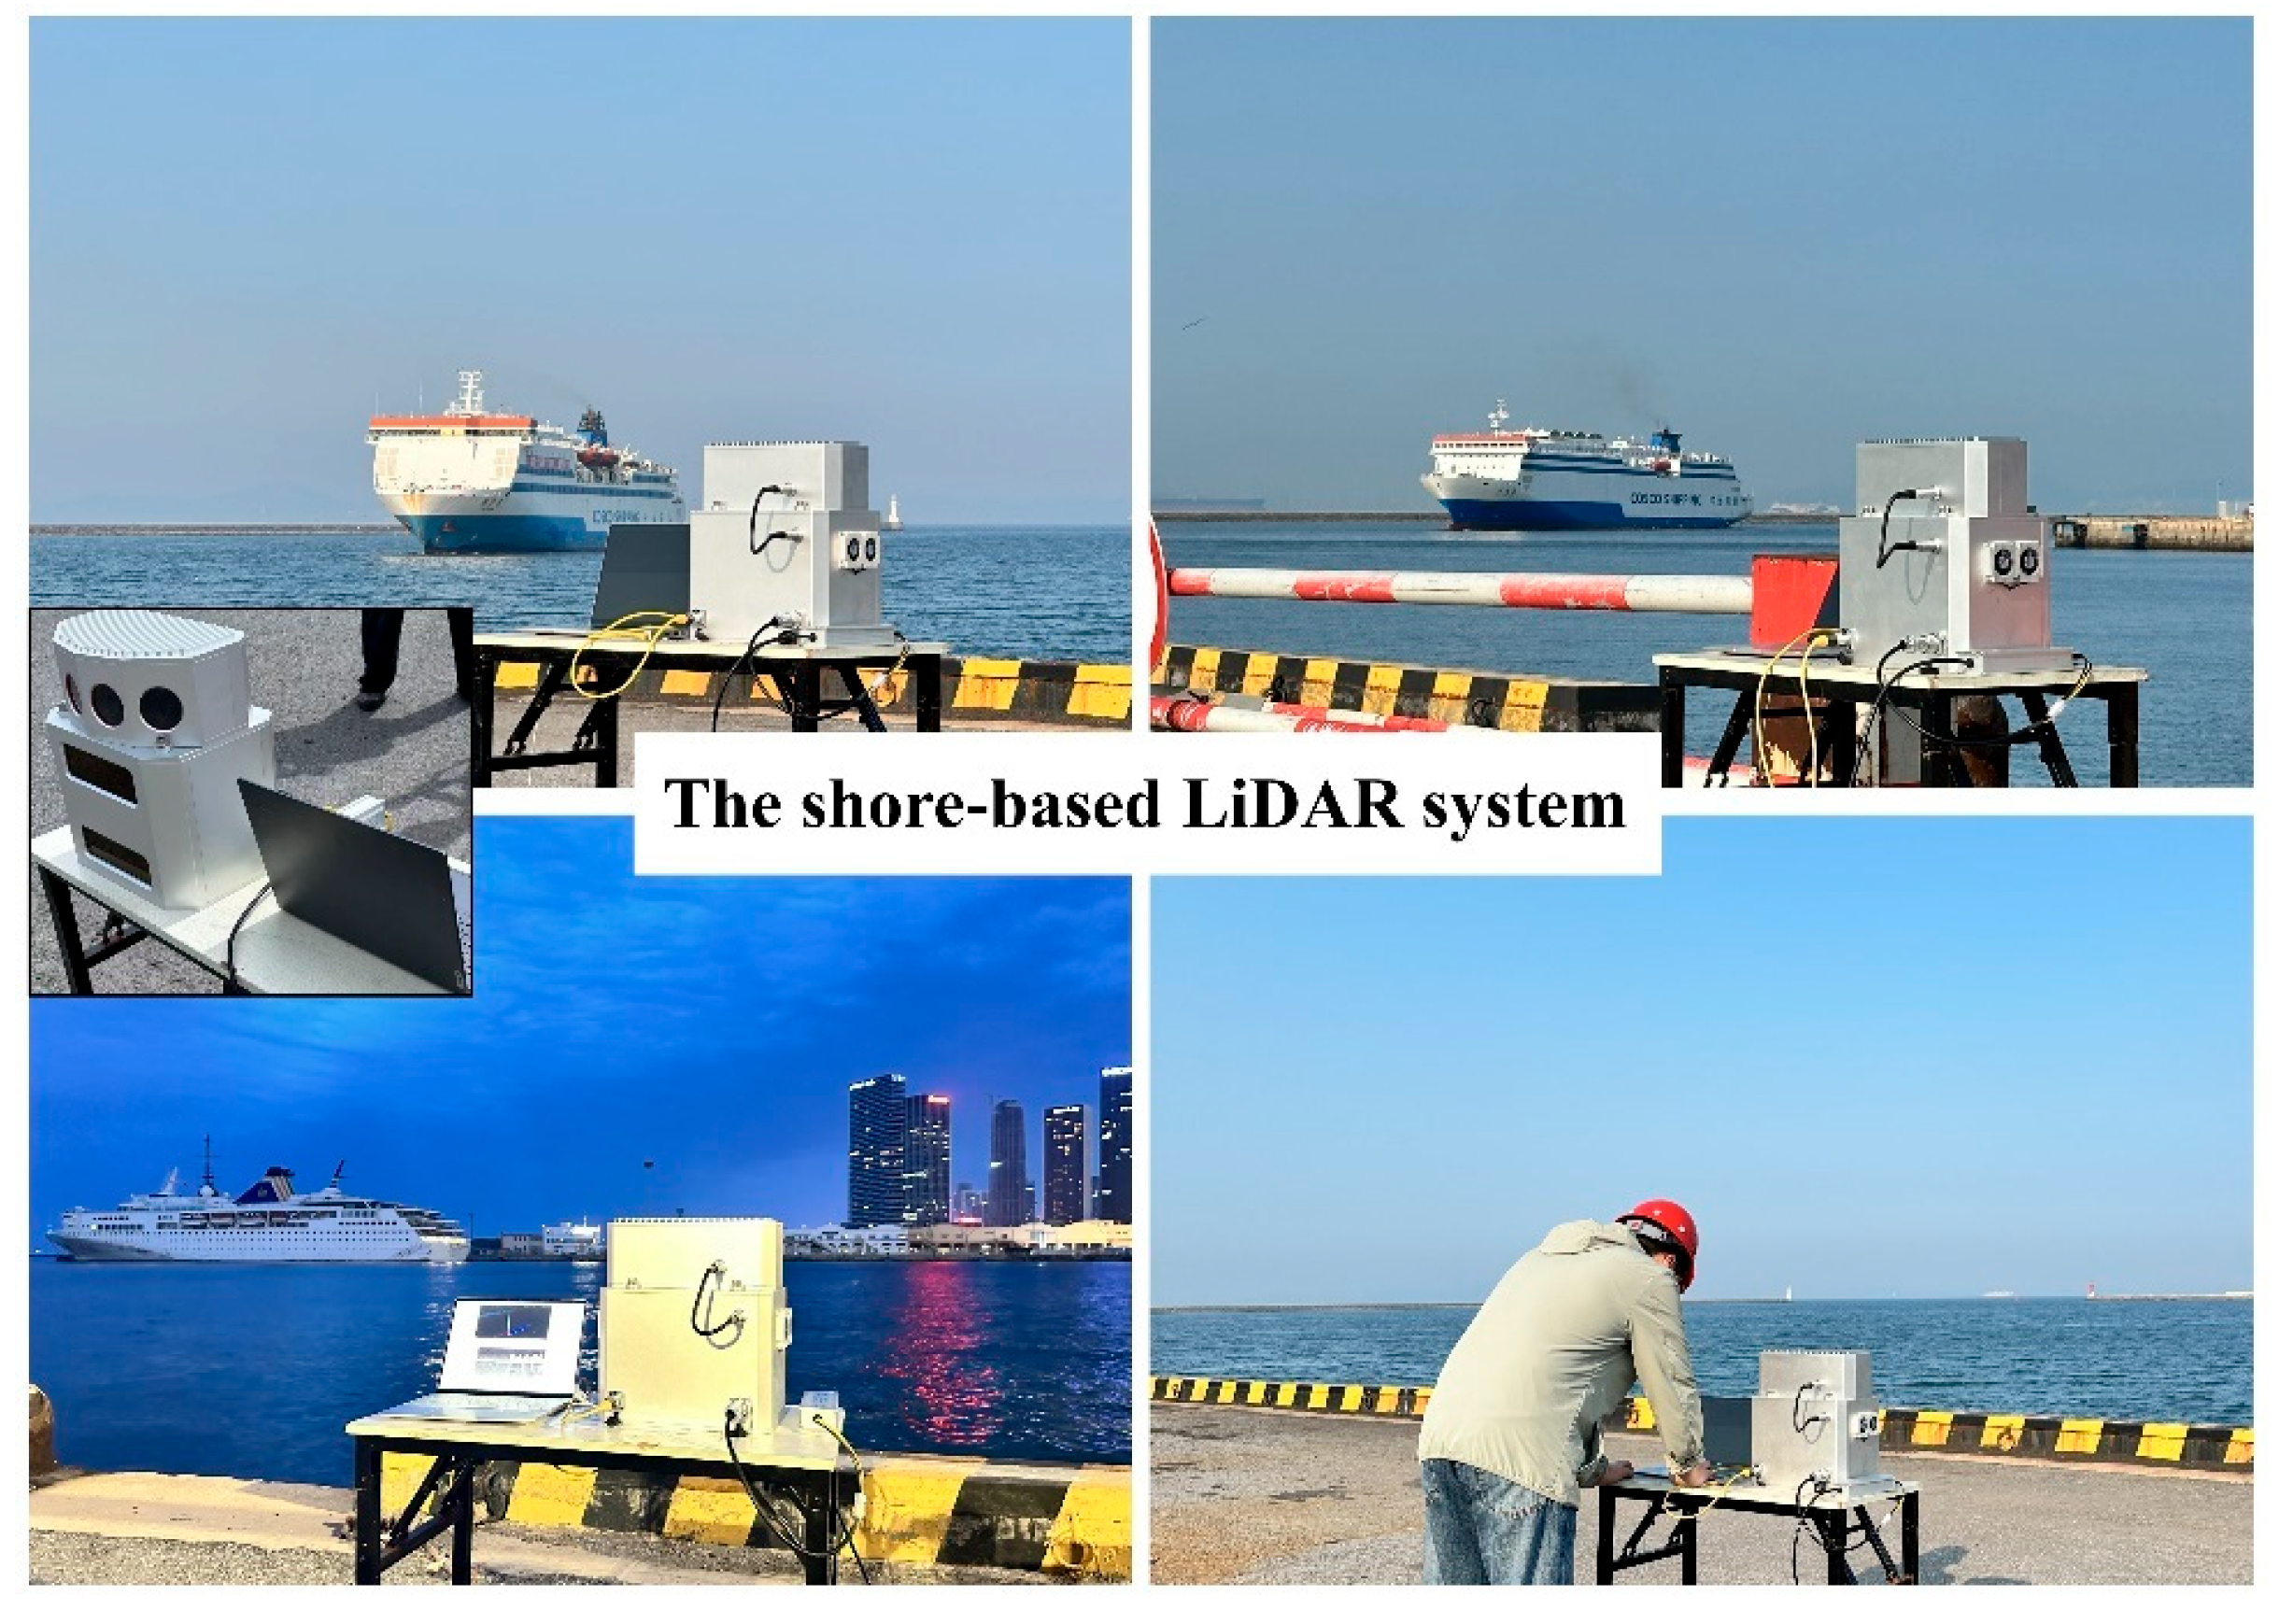
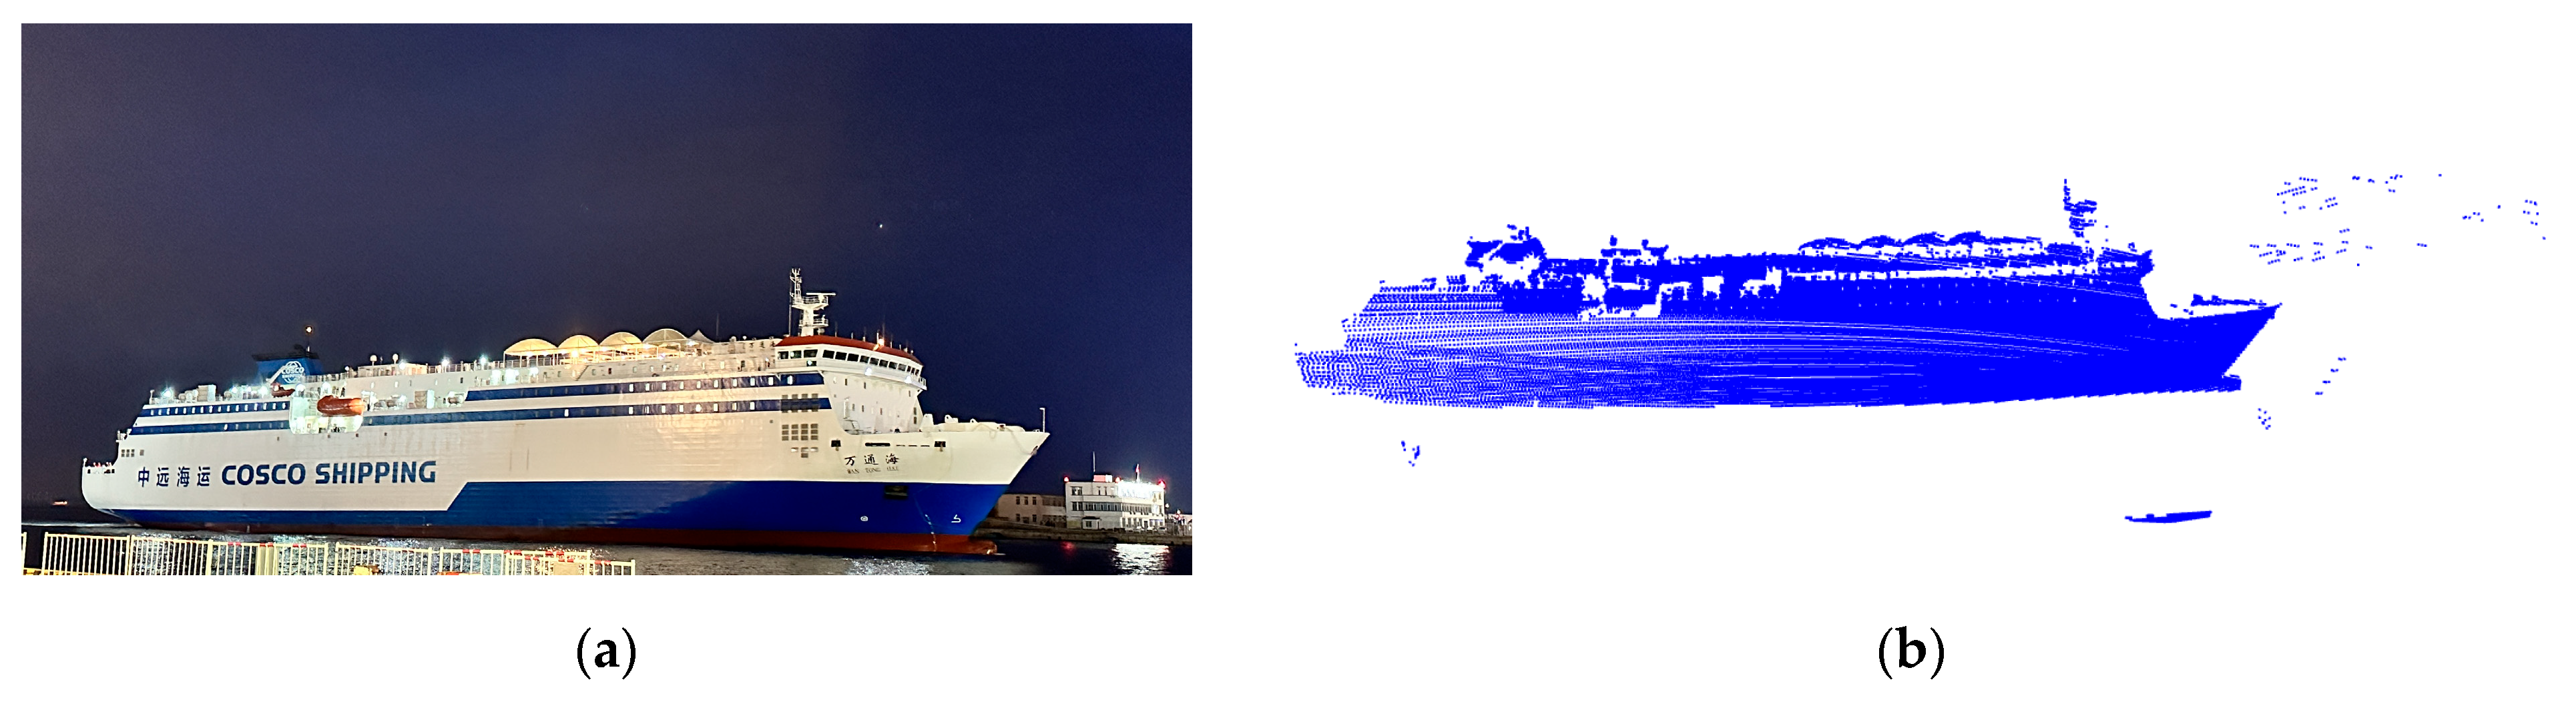
In the field of ship trajectory prediction, AIS data-driven methods are widely used to make long-term and large-scale prediction based on historical navigation information. A large volume of maritime data is generated by the AIS system, offering significant support for ship management and traffic control. However, details of these data are often insufficient to reflect the ship’s actual movement during berthing. Therefore, to intuitively illustrate these limitations and contrast AIS data with LiDAR data in recording ship berthing status, the berthing activity of the ship WanTongHai on 8 May 2025 was selected as a representative case study for comparative analysis. Specifically, point cloud data of the target ship’s berthing process, as shown in Figure 12, was collected using the shore-based LiDAR system described in Section 4.1. After preprocessing, the ship’s trajectory, angle, and speed information relative to the berth were extracted through our proposed algorithm, which has also been tested in real port environments. This information was used as the actual motion state for comparison. In parallel, AIS data corresponding to the same berthing event was recorded and processed, containing 15 timepoints. The starting point of the berthing trajectory was (38.9352°,121.6579°), which was also defined as time = 0 s.
Figure 13, Figure 14 and 
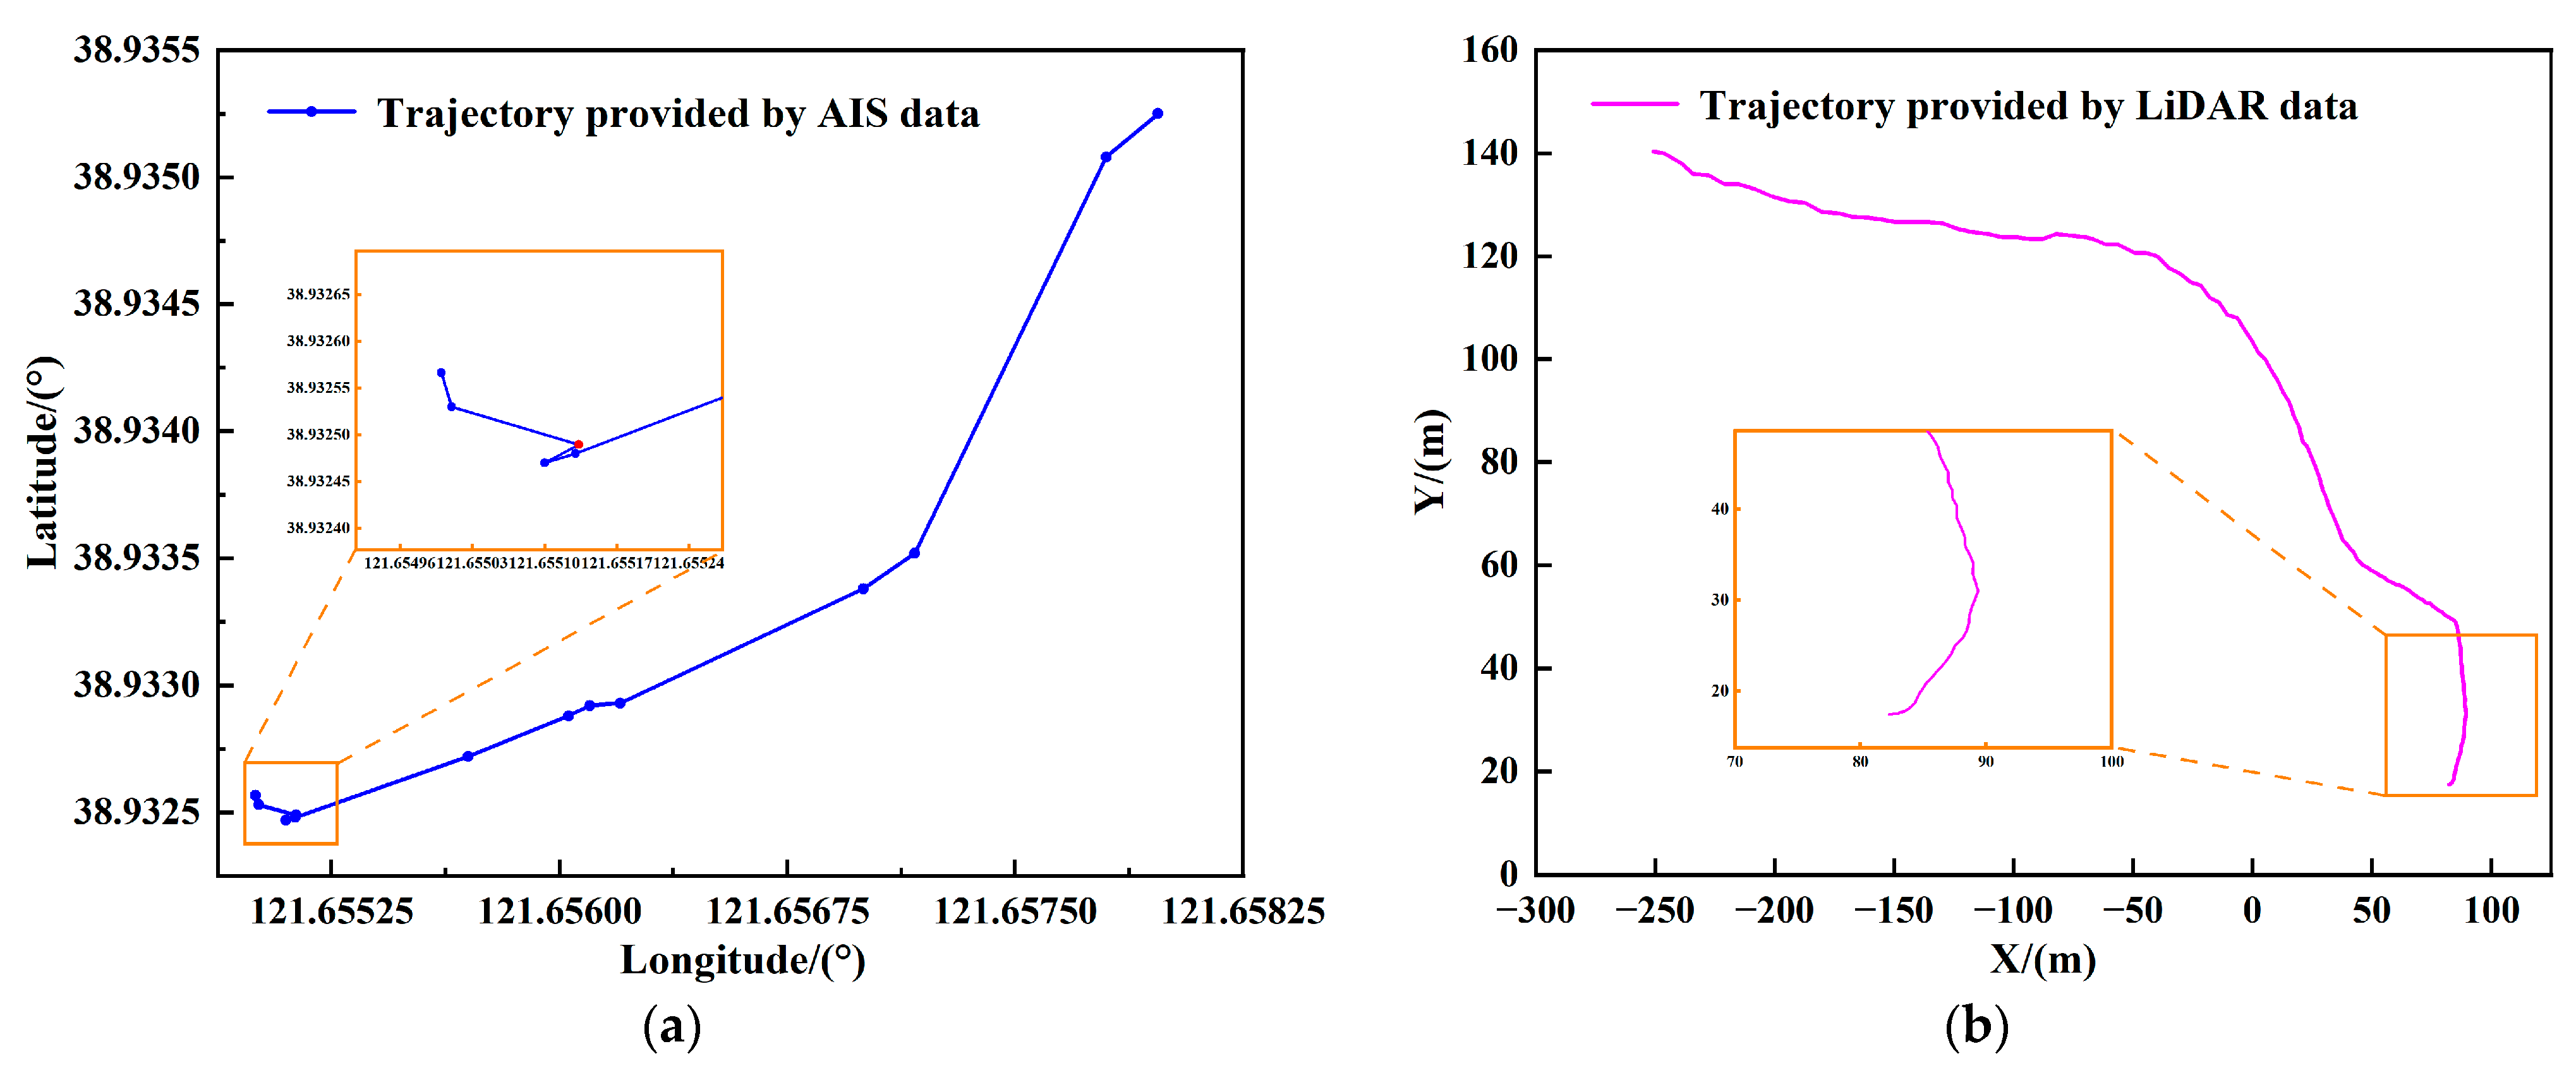
Figure 15 show the visualized results of trajectory, angle, and speed information during the target ship during berthing. It is worth noting that only the bow information provided by the LiDAR data is presented. From the perspective of the berthing trajectory, as depicted in Figure 13a, the timepoints of AIS data were sparse, with an average sampling interval of 34.21 s, producing trajectories composed of linear segments. Such representation inadequately reflects the true, continuous movement pattern of the ship when berthing. Some studies typically handle AIS data by performing interpolation techniques. but this still fails to recover the subtle dynamic variations that occur during berthing. In contrast, LiDAR data, as shown in Figure 13b, provided denser and more continuous trajectory information, effectively recording the entire berthing path and local trajectory changes. In this experiment, the ship WanTongHai transitioned to sternward motion in the final phase of berthing, enabling the ship to align and interface precisely with the port facilities. As shown in the orange box in Figure 13, both datasets effectively reflected this berthing strategy. In addition, the AIS trajectory contained an outlier (marked in red), which could adversely affect subsequent model training and prediction, undermining the overall analysis’s accuracy.
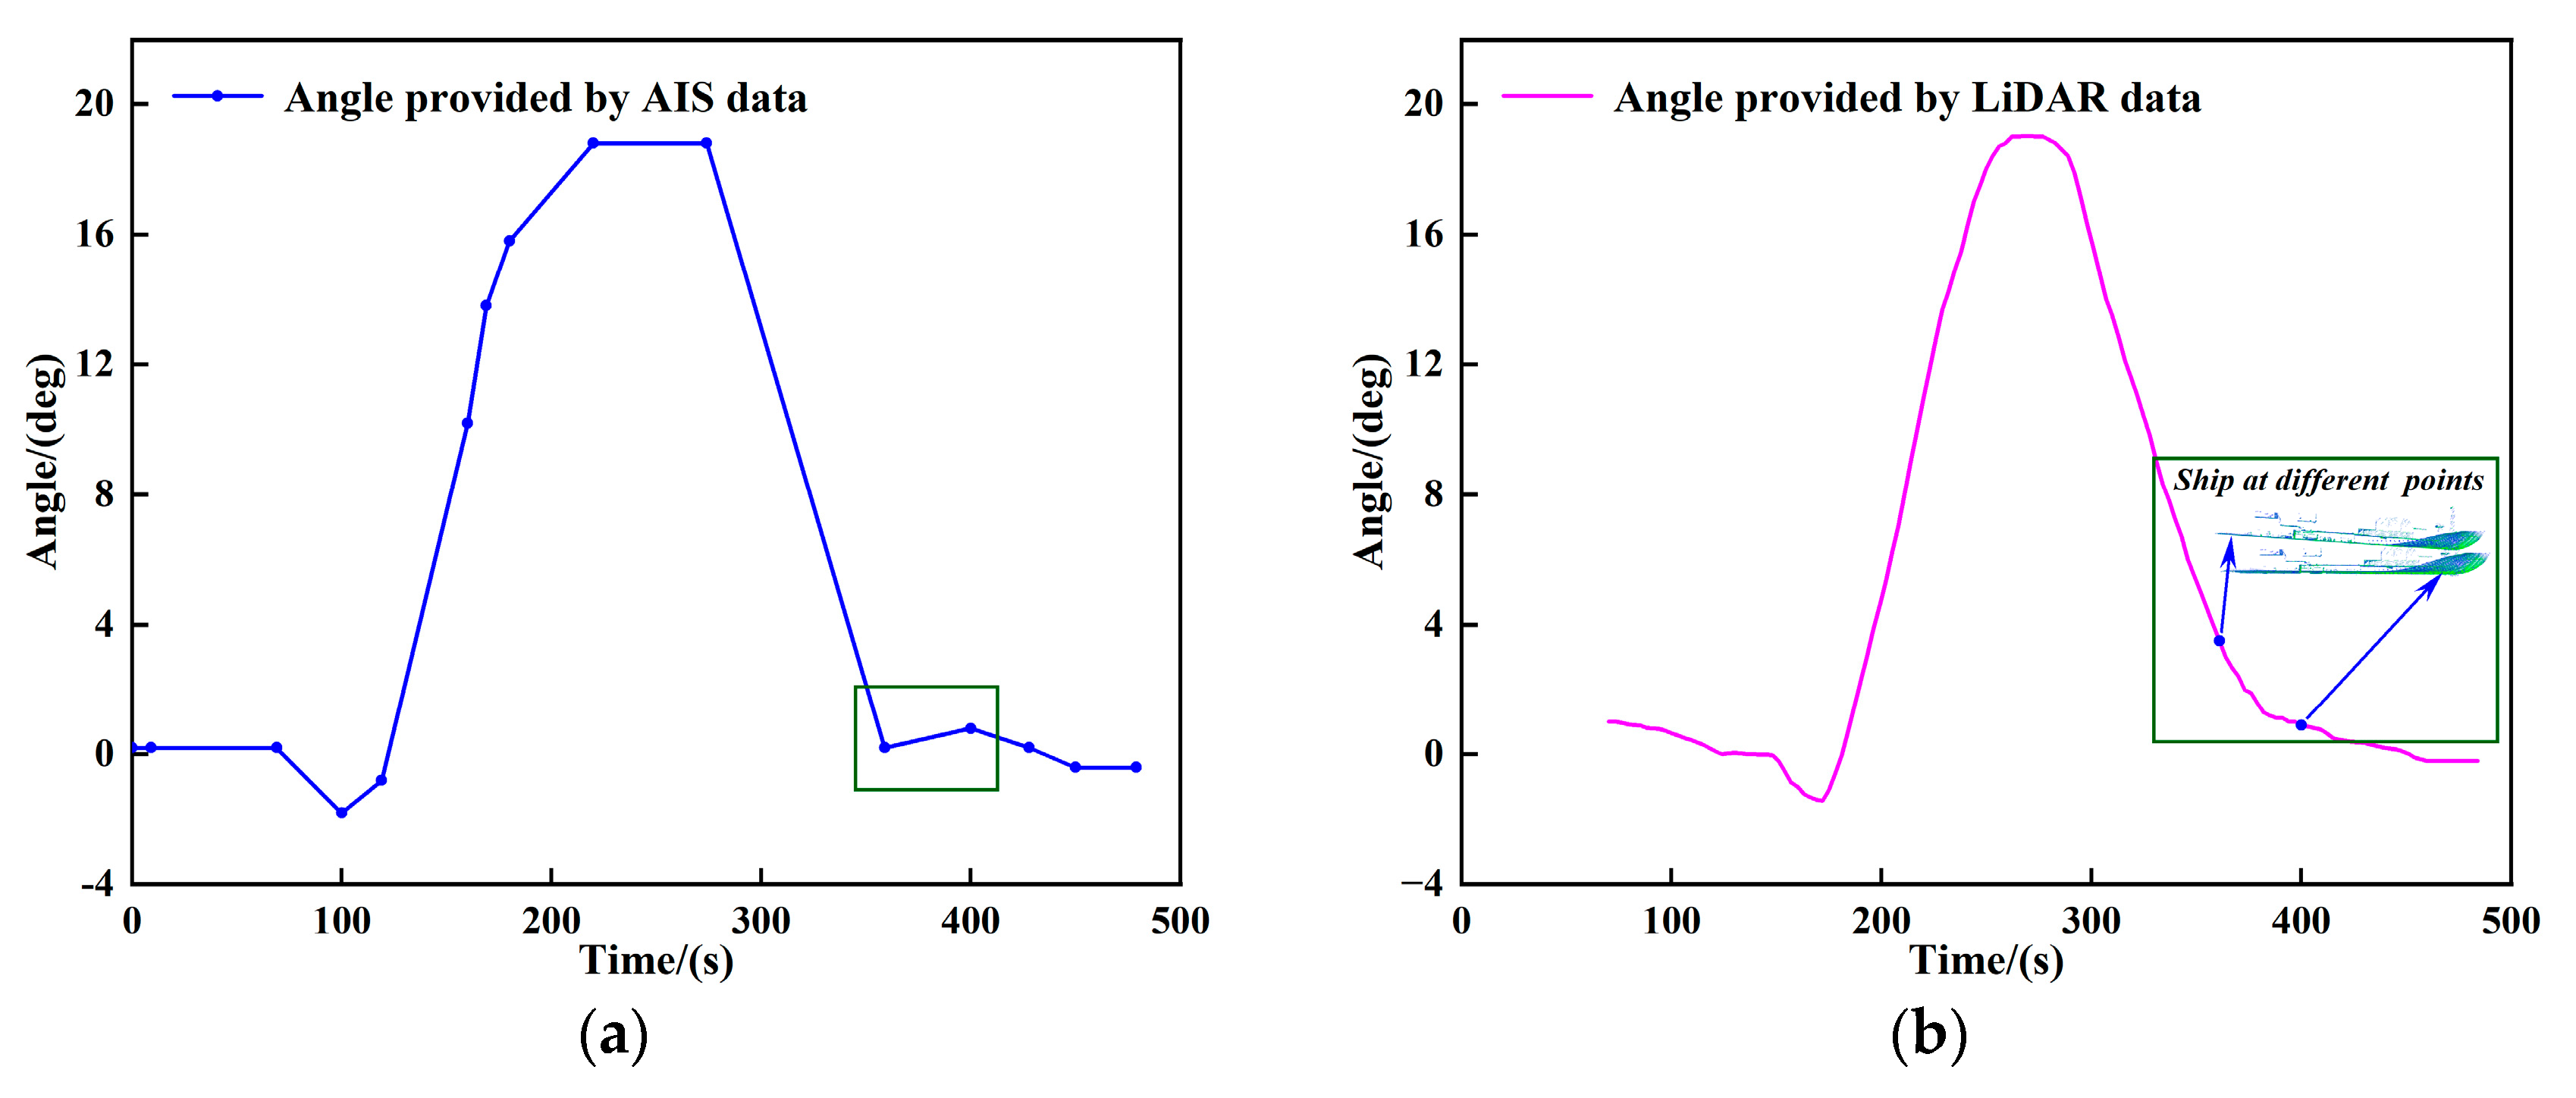
Figure 14 illustrates the time-varying curves of the berthing angle recorded by AIS and LiDAR data. Overall, both curves exhibited similar variation trends, reflecting the ship’s directional adjustments during berthing. However, there are some differences in the temporal evolution. For example, during the 359–400 s interval, as shown in green box in Figure 14, the AIS data indicated an increasing angle trend—see Figure 14a—whereas LiDAR data revealed that the angle was actually decreasing during the same period—see 
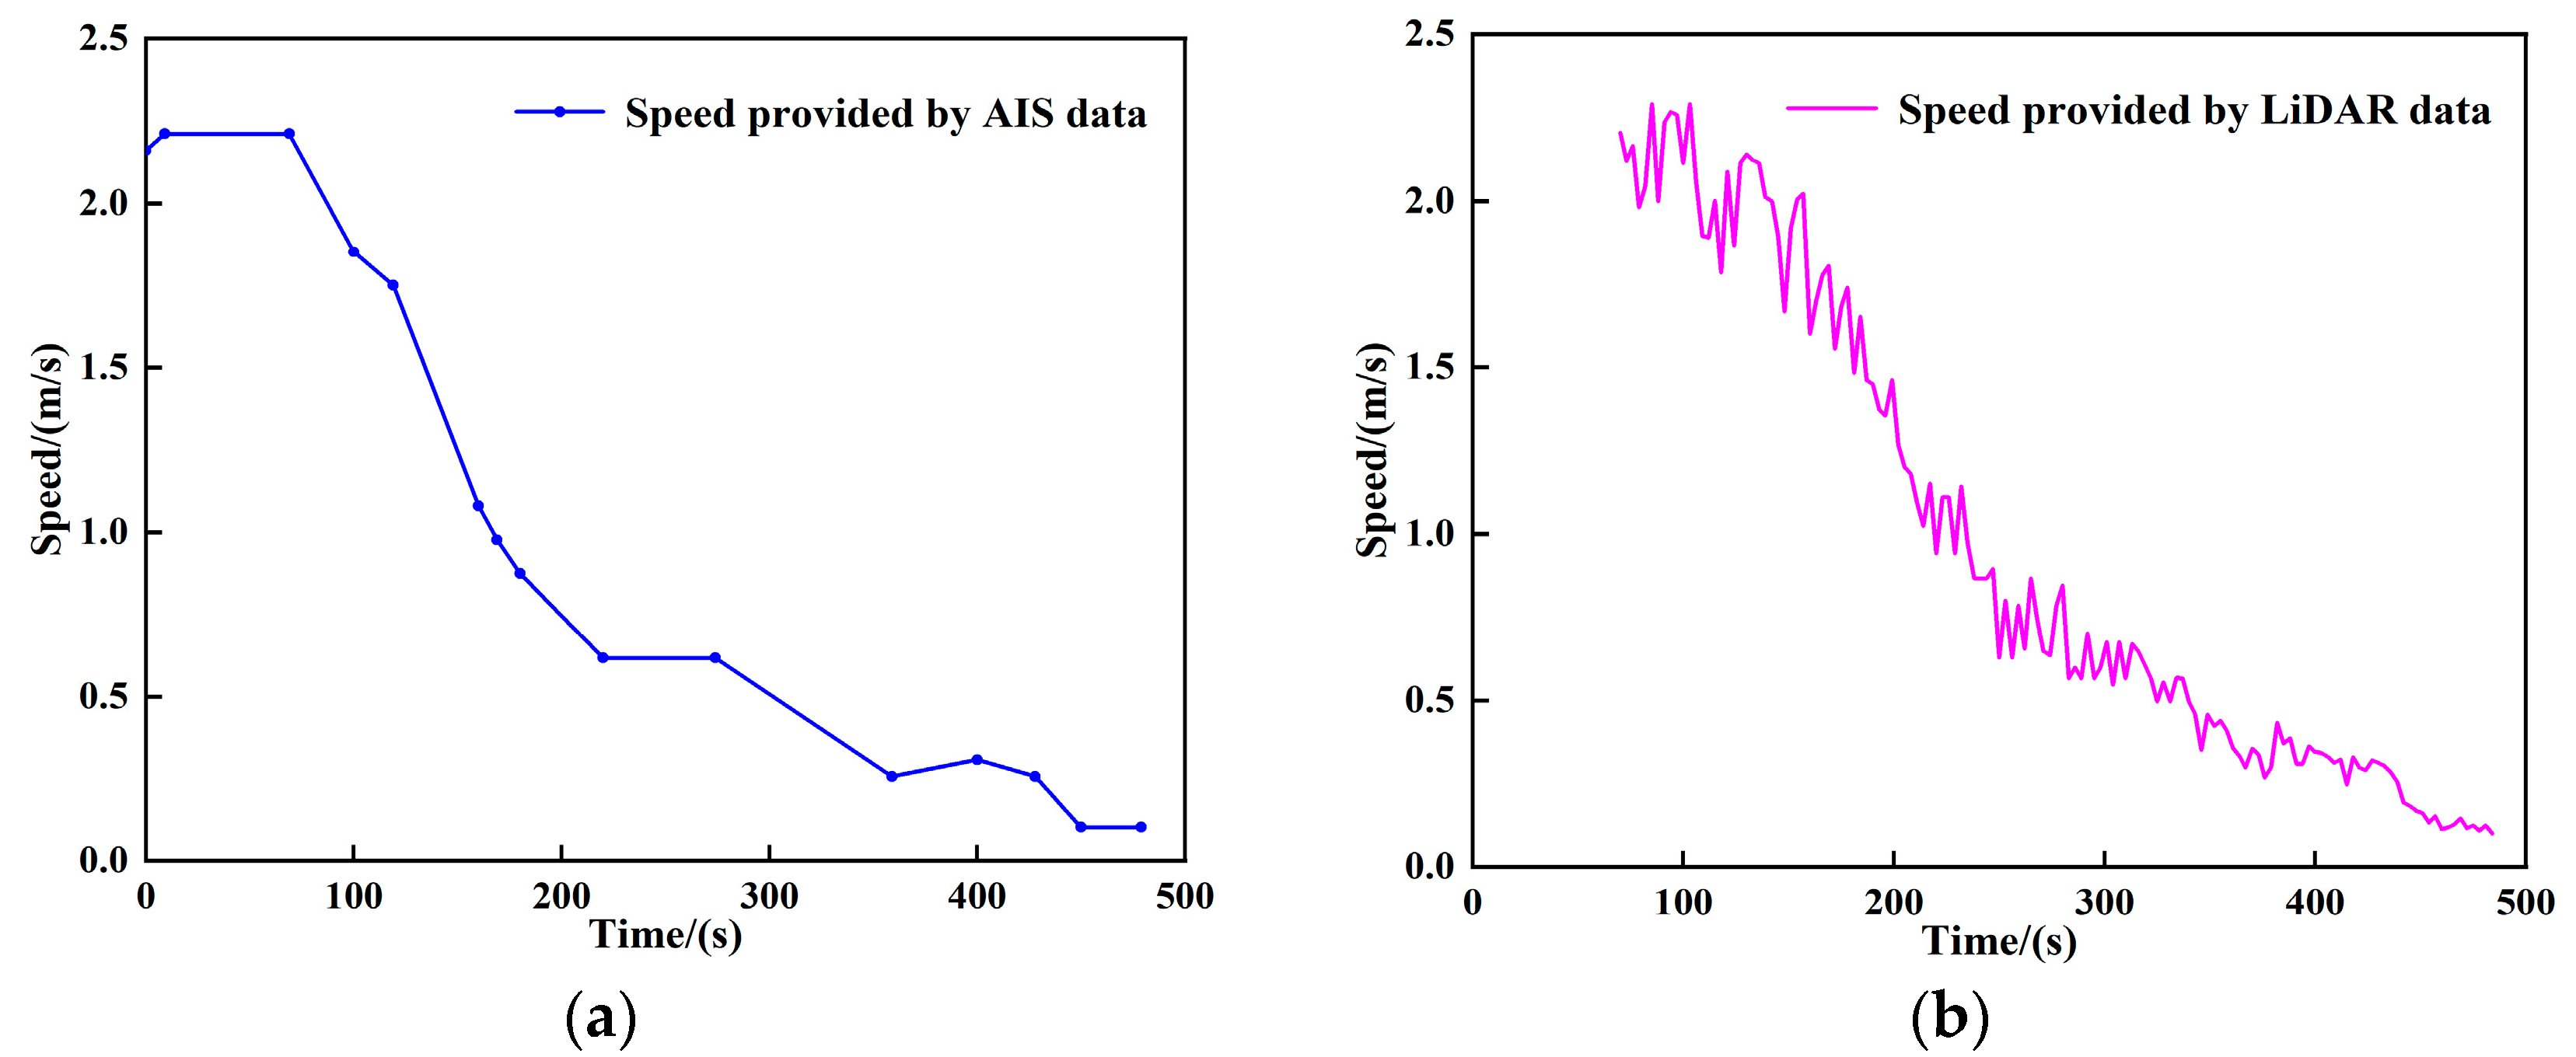
Figure 14b. In terms of the speed, AIS data smoothed out rapid adjustments in speed, as depicted in Figure 15a, and failed to capture rapid fluctuations in the ship’s movement. In contrast, LiDAR data directly derived the speed by measuring the continuous displacement variations, as shown in Figure 15b, thereby reflecting each instance of ship’s deceleration and acceleration.
Based on the above analysis, AIS data shows significant limitations in berthing scenarios that require high-precision, continuous monitoring, while LiDAR data provides a more accurate, comprehensive, and stable depiction of ship berthing behavior, providing a more solid foundation for prediction. Therefore, we can conclude that the proposed LiDAR data-driven method is both feasible and necessary to improve the accuracy and reliability of ship BBP.
Furthermore, the recorded AIS data typically simplifies the entire ship to a single point, whereas a large ship is a behemoth with a length of several hundred meters and a width of several tens of meters. Such a simplification is clearly inadequate to accurately describe the true dimensions of the behemoth and its complex motion status, especially during the berthing process, where the motion states of the bow and stern may change in distinctly different ways. LiDAR data can accurately reflect the spatial positions of various parts of the hull near the shore relative to the berth, helping solve the problem of real-time acquisition of the ship’s multi-point motion status. Therefore, the dataset constructed in this study introduces berthing information for the bow, midship, and stern, enabling the model to provide a more comprehensive prediction.
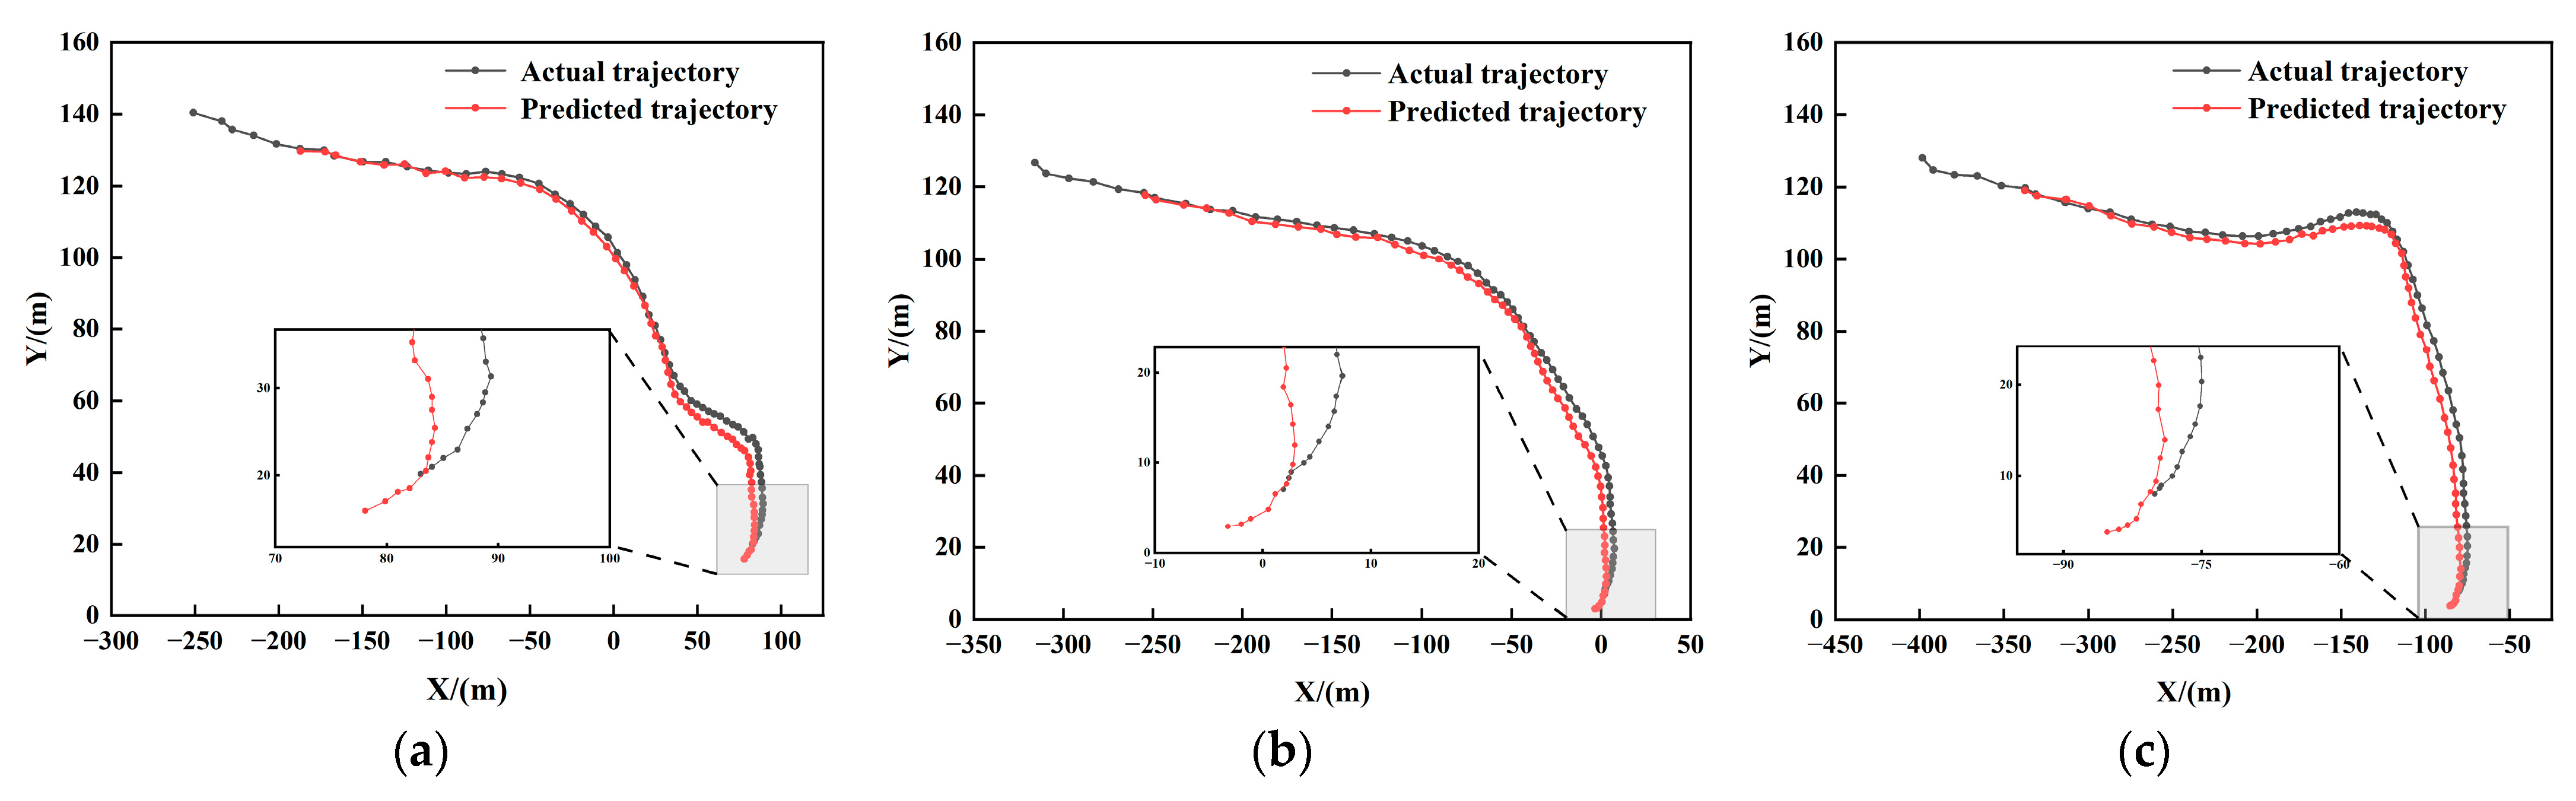
Figure 16 and Figure 17 show a comparison between the motion trajectories and speeds at key structural points of the ship, including the bow, midship, and stern, as predicted by the LiDAR data-driven baseline and the true values. Specifically, as illustrated in 
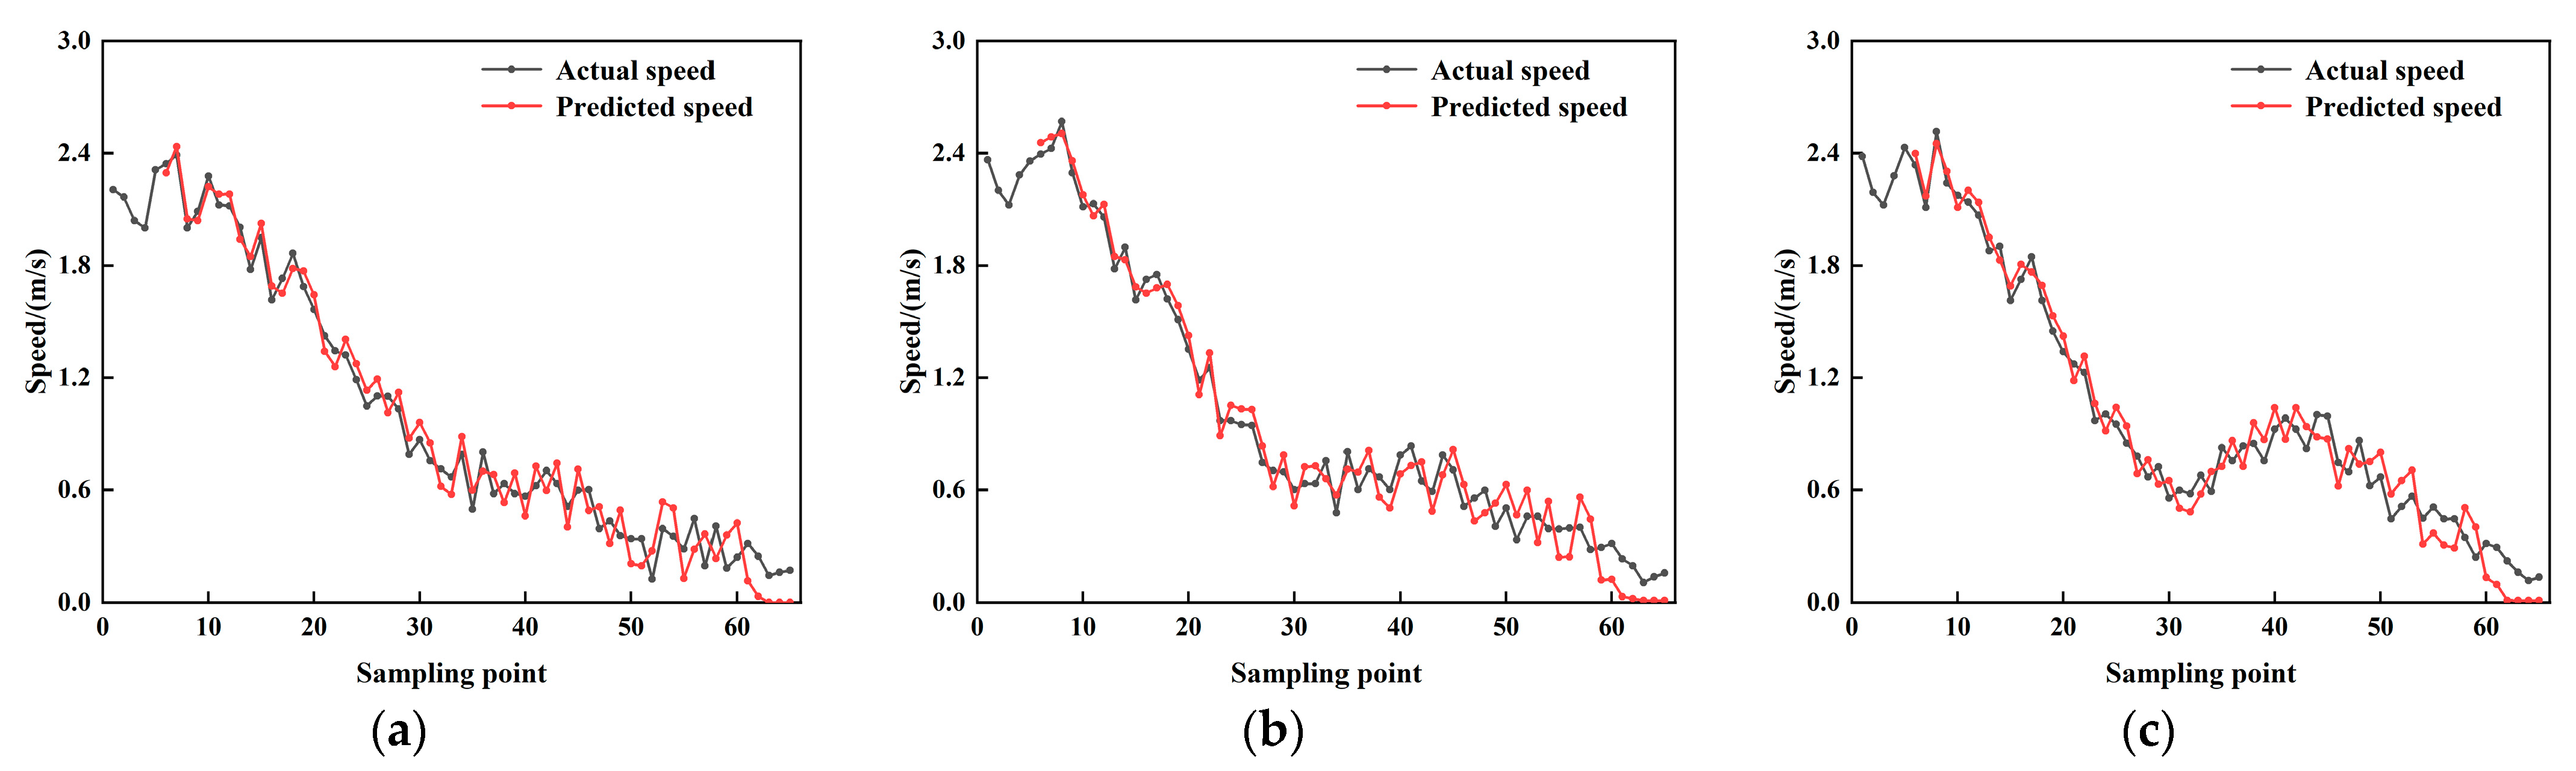
Figure 16, the trajectories predicted by the baseline exhibit a degree of spatial resemblance to the actual trajectories, accurately capturing the trajectory variation characteristics of each key point. Quantitatively, the average prediction errors at the bow, midship, and stern were 2.89 m, 2.91 m, and 3.03 m, respectively, while the terminal errors were 6.61 m, 6.57 m, and 6.74 m, respectively. For large ships, these errors remain within the acceptable range for practical berthing applications and can provide valuable references for berthing decision-making, path planning, and early warning. However, for scenarios such as autonomous berthing and precise positioning, further research is needed to reduce these errors. The non-stationary fluctuations in speed during the berthing process impose higher demands on the model’s predictive capability. Despite this, as shown in Figure 17, the speed prediction performance of the baseline remains relatively robust. The maximum absolute errors for predicted speeds at the bow, midship, and stern were 0.212 m/s, 0.199 m/s, and 0.207 m/s, respectively, indicating a high overall prediction accuracy. It must be noted, however, that the model did not always accurately respond to every acceleration or deceleration event. For example, in nodes when the ship suddenly decelerated, the model temporarily continued to predict an acceleration trend, leading to localized prediction deviations. Despite these occasional deviations, the overall accuracy achieved in multi-point speed prediction can still serve as an important reference.

4.4. Discussion

4.4.1. Discussion on the Performance and Limitations

The ship BBP task addressed in this paper aims to predict the ship’s multi-point trajectory, angle, and speed information relative to the berth over a forthcoming time window based on consecutive historical data acquired by a shore-based LiDAR system. Previous studies have shown that the sparsity and accuracy of AIS data are key challenges that negatively affect the accuracy of prediction models, particularly in berthing scenarios. In contrast, the representation of LiDAR data can provide richer, more precise, and higher-frequency berthing information, thereby offering the predictive model more detailed input features. This enhances the model’s ability to perceive the fine-grained and rapidly changing dynamics of ship berthing. The baseline developed in this study effectively leverages the strengths of CNN, BiGRU, and BiLSTM to improve prediction results, achieving competitive predictive performance across various evaluation metrics (MAE, MSE, and ADE) on our self-constructed dataset, further validating the potential of the proposed method in real-world berthing applications.
However, this study has certain limitations. Firstly, the detection range limitations of the LiDAR resulted in the experimental coverage area failing to encompass the entire ship berthing process. The current shore-based LiDAR system used in the experiments lacks sufficient point cloud data acquisition beyond 500 m from the berth, restricting the effective time window for behavior prediction and affecting the model’s ability to capture the full dynamics of the ship berthing process. Deploying high-performance LiDAR or integrating and coordinating multiple LiDAR systems could be considered to achieve wider spatial coverage for perception in the future. More complete data can support the model in comprehensively modeling and accurately predicting the dynamic states throughout the entire berthing process. Additionally, although the designed baseline meets the short-term prediction requirements for ship berthing behavior, it still lacks general applicability for long-term trajectory prediction due to the error accumulation in iterative predictions.

4.4.2. Discussion on the Implications for Smart Ports

Berthing is recognized as one of the most critical and risk-prone phases in maritime navigation. The LiDAR data-driven method demonstrates enhanced accuracy and stability in predicting ship berthing behavior. This holds practical relevance for port operators and shipping companies. Accurate ship BBP can assist them in better planning berthing routes and optimize berth scheduling, ensuring traffic safety and improving overall berthing efficiency. Meantime, the finding of this paper provides valuable references for future applications in smart port systems.
(1)
Our proposed LiDAR-based system is not meant to serve as a full substitute for AIS, but rather to function in a complementary manner. During long-range operations, the system utilizes AIS data to perform coarse trajectory predictions. Once the vessel enters the operational range of the shore-based LiDAR, the system seamlessly transitions to our high-precision deep learning model for fine-grained, real-time prediction. This integrated approach ensures comprehensive coverage throughout the berthing process, effectively balancing spatial range and predictive accuracy.
(2)
Our method can underpin an automated alert system. For instance, if the model forecasts a deviation from the designated berthing trajectory or an excessive berthing angle, the system can generate timely warnings. This advance notice allows operators to adjust propulsion settings or implement corrective maneuvers in a timely manner, thereby enhancing the safety and efficiency of the berthing operation.
(3)
The prediction outputs of our system can be encapsulated as standardized application programming interfaces (APIs), thereby facilitating seamless integration with existing port infrastructure, terminal operating systems, and onboard navigation platforms. This enables the embedding of predictive capabilities directly into smart port management and operational workflows.

5. Conclusions

In this paper, based on ship berthing data collected from a shore-based LiDAR system, a novel method is proposed for ship BBP tasks. By utilizing the LiDAR data to drive a hybrid deep learning architecture, the proposed method aims to achieve correct and stable prediction of trajectory, angle, and speed of ships in complex and dynamic berthing scenarios.
To test the feasibility and effectiveness of the proposed LiDAR data-driven method, a dataset was constructed, consisting of sequence data obtained from multiple berthing activities in a real port environment, and then a deep learning baseline was designed that integrates CNN, BiGRU, and BiLSTM in a specific order. A comprehensive comparative experiment demonstrated that the designed baseline significantly outperforms conventional recurrent units and combinations on our dataset, achieving lower trajectory, angle, and speed prediction errors. Moreover, through a visual analysis of the berthing process of the target ship, it was shown that, compared to AIS data, LiDAR data can provide a more accurate representation of the ship’s actual motion during berthing. The finding of this paper not only can assist the pilot and captain in making reasonable berthing decisions but also provide a valuable insight for port traffic scheduling, ensuring the safety and efficiency of berthing.
This paper primarily aimed to predict the future berthing behavior of ships using historical LiDAR data. Therefore, in future work, we plan to collaborate with more ports and terminals to collect berthing data from a wider variety and greater number of vessels under diverse conditions. This will enable us to build a larger and more diverse dataset, thereby enhancing the generalizability of our prediction model. More environmental variables (such as sea currents) will also be investigated and introduced. On this basis, prediction performance of the baseline on our dataset will be further enhanced by exploring other advanced techniques like multi-task learning and transfer learning. Attention will also be given to solve the anomaly detection and risk assessment of ship berthing based on accurate ship BBP predictions, thereby better serving the management of smart ports.

Author Contributions

Y.L.: Conceptualization, Funding acquisition, Project administration, Supervision, and Writing—review & editing. J.W.: Methodology, Software, Data curation, Formal analysis, Experiments, and Writing—review & editing. H.G.: Methodology, Formal analysis, and review. Z.Z.: Data processing and Proofreading. Y.G.: Experiments. All authors have read and agreed to the published version of the manuscript.

Funding

This work is supported by the National Key R&D Program of China (2023YFB4302300), the Fundamental Research Funds for the Central Universities (3132023507), the Dalian High-Level Talent Innovation Program (2022RG02), and the National Natural Science Foundation of China (52301410).

Institutional Review Board Statement

Not applicable.

Informed Consent Statement

Not applicable.

Data Availability Statement

The LiDAR dataset of ship berthing, which was utilized to support the findings presented in this paper, cannot be shared at this time. This is because the data also form part of an ongoing study, and are subject to restrictions until the completion of the related research project.

Conflicts of Interest

Author Hua Guo was employed by the company China Energy Shipping Company. The remaining authors declare that the research was conducted in the absence of any commercial or financial relationships that could be construed as a potential conflict of interest.

Abbreviations

The following abbreviations are used in this manuscript:
ADEAverage Displacement Error
AISAutomatic Identification System
BBPBerthing Behavior Prediction
BiLSTMBi-Directional Long Short-Term Memory
BiGRUBi-Directional Gated recurrent unit
CNNConvolutional Neural Network
FDEFinal Displacement Error
GANGenerative Adversarial Network
GATGraph Attention Network
GRUGate Recurrent Unit
IMOInternational Maritime Organization
LiDARLight Detection and Ranging
LSTMLong Short-Term Memory
MAEMean Absolute Error
MASSMaritime Autonomous Surface Ships
MSEMean Square Error
RFRandom Forest
RNNsRecurrent Neural Networks
RTKReal-Time Kinematic
Seq2SeqSequence-To-Sequence
SVRSupport Vector Regressor

References

  1. Xing, W.; Wang, J.; Zhou, K.; Li, H.; Li, Y.; Yang, Z. A hierarchical methodology for vessel traffic flow prediction using Bayesian tensor decomposition and similarity grouping. Ocean Eng. 2023, 286, 115687. [Google Scholar] [CrossRef]
  2. Li, Y.; Chen, B.; Liu, Q.; Zhang, Y. Geohash coding-powered deep learning network for vessel trajectory prediction using clustered AIS data in maritime Internet of Things industries. Comput. Electr. Eng. 2024, 120, 109611. [Google Scholar] [CrossRef]
  3. Pallotta, G.; Horn, S.; Braca, P.; Bryan, K. Context-enhanced vessel prediction based on Ornstein-Uhlenbeck processes using historical AIS traffic patterns: Real-world experimental results. In Proceedings of the 17th International Conference on Information Fusion (FUSION), Salamanca, Spain, 7–10 July 2014; pp. 1–7. [Google Scholar]
  4. Miller, A.; Walczak, S. Maritime Autonomous Surface Ship’s Path Approximation Using Bezier Curves. Symmetry 2020, 12, 1704. [Google Scholar] [CrossRef]
  5. Perera, L.; Guedes Soares, C. Ocean Vessel Trajectory Estimation and Prediction Based on Extended Kalman Filter. In Proceedings of the 2nd International Conference on Adaptive and Self-Adaptive Systems and Applications, Lisbon, Portugal, 21–26 November 2010. [Google Scholar]
  6. Sutulo, S.; Moreira, L.; Guedes Soares, C. Mathematical models for ship path prediction in manoeuvring simulation systems. Ocean Eng. 2002, 29, 1–19. [Google Scholar] [CrossRef]
  7. Capobianco, S.; Millefiori, L.M.; Forti, N.; Braca, P.; Willett, P. Deep Learning Methods for Vessel Trajectory Prediction Based on Recurrent Neural Networks. IEEE Trans. Aerosp. Electron. Syst. 2021, 57, 4329–4346. [Google Scholar] [CrossRef]
  8. Abebe, M.; Shin, Y.; Noh, Y.; Lee, S.; Lee, I. Machine Learning Approaches for Ship Speed Prediction towards Energy Efficient Shipping. Appl. Sci. 2020, 10, 2325. [Google Scholar] [CrossRef]
  9. Gao, D.; Zhu, Y.; Guedes Soares, C. Uncertainty modelling and dynamic risk assessment for long-sequence AIS trajectory based on multivariate Gaussian Process. Reliab. Eng. Syst. Saf. 2023, 230, 108963. [Google Scholar] [CrossRef]
  10. Zhang, L.; Alharbe, N.R.; Luo, G.; Yao, Z.; Li, Y. A hybrid forecasting framework based on support vector regression with a modified genetic algorithm and a random forest for traffic flow prediction. Tsinghua Sci. Technol. 2018, 23, 479–492. [Google Scholar] [CrossRef]
  11. Li, H.; Jiao, H.; Yang, Z. AIS data-driven ship trajectory prediction modelling and analysis based on machine learning and deep learning methods. Transport. Res. Part E Logist. Transport. Rev. 2023, 175, 103152. [Google Scholar] [CrossRef]
  12. Luo, X.; Niu, L.; Zhang, S. An Algorithm for Traffic Flow Prediction Based on Improved SARIMA and GA. KSCE J. Civ. Eng. 2018, 22, 4107–4115. [Google Scholar] [CrossRef]
  13. Rong, H.; Teixeira, A.P.; Guedes Soares, C. Ship trajectory uncertainty prediction based on a Gaussian Process model. Ocean Eng. 2019, 182, 499–511. [Google Scholar] [CrossRef]
  14. Rong, H.; Teixeira, A.P.; Guedes Soares, C. Maritime traffic probabilistic prediction based on ship motion pattern extraction. Reliab. Eng. Syst. Saf. 2022, 217, 108061. [Google Scholar] [CrossRef]
  15. Valsamis, A.; Tserpes, K.; Zissis, D.; Anagnostopoulos, D.; Varvarigou, T. Employing traditional machine learning algorithms for big data streams analysis: The case of object trajectory prediction. J. Syst. Softw. 2017, 127, 249–257. [Google Scholar] [CrossRef]
  16. Zhao, J.; Yan, Z.; Zhou, Z.; Chen, X.; Wu, B.; Wang, S. A ship trajectory prediction method based on GAT and LSTM. Ocean Eng. 2023, 289, 116159. [Google Scholar] [CrossRef]
  17. Forti, N.; Millefiori, L.M.; Braca, P.; Willett, P. Prediction oof Vessel Trajectories from AIS Data Via Sequence-To-Sequence Recurrent Neural Networks. In Proceedings of the 2020 IEEE International Conference on Acoustics, Speech and Signal Processing (ICASSP), Barcelona, Spain, 4–8 May 2020; pp. 8936–8940. [Google Scholar] [CrossRef]
  18. You, L.; Xiao, S.; Peng, Q.; Claramunt, C.; Han, X.; Guan, Z. ST-Seq2Seq: A Spatio-Temporal Feature-Optimized Seq2Seq Model for Short-Term Vessel Trajectory Prediction. IEEE Access 2020, 8, 218565–218574. [Google Scholar] [CrossRef]
  19. Zeng, X.; Gao, M.; Zhang, A.; Zhu, J.; Hu, Y.; Chen, P.; Chen, S.; Dong, T.; Zhang, S.; Shi, P. Trajectories prediction in multi-ship encounters: Utilizing graph convolutional neural networks with GRU and Self-Attention Mechanism. Comput. Electr. Eng. 2024, 120, 109679. [Google Scholar] [CrossRef]
  20. Liu, C.; Li, Y.; Jiang, R.; Du, Y.; Lu, Q.; Guo, Z.; Zhang, X. TPR-DTVN: A Routing Algorithm in Delay Tolerant vessel Network Based on Long-Term Trajectory Prediction. Wirel. Commun. Mob. Comput. 2021, 9, 6630265. [Google Scholar] [CrossRef]
  21. Song, H.; Liu, J.; Shi, Q.; Zhi, J.; Jiang, X. Multi-ship trajectory prediction framework for high-density maritime traffic areas based on BI-GRU and GAT. In Proceedings of the 2023 11th International Conference on Information Systems and Computing Technology (ISCTech), Qingdao, China, 30 July–1 August 2023; pp. 333–337. [Google Scholar] [CrossRef]
  22. Bao, K.; Bi, J.; Gao, M.; Sun, Y.; Zhang, X.; Zhang, W. An Improved Ship Trajectory Prediction Based on AIS Data Using MHA-BiGRU. J. Mar. Sci. Eng. 2022, 10, 804. [Google Scholar] [CrossRef]
  23. Wang, S.; He, Z. A prediction model of vessel trajectory based on generative adversarial network. J. Navig. 2021, 74, 1161–1171. [Google Scholar] [CrossRef]
  24. Zhang, B.; Xu, Z.; Zhang, J.; Wu, G. A warning framework for avoiding vessel-bridge and vessel-vessel collisions based on generative adversarial and dual-task. Comput.-Aided Civ. Infrastruct. Eng. 2022, 37, 629–649. [Google Scholar] [CrossRef]
  25. Nguyen, D.; Fablet, R. TrAISformer-A generative transformer for AIS trajectory prediction. arXiv 2021, arXiv:2109.03958. [Google Scholar] [CrossRef]
  26. Huang, P.; Chen, Q.; Wang, D.; Wang, M.; Wu, X.; Huang, X. TripleConvTransformer: A deep learning vessel trajectory prediction method fusing discretized meteorological data. Front. Environ. Sci. 2022, 10, 1012547. [Google Scholar] [CrossRef]
  27. Wang, H.; Yin, Y.; Jing, Q.; Cao, Z.; Shao, Z.; Guo, D. Berthing assistance system for autonomous surface vehicles based on 3D LiDAR. Ocean Eng. 2024, 291, 116444. [Google Scholar] [CrossRef]
  28. Hu, B.; Liu, X.W.; Jing, Q.F.; Lyu, H.G.; Yin, Y. Estimation of berthing state of maritime autonomous surface ships based on 3D LiDAR. Ocean Eng. 2022, 251, 111131. [Google Scholar] [CrossRef]
  29. Hu, Z.; Zhang, M.; Meng, J.; Xiao, H.; Shi, X.; Long, Z. Semantic Map-based Localization of USV Using LiDAR in Berthing and Departing Scene. In Proceedings of the 2023 7th International Conference on Transportation Information and Safety (ICTIS), Xi’an, China, 4–6 August 2023; pp. 583–589. [Google Scholar] [CrossRef]
  30. Wang, Z.; Zhang, Y. Estimation of ship berthing parameters based on Multi-LiDAR and MMW radar data fusion. Ocean Eng. 2022, 266, 113155. [Google Scholar] [CrossRef]
  31. Chen, C.; Li, Y. Ship berthing information extraction system using three-dimensional light detection and ranging data. J. Mar. Sci. Eng. 2021, 9, 747. [Google Scholar] [CrossRef]
  32. Chen, C.; Li, Y.; Wang, T. Real-time tracking and berthing aid system with occlusion handling based on LiDAR. Ocean Eng. 2023, 288, 115929. [Google Scholar] [CrossRef]
  33. Wang, T.; Li, Y.; Chen, C. Spatial state analysis of ship during berthing and unberthing process based on 3D LiDAR. Ocean Eng. 2023, 288, 116067. [Google Scholar] [CrossRef]
  34. Wang, T.; Li, Y. Spatial state analysis of ship during berthing and unberthing process based on multi-ship data from 3D LiDAR. Measurement 2025, 244, 116497. [Google Scholar] [CrossRef]
  35. Mentjes, J.; Wiards, H.; Feuerstack, S. Berthing Assistant System Using Reference Points. J. Mar. Sci. Eng. 2022, 10, 385. [Google Scholar] [CrossRef]
  36. Zhou, C.; Wang, J.; Qin, S.; Li, Z.; Latt, M. Real-time extraction method for ship berthing information based on 3D LiDAR. In Proceedings of the 13th International Conference on Transportation and Traffic Engineering (ICTTE), Wuhan, China, 28–30 December 2024; pp. 407–412. [Google Scholar] [CrossRef]
  37. Wang, J.; Li, Y.; Zhang, Z.; Wang, Z.; Liu, Z. Inshore-ship berthing parameters extraction system using 2D bird’s eye view of 3D LiDAR data. Measurement 2025, 249, 117050. [Google Scholar] [CrossRef]
Figure 1. Flow of data preprocessing.
Jmse 13 01396 g001
Figure 2. Framework of the CNN-BiGRU-BiLSTM model.
Jmse 13 01396 g002
Figure 3. Framework of CNN.
Jmse 13 01396 g003
Figure 4. The framework of the BiLSTM.
Jmse 13 01396 g004
Figure 5. The framework of the BiGRU.
Jmse 13 01396 g005
Figure 6. The structure of the bidirectional recurrent network.
Jmse 13 01396 g006
Figure 7. Top view of Dalian Port, China.
Jmse 13 01396 g007
Figure 8. Images of berthing: (a) ship HuLuDao, (b) ship WanTongHai, and (c) ship ShengSheng2.
Jmse 13 01396 g008
Figure 9. Placement of the LiDAR system for experiments.
Jmse 13 01396 g009
Figure 10. Placement of the experimental sensor for experiments.
Jmse 13 01396 g010
Figure 11. Example of a sliding window.
Jmse 13 01396 g011
Figure 12. (a) Image of the target ship berthing and (b) point cloud data of the target ship berthing.
Jmse 13 01396 g012
Figure 13. Trajectory of the ship: (a) trajectory provided by AIS data and (b) trajectory provided by LiDAR data.
Jmse 13 01396 g013
Figure 14. Angle of the ship: (a) angle provided by AIS data and (b) angle provided by LiDAR data.
Jmse 13 01396 g014
Figure 15. Speed of the ship: (a) speed provided by AIS data and (b) speed provided by LiDAR data.
Jmse 13 01396 g015
Figure 16. The comparison of predicted and actual trajectories: (a) the results for the bow point, (b) the results for the midship point, and (c) the results for the stern point.
Jmse 13 01396 g016
Figure 17. The comparison of predicted and actual speeds: (a) the results for the bow point, (b) the results for the midship point, and (c) the results for the stern point.
Jmse 13 01396 g017
Table 1. Parameters of the experimental ships.
Ship NameTotal Length/mTotal Width/mShip TypeBerthing Time
HuLuDao13623Passenger ship17–18 P.M.
WanTongHai 16425Passenger ship19–20 P.M.
ShengSheng216524Passenger ship4–5 A.M.
Table 2. Specifications of the LiDAR system.
ItemParameter
Maximum detection distance500 m
Precision±2 cm
Angle resolution (H × V)0.18° × 0.24°
Visual range (H × V)120° × 25°
Frame rate10 FPS
Laser wavelength1550 nm
Working voltage24 V
Average power50 W
Table 3. Composition of the dataset.
Ship NameTrajectoriesTimestamp Points
HuLuDao2110,752
ShengSheng22712,501
WanTongHai2913,224
Table 4. Hyperparameter configuration of network training.
ParametersValuesParametersValues
Batch size32Epochs100
Crop size128 × 128Weight decay1 × 10−4
Learning rate0.001Gradient clipping1.0
Table 5. The performance results for each single-layer model on our dataset.
ModelMSEMAEADE (m)FDE (m)
AngleSpeedAngleSpeedTrajectoryTrajectory
RNN0.003480.029450.059070.171417.6134515.90547
GRU0.002390.016900.048920.130355.5312411.83986
LSTM0.001800.007640.042510.087634.739809.96559
BiGRU0.001260.004250.035580.065804.233639.19652
BiLSTM0.001450.004760.038110.068414.422399.42540
Transformer0.001970.010590.044470.102744.8965410.57026
Table 6. The performance results for each CNN-single-layer model on our dataset.
ModelMSEMAEADE (m)FDE (m)
AngleSpeedAngleSpeedTrajectoryTrajectory
C-RNN0.002870.024850.053610.157646.9434514.60549
C-GRU0.002000.014620.044720.120804.9498110.63069
C-LSTM0.001470.006600.038360.081284.216969.29328
C-BiGRU0.001010.003720.031780.060753.799158.23725
C-BiLSTM0.001220.003950.034850.062853.964908.53545
C-Transformer0.001610.008750.040110.093594.452379.79071
Table 7. The performance results for each combination on our dataset.
ModelMSEMAEADE (m)FDE (m)
AngleSpeedAngleSpeedTrajectoryTrajectory
C-BiGRU-BiGRU0.000760.002510.027580.050643.256837.28694
C-BiLSTM-BiLSTM0.000920.003650.030640.059683.636408.09548
C-BiLSTM-BiGRU0.000790.002800.028210.052763.405697.48019
C-BiGRU-BiLSTM0.000700.001960.026540.043383.024186.81442
Disclaimer/Publisher’s Note: The statements, opinions and data contained in all publications are solely those of the individual author(s) and contributor(s) and not of MDPI and/or the editor(s). MDPI and/or the editor(s) disclaim responsibility for any injury to people or property resulting from any ideas, methods, instructions or products referred to in the content.

