Article

Shore-Based Constant Tension Mooring System Performance and Configuration Study Based on Cross-Domain Collaborative Analysis Method

1
National Demonstration Center for Experimental Mechanical and Electrical Engineering Education, Tianjin University of Technology, Tianjin 300384, China
2
National Engineering Laboratory for Port Hydraulic Construction Technology, Tianjin Research Institute for Water Transport Engineering, Tianjin 300456, China
*
Author to whom correspondence should be addressed.
J. Mar. Sci. Eng. 2025, 13(8), 1385; https://doi.org/10.3390/jmse13081385
Submission received: 2 July 2025 / Revised: 17 July 2025 / Accepted: 21 July 2025 / Published: 22 July 2025
(This article belongs to the Section Coastal Engineering)

Abstract

In this paper, a new solution is proposed for the problem of mooring safety of large ships in complex sea conditions. Firstly, a dual-mode mooring system is designed to adaptively switch between active control and passive energy storage, adjusting the mooring strategy based on real-time sea conditions. Second, a collaborative analysis platform based on AQWA-Python-MATLAB/Simulink was researched and developed. Thirdly, based on the above simulation platform, the performance of the mooring system and the effects of different configurations on the stability of ship motion and dynamic tension of the cable are emphasized. Finally, by comparing the different mooring positions under various sea conditions with the traditional mooring system, the results show that the constant tension mooring system significantly improves the stability and safety of the ship under both conventional and extreme sea conditions, effectively reducing the fluctuation of cable tension. Through the optimization analysis, it is determined that the configuration of bow and stern cables is the optimal solution, which ensures safety while also improving economic benefits.

1. Introduction

With the rapid development of offshore engineering and the shipping industry, the safe mooring of large ships has received increasing attention. Mooring operations are one of the most sensitive, complex, and critical operations when analyzed from a ship management perspective [1,2,3,4,5]. UK P&I Club, an organization that provides protection and indemnification on a global scale, has seen a large number of seafarers seriously injured as a result of significant mooring equipment accidents with indemnification of more than $34 million from 1999 to 2009. Furthermore, 5 percent of mooring equipment accidents occurred due to mooring winches, 42 percent were caused by slipping reels, and 53 percent were caused by broken ropes and wires. Mooring accidents are the seventh most common cause of injury and the third most expensive in terms of claims. In the Oil Companies International Forum [6], it is stated that when a large ship enters a harbor for mooring, the change in tension on the cable is affected by wind, currents, tides, interactions from other boats, waves, and changes in draft or sideways inclination produced by the ship during loading and unloading of cargo [7], which has to be resolved by multiple cable management [8]. Research results show that so far in the process of cable management, most experienced seafarers manually adjust the cable to regulate the tension, which is very dangerous when the environmental conditions are not suitable, the ship’s maneuvering power is insufficient, and the teamwork between the operator’s insufficient ability does not work well together [9].
In order to solve the above problems, the constant tension mooring system plays a key role. The system can monitor the cable tension in real-time and adjust the cable length automatically, thus significantly reducing the workload of the crew. Through constant tension control, the system can distribute the force of each cable in a balanced manner, which not only effectively reduces the maximum tension load of a single cable but also significantly improves the mooring stability of the ship [10,11].
Constant tension control is a technology that maintains tension stability by adjusting displacement or force in real time. It is widely used in coil processing, lifting, and towing operations. In the fields of marine engineering, constant tension winches are commonly used to maintain constant tension in mooring cables. In recent years, an increasing number of experts have conducted research on constant tension mooring. So far, scholars have proposed some new mooring technologies [12]; the automatic vacuum mooring system is one of the latest ship technologies in maritime development. During mooring operations, the vacuum pads continuously pull the ship toward the dock. After mooring, the vacuum pads maintain the ship’s position against the dock. The automatic magnetic mooring system, developed by Mampaey Dock in the Netherlands, operates on a similar principle to the automatic vacuum mooring system. However, the magnetic force generated by this system may interfere with the ship’s electronic equipment. Dynamic mooring systems can deliver mooring ropes to ships without requiring complex rope systems. These systems can safely release mooring ropes at maximum safe working loads (SWL) either locally or remotely while actively maintaining constant tension in the mooring ropes. The quick-release hook device (QRH), which has been installed in facilities worldwide since 1972, enables safe mooring by securing ropes to the quick-release hook. This allows for quick and easy release, improving operational efficiency and reducing mooring departure times [13].
In constant tension control, many experts have studied the mooring of floating offshore wind power systems to obtain that the constant tension mooring system can significantly reduce the length of the mooring line used and the maximum mooring line tension, avoiding damage to the wind turbine caused by over-tightening of the mooring chain and overloading of the mooring, and effectively improving the survivability of floating offshore wind turbines in extreme conditions in shallow water [14]. Q. Chen et al. used a model to evaluate and analyze PID and FUZZY P+ID controllers for constant tension winches operating under waves [15] and verified the robustness of FUZZY P+ID to many unmeasurable disturbances such as buoyancy, drag, and wave effects through practical applications in 2016 [16]. Zhu P. Zhang et al. established a PID control system based on ordinary PID control, fuzzy PID control, and BP fuzzy neural network PID control and gave a simulation model of a cable constant tension winch based on NARX neural network prediction of tension compensation value plus BP fuzzy neural network PID control with high accuracy of cable tension control, fast dynamic response, smooth system, and no overshoot [17].
Nazligul and other scholars have shown that although modern offshore mooring technology has developed various forms, traditional passive mooring systems still dominate current engineering practice [13]. In recent years, many scholars have made significant progress in the research field of constant tension mooring systems, and their research results have fully demonstrated the important value of such systems in enhancing mooring safety and reliability [18,19,20,21,22,23,24]. However, there are still research gaps in the existing literature in two key aspects: first, the lack of a joint analysis methodology with multi-software synergy, and second, the lack of in-depth research on the optimal arrangement of shore-based constant tension mooring systems.
Based on this, this study focuses on the following innovative research based on systematically combing the existing research results and combining them with the team’s previous work [25,26]: firstly, the limitations of the traditional mooring system are analyzed; secondly, a shore-based constant tension mooring system with active/passive dual-mode switching function is proposed, and its spatial arrangement scheme is optimized and designed. To verify the performance of the system, a co-simulation platform based on AQWA(2022R1)-Python(3.9)-MATLAB/Simulink(R2023b) is developed in this study. The platform achieves accurate simulation of the dynamic response of the mooring system by building a hull-mooring coupling model in AQWA, a constant tension control system model in MATLAB/Simulink, and real-time data interaction using Python. Through the parametric analysis of the system and the comparison study of multiple working conditions, the optimal arrangement scheme of the constant tension mooring system is finally determined in this study.

2. System Design and Operating Principles

2.1. Purpose of System Design

During ship berthing operations, the combined effects of a variety of environmental loads (including wind, currents, waves, surges, ice loads, tidal action, etc.) can cause significant ship displacement [27]. To ensure operational safety, the mooring system must have sufficient load-bearing capacity to resist the dynamic forces caused by these environmental loads. Particularly in the case of load changes due to strong swells, rough sea conditions, or harbor loading and unloading operations, this can lead to a significant increase in cable tension in the direction of the force [28].
Conventional mooring methods usually use cables fixed directly to the shoreline bollards, as shown in Figure 1. When environmental loads displace the ship, the tension of the cable in the direction of the load will increase dramatically, while the tension of the cable in the direction of the backload will decrease accordingly, as shown in Figure 2 (the red color indicates the high-tension cable and the green color indicates the low-tension cable). Under extreme environmental conditions, this uneven tension distribution phenomenon will further deteriorate, which may lead to cable breakage accidents, resulting in significant casualties and property damage [28]. Adopting a constant tension mooring system with adaptive adjustment is important to ensure the safety of ship mooring, protect the lives and properties of people, and maintain the integrity of harbor facilities.

2.2. Design of Constant Tension Mooring System

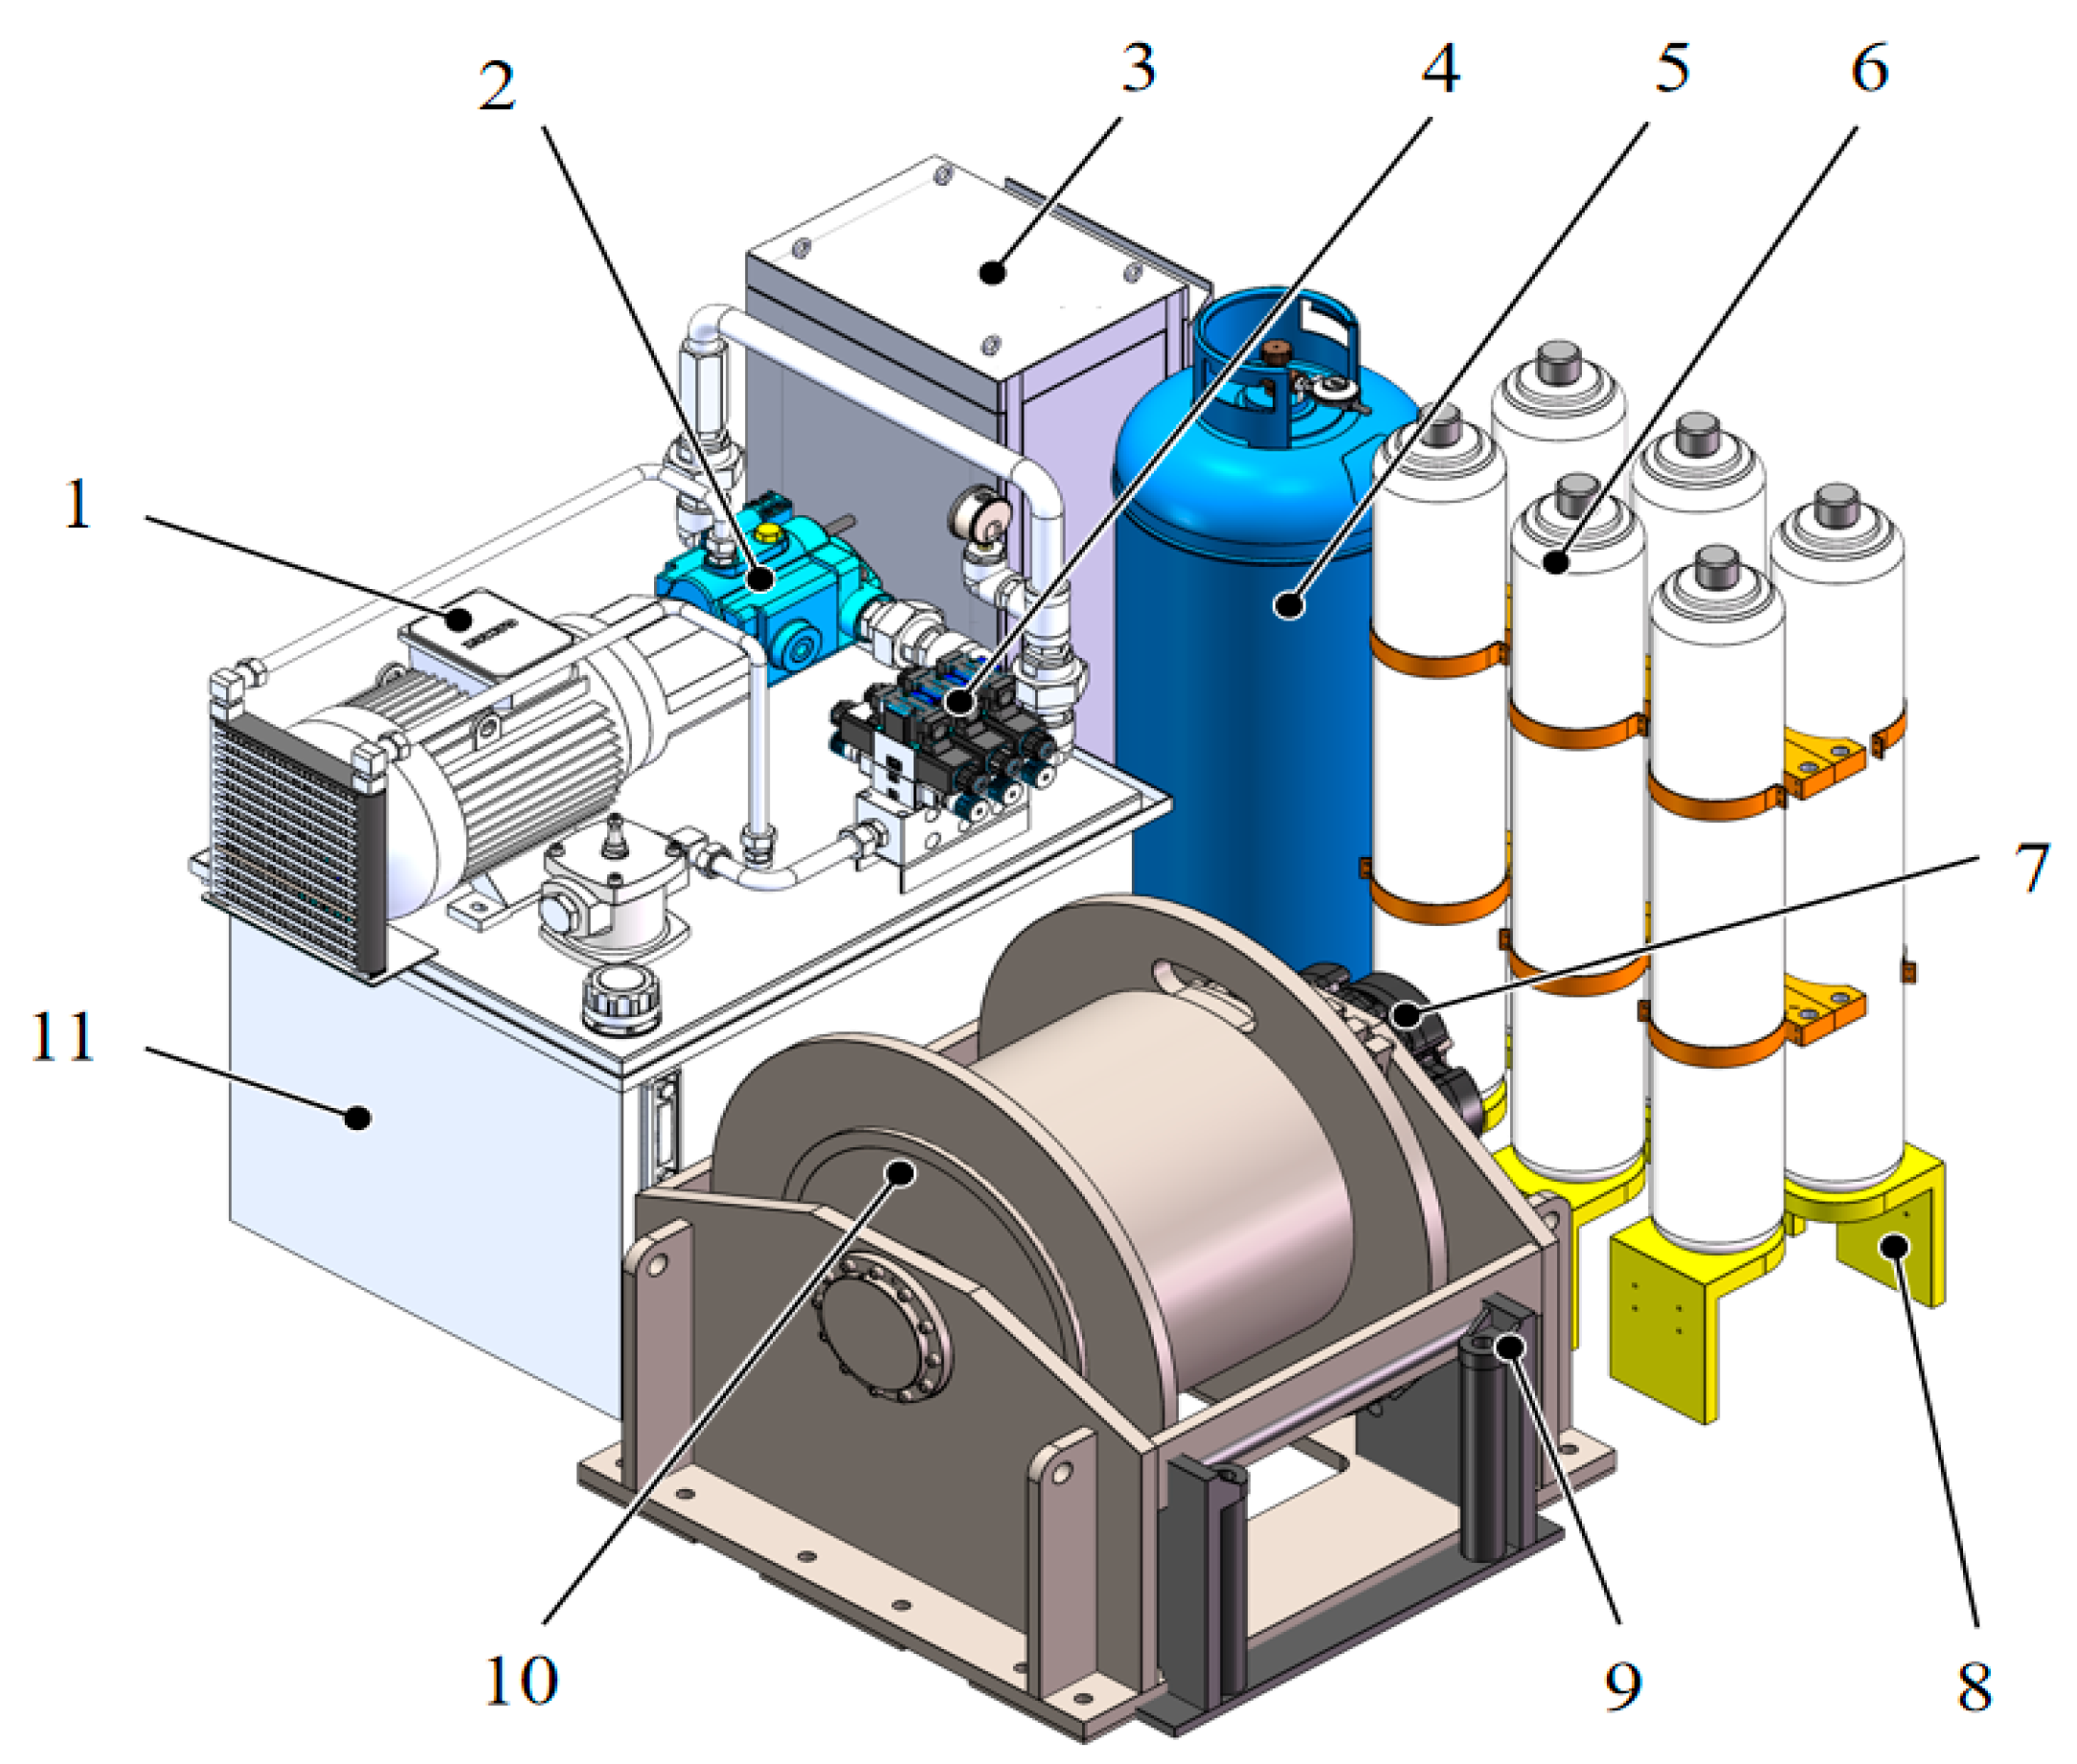
The system is designed for existing ports with a constant tension mooring system consisting of the following main components: control system, hydraulic system, and execution system. The execution system consists of motor 1, hydraulic pump 2, control cabinet 3, hydraulic valve 4, nitrogen cylinder 5, accumulator 6, hydraulic motor 7, accumulator support 8, guide door 9, winch 10, hydraulic tank 11, etc., as shown in Figure 3.
Constant tension winch systems can be categorized into two modes of operation: actively controlled and passive [16]. This system adopts a reversing valve to realize the intelligent switching between the two modes, and the specific workflow is as follows: in the phase of ship berthing operation, after the cable is connected to the mooring system, the programmable logic controller (PLC) sends commands to the reversing valve to switch the hydraulic oil circuit to the active control mode; at this time, several mooring systems work together, and the ship will be towed to the predetermined mooring position through precise control. Subsequently, the system automatically adjusts the cable tension to the preset constant value according to the real-time monitoring of the sea state parameters, the ship’s tonnage, and the cable parameters and synchronously adjusts the accumulator pressure to the corresponding set value, as shown in Figure 4.
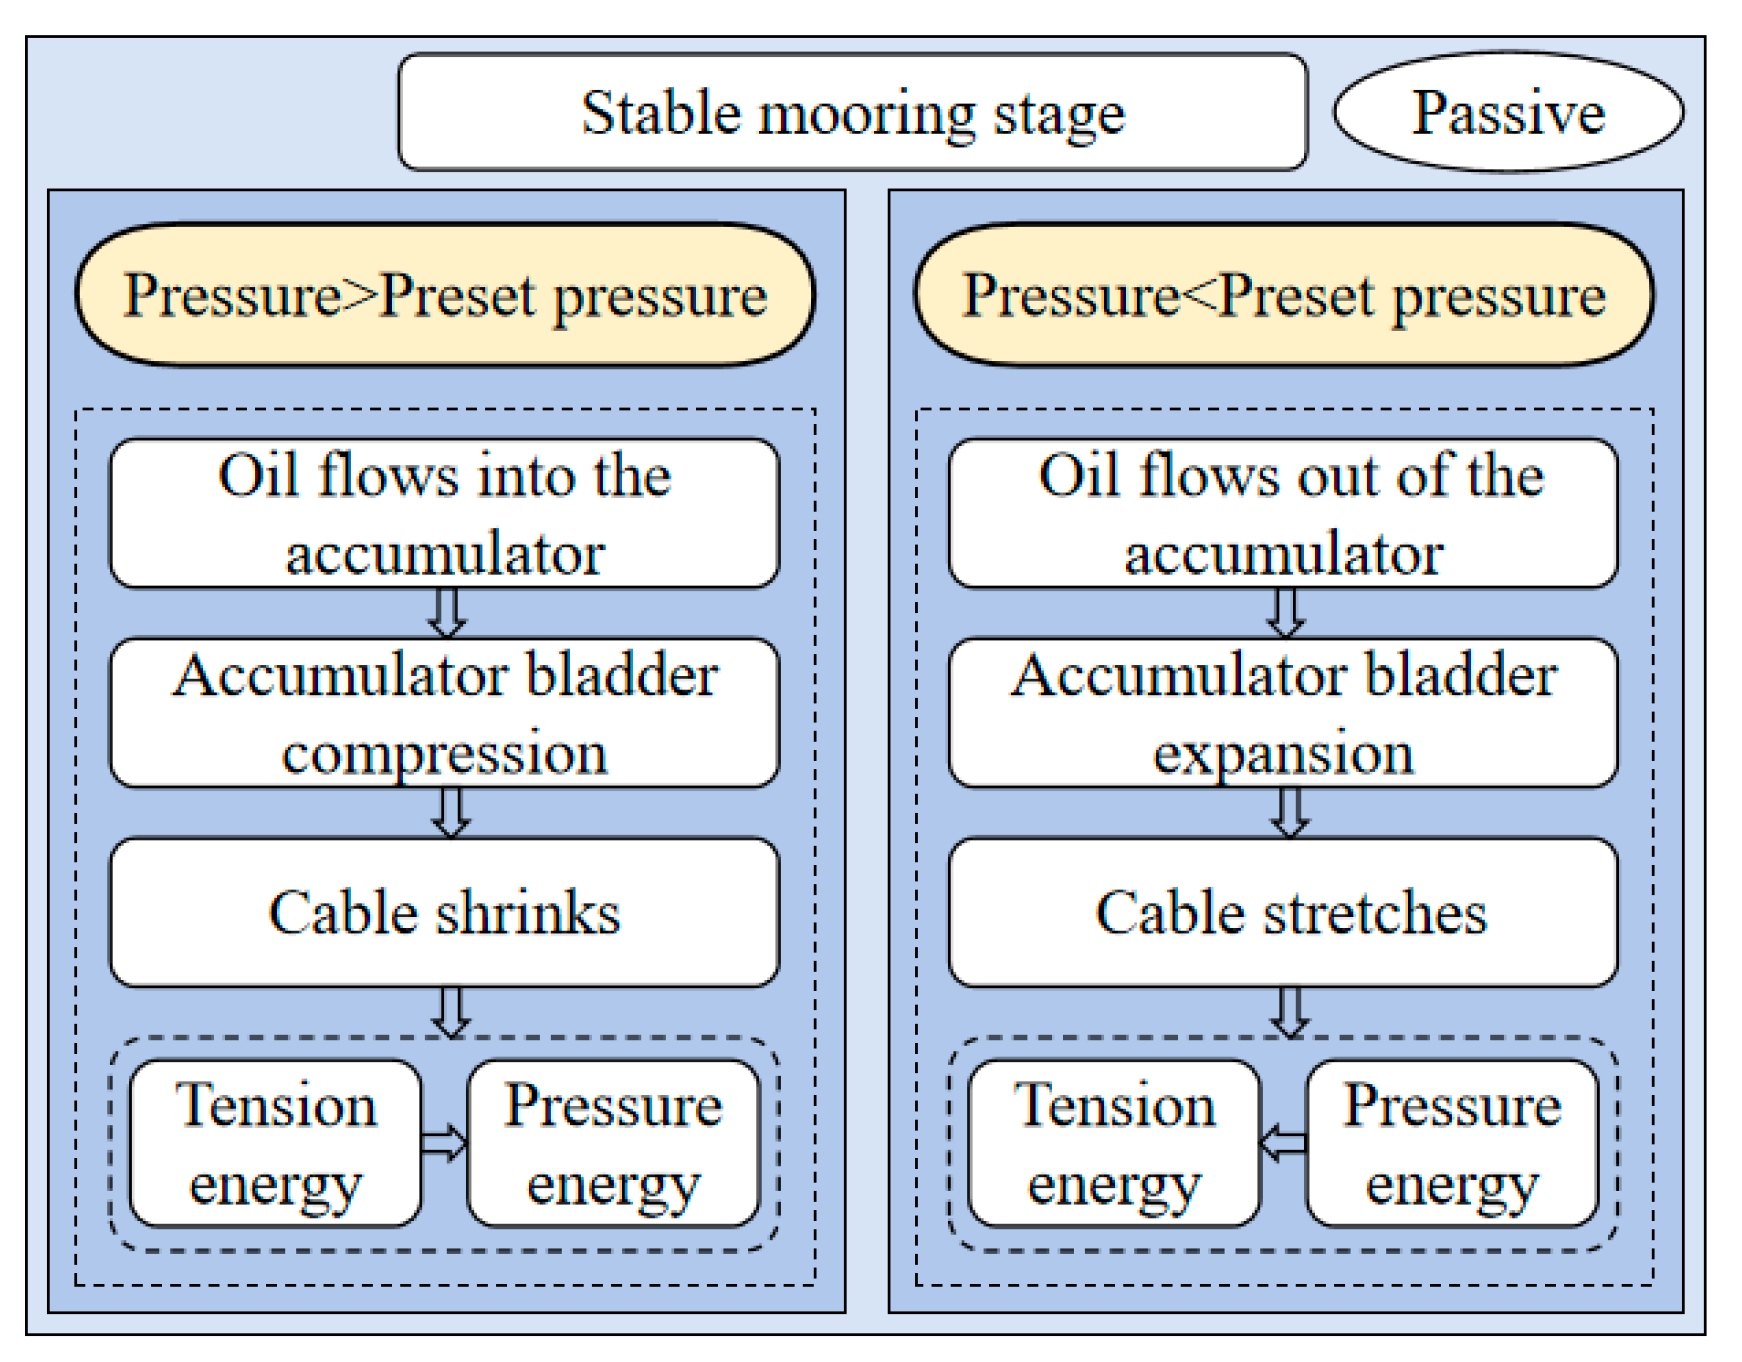
After completing the positioning adjustment, the system automatically switches to passive control mode and connects the accumulator to the hydraulic circuit. In this mode, the mooring system enters a stable working state. When the cable tension exceeds the set threshold, the system transfers the excess energy from the cable to the accumulator through the hydraulic circuit. At this time, the accumulator’s bladder compresses, and the elastic potential energy generated by the cable tension is converted into pressure energy storage. When the cable tension falls below the set value, the system releases the pressure energy stored in the accumulator and converts it into tension, which actively compensates for the slack in the cable, thus achieving a relatively constant tension on the cable. No external energy input is required to maintain a relatively constant tension on the cable, as shown in Figure 5.
The system monitors the change in cable tension in real time when there is a change in sea state, tidal action, or change in the draft due to ship loading and unloading during the mooring period. Once the tension value is detected to be out of the preset threshold range, the system immediately starts the active control program to quickly restore the cable tension to the set constant value by intelligently adjusting the pressure of the accumulator, as shown in Figure 4, and the system automatically switches to the active mode to ensure that the tension on the cable is less than the work load limit (WLL) through intelligent control when extreme sea conditions are encountered, ensuring the mooring safety [6].

2.3. Mathematical Model of the Mooring System

In this constant tension mooring system, the accumulator, as the core regulator, plays a key role in maintaining the constant cable tension during the stabilization phase of the mooring. The accumulator adopts a two-way energy regulation mechanism, which realizes that the system can effectively maintain the mooring tension relatively constantly through the dynamic storage and release of energy without external energy input.
In the design process of constant tension mooring systems, the establishment of an accurate mathematical model is the key technical foundation. It should be noted that there are two main nonlinear factors in the actual operation of hydraulic motors: one is the internal leakage effect due to machining accuracy, and the other is the significant heat loss generated by the high-pressure fluid flow through the transmission line. These factors work together to give the system a typical strong nonlinear time-varying characteristic. To simplify the analysis, this study adopts the small disturbance linearization method to linearly approximate the nonlinear characteristics near the stable operating point of the system and finally derives the continuous control equation of the hydraulic motor flow:
Q m = C i m ( P h P l ) + D m d θ m d t + V s 4 β e d ( P h P l ) d t + C o m P h
where  Q m is the hydraulic motor output flow,  C i m is the internal leakage coefficient,  C o m is the external leakage coefficient,  P h is the pressure of the high-pressure pipeline,  P l is the low-pressure pipeline backpressure pressure,  D m is the hydraulic motor flow,  θ m is the hydraulic motor angle of rotation,  V s is the hydraulic motor single-cavity volume, and  β e is the effective bulk modulus. The hydraulic motor output torque balance equation is:
n D m ( P h P b ) = J m d 2 θ d t 2 + B m d θ m d t + T o
where  J m is the total rotational inertia,  B m is the equivalent viscous damping coefficient, and  T o is the load torque. The operating principle of the accumulator is based on the Boyle–Mariotte ideal gas equation of state. During the long-term mooring of the ship, the cable generates a high energy input, and the heat exchange effect during the whole working process is negligible due to the good adiabatic properties of the system, so the equation in the accumulator skin capsule is:
P 0 V 0 k = P 1 V 1 k = P 2 V 2 k = constant
where  k is the temperature coefficient,  P 0 is the pressure of the accumulator at the initial time,  V 0 is the volume of the accumulator at the initial time,  P 1 is the pressure of the accumulator at the beginning of the mooring,  V 1 is the volume of the accumulator at the beginning of the mooring,  P 2 is the pressure of the adjusted accumulator, and  V 2 is the volume of the skin bladder in the adjusted accumulator. According to the relationship between the pressure and the volume in the accumulator, it can be known that the volume of the skin bladder in the accumulator is:
V 1 = P 0 V 0 k P 1 k
Since the total volume inside the accumulator is the sum of the gas volume and the liquid volume, it is known that the volume of the liquid in the accumulator changes by the amount:
V 0 = V 1 + V l
where  V l is the volume of the liquid in the accumulator, and the flow rate of the accumulator is known by the amount of change in the volume of the liquid in the accumulator:
Q e = d V l d t
where  Q e is the flow rate of the accumulator input or output when the relative displacement of the ship occurring on the cable tension acts on the winch. The deceleration device can be known to act on the hydraulic motor torque:
T i = F c D 2 n
where  F c is the tension on the cable,  D is the diameter of the winch,  n is the gear ratio of the reducer, and  T i is the input torque of the hydraulic motor. The following formula can obtain the hydraulic motor torque balance formula [29]:
F c D 2 n = ( P h P l ) D m η 2 π
where  η is the transmission efficiency, and the pressure in the high-pressure chamber in the hydraulic motor is:
P h = F c D π n D m η + P l
It can be obtained by the equation:
d V l d t = C i m ( P h P l ) + D m d θ m d t + V s 4 β e d ( P h P l ) d t + C o m P h
The angle  θ of rotation of the hydraulic motor can be obtained by derivation as:
θ = d V l d t C i m ( P h P l ) V s 4 β e d ( P h P l ) d t C o m P h D m
The following equation can find the length of cable extension or contraction:
L = D 2 θ
where  L is the length of cable extension or contraction. (The physical meanings of the key physical parameters in Formulas (1)–(12) can be found in Table A1 of Appendix A).

2.4. Mathematical Model of a Ship

To verify the performance of the constant tension mooring system proposed in this paper, a 40,000-ton ship is selected as the research object. In the process of numerical analysis, we established a complete ship mooring system coupling model, in which the key parameters of the ship hull, as shown in Table 1, include, but are not limited to, the ship’s main scales (overall length, width, depth), displacement, draft, moment of inertia, etc. By analyzing the mooring performance of this ship, the applicability of this system on ships of different tonnages can be better evaluated.

3. Numerical Simulation and Analysis

3.1. Numerical Simulation Parameter Setting

In this study, a numerical simulation of a multi-body coupled system is carried out to address the dynamic response of a moored ship in an irregular wave environment. Based on the three-dimensional potential flow theory, a fully coupled analysis system containing the wind-wave-current environmental loads, the ship’s six-degree-of-freedom motion, the mooring cable dynamics, and the coastal boundary conditions is constructed [30].

3.1.1. Wave Load Modeling

In practice, wave models are often modelled using the linear superposition principle [31], for example:
ζ ( X , Y , t ) = m = 1 N d j = 1 N m a j m e i ( k j m X cos x m + k j m Y sin x m ω j m t + α j m )
where  N d and  N m denote the number of wave directions and the number of wave components in each wave direction, respectively;  x m ( m = 1 , N d ) denotes the wave direction;  α j m denotes the wave amplitude;  ω j m denotes the wave frequency;  k j m denotes the number of waves; and  α j m denotes the random phase angle of wave components ( j = 1 , N m ). The wave representation of irregular waves can be realized by specifying the wave spectrum, which in this study is based on the JONSWAP Spectrum, and the value of the spectral coordinates at a certain frequency is:
S ( ω ) = α g 2 γ a ω 5 exp 5 ω p 4 4 ω 4
where  ω p is the peak frequency,  γ is the peak enhancement factor, and  α is a constant related to wind speed and spectral peak frequency.

3.1.2. Wind Load Modelling

When analyzing the problem of wind response to the dynamic response of a moored ship, this study is based on the NPD Wind Spectrum [32], where the average 1 h wind speed distribution curve at height  Z is:
V ¯ z = V ¯ 10 1 + C ln Z 10
where  V ¯ z denotes the 1 h duration mean wind speed at height  Z V ¯ 10 denotes the mean wind speed at 10 m above the water surface,  C = 0.0573 1 + 0.15 V ¯ 10 , and the NPD wind energy density spectrum at height  Z is:
S ( f ) = 320 V ¯ 10 10 2 Z 10 0.45 1 + f ˜ 0.468 3.561
where  f is the frequency,  f ˜ = 172 f z 10 2 / 3 V ¯ 10 3 / 4 .

3.1.3. Flow Load Modeling

The Ekman current is generated by the balance of Coriolis forces and wind-induced surface friction, forming a decaying spiral structure with depth [33]. Barltrop points out that while tidal and storm surge currents weaken in deeper regions, their cumulative influence may remain significant in the total flow [34]. The flow can exert great pressure on the ship, and the total water flow at a depth of position d is the sum of the uniform flow rate and the profile flow rate, with the following equation:
U c ( d ) = ( U 0 cos θ 0 , U 0 sin θ 0 , 0 ) + ( U d cos θ d , U d sin θ d , 0 )
where the uniform flow velocity is defined by a positive scalar value  U 0 and its orientation angle  θ 0 in a fixed reference coordinate system, and the profile flow velocity is defined by the peak flow velocity  U d at depth  d and the orientation angle  θ d .

3.1.4. Parameter Setting

In particular, the system will face the most severe conditions when the environmental loads are in the same direction, when the amplitude of the ship motion response is the largest, and when the mooring cable tension reaches an extreme value [27]. Based on the conservative design principle, this study sets all the test conditions to be in the same direction of environmental loads to ensure that the developed constant tension mooring system has the robustness to cope with the actual complex sea conditions (including multidirectional environmental loads). To analyze the cable tension and ship stability under various sea conditions during mooring, this experiment will examine different wave and wind scenarios. The sea state parameters are set as shown in Table 2.

3.2. Analysis of Bollard Force

This study strictly follows the OCIMF-MEG4 (Mooring Equipment Guidelines) specifications for the arrangement and design of mooring cables and constant tension equipment, adopting mirror-symmetrical configurations and ensuring that the initial length, axial stiffness (EA), and pre-tension of the cables at symmetrical positions are relatively the same in order to eliminate the ship’s deflecting moments caused by the asymmetric loads.
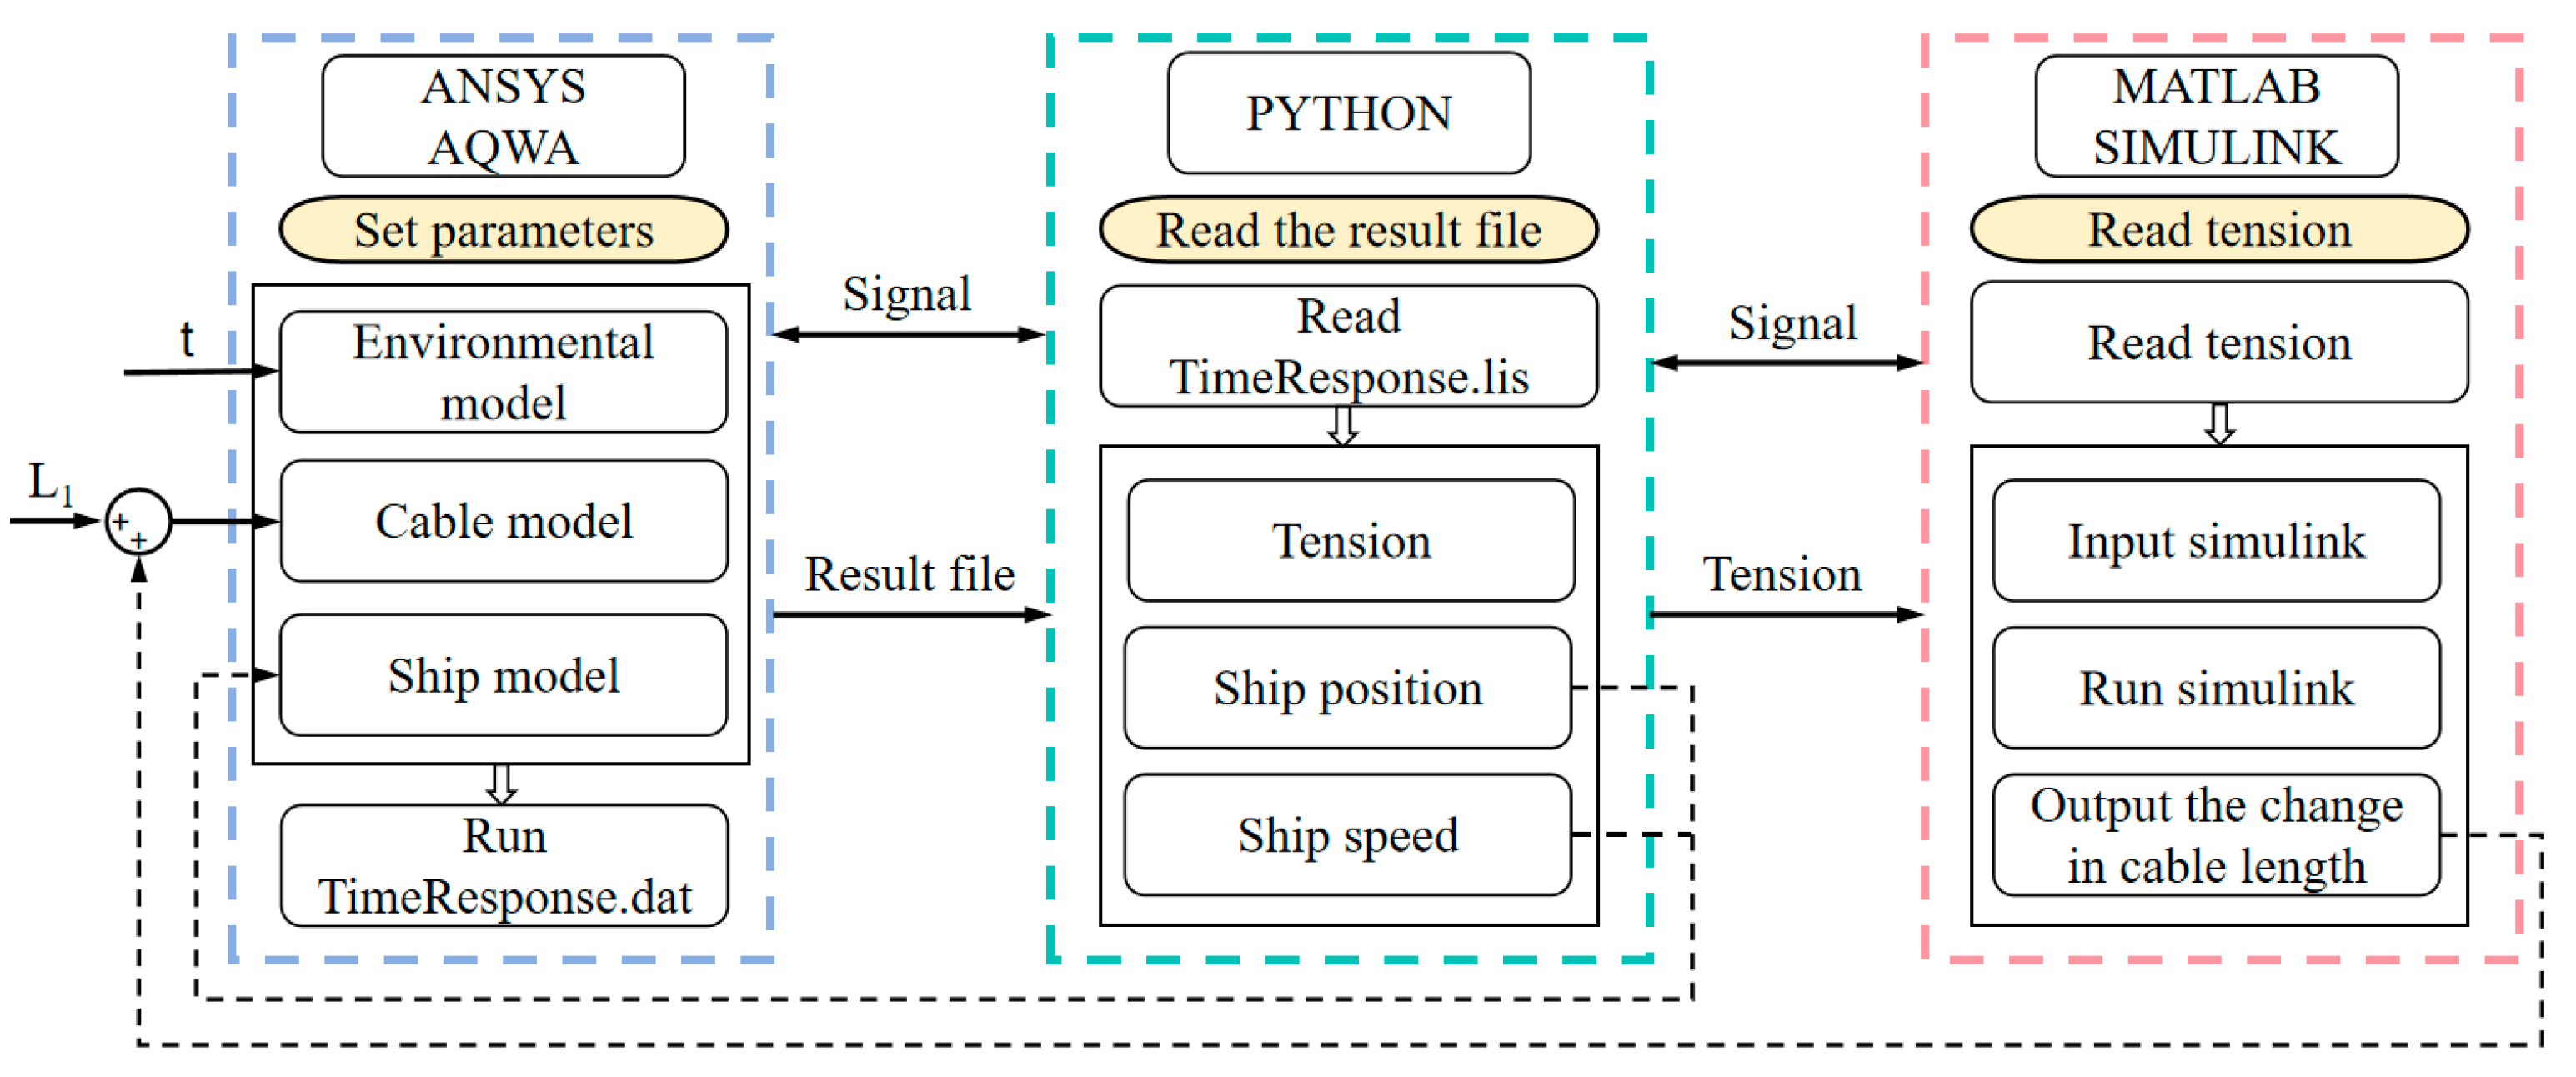
Through the parametric analysis method, the analysis flow is shown in Figure 6, and the effects of the mooring position layout and the number of system configurations on the ship’s mooring performance under different sea state conditions are systematically investigated [35]. Based on the symmetry characteristics of the boat, three typical environmental load directions of  0 ° (longitudinal axis),  45 ° (oblique), and  90 ° (positive transverse) are selected as the research objects, corresponding to different offshore working conditions. The standard six-cable mooring configuration (bow cable, stern cable, two transverse cables, and two inverted cables) is adopted to optimize the spatial layout of the constant tension system and the amount of equipment under the premise of ensuring the safety of the mooring to achieve the optimal balance between safety and engineering economy.
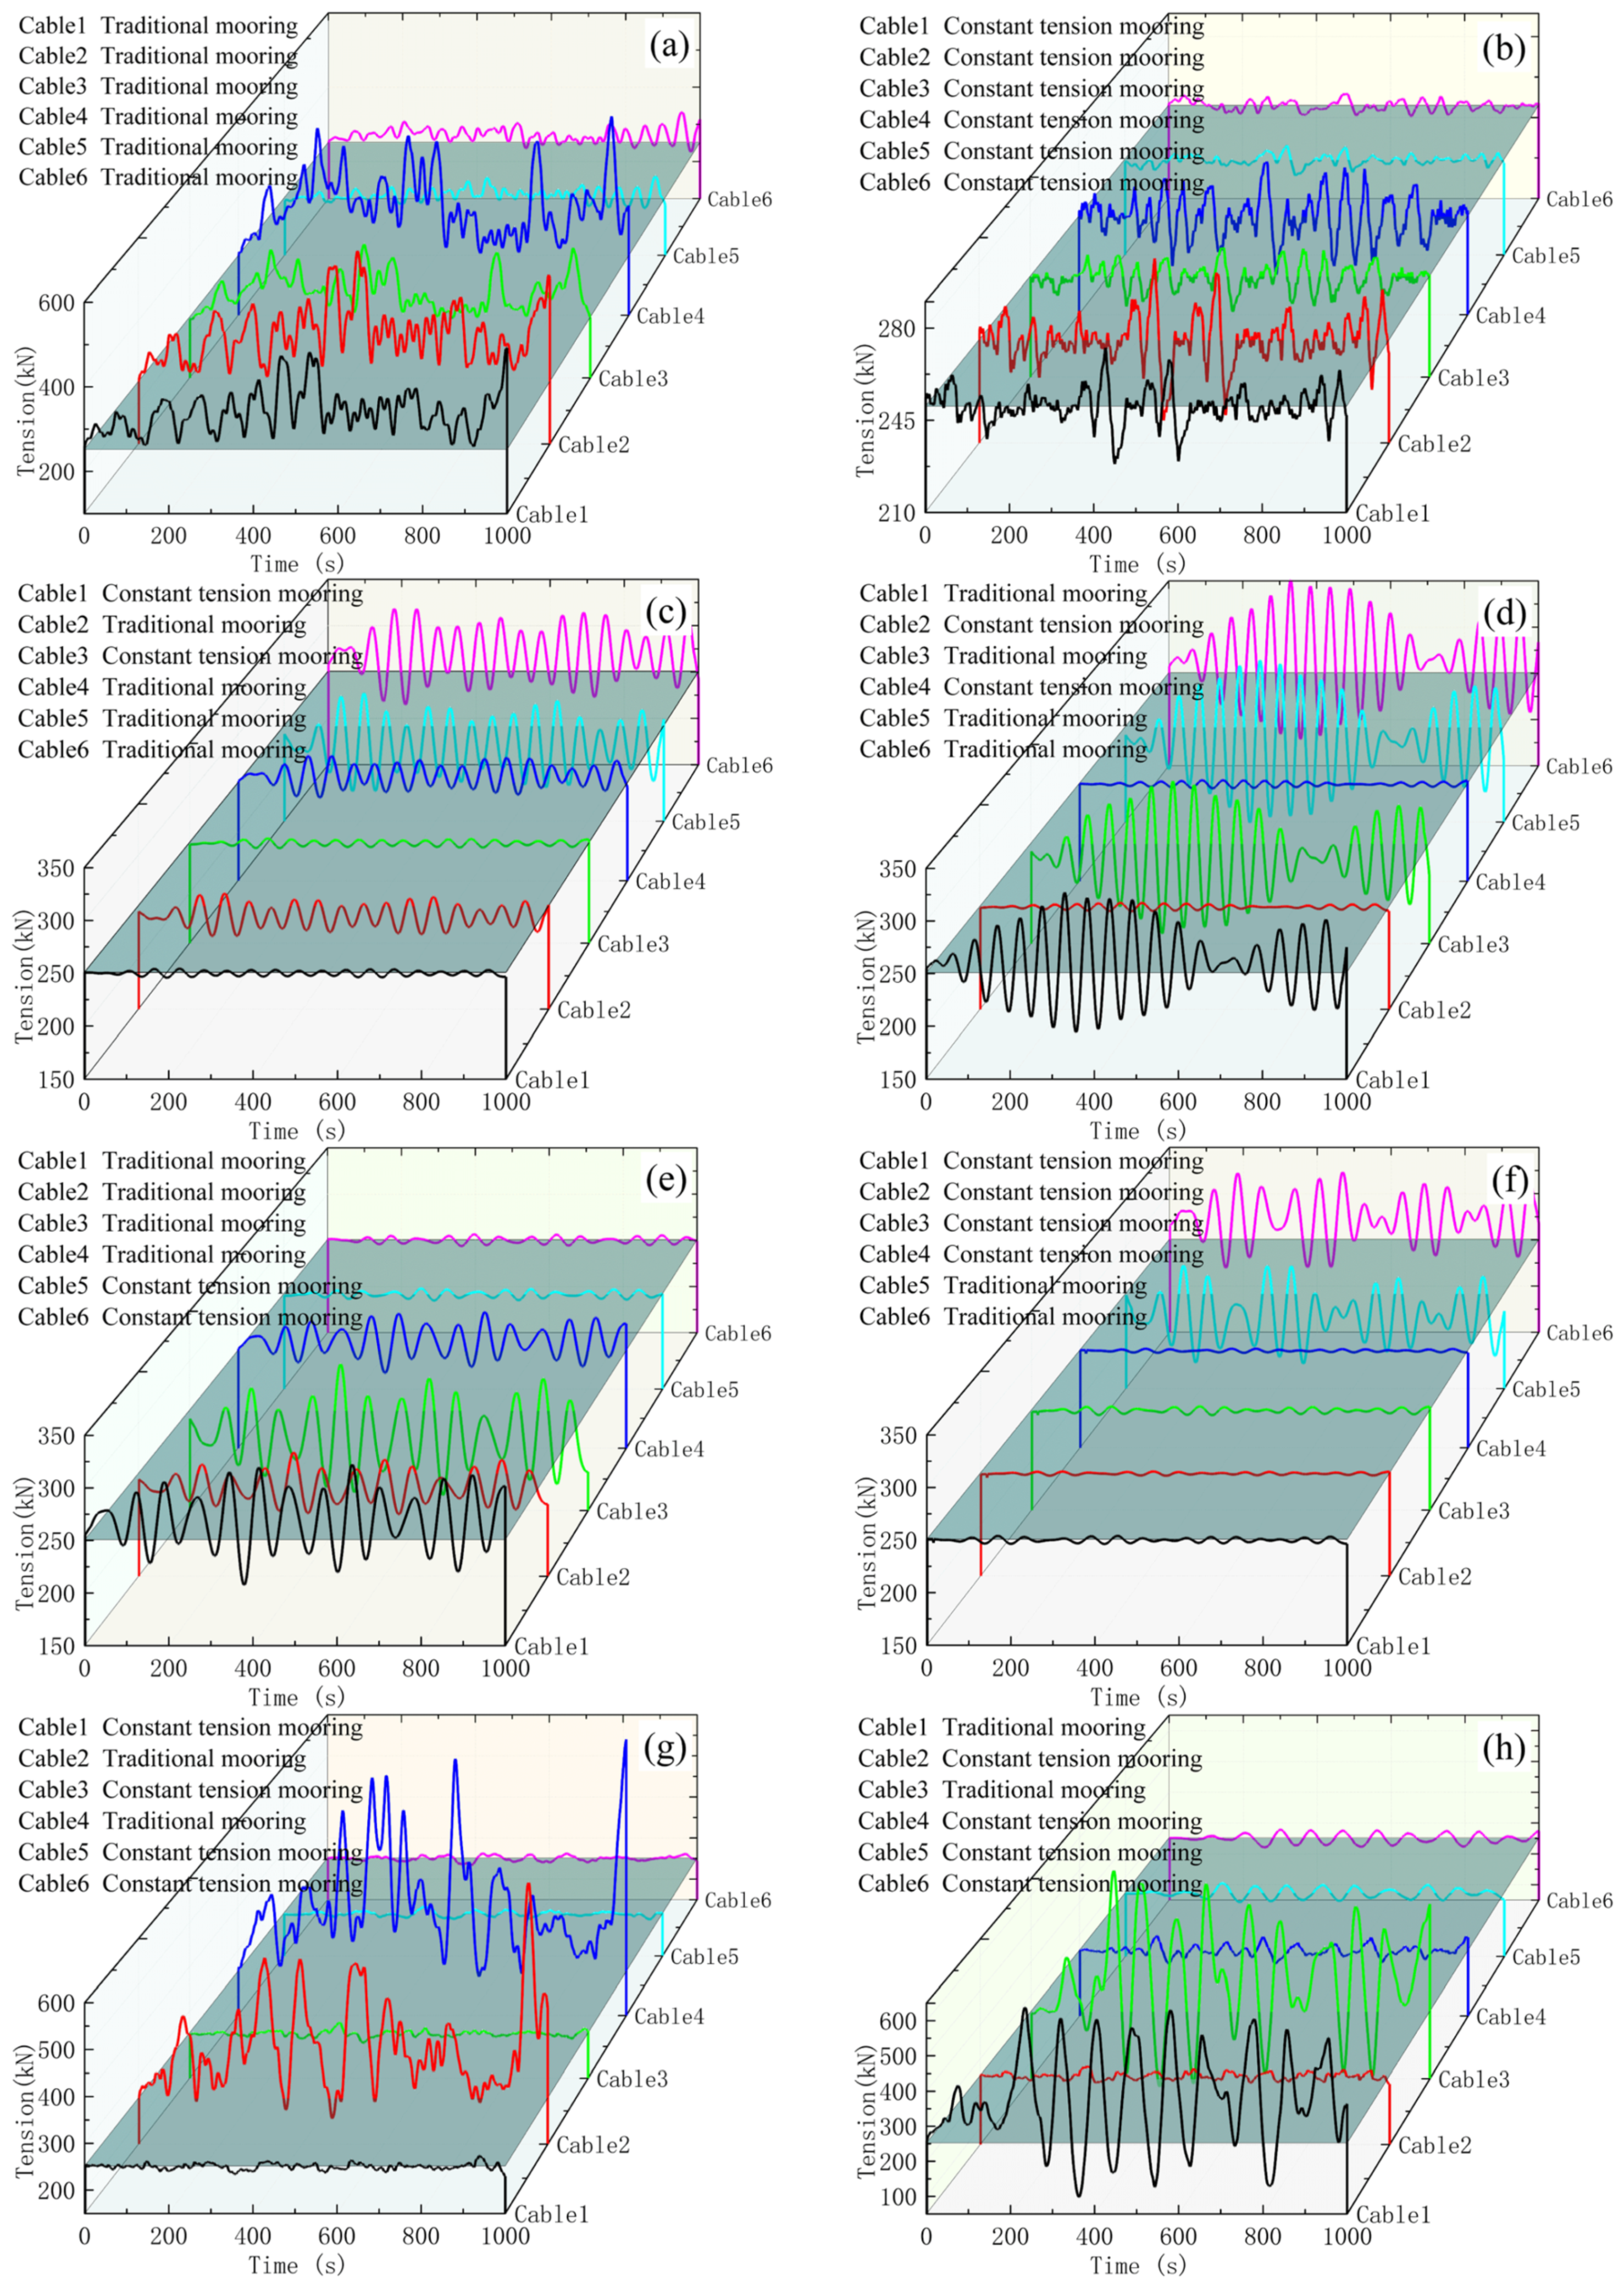
Firstly, the mooring conditions are analyzed under conventional sea state conditions with  90 ° ambient load (positive transverse offshore direction). To systematically evaluate the performance advantages of the shore-based constant tension mooring system, the study adopts a comparative analysis method: firstly, the baseline model of the conventional mooring system is established, and the quantitative analysis of the cable tension characteristics is shown in Figure 7; then, the impact of different system configurations (including the quantity optimization and spatial layout) on the mooring performance is examined. This comparative research framework can effectively reveal the technical advantages of the shore-based constant tension system in tension regulation under different configurations.
Through comparative analysis, it was found that the tension fluctuation of the six cables under the traditional mooring method was significant (the maximum value of the standard deviation of tension among the six cables was 76.5 kN). Although the program of adding a constant tension system to all six cables, as shown in Figure 7b, can significantly reduce the maximum tension on the cables and suppress the tension fluctuation (the maximum value of the standard deviation of tension among the six cables is 9.1 kN), there are two key defects: (1) the continuous stowage leads to the monotonous increase in the length of the cables, as shown in Figure 8, with the cumulative elongation of Cable 4 reaching 712.9 m/1000 s, and (2) the lack of fixed constraint points leads to a decrease in ship positioning accuracy that cannot meet the requirements of mooring. In contrast, the hybrid configuration scheme (with a constant tension system for some cables) can achieve both tension stabilization and position control through the geometric constraints provided by the fixed cables. Based on this, subsequent studies will focus on the optimal design of the hybrid configuration scheme.
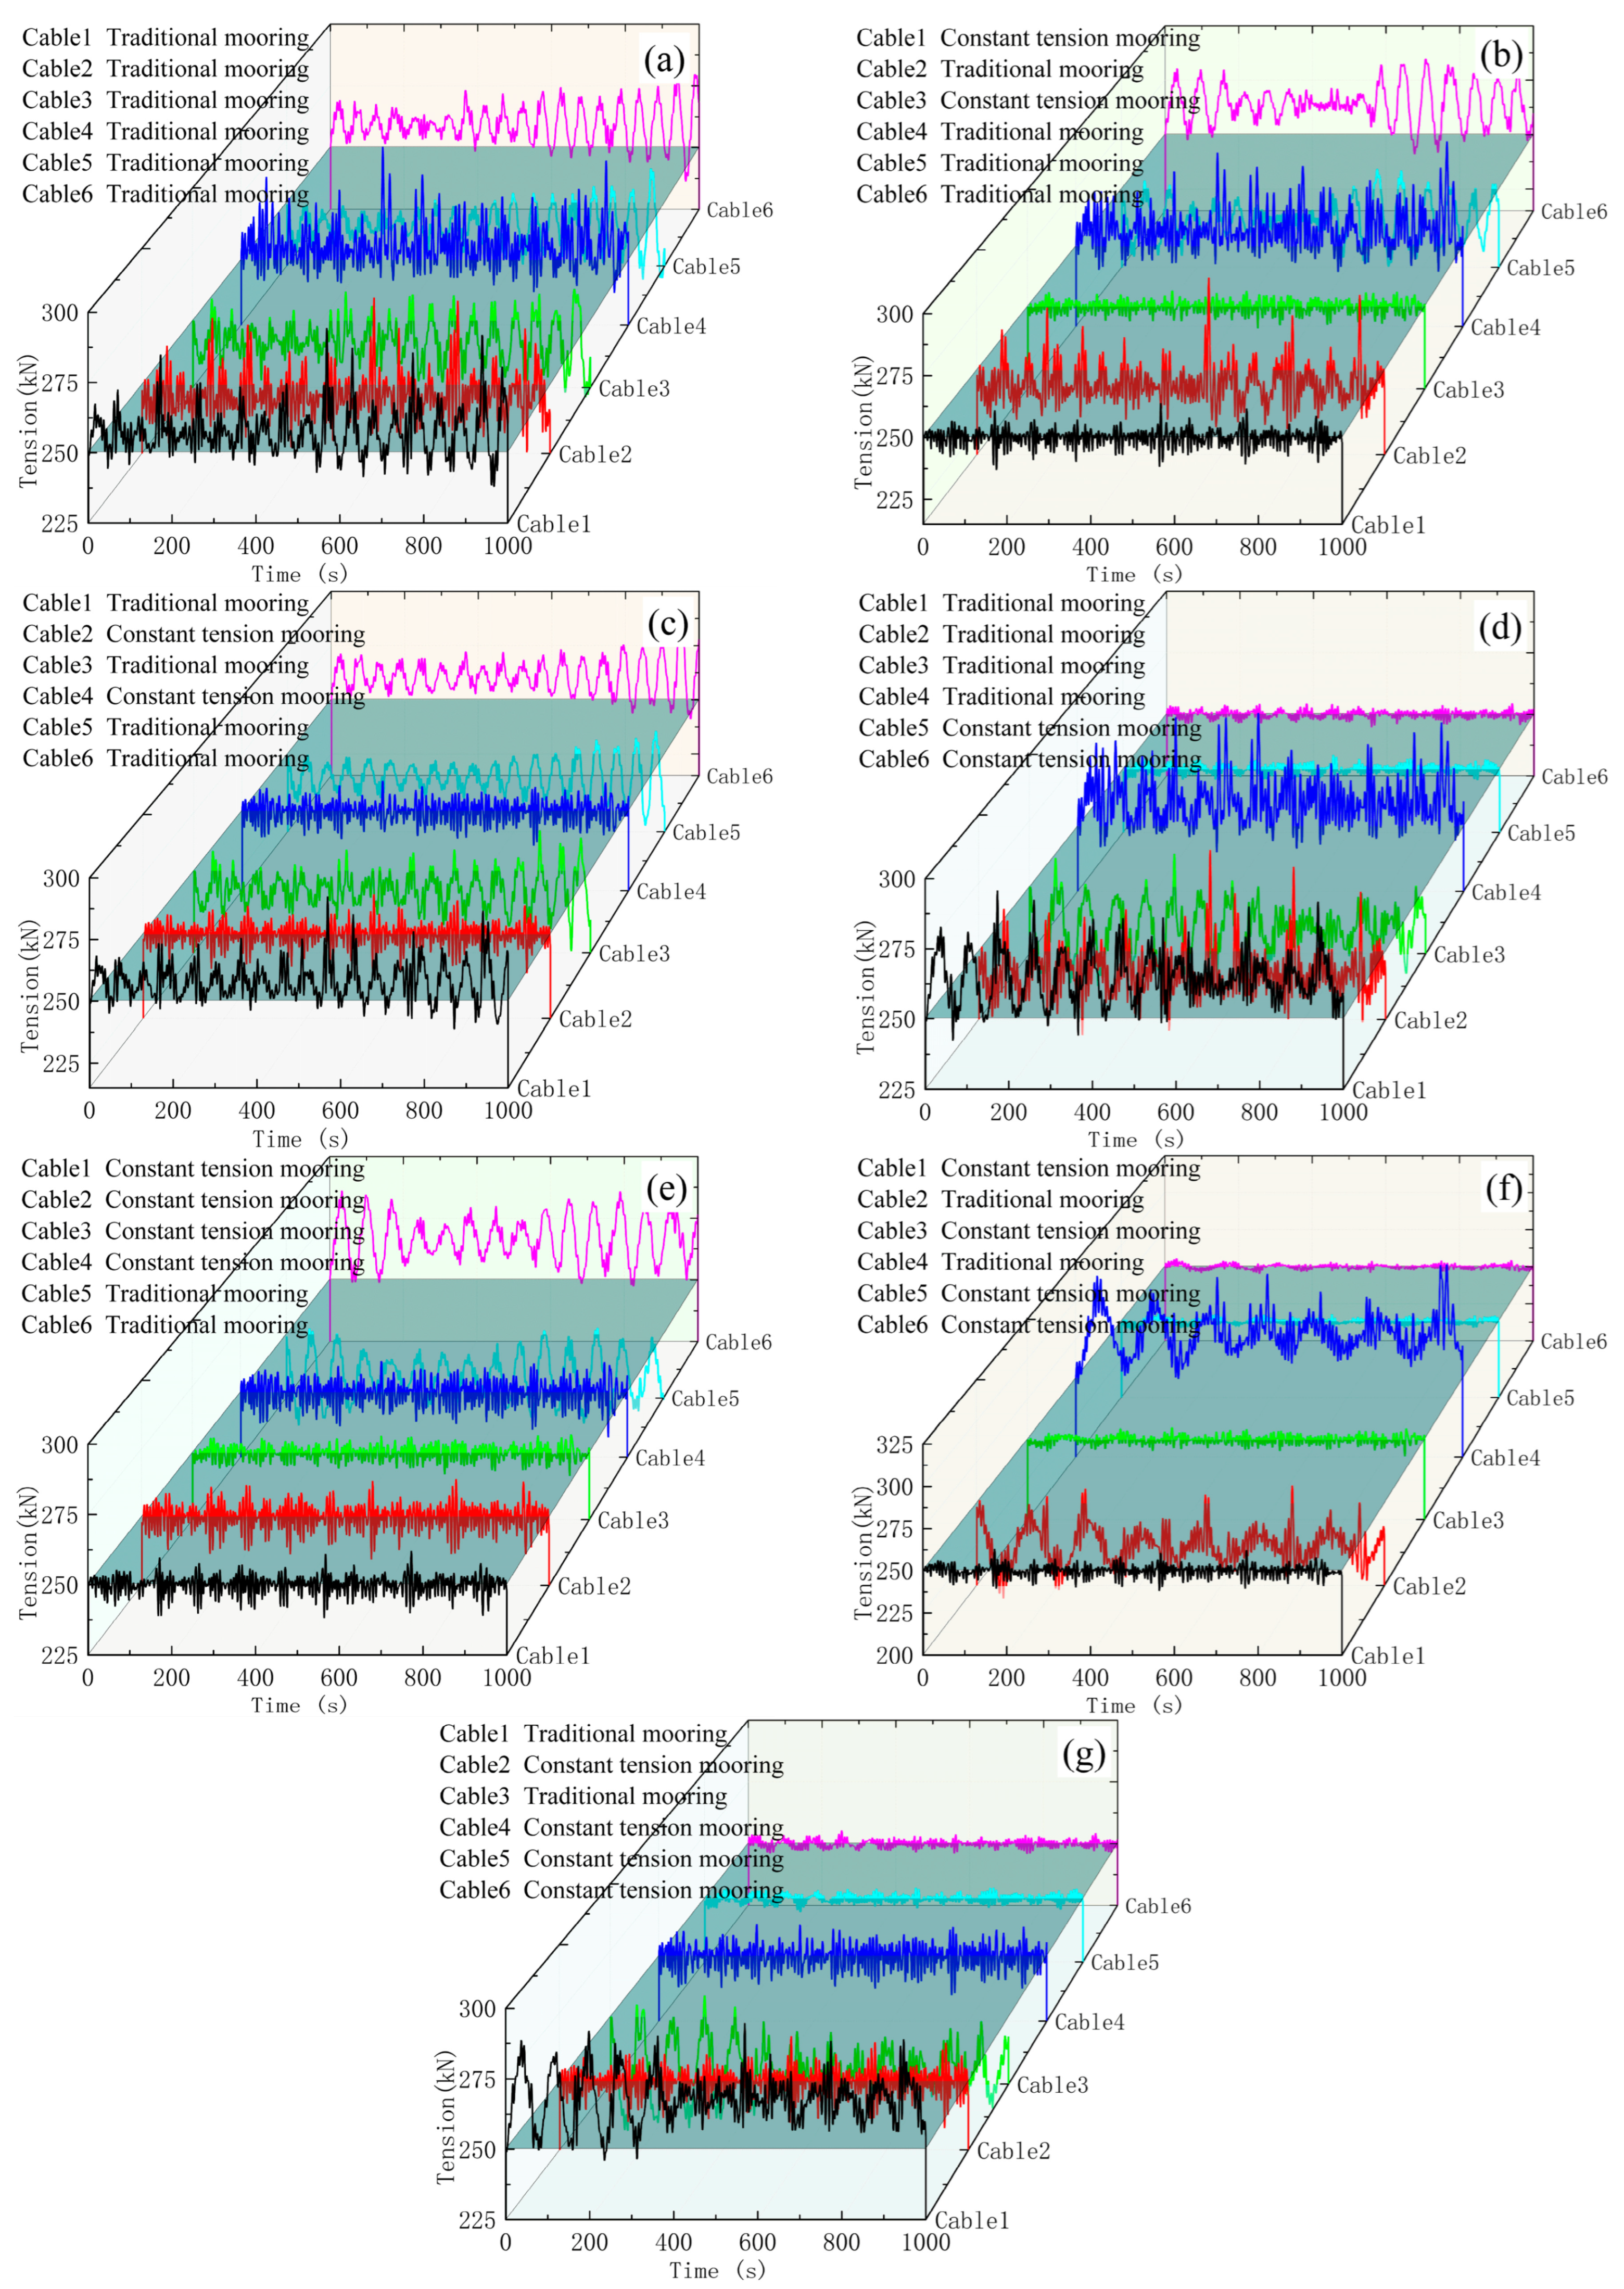
Subsequently, for the mooring conditions of  0 ° and  45 ° environmental load (longitudinal direction) under conventional sea state conditions, the same comparative analysis method is adopted. Firstly, the baseline model of the conventional mooring system is established to analyze the cable tension characteristics quantitatively, and the effects of different mooring schemes on the tension on the cable under the  45 ° ambient load are shown in Figure 9. Then, the focus is placed on the impacts of the different system configurations (including the number of optimizations and spatial layout) on the mooring performance.
The analysis results show that, as shown in Figure 9, the tension amplitude of each mooring cable at a  45 ° ambient load condition is significantly lower than that measured at a  90 ° condition (positive transverse offshore direction). Based on this finding, and considering the efficiency and typicality of the study, subsequent experiments will focus on the most challenging  90 ° ambient load condition to systematically investigate the tension distribution characteristics of each mooring line under this extreme condition. This simplified strategy ensures the engineering representativeness of the research findings and reveals the performance of the mooring system under the most unfavorable conditions. Therefore, only the tension on each cable under a  90 ° ambient load will be analyzed in the subsequent analysis.
A comparative study of the six mooring scenarios reveals that the system faces the most severe loading conditions when wind, waves, and currents all act in the positive transverse offshore direction (90°). Specifically, compared with the 0° and 45° conditions, the maximum cable tension in this direction increases by 61.7% and 58.9%, respectively; the fluctuation of cable tension rises by 78.9% and 81.6%, respectively. The 90° load condition can be considered a critical state that encompasses all combinations of directions, as shown in Table 3. The analysis of the experimental data shows that the cable tension of the conventional mooring system presents significant dynamic characteristics, as shown in Table 4: the maximum tension reaches 609 kN, the average tension peaks at 383 kN, and the maximum value of the standard deviation of the tension reaches 77 kN.
The analysis of the experimental data shows that the cable tension of the traditional mooring system presents significant dynamic characteristics, as shown in Table 4: the maximum tension reaches 609 kN, the average tension peaks at 383 kN, and the maximum standard deviation of the tension reaches 77 kN. The comparative study of the six mooring schemes reveals that the system faces the most severe loading conditions when the wind, waves, and currents all act along the positive transverse offshore direction ( 90 ° ). Compared with the  0 ° and  45 ° conditions, the maximum cable tension in this direction increases by 61.7% and 58.9%, and the fluctuation of cable tension increases by 78.9% and 81.6%, respectively. The  90 ° loading condition can be taken as the critical state to encompass all the combinations of the directions, as shown in Table 3.
Based on this, subsequent studies will focus on analyzing this most unfavorable working condition to improve the efficiency of the analysis while ensuring the comprehensiveness of the study.

4. Results and Discussion

4.1. Optimization Analysis of Cable Tension

From the above analysis, it can be seen that different constant tension mooring schemes will have a significant impact on the distribution of cable tension when wind, waves, and currents act in the direction away from the shore. By using four constant tension mooring systems, Plan 4 produces a maximum tension of 637 kN (4.6% increase compared to the conventional scheme) and an average tension of 376 kN (almost the same as the conventional scheme); Plan 5 (bow and transom + two transverse cables) shows an extreme tension of 789 kN (29.6% increase) and an average tension of 407 kN (6.3% increase); Plan 6 (bow and stern + two transom cables) performed optimally with a maximum tension of 324 kN (46.8% decrease) and an average tension of 273 kN (28.7% decrease). By using two constant tension mooring systems for mooring: Plan 1 (two inverted cables): maximum tension 322 kN, average tension 269 kN; Plan 2 (two transverse cables): maximum tension 351 kN, average tension 259 kN; and Plan 3 (bow and stern cables): maximum tension 318 kN, average tension 269 kN. The data analysis shows that Plan 2, Plan 3, and Plan 6 are comparable in terms of tension control performance (maximum tension difference <10%). Based on the cost–benefit analysis, the dual-system configuration (especially Plan 1 and Plan 3) meets the project requirements: it reduces the maximum tension by 47% and the average tension by 29% while maintaining the mooring safety and significantly reducing the equipment investment. Subsequent studies will focus on the analysis of the dual system configuration.
For the performance analysis of the mooring system under extreme sea state conditions, the results of the study, shown in Figure 10, clearly reveal the dynamic response characteristics of the different configuration schemes: under the traditional mooring scheme, the peak tension of the six cables reaches 3691 kN, the average tension is 1883 kN, and the intensity of tension fluctuation σ = 736 kN. Comparative analysis shows that the three types of constant tension mooring schemes can significantly improve the performance of mooring, with the reduction of peak tension generally exceeding 65%, and the reduction of mean tension reaching more than 74% in all of them. Among them, the peak tension reduction generally exceeds 65%, the average tension reduction reaches more than 74%, and the system safety is effectively improved. Specifically, the vessel adopts Plan 1 with a maximum tension of 928 kN (74.9% reduction) and an average tension of 440 kN (76.6% reduction); Plan 2 with a maximum tension of 1218 kN (67.0% reduction) and an average tension of 479 kN (74.6% reduction); and Plan 3 with a maximum tension of 933 kN (74.7% reduction) and average tension of 466 kN (75.3% reduction), as shown in Table 5. Data analysis shows that for this type of ship, the selection of Plan 1 or Plan 3 can significantly reduce the cable tension and tension fluctuations.

4.2. Optimization Analysis of Ship Stability

The previous section systematically investigated the influence of the spatial layout and the number of equipment configurations of the constant tension mooring system on the cable tension characteristics under different sea state conditions. This section will focus on analyzing the influence mechanism of the mooring system configuration on the stability of ship motion. The ship’s six-degree-of-freedom motion is its dynamic response to the environmental loads (wind, waves, and currents), and these motion responses, if exceeding the safety threshold, will not only force the interruption of cargo loading and unloading operations, resulting in significant economic losses, but also may lead to the ship being forced to leave the berth when the amplitude of the motion is too large (based on the captain’s judgment), which will seriously affect the safety of port operations [36,37,38,39].
In this section, the significant improvement effect of the constant tension mooring system on the ship motion stability is verified through a systematic comparative analysis. The study compares the ship’s six-degree-of-freedom motion response characteristics of conventional mooring schemes with different constant tension system configuration schemes under conventional sea state conditions, as shown in Figure 11. The analysis results show that (1) the ship motion trends under conventional and extreme sea conditions are consistent, but the amplitudes are significantly different. The conventional mooring scheme shows a more obvious motion response under a conventional sea state, in which the peak value of transverse rocking (ROLL) reaches 2.93°, transverse swinging (SWAY) 2.26 m, and bow rocking (YAW) 1.51°. (2) After adopting the constant tension mooring system, the amplitude of the motion in the five degrees of freedom of SWAY, HEAVE, ROLL, PITCH, and YAW tends to be close to zero, which indicates that the system can suppress the ship motions in these five directions effectively. (3) In particular, relative to Plan 1 and Plan 2, Plan 3 has the most prominent control effect in the longitudinal swing (SURGE) direction, and its motion suppression performance is better than the other configurations.
In addition, Figure 12 shows the comparative analysis results of different mooring schemes under extreme sea state conditions. It is shown that the motion suppression effect of the constant tension mooring system in extreme sea conditions is consistent with the control characteristics of conventional sea conditions: the motion response trend of each degree of freedom is highly similar to that of the conventional sea conditions, which further verifies the stable control performance of the system under different environmental conditions. By analyzing the motion response of the ship under conventional and extreme sea conditions, it can be seen that Plan 3 is the optimal solution.

4.3. Results and Prospects

The constant tension mooring system proposed in this study significantly reduces the risk of cable breakage, which is the main concern in mooring operations as emphasized by OCIMF [6], by dynamically adjusting the cable tension, thus realizing the overall performance enhancement of the port mooring system in terms of three dimensions: safety, economy, and operational efficiency. Of particular interest is that the developed hybrid configuration (Plan 3), by cleverly combining the geometrical constraints of the fixed cable with the constant tension adjustment mechanism, not only effectively overcomes the defects of over-extension of the cable existing in the traditional pure constant tension system, but also realizes the synergistic optimization of the tension stability and the positioning accuracy, which provides a streamlined and high-performance innovative solution for the mooring operations of large vessels. It should be noted that, although the numerical simulation based on a 40,000-ton ship has achieved satisfactory results, the optimization of parameters for ships of different tonnages and the adaptation of existing port infrastructure still need to be studied in depth. The follow-up work will focus on real ship mooring test validation and further improve the dynamic response performance and control accuracy of the system through the refined optimization of the hybrid configuration space layout and the development and application of adaptive control algorithms.

5. Conclusions

In this study, the performance of the shore-based constant tension mooring system is systematically analyzed by a numerical simulation method for the mooring safety of large ships in complex sea conditions, and the effects of the system configuration scheme on the cable tension characteristics and the ship motion stability under different sea conditions are analyzed. A comparative approach was used to assess the differences between the system and the conventional scheme. Moreover, the system adopts both active and passive control technologies to achieve efficient and safe mooring operations through a dual-mode switching mechanism: active control is used to enhance safety during dynamic operations (berthing, de-berthing, and extreme sea conditions), and the system is switched to the passive mode when the mooring is stabilized to achieve efficient energy utilization by using hydraulic accumulators to recover and utilize wave energy. Meanwhile, the multi-physical field collaborative analysis platform based on AQWA(2022 R1)-Python(3.9)-MATLAB/Simulink(R2023b) developed in this study successfully realizes the dynamic coupling analysis between the ship mooring coupled dynamics model and the constant tension control system model, which solves the limitations of the traditional analytical methods in terms of the model accuracy and system integrity. Thirdly, based on the above simulation platform, the performance of the mooring system and the effects of different configurations on the stability of ship motion and dynamic tension of the cable are emphasized. Focusing on the performance of the mooring system and the influence of different configurations on the ship motion stability and cable dynamic tension, the following conclusions are drawn. The multi-physics field collaborative analysis platform based on AQWA-Python-MATLAB/Simulink, developed in this study, realizes high-precision dynamic coupling simulation between the ship mooring coupled dynamics model and the constant tension control system model and solves the limitations of the traditional single-software analysis method in terms of the model accuracy and system integrity.
The constant tension mooring system proposed in this study can significantly enhance the stability of ships in normal sea conditions, effectively suppress ship swaying and displacement, and reduce the peak values of key motion indicators such as roll, sway, and bow heave by more than 90% compared to traditional mooring schemes, creating a more stable environment for ship berthing operations. In extreme sea conditions, this system can reduce the peak tension of each cable by more than 65%, significantly reducing the risk of cable breakage caused by excessive tension, significantly improving the safety of mooring operations, and ensuring the safety of ships and port facilities in harsh sea conditions. Through parametric analysis and multi-condition comparison studies, the optimal scheme of placing the constant tension equipment at the bow and stern cables was determined. This scheme can ensure mooring safety and energy conservation while effectively reducing cable tension and improving ship stability, and the equipment investment is relatively small, having better engineering feasibility and economic efficiency.

Author Contributions

Conceptualization, N.L. and P.Q.; methodology, H.C. and S.C.; software, P.Q. and N.L.; validation, N.L.; investigation, N.L. and P.Q.; writing—original draft preparation, N.L. and P.Q.; writing—review and editing, H.C., S.C. and S.W.; supervision, S.W. and H.C.; project administration, S.W.; funding acquisition, S.C. All authors have read and agreed to the published version of the manuscript.

Funding

National Key Research and Development Program of China (2022YFB3207400).

Data Availability Statement

The raw data supporting the conclusions of this article will be made available by the authors on request.

Conflicts of Interest

The authors declare no conflicts of interest.

Abbreviations

The following abbreviations are used in this manuscript:
Qmhydraulic motor output flow
Ciminternal leakage coefficient
Comexternal leakage coefficient
Pbsystem back pressure
Phpressure of the high-pressure pipeline
Pllow-pressure pipeline backpressure
P0Initial pressure
P1System pressure under working condition 1
P2System pressure under working condition 2
Dmhydraulic motor flow
θmhydraulic motor angle of rotation
Vshydraulic motor single-cavity volume
V0volume of the accumulator at the initial time
V1volume of the accumulator at the beginning of the mooring
V2volume of the skin bladder in the adjusted accumulator
Bmequivalent viscous damping coefficient
Ddiameter of the winch
Fctension on the cable
ngear ratio of the reducer
Tiinput torque of the hydraulic motor
QRHquick-release hook device
SWLsafe working load
WLLworking load limit

Appendix A

Table A1. The units and physical meanings of the key physical parameters in Formulas (1)–(12).
SymbolUnitsPhysical Meanings
Q m m3/sReal-time output flow of the hydraulic motor
C i m m3/sHydraulic motor internal leakage coefficient
C o m m3/sHydraulic motor leakage coefficient
P h MPaHigh-pressure pipeline working pressure
P l MPaBack pressure of the low-pressure pipeline
D m m3/radTheoretical flow rate of the hydraulic motor
θ m °The rotation angle of the hydraulic motor
V s m3Hydraulic motor single-chamber volume
β e N/m2Effective volume modulus of the hydraulic motor
J m kg·m2Total rotational inertia of the system
B m N·m·s/radEquivalent viscous damping coefficient
T o N·mOutput torque during system load
P 0 MPaThe pre-charging pressure of the accumulator
V 0 m3The initial volume of the body shell
P 1 MPaPressure in the accumulator during mooring
V 1 m3The volume of the bag when it is moored
P 2 MPaPressure after the accumulator is adjusted
V 2 m3The volume after the body suit adjustment
V l m3The volume of the oil in the accumulator
Q e m3/sThe flow rate of the input or output of the accumulator
F c NReal-time tension of the cable
T i N·mThe torque acting on the hydraulic motor

References

  1. Ahmed, Y.A.; Hasegawa, K. Automatic ship berthing using artificial neural network trained by consistent teaching data using nonlinear programming method. Eng. Appl. Artif. Intell. 2013, 26, 2287–2304. [Google Scholar] [CrossRef]
  2. Paulauskas, V.; Paulauskas, D. Research on work methods for tugs in ports. Transport 2011, 26, 310–314. [Google Scholar] [CrossRef]
  3. Khan, R.U.; Yin, J.; Mustafa, F.S.; Anning, N. Risk assessment for berthing of hazardous cargo vessels using Bayesian networks. Ocean Coast. Manag. 2021, 210, 105673. [Google Scholar] [CrossRef]
  4. Kuzu, A.C.; Akyuz, E.; Arslan, O. Application of fuzzy fault tree analysis (FFTA) to maritime industry: A risk analysing of ship mooring operation. Ocean Eng. 2019, 179, 128–134. [Google Scholar] [CrossRef]
  5. Sokukcu, M.; Sakar, C. Risk analysis of collision accidents during underway STS berthing maneuver through integrating fault tree analysis (FTA) into Bayesian network (BN). Appl. Ocean Res. 2022, 126, 103290. [Google Scholar] [CrossRef]
  6. OCIMF. Mooring Equipment Guidelines (MEG4), 4th ed.; Witherby Seamanship International Ltd.: London, UK, 2018; pp. 3–12. [Google Scholar]
  7. International Maritime Organization (IMO). Revised Guidance on Shipboard Towing and Mooring Equipment (MSC.1/Circ.1175/Rev.1); International Maritime Organization: London, UK, 2020. [Google Scholar]
  8. Jeong, J.S.; Lee, D.S.; Kim, Y.B.; Lee, K.S. Modeling and control allocation for ship berthing system design. In Proceedings of the ICCAS 2010, Gyeonggi-do, Republic of Korea, 27–30 October 2010; pp. 195–200. [Google Scholar]
  9. Liu, X.; Ren, W.; Zhang, Q.; Zhang, S.H. Research of Marine Simulator Cables’ Mathematical Models. Adv. Mater. Res. 2014, 889, 551–554. [Google Scholar]
  10. Wu, L.; Yang, J.; Xiang, Z.; Liu, M.; Li, M.; Di, Y.; Jiang, H.; Dai, C.; Ji, X. An intelligent monitoring system for the force characteristics of floating bollards in a ship lock. J. Mar. Sci. Eng. 2023, 11, 1948. [Google Scholar] [CrossRef]
  11. Chen, J.; Zhou, L.; Ding, S.; Li, F. Numerical simulation of moored ships in level ice considering dynamic behavior of mooring cable. Mar. Struct. 2025, 99, 103716. [Google Scholar] [CrossRef]
  12. Yan, K.; Zhang, S.; Oh, J.; Seo, D.-W. A review of progress and applications of automated vacuum mooring systems. J. Mar. Sci. Eng. 2022, 10, 1085. [Google Scholar] [CrossRef]
  13. Nazligul, Y.E.; Yazir, D. Comparison of automated mooring systems against existing mooring systems by using the IF-TOPSIS method. Ocean Eng. 2023, 285, 115269. [Google Scholar] [CrossRef]
  14. Wang, K.; Chu, Y.; Huang, S.; Liu, Y. Preliminary design and dynamic analysis of constant tension mooring system on a 15 MW semi-submersible wind turbine for extreme conditions in shallow water. Ocean Eng. 2023, 283, 115089. [Google Scholar] [CrossRef]
  15. Chen, Q.; Li, W.; Wang, X.; Yu, J.; Jafarzadeh, S.; Li, Y.; Li, S.; Zhang, W.; Chen, G. Development of a dynamic model for a constant tension winch. In Proceedings of the OCEANS 2015-MTS/IEEE Washington, Washington, DC, USA, 19–22 October 2015; pp. 1–4. [Google Scholar]
  16. Chen, Q.; Li, W.; Chen, G. FUZZY P+ ID controller for a constant tension winch in a cable laying system. IEEE Trans. Ind. Electron. 2016, 64, 2924–2932. [Google Scholar] [CrossRef]
  17. Zhu, P.; Zhang, Q.; Zhao, Z.; Yang, B. BP fuzzy neural network PID based constant tension control of traction winch. Meas. Control 2023, 56, 857–873. [Google Scholar] [CrossRef]
  18. Kery, S. Dynamic modeling of ship-to-ship and ship-to-pier mooring performance. Mar. Technol. Soc. J. 2018, 52, 87–93. [Google Scholar] [CrossRef]
  19. Van der Molen, W.; Scott, D.; Taylor, D.; Elliott, T. Improvement of mooring configurations in Geraldton Harbour. J. Mar. Sci. Eng. 2015, 4, 3. [Google Scholar] [CrossRef]
  20. Zhou, Y.; Zhang, X.; Chen, J.; Liu, R.; Sun, J.; Si, Y. Catenary mooring length control for motion mitigation of semi-submersible floating wind turbines. J. Mar. Sci. Eng. 2024, 12, 628. [Google Scholar] [CrossRef]
  21. Tahar, A.; Halkyard, J.; Steen, A.; Finn, L. Float over installation method—Comprehensive comparison between numerical and model test results. J. Offshore Mech. Arct. Eng. 2006, 128, 256. [Google Scholar] [CrossRef]
  22. Sun, L.; Taylor, R.E.; Choo, Y.S. Multi-body dynamic analysis of float-over installations. Ocean Eng. 2012, 51, 1–15. [Google Scholar] [CrossRef]
  23. Ma, Y.; Yuan, L.; Zan, Y.; Huang, F. Numerical simulation of float-over installation for offshore platform. J. Mar. Sci. Appl. 2018, 17, 79–86. [Google Scholar] [CrossRef]
  24. Kwak, H.; Jung, S.; Oh, S.; Kwon, Y.; Nam, B.; Kim, N.; Lee, K.; Sung, H. Assessment of docking operation during float-over installation on jacket structure. In Proceedings of the ISOPE International Ocean and Polar Engineering Conference, Honolulu, HI, USA, 10–15 June 2018; p. ISOPE-I-18-057. [Google Scholar]
  25. Liu, N.; Qu, P.; Chen, S.; Shen, W.; Zhang, L.; Zhang, Z.; Li, N. Design and Analysis of Rotary Constant Tension Mooring Device. In Proceedings of the 2024 IEEE International Conference on Mechatronics and Automation (ICMA), Tianjin, China, 4–7 August 2024; pp. 178–182. [Google Scholar]
  26. Wang, L.; Liu, N.; Wang, S.; Chen, S. Study on cable tension characteristics of shore-based constant tension mooring systems under the coupling effect of wind, wave, and current. J. Offshore Mech. Arct. Eng. 2024, 146, 051704. [Google Scholar] [CrossRef]
  27. Rosa-Santos, P.; Taveira-Pinto, F.; Veloso-Gomes, F. Experimental evaluation of the tension mooring effect on the response of moored ships. Coast. Eng. 2014, 85, 60–71. [Google Scholar] [CrossRef]
  28. Figuero, A.; Sande, J.; Peña, E.; Alvarellos, A.; Rabuñal, J.R.; Maciñeira, E. Operational thresholds of moored ships at the oil terminal of inner port of A Coruña (Spain). Ocean Eng. 2019, 172, 599–613. [Google Scholar] [CrossRef]
  29. Zhang, H.; Wei, W.; Wang, H.; Zhang, Y.; Liu, X. Digital Hydraulic Motor Characteristic Analysis for Heavy-Duty Vehicle Traction. Actuators 2025, 14, 11. [Google Scholar] [CrossRef]
  30. Low, Y.M.; Langley, R.S. Time and frequency domain coupled analysis of deepwater floating production systems. Appl. Ocean Res. 2006, 28, 371–385. [Google Scholar] [CrossRef]
  31. Kurian, V.J.; Ng, C.Y.; Liew, M.S. Effect of Short-Crested Waves on the Dynamic Responses of Truss SPAR Platforms. In Proceedings of the Twenty-third International Offshore and Polar Engineering Conference, Anchorage, AK, USA, 30 June–5 July 2013. [Google Scholar]
  32. Barltrop, N.D.P. Floating Structures: A Guide for Design and Analysis, 1st ed.; Oilfield Publications Limited (OPL): Ledbury, UK, 1998. [Google Scholar]
  33. Randall, R.E. Elements of Ocean Engineering, 2nd ed.; Society of Naval Architects: Jersey City, NJ, USA, 2010; pp. 20–24. [Google Scholar]
  34. Ziylan, K.; Nas, S. A quasi-static mooring analysis approach for berthed ships. Ocean. Eng. 2024, 309, 118488. [Google Scholar] [CrossRef]
  35. Costas, R.; Figuero, A.; Sande, J.; Pena, E.; Guerra, A. The influence of infragravity waves, wind, and basin resonance on vessel movements and related downtime at the Outer Port of Punta Langosteira, Spain. Appl. Ocean Res. 2022, 129, 103370. [Google Scholar] [CrossRef]
  36. López, M.; Iglesias, G. Long wave effects on a vessel at berth. Appl. Ocean Res. 2014, 47, 63–72. [Google Scholar] [CrossRef]
  37. van Deyzen, A.F.; Beimers, P.; Van der Lem, J.; Messiter, D.; de Bont, J.A. To improve the efficiency of ports exposed to swell. In Proceedings of the Australasian Coasts & Ports Conference, Auckland, New Zealand, 15–18 September 2015; pp. 919–926. [Google Scholar]
  38. Gao, F.; Tang, Y.; Hu, C.; Xie, X. Research on a Ship Mooring Motion Suppression Method Based on an Intelligent Active Anti-Roll Platform. Appl. Sci. 2023, 13, 7979. [Google Scholar] [CrossRef]
  39. Shi, X.-Y.; Zhang, N.-C.; Chen, C.-P.; Jiang, H.-Z.; Cui, L. Experimental Study of characteristics of motions of a large mooring ship in long-period waves. J. Mar. Sci. Technol. 2014, 22, 15. [Google Scholar]
Figure 1. Normal mooring method.
Jmse 13 01385 g001
Figure 2. Abnormal mooring method.
Jmse 13 01385 g002
Figure 3. Three-dimensional diagram of mooring system.
Jmse 13 01385 g003
Figure 4. Operation flowchart of constant tension mooring system.
Jmse 13 01385 g004
Figure 5. Flowchart of passive constant tension mooring system.
Jmse 13 01385 g005
Figure 6. Multi-physics field collaborative analysis process.
Jmse 13 01385 g006
Figure 7. Tension curves on six mooring lines under various mooring schemes with low sea conditions and 90 ° environmental loads. (a). All six mooring lines were not subjected to constant tension mooring. (b). All six mooring lines are tensioned at a constant level. (c). Cable 1 and 3 are moored using constant tension system. (d). Cable 2 and 4 are moored using constant tension system. (e). Cable 5 and 6 are moored using constant tension system. (f). Cable 1, 2, 3 and 4 are moored with constant tension. (g). Cable 1, 3, 5 and 6 are moored with constant tension. (h). Cable 2, 4, 5 and 6 are moored with constant tension.
Jmse 13 01385 g007
Figure 8. The changes in length of the six cables over time.
Jmse 13 01385 g008
Figure 9. Tension curves on six mooring lines under various mooring schemes with low sea conditions and 45 ° environmental loads. (a). All six mooring lines were not subjected to constant tension mooring. (b). Cable 1 and 3 are moored using constant tension system. (c). Cable 2 and 4 are moored using constant tension system. (d). Cable 5 and 6 are moored using constant tension system. (e). Cable 1, 2, 3 and 4 are moored with constant tension. (f). Cable 1, 3, 5 and 6 are moored with constant tension. (g). Cable 2, 4, 5 and 6 are moored with constant tension.
Jmse 13 01385 g009
Figure 10. Tension curves on six cables under various mooring schemes with high sea conditions and 90 ° environmental loads. (a). All six mooring lines were not subjected to constant tension mooring. (b). Cable 1 and 3 are moored using constant tension system. (c). Cable 2 and 4 are moored using constant tension system. (d). Cable 5 and 6 are moored using constant tension system.
Jmse 13 01385 g010
Figure 11. Comparison of the six-degree-of-freedom motion response of a ship between various mooring system configurations and a conventional scheme under conventional sea state conditions. (a). Comparison between Plan8 and Plan1. (b). Comparison between Plan8 and Plan2. (c). Comparison between Plan8 and Plan3. (Plan 8: traditional mooring scheme; Plan 1: two reverse cable mooring schemes; Plan 2: two horizontal cable mooring schemes; Plan 3: bow cable and stern cable mooring scheme).
Jmse 13 01385 g011
Figure 12. Comparison of the six-degree-of-freedom motion response of ships under extreme sea state conditions between various mooring system configurations and conventional schemes. (a). Comparison between Plan7 and Plan1. (b). Comparison between Plan7 and Plan2. (c). Comparison between Plan7 and Plan3. (Plan 7: traditional mooring scheme; Plan 1: two reverse cable mooring schemes; Plan 2: two horizontal cable mooring schemes; Plan 3: bow cable and stern cable mooring scheme).
Jmse 13 01385 g012
Table 1. Key parameters of the hull model.
Parameters MeaningsReference Number
Length (m)192
Wide (m)30.8
Depth (m)11
Coordinate (X, Y, Z)(−1.326, 0, 10)
Tonnage (Kg)45,000,000
Rxx, Ryy, Rzz8.84, 48, 48
Lateral windward area (m2)2700
Longitudinal windward area (m2)650
Table 2. Settings for normal sea conditions and extreme sea conditions parameters.
ParametersNormal Sea ConditionsExtreme Sea Conditions
Wind spectrumNPDNPD
Wind speed (m/s)4.411
Wind reference height (m)1010
Wave spectrumJONSWAPJONSWAP
Surface velocity (m/s)0.82.1
Bottom velocity (m/s)0.30.3
Significant wave height (m)0.84.5
Gamma1.551.6
Peak wave period (s)6.679
Start Period (s)0.947951.90917
Finish Period (s)7.7393115.47511
Table 3. The maximum tension values of each mooring rope under normal sea conditions and different environmental loads when using different constant tension mooring schemes.
PlanPlan 1Plan 2
NameFMAX (kN)FAVG (kN)FSD (kN)FMAX (kN)FAVG (kN)FSD (kN)
Angle045900459004590045900459004590
Cable127829632226326526989252732923272572582596729
Cable22512872712402432374813253267254250250249152
Cable325126229723323522699292592683132402422377734
Cable426729329025726026049142522632542502502500.752
Cable52532562562502502491232602603212402402368738
Cable62532552562502502501232832813512602602368738
PlanPlan3Plan 4
NameFMAX (kN)FAVG (kN)FSD (kN)FMAX (kN)FAVG (kN)FSD (kN)
Angle045900459004590045900459004590
Cable12512642542502502490.5322842956372672683768813
Cable225128826324224524038102522662802502502500.9510
Cable32522572542502502500.7322502586752292303429915
Cable426229627825525825739102522622972502502510.7516
Cable525225928023623623079272532542822502502501214
Cable627828531826426426969252532552792502502501214
PlanPlan 5Plan 6
NameFMAX (kN)FAVG (kN)FSD (kN)FMAX (kN)FAVG (kN)FSD (kN)
Angle045900459004590045900459004590
Cable12532632742502502500.8462522622542502502500.732
Cable2249262723222224364810102532642522502502500.951
Cable32522572752502502500.9362522572542502502500.832
Cable4302323789277279407913112522622522502502500.751
Cable52532552672502502501262532532802332332269923
Cable62542562632502502501262872863242672672739924
Notes: Plan 1 is the use of a constant tension mooring system for two inverted cables; Plan 2 is the use of a constant tension mooring system for two transverse cables; Plan 3 is the use of a constant tension mooring system for the bow and stern cables; Plan 4 is the use of a constant tension mooring system for two transverse cables and two inverted cables; Plan 5 is the use of a constant tension mooring system for the bow cable, transom cable, and two transverse cables; Plan 6 is the use of a constant tension mooring system for the bow cable, stern cable, and two transom cables. FMAX is the maximum tension of the cable; FAVG is the mean value of the cable tension; FSD is the standard deviation of the cable tension.
Table 4. The maximum tension values of each mooring rope under normal sea conditions and different environmental loads when using the traditional mooring scheme.
AngleNameCable1Cable2Cable3Cable4Cable5Cable6
FMAX (kN)294282262294263283
FAVG (kN)258247243256241260
FSD (kN)887877
45°FMAX (kN)296284265292263282
FAVG (kN)258247243256241260
FSD (kN)888877
90°FMAX (kN)492569433609308333
FAVG (kN)340369315383258271
FSD (kN)496443771518
Table 5. The influence of different mooring schemes on the maximum tension and average tension of the cable under extreme sea conditions.
PlanFMAX (kN)Red (%)FAVG (kN)Red (%)
Plan 192874.944076.6
Plan 2121867.047974.6
Plan 393374.746675.3
Notes: Where Plan 1 is the use of constant tension mooring system for two inverted cables; Plan 2 is the use of constant tension mooring system for two transverse cables; Plan 3 is the use of constant tension mooring system for bow and stern cables; FMAX is the maximum tension in the cables; Red is the percentage reduction of this scheme compared to the conventional mooring scheme.
Disclaimer/Publisher’s Note: The statements, opinions and data contained in all publications are solely those of the individual author(s) and contributor(s) and not of MDPI and/or the editor(s). MDPI and/or the editor(s) disclaim responsibility for any injury to people or property resulting from any ideas, methods, instructions or products referred to in the content.