Abstract
Plastic pollution in marine environments is a globally recognized concern that poses ecological and economic threats. While 80% of plastic originates from land, 20% comes from sea-based sources like shipping and fishing. Comprehensive assessments of fishing-related plastics are limited but crucial for mitigation. This study analyzed the distribution and temporal evolution of three fishing-related items (EPS fish boxes, fragments, and buoys) along the Bocassette spit in the northern Adriatic Sea, a region with high fishing and aquaculture activity. UAV monitoring (November 2019, June/October 2020) and structured interviews with Po Delta fishermen were conducted. The collected debris was mainly EPS, with boxes (54.8%) and fragments (39.6%). Fishermen showed strong awareness of degradation, identifying plastic as the primary litter type and reporting gear loss. Litter concentrated in active dunes and the southern sector indicates human and riverine influence. Persistent items (61%) at higher elevations suggest longer residence times. Mapped EPS boxes could generate billions of micro-particles (e.g., ~1013). The results reveal a complex interaction between natural processes and human activities in litter distribution. This highlights the need for integrated management strategies, like improved waste management, targeted cleanup, and community involvement, to reduce long-term impacts on vulnerable coastal ecosystems.
1. Introduction
Plastic pollution in coastal marine environments is now a prominent global environmental issue, as reported by various authors [,,,,,,]. Currently, plastic debris is found in nearly all marine environments worldwide [,]. Transported by marine currents, winds, river outflows, and drift [], plastic debris can traverse extensive distances, reaching both coastal areas and remote, pristine locations such as oceanic islands, polar regions, and deep-sea habitats [,,].
Land-based sources contribute approximately 80% of marine plastic pollution, arising from tourism, coastal recreation, inadequate waste management, industrial activities, and maritime operations []. The remaining 20% is attributed to sea-based sources, which include shipping, fishing vessels, military operations, and offshore installations [,]. Technological advancements, including satellite imagery, unmanned aerial vehicles (UAVs), and automated sampling, have enhanced marine litter monitoring, providing essential data to support mitigation efforts [,,].
Macroplastics (>25 mm) are highly visible and often categorized by use, including packaging and fishing equipment [,]. Items linked to fishing and aquaculture, including polystyrene fish boxes and nets, may represent a significant portion of coastal debris [,,]. Nonetheless, thorough research assessing their impact and geographical distribution is still scarce, particularly in areas with high fishing activity, such as the northern Adriatic Sea [,].
Understanding the perspectives and perceptions of key stakeholders, such as fishermen, is crucial for effective mitigation. Although public perception studies are common [,], research on fishermen’s knowledge and concerns remains limited, despite their direct reliance on marine resources []. As mentioned by the authors of [], research on marine litter has frequently focused on the opinions of the public or recreational users, resulting in a limited representation of professional stakeholders such as fishers.
Fisheries and aquaculture are significant contributors to marine litter; in 2016, single-use plastics constituted 50% of marine debris on European beaches, while fishery-related materials comprised between 3% and 15% of this litter []. In the northern Adriatic Sea, debris from fisheries and aquaculture represents 10–15% of marine waste []. However, thorough assessments are still limited, especially concerning the impact of aquaculture []. Past research has revealed considerable amounts of fishing-related waste, such as polystyrene fish boxes, nets, and cords, along the Mediterranean coastline [,,,].
The Po Delta region in the northern Adriatic Sea is recognized as a hotspot for the impact of fisheries and aquaculture on marine litter []. The main aim of this paper is to enhance our understanding of marine litter dynamics related to fishing in the Bocassette area, thereby supporting effective environmental management. By focusing on specific fishing-related items, such as expanded polystyrene fish boxes, fragments, and large buoys, this study fills existing gaps, particularly in the Bocassette spit, where fishing and aquaculture activities are intense. This study addresses litter distribution, sedimentary processes, residence times, and potential impacts through UAV imaging and stakeholder interviews. The results seek to enhance monitoring efforts and develop targeted strategies for mitigating marine litter in vulnerable coastal ecosystems.
2. Materials and Methods
2.1. Study Area
The pilot site, situated along the spit of Boccassette in the northern Adriatic Sea within the Po Delta area, extends over a linear distance of approximately 4500 m and separates the Barbamarco lagoon from the Adriatic Sea (Figure 1). The Barbamarco lagoon has been developing in the northern portion of the Po Delta since 1850. It is a small (7 km2) coastal lagoon, with an average depth of 0.95 m []. The hydrodynamic dynamics of the lagoon involve intricate interactions, including water exchange with the nearby northern Adriatic Sea through the Bocca Sud and Bocca Nord lagoon mouths, as well as freshwater inflows originating from the Po River via the mouths and inflow channels from Pila di Tramontana and Pila di Maistra [,]. Its geomorphological structure results from significant human-induced activities and interactions, and, today, it can be considered a human-driven ecosystem [,]. Over the last decade, the lagoon system has been subjected to several interventions that have substantially shaped its current coastal geomorphology. In particular, interventions were directed at reinforcing and consolidating the barrier island, stabilizing the two lagoon inlets, creating an internal channel network, and constructing a series of artificial intertidal islands [].
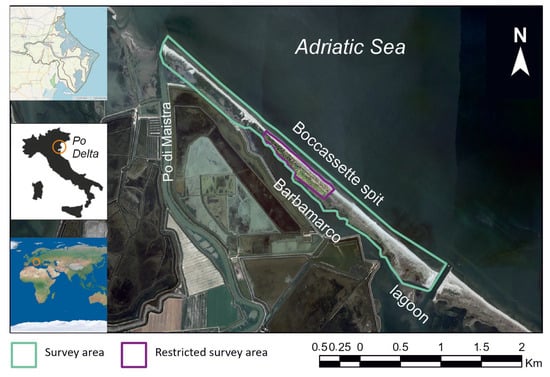
Figure 1.
Study area: The lagoon of Barbamarco and the spit of Boccassette. The green polygon represents the extension of the survey area (November 2019), while the purple line delimits the sub-area, where three surveys are conducted (November 2019, June, and October 2020).
The spit is characterized by gently sloping sandy beaches and by a system of active and fixed dunes parallel to the shoreline. This coastal landscape is further enriched by various vegetative species that contribute significantly to the development and maintenance of coastal dunes and dune slacks. The width of the coastal spit varies significantly, ranging from a minimum of 60 m in the northward direction to a maximum of approximately 300 m in the southward direction, as shown in Figure 1.
Regarding the meteorological conditions of the delta, various studies [,,] demonstrated that the dominant winds are first from the N-NE and E directions, secondly from the E-SE direction, and then from the NW direction. Events with greater intensity, typically below 12 m/s, originate from the eastern sectors, specifically Bora (NE), Levante (E), and Scirocco (SE). In addition, the study of [] emphasizes how waves, particularly events characterized by higher wave heights, usually less than 4.5 m, are primarily concentrated in the northeastern sector (between 30° and 90°). Inside the lagoon, strong tidal flushing results in an average lagoon residence time on the order of 1–2 days for March–October, with a maximum hydraulic residence time of approximately 6 days in mid-summer due to increased stratification [].
Beyond its geographical significance, the Barbamarco lagoon plays a key role in local economic activities, prominently in fishing, aquaculture, and seaside tourism. The area hosts a local fish market and provides mooring for 80 fishing vessels with about 300 fishermen, generating an annual income of around 20 million euros. Additionally, the lagoon is the site of a commercial clam (Tapes philippinarum) fishery, a flourishing industry, employing roughly 400 people. Over the past 19 years, clam production has demonstrated fluctuating values, reaching a maximum of 20,513.95 tons in 2009 and a minimum of 5437.98 tons in 2018 []. These economic activities underscore the socio-economic importance of the Barbamarco lagoon in the region.
2.2. Methodological Approach
2.2.1. Fishermen’s Perception
As noted by the study of [], understanding public perception and knowledge is crucial for engaging society and changing human behavior. Structured interviews were conducted nationally to explore fishermen’s perceptions of marine litter in lagoon environments. This study analyzed the responses from participants in the Veneto and Emilia-Romagna regions. The interviews focused on the community’s perspective regarding the lagoon’s natural value and its impact on decision making.
The questionnaire covered various topics, including fishing trends, aquaculture, environmental conditions over the past five years, and the roles of lagoons and dunes in the ecosystem (Table 1). It also asked about the presence of marine litter and respondents’ participation in cleanup activities, assessing their perceptions of natural and human-induced coastal changes.

Table 1.
Summary of questionnaire themes.
During the interviews conducted in 2019–2020, in addition to collecting personal information to assess the profile of the respondents, seven questions addressed their perceptions of environmental degradation and the presence of marine litter, focusing on
- Economic characteristics and evolution of the coastal area.
- Environmental conditions of the coastal area and, in particular, the coastal lagoon.
- Presence and characteristics of marine litter.
When applicable, answers were given on a 4-level scale (increasing, stable, reducing, no idea), while others were given on a multiple-choice scale.
2.2.2. Eco-Geomorphology and Litter Monitoring
The geomorphic analysis of the Boccassette spit used a DJI Phantom 4 Pro Obsidian drone with a 20-megapixel camera. Initial surveys covering the spit occurred in winter 2019–2020 (26–29 November 2019) under suitable meteorological conditions (Figure 1). Two additional surveys, focusing on a 1 km area as shown in Figure 1, were conducted in summer (25 June) and autumn (10 October) 2020, both under favorable weather conditions for UAV monitoring.
This study was conducted according to common practices for applying UAVs [,], including planning, drone deployment, and image processing and analysis. To optimize drone battery life and ensure adequate image resolution for accurate macro-litter representation, the first November 2019 survey flew at 80 m, covering about 0.8 km2 (4.4 km long, 0.1 to 0.4 km wide). Nine flights were necessary, with an 80% longitudinal overlap and 60% transversal overlap. Around 2300 photos (resolution: 5472 × 3648 pixels) were captured nadir (perpendicular to the flight direction). Additionally, 27 Ground Control Points (GCPs) were placed in the surveyed area. The June and October 2020 flights were broadly similar, but at a maximum altitude of 25 m, covering about 0.18 km2 (22.5% of the area surveyed in the first survey). In total, around 3100 photos were captured nadir.
Data collection involved the acquisition of aerial images, which were subsequently processed using Agisoft Metashape’s Structure from Motion (SfM) algorithm. This produced orthomosaic and digital surface model outputs with a Ground Sample Distance (GSD) of 2.8 to 3 cm for the first survey and about 1 cm for subsequent flights. These resolutions are suitable for mapping targeted fish-related items. Further details on flight surveys and processing methods can be found in the study of [].
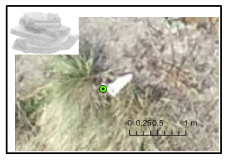
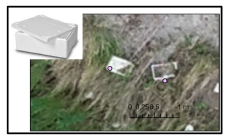
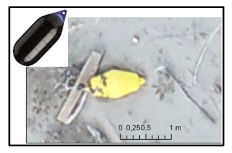
Our study analyzed the distribution of marine litter in relation to geomorphological aspects, focusing on identifying and mapping items associated with fishery activities and eco-geomorphological classes. We targeted three fishing-related items commonly found on European beaches [] due to their easily identifiable characteristics in UAV images: EPS fishing boxes (Master List Code G63, [] Fleet et al., 2021), foamed polystyrene fragments (Master List Codes G83 and G82), and buoys (Master List Code G63). While EPS boxes and buoys are easy to identify, smaller foamed polystyrene fragments can resemble other materials (Table 2). Therefore, our study only included fragments larger than 6/7 pixels, or about 20 cm in their smallest dimension, since smaller fragments fall below the detection limits of UAV imagery and cannot be reliably identified.

Table 2.
Characteristics of the different items and eco-geomorphological classes observed in the 2019 orthophotos.
The items were identified through visual observation and mapped onto the orthophoto within a Geographic Information System (GIS). This identification covered the entire spit during the survey in November 2019. Different eco-geomorphological classes were identified by comparing textural, spatial, spectral, and contextual features in UAV orthomosaics at a 1:3000 scale (Table 2). Photo-aerial interpretation integrated with field survey observations focused on geomorphological characterization and vegetation. The classes consist of the following:
- Beach: Extending from the seawater line to the line of dune foot and includes the beach wrack, which is the deposition of naturally discarded seaweeds and other organic matter on beaches. Waves and tides are the main controlling factors.
- Incipient foredunes: Corresponding to the embryo dunes characterized by pioneer vegetation (like Agropyron junceum ssp. Mediterraneum—Mediterranean rush grass) and the frontal foredune. These incipient formations represent the early stages of dune development and are situated along the beachfront. They are highly delicate and vulnerable to destruction or damage from storm waves or high tides. This zone is typically dominated by wind action but can also be affected by high tides or winter storms.
- Active semi-stabilized or mobile foredune typically has more vegetation cover than the previous ones. They are located behind the incipient foredunes and correspond to the shifting foredunes colonized by Ammophila arenaria (marram grass), which plays a vital role in developing dune systems. They are generally more resilient to storm waves, while wind is the main predominant factor.
- Fixed dunes: Stabilized and vegetated dunes, generally unaffected by storm waves and wind action, are limited and are usually stable.
- Saltmarshes: Densely vegetated coastal ecosystem between the dune system and the lagoon, usually composed of grasses and other low plants.
Subsequently, in ArcGIS Pro, we performed various geographic processing operations. These operations involved intersecting the items with elevation and geomorphological classes and calculating the cross-shore distances between the items and the shoreline, considered as the 0 m elevation contour extracted from the photogrammetric DEM. This analysis aimed to enhance our understanding of how beach configuration influences litter accumulation, including the effects of wind, tides, and coastal hydrodynamics.
Thematic grid maps of abundance were generated to visualize the distribution of three items on the coastal spit, as proposed by the authors of []. These maps clarify which environmental force (tide, wave, current, and/or wind) primarily affected the deposition and relocation of items on the beach and help identify the types of litter trapped by various plants in dune environments. Using a grid has many advantages, as emphasized in the study of []. We created these thematic grid maps by establishing grids with specific dimensions (5 m and 10 m grids using the “Feature Index Grid” tool) and performed a spatial join between the grid and the shapefile related to litter distribution to determine the number of items in each grid cell.
For the 2020 fights (June and October), mapping operations focused on a sub-area (shown in Figure 1) to assess changes in three items from November 2019 to October 2020. This method identified persistence, disappearance, or emergence. We also analyzed the items on the beach and incipient foredunes in relation to the sedimentary budget (erosion/sedimentation) using DEMs from UAV images. The analysis focused on the beach and incipient foredunes to minimize the influence of vegetation. Budget rasters were created from the three flights using the minus raster function to compare November 2019 with June 2020, June 2020 with October 2020, and November 2019 with October 2020. The items were then intersected with the budget raster to determine topographic changes and assess the effects of erosion or sedimentation on item appearance, persistence, or disappearance. However, the evolution of the coastal zone (beach and foredunes) will not be discussed in this paper as it falls outside the scope of our study.
2.2.3. Statistical and Spatial Analysis
All numerical variables, such as litter counts, densities, distances from the shoreline, and elevations, were analyzed using descriptive statistics. We specifically calculated the median, standard deviation, and minimum–maximum values to summarize the overall trend and variability of the data. This analysis provided a comprehensive view of the distribution of expanded polystyrene (EPS) litter and buoy across various environmental conditions. To assess the normality of data, the Shapiro–Wilk test was employed, and the results confirmed that our data were not normally distributed (e.g., for ‘quote’: W = 0.988, p < 0.0001; for ‘distance’: W = 0.812, p < 0.0001). Based on these findings, we chose non-parametric descriptive methods for our analysis.
In our spatial analysis, we used GIS-based methods in ArcGIS to assess the accumulation of the three items (EPS items and buoys) across the three survey periods (November 2019, June 2020, and October 2020). The presence or absence of the identified items was recorded, and changes in their distribution were visually interpreted using overlay techniques. We calculated percentages to assess the presence or absence of EPS items over time, particularly in relation to different eco-geomorphological classes. This method was selected because it aligns with this study’s goal of identifying spatial trends.
Descriptive statistics (i.e., percentages) were used to summarize the responses regarding public perceptions of EPS pollution for the questionnaire data. Since the aim was to provide an overview of public perceptions rather than to test complex relationships, no statistical tests were performed on these data.
3. Results
3.1. Perception
A total of 172 respondents were from the Po Delta area (Emilia-Romagna and Veneto regions), including 85 men (49.4%) and 87 women (50.6%). Regarding age, most respondents were between 20 and 29 (45%), followed by those aged 30 to 39 (18%). Only four respondents (2%) reported not visiting coastal environments.
Regarding their opinions on the primary resources of the coastal zone, most respondents provided three main answers, with tourism activities being the most significant (88% of respondents mentioned tourism—151), followed by fishing and aquaculture (reported by 78.5% of respondents—135). The environment was the third most mentioned resource, identified by 54% of the interviewees. They also indicated that the number of fishermen and the quantity of fish are decreasing, while fish farming and mollusk farming are increasing (Table 3). Similarly, tourism activities are generally perceived as growing. Additionally, 170 respondents (98.8%) believe that marine litter also impacts lagoons, and 134 respondents (78%) attributed the degradation of lagoons to natural factors, while 134 respondents pointed to human activities as the primary cause.

Table 3.
Summary of the respondents’ perceptions regarding the short-term evolution of relevant activities.
Concerning the environmental conditions of coastal zones (lagoon, beach, and dune), as illustrated in Table 4, respondents believe that these areas are more degraded than five years ago. The three main issues identified are pollution (147 respondents, 85.5%), habitat alteration (129 respondents, 75%), and the overexploitation of resources (104 respondents, 60.5%). Additionally, respondents indicated that plastic is the primary type of litter found in seawater (164 respondents, 95.3%) and did not perceive any significant difference in the litter present in lagoons, seawater, or on beaches (125 respondents, 72.7%). Furthermore, most respondents (128, 74.4%) have participated in litter collection in the sea, on beaches, and in lagoons. In contrast, only 21 (12.2%) expressed their unwillingness to participate in cleaning operations due to hygiene concerns or a belief that it is not their responsibility.

Table 4.
Summary of the respondents’ perceptions regarding the state and 5-year evolution of the coastal zones.
Finally, the interviewed fishermen reported that the main items they lost included utensils (57%), baskets (40%), polystyrene boxes (25.2%), ropes (25.2%), pre-baiting bags (12.6%), and buoys (9.9%). Additionally, the fishermen noted that the primary causes of item losses were adverse weather conditions (45.2%), accidental breakage during fishing operations (40%), and the loss of balance due to the rolling and pitching of the boat (25.9%).
3.2. Distribution of the Marine Litter Along the Spit of Boccassette in November 2019
Drone imagery enables the mapping of eco-geomorphological classes, revealing that saltmarshes and fixed dunes constitute approximately 39% and 29% of the area. We identified 2588 items along the coastal spit (about 4.5 km), including 1419 EPS intact expanded-polystyrene (EPS) fishing boxes (54.8%), 1025 broken EPS fishing box fragments (39.6%), and 144 buoys (5.6%, Table 5, Figure 2 and Figure 3).

Table 5.
Number of items counted in the different eco-geomorphological areas.
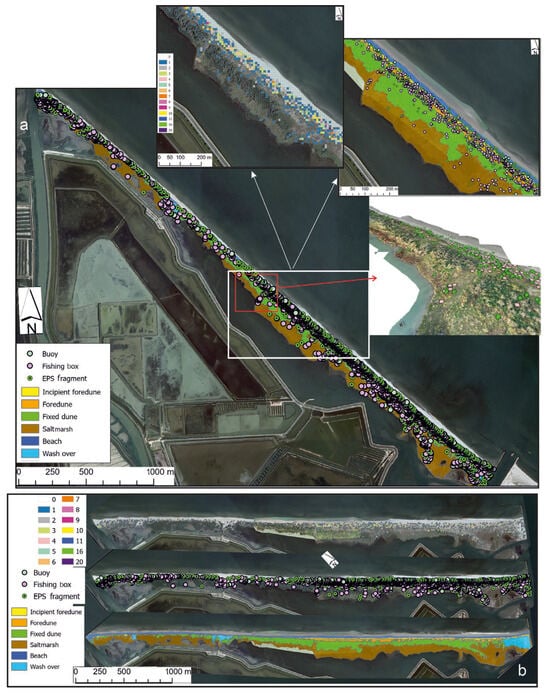
Figure 2.
(a) Spatial distribution of EPS fishing boxes, EPS fragments, and buoys along the Boccasette spit in the Northern Adriatic. The main panel presents a geomorphological map of the entire spit, showing the point locations of detected items. Three insets are included: item abundance represented through a grid map (left), localized item distribution overlaid on geomorphological features (middle), and a 3D perspective view of item positions relative to the landform (right). (b) From top to bottom are the following: the frequency of item occurrence, the spatial localization of items, and an eco-geomorphological map highlighting the dominant morphodynamic processes across the study area.
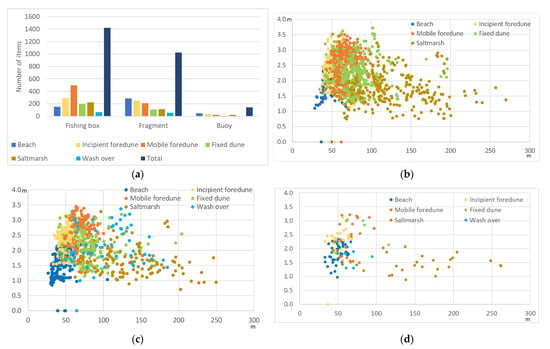
Figure 3.
(a) Distribution of EPS fishing boxes, EPS fragments, and buoys across geomorphological zones along the Boccasette spit. (b) Distribution of EPS fishing boxes relative to coastal topography. The x-axis represents distance from the shoreline (m), while the y-axis indicates elevation (m). (c) Distribution of polystyrene fragments along a shore-perpendicular transect. The x-axis represents the distance from the shoreline (m), and the y-axis corresponds to elevation (m). (d) Distribution of buoys with elevation profiles. The x-axis represents distance from the shoreline (m), and the y-axis shows elevation (m). All data are collected during a survey in November 2019.
Of the total items observed, 483 (approximately 18%) were located on the beach, predominantly in the upper part characterized by the accumulation of beach wrack. The composition of the debris items (Table 5, Figure 3a) included 31% EPS fishing boxes, 59% EPS fragments, and 10% buoys. In particular, fragments were more numerous than the other types. When examining the quantity of items in relation to the beach area, the rate of items per square meter was about 0.0061, with fragments having a higher value.
In the area of the incipient foredunes, characterized by the development of pioneer vegetation consisting of Agropyron junceum (rush grass), 580 items were observed (about 22% of the total items), including 289 EPS fishing boxes, 254 EPS fragments, and 37 buoys (Table 5, Figure 3a). The incipient foredunes represent approximately 7.2% of the studied area, with the following:
- -
- Beach: About 0.006 items m−2.
- -
- Incipient foredunes: 0.0124 items m−2, twice the beach density.
Next, the mobile foredunes, colonized by Ammophila arenaria (marram grass) and other psammophyte species such as Eryngium maritimum (sea holly), account for 6.4% of the studied area. In this zone, 729 items have been mapped (28% of the total items), comprising 496 EPS fishing boxes (68%), 210 EPS fragments (29%), and 23 buoys (3%). It should be noted that the highest number of fishing boxes was recorded in this zone, while fragments and buoys were more abundant on the beach.
Then, progressing toward the lagoon, we observed 314 items on fixed dunes, characterized by vegetation that included Tortuleto (tortuleto community), Echinophora spinosa (spiny Echinophora), species in the order Malcolmietalia, Juniperus oxycedrus (prickly juniper), shrubs, and woods. Among these items were 198 fishing boxes (63%), 106 fragments (34%), and 10 buoys (3%).
In the area behind the dunes, the primary saltmarsh class is influenced by transitional waters and characterized by Spartina alterniflora (smooth cordgrass) and Spartina patens (salt meadow cordgrass). A total of 250 items were identified, including 223 EPS fishing boxes (63%), 111 EPS fragments (31%), and 22 buoys (6%). Notably, 124 items were recorded in the wash-over zone, which occupies a small area as shown in Figure 2.
Furthermore, analyzing the cross-shore distribution indicates that items commonly accumulate within an average distance of 45.7 m from the shoreline, exhibiting a variability of ±36.7 m, which suggests inconsistency in their distribution. The average elevation is 2.2 m, with a standard deviation of 0.6 m (Figure 3b–d). Moreover, items linked to saltmarshes typically appear farther from the shoreline and at lower elevations than other eco-geomorphological classes.
Figure 2 illustrates the distribution of items along the shoreline. There is a concentration mainly at the southern end of the spit, especially close to the lagoon inlet utilized by fishermen. According to the 10 m grid map, the item counts vary from a minimum of 1 to a maximum of 20, with a count of 2 being the most frequent. Higher counts are predominantly found in the southern region, while the northern section generally shows lower counts.
3.3. Temporal Evolution of the Items
The analysis of collected items from the surveyed sub-area of approximately 0.18 km2 (refer to Figure 1 for the sub-area’s location), which constitutes 22.5% of the overall study area, indicates that 653 items were recorded during the flight in November 2019, 627 in June 2020, and 561 in October 2020 (Figure 4). Most of these items were EPS fishing boxes and fragments, with fewer than 30 buoys identified altogether (27, 20, and 23, respectively). Interestingly, EPS fishing boxes exceeded fragments in absolute number in November 2019 and October 2020; however, fragments were more numerous than fishing boxes in June 2020.
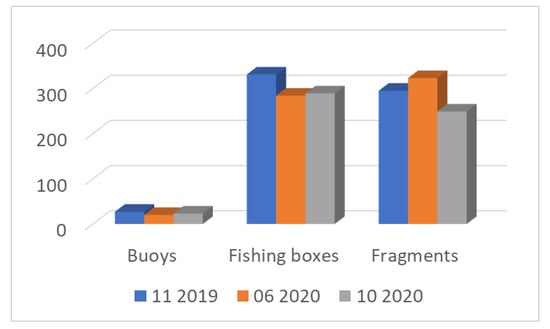
Figure 4.
Number of items observed in the sub-area in November/2019, June/2020, and October/2020.
Furthermore, the results (Figure 5a) show that the buoys were mainly located near the sea, at a maximum distance of 67 m (mean distance of 47.8 m ± 9.8 m), with an elevation ranging from 0.8 to 3.2 m (mean elevation of 1.98 ± 0.68 m). In contrast, EPS fishing boxes and fragments were usually located farther from the shoreline, between 29 and 80 m (mean distance 195.8 ± 69.3 m) and elevations from 0.3 to 3.9 m (2.4 ± 0.6 m). Additionally, these items were primarily associated with mobile foredunes, fixed dunes, and, to a lesser extent, incipient foredunes (Figure 5b). However, in November 2019, the items were first linked with incipient foredunes and secondarily with the beach and fixed foredunes.
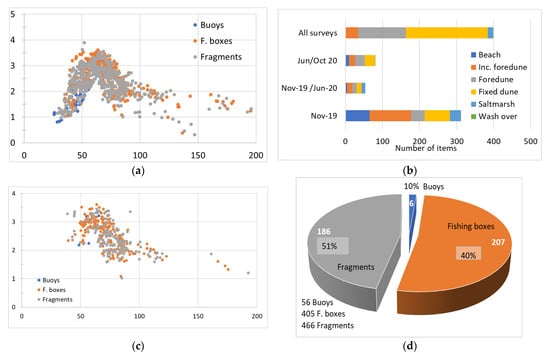
Figure 5.
(a) The relationship between the distance from the shoreline and elevation of the various items identified during the three surveys, (b) distribution of the observed items during the three surveys, categorized by eco-geomorphological classes, (c) relationship between the distance from the shoreline and elevation of items always present during the three surveys, (d) distribution of the items according to the different eco-geomorphological zones.
Reviewing the temporal evolution of the items from November 2019 to October 2020, it was observed that 399 items were consistently recorded across all three survey flights (sub-survey area, Figure 1), making up 61% of the items documented in November 2019. These frequently recorded items were typically located between a minimum of 38.8 m and a maximum of 192.7 m (mean distance 75.2 ± 19 m) from the shoreline and elevated between a minimum of 1 m and 3.6 m (2.5 ± 0.51 m; Figure 5c). Specifically, compared to observations from November 2019, 6 of the 27 total buoys (22%), 207 of the 331 total EPS fishing boxes (62.5%), and 186 of the 295 total EPS fragments (63%) were consistently observed in all three surveys.
Finally, we analyzed the relationships between elevation and elevation change across the survey periods for the 189 items identified on the beach and incipient dunes of the sub-survey area (Figure 1) to exclude the influence of vegetation. The results, illustrated in Figure 6, reveal that items consistently found throughout all survey periods are typically situated at higher elevations (ranging from 1 to 3.5 m, with an average of 2.23 ± 0.65 m) and are generally associated with positive elevation changes. Conversely, items noted solely in November 2019 showed a mix of negative and positive elevation changes, with elevations between 1.49 and 3.5 m (average value 2.6 ± 0.41 m).
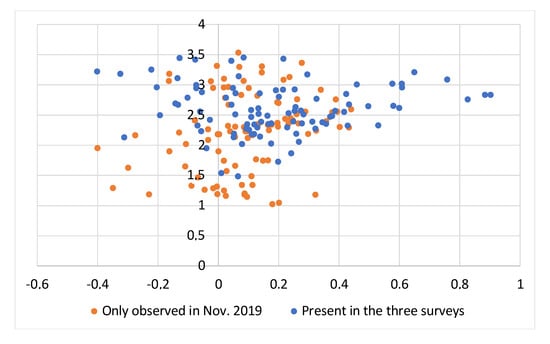
Figure 6.
Relationship between elevation changes (m) and the elevation (m) for items found exclusively in November 2019, compared to those consistently observed across all three surveys.
4. Discussion
Our results reveal not only a high level of awareness regarding coastal and lagoon degradation but also underscore critical issues related to the distribution, permanence, and monitoring of marine litter. They highlight the need for comprehensive strategies to address pollution and its long-term impacts on these vulnerable ecosystems.
4.1. Perception of Coastal and Lagoon Degradation
Data from respondents in the Po Delta region indicates a strong awareness of environmental degradation in coastal and lagoon areas. However, it is crucial to recognize that respondent bias may affect the findings, as those who are more informed or concerned about environmental issues are likely to participate in the survey. This potential bias is especially significant since most participants were from the Po Delta area, presumably more impacted and therefore more anxious about coastal and marine environmental challenges.
The findings indicate an increase in degradation over the past five years, which respondents mainly attribute to human activities, with pollution, habitat alteration, and resource overexploitation identified as the primary concerns (Table 4). These results are consistent with findings from other studies [,,,]. For example, the study of [] found that citizens in ten European countries are generally alarmed by coastal and marine issues that are not directly associated with climate change, including pollution, overfishing, and habitat destruction. Likewise, the authors of [] highlighted pollution and overfishing as key areas for public policy development in ten European nations. In Italy, the authors [] documented a moderate awareness among citizens regarding marine environmental issues, with pollution and litter being the most frequently cited problems. Furthermore, the authors of [] raised concerns about the irreversibility of marine environmental issues, stakeholder negligence, and the implications for future generations. The respondents’ concerns regarding habitat alteration are also confirmed by our results on the distribution of three specific items and our previous findings [], which indicate a significant amount of debris in the dune systems, despite our examination of only three macro items. Hence, our findings affirm those of [], who stated that the contamination of coastal dune volume demands serious consideration.
The perception that the number of fishermen and fish is decreasing while fish and mollusk farming is increasing indicates a shift in local economic activities and environmental conditions (Table 3). This aligns with the study of [], reporting a 38.7% reduction in the North Adriatic fishing fleet. A recent report noted that “in 2018, the number of boats in the Venetian fleet decreased by 0.6%, a 14.9% loss compared to 2009” []. Respondents express concerns about marine litter, including fishery-related items such as EPS fishing boxes and fragments, which significantly impact these ecosystems.
The respondents’ perceptions of marine litter are noteworthy. They report that marine litter, particularly plastic, is a pervasive issue affecting fishing and damaging equipment. Many have recently noted an increase in litter problems. Identifying plastic as the main type of litter aligns with global trends, supported by studies [,,,]. For instance, the authors of [] reported that marine debris was commonly observed in Ireland, Europe, and Taiwan, whereas respondents in Kenya were mainly concerned about plastic. The authors of [] found strong concern about plastic as the primary type of debris on beaches in Mar del Plata City (Argentina). Similarly, the author of [] noted that plastics were the primary type of litter on all surveyed beaches.
The respondents’ perceptions of marine litter, particularly the prevalence of plastic debris, are supported by our detailed spatial analysis of marine litter distribution along the spit of Boccassette in November 2019, as well as in June and October 2020 (Table 5 and Figure 2 and Figure 4). The inability of respondents to identify significant differences in litter types across various coastal environments highlights the widespread presence of plastic debris, a trend confirmed by our field data.
4.2. Processes Related to Marine Litter Distribution
Our results show the prevalence of EPS items (fragments and fishing boxes, Table 5, Figure 3a), aligning with previous studies [,,,]. The authors of [] suggested that EPS items are abundant in natural environments due to their low biodegradability. Additionally, our findings provide insights into their distribution and permanence, which aid in proposing effective mitigation measures.
4.2.1. Cross-Shore Processes
Our analysis identified distinct patterns in the cross-shore distribution of three specific types of plastic items: EPS fishing boxes, EPS white fragments, and buoys. The data show that EPS fishing boxes are predominantly found in the active dunes, while EPS fragments are more common on the beach (Table 5, Figure 3a). However, buoys exhibit a distribution pattern where they are frequently found both on the beach and within the active dunes (Table 2, Figure 2).
As noted by the authors of [], item counts do not always correlate with item density in a sector. Our study supports this, revealing a higher concentration of items in active dunes (especially incipient and mobile foredunes). A similar pattern was observed by the authors of [] along the central Adriatic coast (Abruzzo and Molise regions). Moreover, items tend to accumulate within 50 m from the shoreline, at elevations of 1 to 3 m, corresponding to incipient and active foredunes (Figure 3b–d). These results align with the study of [], who found the highest item concentration (0.031 items/m2) in foredune areas. Additionally, the authors of [] noted that vegetation significantly influences the distribution of marine litter, often trapping polystyrene items within dense vegetation, more so than proximity to the shoreline. Similarly, the authors of [] found that vegetation in coastal dunes acts as a ‘plastic litter sink,’ trapping and stabilizing items through perennial grasses and tufts, leading to accumulation and burial over time. This highlights the need for further research on the role of vegetation in trapping marine litter in dune zones.
Our results align with the study of [], who mapped marine debris in 10 polygons along Barbamarco. While they found widespread litter, it was concentrated in beach wrack, dunes, and saltmarshes. Their study aimed to identify litter types using image screenings, examine their distribution in relation to eco-geomorphological aspects, and provide recommendations for monitoring and cleaning. In contrast, our study focuses on the distribution and evolution of three fishing-related items (buoys, EPS fishing boxes, and EPS fragments) across the entire spit, recognizing its greater dedication to fisheries over tourism. Another key distinction is that the selected items in our study are buoyant (floating) plastics, which are especially vulnerable to wind and wave transport, allowing a more accurate assessment of their spatial dynamics across coastal zones.
Based on the observed distribution patterns, we assume most items were transported by sea. After reaching the beach, onshore winds likely pushed items further inland. This has been noted in various studies [,,,,]. For example, the authors of [] found that onshore waves and winds can significantly influence deposition and redistribution over time frames of one month and one week, respectively. Additionally, the authors of [] demonstrated that coastal dune vegetation plays a crucial role in trapping litter moved landward by waves and winds, potentially extending the residence time of debris, as noted by the study of [] as well.
Additionally, due to their low specific density, EPS items are particularly susceptible to being carried inland by prevailing winds from N45° to N135. Notably, stronger events, typically occurring at speeds under 12 m/s, originate from the eastern sectors, particularly the Bora (NE), Levante (E), and Scirocco (SE) winds. These winds can move EPS items inland, where they settle along coastal dune vegetation that serves as a natural barrier. This aligns with the findings of [,,,,]. The authors of [] also proposed that EPS fishing boxes, due to their larger surface area and friction, are more likely to be transported further inland, often reaching areas behind the dunes.
4.2.2. Longshore Processes
Understanding the longshore distribution of marine litter is more complex than the cross-shore distribution. Coastal processes, including wave action, wind, and vegetation, influence cross-shore patterns, while longshore currents, wind direction, and human activities such as fishing and coastal development, shape longshore distribution.
The predominant longshore current flows north in the study area, transporting litter along the coastline. However, local environmental and sedimentary factors also affect litter distribution. Despite the prevailing northward longshore current, our results show a gradient in marine litter distribution, with higher concentrations in the southern sector and lower in the north. This pattern is due to hydrodynamic processes along the coastline. According to the study of [], the northern sector experiences erosion, while the southern stretch accumulates sediment. This sediment dynamics, especially the sediment accumulation, likely explains the higher concentrations of buoyant items in the southern part of our study area, indicating that local sediment dynamics significantly influence litter deposition in this sector.
Moreover, vegetation and beach wrack in coastal systems significantly influence litter distribution along shores and dunes. The authors of [] suggest that they act as obstacles, reducing cross-shore and longshore mobility and altering deposition patterns. In Mediterranean coastal dunes, litter accumulation exhibits longshore variation influenced by biotic factors, such as vegetation height and zonation []. The eco-geomorphological variability along the Boccassette shoreline likely impacts litter retention, with low-to-medium-height vegetation in foredune zones trapping litter. This can create hotspots of litter accumulation, with vegetation serving as a “flying plastic litter sink” that hinders inland and lateral debris movement, as noted by the study of []. These natural elements add complexity by interacting with hydrodynamic forces and human influences. Additionally, coastal features and artificial structures can disrupt longshore currents, resulting in localized accumulation or erosion that complicates distribution patterns.
Coastal processes, such as waves, currents, and wind, are crucial for the distribution of marine litter. However, our results indicate that human activities, particularly aquaculture and fishing, as well as nearby entry points, also significantly impact it. The authors of [] highlight that aquaculture’s extensive plastic use leads to waste, worsened by poor waste management due to low staff awareness and lack of waste facilities at harbors [,]. The southern inlet facilitates exchanges between the Barbamarco lagoon and the sea, serving as a key entry point for fishing vessels at the port of Pila within the lagoon. This makes the southern sector more vulnerable to fishing debris than the north. Vessel traffic, port activities, and aquaculture operations increase the risk of litter accumulation in this area. Furthermore, the nearby Po della Pila River, a significant distributary of the Po Delta, contributes to this pattern, supplying 61% of the water discharge and 74% of the sediment discharge from the Po Delta [], thus exacerbating litter accumulation.
Our results align with studies emphasizing the influence of human activity on marine litter patterns, particularly in harbor areas. The authors of [,] noted higher litter densities on beaches near harbors, demonstrating the role of port activities in marine litter accumulation. The author of [] identified ports as the main driver of marine litter and found that rivers did not significantly influence beached litter. In contrast, we found higher litter density near the southern inlet, where both a port and the major river Po della Pila are located, suggesting that proximity to both can contribute to enhanced marine litter accumulation. The authors of [] support this, suggesting that this combination is crucial for litter distribution on the studied beaches.
These results underscore the need for localized management strategies that consider port-related activities, like fishing and aquaculture and riverine inputs, as highlighted by the author of []. Given the significance of fishing in the study area, particularly through the use of EPS fishing boxes and buoys, their potential contribution to litter accumulation is crucial. While longshore currents mainly govern litter transport along the coastline, the Po della Pila River significantly affects litter distribution, particularly in the south. The river serves as a pathway for upstream debris and a localized force exacerbating litter accumulation along the southern coastline. This dual influence highlights the importance of addressing marine litter locally, considering both maritime and fishing practices, as well as river contributions. Targeted interventions near key locations, such as inlets and harbors, are essential for reducing the influx and accumulation of marine debris. Similar findings in Spain, specifically in Mediterranean coastal sites (Alicante, SE Spain), suggest the need for localized management strategies, including stricter regulations, environmental education, and better waste management systems [].
4.2.3. Sedimentary Budget and Residence Times
As observed in various studies, the sedimentary budget is crucial for the distribution and persistence of marine debris [,,,]. For instance, the authors of [] found that plastic debris re-emerges during storms in eroded areas but may be buried where sediments accumulate. Similarly, the authors of [] noted that litter presence and persistence depend on sedimentary conditions, with erosion favoring re-exposure and accumulation leading to burial. Our sub-survey results enhance the understanding of how sediment dynamics influence litter movement and retention over time.
Figure 7 provides a schematic overview of the spatial distribution and persistence of the three studied plastic items across the Boccasette Spit. The diagram shows how different item types accumulate in specific coastal zones and explains the connection between their persistence, elevation, and sediment dynamics observed during the survey.
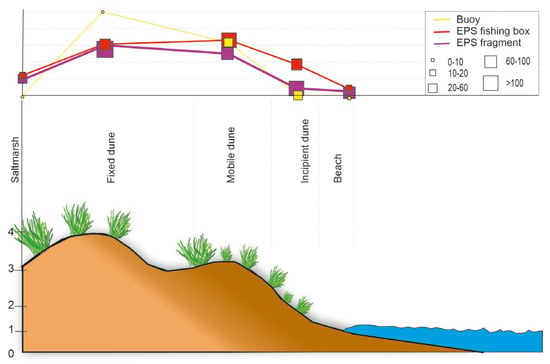
Figure 7.
Schematic of cross-shore distribution and persistence of three fishing-related plastics along Boccasette Spit, based on UAV surveys from November 2019 and October 2020. It shows that buoys (mainly located on the beach and dunes) have low persistence, EPS fragments (found in dunes) have moderate persistence, and EPS fishing boxes (located in both mobile and fixed dunes) have high persistence. Persistence indicates presence across the three surveys.
Our findings confirm that sedimentary processes have a significant influence on the residence time of marine debris. Buoys, typically positioned near the water at low elevations (1 to 2 m), are more susceptible to the effects of tides and waves. Consequently, as noted by the study of [], they experience shorter residence times and frequent displacements. This aligns with our data, where only 6 out of 56 buoys were consistently recorded across all three surveys, likely due to their increased mobility in high-energy conditions.
In contrast, EPS fishing boxes and EPS fragments were usually found further inland, located 30 to 80 m from the shoreline and at elevations between 1 and 3.5 m. These items were noted over extended periods, with 207 out of 405 EPS fishing boxes and 186 out of 466 EPS fragments consistently observed in all surveys (Figure 4 and Figure 5c). As illustrated in Figure 7, these items were most persistent in the mobile and fixed dunes, where sediment tends to accumulate. Their continual presence at higher elevations may indicate that they were buried by accumulating sediments, leading to prolonged residence times. Both the authors of [,] observed similar patterns, remarking that sediment build-up in dune systems covers debris, protecting it from immediate re-exposure and facilitating its redistribution over extended durations.
The temporal variability, such as the higher number of EPS fragments in June 2020 compared to EPS fishing boxes, may be associated with varying erosion and re-exposure patterns, as noted by the study of []. EPS fragments, which were lighter and more susceptible to movement by wind or waves, generally get redistributed. In contrast, larger and heavier fishing boxes, likely due to the sediment they contain, tend to remain buried for a longer duration, thereby enhancing their persistence.
Our results regarding the elevation changes also provide insight into debris behavior (Figure 6). Items that appeared in every survey were typically found at higher elevations (ranging from 2 to 3.5 m) and mostly in areas experiencing positive elevation changes, indicating that they were situated in sediment accumulation zones (Figure 6). This observation supports the findings of [], which suggested that debris buried in accumulating dunes tends to be re-exposed less frequently. Conversely, items observed only in November 2019 exhibited both positive and negative elevation changes, implying they were either recently deposited or temporarily exposed in dynamic regions where sediment deposition and removal are in constant flux (Figure 6), as highlighted by the study of [].
These observations highlight the crucial role of erosion and accumulation in determining the fate of marine debris. In eroding areas, debris can be re-exposed and redistributed by tides and waves, whereas, in accumulating zones, items are buried and integrated into the sediment, extending their residence time. The authors of [] suggest that debris trapped in embryonic or foredunes may eventually be buried and incorporated into the dune system, thereby explaining why certain items persist across multiple surveys.
Our findings support the litter–dune dynamics model (established by the authors of []). Lighter debris, such as EPS fragments and EPS fishing boxes, likely became trapped in dune vegetation, with wind-driven sand burial further contributing to their persistence. In areas more susceptible to erosion, such as beaches and lower dunes, these materials reappear as sediment is removed, which accounts for their reappearance in later surveys. This cycle of burial and re-exposure underscores the importance of understanding sedimentary budgets when examining the movement and persistence of marine debris.
4.2.4. Impacts of Marine Litter: Environmental and Socio-Economic Consequences
As previously stated, the persistence of marine litter in coastal areas can lead to significant environmental and socio-economic repercussions. The authors of [] pointed out the severe adverse effects of marine litter on nearly all ecosystem services globally. Our research focused on three specific items, EPS fishing boxes, EPS fragments, and buoys, as indicators of plastic pollution, mainly from fishery and aquaculture activities, constituting just a small portion of the total litter found along the spit. This litter not only diminishes the aesthetic value of coastal regions, adversely affecting tourism, as noted by the authors of [], but also presents long-term environmental hazards. For example, the authors of [] indicated that the buildup of polystyrene and plastic fragments in fixed dune scrubs results in ongoing pollution, particularly in areas of exceptional natural significance.
Additionally, the authors of [] pointed out that EPS materials utilized in aquaculture are very light and buoyant, which allows them to accumulate in coastal areas where they eventually break down into smaller fragments []. In contrast, high-density polyethylene (HDPE), commonly used for buoys, is more robust and chemically stable. While it degrades more slowly, it can also lead to microplastic generation through abrasion and fragmentation [].
EPS items are global in marine environments [], and their presence in coastal zones raises concerns about fragmentation processes, which are considered significant sources of microplastics (MPs) and nanoplastics (particles smaller than 100 nm). Environmental factors, particularly sunlight, primarily cause fragmentation, producing MPs and nanoplastics [,]. The authors of [] note that UV-B radiation initiates the photo-oxidative degradation of polymers in marine environments, while the authors of [] state that PS is more vulnerable to weathering and PE degrades slowly. HDPE (high-density polyethylene), with a half-life that ranges from 450 to over 25,000 years in marine environments [], degrades much more slowly, highlighting the longevity of plastic pollution.
The authors of [] found that, after three months of sunlight exposure, EPS can produce approximately 3.7 × 10⁶ ± 1.7 × 10⁵ particles/cm2, increasing to about 2.3 × 10⁷ ± 1.8 × 10⁷ particles/cm2 after nine months. Based on the dimensions of an EPS fishing box (dimensions: 50 × 30 × 14 cm), we estimate that, after nine months, the exposed face of a single EPS fishing box could potentially produce 34.5 × 10⁹ ± 27 × 109 particles. This number should be multiplied by the total number of EPS fishing boxes (1419) or by 50%, since about half of the EPS fishing boxes remained after 10 months of monitoring. Therefore, the 1419 EPS fishing boxes mapped along the Bocassette spit may produce 4.90 × 10¹³ micro-particles, or at least 2.45 × 10¹³ if we only consider 50% of the EPS fishing boxes.
The authors of [] calculated that the fragmentation rate of nanoparticles, after an equivalent duration of sunlight exposure, was approximately ten times greater than that of microparticles when considering particle numbers, even though the mass of nanoparticles was minimal compared to microparticles. Despite their diminutive size, nanoplastics represent a significant threat to marine ecosystems due to their likelihood of being ingested by marine organisms and subsequently entering the food chain, as indicated by various studies [,,]. The authors of [] noted the presence of micro and nanoplastics in marine animals such as mussels, oysters, marine fish, seabirds, and whales, while the authors of [] emphasized that the buildup of nanoplastics in these organisms could lead to potential toxic effects. Hence, our findings underscore the need for a deeper understanding of sedimentary dynamics and the implementation of targeted strategies to manage marine litter and mitigate its long-term effects.
4.2.5. Implications for Policy and Community Engagement in Marine Litter Management
Our previous findings underscore the need for targeted measures to address plastic pollution, notably expanded polystyrene (EPS) pollution. The global demand for polystyrene and EPS has notably increased, rising from 13 million tons in 2000 to approximately 14.9 million tons in 2010, with the global EPS market size estimated at 6.62 million tons in 2016 []. The rapid fragmentation and association of EPS items with heavy metals pose contamination risks, leading to acute metal exposure in ecosystems []. Additionally, it is worth considering that the respondents have observed a decline in the fishing fleet and an increase in aquaculture, suggesting changes in economic activities that may alter the type and source of marine litter.
Fishermen contribute to marine litter by accidentally losing items like EPS boxes and buoys. However, they also play a key role in addressing the issue. Involving them in strategies to reduce litter, such as designing biodegradable alternatives to polystyrene, can help mitigate fishing-related debris.
Consequently, urgent actions are essential for monitoring and mitigation, taking into account the evolving socio-economic context. This includes awareness initiatives and cleanup programs aimed at engaging citizens and coastal users, as noted by the study of []. Key elements to consider include the following:
- Public Involvement in Litter Monitoring and Cleanup: Respondents’ participation in litter collection highlights the community-based monitoring potential for future strategies. As the author of [] suggested, these strategies should consider local characteristics for efficiency. Fishermen have a dual role: they contribute to marine litter through the accidental loss of fishing items (like EPS fishing boxes or buoys) and are stakeholders in addressing this issue. Involving them in litter reduction strategies, such as designing biodegradable alternatives to polystyrene or participating in programs like Fishing For Litter, could help reduce the impact of fishing-related debris. According to the study of [], Fishing For Litter is an initiative involving fishermen in removing marine litter from the sea while raising awareness about the environmental impact of marine debris, as noted by the study of []. In the Adriatic Sea, the DeFishGear project implemented Fishing for Litter at 15 ports, including Italian ports like Ancona, Chioggia, and Cesenatico. Although initial participation was strong, sustained efforts faced obstacles like limited infrastructure and a lack of long-term funding []. Despite these challenges, the program continued in Cesenatico and Slovenian ports, such as Izola and Koper, with support from local cooperation. These examples underscore the need for consistent funding, clear legal frameworks, and collaboration with the fishing industry []. Such initiatives could strengthen cooperation between fishermen, local authorities, and environmental organizations. Public awareness and local initiatives: Boosting public participation can address hygiene concerns and foster collective responsibility. The authors of [] confirm that beach cleaning helps volunteers understand litter’s impact on marine environments and alters their plastic use and disposal behaviors. Their study indicates that cleanup efforts effectively remove large amounts of litter, with organizations collecting around 3000 metric tons annually.
- Beach and Dune System Cleanup: Results indicate beach cleaning efforts must also include dune systems, particularly active foredunes, as litter (mainly plastic and polystyrene) affects sand characteristics and plant species composition by increasing sediment permeability and reducing thermal diffusivity []. Therefore, tailored cleaning procedures for dune systems are essential, as improper methods, especially involving citizen volunteers, can harm vegetation and root systems. This requires staff training and user education. For example, the study of [] recommends restricting access to sand dunes and vegetation for manual litter collection, prohibiting mechanized cleaning in these areas.
- Comprehensive Monitoring Strategies: Robust monitoring systems should cover diverse environments, including dunes and vegetation zones that trap litter. Combining techniques such as remote sensing, citizen science, and field surveys enables cost-effective, ongoing monitoring []. These strategies will also enhance the understanding of marine litter distribution []. A combined approach using standard beach surveys (e.g., visual in situ census like []) with UAV-based surveys may provide a promising solution. Traditional methods provide detailed litter information, whereas UAV surveys are up to 39 times faster [], enabling the monitoring of remote sites and covering nearly the entire beach, including dune systems, as noted in several studies [,,,,,,,,,,,,,]. However, as suggested by the study of [], standardizing drone-based litter surveys is necessary for comparison across varied coastal environments.
- Integrated Approaches for Improved Understanding: Finally, our results suggest that integrated approaches combining knowledge of beach morphodynamics, marine litter abundance, and environmental factors may enhance our understanding of the spatiotemporal distribution and seasonal variations in marine litter accumulation. Geo-observations (both in situ and remote), coupled with hydrodynamic and particle modeling, can further clarify the relationships among ecology, geomorphology, hydrodynamics, and, ultimately, human activities. For instance, studies on the role of vegetation in trapping marine litter or its impact on plant species [] could enhance our understanding. Additionally, as suggested by the study of [], modeling the swash-runup process can help identify locations of marine litter accumulation and estimate the residence time of items within the beach-dune system.
5. Conclusions
Our study highlights the complexity of marine litter in the Po Delta, especially along Bocassette’s coastal spit, highlighting the impact of natural processes and human activities. Respondents demonstrated a high level of awareness of coastal degradation, particularly pollution and marine litter, with plastic debris being identified as the primary concern. This concern aligns with studies revealing widespread worries about plastic pollution and its environmental effects.
Our data further indicate that coastal environments, such as coastal spits, face increasing threats from marine litter. The large number of fishing-related items, represented by EPS fishing boxes, EPS fragments, and buoys, reflects a strong link between local economic activities, including fishing and aquaculture, and litter accumulation. Our observations reveal distinct patterns in litter distribution, with dunes serving as natural traps and sinks for debris. Meanwhile, higher litter concentrations were observed near areas of human activity, such as ports and river outlets. This suggests that both natural forces and human factors play crucial roles in the accumulation of litter.
This highlights the need for localized management strategies in key areas affected by human activities and natural processes. Furthermore, the persistence of marine debris, particularly lightweight EPS items, emphasizes the need for implementing mitigation measures, such as enhanced waste management and focused cleanup efforts.
In conclusion, a comprehensive strategy is essential for managing marine litter. This strategy should consider sedimentary processes, environmental degradation, and socio-economic developments in coastal communities. By mitigating the drivers and spatial concentration patterns of marine litter, we can reduce its long-term effects on sensitive coastal and lagoon ecosystems.
Author Contributions
Conceptualization, C.C., A.L. and U.S.; methodology, C.C. and A.L.; analysis, C.C., A.L. and U.S.; investigation, C.C.; data curation, C.C.; writing—original draft preparation, C.C.; writing—review and editing, C.C., A.L. and U.S.; visualization. C.C.; supervision, C.C. and U.S.; project administration, C.C. and U.S.; funding acquisition, C.C. and U.S. All authors have read and agreed to the published version of the manuscript. Please turn to the CRediT taxonomy for the term explanation. Authorship must be limited to those who have contributed substantially to the work reported.
Funding
This research was funded by the Interreg Italy-Croatia program ITALY CROATIA CROSS-BORDER COOPERATION PROGRAMM, NET4mPLASTC and by the national project FEAMP “121/RBC/18”, titled “Protezione della biodiversità e degli ecosistemi marini e dei regimi di compensazione nell’ambito delle attività di pesca sostenibili—Studio per il ripristino degli habitat e della funzionalità della laguna di Barbamarco (Zona SIC/ZPS, Delta del Po) con il coinvolgimento dei pescatori.” (Protection of Biodiversity and Marine Ecosystems and Compensation Regimes within the Scope of Sustainable Fishing Activities—Study for the Restoration of Habitats and the Functionality of the Barbamarco Lagoon (SIC/ZPS Zone, Po Delta) with the Involvement of Fishermen).
Data Availability Statement
Data will be provided upon request to the authors.
Acknowledgments
The authors thank the four anonymous reviewers for their valuable comments and suggestions, which helped improve the quality of this manuscript.
Conflicts of Interest
Author Alexandre Lazarou was employed by the company Zanasi Alessandro SRL. The remaining authors declare that the research was conducted in the absence of any commercial or financial relationships that could be construed as a potential conflict of interest.
Abbreviations
The following abbreviations are used in this manuscript:
| EPS | Expanded Polystyrene |
References
- Galgani, L.; Beiras, R.; Galgani, F.; Panti, C.; Borja, A. Impacts of Marine Litter. Front. Mar. Sci. 2019, 6, 208. [Google Scholar] [CrossRef]
- Law, K.L. Plastics in the Marine. Environ. Annu. Rev. Mar. Sci. 2017, 9, 205–229. [Google Scholar] [CrossRef]
- Fernández García, G.; Asensio-Montesinos, F.; Anfuso, G.; Arenas-Granados, P. Beach Litter Variability According to the Number of Visitors in Cádiz Beaches, SW Spain. J. Mar. Sci. Eng. 2024, 12, 201. [Google Scholar] [CrossRef]
- Slimane, E.B.; Haseler, M.; Ben Abdallah, L.; Mhiri, F.; Nassour, A.; Schernewski, G. Efficient Beach Litter Monitoring: Accelerated Surveys of Pollution Hotspots—A North African Case Study. J. Mar. Sci. Eng. 2025, 13, 71. [Google Scholar] [CrossRef]
- Mikhailenko, A.V.; Ruban, D.A. Plastics and Five Heavy Metals from Sea Beaches: A Geographical Synthesis of the Literary Information. J. Mar. Sci. Eng. 2023, 11, 626. [Google Scholar] [CrossRef]
- Munari, C.; Corbau, C.; Simeoni, U.; Mistri, M. Marine litter on Mediterranean shores: Analysis of composition, spatial distribution and sources in north-western Adriatic beaches. Waste Manag. 2016, 49, 483–490. [Google Scholar] [CrossRef]
- Williams, A.T.; Rangel-Buitrago, N. Marine Litter: Solutions for a Major Environmental Problem. J. Coast. Res. 2019, 201935, 648–663. [Google Scholar] [CrossRef]
- Jambeck, J.R.; Geyer, R.; Wilcox, C.; Siegler, T.R.; Perryman, M.; Law, K.L. Plastic waste inputs from land into the ocean. Science 2015, 347, 768–771. [Google Scholar] [CrossRef]
- GESAMP. Guidelines for the Monitoring and Assessment of Plastic Litter and Microplastics in the Ocean; Kershaw, P.J., Turra, A., Galgani, F., Eds.; GESAMP Reports and Studies; GESAMP Joint Group of Experts on the Scientific Aspects of Marine Environmental Protection: London, UK, 2019; p. 130. [Google Scholar]
- Van Sebille, E.; Aliani, S.; Lavender Law, K.; Maximenko, N.; Alsina, J.M.; Bagaev, A.; Bergmann, M.; Chapron, B.; Chubarenko, I.; Cózar, A.; et al. The physical oceanography of the transport of floating marine debris. Environ. Res. Lett. 2020, 15, 023003. [Google Scholar] [CrossRef]
- Agamuthu, P.; Mehran, S.; Norkhairah, A.; Norkhairiyah, A. Marine debris: A review of impacts and global initiatives. Waste Manag. Res. 2019, 37, 987–1002. [Google Scholar] [CrossRef]
- Sousa-Guedes, D.; Bessa, F.; Queiruga, A.; Teixeira, L.; Reis, V.; Gonçalves, J.A.; Marco, A.; Sillero, N. Lost and found: Patterns of marine litter accumulation on the remote Island of Santa Luzia, Cabo Verde. Environ. Pol. 2024, 344, 123338. [Google Scholar] [CrossRef]
- Anfuso, G.; José Bolívar-Anillo, H.; Asensio-Montesinos, F.; Portantiolo Manzolli, R.; Portz, L.; Villate Daza, D.-A. Beach litter distribution in Admiralty Bay, King George Island, Antarctica. Mar. Pollut. Bull. 2020, 160, 111657. [Google Scholar] [CrossRef]
- Galgani, F.; Hanke, G.; Werner, S.; De Vrees, L. Marine litter within the European Marine Strategy Framework Directive. ICES J. Mar. Sci. 2013, 70, 1055–1064. [Google Scholar] [CrossRef]
- United Nations Environment Programme (UNEP). From Pollution to Solution: A Global Assessment of Marine Litter and Plastic Pollution; Synthesis; United Nations Environment Programme (UNEP): Nairobi, Kenya, 2021. [Google Scholar]
- Sozio, A.; Scarrica, V.M.; Rizzo, A.; Aucelli, P.P.C.; Barracane, G.; Dimuccio, L.A.; Ferreira, R.; La Salandra, M.; Staiano, A.; Tarantino, M.P.; et al. Application of Direct and Indirect Methodologies for Beach Litter Detection in Coastal Environments. Remote Sens. 2024, 16, 3617. [Google Scholar] [CrossRef]
- Fernández-Enríquez, A.; Anfuso, G.; Asensio-Montesinos, F.; Bakaj, A.; Ismailaj, M.; Cobaj, G. Distribution and Composition of Beach Litter along the Ionian Coastline of Albania. Water 2024, 16, 2370. [Google Scholar] [CrossRef]
- Taddia, Y.; Corbau, C.; Zambello, E.; Pellegrinelli, A. UAVs for Structure-From-Motion Coastal Monitoring: A Case Study to Assess the Evolution of Embryo Dunes over a Two-Year Time Frame in the Po River Delta, Italy. Sensors 2019, 19, 1717. [Google Scholar] [CrossRef]
- Ciufegni, E.; Anfuso, G.; Gutiérrez Romero, J.C.; Asensio-Montesinos, F.; Rodríguez Castle, C.; González, C.J.; Álvarez, O. Spatial and Temporal Deposition Rate of Beach Litter in Cadiz Bay (Southwest Spain). Sustainability 2024, 16, 1010. [Google Scholar] [CrossRef]
- Addamo, A.M.; Laroche, P.; Hanke, G. Top Marine Beach Litter Items in Europe; EUR 29249 EN; Publications Office of the European Union: Luxembourg, 2017; ISBN 978-92-79-87711-7. [Google Scholar] [CrossRef]
- Vlachogianni, T.; Fortibuoni, T.; Ronchi, F.; Zeri, C.; Mazziotti, C.; Tutman, P.; Varezić, D.B.; Palatinus, A.; Trdan, S.; Peterlin, M.; et al. Marine litter on the beaches of the Adriatic and Ionian Seas: An assessment of their abundance, composition and sources. Mar. Pollu. Bull. 2018, 131, 745–756. [Google Scholar] [CrossRef]
- Sandra, M.; Devriese, L.; De Raedemaecker, F.; Lonneville, B.; Lukic, I.; Altvater, S.; Compa Ferrer, M.; Deudero, S.; Torres Hansjosten, B.; Alomar Mascaró, C.; et al. Knowledge Wave on Marine Litter from Aquaculture Sources; D2.2 Aqua-Lit Project: Oostende, Belgium, 2020; p. 136. [Google Scholar]
- Rizzo, A.; Sozio, A.; Anfusio, G.; La Salandra, M.; Sasso, C. The use of UAV images to assess preliminary relationships between spatial litter distribution and beach morphodynamic trends: The case study of Torre Guaceto beach (Apulia Region, southern Italy). Geog. Fis. Din. Quat. 2022, 45, 237–250. [Google Scholar] [CrossRef]
- Forleo, M.B.; Romagnoli, L. Marine plastic litter: Public perceptions and opinions in Italy. Mar. Pollut. Bull. 2021, 165, 112160. [Google Scholar] [CrossRef]
- Hartley, B.L.; Pahl, S.; Veiga, J.; Vlachogianni, T.; Vasconcelos, L.; Maes, T.; Doyle, T.; d’Arcy Metcalfe, R.; Oztürk, A.A.; Di Berardo, M.; et al. Exploring public views on marine litter in Europe: Perceived causes, consequences and pathways to change. Mar. Pollut. Bull. 2018, 133, 945–955. [Google Scholar] [CrossRef]
- Wootton, N.; Nursey-Bray, M.; Reis-Santos, P.; Gillanders, B.M. Perceptions of plastic pollution in a prominent fishery: Building strategies to inform management. Mar. Pol. 2022, 135, 104846. [Google Scholar] [CrossRef]
- Asensio-Montesinos, F.; Anfuso, G.; Randerson, P.; Williams, A.T. Seasonal comparison of beach litter on Mediterranean coastal sites (Alicante, SE Spain). Ocean Coast. Manag. 2019, 181, 104914. [Google Scholar] [CrossRef]
- Andriolo, U.; Gonçalves, G. Baseline: The octopus pot on the North Atlantic Iberian coast: A plague of plastic on beaches and dunes. Mar. Pollut. Bull. 2023, 192, 115099. [Google Scholar] [CrossRef] [PubMed]
- Skirtun, M.; Sandra, M.; Strietman, W.J.; van den Burg, S.W.K.; De Raedemaecker, F.; Devriese, L.I. Plastic pollution pathways from marine aquaculture practices and potential solutions for the North-East Atlantic region. Mar. Pollut. Bull. 2022, 174, 113178. [Google Scholar] [CrossRef]
- Nardin, W.; Simeoni, U.; Matticchio, B.; Corbau, C. Geomorphological modeling of tidal inlets for sustainable deltaic lagoon management: A case study from the Po River delta, Italy. Ocean Coast. Manag. 2022, 220, 106081. [Google Scholar] [CrossRef]
- Spillman, C.M.; Hamilton, D.P.; Imberger, J. Management strategies to optimise sustainable clam (Tapes philippinarum) harvests in Barbamarco Lagoon, Italy. Est. Coast. Shelf Sci. 2009, 81, 267–278. [Google Scholar] [CrossRef]
- Simeoni, U.; Corbau, C. A review of the Delta Po evolution (Italy) related to climatic changes and human impacts. Geomorphology 2009, 107, 64–71. [Google Scholar] [CrossRef]
- Corbau, C.; Lazarou, A.; Buoninsegni, J.; Olivo, E.; Gazale, V.; Nardin, W.; Simeoni, U.; Carboni, U. Linking marine litter accumulation and beach user perceptions on pocket beaches of Northern Sardinia (Italy). Ocean Coast. Manag. 2022, 232, 106442. [Google Scholar] [CrossRef]
- IDROSER. Progetto di Piano per la Difesa dal Mare e la Riqualificazione Ambientale del Litorale Della Regione Emilia-Romagna Relazione Generale; Regione Emilia-Romagna: Bologna, Italy, 1996. [Google Scholar]
- Ruol, P.; Martinelli, L.; Favaretto, C.; Pinato, T.; Galiazzo, F.; Patti, S.; Anti, U.; Piazza, R.; Simonin, P.; Selvi, G.; et al. Gestione Integrata della zona Costiera Studio e Monitoraggio per la Definizione degli Interventi di Difesa dei Litorali dall’Erosione Nella Regione Veneto—Linee Guida; Regione Veneto: Fondamenta Santa Lucia, Venice, Italy, 2016; p. 335. [Google Scholar]
- Osservatorio Socio Economico della Pesca e dell’Acquacoltura. La Pesca in Veneto, Flotta, Impresa Produzione e Commercio—Anno 2018; Regione del Veneto: Venice, Italy, 2019; 34p, Available online: https://www.venetoagricoltura.org/wp-content/uploads/2019/12/La-pesca-in-Veneto-2018.pdf (accessed on 11 December 2023).
- Gonçalves, G.; Andriolo, U.; Gonçalves, M.S.; Sobral, P.; Bessa, F. Review: Beach litter survey by drones: Mini-review and discussion of a potential standardization. Environ. Poll. 2022, 315, 120370. [Google Scholar] [CrossRef]
- Corbau, C.; Buoninsegni, J.; Olivo, E.; Vaccaro, C.; Nardin, W.; Simeoni, U. Understanding through drone image analysis the interactions between geomorphology, vegetation and marine debris along a sandy spit. Mar. Pollut. Bull. 2023, 187, 114515. [Google Scholar] [CrossRef]
- Fleet, D.; Vlachogianni, T.h.; Hanke, G. A Joint List of Litter Categories for Marine Macrolitter Monitoring; EUR 30348 EN; Publications Office of the European Union: Luxembourg, 2021; ISBN 978-92-76-21445-8. [Google Scholar] [CrossRef]
- Lotze, H.K.; Guest, H.; O’Leary, J.; Tudae, A.; Wallace, D. Public perceptions of marine threats and protection from around the world. Ocean Coast. Manag. 2018, 152, 14–22. [Google Scholar] [CrossRef]
- Buckley, P.J.; Pinnegar, J.K.; Painting, S.J.; Terry, G.; Chilvers, J.; Lorenzoni, I.; Gelcich, S.; Duarte, C.M. Ten thousand voices on marine climate change in Europe: Different perceptions among demographic groups and nationalities. Front. Mar. Sci. 2017, 4, 206. [Google Scholar] [CrossRef]
- Gelcich, S.; Buckley, P.; Pinnegar, J.K.; Chilvers, J.; Lorenzoni, I.; Terry, G.; Guerrero, M.; Castilla, J.C.; Valdebenito, A.; Duarte, C.M. Public awareness, concerns, and priorities about anthropogenic impacts on marine environments. Proc. Natl. Acad. Sci. USA 2014, 111, 15042–15047. [Google Scholar] [CrossRef] [PubMed]
- Lucrezi, S. Public perceptions of marine environmental issues: A case study of coastal recreational users in Italy. J. Coast. Conserv. 2022, 26, 52. [Google Scholar] [CrossRef]
- Andriolo, U.; Gonçalves, G. Baseline Is coastal erosion a source of marine litter pollution? Evidence of coastal dunes being a reservoir of plastics. Mar. Pollut. Bull. 2022, 174, 113307. [Google Scholar] [CrossRef]
- Distretto di Pesca Nord Adriatico. Analisi Socio-Economica della Filiera Ittica—Nelle Regioni del Distretto di Pesca Nord Adriatico; Osservatorio Socio Economico della Pesca e dell’Acquacoltura: Venice, Italy, 2016; 15p. [Google Scholar]
- Veneto Agricoltura. LA PESCA IN VENETO, Flotta, Imprese, Produzione e Commercio—2018; Osservatorio Socio Economico della Pesca e dell’Acquacoltura: Venice, Italy, 2018; 34p. [Google Scholar]
- Bettencourt, S.; Freitas, D.N.; Costa, S.; Caeiro, S. Public perceptions, knowledge, responsibilities, and behavior intentions on marine litter: Identifying profiles of small oceanic islands inhabitants. Ocean Coast. Manag. 2023, 231, 106406. [Google Scholar] [CrossRef]
- Seco Pon, J.P.; Becherucci, M.E.; Paterlini, C.-A.; Quadri Adrogué, A.; Castano, M.V.; Zumpano, F.; García, G.O. Perception, knowledge and attitudes towards environmental issues and management among coastal users of the most important beach destination in Argentina. Ocean Coast. Manag. 2022, 220, 106070. [Google Scholar] [CrossRef]
- Rayon-Viña, L.; Miralles, M.; Gómez-Agenjo, E.; Dopico, E.; Garcia-Vazquez, E. Marine litter in south Bay of Biscay: Local differences in beach littering are associated with citizen perception and awareness. Mar. Pollut. Bull. 2018, 131, 727–735. [Google Scholar] [CrossRef]
- Andrady, A.L. Plastics and the Environment; John Wiley and Sons: West Sussex, UK, 2003. [Google Scholar]
- Poeta, G.; Battisti, C.; Acosta, A.T.R. Marine litter in Mediterranean sandy littorals: Spatial distribution patterns along central Italy coastal dunes. Mar. Pollut. Bull. 2014, 89, 168–173. [Google Scholar] [CrossRef]
- Poeta, G.; Fanelli, G.; Pietrelli, L.; Acosta, A.T.R.; Battisti, C. Plastisphere in action: Evidence for an interaction between expanded polystyrene and dunal plants. Environ. Sci. Pollut. Res. 2017, 24, 11856–11859. [Google Scholar] [CrossRef]
- Cresta, E.; Battisti, C. Anthropogenic litter along a coastal-wetland gradient: Reed-bed vegetation in the backdunes may act as a sink for expanded polystyrene. Mar. Pollut. Bull. 2021, 172, 112829. [Google Scholar] [CrossRef] [PubMed]
- Andriolo, U.; Gonçalves, G.; Bessa, F.; Sobral, P. Mapping marine litter on coastal dunes with unmanned aerial systems: A showcase on the Atlantic Coast. Sci. Total Environ. 2020, 736, 139632. [Google Scholar] [CrossRef] [PubMed]
- Di Febbraro, M.; Frate, L.; de Francesco, M.C.; Stanisci, A.; Tozzi, F.P.; Varricchione, M.; Carranza, M.L. Modelling Beach Litter Accumulation on Mediterranean Coastal Landscapes: An Integrative Framework Using Species Distribution Models. Land 2021, 10, 54. [Google Scholar] [CrossRef]
- Mo, A.; D’Antraccoli, M.; Bedini, G.; Ciccarelli, D. The role of plants in the face of marine litter invasion: A case study in an Italian protected area. Mar. Pollut. Bull. 2021, 169, 112544. [Google Scholar] [CrossRef]
- Gallitelli, L.; Battisti, C.; Olivieri, Z.; Marandola, C.; Acosta, A.T.R.; Scalici, M. Carpobrotus spp. patches as trap for litter: Evidence from a Mediterranean beach. Mar. Pollut. Bull. 2021, 173, 113029. [Google Scholar] [CrossRef]
- Olivelli, A.; Hardesty, B.D.; Wilcox, C. Coastal margins and backshores represent a major sink for marine debris: Insights from a continental-scale analysis. Environ. Res. Lett. 2020, 15, 074037. [Google Scholar] [CrossRef]
- De Francesco, M.C.; Carranza, M.L.; Stanisci, A. Beach litter in Mediterranean coastal dunes: An insight on the Adriatic coast (central Italy). Rend. Fis. Acc. Lincei 2018, 29, 825–830. [Google Scholar] [CrossRef]
- De Francesco, M.C.; Carranza, M.L.; Varricchione, M.; Tozzi, F.P.; Stanisci, A. Natural protected areas as special sentinels of littering on coastal dune vegetation. Sustainability 2019, 11, 5446. [Google Scholar] [CrossRef]
- Huntington, T. Marine Litter and Aquaculture Gear—White Paper; Report produced by Poseidon Aquatic Resources Management Ltd for the Aquaculture Stewardship Council; Poseidon Aquatic Resources Management Ltd.: Surrey, UK, 2019; 20p. [Google Scholar]
- GGGI (Global Ghost Gear Initiative). Best Practice Framework for the Management of Aquaculture Gear; Huntington, T., Ed.; Poseidon Aquatic Resources Management Ltd.: Surrey, UK, 2021; 81p plus appendices, Available online: https://repository.oceanbestpractices.org/handle/11329/1728 (accessed on 4 March 2025).
- Menicagli, V.; De Battisti, D.; Balestri, E.; Federigi, I.; Maltagliati, F.; Verani, M.; Castelli, A.; Carducci, A.; Lardicci, C. Impact of storms and proximity to entry points on marine litter and wrack accumulation along Mediterranean beaches: Management implications. Sci. Total Environ. 2022, 824, 153914. [Google Scholar] [CrossRef]
- Masiá, P.; Ardura, A.; Gaitán, M.; Gerber, S.; Rayon-Viña, F.; Garcia-Vazquez, E. Maritime ports and beach management as sources of coastal macro-, meso-, and microplastic pollution. Environ. Sci. Pollut. Res. 2021, 28, 30722–30731. [Google Scholar] [CrossRef]
- Turner, A.; Amos, S.L.; Williams, T. Coastal dunes as a sink and secondary source of marine plastics: A study at Perran Beach, southwest England. Mar. Pollut. Bull. 2021, 173, 113113. [Google Scholar] [CrossRef]
- Lincoln, S.; Andrews, B.; Birchenough, S.N.R.; Chowdhury, P.; Engelhard, G.H.; Harrod, O.; Pinnegar, J.K.; Townhill, B.L. Marine litter and climate change: Inextricably connected threats to the world’s oceans. Sci. Total Environ. 2022, 837, 155709. [Google Scholar] [CrossRef]
- Beaumont, N.J.; Aanesen, M.; Austen, M.C.; Börger, T.; Clark, J.R.; Cole, M.; Hooper, T.; Lindeque, P.K.; Pascoe, C.; Wyles, K.J. Viewpoint: Global ecological, social and economic impacts of marine plastic. Mar. Pollut. Bull. 2019, 142, 189–195. [Google Scholar] [CrossRef] [PubMed]
- Mooser, A.; Anfuso, G.; Mestanza, C.; Williams, A.T. Management Implications for the Most Attractive Scenic Sites along the Andalusia Coast (SW Spain). Sustainability 2018, 10, 1328. [Google Scholar] [CrossRef]
- Heo, N.W.; Hong, S.H.; Han, G.M.; Hong, S.; Lee, J.; Song, Y.K.; Jang, M.; Shim, W.J. Distribution of small plastic debris in cross-section and high strandline on Heungnam beach, South Korea. Ocean Sci. J. 2013, 48, 225–233. [Google Scholar] [CrossRef]
- Song, Y.K.; Hong, S.H.; Eo, S.; Han, G.M.; Shim, W.J. Rapid Production of Micro- and Nanoplastics by Fragmentation of Expanded Polystyrene Exposed to Sunlight. Environ. Sci. Technol. 2020, 54, 11191–11200. [Google Scholar] [CrossRef]
- Song, Y.K.; Hong, S.H.; Jang, M.; Han, G.M.; Jung, S.W.; Shim, W.J. Combined effects of UV exposure duration and mechanical abrasion on microplastic fragmentation by polymer type. Environ. Sci. Technol. 2017, 51, 4368–4376. [Google Scholar] [CrossRef]
- Gewert, B.; Plassmann, M.M.; MacLeod, M. Pathways for degradation of plastic polymers floating in the marine environment. Environ. Sci. Process Impacts 2015, 17, 1513–1521. [Google Scholar] [CrossRef]
- Andrady, A.L. Microplastics in the marine environment. Mar. Pollut. Bull. 2011, 62, 1596–1605. [Google Scholar] [CrossRef]
- Chamas, A.; Moon, H.; Zheng, J.; Qiu, Y.; Tabassum, T.; Jang, J.H.; Abu-Omar, M.; Scott, S.L.; Suh, S. Degradation rates of plastics in the environment. ACS Sustain. Chem. Eng. 2020, 8, 3494–3511. [Google Scholar] [CrossRef]
- Gonçalves, J.; Bebianno, M.J. Nanoplastics impact on marine biota: A review. Environ. Poll. 2021, 273, 116426. [Google Scholar] [CrossRef]
- Kokilathasan, N.; Dittrich, M. Review: Nanoplastics: Detection and impacts in aquatic environments—A review. Sci. Total Environ. 2022, 849, 157852. [Google Scholar] [CrossRef]
- Li, Z.; Yan, L.; Junaid, M.; Chen, X.; Liao, H.; Gao, D.; Wang, Q.; Zhang, Y.; Wang, J. Impacts of polystyrene nanoplastics at the environmentally relevant and sub-lethal concentrations on the oxidative stress, immune responses, and gut microbiota to grass carp (Ctenopharyngodon idella). J. Hazard. Mat. 2023, 441, 129995. [Google Scholar] [CrossRef]
- Mofijur, M.; Ahmed, S.F.; Ashrafur Rahman, S.M.; Yasir Arafat Siddiki, S.K.; Saiful Islam, A.B.M.; Shahabuddin, M.; Ong, H.C.; Mahlia, T.M.I.; Djavanroodi, F.; Show, P.L. Source, distribution and emerging threat of micro- and nanoplastics to marine organism and human health: Socio-economic impact and management strategies. Environ. Res. 2021, 195, 110857. [Google Scholar] [CrossRef] [PubMed]
- Shi, C.; Liu, Z.; Yu, B.; Zhang, Y.; Yang, H.; Han, Y.; Wang, B.; Liu, Z.; Zhang, H. Emergence of nanoplastics in the aquatic environment and possible impacts on aquatic organisms. Sci. Total Environ. 2024, 906, 167404. [Google Scholar] [CrossRef] [PubMed]
- Mohsen, M.; Lin, C.; Tu, C.; Zhang, C.; Xu, S.; Yang, H. Association of heavy metals with plastics used in aquaculture. Mar. Pollut. Bull. 2022, 174, 163573. [Google Scholar] [CrossRef] [PubMed]
- Gallitelli, L.; Battisti, C.; Scalic, M. Dunal plants intercepting macrolitter: Implications for beach clean-ups. Mar. Pollut. Bull. 2023, 187, 114585. [Google Scholar] [CrossRef]
- Ronchi, F.; Galgani, F.; Binda, F.; Mandić, M.; Peterlin, M.; Tutman, P.; Anastasopoulou, A.; Fortibuoni, T. Fishing for Litter in the Adriatic-Ionian macroregion (Mediterranean Sea): Strengths, weaknesses, opportunities and threats. Mar. Pol. 2019, 100, 226–237. [Google Scholar] [CrossRef]
- Wyles, K.J.; Pahl, S.; Carroll, L.; Thompson, R.C. An evaluation of the Fishing For Litter (FFL) scheme in the UK in terms of attitudes, behavior, barriers and opportunities. Mar. Pollut. Bull. 2019, 144, 48–60. [Google Scholar] [CrossRef]
- Nelms, S.E.; Easman, E.; Anderson, N.; Berg, M.; Coates, S.; Crosby, A.; Eisfeld-Pierantonio, S.; Eyles, L.; Flux, T.; Gilford, E.; et al. The role of citizen science in addressing plastic pollution: Challenges and opportunities. Environ. Sci. Pol. 2022, 128, 14–23. [Google Scholar] [CrossRef]
- Šilc, U.; Küzmič, F.; Caković, D.; Stešević, D. Beach litter along various sand dune habitats in the southern Adriatic (E Mediterranean). Mar. Pollut. Bull. 2018, 128, 353–360. [Google Scholar] [CrossRef] [PubMed]
- ERA (Environment & Resouces Authority). Operating Procedures on Beach Cleaning; Environment and Resources Authority: Marsa, Malta, 2017; 12p, Available online: https://era.org.mt/operating-procedures-on-beach-cleaning/ (accessed on 17 October 2024).
- Veettil, B.K.; Quan, N.H.; Hauser, L.T.; Van, D.D.; Quang, N.Z. Coastal and marine plastic litter monitoring using re54mote sensing: A review. Estuar. Coast. Shelf Sci. 2022, 279, 108160. [Google Scholar] [CrossRef]
- Maximenko, N.; Corradi, P.; Law, K.L.; Sebille, E.V.; Garaba, S.P.; Lampitt, R.S.; Galgani, F.; Martinez-Vicente, V.; Goddijn-Murphy, L.; Veiga, J.M.; et al. Towards the integrated marine debris observing system. Front. Mar. Sci. 2019, 6, 447. [Google Scholar] [CrossRef]
- Martin, C.; Parkes, S.; Zhang, Q.; Zhang, X.; McCabe, M.F.; Duarte, C.M. Use of unmanned aerial vehicles for efficient beach litter monitoring. Mar. Pollut. Bull. 2018, 131, 662–673. [Google Scholar] [CrossRef]
- Andriolo, U.; Topouzelis, K.; van Emmerik, T.H.M.; Papakonstantinou, A.; Monteiro, J.G.; Isobe, A.; Hidaka, M.; Kako, S.; Kataoka, T.; Gonçalves, G. Baseline: Drones for litter monitoring on coasts and rivers: Suitable flight altitude and image resolution. Mar. Pollut. Bull. 2023, 195, 115521. [Google Scholar] [CrossRef]
- Merlino, S.; Paterni, M.; Berton, A.; Massetti, L. Unmanned Aerial Vehicles for Debris Survey in Coastal Areas: Long-Term Monitoring Programme to Study Spatial and Temporal Accumulation of the Dynamics of Beached Marine Litter. Rem. Sens. 2020, 12, 1260. [Google Scholar] [CrossRef]
- Gonçalves, G.; Andriolo, U.; Pinto, L.; Bessa, F. Mapping marine litter using UAS on a beach-dune system: A multidisciplinary approach. Sci. Total Environ. 2020, 706, 135742. [Google Scholar] [CrossRef]
- Calderisi, G.; Cogoni, D.; Loni, A.; Fenu, G. Difference between invasive alien and native vegetation in trapping beach litter: A focus on a typical sandy beach of W-Mediterranean Basin. Mar. Pollut. Bull. 2023, 192, 115065. [Google Scholar] [CrossRef]
Disclaimer/Publisher’s Note: The statements, opinions and data contained in all publications are solely those of the individual author(s) and contributor(s) and not of MDPI and/or the editor(s). MDPI and/or the editor(s) disclaim responsibility for any injury to people or property resulting from any ideas, methods, instructions or products referred to in the content. |
© 2025 by the authors. Licensee MDPI, Basel, Switzerland. This article is an open access article distributed under the terms and conditions of the Creative Commons Attribution (CC BY) license (https://creativecommons.org/licenses/by/4.0/).
