Article

Determining Non-Dimensional Group of Parameters Governing the Prediction of Penetration Depth and Holding Capacity of Drag Embedment Anchors Using Linear Regression

Department of Civil Engineering, Memorial University of Newfoundland, St. John’s, NL A1C 5S7, Canada
*
Author to whom correspondence should be addressed.
J. Mar. Sci. Eng. 2025, 13(7), 1332; https://doi.org/10.3390/jmse13071332
Submission received: 29 May 2025 / Revised: 5 July 2025 / Accepted: 6 July 2025 / Published: 11 July 2025
(This article belongs to the Section Ocean Engineering)

Abstract

Drag embedment anchors (DEAs) provide reliable and cost-effective mooring solutions for floating structures, e.g., platforms, ships, offshore wind turbines, etc., in offshore engineering. Structural stability and operational safety require accurate predictions of their penetration depths and holding capacities across various seabed conditions. In this study, explicit linear regression (LR) models were developed for the first time to predict the penetration depth and holding capacity of DEAs on clay and sand seabed. Buckingham’s theorem was also applied to identify dimensionless groups of parameters that influence DEA behavior, e.g., the penetration depth and holding capacity of the DEAs. LR models were developed and validated against experimental data from the literature for both clay and sand seabed. To evaluate model performance and identify the most accurate LR models to predict DEA behavior, comprehensive sensitivity, error, and uncertainty analyses were performed. Additionally, LR analysis revealed the most influential input parameters impacting penetration depth and holding capacity. Regarding offshore mooring design and geotechnical engineering applications, the proposed LR models offered a practical and efficient approach to estimating DEA performance across various seabed conditions.

1. Introduction

Drag embedment anchors (DEAs) are crucial components in offshore mooring systems, providing reliable anchoring solutions for floating structures, including oil and gas platforms, floating wind turbines, and marine renewable energy installations [1]. Their significance lies in their ability to achieve high holding capacity through deep penetration into the seabed, driven by the drag force applied during installation [2]. DEAs are particularly advantageous in soft to medium-strength seabed, where they can embed deeply and develop substantial resistance against vertical and horizontal loads [3]. The application of DEAs is widespread due to their cost-effectiveness, ease of installation, and adaptability to various soil conditions [4]. Unlike other anchoring systems, DEAs do not require complex installation equipment, as they are deployed using standard anchor handling vessels (AHVs) [5]. Additionally, their performance can be optimized through advanced numerical modeling and analysis, which account for factors such as drag velocity, mooring chain tension, and soil properties [6]. The advantages of DEAs include their high reliability, minimal environmental impact, and ability to withstand extreme environmental loads, making them indispensable for ensuring the stability and safety of offshore structures in challenging marine environments [7]. The schematic layout of a DEA is illustrated in Figure 1.
DEAs are widely used in marine anchoring systems due to their simple design, cost-effectiveness, and efficiency in various seabed conditions. Their popularity has driven extensive research to optimize performance, focusing on embedment trajectories, holding capacity, dynamic loading, and soil interactions. These studies highlight the industry’s reliance on DEAs and efforts to improve their reliability and design for diverse offshore applications.
Early research established a fundamental understanding of DEA behavior in soft seabeds. Aubeny and Chi [8] analyzed the load capacity and trajectory of a drag embedment anchor in soft seabed conditions, examining an idealized anchor with a rectangular fluke and cylindrical shank. Their trajectory prediction method demonstrated that equilibrium was quickly reached during embedment, with anchor rotation matching line uplift angle changes while load capacity remained constant. Wang et al. [9] further developed this understanding by creating a quasi-static model to predict anchor kinematic trajectories, considering soil capacity, anchor line conditions, and vessel handling in both moving and stationary anchor handling vessel (AHV) installations. Their integrated system analysis revealed that increasing anchor line length enhanced embedment depth but increased drag force on the AHV, while moving vessel installation achieved deeper embedment than stationary methods.
Subsequent research focused on the complex interactions during anchor installation. Zhao and Liu [10] evaluated penetration behavior controlled by the AHV and installation line using large deformation numerical analysis with a coupled Eulerian–Lagrangian technique. They investigated how drag velocity, uplift angle, line diameter, and length affected performance, establishing relationships between drag velocity, force, embedment depth, and critical line length. Zhang et al. [11] addressed limitations in traditional prediction methods by incorporating shallow behavior analysis, demonstrating that shallow-flow channel–soil interactions with varying bearing factors were essential for accurate kinematic predictions, particularly at shallow depths.
Recent studies have explored performance in complex soil conditions and innovative configurations. Lai et al. [12] examined DEA performance in layered offshore soils through model tests, developing a calibrated prediction model based on plasticity theory. Their findings showed that fluke pitch played a key role in penetrating stiff layers, with the undrained shear strength ratio significantly influencing penetration success. Building on this work, Lai et al. [13] studied piggy-backed drag embedment anchors through analytical and experimental analysis, demonstrating that this configuration enhanced total capacity beyond twice that of a single anchor by increasing rotational resistance.
Current research emphasizes optimization and comprehensive design approaches. Dao et al. [14] developed analytical models to balance cost, efficiency, and safety in DEA design for offshore infrastructure. While identifying limitations such as conservative embedment depth estimates, they recommended integrating optimization algorithms for complex DEA–soil interactions and provided foundational code for future research, establishing benchmarks for continued advancement in this field.
To date, numerous experimental, analytical, numerical, and finite element analyses (FDAs) studies have been conducted to explore various aspects of DEAs, including their embedment behavior, holding capacity, and interaction with different seabed conditions. These studies have significantly advanced the understanding of DEA performance in both sandy and clay seabed. However, a critical gap remains in identifying the dimensionless groups of parameters that govern anchor penetration depth and capacity. Such dimensionless groups are essential for developing generalized predictive models that can be applied across a wide range of conditions. The current study employed dimensional analysis to systematically identify the most influential dimensionless parameters affecting anchor penetration depth and capacity in sand and clay seabed. By leveraging this approach, key dimensionless groups were derived, capturing the interplay between anchor geometry, soil properties, installation forces, and environmental conditions. Based on these dimensionless groups, a set of linear regression models was developed to predict the target parameters (penetration depth and anchor capacity) with high accuracy. These models provide a robust and practical framework for optimizing DEA design and installation, offering valuable insights for engineers and researchers in offshore geotechnical engineering. This study bridges the gap between theoretical understanding and practical application, enabling more reliable and efficient deployment of drag embedment anchors in diverse marine environments.

2. Methodology

The development of linear regression (LR) models to estimate the penetration depth and holding capacity of drag embedment anchors (DEAs) in clay and sand seabed is outlined in the flowchart represented in Figure 2. The process begins with formulating idealistic assumptions to isolate critical factors influencing DEA behavior, such as anchor geometry, soil properties, and installation forces, while neglecting secondary effects. Dimensional analysis using the Buckingham-π theorem is then applied to reduce the number of variables into dimensionless groups that govern DEA performance. These groups, which capture interactions between anchor characteristics, soil strength, and installation parameters, provide a unified framework for modeling. A comprehensive dataset, incorporating experimental, numerical, and field data for clay and sand seabed, is compiled to train and validate the LR models. Using these dimensionless groups as input variables, LR models are developed to establish quantitative relationships predicting penetration depth and holding capacity. The models undergo rigorous statistical analysis and validation through performance metrics such as R-squared values and root mean square error (RMSE) to ensure accuracy and reliability. Finally, the most accurate LR models are identified, and key influencing dimensionless groups are highlighted, offering valuable insights for optimizing anchor design and installation in varying seabed conditions.

2.1. Dimensional Analysis

2.1.1. Dimensional Analysis for Penetration Depth of Drag Embedment Anchor (De) in Clay Seabed

To perform a dimensional analysis for predicting the penetration depth (De) of a drag embedment anchor (DEA) in clay seabed using the parameters provided, the Buckingham π theorem is applied. This theorem helps identify dimensionless groups that relate to physical problems. Table 1 introduces the variables and their corresponding dimensions in the clay seabed.

2.1.2. Number of Variables and Fundamental Dimensions

Number of variables: 8 (De, Lf, Wf, Ls, Ws, Wd, Su, k)
The fundamental dimensions involved were as follows: M (mass), L (length), T (time). According to the Buckingham π theorem, the number of dimensionless π groups is nm, where n is the number of variables (n = 8) and m is the number of fundamental dimensions, equaling 3 (M, L, T). So, we have 5 (8 − 3) dimensionless groups.

2.1.3. Define Dimensionless Groups

The dimensionless groups will be derived by selecting repeating variables that include all fundamental dimensions and combining them with the remaining variables.

2.1.4. Select Repeating Variables

Let us choose repeating variables that involve mass, length, and time:
-
Lf (Length, L)
-
Wd (Weight, MLT−2)
-
Su (Shear Strength, ML−1T−2)

2.1.5. Dimensionless Groups

We will form each dimensionless group (π groups) by combining the remaining variables with the repeating variables.
Example: π1 for De
π1 = De·Lfa Wdb·Suc
Dimensions:
De: L
Lfa: La
Wdb: (MLT−2)b
Suc: (ML−1T−2)c
Equating dimensions:
L·La·(MLT−2)b·(ML−1T−2)c = L0 M0 T0
Expanding and simplifying:
Length (L): 1 + a − bc = 0
Mass (M): b + c = 0
Time (T): −2b − 2c = 0
Solving these equations gives the following:
b = −c
1 + a = 0 ⇒ a = −1
Substituting b with −c:
π 1   =   D e W s · W d S u . W s 2 b
This process is repeated for other dimensionless groups, e.g., π1 to π6.

2.1.6. Dimensionless Groups of Parameters

The dimensionless groups will take the following form:
π 1   =   D e W s ,   π 2   =   W f W s ,   π 3   =   L s W s ,   π 4   =   L f W s ,   π 5   =   W d S u · W s 2 ,   π 6   =   k · L f S u
The functional relationship between these groups can be written as follows:
f D e W s ,   W f W s ,   L s W s ,   L f W s ,   W d S u . W s 2 ,   k . L f S u = 0
Hence, it can be rearranged to predict De:
D e W s = f 1   W f W s ,   L s W s ,   L f W s ,   W d S u . W s 2 ,   k . L f S u

2.1.7. Dimensional Analysis for Anchor Holding Capacity (F) of Drag Embedment in Clay Seabed

By performing a similar dimensional analysis for determining the anchor holding capacity (F) of drag embedment in the clay seabed, the dimensionless groups of parameters are formed as follows:
F S u W s 2 = f 2   W f W s ,   L s W s ,   L f W s ,   W d S u . W s 2 ,   k . L f S u

2.1.8. Dimensional Analysis for Penetration Depth of Drag Embedment Anchor (De) in Sand Seabed

This dimensionless analysis will identify groups that describe the relationship between the input and output parameters for the penetration depth of the sand seabed’s drag embedment anchor (De) in the sand seabed; hence, the parameters and their respective dimensions are provided in Table 2.
Thus, the dimensionless groups of parameters affecting the penetration depth of the drag embedment anchor (De) in the sand seabed are provided below:
D e W s = f 3   W f W s ,   L s W s ,   L f W s ,   W d γ · W s 3 · g ,   φ ,   ψ

2.1.9. Dimensional Analysis for Anchor Holding Capacity (F) of Drag Embedment in Sand Seabed

The dimensionless groups of parameters governing the anchor holding capacity (F) of drag embedment in the sand seabed are determined as follows:
F γ · W s 3 · g = f 4   W f W s ,   L s W s ,   L f W s ,   W d γ · W s 3 · g ,   φ ,   ψ
Therefore, W f W s , L s W s , L f W s , W d S u . W s 2 , k . L f S u inputs were utilized to predict the penetration depth and capacity of the drag embedment anchors in the clay seabed, while W f W s , L s W s , L f W s , W d γ · W s 3 · g , φ , ψ inputs were used to estimate the target parameters in the sand seabed.

2.2. Applied Dataset

To validate the LR models for estimating the penetration depth and holding capacity of DEAs in clay and sand seabed, a comprehensive dataset was created from experimental and analytical studies published in the literature. The dataset includes dimensionless parameters derived from anchor geometry, soil properties, and installation conditions, ensuring a robust foundation for model training and validation. For sandy seabed, [2,15,16] were used to build the dataset. Table 3 shows the minimum, maximum, average, and standard deviation of the applied dimensionless groups of parameters for the sandy seabed.
For the clay seabed, we utilized the work of [3,17,18,19,20] to create the dataset. Table 4 demonstrates the minimum, maximum, average, and standard deviation of the applied dimensionless groups of parameters for the clay seabed.
Figure 3 illustrates the input combinations used to develop the linear regression (LR) models for predicting the penetration depth and holding capacity of DEAs in clay and sand seabed. The diagram differentiates between two distinct seabed conditions, e.g., clay and sand, by using separate sets of dimensionless variables, which serve as inputs for various LR models. In the clay seabed (a), dimensionless groups include ratios of anchor weight, soil shear strength, and anchor length, among others, which influence penetration and anchor holding capacity. Similarly, for the sand seabed (b), additional dimensionless parameters, such as friction angle (φ) and dimensionless soil unit weight terms, are incorporated to account for granular soil behavior. The LR models are constructed using different combinations of these variables, as indicated in the model listings, to determine the most statistically significant predictors for DEA performance. This stepwise approach ensures model robustness, as multiple regressions are evaluated to identify the best-fitting equations based on statistical performance metrics. By analyzing different LR models, the study highlights the most influential factors governing anchor behavior, providing valuable insights for optimizing anchor design and deployment strategies across varying seabed conditions.

2.3. Goodness of Fit

There were several criteria used to assess the precision, correlation, and complexity of the LR models, including correlation coefficients (R), root mean square errors (RMSE), mean absolute percentage errors (MAPE), Willmott indexes (WI), residual mass coefficients (CRMs), and Akaike information criteria (AICs). A high degree of correlation was observed between the values observed and the proximity of the R and WI criteria to one, showing the ML model. RMSE, MAPE, and CRM indices were close to zero for LR models; however, the complexity of the LR models was not examined using the indices. The Akaike information criteria (AIC) were used to overcome this restriction [21]:
R = i = 1 n P i P ¯ O i O ¯ i = 1 n P i P ¯ 2 i = 1 n O i O ¯ 2
R M S E = 1 n i = 1 n P i O i 2
M A P E = 100 n i = 1 n P i O i O i
W I = 1 i = 1 n O i P i 2 i = 1 n P i O ¯ + O i O ¯ 2
C R M = i = 1 n O i i = 1 n P i i = 1 n O i
A I C = n × log 1 n i = 1 n P i O i 2 + 2 k

3. Results and Discussion

3.1. Clay Seabed

Figure 4 depicts the results of statistical metrics of the LR models for predicting the penetration depth and the holding capacity of the drag embedment anchor in the clay seabed. The six linear regression (LR) models (LR 1 to LR 6) are systematically developed by varying the selection of five key dimensionless groups that define anchor and soil interactions in clay seabed. LR 1 serves as the most comprehensive model, incorporating all five input parameters W f W s , L s W s , L f W s , W d S u · W s 2 , k · L f S u . Moving to LR 2, one input k · L f S u is removed, simplifying the model while still capturing the primary influences on penetration depth and holding capacity. Similarly, LR 3 excludes W d S u · W s 2 , refining the analysis further. This stepwise elimination process continues, with each subsequent LR model omitting a different input to assess its contribution. By LR 6, the model retains only four inputs L s W s , L f W s , W d S u · W s 2 , k · L f S u , removing W f W s (see Figure 3). The coefficient of determination indicated that all models have moderate predictive capabilities, with values ranging between 0.77 and 0.81. Among them, LR 1 exhibited the highest R index, confirming its superior ability to capture the relationship between the predictors and penetration depth. In contrast, the LR 3 model demonstrated the lowest value of the R index. The LR3 model exhibited the highest RMSE and AIC values, indicating the weakest predictive accuracy and least efficient model structure among the evaluated regression models. This inferior performance can be attributed to the lack of critical parameters that capture essential geotechnical mechanisms in LR3, particularly those related to soil–anchor interaction forces, such as the anchor dead weight ratio and fluke geometry. The model likely fails to fully represent the driving and resisting forces influencing drag anchor penetration in soft clay, where resistance is highly dependent on undrained shear strength and strain-rate effects. Conversely, LR1, which demonstrated the lowest AIC and RMSE along with the highest Willmott Index (WI), showed superior performance. The CRM values showed that most models tended to underestimate the penetration depth, with LR3 showing the largest negative bias. This systematic underprediction implied that the model might be neglecting influential parameters such as the effect of strain-softening or progressive failure, often observed in clay under large deformations caused by dragging anchors. The anchor dead weight ratio (Wd/SuWs2) emerged as the most influential parameter for predicting penetration depth. This emphasized the fundamental role of gravitational forces in overcoming the cohesive resistance of clay during anchor embedment. Heavier anchors increased normal stress on the soil, promoting deeper penetration through shear failure mechanisms. The second most critical factor, the fluke width ratio (Wf/Ws) aligned with the concept that a wider fluke mobilized greater passive resistance by increasing the contact area and distributing the load across more soil volume. The gradient of undrained shear strength (kLf/Su) was also a significant predictor, underscoring the importance of vertical soil strength variation, which was common in marine clays due to consolidation and layering. Moreover, the fluke length ratio (Lf/Ws) and shank length ratio (Ls/Ws) contributed meaningfully by affecting the load transfer mechanism and anchor-soil interaction geometry. A longer fluke, for example, modified the embedment path and enhanced rotational stability, while a longer shank could either aid or hinder penetration depending on its effect on force alignment and resistance buildup.
Among these models, the LR 1 model demonstrated the best performance across all metrics. Specifically, the LR 1 model achieved the highest correlation coefficient, indicating a strong correlation between predicted and observed values. Additionally, LR 1 recorded one of the lowest RMSE values, reflecting minimal prediction error, whereas the LR 3 model exhibited the weakest performance, with the lowest value of R and the highest degree of the RMSE index. The AIC value for LR 1 was relatively lower, indicating an optimal balance between model fit and complexity. The CRM value for LR 1 was closest to zero, with unbiased predictions. Furthermore, LR 1 achieved the highest Willmott’s Index, demonstrating strong agreement between predicted and observed values. Comparatively, LR 3 had the lowest WI and the highest CRM, with its poor predictive capability. The superior performance of LR 1 can be attributed to its ability to effectively capture the underlying patterns and dependencies within the dataset. Overall, the consistent performance of LR 1 across all statistical indices validates its robustness and accuracy in predicting the anchor holding capacity in clay seabed, making it the most reliable model among the six LR models. The implemented sensitivity analysis demonstrated that the anchor dead weight ratio ( W d S u · W s 2 ) had the highest level of effectiveness in modeling the holding capacity of DEA using the LR model.
The study performed a sensitivity analysis on a linear regression model to assess how dimensionless parameters affect drag anchor holding capacity prediction in clay seabed. The anchor dead weight ratio ( W d S u · W s 2 ) had the greatest impact on prediction accuracy, followed by the fluke width ratio ( W f W s ), fluke length ratio ( L f W s ), undrained shear strength gradient ratio ( k · L f S u ), and shank length ratio ( L s W s ). This analysis underscores the critical role of anchor geometry, especially fluke dimensions, and seabed shear strength in controlling holding capacity. Consequently, these findings provide essential guidance for optimizing anchor design through strategic parameter prioritization.
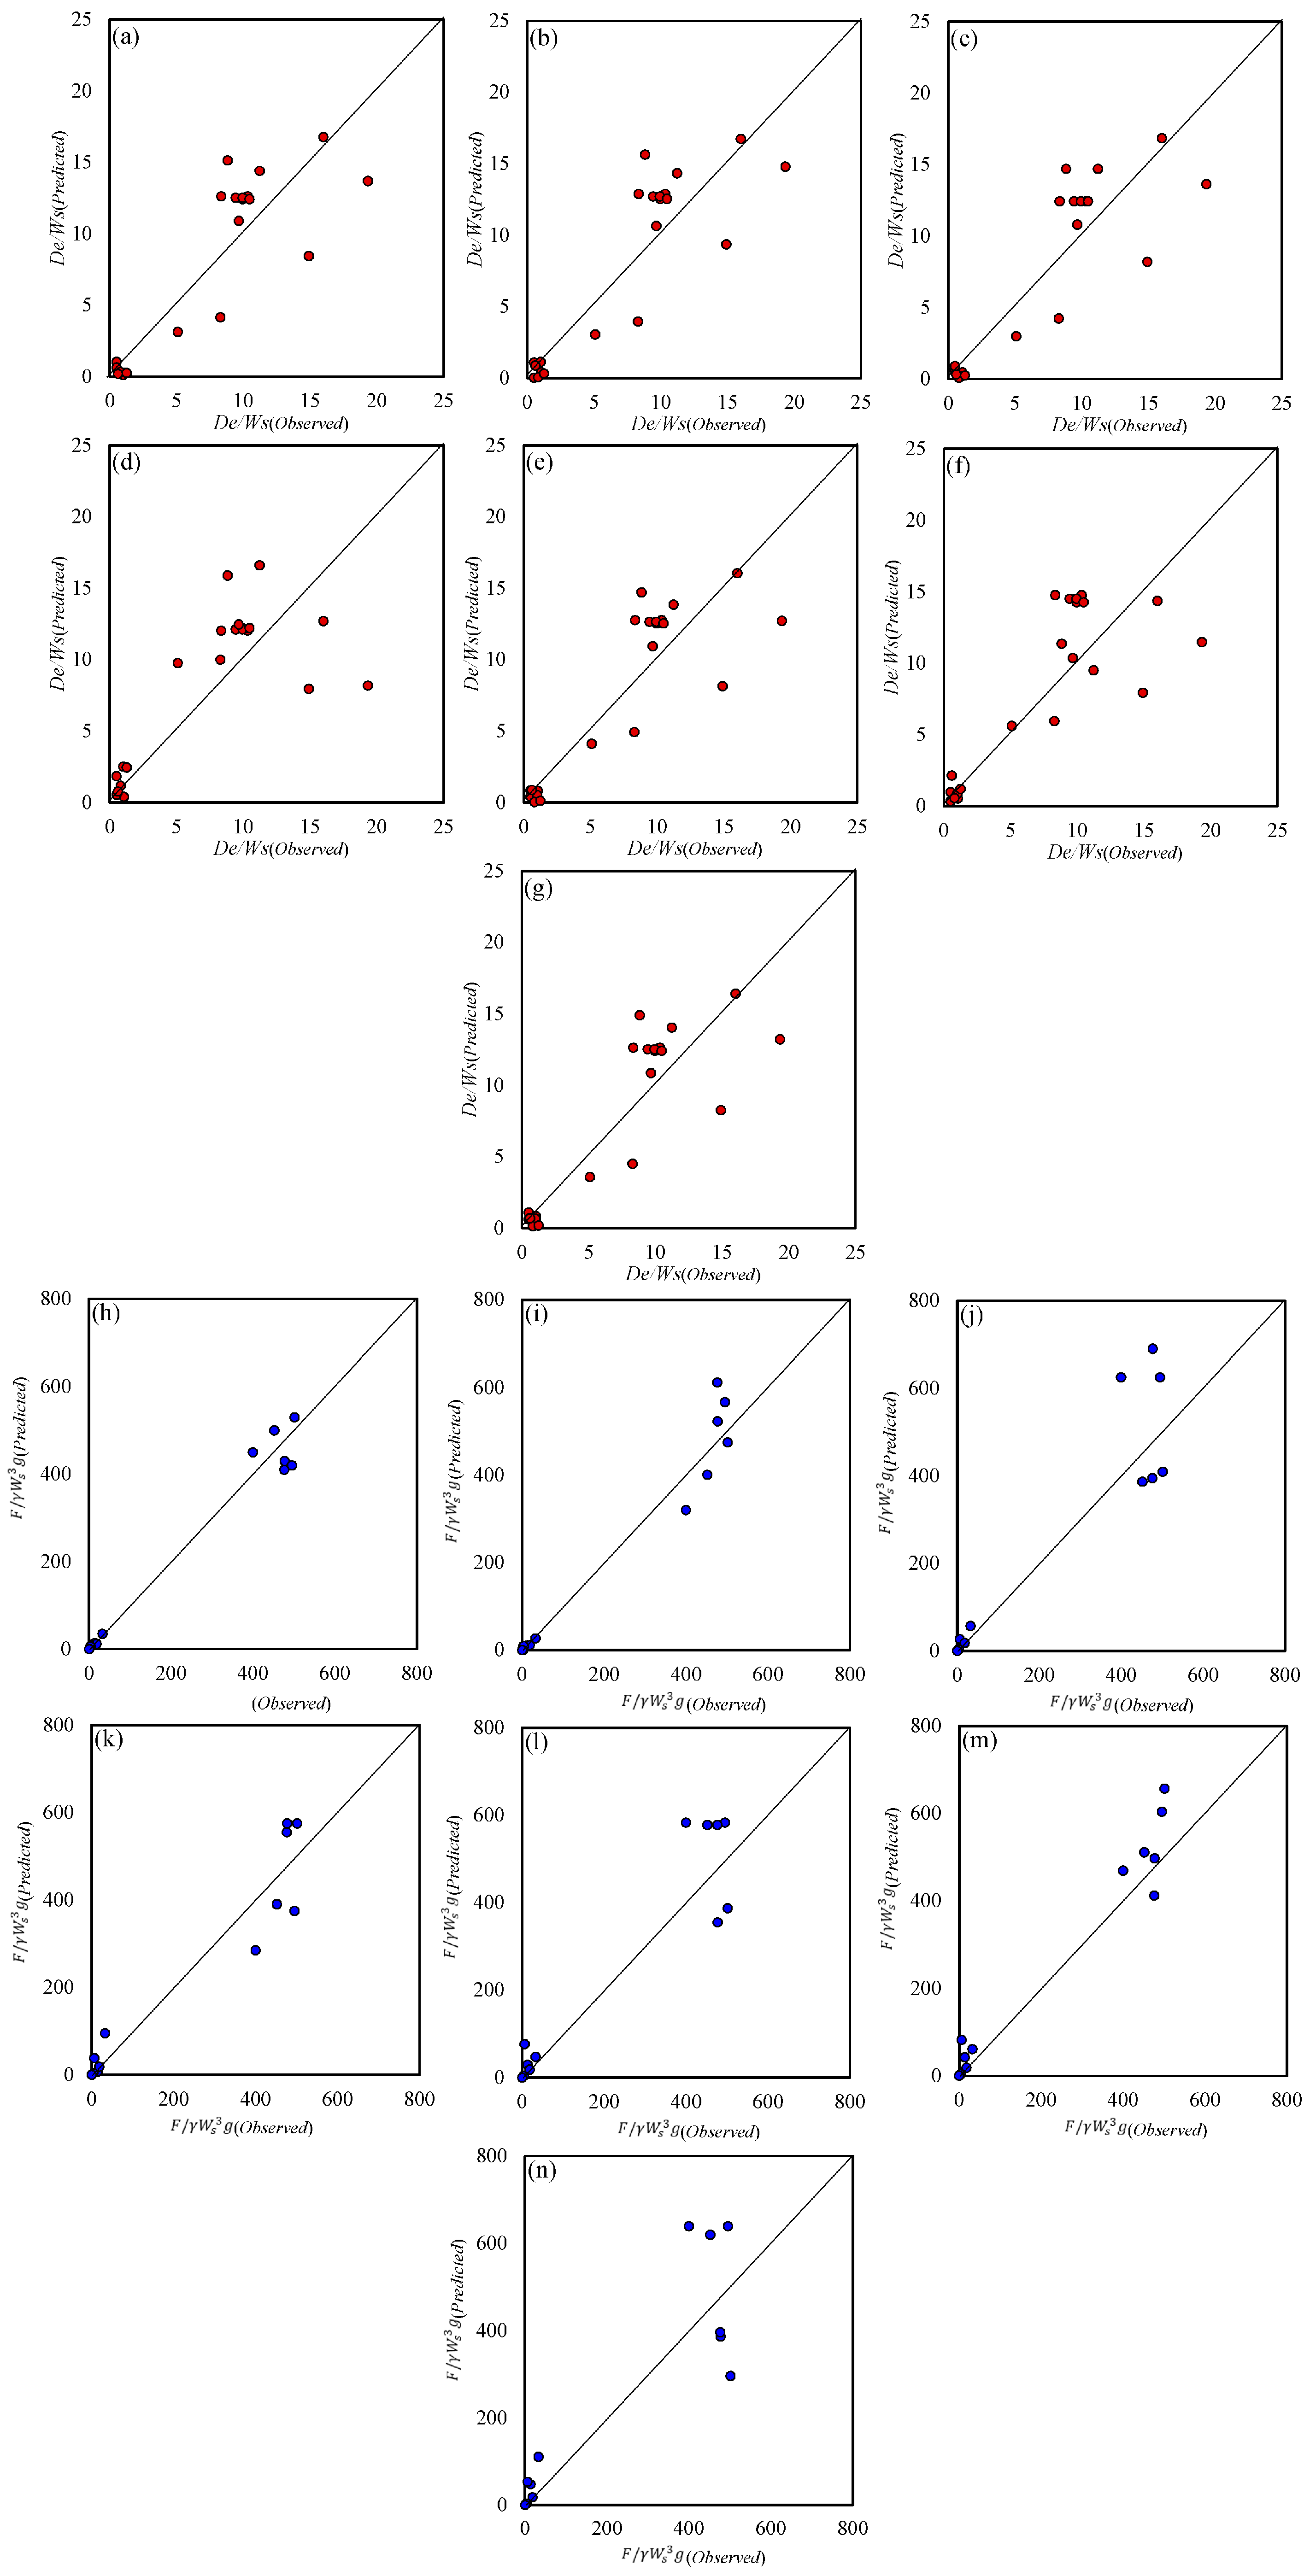
Figure 5 illustrates the scatter plot for the LR models to predict the penetration depth of the drag embedment anchor in the clay seabed. Regarding the modeling results, LR 1, LR 2, LR 4, LR 5, and LR 6 demonstrated relatively strong agreement between observed and predicted values, as most points cluster near the diagonal line. This suggests that these models provided reasonably accurate penetration depth estimates, with LR 1 appearing to have the best fit. However, the LR 3 model showed significant deviation from the ideal diagonal line, with a wider spread of points. This indicated higher prediction errors and lower accuracy compared to the other models, corroborating its poor performance as previously observed in the statistical indices such as RMSE and AIC. The greater scatter suggested that the LR 3 model struggled to generalize the relationship between input variables and penetration depth. Furthermore, all models exhibited some degree of underprediction, as indicated by the clustering of points below the diagonal line. This aligned with the negative CRM values from the statistical analysis, confirming that the models tend to underestimate the penetration depth. Overall, while the LR 1 model was the most accurate, the LR 3 model performed the worst. The results highlight the limitations of linear regression in capturing complex nonlinear relationships in seabed penetration depth prediction.
The scatter plots of the LR models used to predict the capacity of drag embedment anchors in the clay seabed are shown in Figure 6. The models LR 1, LR 2, LR 4, LR 5, and LR 6 showed impressive predictive capabilities, with their data points closely mirroring the diagonal line, indicating high accuracy. Notably, LR 1 stood out with the strongest correlation between predicted and actual values, solidifying its position as the top-performing model. In contrast, LR 3 demonstrated poor predictive power, characterized by significant deviations from the diagonal line and a wider scatter of data points, which aligns with its previously observed high error rate and low correlation coefficient. Hence, the results reaffirm that LR 1 is the most reliable model, while LR 3 is the least effective for predicting drag embedment anchor capacity in clay seabed.
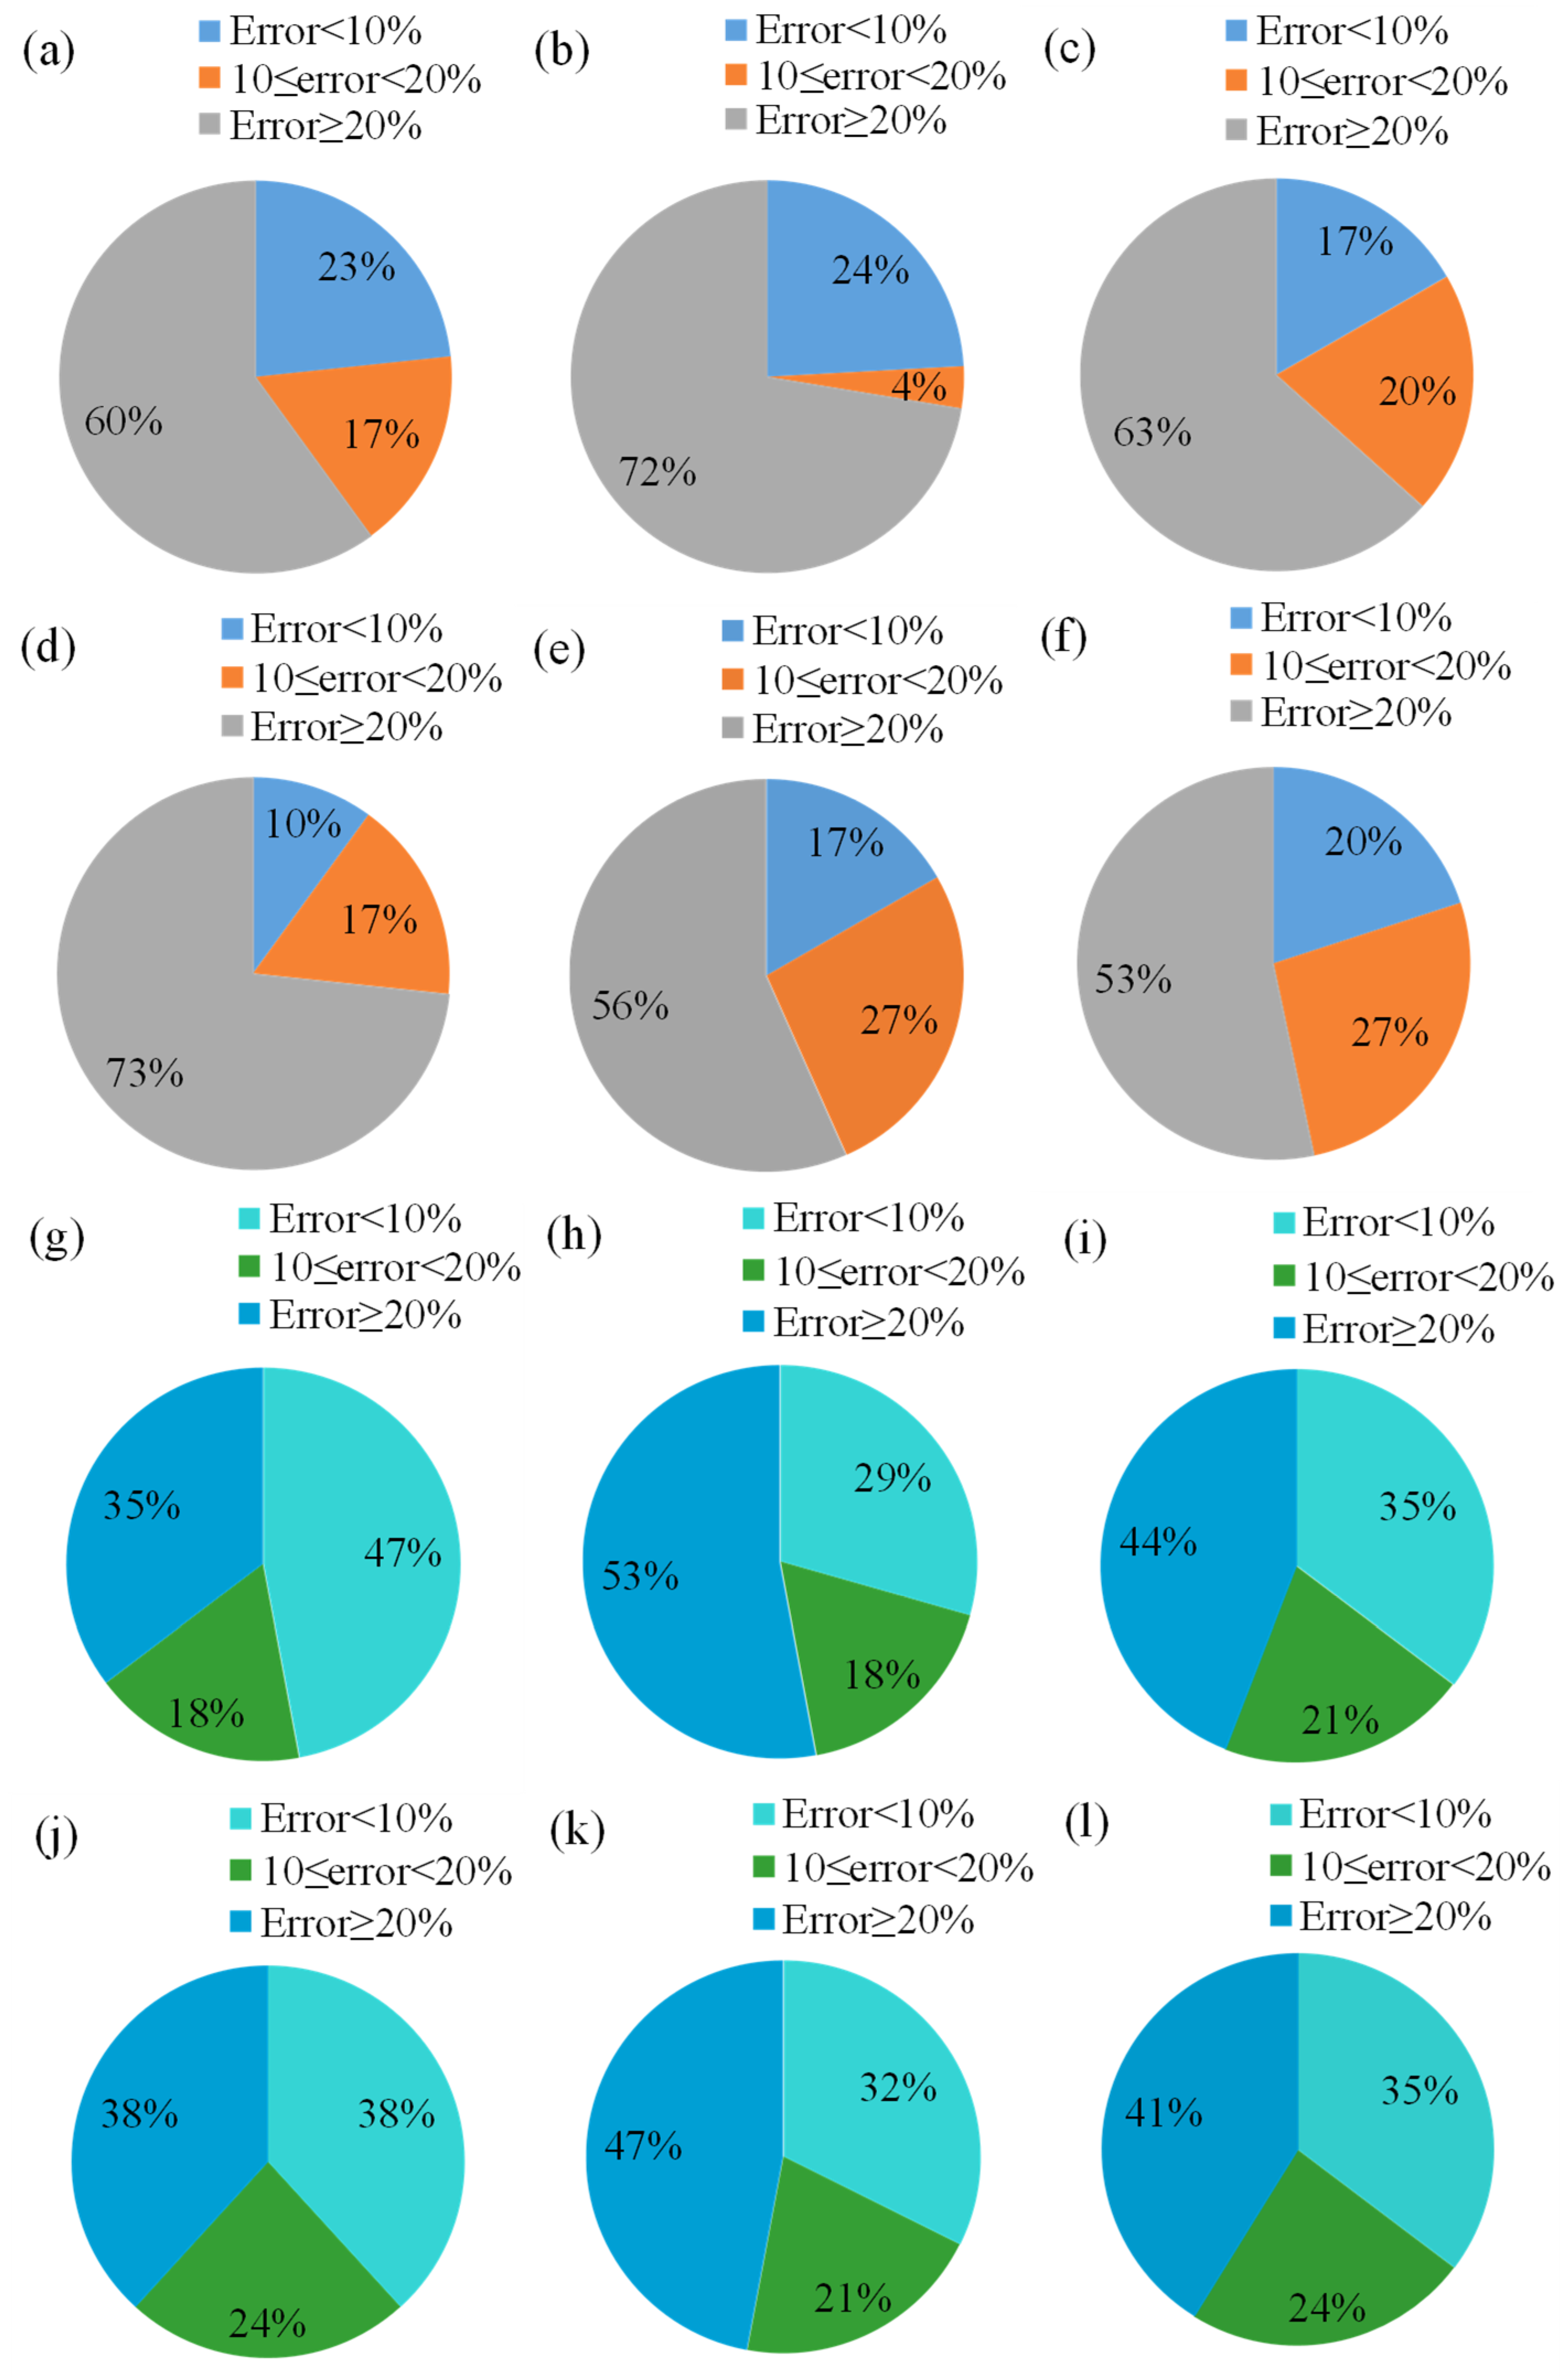
When examining the most accurate predictions (error < 10%), LR 2 slightly outperformed the others with 24% of its predictions falling within this range, followed by LR 1 (23%) and LR 6 (20%). LR 4 performed the worst in this category with only 10%. Mid-range errors (10–20%) varied across models, with LR 5 and LR 6 showing the highest at 27%, while LR 2 showed the least (4%), suggesting that LR 2 was more polarized between highly accurate and poor predictions. Based on the error distribution plots for LR 1 to LR 6 in predicting the penetration depth of drag embedment anchors in clay seabed, it could be concluded that LR 1 was the best-performing model in terms of error distribution. Among all six linear regression models, LR 1 exhibited a strong balance between prediction accuracy and error minimization. Specifically, LR 1 achieved 23% of predictions with an error less than 10%, which was among the highest across all models, and 17% of predictions within the 10–20% error range, indicating that 40% of its predictions fell within an acceptable error margin below 20%. LR 1 had a lower proportion of high-error predictions (≥20%) at 60%, compared to most other models, such as LR 2 (72%) and LR 4 (73%). While LR 6 slightly outperformed LR 1 in reducing high-error predictions (53%), LR 1 compensated by achieving a more favorable distribution in the low-error (<10%) category, closely rivaling LR 2 (24%) and surpassing LR 6 (20%). Given this analysis, LR 1 offered a reliable and well-rounded performance, combining a high percentage of accurate predictions with a moderate level of high-error outcomes. Therefore, LR 1 could be considered the most effective model for predicting penetration depth based on its superior error distribution profile.
Despite LR1’s relative superiority, a portion of its predictions exhibited errors greater than 10% due to both methodological and physical limitations. Linear regression inherently struggled to model the complex, nonlinear interactions that governed DEA behavior, such as plastic deformation, strain-softening, and soil–anchor interface dynamics. These simplifications introduced model bias, especially since real soil behavior, particularly in layered clay or dilative sand, was highly nonlinear, anisotropic, and spatially variable. Furthermore, while the use of Buckingham π groups reduced complexity, it assumed scale invariance and failed to capture critical interaction terms or second-order effects. Important factors such as anchor installation velocity, cyclic loading, soil heterogeneity, and time-dependent behaviors like consolidation were excluded. The dataset used to train the model was drawn from diverse experimental sources with different quality and scope, and it did not adequately represent the full parameter space, particularly under boundary or extreme conditions, thereby limiting the model’s generalization. Additionally, natural seabed conditions exhibited inherent uncertainty and spatial variability, meaning that parameters such as friction angle (φ), undrained shear strength (Su), and unit weight (γ) could vary significantly over small spatial scales, further contributing to prediction errors.
It is worth noting that the dataset used in this study was compiled from various experimental and analytical sources, which inherently differ in scope, boundary conditions, instrumentation precision, and reporting formats. These variations introduced noise and heterogeneity that challenged the linear regression (LR) models’ ability to learn consistent patterns. The inconsistency may arise from non-uniform data collection methods, variable anchor geometries, or different testing scales, which limit the generalization capability of the model. This is evident in the uncertainty analysis, where even the best-performing model (LR 1) exhibited (Table 5, Figure 6) that the training model is highly sensitive to the quality and representativeness of the input data.
Although the dimensional analysis provided a rigorous foundation using Buckingham’s π theorem, it assumes that all influential mechanisms are sufficiently captured by the selected parameters. However, omitting dynamic and time-dependent factors, e.g., installation velocity and soil anisotropy) may contribute to nonlinear interactions that the linear model cannot fully resolve. These limitations were further exacerbated by the following:
  • Scale differences among datasets;
  • Nonuniform boundary conditions in the source experiments;
  • Unmodeled nonlinearities, especially in clay, where strain-softening and progressive failure dominate;
Hence, the relatively low rate of <10% error predictions is more a reflection of dataset fragmentation and unmodeled interactions than of model structure alone. To improve prediction, accuracy, and reliability, future efforts will focus on the following:
  • Curating a high-fidelity, standardized experimental dataset for DEA performance under controlled conditions.
  • Including additional physical variables, such as installation velocity, cyclic load amplitude/frequency, and time-dependent consolidation, either directly or through surrogate dimensionless parameters.
  • Exploring hybrid modeling techniques, combining dimensional analysis with nonlinear machine learning (e.g., Random Forests, Support Vector Regression), to capture complex interactions beyond the capability of linear regression.
The LR 1 model had 47% of predictions with an error of less than 10%, 18% fell within the 10–20% range, and 35% had an error of greater than 20%. This model showed the highest percentage of highly accurate predictions. For the LR 2 model, only 29% of predictions were within <10% error, while 53% exceeded 20% error, the worst among all models. The LR 3 model showed a balanced distribution with 35% < 10% error, 21% between 10–20%, and 44% ≥ 20%. LR 4 presented an even distribution with 38% < 10%, 24% in 10–20%, and 38% ≥ 20%, indicating moderate accuracy. For the LR 5 model, 32% of predictions had less than 10% error, while 21% were in the mid-range, and 47% had ≥20% error. Furthermore, the LR 6 model was similar to LR 3, with 35% less than 10% error, 24% mid-range, and 41% higher than 20% error. Among the models, LR 1 outperformed the others, offering the lowest proportion of high-error predictions (35%) and the highest proportion of accurate predictions (47%), making it the most reliable for predicting anchor capacity. LR 2 performed the worst, with more than half its predictions exceeding 20% error. Models LR 3, LR 4, LR 5, and LR 6 displayed moderate performance but still had a significant portion of high-error predictions. Hence, LR 1 was the best-performing model, demonstrating both qualitative robustness and quantitative superiority in predicting drag embedment anchor capacity in clay seabed.
Table 5 represents the results of the uncertainty analysis for the LR models to predict the penetration depth and holding capacity of the drag embedment anchor in the clay seabed. All LR models showed mean values near zero, indicating minimal bias. LR 3 had the smallest mean error (−0.0016), followed closely by LR 5 (−0.0122) and LR 6 (−0.0291), while LR 4 had a slight positive bias (0.0143). These results suggested that all models were generally unbiased in their predictions. LR 1 had the lowest variability (30.50), indicating more consistent predictions, while LR 3 (31.44) and LR 6 (31.43) showed the highest variability. LR 1 had the narrowest 95% CI range (−11.44, 11.34), indicating greater precision, while LR 6 had the widest interval (−11.77, 11.71), reflecting higher uncertainty. LR 1 again had the smallest WUB (11.39), while LR 3 and LR 6 had the widest (11.74). LR 1 stood out as the most reliable model, with low variability, minimal uncertainty, and a tight confidence interval, reflecting high precision and consistency in its predictions. Conversely, LR 6 and LR 3 exhibited greater uncertainty and variability, making them less consistent. So, this analysis suggested that LR 1 provided the most stable and precise predictions for penetration depth in clay seabed among the six models evaluated.
For estimating the capacity of DEA in the clay seabed, the LR 1 model possessed a mean error of −4,332,392, which, while negative, was within an acceptable range compared to other models. It performed better than LR 3 (−15,376,462) and was relatively close to LR 2, LR 5, and LR 6 in terms of error magnitude. The standard deviation for the LR 1 model was 5,404,922, which was moderate and indicates a reasonable level of consistency in its predictions. It was higher than LR 4 but comparable to LR 5 and LR 6, and notably lower than LR 3. LR 1 had a CI of (−6,218,258 to −2,446,525), which was moderately narrow, indicating a good level of confidence in its prediction range. Its WUB was 1,885,867, while higher than LR 4.

3.2. Sandy Seabed

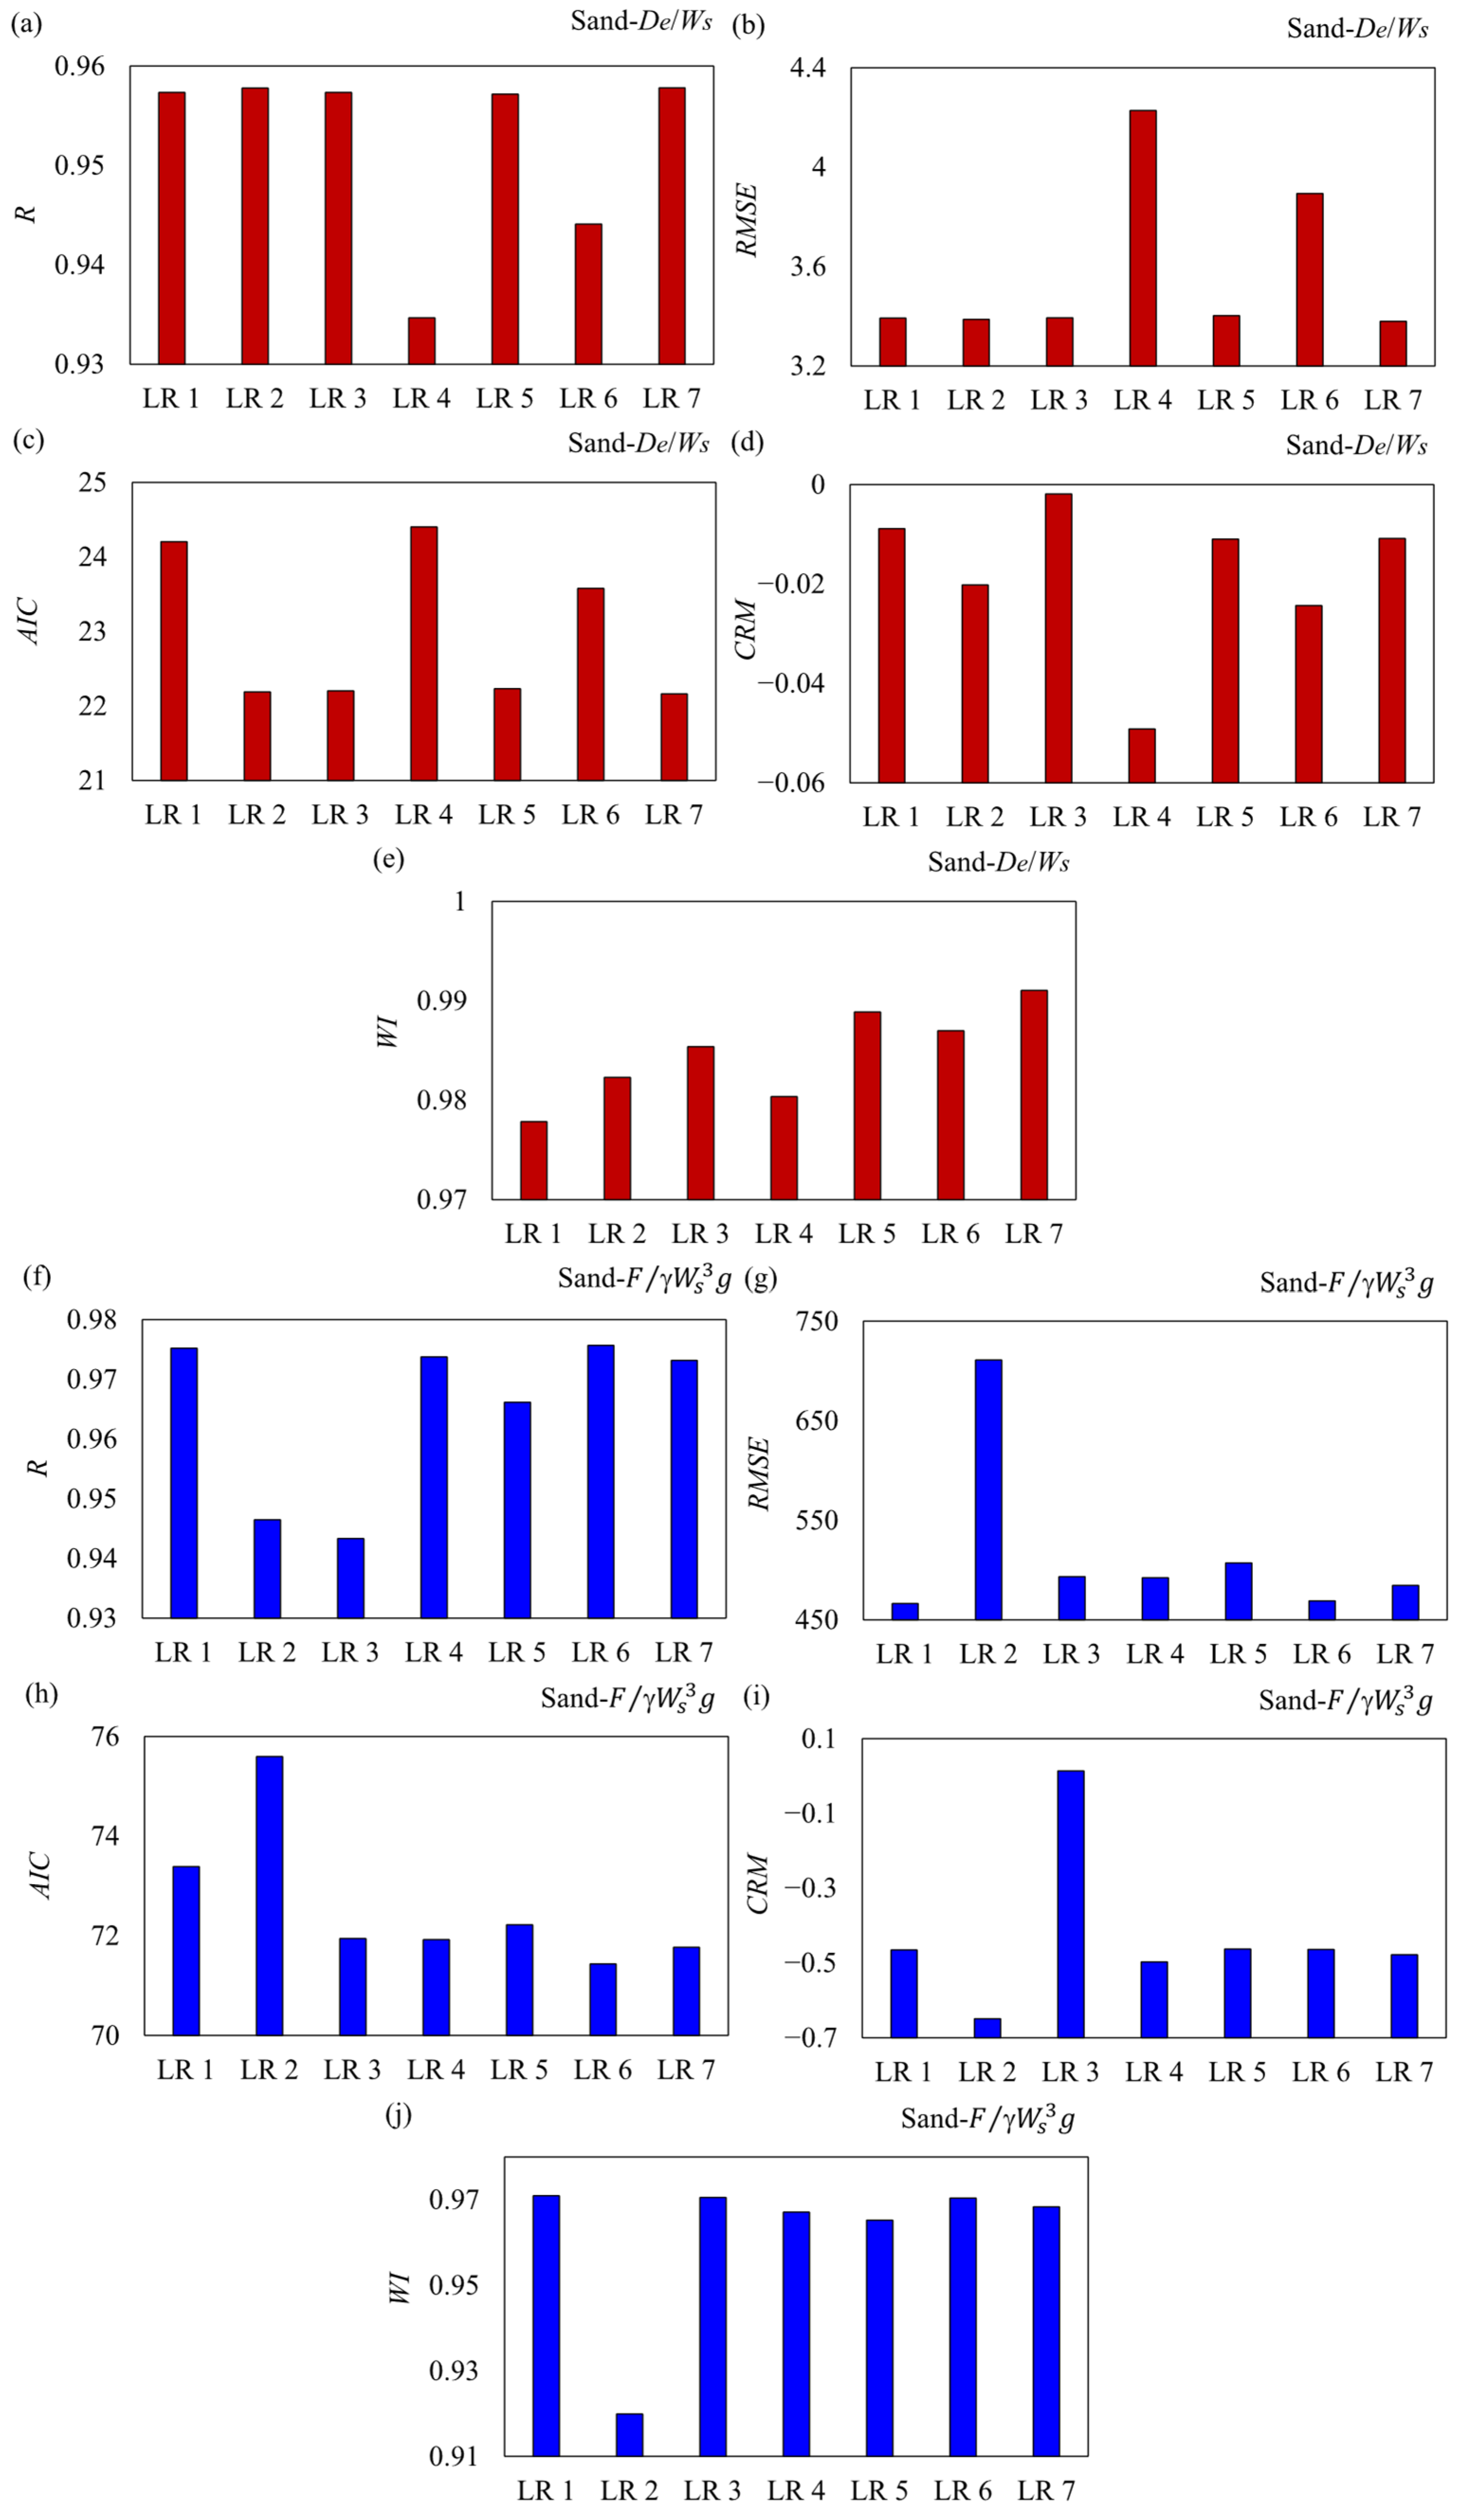
Figure 7 demonstrates the results of the statistical indices calculated for the LR models to predict the penetration depth of drag embedment anchors in the sand seabed. To predict the penetration depth in the clay seabed by the LR 1 model, all input parameters W f W s ,   L s W s ,   L f W s ,   W d γ · W s 3 · g ,   φ ,   ψ were applied, whereas these inputs were, respectively, eliminated one by one for LR 2 to LR 7. The analysis revealed that LR 1 and LR 2 achieved the highest R metric of 0.96, indicating a strong correlation with the actual data. However, LR 4 had the lowest R criterion of 0.93, suggesting weaker predictive performance and an inability to effectively capture the relationship between input parameters and the target variable. In terms of prediction accuracy, LR 1 achieved an RMSE of 3.39, which was slightly higher than LR 2’s RMSE of 3.2. While LR 2 had the lowest RMSE, LR 1 still demonstrated strong predictive accuracy, with errors significantly lower than LR 4, which had the highest RMSE of 4.2. This further confirmed LR 4’s poor performance, as reflected in its higher prediction errors. When evaluating model optimization, LR 1 exhibited an AIC value of 24.2, which was slightly higher than LR 2 and LR 3 (AIC = 22). However, LR 1’s AIC value was still lower than LR 4’s AIC of 25, indicating that LR 1 was well-optimized with minimal overfitting compared to LR 4, which showed signs of poor data representation. In terms of bias, LR 1 achieved a CRM of −0.0089, indicating a negligible underestimation of the target value. This performance was comparable to LR 2, which had a CRM of 0.00 (no bias), and significantly better than LR 4, which had the most negative CRM of −0.05, reflecting a substantial underestimation of the target value. This highlighted LR 1 as a balanced and reliable model. Finally, LR 1 achieved a WI value of 0.978, demonstrating excellent agreement with the actual data. While LR 2, LR 3, LR 6, and LR 7 achieved a slightly higher WI of 0.99, LR 1’s WI was still significantly better than LR 4’s WI of 0.97, which confirmed its poor agreement with the actual data.
Therefore, the quantitative analysis indicated that LR 1 was one of the most accurate and reliable models, demonstrating a strong correlation (R = 0.96), low prediction error (RMSE = 3.39), minimal bias (CRM = −0.0089), and excellent agreement with the actual data (WI = 0.978). While LR 2 performed slightly better in some metrics, LR 1 consistently outperformed LR 4, which showed high error, significant underestimation, and poor agreement. Therefore, LR 1 can be considered the best model for predicting the target value, particularly when considering its overall balance of performance across all metrics. The sensitivity analysis showed that the anchor dead weight ratio ( W d S u · W s 2 ) was identified as the most influential input parameter to model the penetration depth of DEA in the sand seabed.
Regarding the performed sensitivity analysis, the best LR model predicting drag embedment anchor penetration in sand seabed showed that the anchor dead weight ratio (Wd/SuWs2) was the most influential dimensionless parameter. The shank length ratio (Ls/Ws), fluke length ratio (Lf/Ws), peak friction angle (φ), dilation angle (ψ), and fluke width ratio (Wf/Ws) followed in descending order. These findings illustrated the critical role of geometric and geotechnical factors in anchor penetration and offered valuable insights for optimizing anchor design and performance in the sand seabed.
As per the simulation results, LR 1 demonstrated the highest R index of 0.975, indicating the strongest predictive capability and correlation with the target variable. In comparison, LR 5 and LR 7 achieved slightly lower R values of 0.973, while LR 2 exhibited the weakest correlation with an R index of approximately 0.93, reflecting lower accuracy in capturing the relationship between input features and the target variable. In terms of prediction accuracy, LR 1 achieved an RMSE of 466.51, which was significantly lower than LR 2’s RMSE of 711, the highest among all models. This indicates that LR 1 minimized prediction errors more effectively than LR 2, which showed significant errors and poor performance. While LR 3, LR 4, and LR 5 also demonstrated relatively low RMSE values (around 450), LR 1’s RMSE was competitive and reflected strong predictive accuracy. When evaluating model fit and complexity, LR 1 achieved an AIC value of 73.38, which was lower than LR 2’s AIC of 76 (indicating poor fit and potential overfitting) and comparable to the optimal AIC values of LR 3, LR 4, and LR 5 (around 71–72). This suggests that LR 1 was well-optimized with minimal overfitting and balanced complexity. In terms of bias, LR 1 exhibited a CRM value of −0.465, indicating a slight underestimation of the target variable. While this was higher than the near-zero CRM values of LR 5, LR 6, and LR 7, it was significantly better than LR 2 and LR 4, which showed strong underestimation with CRM values of approximately −0.6. LR 3 exhibited a positive CRM of 0.1, indicating slight overestimation. Despite its slight underestimation, LR 1 demonstrated a relatively balanced performance in terms of bias. Finally, LR 1 achieved a WI value of 0.971, indicating excellent agreement with the actual data. This was among the highest WI values, alongside LR 5, LR 6, and LR 7, which also achieved WI values of approximately 0.97. In contrast, LR 2 exhibited the lowest WI value of 0.92, reflecting poor agreement and weak performance.
Thus, the quantitative analysis revealed that LR 1 was the best-performing model, demonstrating the highest correlation (R = 0.975), low prediction error (RMSE = 466.51), minimal overfitting (AIC = 73.38), and excellent agreement with the actual data (WI = 0.971). While LR 5 and LR 7 also performed well, LR 1 consistently outperformed LR 2, which showed high error, strong underestimation, and poor agreement. Therefore, LR 1 can be considered the most accurate and reliable model for predicting the target value, based on its overall balance of performance across all metrics. Regarding the sensitivity analysis, the friction angle (φ) was the most significant input parameter to estimate the holding capacity of the DEA in the sand seabed.
Based on the sensitivity analysis, the linear regression modeling for drag embedment anchor holding capacity in sand seabed indicated that sand friction angle (φ) was the strongest predictor. Moreover, dilation angle (ψ), fluke length ratio (Lf/Ws), anchor dead weight ratio (Wd/(Su·Ws2), fluke width ratio (Wf/Ws), and shank length ratio (Ls/Ws) significantly influenced the model performance. Both soil properties and anchor geometry were crucial for modeling anchor holding capacity in the sand seabed.
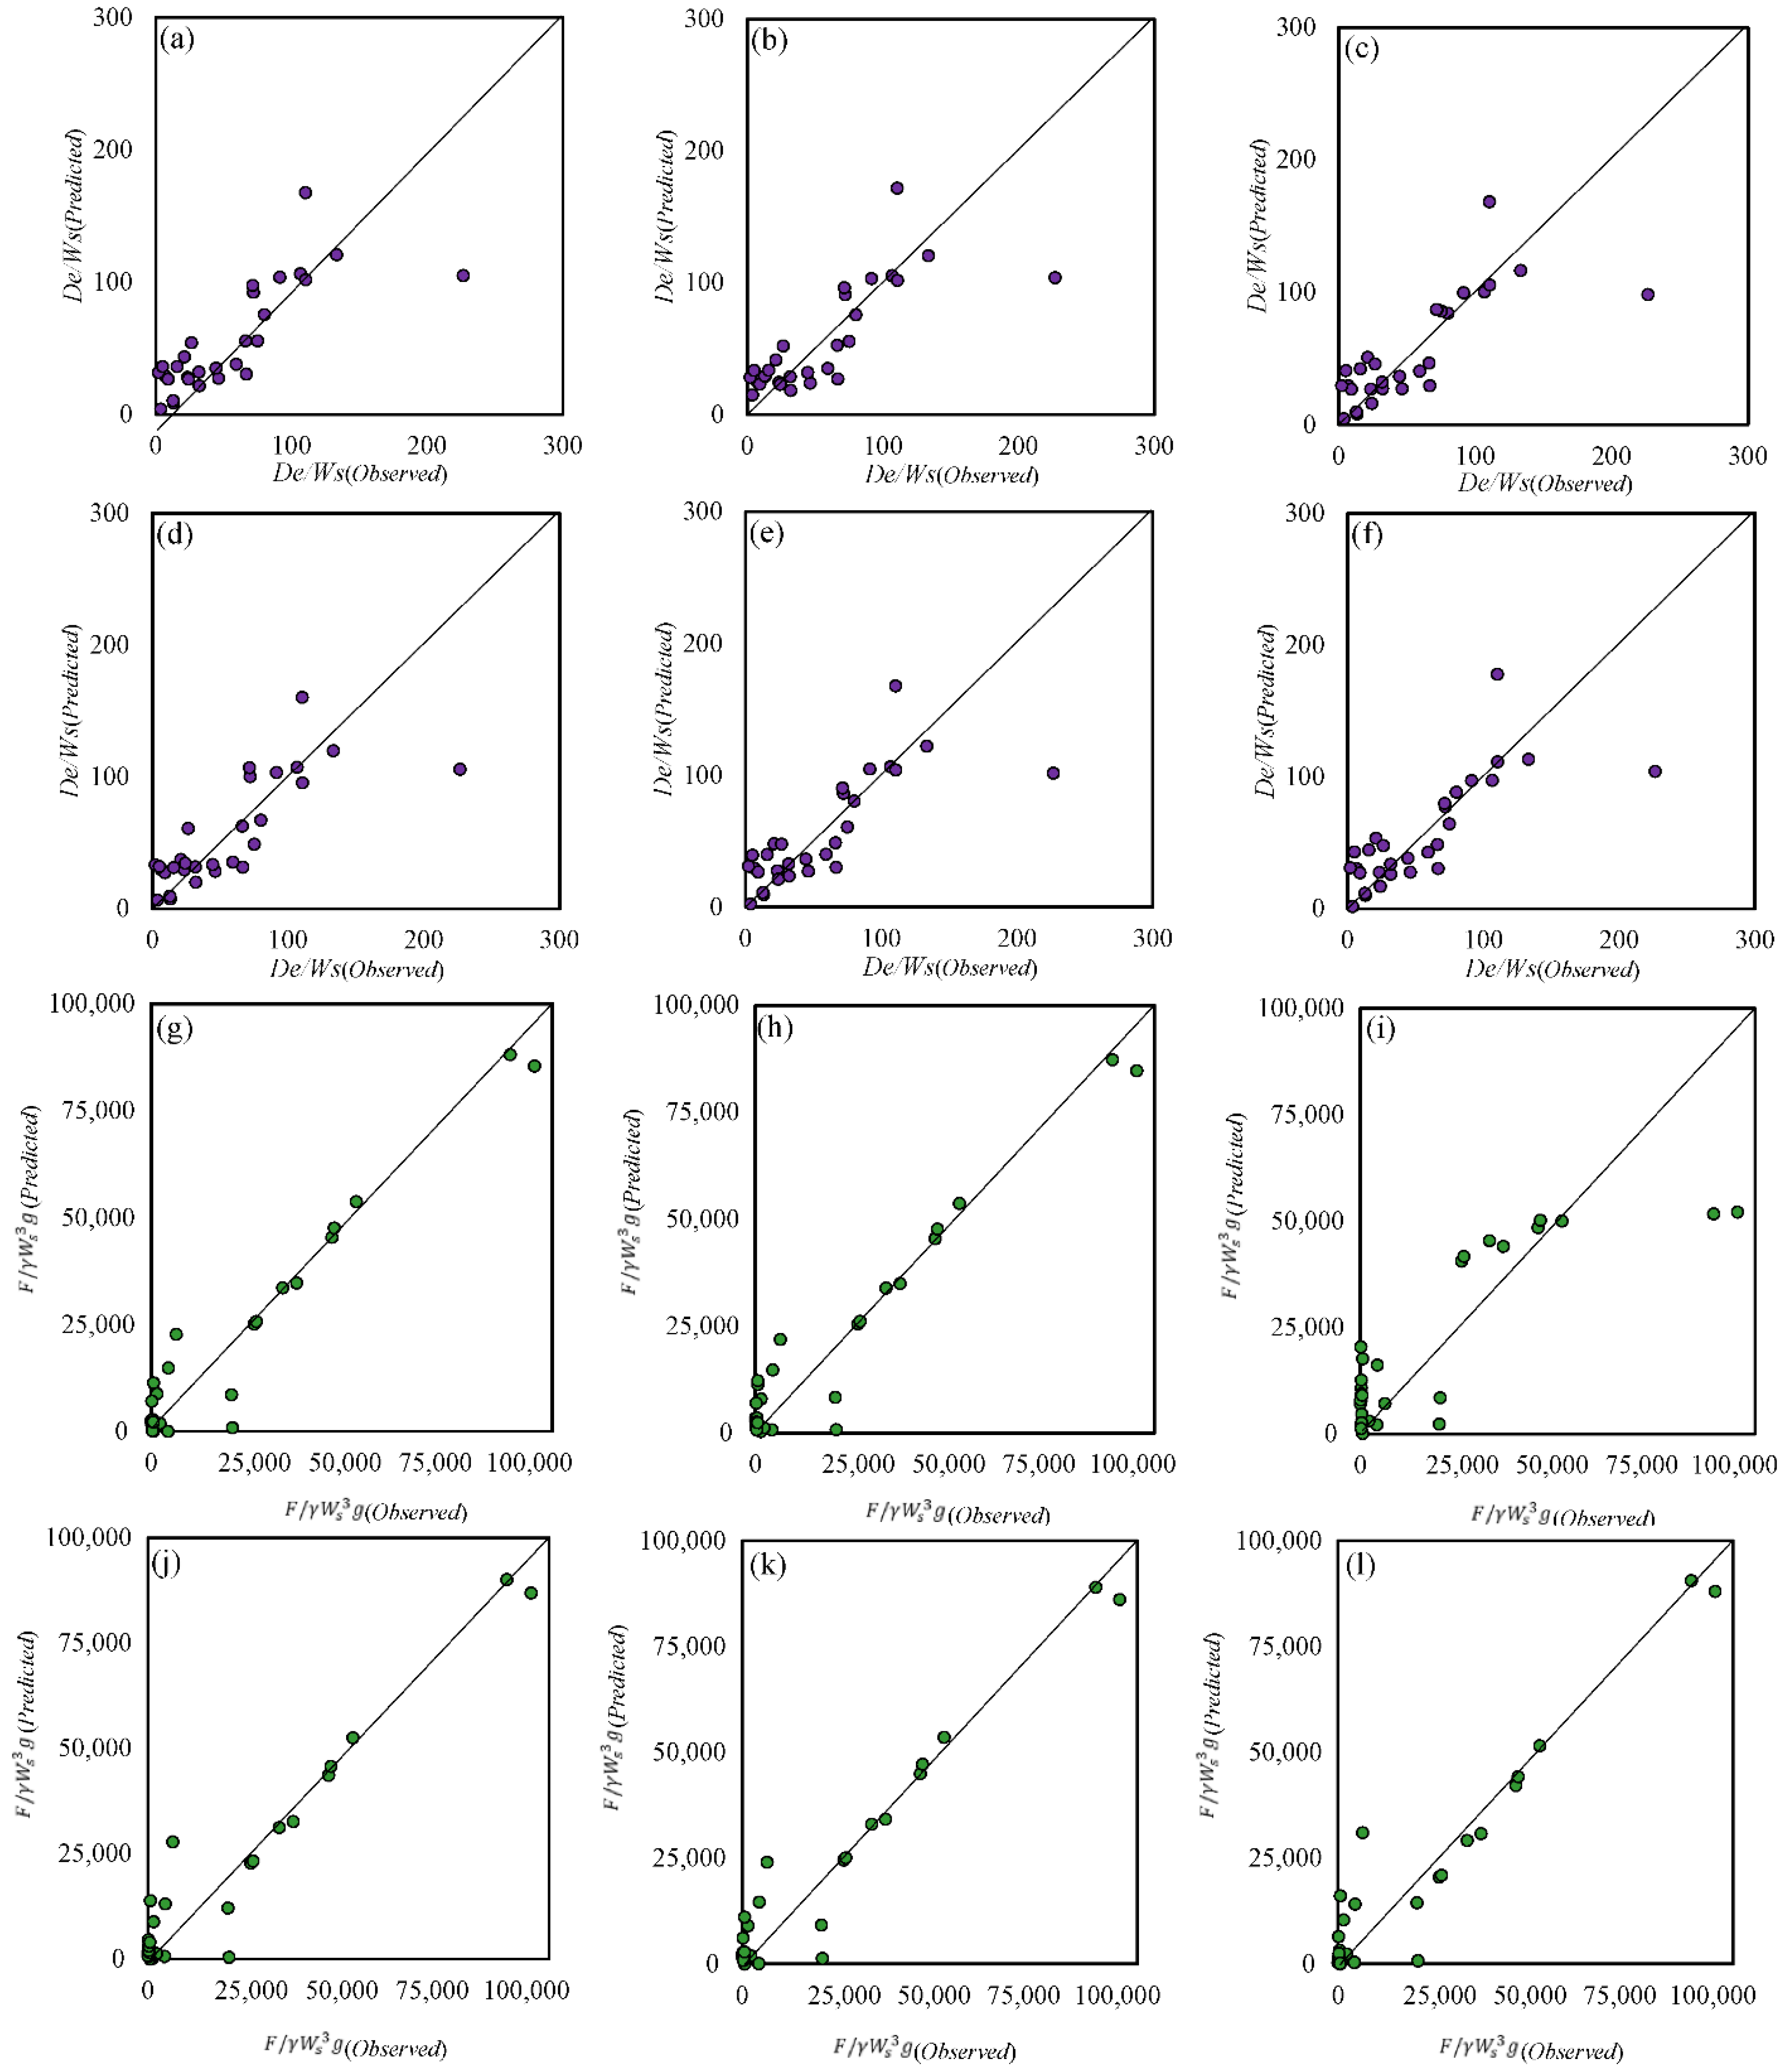
The scatter plots in Figure 8 display the comparison between observed and predicted values of the penetration depth-to-weight ratio (De/Ws) for the LR models (LR 1 to LR 7). The scatter plot for LR 1 showed the data points were more closely clustered around the diagonal line, indicating better accuracy and minimal deviation between observed and predicted values. Other models, especially LR 2 and LR 4, exhibited higher scatter and more deviation from the diagonal line, suggesting poorer prediction accuracy. LR 1 and LR 7 demonstrated a more balanced distribution around the diagonal line, showing that the model captured both lower and higher values effectively. In contrast, the LR 3 and LR 5 models tended to overestimate or underestimate the penetration depth in certain regions. LR 1 exhibited fewer outliers and tighter clustering of data points, while LR 2 and LR 4 had several data points deviating far from the ideal line, which indicated higher error margins. LR 1 showed the highest correlation coefficient, approximately 0.96, indicating a strong linear relationship between observed and predicted values. Other models, such as LR 2 and LR 4, had lower R values, around 0.93–0.94, reflecting weaker correlations. Hence, the LR 1 model outperformed the other models in terms of correlation, accuracy, and bias minimization. The scatter plot for LR 1 showed better clustering around the diagonal line, while the quantitative metrics confirmed the highest correlation coefficient and the lowest RMSE. Therefore, LR 1 was the most reliable and accurate model for predicting the penetration depth in the sand seabed.
For the anchor holding capacity in the sand seabed predicted by LR 1, the predicted values were closely aligned with the diagonal line, with minimal deviation and a strong agreement between the observed and predicted values. However, the LR 2 and LR 4 models showed greater dispersion from the diagonal line, indicating poorer predictive performance. It was worth noting that the LR 1 model displayed tight clustering around the ideal line, reflecting better accuracy and consistency, whereas models like LR 3 and LR 5 exhibited scattered points with higher variance, leading to less reliable predictions. LR 1 exhibited fewer outliers and less spread in the data points, while LR 4 and LR 6 showed significant deviations from the diagonal, which increased the error rate. So, the LR 1 model presented the highest degree of correlation coefficient, with a strong linear relationship between observed and predicted values.
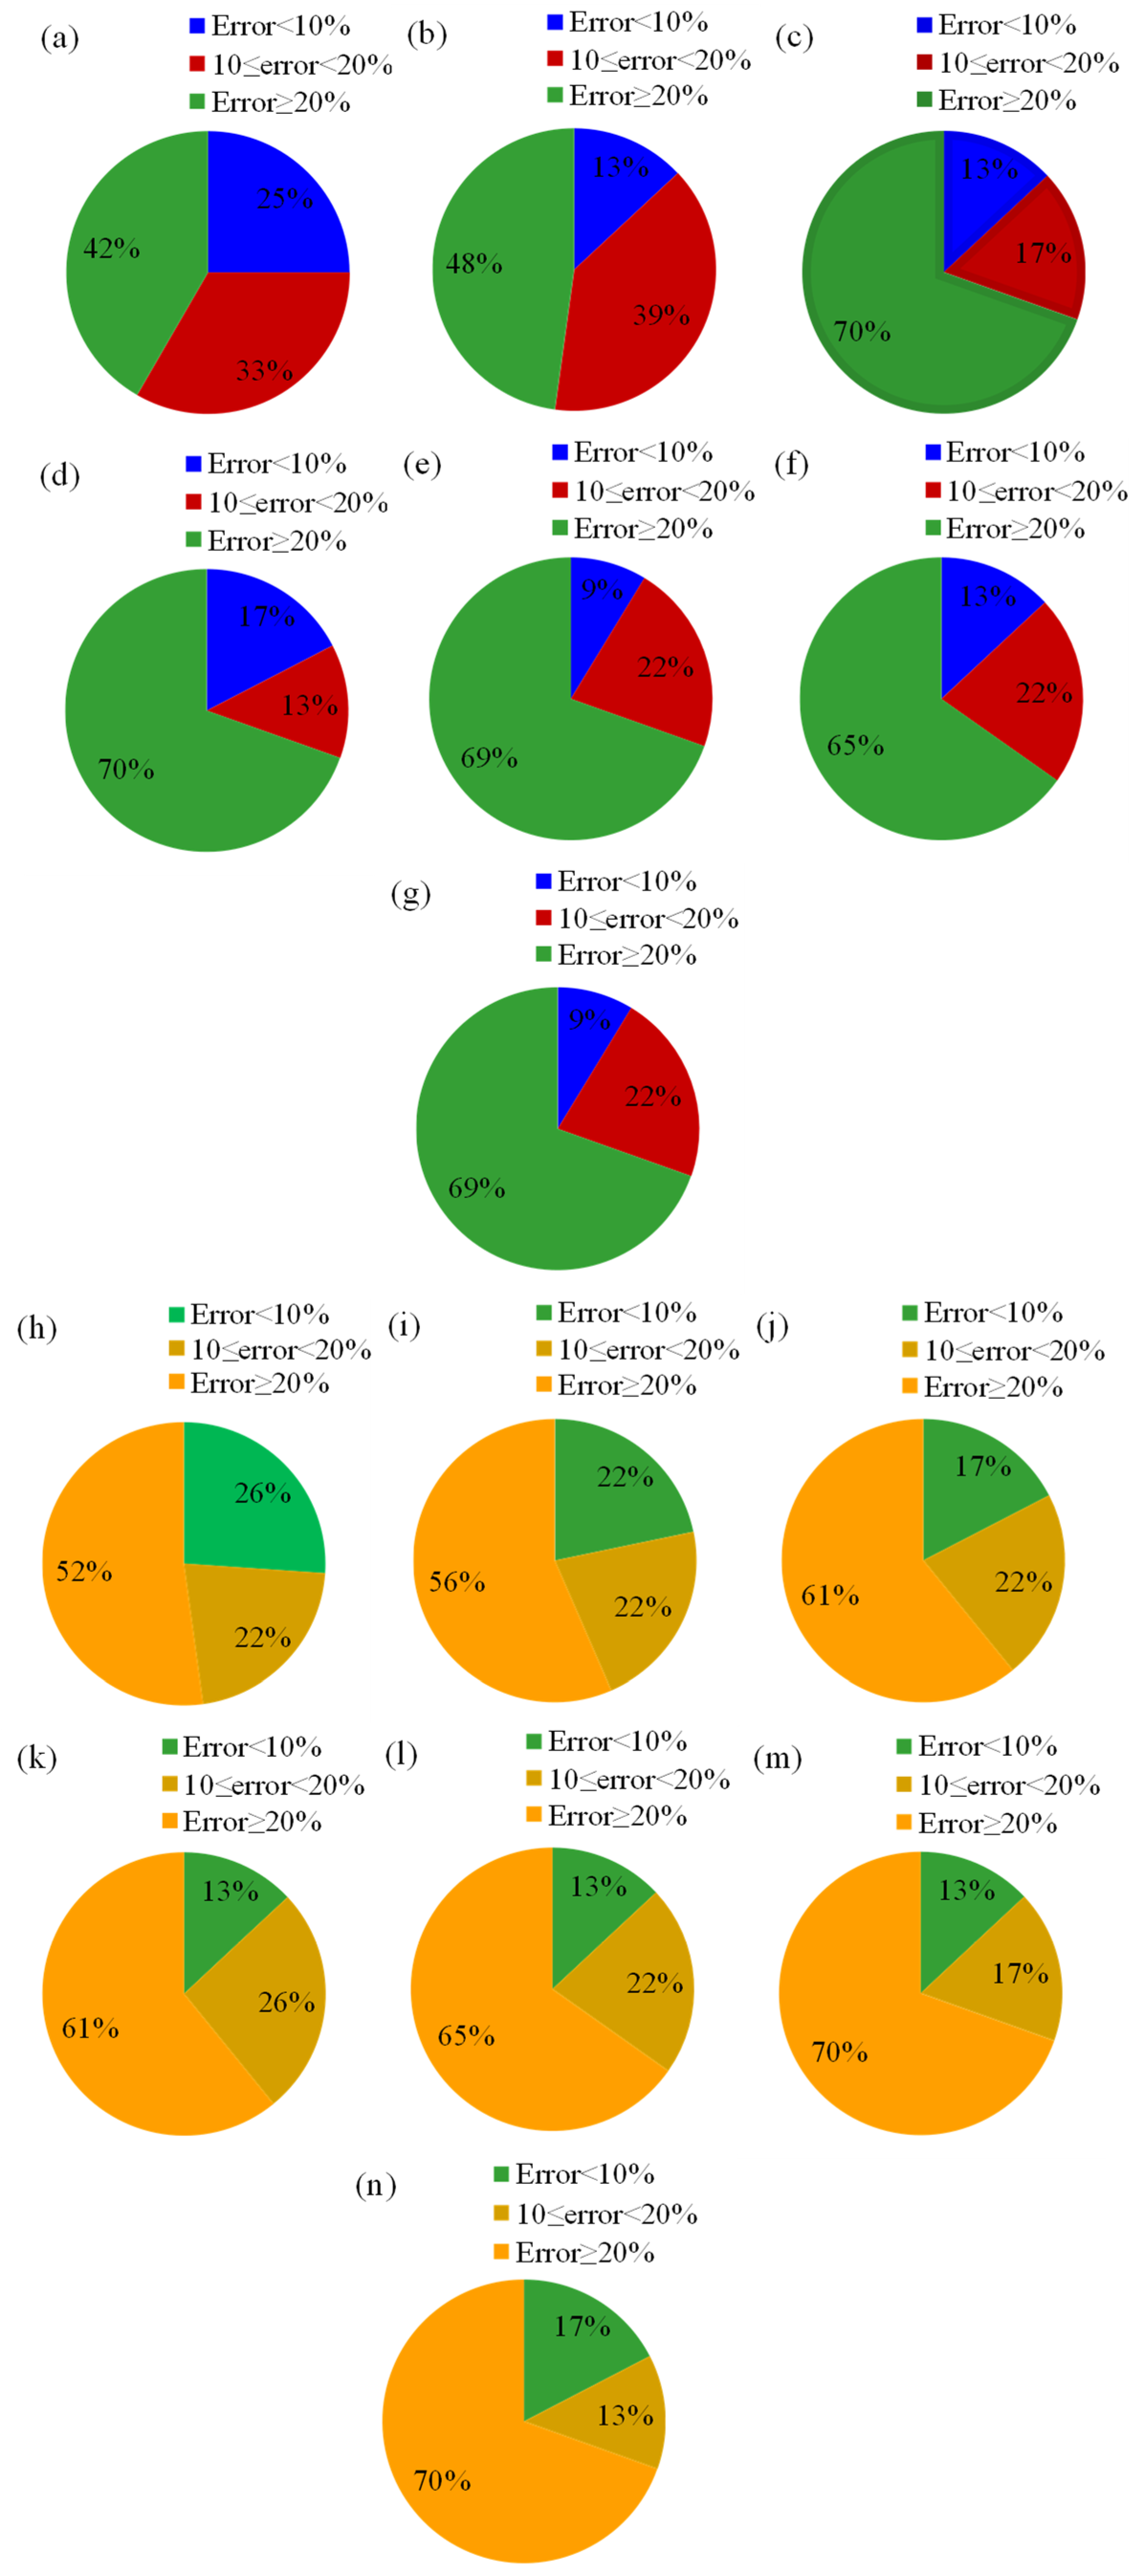
Figure 9 shows the error distribution of the LR models for the estimation of the penetration depth of drag embedment anchors in the sand seabed. Amongst the LR models, the LR 1 model showed the best performance, with 25% of predictions falling within 10% error, 33% within 10–20% error, and 42% exceeding 20% error, with better generalization and higher accuracy compared to other models. On the other hand, the LR 3, LR 4, and LR 5 models exhibited the worst performance, with 70% of errors exceeding 20%, suggesting that these models struggled to capture the complex nonlinear relationship between input variables and penetration depth. LR 2 showed moderate performance, with 13% of predictions within 10% error and 48% exceeding 20% error, while LR 6 and LR 7 showed similar patterns, with only 9% of predictions within 10% error, 22% within 10–20% error, and 69% exceeding 20% error, reflecting their limited predictive capability. The high error rates in these models may have been due to the presence of outliers, poor feature selection, or the inherent limitations of linear regression in handling complex seabed-anchor interactions. The fact that LR 1 had the highest correlation coefficient, as demonstrated in previous scatter plots, aligned with its superior error distribution, further confirming its reliability and accuracy in predicting the penetration depth. Thus, the LR 1 model was considered the most effective model among the seven, as it achieved the lowest error distribution and the highest correlation coefficient, making it the most suitable for practical applications in predicting anchor performance in the sand seabed.
For predicting the drag embedment anchor capacity in the sand seabed, a significant proportion of errors fell in the highest error category (≥20%) for most models, suggesting that while the LR models captured some trends in anchor capacity, they exhibited considerable prediction inaccuracies. For instance, models LR 6 and LR 7 showed the highest proportion of errors exceeding 20% (around 70%), whereas models LR 1 and LR 2 performed relatively better with lower percentages of high-error predictions (52% and 56%, respectively). This indicated that simpler linear regression models struggled with capturing the complex nonlinear relationships governing drag embedment anchor behavior in the sandy seabed. The variability in error distributions across different models suggested that some LR models may have benefited from refined parameter selection, improved feature engineering, or the inclusion of nonlinear or interaction terms to enhance predictive accuracy. Additionally, the relatively small proportion of low-error predictions (error < 10%) across all models implied that LR-based approaches alone may not have been sufficient for precise capacity prediction. More sophisticated machine learning models, such as neural networks or ensemble methods, could have potentially improved predictive accuracy by capturing complex dependencies between input parameters and anchor capacity more effectively. In conclusion, LR 1 was the best model in terms of error distribution, with the lowest proportion of high-error predictions and a relatively higher proportion of low-error predictions.
Table 6 demonstrates the results of the uncertainty analysis for the LR models to predict the penetration depth and anchor capacity in the sand seabed. LR 1 was the best-performing model based on the uncertainty analysis, with an underestimating performance. It had a mean close to zero (−0.095), with minimal bias, and a low standard deviation (3.47), along with a narrow WUB (1.5), indicating low uncertainty. LR 4 and LR 6 were the least reliable models due to higher standard deviations (4.29 and 3.97, respectively), wider WUB values (1.855 and 1.722, respectively), and wider confidence intervals (−2.381, 1.329 and −1.987, 1.457). LR 2, LR 3, LR 5, and LR 7 also performed well, with low standard deviations, narrow WUB values, and narrow confidence intervals. However, LR 1 stood out as the most reliable and precise model overall. Thus, the uncertainty analysis confirmed that LR 1 was the most reliable and precise model for predicting the penetration depth of a drag embedment anchor in a sand seabed. It demonstrated minimal bias, consistent predictions, low uncertainty, and high precision, making it the best choice for that application. Models like LR 4 and LR 6 should have been avoided due to their higher variability and uncertainty.
For the prediction of the drag embedment anchor capacity in the sand seabed, the mean values for most LR models were negative, indicating that the models tended to underestimate penetration depth. The standard deviation was relatively high across all models, particularly for LR 2 (613.14) and LR 3 (504.49), suggesting significant variability in predictions. LR 3 was the only model with a positive mean value, indicating occasional overestimation. Models with higher standard deviations exhibited greater uncertainty in their predictions, reflecting inconsistencies in model performance. LR 2 had the highest WUB (265), indicating substantial uncertainty, while LR 1 and LR 6 had lower WUB values (167 and 168.5, respectively), suggesting relatively more stable predictions. The models with more negative mean values (e.g., LR 2) tended to have higher WUBs, indicating that stronger underestimation was associated with greater uncertainty. LR 2 had the widest interval (−647 to −117), indicating the greatest uncertainty, while LR 3 had a wide but more balanced range (−210 to 226), reflecting both underestimation and overestimation. Most models had consistently negative confidence intervals, reinforcing the tendency toward underestimation. A wider confidence interval suggested lower reliability, while narrower intervals indicated greater confidence in predictions.
The present study highlighted critical advancements in offshore mooring technology by addressing a key engineering challenge: predicting the performance of DEAs with scientific rigor. By developing first-of-their-kind LR models and applying Buckingham’s theorem, the study provided a data-driven, dimensionless framework to accurately estimate penetration depth and holding capacity in both clay and sand seabed, essential for ensuring structural stability and safety of floating offshore structures. The integration of sensitivity, error, and uncertainty analyses further validated the models’ reliability, offering engineers a practical, efficient tool to optimize DEA design and deployment across diverse marine environments. This mattered because of the following factors:
-
Safety and reliability: Accurate predictions prevent anchor failure, crucial for offshore operations.
-
Innovation: First explicit LR models for DEAs, bridging theory and practice (see Appendix A).
-
Broad applicability: Validated for both clay and sand, covering major seabed types.
-
Efficiency: Simplified complex geotechnical calculations into actionable engineering tools.
This work directly supported cost-effective, safer offshore energy infrastructure, e.g., wind farms, platforms, ships, etc.

4. Conclusions

In this study, the dimensionless groups of parameters affecting the penetration depth and holding capacity of the drag embedment anchors (DEAs) in clay and sand seabed were identified by using Buckingham’s theorem and linear regression (LR) analysis for the first time. Utilizing the dimensionless groups of parameters, six LR models in clay condition and seven LR models in sand condition were developed, and the LR models were validated with experimental values. Afterward, the sensitivity, error, and uncertainty analyses were implemented for the LR models, and the superior LR models, along with the most impactful input parameters, were detected. Finally, a set of explicit LR-based equations was proposed to predict the objective parameters in practical applications, particularly in the early phases of offshore structure design investigations. The most significant results of the current study are summarized below:
  • The LR 1 model, as a function of all input parameters, was the best model to predict the penetration depth and holding capacity of DEAs in the clay seabed.
  • Sensitivity analysis proved that the anchor dead weight ratio ( W d S u · W s 2 ) had the highest level of influence in modeling the DEA’s penetration depth and holding capacity.
  • Similar to the clay seabed, LR 1 was known as the superior LR model with which to simulate the penetration depth and holding capacity of anchors in sand seabed.
  • LR1 incorporated all relevant dimensionless parameters derived via Buckingham π theorem, which theoretically ensured that the model accounted for the complete set of physically significant variables. By including all soil, geometric, and loading properties, LR1 was better able to represent the actual physics of DEA embedment and resistance in soils, e.g., LR1 consistently outperformed all other LR models across statistical and uncertainty criteria. The most physically impactful variables, such as Wd/Su⋅Ws2 and φ, were found to be key drivers of anchor behavior, so LR1 included these, making it both data-informed and physics-consistent. Hence, LR1 was noy only best due to empirical fit but because it was the only model respecting the full physical dimensional framework and validated through robust statistical and uncertainty analysis.
  • Regarding the performed sensitivity analysis, anchor dead weight ratio and sand friction angle (φ) were recognized as the most significant input parameters with which to predict the target functions in the sand seabed.
  • The superior LR models had the highest level of correlation and accuracy, and the lowest level of complexity.
  • The error analysis demonstrated that almost a quarter of the penetration depth in clay predicted by the LR 1 model had an error of less than 10%, whereas this percentage for the holding capacity was roughly 50%.
  • The best LR model (LR 1) showed an underestimating performance with the narrowest uncertainty bound to model the penetration depth in clay seabed.
  • The values of R, AIC, and RMSE used by the best LR model (LR1) to predict the holding capacity in sand seabed were 0.975, 73.383, and 466.511, respectively.
This study successfully established a novel dimensionless framework, using Buckingham’s theorem and LR analysis to predict the depth and holding capacity of DEAs in clay and sand seabed. The proposed LR-based equations offer a practical tool for early-stage offshore design, with error analyses confirming reliability. These findings bridge critical gaps in DEA performance prediction, enabling the development of safer and more efficient mooring systems. Future studies could investigate DEA behavior in layered seabed, dynamic loading effects, and machine learning enhancements, as well as field validation, anchor geometry optimization, climate change resilience, and integration with digital twins, laying the groundwork for next-generation anchor design and potentially transforming these models into industry standards for offshore geotechnics.

Author Contributions

Conceptualization, H.S.; Methodology, M.O. and H.A.; Software, M.O.; Validation, M.O. and H.A.; Formal analysis, M.O.; Investigation, M.O.; Resources, H.S.; Data curation, M.O. and H.A.; Writing—original draft, M.O.; Writing—review and editing, H.A. and H.S.; Visualization, M.O.; Supervision, H.S.; Project administration, H.S.; Funding acquisition, H.S. All authors have read and agreed to the published version of the manuscript.

Funding

This research received no external funding.

Data Availability Statement

The original contributions presented in this study are included in the article. Further inquiries can be directed to the corresponding author.

Acknowledgments

The authors respectfully acknowledge the support of Natural Sciences and Engineering Research Council of Canada (NSERC) through Discovery funding program. The provision of facilities and the funding support provided by Memorial University via School of Graduate Studies is also appreciated.

Conflicts of Interest

The authors declare no conflict of interest.

Appendix A

Table A1 shows the explicit LR-based model for the estimation of the penetration depth and holding capacity of the DEA in clay and sand seabed.
Table A1. Explicit LR-based model for the estimation of the penetration depth and holding capacity of the DEA in clay and sand seabed.
ClayLR 1De/Ws = |3.46 Wf/Ws + 1.82 Ls/Ws + 4.62 Lf/Ws − 0.774 Wd/Su·Ws2 − 1.38 k·Lf/Su|(A1)
LR 2De/Ws = |−5.6 + 3.26 Wf/Ws + 1.58 Ls/Ws + 5.43 Lf/Ws − 0.750 Wd/Su·Ws2|(A2)
LR 3De/Ws = |−7.7 + 0.87 Wf/Ws − 1.34 Ls/Ws + 10.26 Lf/Ws − 1.31 k·Lf/Su|(A3)
LR 4De/Ws = |7.5 + 5.35 Wf/Ws + 4.12 Ls/Ws − 1.122 Wd/Su·Ws2 − 1.52 k·Lf/Su|(A4)
LR 5De/Ws = |−3.8 + 2.23 Wf/Ws + 7.77 Lf/Ws − 0.509 Wd/Su·Ws2 − 1.32 k·Lf/Su|(A5)
LR 6De/Ws = |−8.5 − 1.40 Ls/Ws + 11.38 Lf/Ws − 0.204 Wd/Su·Ws2 − 1.25 k·Lf/Su|(A6)
LR 1F/Su·Ws2 = |655 + 1034 Wf/Ws + 225 Ls/Ws − 1492 Lf/Ws + 925.2 Wd/Su·Ws2 − 53.6 k·Lf/Su|(A7)
LR 2F/Su·Ws2 = |−230 + 1117 Wf/Ws + 328 Ls/Ws − 1579 Lf/Ws + 903.7 Wd/Su·Ws2|(A8)
LR 3F/Su·Ws2 = |8623 + 3900 Wf/Ws + 4140 Ls/Ws − 7711 Lf/Ws − 8.8 k·Lf/Su|(A9)
LR 4F/Su·Ws2 = |−2229 + 534 Wf/Ws − 502 Ls/Ws + 1014.2 Wd/Su·Ws2 − 56.2 k·Lf/Su|(A9)
LR 5F/Su·Ws2 = |210 + 927 Wf/Ws − 1135 Lf/Ws + 952.8 Wd/Su·Ws2 − 55.1 k·Lf/Su|(A10)
LR 6F/Su·Ws2 = |−1608 − 607 Ls/Ws + 418 Lf/Ws + 1081.7 Wd/Su·Ws2 − 62.9 k·Lf/Su|(A11)
SandLR 1De/Ws = |−5.54 + 0.55 Wf/Ws + 1.099 Ls/Ws − 0.72 Lf/Ws + 0.0643 Wd/g·Ws3·g + 2.8 φ − 6.7 ψ|(A12)
LR 2De/Ws = |−8.01 + 0.70 Wf/Ws + 1.114 Ls/Ws − 0.95 Lf/Ws + 0.0687 Wd/g·Ws3·g + 5.0 φ|(A13)
LR 3De/Ws = |−3.57 + 0.59 Wf/Ws + 1.115 Ls/Ws − 0.75 Lf/Ws + 0.0636 Wd/g·Ws3·g − 7.5 ψ|(A14)
LR 4De/Ws = |−2.4 − 1.00 Wf/Ws + 0.645 Ls/Ws + 1.68 Lf/Ws − 2.7 φ − 19.7 ψ|(A15)
LR 5De/Ws = |−4.76 − 0.212 Wf/Ws + 0.898 Ls/Ws + 0.0568 Wd/g·Ws3·g + 3.3 φ − 8.8 ψ|(A16)
LR 6De/Ws = |−4.8 − 1.47 Wf/Ws + 1.493 Lf/Ws + 0.0486 Wd/g·Ws3·g + 7.1 φ − 8.2 ψ|(A17)
LR 7De/Ws = |−4.93 + 0.995 Ls/Ws − 0.289 Lf/Ws + 0.0615 Wd/g·Ws3·g + 3.3 φ − 7.5 ψ|(A18)
LR 1F/gWs3·g = |−1388 − 214 Wf/Ws + 27.6 Ls/Ws + 275 Lf/Ws + 14.3 Wd/g·Ws3·g + 2153 φ − 7115 ψ|(A19)
LR 2F/gWs3·g = |−4310 − 73 Wf/Ws + 41.5 Ls/Ws + 54 Lf/Ws + 30.0 Wd/g·Ws3·g + 4901 φ|(A20)
LR 3F/gWs3·g = |140 − 194 Wf/Ws + 36.1 Ls/Ws + 272 Lf/Ws + 10.8 Wd/g·Ws3·g − 7816 ψ|(A21)
LR 4F/gWs3·g = |−974 − 300 Wf/Ws − 0.9 Ls/Ws + 412 Lf/Ws + 1520 φ − 7839 ψ|(A22)
LR 5F/gWs3·g = |−1848 + 80.8 Wf/Ws + 107.0 Ls/Ws + 24.49 Wd/g·Ws3·g + 2119 φ − 6358 ψ|(A23)
LR 6F/gWs3·g = |−1346 − 264 Wf/Ws + 329 Lf/Ws + 12.85 Wd/g·Ws3·g + 2231 φ − 7148 ψ|(A24)
LR 7F/gWs3·g = |−1681 + 68.2 Ls/Ws + 109.1 Lf/Ws + 17.92 Wd/g·Ws3·g + 1998 φ − 6842 ψ|(A25)

References

  1. O’Loughlin, C.D.; Richardson, M.D.; Randolph, M.F. Drag anchor fluke-soil interaction in clays. Can. Geotech. J. 2013, 50, 575–588. [Google Scholar] [CrossRef]
  2. Neubecker, S.R.; Randolph, M.F. Profile and frictional capacity of embedded anchor chains. J. Geotech. Eng. 1995, 121, 797–803. [Google Scholar] [CrossRef]
  3. Thorne, C.P. Penetration and load capacity of marine drag anchors in soft clay. J. Geotech. Geoenvironmental Eng. 1998, 124, 945–953. [Google Scholar] [CrossRef]
  4. Wang, D.; Hu, Y.; Randolph, M.F. Numerical analysis of drag anchor installation. Ocean Eng. 2010, 37, 1123–1134. [Google Scholar] [CrossRef]
  5. Liu, J.; Tian, Y.; Cassidy, M.J. Drag anchor installation in layered soils. Appl. Ocean. Res. 2014, 48, 1–12. [Google Scholar]
  6. Wang, D.; O’Loughlin, C.D. Numerical modeling of drag anchor installation using coupled Eulerian-Lagrangian techniques. Comput. Geotech. 2014, 62, 158–171. [Google Scholar] [CrossRef]
  7. Randolph, M.F.; Gourvenec, S. Offshore Geotechnical Engineering; CRC Press: Boca Raton, FL, USA, 2017. [Google Scholar]
  8. Aubeny, C.P.; Chi, C. Mechanics of drag embedment anchors in a soft seabed. J. Geotech. Geoenvironmental Eng. 2010, 136, 57–68. [Google Scholar] [CrossRef]
  9. Wang, L.Z.; Shen, K.M.; Li, L.L.; Guo, Z. Integrated analysis of drag embedment anchor installation. Ocean Eng. 2014, 88, 149–163. [Google Scholar] [CrossRef]
  10. Zhao, Y.; Liu, H. The drag effects on the penetration behavior of drag anchors during installation. Ocean Eng. 2015, 109, 169–180. [Google Scholar] [CrossRef]
  11. Zhang, Y.; Fan, S.; Li, S.; Yin, J. Analysis of the drag anchor behaviour at shallow depths. Comput. Geotech. 2023, 160, 105518. [Google Scholar] [CrossRef]
  12. Lai, Y.; Zhu, B.; Huang, Y.; Chen, C. Behaviors of drag embedment anchor in layered clay profiles. Appl. Ocean Res. 2020, 101, 102287. [Google Scholar] [CrossRef]
  13. Lai, Y.; Huang, Y.; Gilbert, R.B.; Aubeny, C.P. Behavior of piggy-backed drag embedment anchors in marine soils. J. Geotech. Geoenvironmental Eng. 2022, 148, 04021167. [Google Scholar] [CrossRef]
  14. Dao, D.A.; Grabe, J.; Chmelnizkij, A. Examination of an analytical approach for load-displacement behavior of drag embedment anchors and their geometrical optimization. In Proceedings of the International Conference on Offshore Mechanics and Arctic Engineering, Singapore, 9–14 June 2024; ASME: New York, NY, USA, 2024; Volume 87868, p. V008T10A011. [Google Scholar]
  15. LeLievre, B.; Tabatabaee, J. The performance of marine anchors with planar flukes in sand. Can. Geotech. J. 1981, 18, 520–534. [Google Scholar] [CrossRef]
  16. Dias, H.R.F. Uma Contribuição para Conhecimento do Comportamento de Âncoras em Leitos Marinhos Arenosos para Estruturas Flutuantes. Master’s Thesis, Universidade do Porto, Porto, Portugal, 2013. [Google Scholar]
  17. Stewart, W.P. Drag embedment anchor performance prediction in soft soils. In Proceedings of the Offshore Technology Conference, Houston, TX, USA, 4–7 May 1992; OTC: Houston, TX, USA, 1992; p. OTC-6970. [Google Scholar]
  18. Dunnavant, T.W.; Kwan, C.T. Centrifuge modelling and parametric analyses of drag anchor behavior. In Proceedings of the Offshore Technology Conference, Houston, TX, USA, 3–6 May 1993; OTC: Houston, TX, USA, 1993; p. OTC-7202. [Google Scholar]
  19. O’Neill, M.P.; Randolph, M.F.; Neubecker, S.R. A novel procedure for testing model drag anchors. In Proceedings of the ISOPE International Ocean and Polar Engineering Conference, Honolulu, HI, USA, 25–30 May 1997; ISOPE: Mountain View, CA, USA, 1997; p. ISOPE-I. [Google Scholar]
  20. Aubeny, C.P.; Murff, J.D.; Kim, B.M. Prediction of anchor trajectory during drag embedment in soft clay. Int. J. Offshore Polar Eng. 2008, 18, ISOPE-08-18-4-314. [Google Scholar]
  21. Azimi, H.; Shiri, H.; Mahdianpari, M. Generalized structure of the group method of data handling for modeling iceberg drafts. Ocean Model. 2024, 188, 102337. [Google Scholar] [CrossRef]
Figure 1. Isometric perspectives and key geometric parameters of DEA (MK6 Stevpris).
Jmse 13 01332 g001
Figure 2. Flowchart of present study.
Jmse 13 01332 g002
Figure 3. Input combinations used to develop different LR models: (a) clay seabed; (b) sand seabed.
Jmse 13 01332 g003
Figure 4. Results of the statistical indices—(a,f) R; (b,g) RMSE; (c,h) AIC; (d,i) CRM; (e,j) WI—for the LR models used to predict the penetration depth and holding capacity of drag embedment anchors in the clay seabed.
Jmse 13 01332 g004
Figure 5. Scatter plot for (a,g) LR 1, (b,h) LR 2, (c,i) LR 3, (d,j) LR 4, (e,k) LR 5, and (f,l) LR 6 when used to predict penetration depth and holding capacity of drag embedment anchor in clay seabed.
Jmse 13 01332 g005
Figure 6. Error distribution plots for (a,g) LR 1, (b,h) LR 2, (c,i) LR 3, (d,j) LR 4, (e,k) LR 5, and (f,l) LR 6 to predict penetration depth and holding capacity of drag embedment anchor in clay seabed.
Jmse 13 01332 g006
Figure 7. Results of the statistical indices (a,f) R (b,g) RMSE (c,h) AIC (d,i) CRM (e,j) WI for the LR models to predict the penetration depth and holding capacity of drag embedment anchor in the sand seabed.
Jmse 13 01332 g007
Figure 8. Scatter plot for (a,h) LR 1 (b,i) LR 2 (c,j) LR 3 (d,k) LR 4 (e,l) LR 5 (f,m) LR 6 (g,n) LR 7 to predict the penetration depth and holding capacity of drag embedment anchor in the sand seabed.
Jmse 13 01332 g008
Figure 9. Error distribution plots for (a,h) LR 1 (b,i) LR 2 (c,j) LR 3 (d,k) LR 4 (e,l) LR 5 (f,m) LR 6 (g,n) LR 7 to predict the penetration depth and holding capacity of drag embedment anchor in the sand seabed.
Jmse 13 01332 g009
Table 1. Variables and their corresponding dimensions applied in the dimensional analysis for the clay seabed.
VariablesCorresponding Dimensions
Penetration Depth (De)Length (L)
Fluke Length (Lf)Length (L)
Fluke Width (Wf)Length (L)
Shank Length (Ls)Length (L)
Shank Width (Ws)Length (L)
Anchor Dead Weight (Wd)Force (F) or Mass × Acceleration (MLT−2)
Undrained Shear Strength (Su)Force per unit area (Pressure): (ML−1T−2)
Undrained Shear Strength Gradient (k)Change in Shear Strength Per Unit Length: (ML−2T−2)
Table 2. Variables and their corresponding dimensions applied in the dimensional analysis for the sand seabed.
VariablesCorresponding Dimensions
Penetration Depth (De)Length (L)
Fluke Length (Lf)Length (L)
Fluke Width (Wf)Length (L)
Shank Length (Ls)Length (L)
Shank Width (Ws)Length (L)
Anchor Dead Weight (Wd)Force (F) or Mass × Acceleration (MLT−2)
Friction Angle (φ)Dimensionless [-]
Dilation Angle (ψ)Dimensionless [-]
Sand Density (γ)Mass × Volume−3 [ML−3]
Gravitational Acceleration (g)Length × Time−2 [LT−2]
Table 3. Minimum, maximum, average, and standard deviation of the applied dimensionless groups of parameters for the sandy seabed.
De/WsF/Su·Ws2Wf/WsLs/WsLf/WSWd/gWs3·gφ (Rad)ψ (Rad)
Max49.4565943.89419.08326.532.25126.2370.8670.436
Min0.50.0011.64.830.0600.5410.087
Ave10.699588.4479.08711.29013.33935.1730.6760.283
StD11.7381486.9424.1336.0757.50336.0180.0820.115
Table 4. Minimum, maximum, average, and standard deviation of the applied dimensionless groups of parameters for the clay seabed.
De/WsF/Su·Ws2Wf/WsLs/WsLf/WsWd/Su·Ws2k·Lf/Su
Max226.58095,519.1316.750302088.889230.756
Min220.7781.5293.3332.9410.0250.126
Ave57.34115,081.9407.6008.7307.68517.8157.713
StD50.39724,692.3106.0046.1483.80923.14738.870
Table 5. Results of the uncertainty analysis for the LR models to predict the penetration depth and holding capacity of DEA in the clay seabed.
ModelMeanSt DEV95% CIWUB
De/WsLR 1−0.0477530.4975(−11.44, 11.34)±11.39
LR 2−0.0806531.09797(−11.69, 11.53)±11.61
LR 3−0.0015831.44425(−11.74, 11.74)±11.74
LR 40.01428830.84948(−11.51, 11.53)±11.52
LR 5−0.0121730.68685(−11.47, 11.45)±11.46
LR 6−0.029131.43078(−11.77, 11.71)±11.74
F/Su·Ws2LR 1−4,332,3925,404,922(−6,218,258 −2,446,525)±1,885,866.5
LR 2−3,074,1023,419,463(−4,267,209 −1,880,995)±1,193,107
LR 3−1.5 × 10711,829,588(−19,504,000 −11,248,923)±4,127,538.5
LR 4−718,884873,007.3(−1,023,491 −414,278)±304,606.5
LR 5−3,776,7054,725,350(−5,425,457 −2,127,952)±1,648,752.5
LR 6−3,249,1714,532,709(−4,830,708 −1,667,634)±1,581,537
Table 6. Results of the uncertainty analysis for the LR models to predict the penetration depth and anchor capacity in the sand seabed.
ModelMeanSt DEV95% CIWUB
De/WsLR 1−0.094963.46771(−1.595, 1.405)±1.5
LR 2−0.216123.456995(−1.711, 1.279)±1.495
LR 3−0.02023.469565(−1.521, 1.480)±1.5005
LR 4−0.526154.289621(−2.381, 1.329)±1.855
LR 5−0.117333.477106(−1.621, 1.386)±1.5035
LR 6−0.26053.972103(−1.978, 1.457)±1.722
LR 7−0.116073.453149(−1.609, 1.377)±1.493
F/g·Ws3·gLR 1−273.873386.146(−440.9, −106.9)±167
LR 2−382.269613.1351(−647, −117)±265
LR 37.985859504.4879(−210, 226)±218
LR 4−292.834404.5642(−467.8, −117.9)±174.95
LR 5−272.64437.3273(−461.8, −83.5)±189.15
LR 6−273.212389.7248(−441.7, −104.7)±168.5
LR 7−281.277403.5826(−455.8, −106.8)±174.5
Disclaimer/Publisher’s Note: The statements, opinions and data contained in all publications are solely those of the individual author(s) and contributor(s) and not of MDPI and/or the editor(s). MDPI and/or the editor(s) disclaim responsibility for any injury to people or property resulting from any ideas, methods, instructions or products referred to in the content.

