Article

Energetics of Eddy–Mean Flow Interaction in the Kuroshio Current Region

1
School of Information Engineering, Nanjing Xiaozhuang University, Nanjing 211171, China
2
Southern Marine Science and Engineering Guangdong Laboratory (Zhuhai), Zhuhai 519082, China
3
School of Marine Sciences, Sun Yat-sen University, Zhuhai 519082, China
4
School of Atmospheric Sciences, Sun Yat-sen University, Zhuhai 519082, China
5
College of Oceanography, Hohai University, Nanjing 210098, China
6
Department of Geography and Environmental Sciences, Northumbria University, Newcastle NE1 8ST, UK
7
Key Laboratory of Ecosystem Carbon Source and Sink, China Meteorological Administration (ECSS-CMA), Wuxi University, Wuxi 214105, China
8
College of Intelligent Science and Control Engineering, Jinling Institute of Technology, Nanjing 211169, China
*
Authors to whom correspondence should be addressed.
J. Mar. Sci. Eng. 2025, 13(7), 1304; https://doi.org/10.3390/jmse13071304
Submission received: 28 May 2025 / Revised: 27 June 2025 / Accepted: 29 June 2025 / Published: 3 July 2025

Abstract

A comprehensive diagnosis of eddy–mean flow interaction in the Kuroshio Current (KC) region and the associated energy conversion pathway is conducted employing a state-of-the-art high-resolution global ocean–sea ice coupled model. The spatial distributions of the energy reservoirs and their conversions exhibit significant complexity. The cross-stream variation is found in the energy conversion pattern in the along-coast region, whereas a mixed positive–negative conversion pattern is observed in the off-coast region. Considering the area-integrated conversion rates between energy reservoirs, barotropic and baroclinic instabilities dominate the energy transferring from the mean flow to eddy field in the KC region. When the KC separates from the coast, it becomes highly unstable and the energy conversion rates intensify visibly; moreover, the local variations of the energy conversion are significantly influenced by the topography in the KC extension region. The mean available potential energy is the total energetic source to drive the barotropic and baroclinic energy pathway in the whole KC region, while the mean kinetic energy supplies the total energy in the extension region. For the whole KC region, the mean current transfers 84.9 GW of kinetic energy and 37.3 GW of available potential energy to the eddy field. The eddy kinetic energy is generated by mixed barotropic and baroclinic processes, amounting to 84.9 GW and 15.03 GW, respectively, indicating that topography dominates the generation of mesoscale eddy. Mean kinetic energy amounts to 11.08 GW of power from the mean available potential energy and subsequently supplies the barotropic pathway.

1. Introduction

The Kuroshio Current (KC) exhibits a characteristic northeastward trajectory along continental margins prior to its separation near the Bōsō Peninsula, where it transitions into an eastward-flowing jet entering the Pacific Ocean. This separation regime functions as a key generation site for mesoscale eddies through dynamical detachment mechanisms [1]. As a principal component of the North Pacific circulation, the KC significantly modulates the meridional heat redistribution, the biogeochemical flux dynamics, and the propagation characteristics of mid-latitude atmospheric disturbances. Its energy cycle—driven by wind forcing, baroclinic/barotropic instabilities, and topographic interactions—exerts profound influences on the Pacific Decadal Oscillation and global climate modes [2]. The energy cascade spanning from wind-forced generation to turbulent dissipation across multiple spatiotemporal scales remains insufficiently characterized, with significant knowledge gaps persisting in the interactions among background mean flow, mesoscale eddy fields, and submesoscale processes. Observational and modeling evidence demonstrates that the KC mediates vigorous energy/momentum exchange with transient coherent structures through nonlinear eddy–mean flow interactions, exhibiting distinct forward and inverse cascade regimes [3]. The Kuroshio Extension constitutes a critical air–sea coupling zone in the North Pacific, exhibiting steep isopycnals and persistently high eddy kinetic energy (EKE) levels that dominate the regional mesoscale variability [1,4,5]. This dynamic regime facilitates intensive energy exchange across the air–sea interface, making the Kuroshio Extension a crucial modulator of basin-scale climate feedbacks. Such dynamic conditions underscore the region critical role in modulating large-scale circulation. A comprehensive understanding of multiscale energy conversion processes between the mean and eddy field constitutes a critical prerequisite for deciphering the spatiotemporal variability of the Western Boundary Current (WBC) and its broader climate linkages.
The oceanic energy cascade operates as a multiscale engine driving climate system, with mesoscale eddies acting as critical intermediaries in redistributing energy across spatial and temporal domains [6]. The WBC, which includes the KC, represents hotspots of energy transfer due to its unique combination of significant EKE and persistent baroclinic instability [2,7]. These systems account for over 30% of global oceanic heat transport, yet their nonlinear energy exchange mechanisms remain poorly quantified, hindering accurate climate projections. The eddy–mean flow interaction in the KC region is highly complex, and recent satellite missions and high-resolution models have revealed that 60–70% of kinetic energy (KE) variability arises from eddy–mean flow interactions, yet only 40% of these interactions are captured by CMIP6 models [8]. A comprehensive quantification of eddy–mean flow dynamics is crucial for advancing our understanding of oceanic circulation mechanisms and refining theoretical frameworks governing fluid motions. Both observational studies and numerical modeling have revealed that intense current systems, particularly those exhibiting strong barotropic and baroclinic instabilities like WBCs and the Antarctic Circumpolar Current, demonstrate pronounced interactions between eddies and mean flows [9,10,11,12,13]. Through high-resolution numerical model, von Storch et al. (2012) established parallels between oceanic and atmospheric energy transfer pathways, demonstrating their alignment with classical baroclinic instability theories [14,15,16]. Spatial variations in eddy–mean flow interactions reveal distinct regional characteristics: subtropical zones predominantly exhibit localized baroclinic instability processes, whereas the major WBC extensions (e.g., Kuroshio and Gulf Stream) and the Southern Ocean display nonlocal interaction patterns [12,13,17,18,19]. Particularly in the Gulf Stream system, Kang et al. (2015) [13] identified unique regional energetics characterized by atypical eddy–mean flow dynamics differing substantially from open-ocean conditions. Additionally, the submesoscale KE being particularly sensitive to seasonal variation, the transition rates of KE in summer and autumn are generally larger compared to those in spring and winter [20]. These findings emphasize the necessity for systematic investigations of energy transfer mechanisms within KC. Given the intricate physical processes inherent to WBC regions, a thorough analysis of energy budgets and transfer pathways becomes particularly imperative for understanding the KC dynamics.
Wind stress serves as the primary energy source for the KC system, with its forcing mechanisms exhibiting pronounced latitudinal dependence: Ekman pumping dominates at lower latitudes, while direct wind stress work prevails in mid-latitudes [2]. This energy is initially converted into mean kinetic energy (MKE) through geostrophic adjustment, followed by redistribution via instabilities. Baroclinic instability drives the conversion of potential energy to KE during subduction processes. In contrast, barotropic instability facilitates an inverse kinetic energy cascade, transferring energy from mesoscale eddies back to the mean flow. This phenomenon is particularly pronounced in the extension region, where EKE peaks due to enhanced shear instability [21]. The systematic examination of eddy–mean flow interactions provides fundamental insights into mesoscale dynamical processes. Eddy generation mechanisms primarily bifurcate into two distinct pathways: wind stress curl variability over basin scales, which modulates jet variability through interannual forcing [22,23], and dynamical detachment from the main current, where eddies serve as principal agents in energy redistribution [24]. Jet instability mechanisms constitute critical drivers of eddy genesis, with theoretical and modeling studies confirming their role in energizing flow meanders through EKE transfer to the mean current [9,10,25,26,27]. In the Kuroshio Extension, eddies actively regulate jet morphology through bidirectional energy exchanges [10], while simultaneously influencing large-scale circulation patterns [28,29,30]. These transient features exert critical modulation on flow characteristics-altering structural stability [31,32,33,34], modifying current intensity [35,36,37], and governing energy transfer regimes between turbulent and mean-flow components.
The enhanced availability of observational datasets and numerical simulations has enabled refined investigation of eddy–mean flow interaction. These interactions demonstrate particularly pronounced dynamics in the Kuroshio Extension compared to other oceanic regions [11,12]. Spatiotemporal analysis reveals meridional gradients in energy conversion magnitudes, with coastal zones exhibiting dominant mean-to-eddy energy transfers, while open-ocean areas show preferential eddy-to-mean conversions [11,12]. Notably, KE conversion patterns exhibit greater complexity than potential energy transfers due to baroclinic processes. Waterman et al. (2011) [9,10] quantified jet–eddy coupling mechanisms, demonstrating that transient vortices enhance energy transfers to the mean flow while sustaining recirculation gyres. Seasonal analyses further reveal EKE contributions to Kuroshio Extension acceleration through mean-flow energization [3]. Such multiscale energy redistribution mechanisms underscore the critical role of Kuroshio Extension in modulating regional circulation energetics.
In the WBC region, energy pathways differ from those observed in the Southern Ocean and the global integrated system, primarily due to the influence of eddy momentum flux and energy exchange within and beyond these areas [12]. Specifically, in the extension western region, energy is transferred from eddy available potential energy (EAPE) to EKE, whereas in the eastern segment, the direction of transfer is reversed. Additionally, the transfer of energy from EKE to MKE is positive in the eastern part but negative in the western part [9,38,39,40]. Waterman and Jayne (2011) [9,10] revealed that the mean current in the eastern segment of the Kuroshio Extension is driven by these energy transfers, whereas Chen et al. (2014) [12] discovered that both eddies and energy input through the boundary contribute to the increase of available potential energy (APE) there. Topographic effects further modulate energy dissipation through enhancing localized turbulence by internal wave generation and bottom boundary layer friction. Increased topographic roughness elevates the bottom drag coefficient in nearshore regions, while nonlinear interactions between currents and submarine ridges amplify vertical mixing efficiency by 30–50% compared to open basins [41,42]. However, current models struggle to resolve subkilometer-scale processes, introducing uncertainties in closing the energy budget. Recent synergistic advances in numerical modeling and observational techniques have significantly enhanced diagnostic capabilities for the energy cycle in Kuroshio Extension. However, nonlinear coupling of multiscale processes and spatial heterogeneity of energy cascades continue to constrain mechanism understanding. Breakthroughs in high-resolution ocean models now provide novel tools to resolve energy fluxes. Comparative studies reveal substantial discrepancies in KE budget diagnostics among numerical models within the KC. These model intercomparisons underscore the critical role of turbulence closure schemes and boundary forcing sensitivities in shaping energy diagnostics.
This study conducts a comprehensive three-dimensional analysis of eddy–mean flow interactions and associated energy budget dynamics along the KC system. Our investigation encompasses three critical subsystems: the coastal boundary current zone (KC1), flow separation transition region (KC2), and open-ocean extension area (KC3). The diagnostic framework employs a 40-year (1979–2018) high-resolution global ocean general circulation model simulation (about 18 km), whose fidelity in capturing mesoscale eddy kinetic and temporal variability has been previously demonstrated. This long-term, eddy-resolving numerical experiment effectively mitigates inherent limitations observed in previous investigations, particularly the sparse spatiotemporal resolution of observational datasets and inadequate representation of mesoscale processes in large-scale numerical simulations. Key findings reveal significant vertical stratification characteristics and horizontal heterogeneity in energy exchange mechanisms between transient eddies and the mean KC flow. Through systematic quantification of the eddy–mean flow energy budget components along the principal current axis, we identify distinct downstream modulation of energy transfer mechanisms. Specifically, the spatial progression from WBC dominance to open-ocean inertial jet dynamics manifests progressive transformations in both the magnitude and vertical structure of barotropic/baroclinic energy conversion processes. The paper is organized as follows. Section 2 of this paper provides definitions of energy terms and governing equations, as well as a concise overview of the model and experimental setup. Section 3 presents detailed descriptions of energy reservoirs, energy conversion processes, and energy budgets. Finally, Section 4 contains the conclusion and discussion.

2. Diagnostic Framework and Model

2.1. Theoretical Framework

Adopting the energy decomposition methodology from Wu et al. (2017, 2020, 2021) and Kang and Curchitser (2015, 2017), this study considers four distinct energy reservoirs [13,43,44,45,46]: mean available potential energy (MAPE, P m ), MKE ( k m ), EKE ( k e ), and EAPE ( P e ). These components are rigorously defined through the following mathematical formulations:
MKE k m = 0.5 ρ 0 u ¯ 2 + v ¯ 2
EKE k e = 0.5 ρ 0 u 2 + v 2 ¯
MAPE P m = g 2 n 0 ρ ¯ a 2
and
EAPE P e = g 2 n 0 ρ 2 ¯
where ρ 0 = 1038   kg   m 3 represents the constant part of the reference density, while u and v denote the 5-day mean zonal and meridional velocity components, respectively, computed over the 10-year study period (the over bar). The prime symbol (′) indicates instantaneous deviations from these temporal means, corresponding to eddy-scale fluctuations. The local potential density field ( ρ ) can be decomposed into two distinct components, as expressed by the following: ρ x , y , z , t = ρ r z + ρ a x , y , z , t ; ρ r z is defined by the area average of the 5-day mean density over KC region, and ρ a x , y , z , t is the perturbation part of the density from ρ r z . n 0 = ρ r / z is the vertical gradient of ρ r z .
The reference density ( ρ r ) varies monthly. While the adopted available potential energy (APE) formulation follows standard approximations [47], its validity diminishes in regions characterized by weak stratification and steep topographic gradients (slopes > 0.05 m2 s−2) [48]. Sensitivity analyses reveal that MAPE exhibits significant dependence on ρ r : spatial patterns and domain-integrated values vary by 20–30% when alternate stratification profiles are tested. In contrast, EAPE and its conversion terms ( MAPE EAPE and MAPE MKE ) display limited sensitivity (±<5%) to ρ r .
Briefly, the generation rates of MAPE and EAPE are given by
G P m = ρ ¯ a B ¯ 0 n 0
and
G ( P e ) = ρ n 0 B ¯
respectively, where B 0 = g ρ 0 α Q C w + ρ 0 β S E , α = ρ θ S , z , β = ρ S θ , z , θ and S denote the potential temperature and salinity, C w is the heat capacity of seawater, and Q and E are the net ocean surface heat and freshwater fluxes.
G k m and G k e are generation rates of MKE and EKE which are given by
G k m = τ x ¯   u s ¯ + τ y ¯   v s ¯
G k e = τ x u s ¯ + τ y v s ¯
where τ x and τ y denote the ocean surface wind stress and u s and v s are the ocean surface velocities.
In addition, the conversion rates between the energy reservoirs are presented as follows:
C k m , k e = ρ 0 u u ¯ u ¯ + v u ¯ v ¯
C k e , k m = ρ 0 u ¯ u u ¯ + v ¯ u v ¯
C P m , P e = g n 0 ρ a u ¯ ρ ¯ a
C P e , P m = g n 0 ρ ¯ a u ρ a ¯
C P m , k m = g ρ ¯ a   w ¯
C k m , P m = g ρ ¯ a   w ¯
C P e , k e = g ρ a w ¯
and
C k e , P e = g ρ a w ¯
where w is the vertical velocity and u denotes the three-dimensional velocity vector field. A positive value of C A , B indicates energy transfer from reservoir A to reservoir B, while a negative value signifies the reverse energy direction. Equation (9) represents the EKE production induced by the barotropic instability, i.e., the mean momentum fluxes, and Equation (10) represents the MKE change rate due to eddy momentum fluxes. The conversion terms in Equation (11) and Equation (12) are the EAPE and MAPE productions due to horizontal eddy density fluxes, respectively. Equations (13) and (14) represent the acceleration of the mean flow through time-mean buoyancy flux. Equations (15) and (16) show the EKE production due to baroclinic instability. More details on the derivation and physical mechanism about Equations (9)–(16) can be found in Wu et al. (2017), Chen et al. (2014), and Kang and Curchitser (2015) [12,13,44].

2.2. Numerical Simulation

The ECCO2 (Estimating the Circulation and Climate of the Ocean Phase 2) global ocean–sea ice synthesis product (about 18 km horizontal resolution) is implemented to address the research objectives. The ECCO2 project is dedicated to generating an optimal, temporally evolving synthesis of comprehensive oceanographic and sea ice observations at eddy-permitting resolution. Utilizing the MITgcm configured for global, full-depth ocean and sea ice simulations, ECCO2 employs a least square fitting approach to assimilate available satellite and in situ observational data. These synthesized datasets serve multiple scientific purposes, including quantifying oceanic contributions to the global carbon cycle; investigating contemporary changes in polar ocean dynamics; monitoring temporal variations in energy and mass balances across earth system components; and supporting diverse interdisciplinary research applications. This data-constrained framework solves the hydrostatic Boussinesq equations on a cubed-sphere grid [49] using the MITgcm configuration [50,51], coupled with a sea ice model [52]. The 50-level vertical grid features layer thicknesses increasing from 10 m (surface) to 450 m (abyss). Turbulence closure employs: Biharmonic horizontal viscosity and KPP for vertical mixing [53], and quadratic drag law for bottom boundary parameterization. Control parameters are optimized via Green Function adjoint techniques [54,55,56] to minimize model-observation discrepancies. Full configuration details are documented in Menemenlis et al. (2008) and Chen (2014) [12].
The ECCO2 state estimation employs 6-hourly atmospheric boundary forcing derived from the Japanese Reanalysis (JRA-55) dataset spanning 1979–2018. Developed by the Japan Meteorological Agency through a four-dimensional variational assimilation system, JRA-55 integrates multi-source observations including ECMWF operational analyses, NCDC surface stations, and MRI radiosonde measurements. The forcing fields comprise downward longwave/shortwave radiation, 2 m air temperature, specific humidity, 10 m wind velocity components, and freshwater flux (river runoff and precipitation). With a 1.125° × 1.125° spatial resolution and 6-hourly temporal resolution, these fields drive a 40-year simulation (1979–2018). Analysis focuses on the final decadal outputs, archived as 5-day mean fields to resolve mesoscale variability.

3. Results

3.1. Energy Reservoirs

Figure 1 presents the depth-integrated horizontal distributions of energy reservoirs for the upper 1000 m. The four subdomains in Figure 1a represent the whole Kuroshio Current region (black, KC), the along-coast region (red, KC1), the upon-separation region (blue, KC2), and the off-coast region (magenta, KC3), respectively. All the energy reservoirs distribute inhomogeneously, and the spatial patterns are similar to the previous studies [11,57,58]. Specifically, the distribution of MKE is characterized by a narrow strip from the east coast of Taiwan to the upstream of Bōsō Peninsula (Figure 1a), and it gradually weakens in KC3. The distribution of EKE is smaller in the upstream of Bōsō Peninsula and experiences a sharp increase in the KC2 region, followed by a maximum value and a decrease gradually in the KC3 region (Figure 1b). It is found that the large EKE concentrates in the farther extension region where the eddies pinched off from the Kuroshio [1,59]. The EKE spreads much more broadly, indicating that the region has strong mesoscale variability generated by barotropic and baroclinic instabilities.
In addition, APE is important to indicate the variability of eddy field and the interactions between eddies and the mean current; it is usually twice as large as EKE [4]. APE is influenced by the buoyancy flux (heat flux and freshwater flux) through heating (cooling) the ocean and adding (abstracting) fresh water from the ocean [6,60]. It also influences by the wind through increasing the sloping isopycnals by Ekman pumping [11]. APE is stored in the isopycnals, which can be released through the generation of eddies by baroclinic instability. The MAPE spatial distribution exhibits a general pattern characterized by higher and lower values located in the northern and southern areas, respectively (Figure 1c). Considering MAPE’s heavy dependence on the reference density, the absolute magnitude of its values does not hold significant physical significance. The distribution of EAPE is analogous to the EKE for both relating to the stretching part of the potential vorticity and the vorticity [61] (Figure 1d). The distribution of EAPE is more homogeneous as it is also influenced by the local density gradient. The broadly analogous spatial patterns of EAPE and EKE suggest a close energy conversion linkage between the two reservoirs. Considering the sensitivity of APE to density reference, this study calculated density reference and buoyancy frequency based on three distinct regions: the entire plotting area, the KC region, and the KC3 region. As illustrated in Figure 2a, significant discrepancies were observed in density reference among different regions. For subsequent calculations, the density reference derived from the KC region was selected. Notably, buoyancy frequencies exhibited minimal variations across the three regions, except within the 200–400 m, where the buoyancy frequency in the KC3 region was slightly larger than those in other regions (Figure 2b).
The magnitudes of MKE, EKE, and EAPE decrease with increasing depth, whereas the patterns are very similar to the integrated distribution, reflecting an equivalent barotropic structure of KC (Figure 3). The MKE is stronger than EKE and EAPE in the along coast region and keep a strong MKE in KC2 and the east region of KC3. The vertical structures of these three reservoirs are generally consistent with those at the surface, apart from the attenuation in magnitude (Figure 3a–c), reflecting a quasi-barotropic jet structure, as found by the satellite data [4]. The vertical structure of EAPE spreads more broadly throughout the whole column and the horizontal distribution is similar to the EKE consistent with previous result [61] (Figure 3d–i). It indicates that the EAPE is the source to generate eddy activities. Vertically, the MKE and EKE extend throughout the water column (Figure 4). Both values of MKE and EKE decrease about a half in the upper 500 m, and decrease about one order in the upper 1000 m (Figure 4). The area average energy densities are presented in Figure 4 for the four subdomains. On average, the EAPE is stronger than EKE throughout the water column, and the MAPE is also larger than EAPE in the whole water column except the upper 50 m. MKE, EKE, and EAPE decrease dramatically with the increasing depth (Figure 4). The vertical distribution of reservoirs in KC and KC3 regions are similar (Figure 4a,d) that EKE is larger than MKE in the whole water column and the EAPE distributes broadly, and it is the largest reservoir except the upper 100 m. In the along coast region (Figure 4b), the EKE is larger than MKE in the whole water column, and EAPE changes almost two orders in the upper 200 m. The EKE is larger than MKE of the water column in upon-separation region (KC2). In the along-coast and upon-separation regions, the mean and eddy energy concentrate in the upper 1000 m, while in the farther east extension region extends deeper in 1000 m (Figure 4d).

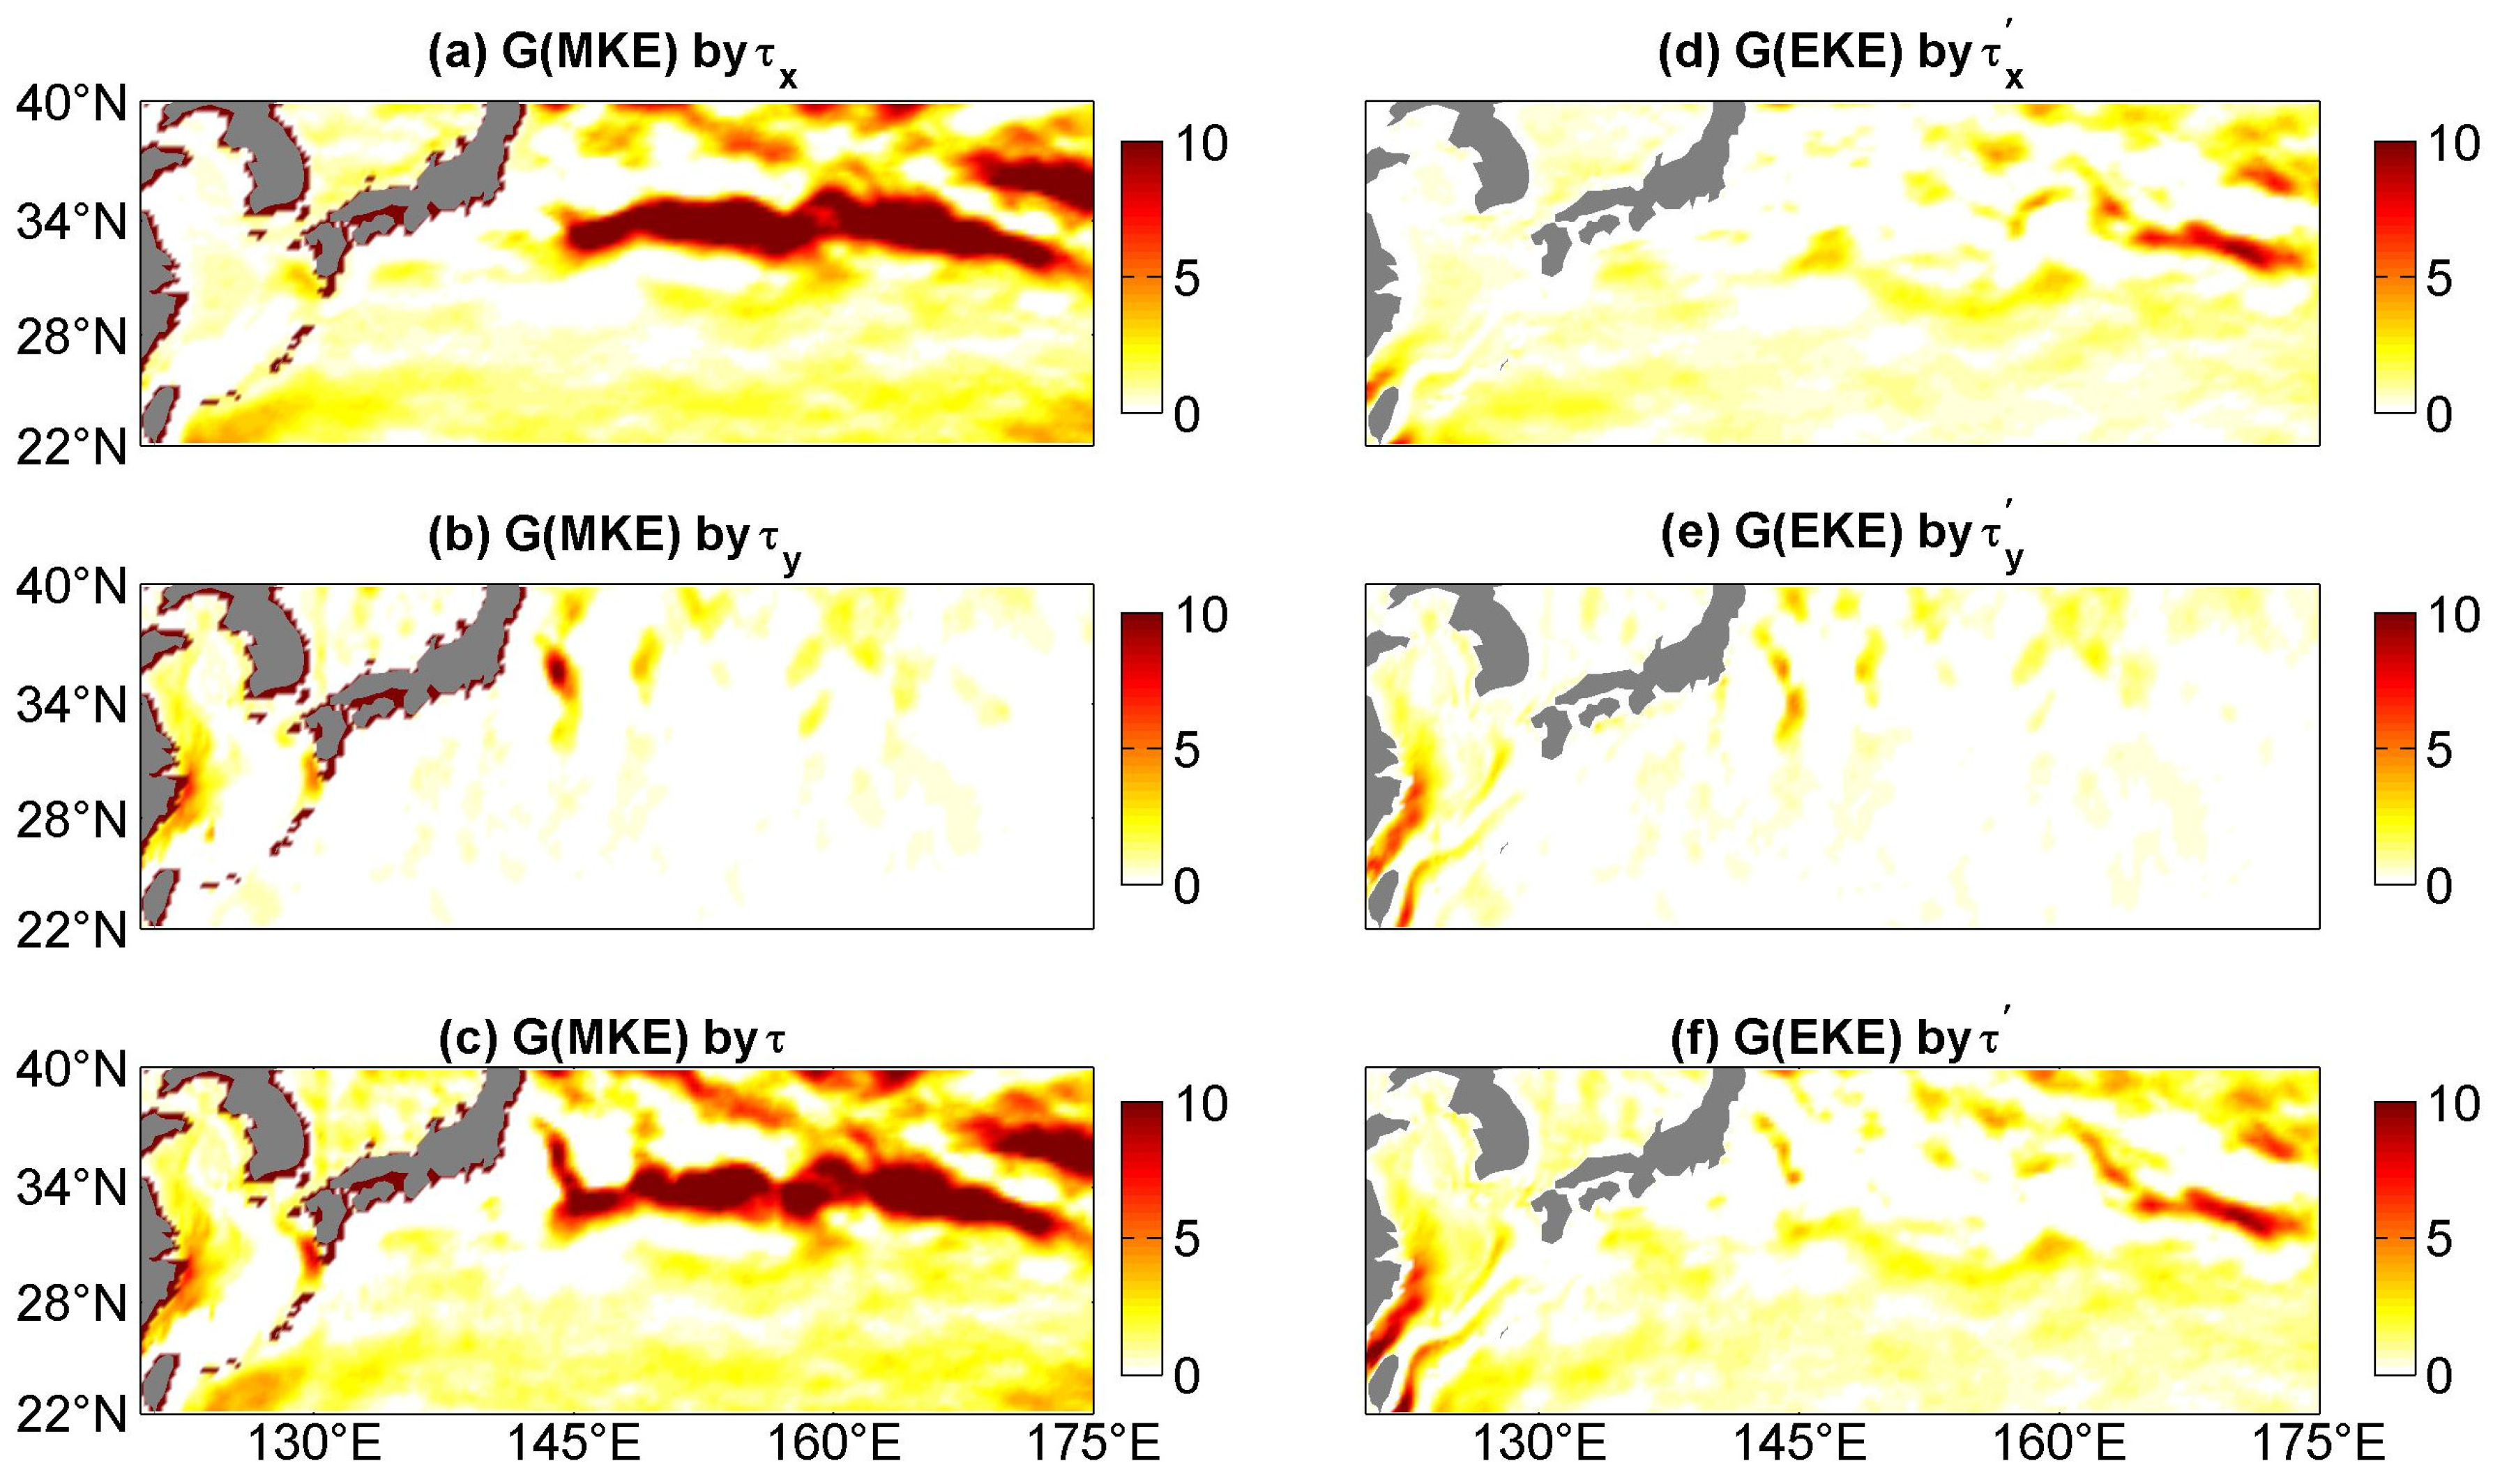
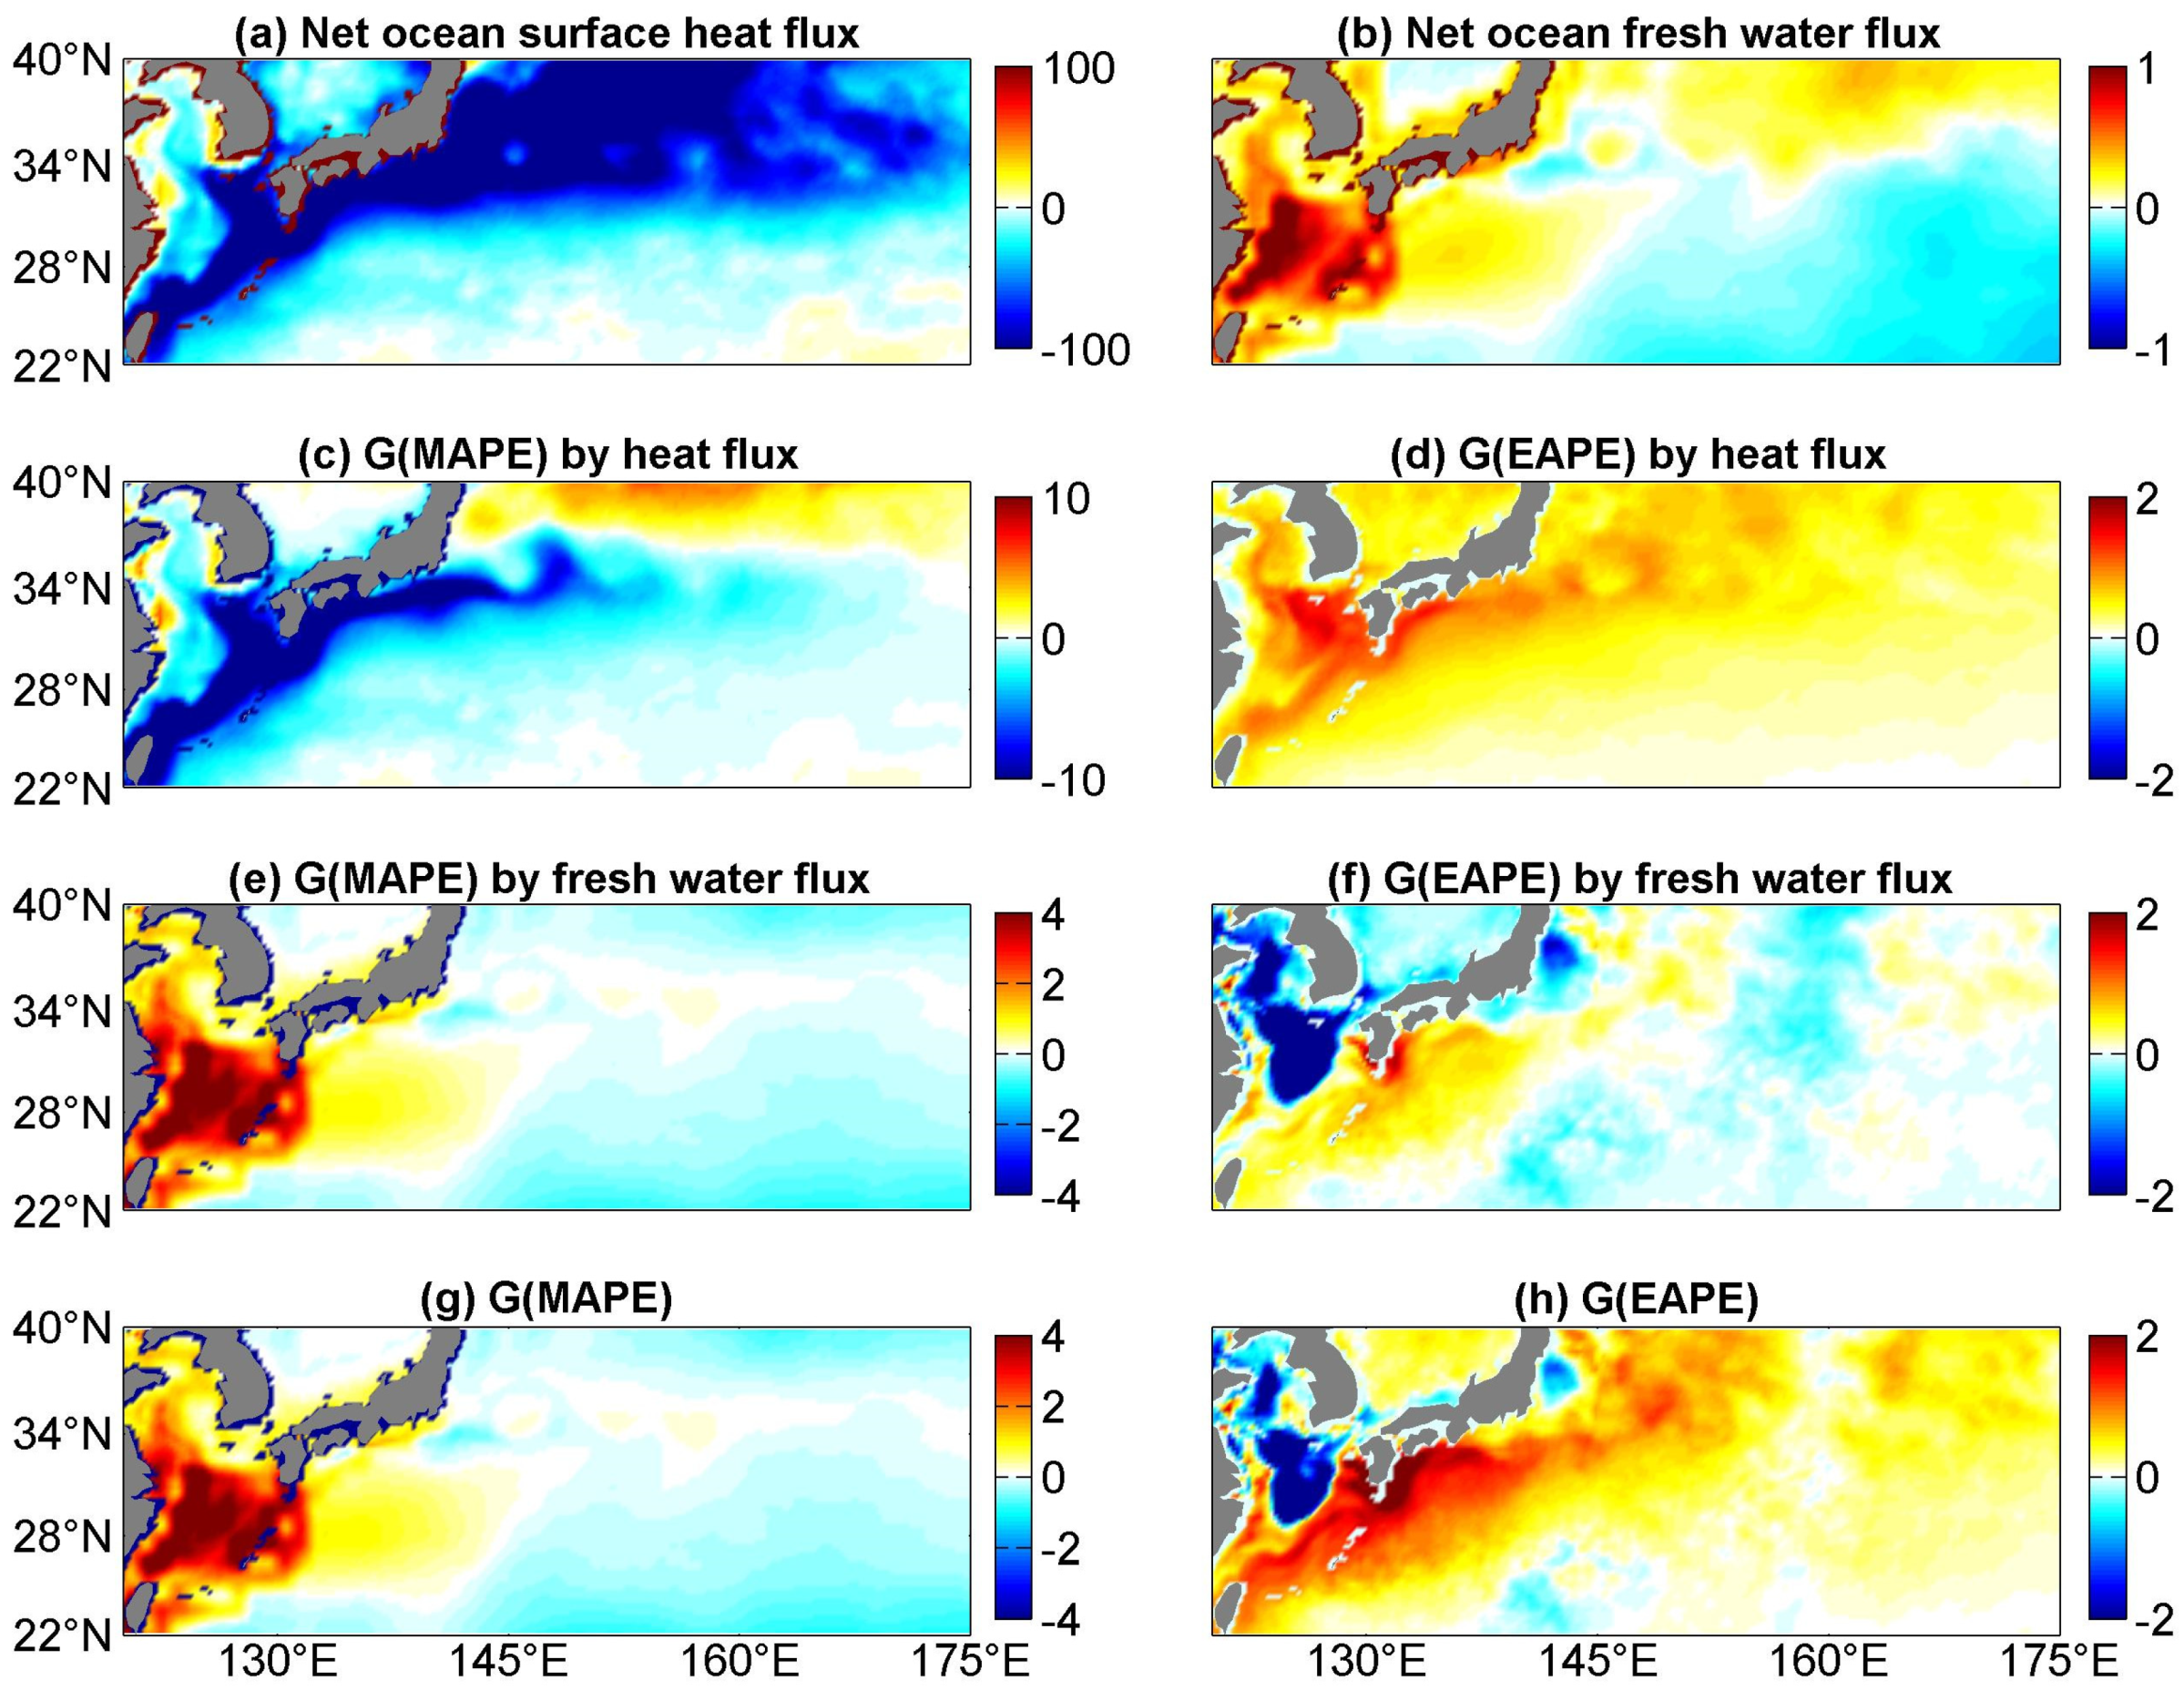
3.2. Energy Generations

The global ocean is primarily driven by wind stress, heat flux, and freshwater flux. This study investigates the generation rates of potential energy and kinetic energy. Figure 5a–c present the spatial distributions of MKE generation rates ( G MKE ) induced by the time-mean zonal and meridional wind stresses and total wind stress, respectively. The results reveal that the spatial distribution of G MKE driven by wind stress (Figure 5c) is predominantly attributed to the time-mean zonal wind stress (Figure 5a). The energy input from the time-mean wind stress into the time-mean current is concentrated in the KC3 region, exhibiting a distinct zonal structure. This spatial distribution of G MKE aligns with previous findings derived from satellite observations [57]. In contrast, the spatial distribution of G MKE induced by meridional wind stress generally exhibits smaller magnitudes, with only sporadic localized regions showing notable contributions (Figure 5b). Integration of G MKE across the study area indicates that the total energy input from the time-mean wind field into the time-mean circulation for G MKE amounts to 11.9 GW. The zonal wind stress contributes approximately 9.7 GW, whereas the meridional wind stress accounts for merely 2.2 GW. The results in Figure 5a–c demonstrate that zonal wind stress dominates G MKE , while meridional wind stress plays a secondary role. This disparity is primarily linked to the spatial configuration and orientation of the northern hemisphere storm track.
Subsequently, we analyze the contribution of time-varying wind stress to EKE. Figure 5d–f illustrate the spatial distributions of energy input into time-varying flow fields from temporally fluctuating zonal wind stress ( τ x ), meridional wind stress ( τ y ), and total perturbed wind stress ( τ ), respectively, i.e., the spatial patterns of G(EKE). As shown in Figure 5d, the G(EKE) induced by τ x is predominantly characterized by positive values across the entire region, with notably high-magnitude zonal structures concentrated in the KC3 region. In contrast, the G(EKE) induced by τ y exhibits relatively smaller magnitudes (Figure 5e). Quantitatively, the domain-integrated G(EKE) driven by perturbed wind stress amounts to 1.2 GW. Of this total, zonal wind stress anomalies contribute approximately 0.9 GW, while meridional wind stress anomalies account for only 0.3 GW. These results highlight the dominant role of zonal wind stress fluctuations in generating EKE, compared to the minor contribution from meridional components [62].
Air–sea heat flux and freshwater flux can significantly modulate sea surface density. When a positive buoyancy flux (reducing seawater density) is introduced into low-density seawater, or a negative buoyancy flux is imposed on high-density seawater, the values of MAPE and EAPE increase. Conversely, the opposite scenario reduces these energy components. Figure 6a and Figure 6b display the spatial distributions of net surface heat flux and freshwater flux, respectively. The net surface heat flux in the study area exhibits pronounced oceanic heat loss north of the KC, with diminishing heat loss southward until net heat gain occurs (Figure 6a). In contrast, the net surface freshwater flux shows freshwater gain in the Kuroshio region and freshwater loss in the broad ocean (Figure 6b).
Due to substantial oceanic heat loss, the heat flux-driven generation rate of MAPE (G(MAPE)) predominantly exhibits significant negative values, particularly in the KC1 and KC2 regions, correlating strongly with local heat loss (Figure 6c). Conversely, freshwater flux-induced G(MAPE) displays prominent positive values in KC1 and KC2, alongside weaker negative values in KC3. The overall spatial pattern of total G(MAPE) generation is dominated by freshwater flux, characterized by marked positive anomalies in KC1/KC2 and subdued negative anomalies in KC3. For EAPE, G(EAPE) induced by heat flux generally exhibits positive values, with enhanced magnitudes northeast of Taiwan Island extending into KC1 (Figure 6d). Freshwater flux-induced G(EAPE) also contributes noticeably in this region (Figure 6f). The spatial distribution of G(EAPE) is predominantly governed by heat flux (Figure 6h). Quantitatively, the domain-integrated G(MAPE) amounts to 0.032 GW, with heat flux contributing 0.006 GW and freshwater flux 0.03 GW. Similarly, the domain-integrated G(EAPE) totals 0.021 GW, of which heat flux accounts for 0.02 GW and freshwater flux 0.0006 GW. These results underscore the contrasting roles of heat and freshwater fluxes in modulating APE across the study domain.

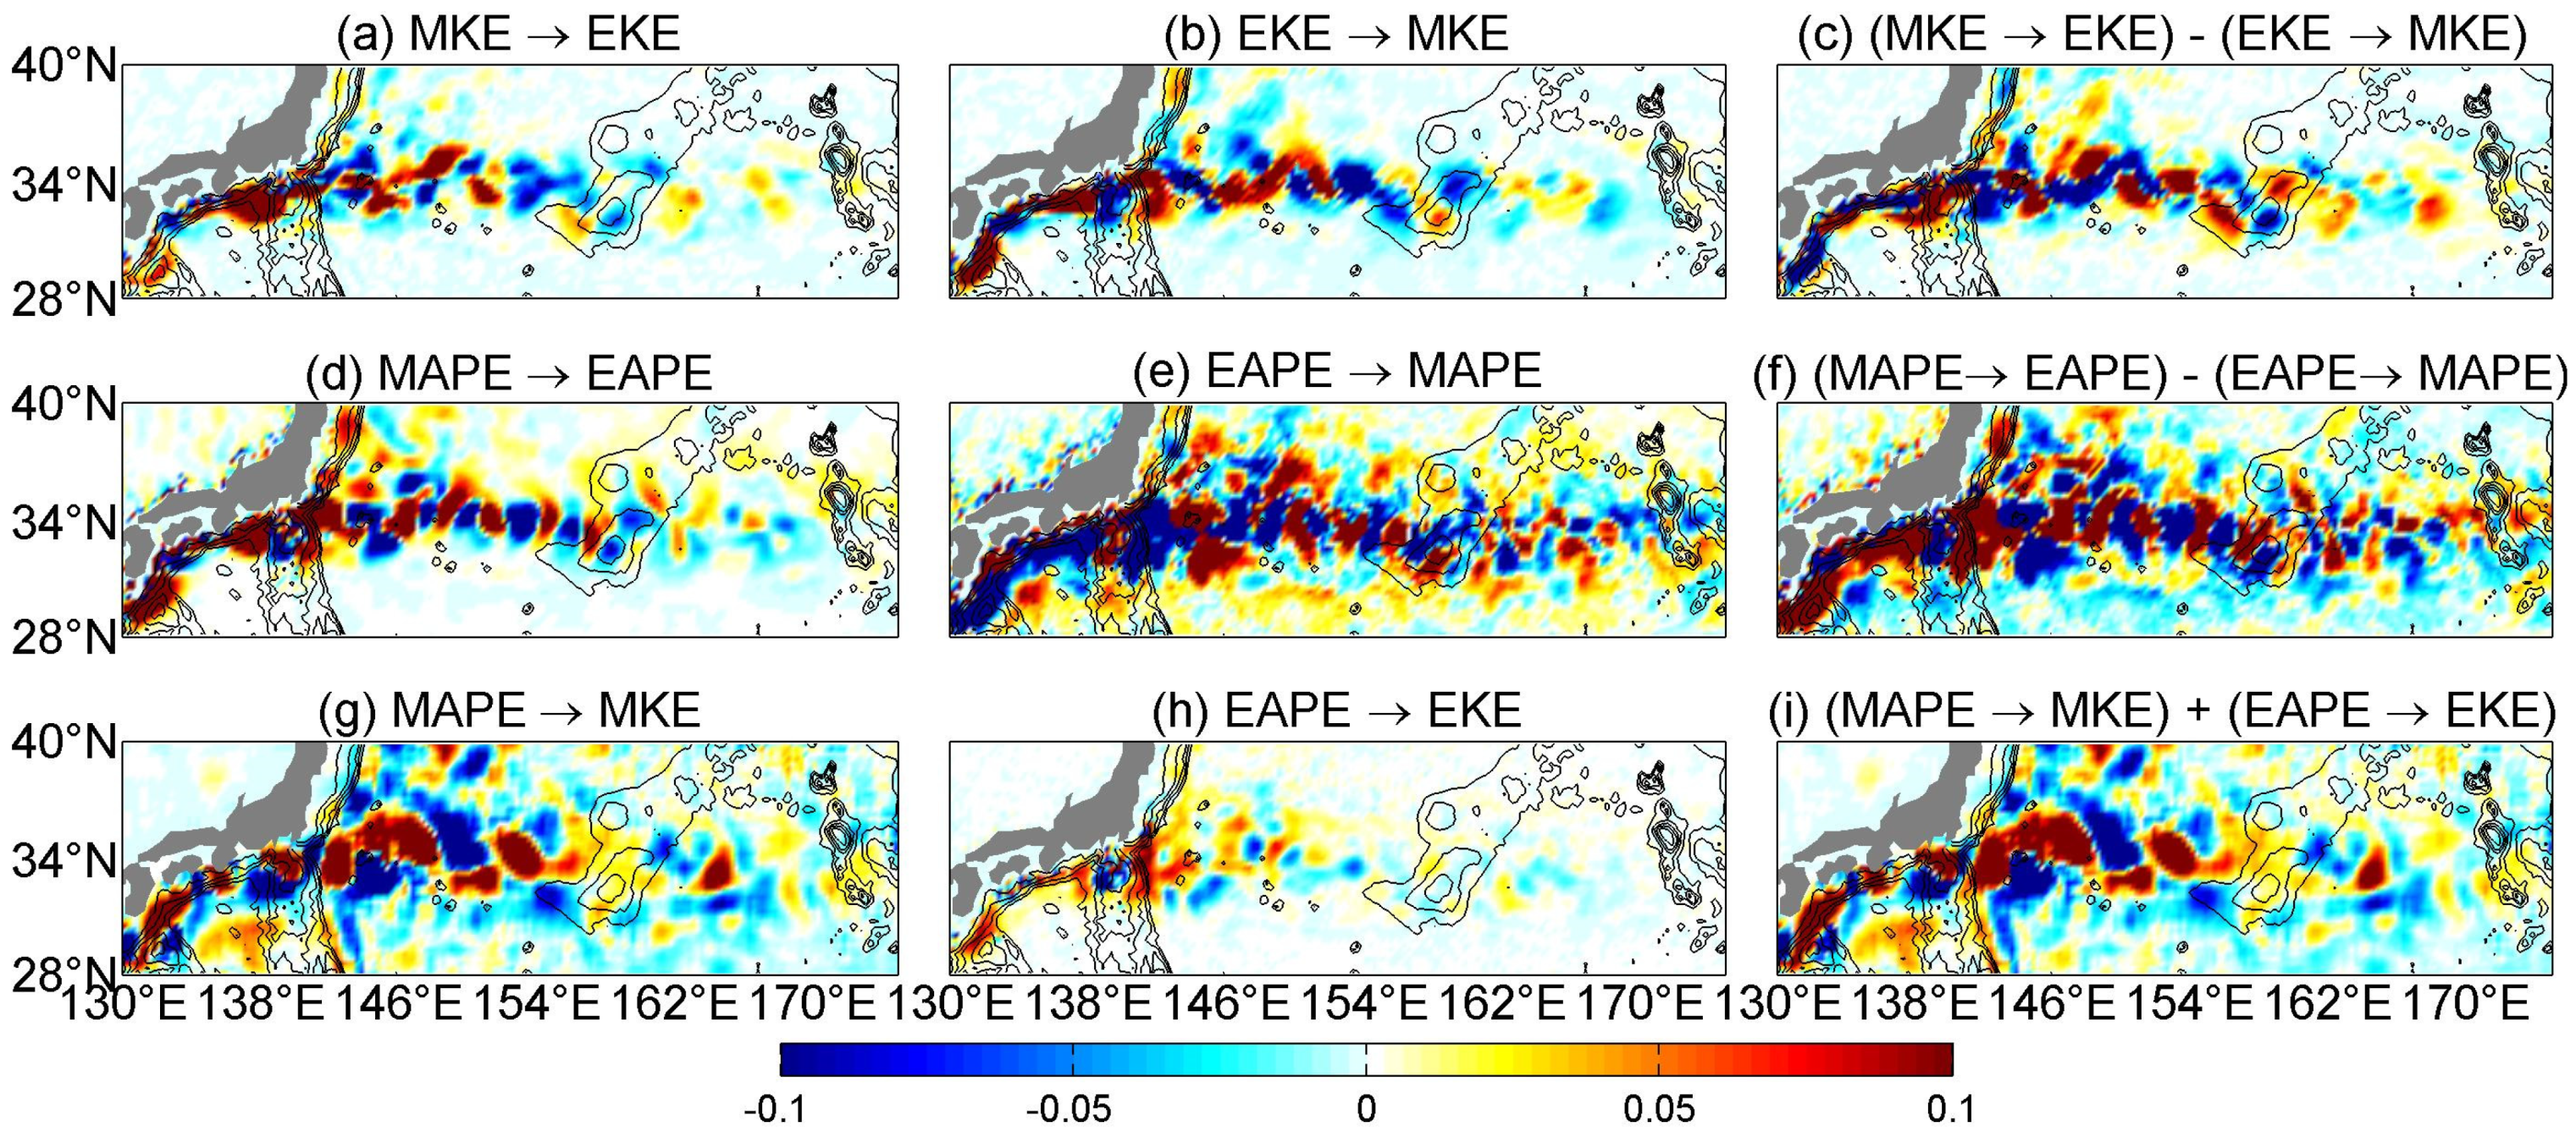
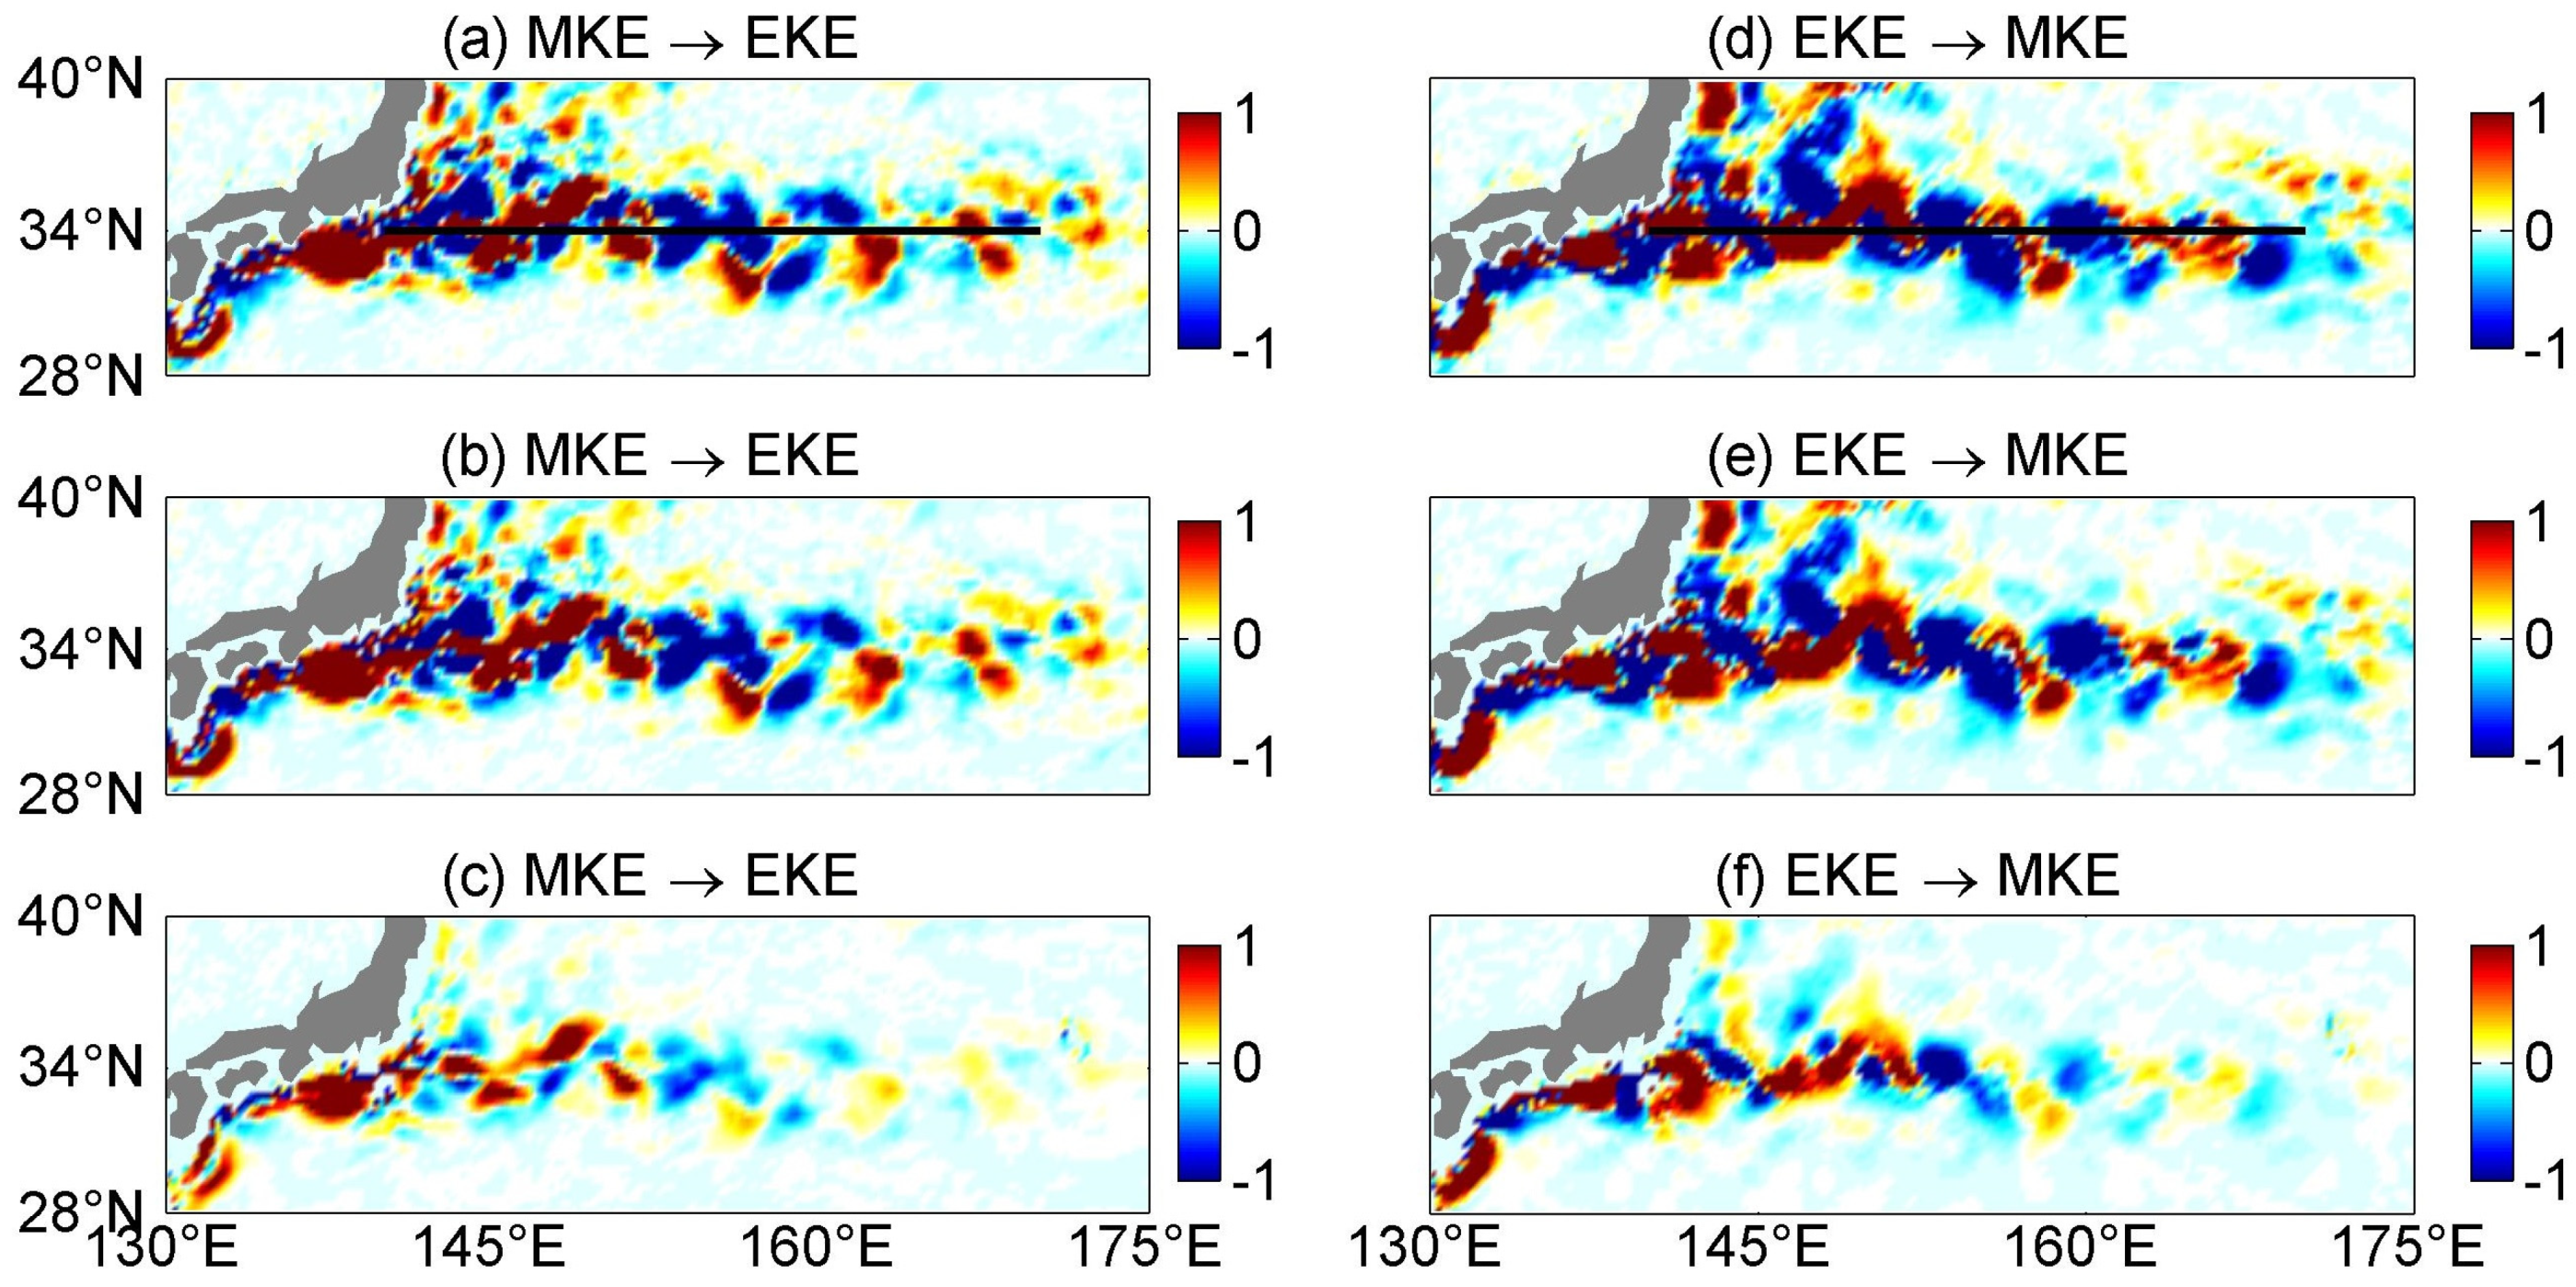
3.3. Energy Conversions

The energy conversion rates among the energy reservoirs are examined by using the last 10-year model outputs (2009–2018). Figure 7 shows the horizontal pattern of the vertical integrated conversion rates for the entire column. The conversion rates are all significant along the Kuroshio path and present observable spatial variability. In the along-coast region (KC1) upstream of Bōsō Peninsula, the conversion rates are influenced by the topography significantly. The integrated MKE EKE conversion rate is slightly negative in the inshore side of the Kuroshio, whereas the value is positive in the offshore side (Figure 7a). This pattern is similar to the along-coast region of Gulf Stream region [63]. In the immediately upstream of the upon-separation region (KC2) and between the latitude of 32–34° N, the eddies accelerate the mean flow (Figure 7b). This conversion pattern is also found in the previous investigations [11,12]. When considering the total mean-to-eddy kinetic energy conversion rates ( MKE EKE and EKE MKE ; Figure 7c), the negative values dominant the inshore side of the stream while the positive values dominant the offshore side (Figure 7c). The prominent EKE growth are from 28° N to 33° N and nearby the upon-separation region, and in these regions the mean flow release energy to the eddies (Figure 7a). However, the preferred EKE decay are from 31° N to 34° N and the farther extension area east of 154° E, the eddies energize the mean flow in these areas (KC3). For the distribution of vertical integrated conversion rate of MAPE EAPE (Figure 5d), the positive values nearly cover the entire along coast region except some negative spots nearby the shallower topography concentrating in nearby the 32° N and 34° N. For example, in the immediately upstream of upon-separation region, there is a significant negative area in the offshore side. In the extension area, the conversion rate between MAPE and EAPE presents a mixed positive–negative pattern (Figure 7d,e). When considering the total conversion rate from MAPE to EAPE (Figure 7f), the distribution is almost dominated by the positive values except some negative spots in the along-coast region. The cross-variation of conversion rate from MAPE to EAPE (Figure 7f) is as significant as that from MKE to EKE in the along-coast region and the extension region (Figure 7c). The energy conversion is from MAPE to MKE in 28–33° N of the along-coast region, and nearby the immediately upstream of upon-separation region the energy conversion direction is from MAPE to MKE and the conversion rate is significant (Figure 7g).
In the upon-separation region (Bōsō Peninsula, labeled by a black dot in Figure 2b), the Kuroshio separates from the coast and flows to the open ocean. In the separation region, the mean to eddy conversion rates are remarkable for both MKE and MAPE (Figure 7a,d,g), indicating the strong generation of the eddies in the region through barotropic and baroclinic instabilities. This is in agreement with the previous studies [11]. When considering the total conversion from MKE to EKE, the along-stream variation is significant (Figure 7c), while the total conversion from MAPE to EAPE is prominently strong in the upon-separation region (Figure 7d). The total conversion from APE to KE is significant in this region (Figure 7g,h). However, upstream of Bōsō Peninsula, the conversion direction is from MAPE to MKE and downstream of Bōsō Peninsula, the conversion direction is from MAPE to MKE in most of the separation area. The large positive values are significant in both the MAPE EAPE and EAPE EKE conversion rates in the upon-separation area (Figure 7g,h). This indicates that the baroclinic instability releases more energy to support the generation of EKE.
In the KC3 region, the conversion rate between MKE and EKE presents a mixed positive–negative pattern (Figure 7a–c). When considering the total conversion from MKE to EKE, the values are negative in the northern portion of the steam, while the values are positive in the southern part of the stream (Figure 7c). For the APE field, the conversion is from MAPE to EAPE in the extension region and shows a complicated mixed positive–negative pattern. For the conversion between APE and kinetic energy (Figure 7g–i), there is a conversion from APE to kinetic energy at 28–34° N and in the immediately upstream of the separation region the values are negative with transferring energy from kinetic energy to APE and the values are positive in the upon-separation region, while it presents a mixed positive–negative pattern in the farther extension region. Some previous investigations show that this is influenced by the topography [64,65].
Figure 8, Figure 9 and Figure 10 show the three-dimensional structure of the eddy–mean flow interaction in Kuroshio region, and two energy conversion pathways from MKE and MAPE to EKE have been found. The energy conversion rate between MKE and EKE is characterized by significant mixed positive–negative structures. Generally, the energy is transferred from MKE to EKE in KC1 region, while energy is transferred from EKE to MKE in KC2 and KC3 regions where the energy conversion is influenced by the topography significantly, as found in the previous study (Wu et al., 2017) [44]. The mean and eddy KE field keep the same spatial pattern through the whole water column except the decreased magnitude of energy conversion rate and its strength is confined within the upper 500 m (Figure 8 and Figure 10a,b). Regarding the MAPE to EAPE conversion rate (Figure 9a–c), overall, the horizontal structure of energy conversion shows a significant positive pattern in KC1 and KC2, while changing to a weak mixed positive–negative pattern in KC3. It exhibits a positive–negative pattern in the upper 500 m and attenuates rapidly below 500 m (Figure 10d). The conversion rate from EAPE to EKE is mostly positive in the surface basically over the whole region, while the pattern is dominated by a positive–negative pattern through the deeper water column (Figure 9d–f and Figure 10c) and it is the same as the others findings [11,12,13].
The profiles of the area mean of conversion rates are depicted in Figure 11. For the entire KC region (Figure 11a), the MKE and MAPE transfer energy to the eddy field and the transferring direction is from MAPE to MKE in KC and KC1 regions, while the direction is from MKE to MAPE in KC2 and KC3 regions. The baroclinic instability is the main processes to generate eddy through the pathway MAPE EAPE EKE . All the conversion rates reach their maximums in the upper 400 m and decrease dramatically in the upper 1000 m. In the KC1 region, the energy pathway is the same as the entire region except that the conversion is from EKE to MKE in the upper 50 m and the conversion rates are larger in the along coast region than that in the KC region. In the upper 200 m, the conversion direction is from MAPE to EAPE and the direction is reversing below the depth 200 m in KC3 (Figure 11d). In the KC2 region, the energy conversion rates are the same as the KC area (Figure 11a,c) except that the conversion from MAPE to MKE is in the upper 100 m and then the direction changes from the MKE to MAPE. In the KC3 region, the vertical structures of MAPE to MKE is different from the other three regions in that the direction is from MKE to MAPE in the whole water column (Figure 11d). The conversion rates from MAPE to EAPE and EAPE to EKE are distinct from the other regions. The two conversion rates change the direction at about 250 m and 400 m, respectively (Figure 11d).

3.4. Energy Budget

The energy budget of the eddy–mean flow interaction for the four domains is presented in Figure 12. For the KC domain defined in this study, the MAPE is the largest reservoir (632.32 PJ), followed by EAPE (142.69 PJ) and EKE (68.19 PJ), respectively. The MKE is the smallest one (42.39 PJ), which is roughly 62% of EKE. Similarly, in the other three subregions, MAPE is the highest, followed by EAPE and EKE. The rate of EAPE to EKE is higher than 1.5 for all subdomains, whereas the rates of MKE to EKE are 1.3, 2.1, and 1.7 in upon-separation (KC1), along-coast regions (KC2), and off-coast region (KC3), respectively. The MKE is larger than EKE in along-coast (KC1) and upon-separation (KC2) regions, while MKE is smaller than EKE in the KC and KC3 regions.
Considering the energy conversions among the four reservoirs, the energy is transferred from the mean field to the eddy field with a MKE conversion rate of 84.90 GW and an EAPE conversation rate of 15.03 GW (Figure 12a). The generation of the eddies through two pathways: the barotropic process MKE EKE with a conversion rate of 84.9 GW and the baroclinic process MAPE EAPE EKE with a conversion rate of 15.03 GW. Beyond transferring energy to the eddies via the baroclinic instability, MAPE also transfers about 11.08 GW to the MKE and generates the eddies directly, implying that the MAPE not only supplies energy to generate eddies by baroclinic instability but also supplies energy to the barotropic process in KC area. We compare this energy cycle to that estimated by Chen et al. (2014) [12]. In these two energy cycles, the energy conversion rates are larger than that estimated from their results for our domain concludes the along-coast region. The two energy cycles are the same in transferring direction, showing two major power energy pathways directed from MAPE. Additionally, the energy pathway is different from that integrated in the global ocean [11]. For the global ocean, the baroclinic instability dominants the energy transferring to the eddies, and the rate for baroclinic to barotropic is about five times, while in the KC region the barotropic dominates the energy transferring path. A comparison of the energy cycles indicated that the barotropic process is the main path that generates the eddies, whereas the baroclinic instability is important on the open ocean.
Regarding the three subdomains, the energy cycles have different structure. In the KC1 and KC2 regions, the energy exchange pattern is similar to that in the KC region (Figure 12b,c). The energy cycle of the off-coast (KC3) region is different from those of the other regions (Figure 12d). The MAPE changes from a source to an energy sink, transferring energy from MKE to MAPE with a conversion rate of 2.7 GW. In summary, the two main energy pathways in the KC3 region are: MKE EKE and MKE MAPE EAPE EKE . This energy pathway is the same with the global ocean and Southern Ocean [11,44], indicating that the wind stress contributes energy to the ocean through the barotropic and baroclinic processes. For the KC3 area, the barotropic pathway dominates the energy transferring (28.1 GW), whereas the baroclinic pathway dominates the energy transferring in the global ocean.

4. Conclusions and Discussion

To summarize, using the ECCO2 outputs, we presented a detailed energetics analysis of the KC. The time-mean and time-varying energy equations, which are derived as in Kang and Curchitser (2015) [13], are used as the theoretical framework. Based on these equations, the distributions of energy reservoirs and the eddy–mean flow interaction are analyzed and the energy budget for the three subdomains is also investigated. In this study, we emphasized three subdomains representing the KC region, the KC1, KC2, and the KC3 regions.
The horizontal distributions of energy reservoirs are inhomogeneous in the KC region. The MKE is characterized by a narrow strip along the stream jet and gradually decrease in the KC3 region. The distribution of EKE gradually increases in the KC1 and KC2 regions and then experiences a maximum in the KC3 region. These features are the same as in previous studies [66,67,68]. In the vertical distributions, MKE and EKE reach their maximum in the upper 500 m, and the integrated values are 42.39 PJ and 68.19 PJ, respectively. The EAPE pattern is similar to EKE in the KC region, indicating an equivalent barotropic structure, with an integrated value of 142.69 PJ in the KC region. The magnitude of EAPE is slightly influenced by the density reference, while the value of MAPE has a strong dependence of the density reference with a number of 632.32 PJ in the KC region. Considering the energy pathway for the KC region, the energy is transferred from MAPE to EAPE with a rate of 70.13 GW. The EKE is generated by two mechanisms: the barotropic instability draws 84.9 GW from MKE to EKE, and the baroclinic instability converts 15.03 GW through MAPE EAPE EKE pathway. Beyond supplying energy to the baroclinic instability, MAPE also supplies energy to the MKE with a converse rate of 11.08 GW.
The energy conversions between the reservoirs are significant along the Kuroshio jet stream, and exhibit a more complicated pattern in the extension regions. In the KC1 region, the horizontal distribution of MKE and EKE shows a prominent cross-stream variation, which is MKE EKE in the offshore region and the conversion is EKE MKE in the inshore area. The energy conversion is almost from APE to KE except in the region immediately upstream of Bōsō Peninsula where eddies energize mean flow. In the vertical distribution of conversion rates, the energy transfers from mean to the eddy fields in both APE and KE. In the KC2 region, the mostly positive patterns are observed in MAPE EAPE EKE , implying a strong baroclinic instability.
In the KC3 region, a more complicated energy conversion pattern can be found. The conversion rates from mean flow to the eddy field ( MKE EKE ; MAPE EAPE ) present mixed positive–negative patterns. The conversion magnitude from APE to KE ( MKE MAPE ; EAPE EKE ) is smaller than the along-coast and upon-separation regions. Such spatial variation has been linked to the topography influence in this region [21]. The mixed conversion patterns between MKE and EKE are influenced by the topography. The MKE transfers energy to EKE in the whole water column and the MKE transfers to MAPE in the water column and the area-mean conversion rates in the off-coast region reaches its maximum at 400 m. Furthermore, the study here presents a systematic analyzing about the KC energetics and examining the energy budget, which can be applied to other oceans as well as used for seasonal and interannual variabilities in the KC region. This energetics approach may also be useful in understanding the behavior of coarser ocean models, where some, but not all, of the processes described here are parameterized.

Author Contributions

Conceptualization, Y.W. and C.L.; methodology, Y.W. and L.Y.; software, Y.W., D.Q. and K.L.; validation, J.Q., Q.Q., D.Q., X.Z., J.L., Y.Z., H.G. and J.W.; formal analysis, Y.W. and H.C.; investigation, Y.W. and K.Z.; resources, Y.W., D.Q. and Y.W.; data curation, Y.W. and Z.Q.; writing—original draft preparation, Y.W.; writing—review and editing, Y.W.; visualization, Y.W.; supervision, Y.W.; funding acquisition, Y.W. and C.L. All authors have read and agreed to the published version of the manuscript.

Funding

This research was funded by the National Key R&D Program of China (2024YFF0506603), the Independent Research Foundation of Southern Marine Science and Engineering Guangdong Laboratory (Zhuhai) (SML2023SP201), the Natural Science Foundation of Guangdong Province, China (2024A1515012717), the National Natural Science Foundation of China, grant numbers 41806216, the Natural Science Foundation of Jiangsu Province, grant number BK20211015, the China Postdoctoral Science Foundation, grant numbers 2019T120379 and 2018M630499, and the Talent start-up fund of Nanjing Xiaozhuang University, grant number 4172111. Jianfen Wei is supported by the Natural Science Foundation of the Jiangsu Higher Education Institutions of China (Grant No. 23KJB170024) and by the Talent Start-up Fund of Wuxi University (Grant No. 2023r038); Dalei Qiao is supported by the Natural Science Foundation of the Jiangsu Higher Education Institutions of China (23KJA580002); and Jing Li is supported by the National Natural Science Foundation of China, grant number 62205150.

Data Availability Statement

The data presented in this study are available on request from the corresponding authors.

Acknowledgments

The MITgcm code was obtained freely from http://mitgcm.org/ (accessed on 27 June 2025). The atmospheric forcing data were obtained freely from the NCAR’s research data archive (JRA-55: https://rda.ucar.edu/datasets/ds625.0/) (accessed on 27 June 2025).

Conflicts of Interest

The authors declare no conflicts of interest.

References

  1. Qiu, B. Kuroshio Extension variability and forcing of the Pacific Decadal Oscillations: Responses and potential feedback. J. Phys. Oceanogr. 2003, 33, 2465–2482. [Google Scholar] [CrossRef]
  2. Qiu, B.; Chen, S.M. Variability of the Kuroshio Extension jet, recirculation gyre and mesoscale eddies on decadal time scales. J. Phys. Oceanogr. 2005, 35, 2465–2482. [Google Scholar] [CrossRef]
  3. Greatbatch, R.J.; Zhai, X.; Kohlmann, J.D.; Czeschel, L. Ocean eddy momentum fluxes at the latitudes of the Gulf Stream and the Kuroshio extensions as revealed by satellite data. Ocean Dyn. 2010, 60, 617–628. [Google Scholar] [CrossRef]
  4. Scharffenberg, M.; Stammer, D. Seasonal variations of the large-scale geostrophic flow field and eddy kinetic energy inferred from the TOPEX/Poseidon and Jason-1 tandem mission data. J. Geophy. Res. 2010, 115, C02008. [Google Scholar] [CrossRef]
  5. Yang, Y.; Liang, X.S.; Qiu, B.; Chen, S. On the decadal variability of the eddy kinetic energy in the Kuroshio extension. J. Phys. Oceanogr. 2017, 47, 1169–1187. [Google Scholar] [CrossRef]
  6. Ferrari, R.; Wunsch, C. The distribution of eddy kinetic and potential energies in the global ocean. Tellus 2010, 62A, 92–108. [Google Scholar] [CrossRef]
  7. Chen, X.; Qiu, B.; Chen, S.; Qi, Y.; Du, Y. Seasonal eddy kinetic energy modulations along the North Equatorial Countercurrent in the western Pacific. J. Geophys. Res. Oceans 2015, 120, 6351–6362. [Google Scholar] [CrossRef]
  8. Hui, Y.; Zhang, L.; Yan, X.; Li, M.; Wang, F.; Hu, D. Energetics of eddy-mean flow interactions in the western tropical Pacific Ocean. Deep Sea Res. 2024, 208, 12. [Google Scholar] [CrossRef]
  9. Waterman, S.; Jayne, S.R. Eddy-mean flow interaction in the along-stream development of a western boundary current jet: An idealized model study. J. Phys. Oceanogr. 2011, 41, 682–707. [Google Scholar] [CrossRef]
  10. Waterman, S.; Hogg, N.G.; Jayne, S.R. Eddy–Mean Flow Interaction in the Kuroshio Extension Region. J. Phys. Oceanogr. 2011, 41, 1182–1208. [Google Scholar] [CrossRef]
  11. von Storch, J.; Eden, C.; Fast, I.; Haak, H.; Hernndez-Deckers, D.; Maier-Reimer, E.; Marotzke, J.; Stammer, D. An estimate of Lorenz energy cycle for the world ocean based on the 1/10 STORM/NCEP simulation. J. Phys. Oceanogr. 2012, 42, 2185–2205. [Google Scholar] [CrossRef]
  12. Chen, R.; Flierl, G.R.; Wunsch, C. A Description of Local and Nonlocal Eddy–Mean Flow Interaction in a Global Eddy-Permitting State Estimate. J. Phys.Oceanogr. 2014, 44, 2336–2352. [Google Scholar] [CrossRef]
  13. Kang, D.J.; Curchitser, E.N. Energetics of Eddy-Mean Flow Interactions in the Gulf Stream Region. J. Phys. Oceanogr. 2015, 45, 1103–1120. [Google Scholar] [CrossRef]
  14. Lorenz, E.N. Available potential energy and the maintenance of the general circulation. Tellus 1955, 7, 157–167. [Google Scholar] [CrossRef]
  15. Pedlosky, J. Geophysical Fluid Dynamics; Springer: New York, NY, USA, 1987; 710p. [Google Scholar]
  16. Li, L.; Ingersoll, A.P.; Jiang, X.; Feldman, D.; Yuk, L.Y. Lorenz energy cycle of the global atmosphere based on reanalysis datasets. Geophys. Res. Lett. 2007, 34, L16813. [Google Scholar] [CrossRef]
  17. Murakami, S. Atmospheric local energetics and energy interactions between mean and eddy fields. Part I: Theory. J. Atmos. Sci. 2011, 68, 760–768. [Google Scholar] [CrossRef]
  18. Murakami, S.; Ohgaito, R.; Abe-Ouchi, A. Atmospheric local energetics and energy interactions between mean and eddy fields. Part II: An example for the last glacial maximum climate. J. Atmos. Sci. 2011, 68, 533–552. [Google Scholar] [CrossRef]
  19. Jan, S.; Mensah, V.; Andres, M.; Chang, M.H.; Yang, Y.J. Eddy-Kuroshio interactions: Local and remote effects. J. Geophys. Res. Oceans 2017, 122, 9744–9764. [Google Scholar] [CrossRef]
  20. Peng, Z.; Zhang, S. Seasonal Variation of Submesoscale Ageostrophic Motion and Geostrophic Energy Cascade in the Kuroshio. J. Mar. Sci. Eng. 2024, 12, 1121. [Google Scholar] [CrossRef]
  21. Nakamura, H.; Nishina, A.; Ichikawa, H.; Nonaka, M.; Sasaki, H. Deep countercurrent beneath the Kuroshio in the Okinawa Trough. J. Geophys. Res. 2008, 113, C06030. [Google Scholar] [CrossRef]
  22. Lin, X.; Wu, D.; Li, Q.; Lan, J. An amplification mechanism of intraseasonal long rossby wave in subtropical ocean. J. Phys. Oceanogr. 2005, 61, 369–378. [Google Scholar] [CrossRef]
  23. Qiu, B.; Chen, S. Eddy-mean flow interaction in the decadally modulating Kuroshio Extension system. Deep Sea Res. 2010, 57, 1098–1110. [Google Scholar] [CrossRef]
  24. Chelton, D.B.; Schlax, M.G.; Samelson, R.M. Global observations of nonlinear mesoscale eddies. Prog. Oceanogr. 2011, 91, 167–216. [Google Scholar] [CrossRef]
  25. Wood, R.A. Unstable waves on oceanic fronts: Large amplitude behavior and mean flow generation. J. Phys. Oceanogr. 1988, 18, 775–787. [Google Scholar] [CrossRef]
  26. Tai, C.K.; White, W.B. Eddy variability in the Kuroshio Extension as revealed by GEOSAT altimetry: Energy propagation away from the jet, Reynolds stress, and seasonal cycle. J. Phys. Oceanogr. 1990, 20, 1761–1777. [Google Scholar] [CrossRef]
  27. Xu, C.; Shang, X.D.; Huang, R.X. Estimate of eddy energy generation/dissipation rate in the world ocean from altimetry data. Ocean Dyn. 2011, 61, 525–541. [Google Scholar] [CrossRef]
  28. Holland, W.R.; Lin, L.B. On the generation of mesoscale eddies and their contributionto the oceanic general circulation. I. A preliminary numerical experiment. J. Phys. Oceanogr. 1975, 5, 642–657. [Google Scholar] [CrossRef]
  29. Holland, W.R.; Lin, L.B. On the generation of mesoscale eddies and their contribution to the oceanic general circulation. II. A parameter study. J. Phys. Oceanogr. 1975, 5, 658–669. [Google Scholar] [CrossRef]
  30. Holland, W.R. The role of mesoscale eddies in the general circulation of the ocean-Numerical experiments using a wind-driven quasi-geostrophic model. J. Phys. Oceanogr. 1978, 8, 363–392. [Google Scholar] [CrossRef]
  31. Thompson, R.O.R.Y. Reynolds stress and deep countercurrents near the Gulf Stream. J. Mar.Res. 1978, 36, 611–615. [Google Scholar]
  32. Dewar, W.K.; Bane, J.M. Gulf Stream dynamics. Part II: Eddy energetics at 738W. J. Phys. Oceanogr. 1989, 19, 1574–1587. [Google Scholar] [CrossRef]
  33. Hogg, N.G. On the transport of the Gulf Stream between Cape Hatteras and the Grand Banks. J. Mar. Res. 1992, 50, 545–566. [Google Scholar] [CrossRef]
  34. Watts, D.R.; Tracey, K.L.; Bane, J.M.; Shay, T.J. Gulf Stream path and thermocline structure near 74 W and 68 W. J. Geophys. Res. 1995, 100, 18291–18312. [Google Scholar] [CrossRef]
  35. Hogg, N.G. A note on the deep circulation of the western North Atlantic: Its nature and causes. Deep-Sea Res. 1983, 30, 945–961. [Google Scholar] [CrossRef]
  36. Hogg, N.G. Evidence for baroclinic instability in the Gulf Stream recirculation. Prog. Oceanogr. 1985, 14, 209–229. [Google Scholar] [CrossRef]
  37. Hogg, N.G. Toward parameterization of the eddy field near the Gulf Stream. Deep-Sea Res. 1993, 40, 2359–2376. [Google Scholar] [CrossRef]
  38. Nishida, H.; White, W. Horizontal eddy fluxes of momentum and kinetic energy in the near-surface of the Kuroshio Extension. J. Phys. Oceanogr. 1982, 12, 160–170. [Google Scholar] [CrossRef]
  39. Hall, M.M. Energetics of the Kuroshio Extension at 35°N, 152°E. J. Phys. Oceanogr. 1991, 21, 958–975. [Google Scholar] [CrossRef]
  40. Eden, C.; Greatbatch, R.J.; Willebrand, J. A diagnosis of thickness fluxes in an eddy-resolving model. J. Phys. Oceanogr. 2007, 37, 727–742. [Google Scholar] [CrossRef]
  41. Nagai, T.; Hasegawa, D.; Tsutsumi, E.; Nakamura, H.; Nishina, A.; Senjyu, T.; Endoh, T.; Matsuno, T.; Inoue, R. The Kuroshio flowing over seamounts and associated submesoscale flows drive 100-km-wide 100–1000-fold enhancement of turbulence. Commun. Earth Environ. 2021, 2, 170. [Google Scholar] [CrossRef]
  42. Whalen, C.B.; Talley, L.D.; MacKinnon, J.A. Spatial and temporal variability of global ocean mixing inferred from Argo profiles. Geophys. Res. Lett. 2012, 39, L18612. [Google Scholar] [CrossRef]
  43. Kang, D.; Curchitser, E.N. On the evaluation of seasonal variability of the ocean kinetic energy. J. Phys. Oceanogr. 2017, 47, 1675–1683. [Google Scholar] [CrossRef]
  44. Wu, Y.; Wang, Z.; Liu, C. On the response of the Lorenz energy cycle for the Southern Ocean to intensified westerlies. J. Geophys. Res. Oceans 2017, 122, 2465–2493. [Google Scholar] [CrossRef]
  45. Wu, Y.; Wang, Z.M.; Liu, C.Y.; Lin, X. Impacts of high-frequency atmospheric forcing on Southern Ocean circulation and Antarctic sea ice. Adv. Atmos. Sci. 2020, 37, 515–531. [Google Scholar] [CrossRef]
  46. Wu, Y.; Wang, Z.M.; Liu, C.; Yan, L.J. Energetics of Eddy-Mean Flow Interactions in the Amery Ice Shelf Cavity. Front. Mar. Sci. 2021, 8, 638741. [Google Scholar] [CrossRef]
  47. Stewart, K.D.; Saenz, J.A.; Hogg, A.M.; Hughes, G.O.; Griffiths, R.W. Effect of topographic barriers on the rates of available potential energy conversion of the oceans. Ocean Model. 2014, 76, 31–42. [Google Scholar] [CrossRef]
  48. Zemskova, V.E.; White, B.L.; Scotti, A. Available potential energy and the general circulation: Partitioning wind, buoyancy forcing, and diapycnal mixing. J. Phys. Oceanogr. 2015, 45, 1510–1531. [Google Scholar] [CrossRef]
  49. Adcroft, A.; Campin, J.M.; Hill, C.; Marshall, J. Implementation of an atmosphere–ocean general circulation model on the expanded spherical cube. Mon. Wea. Rev. 2004, 132, 2845–2863. [Google Scholar] [CrossRef]
  50. Marshall, J.; Adcroft, A.; Hill, C.; Perelman, L.; Heisey, C. A finite-volume, incompressible Navier Stokes model for studies of the ocean on parallel computers. J. Geophys. Res. 1997, 102, 5753–5766. [Google Scholar] [CrossRef]
  51. Marshall, J.; Hill, C.; Perelman, L.; Adcroft, A. Hydrostatic, quasi-hydrostatic, and nonhydrostatic ocean modeling. J. Geophys. Res. 1997, 102, 5733–5752. [Google Scholar] [CrossRef]
  52. Losch, M.; Menemenlis, D.; Heimbach, P.; Campin, J.; Hill, C. On the formulation of sea-ice models. Part 1: Effects of different solver implementations and parameterizations. Ocean Model. 2010, 33, 129–144. [Google Scholar] [CrossRef]
  53. Large, W.; McWilliams, J.; Doney, S. Oceanic vertical mixing: A review and a model with a nonlocal boundary layer parameterization. Rev. Geophys. 1994, 32, 363–403. [Google Scholar] [CrossRef]
  54. Menemenlis, D.; Hill, C.; Adcrocft, A.; Campin, J.-M.; Cheng, B.; Ciotti, B.; Fukumori, I.; Heimbach, P.; Henze, C.; Köhl, A.; et al. NASA supercomputer improves prospects for ocean climate research. EOS Trans. Amer. Geophys. Union 2005, 86, 89–96. [Google Scholar] [CrossRef]
  55. Menemenlis, D.; Fukumori, I.; Lee, T. Using Green’s functions to calibrate an ocean general circulation model. Mon. Wea. Rev. 2005, 133, 1224–1240. [Google Scholar] [CrossRef]
  56. Menemenlis, D.; Campin, J.; Heimbach, P.; Hill, C.; Lee, T.; Nguyen, A.; Schodlock, M.; Zhang, H. ECCO2: High Resolution Global Ocean and Sea Ice Data Synthesis; Mercator Ocean Quarterly News Letter, No. 31; Mercator Ocean: Ramonville Saint-Agne, France, 2008; pp. 13–21. [Google Scholar]
  57. Wunsch, C. The work done by the wind on the oceanic general circulation. J. Phys.Oceanogr. 1998, 28, 2332–2340. [Google Scholar] [CrossRef]
  58. Roquet, F.; Wunsch, C.; Madec, G. On the patterns of wind-power input to the ocean circulation. J. Phys.Oceanogr. 2011, 41, 2328–2342. [Google Scholar] [CrossRef]
  59. Qiu, B.; Kelly, K.A.; Joyce, T.M. Mean flow and variability in the Kuroshio extension from Geostat altimetry data. J. Phys. Oceanogr. 1991, 96, 18491–18507. [Google Scholar]
  60. Wunsch, C.; Ferrari, R. Vertical mixing, energy, and the general circulation of the oceans. Annu. Rev. Fluid Mech. 2004, 36, 281–314. [Google Scholar] [CrossRef]
  61. Roullet, G.; Capet, X.; Maze, G. Global interior eddy available potential energy diagnosed from Argo floats. Geophys. Res. Lett. 2014, 41, 1651–1656. [Google Scholar] [CrossRef]
  62. Ji, J.; Dong, C.; Zhang, B.; Liu, Y.; Zou, B.; King, G.P.; Xu, G.; Chen, D. Oceanic eddy characteristics and generation mechanisms in the Kuroshio Extension region. J. Geophys. Res. Oceans 2018, 123, 8548–8567. [Google Scholar] [CrossRef]
  63. Kang, D.; Curchitser, E.N.; Rosati, A. Seasonal variability of the Gulf Stream kinetic energy. J. Phys. Oceanogr. 2016, 46, 1189–1207. [Google Scholar] [CrossRef]
  64. Yan, X.; Kang, D.; Curchitser, E.N.; Pang, C. Energetics of eddy-mean flow interactions along the western boundary currents in the North Pacific. J. Phys. Oceanogr. 2019, 49, 789–810. [Google Scholar] [CrossRef]
  65. Yan, X.; Kang, D.; Pang, C.; Zhang, L.; Liu, H. Energetics analysis of the eddy-Kuroshio interaction east of Taiwan. J. Phys. Oceanogr. 2022, 52, 647–664. [Google Scholar] [CrossRef]
  66. Rieck, J.K.; Boing, C.W.; Greatbatch, R.J.; Scheinert, M. Seasonal variability of eddy kinetic energy in a global high-resolution ocean model. Geophys. Res. Lett. 2015, 42, 9379–9386. [Google Scholar] [CrossRef]
  67. Yang, Y.; Liang, X.S. On the seasonal eddy variability in the Kuroshio extension. J. Phys. Oceanogr. 2018, 48, 1675–1689. [Google Scholar] [CrossRef]
  68. Yan, X.; Kang, D.; Curchitser, E.N.; Liu, X.; Pang, C.; Zhang, L. Seasonal Variability of Eddy Kinetic Energy along the Kuroshio Current. J. Phys. Oceanogr. 2023, 53, 1731–1752. [Google Scholar] [CrossRef]
Figure 1. Spatial distributions of the vertical integrated (upper 1000 m) energy reservoirs: MKE ((a), 105 J m−2), EKE ((b), 105 J m−2), MAPE ((c), 107 J m−2), and EAPE ((d), 105 J m−2). The boxed areas in (a) represent subdomains that are analyzed in this study: the Kuroshio Current region (black, KC) and its along-coast region (red, KC1), upon-separation region (blue, KC2), and off-coast region (magenta, KC3). The location of Bōsō Peninsula is labeled by a black circle in (b).
Jmse 13 01304 g001
Figure 2. Profiles of (a) reference density and (b) buoyancy frequency from the model outputs averaged over the last 10 years. Black line represents the density reference over the entire region, while the red and blue lines represent the KC and the KC3 regions, respectively.
Jmse 13 01304 g002
Figure 3. Horizontal distributions of MKE, EKE, and EAPE (J m−3) at 55 m, 105 m, and 410 m depth.
Jmse 13 01304 g003
Figure 4. Vertical profiles of the area mean energy reservoirs (J m−3) in the four subdomains, as labeled in Figure 1a.
Jmse 13 01304 g004
Figure 5. The distributions of MKE generation by time-mean zonal wind stress ((a), τ x , 10−3 W m−2), meridional wind stress ((b), τ y , 10−3 W m−2), and total wind stress ((c), τ , 10−3 W m−2); Figures (df) present the distributions of EKE generation by time-varying zonal wind stress ((d), τ x , 10−3 W m−2), time-varying meridional wind stress ((e), τ y , 10−3 W m−2), and total time-varying wind stress ((f), τ , 10−3 W m−2).
Jmse 13 01304 g005
Figure 6. Distributions of net ocean surface heat flux ((a), W m−2) and fresh water flux ((b), 10−4 kg m−2 s−1); Figures (c,e,g) present the generation of MAPE by heat flux (10−5 W m−2), fresh water flux (10−3 W m−2), and the total buoyancy flux (10−3 W m−2), respectively. Figures (d) (10−5 W m−2), (f) (10−5 W m−2), and (h) (10−5 W m−2) are the same as that in Figures (c,e,g), but for the generation of EAPE.
Jmse 13 01304 g006
Figure 7. Horizontal distributions of the vertical integrated conversion rates (10−2 W m−2) from MKE to EKE (a) and from EKE to MKE (b); Figure (c) shows the difference of energetic conversion rate between Figure (a) and Figure (b). Figures (df) are the same as Figures (ac), but for energetic conversion rate between MAPE and EAPE. Figures (g,h) present the energy conversion rates from MAPE to MKE and from EAPE to EKE, respectively. The total energy conversion rate from available potential energy to kinetic energy are shown in Figure (i). Bathymetry contours are presented at 1000 m, 2000 m, 3000 m, 4000 m, and 5000 m.
Jmse 13 01304 g007
Figure 8. Horizontal distribution of the conversion rates between MKE and EKE (10−5 Wm−3) at the 55 m, 105 m and 410 m depths. The black solid lines in Figures (a,d) indicate the position of the vertical profiles depicted in Figure 10.
Jmse 13 01304 g008
Figure 9. Horizontal distribution of the conversion rates between MAPE, EAPE, and EKE (10−5 Wm−3) at the 55 m, 105 m and 410 m depths. The black solid lines in Figures (a,d) indicate the position of the vertical profiles depicted in Figure 10.
Jmse 13 01304 g009
Figure 10. Vertical profile of the energy conversion rates between MKE and EKE, EAPE and EKE, and MAPE and EAPE (10−4 Wm−3) along the section indicated in Figure 8.
Jmse 13 01304 g010
Figure 11. Vertical profiles of the area—mean energy conversion rates for the four subdomains (10−5 W m−3).
Jmse 13 01304 g011
Figure 12. Schematics of the energy budget (volume integration) for KC (a), KC1 (b), KC2 (c), and KC3 (d). Energy reservoirs and conversion rates are in units of petajoules (PJ = 1015 J) and gigawatts (GW = 109 W), respectively.
Jmse 13 01304 g012
Disclaimer/Publisher’s Note: The statements, opinions and data contained in all publications are solely those of the individual author(s) and contributor(s) and not of MDPI and/or the editor(s). MDPI and/or the editor(s) disclaim responsibility for any injury to people or property resulting from any ideas, methods, instructions or products referred to in the content.

