Abstract
This paper addresses the need for an integrated approach to develop an improved clam dredge system. Current designs often rely on empirical methods, resulting in a disconnect between theoretical models, computational simulations, and experimental validation. To bridge this gap, the study integrates computational fluid dynamics (CFD), experimental tests, and analytical methods to develop a clam dredge system. Firstly, the paper introduces an analytical tool that facilitates decision making by evaluating pump parameters, and to determine the operating point for various hose and nozzle parameters. This guides the parameter selection of pump, hose and jets for maximum performance. Secondly, CFD is utilized to analyze flow behavior, enabling the design of internal nozzle geometries that minimize head losses and maximize the scouring effect. A full-scale experimental measurement was conducted to validate computational results. Furthermore, a replica manifold is constructed using 3D printing and tested, demonstrating improvements in jet speed with both original and new nozzle designs. Analytical results indicate that increasing hose length reduces BHP, flow rate, and jet velocity, while increasing hose or jet diameter boosts BHP and flow but reduces jet speed due to pressure drops. Switching pumps reduced power consumption by 10.5% with minimal speed loss. The CFD analysis optimized nozzle design, reducing jet loss and enhancing efficiency. The proposed slit nozzle design reduces the loss coefficient by 85.24% in small-scale runs and by 83% in full-scale runs compared to the original circular jet design. The experiments confirmed the pressure differences between the CFD and experimental tests are within 10%, and demonstrated that rectangular jets increase speed by 9% and seafloor force by 19%. This paper improved the hydrodynamic design of the clam dredge system, and provides a framework for future dredge system designs.
1. Introduction
Clam dredging is a crucial component of the global seafood industry, providing a primary means of harvesting clams from ocean beds. Hydraulic clam dredges, which range in width from 100 to 250 inches, utilize high-pressure water jets to loosen sediment and extract clams efficiently. These systems function by directing water from an onboard pump through a large hose, which is then distributed via a manifold to a series of nozzles. The operational efficiency of these dredges significantly impacts fuel consumption, harvesting time, and economic viability. Figure 1a illustrates a clam dredge actively collecting clams from the seabed, while Figure 1b depicts the dredge after completing a harvesting cycle.

Figure 1.
Clamming with hydraulic dredge. Courtesy of Captain Tom Dameron.
Despite their widespread use, existing clam dredge designs suffer from inefficiencies that result in excessive energy consumption, suboptimal sediment disturbance, and environmental concerns. Many dredge designs in use today were developed decades ago using empirical methods [1,2], without a systematic integration of computational modeling and experimental validation. As fuel costs rise and environmental regulations tighten, there is a pressing need for an optimized dredge system that balances efficiency and operational effectiveness.
Computational tools, particularly computational fluid dynamics (CFD) [3,4,5,6,7], have been widely used to analyze various aspects of dredge operations. Several studies have focused on understanding hydrodynamic challenges and optimizing dredging system components. For example, Fuller et al. [8] reviewed hydrodynamic dredging challenges in the U.S., identifying operational bottlenecks. Beck et al. [9] examined hydrodynamic forces acting on ships in dredged channels, providing insights into fluid interactions that affect dredging efficiency. Liu et al. [10] conducted numerical analyses on axial forces in dredging pumps, demonstrating the role of axial clearance in system performance. Similarly, Cao et al. [11] used CFD to optimize the overflow duct in a trailing suction hopper dredger, improving sediment transport efficiency.
Beyond general hydrodynamic considerations, CFD has been applied to specific dredging operations, including clamshell dredging and jet-assisted sediment removal. Miedema and Becker [12] modeled the closing process of clamshell dredges, improving the understanding of operational efficiency. Petetta et al. [13] evaluated dredge selectivity in Mediterranean striped Venus clam fisheries, informing sustainable harvesting practices. Tuck et al. [14] studied the environmental effects of water jet dredging for razor clams in shallow subtidal environments, combining the modeling with field studies.
Advancements in dredge system design have also benefited from CFD-driven optimization. Weida [15] proposed a novel dredge design for silt removal, integrating mathematical modeling with CFD simulations to enhance efficiency. Chen et al. [16] applied CFD to optimize nozzle parameters in traditional drainage pipeline dredging devices, improving operational effectiveness. Teamia et al. [17] experimentally investigated jet pumps for dredging, demonstrating how geometric and operating conditions influence efficiency. Additionally, Yin [18] explored high-pressure submerged jet cutting for hard soil removal, highlighting the potential for uniform-cutting patterns in improved dredging systems.
Further research has focused on optimizing dredging pump performance. Cao et al. [19] investigated pressure fluctuations in sidewall gaps of centrifugal dredging pumps, identifying design modifications to minimize energy losses. Obregon et al. [20] performed an efficiency optimization study on centrifugal dredging pumps using CFD, offering insights into industrial-scale improvements. Ramirez et al. [21] explored cavitation effects in dredging pumps, characterizing and mitigating their impact on pump longevity and performance.
Experimental studies have also contributed to dredge system developments. Peng et al. [22] introduced an integrated dredging approach using pulsed water jets and air lift pumps, demonstrating improved sediment removal efficiency. El-Sawaf et al. [23] experimentally analyzed water jet pump performance, focusing on nozzle configurations to enhance the operational efficiency. Mueller [24] emphasized the role of hydraulic losses in water jet pump performance, providing design guidelines.
The optimization of dredging operations has been explored in several studies. Loney et al. [25] developed dredge portfolio optimization methods to improve waterway maintenance. Blazquez et al. [26] proposed strategies for optimizing mechanical dredging for sediment remediation. Paarlberg et al. [27] applied hydro-morphodynamic modeling to optimize dredging and dumping activities, ensuring the navigability of river systems.
Recent advancements in CFD and experimental fluid dynamics (EFD) have provided insights into pump performance and hydrodynamic design for dredging applications. For instance, Cárdenas-Gutiérrez et al. [28] conducted a parametric CFD analysis of centrifugal pumps, highlighting their applicability to dredging systems similar to ours. Korkmaz et al. [29] validated CFD-based form factors through EFD, supporting the robustness of our integrated CFD-EFD methodology. Oyuela et al. [30] investigated hydrodynamic resistance in marine systems, offering insights into jet and manifold design optimization. Additionally, Firat et al. [31] explored fluid force reduction in laminar flow regimes, providing strategies to minimize losses in manifold designs.
Three critical research gaps are recognized in this paper by reviewing the above literature: (1) Current dredge designs lack a comprehensive methodology that systematically integrates theoretical modeling, computational analysis, and experimental validation to enhance efficiency. (2) Existing studies primarily examine the individual components of the clam dredge system, but no research has comprehensively analyzed the entire system, including the pump, nozzles, and manifold. (3) The low efficiency of current jet designs in the current clam dredge system highlights the need for improvements in nozzle geometry and flow dynamics to enhance performance.
This study addresses the identified research gap by developing an integrated methodology for optimizing clam dredge system performance. The contents of this work are:
(a) An analytical method is introduced to determine the optimal operating point based on hose parameters (length and diameter), manifold/nozzle configurations (nozzle diameter and number of nozzles), and pump characteristics. This tool enables users to estimate the impact of these parameters on pump brake horsepower (BHP) and jet speeds, guiding the parameter selection of the pump for enhanced performance.
(b) CFD simulations are employed to analyze flow dynamics within the manifold and nozzles, allowing for the design of optimized nozzle and manifold geometries that minimizes head losses and enhances scouring efficiency. The impact of nozzle shape and distribution on pressure distribution at the seabed is also evaluated.
(c) Two experiments are conducted. A full-scale experimental test for the real manifold is conducted to validate the CFD results and a 3D-printed replica of the manifold is constructed to experimentally assess the jet speed improvements achieved by the redesigned nozzles.
The significance of this work lies in the development and validation of a novel slit nozzle design. Characterized by a high-aspect-ratio rectangular outlet, the slit nozzle significantly reduces flow separation and wall friction, resulting in a reduction in the loss coefficient by 85.24% in small-scale trials and 83% in full-scale field tests, compared to conventional circular nozzles. CFD simulations revealed the improved hydrodynamics of the new design, and experimental tests confirmed its performance in sediment excavation.
Another significance of this work lies in its comprehensive approach to optimizing clam dredge systems through the integration of an analytical method, CFD, and experimental validation. By developing an analytical tool, this study provides a systematic method for evaluating the key parameters such as hose and manifold configurations, pump characteristics, and jet dynamics, enabling informed decisions on optimal operating conditions. The findings show how hose length, diameter, jet configuration, and impeller size influence jet velocity and energy efficiency, ultimately guiding the selection of components that maximize performance while minimizing power consumption. The CFD analysis not only refined nozzle design to reduce head losses and enhance jet force but also demonstrated the impact of nozzle shape on sediment excavation efficiency. The full-scale experimental validation confirmed the predictive accuracy of the CFD models, and the experiments for the replica model verified the proposed nozzle design improvements. Together, the integrated framework and novel nozzle design improved the jet performance and energy efficiency of the clam dredge system, and provides a three-pronged framework for future dredge system design.
2. Methodology
This study utilized a three-pronged approach to develop an improved clam dredge system. First, an analytical method identified the optimal pump, hose, and nozzle configuration for maximum jet speed and minimal energy consumption. Next, CFD simulations analyzed flow patterns within the manifold and nozzles, leading to the design of new, low-loss nozzles. Finally, a full-scale experimental test is conducted to measure the pressure inside the manifold and to validate the CFD results. Then, an experimental test with a replica manifold is conducted, measuring the improvement in jet speed.
2.1. Analytical Method
In this part, classical fluid mechanics and hydraulics are applied to the dredge system consisting of the pump, the hose, and the manifold with the nozzles. The analytical method was developed to determine the pump selection and to investigate the effects of hose dimensions, jet parameters, and pump selections on brake horsepower (BHP), efficiency, and jet velocity (Vjet). The objective was to achieve a higher Vjet with lower BHP.
Table 1 contains key data for the selection of a pump and associated system parameters, divided into three main sections: pump selection, system parameters, and constants. In the pump selection section, a Goulds 3415 10X12-22 pump (product from Xylem Inc., Seneca Falls, NY, USA) is chosen, operating at 1650 RPM with an impeller diameter of 0.521 m, for its ability to meet the system’s required head and flow rate under operational conditions, including water depths and manifold pressures, as validated by CFD and experimental results. The system parameters section includes details such as a hose length of 91.44 m and a diameter of 0.254 m, with a roughness of 3.81 × m. The manifold loss coefficient is given as 0.67, and the exit area type is specified as jets, with 30 jets each having a diameter of 1.905 × m. The minor losses’ non-dimensional coefficient amounts to 9.69, with a friction factor set at 0.02. Finally, the constants section lists standard physical values used in the calculations: gravitational acceleration at , fluid density at , and viscosity at 1.0 × Pa·s. These parameters are used to evaluate pump performance, fluid flow, and system losses.

Table 1.
Pump selection, constants, and system parameters.
2.1.1. Pump Inclusion Procedure
The pumps involved in this project are shown in Table 2. All the pumps had their performance curves available either online or through their manufacturer. An example for the FAIRBANKS 10” 2825C pump at 1185 rpm is illustrated in Figure 2. The horizontal axis represents the flow rate (Q), which indicates the gallons of fluid flowing through the pump per minute. The vertical axis represents the total head (), which denotes the total energy imparted to the fluid by the pump, measured in feet. This includes both the static lift that the pump needs to overcome and the pressure it generates itself. The efficiency () curve resembles a bell shape, ranging from 70% to 87%, and signifies the ratio of useful hydraulic power output to the mechanical power input, reflecting how efficiently the pump utilizes energy.

Table 2.
Pumps evaluated in this study.
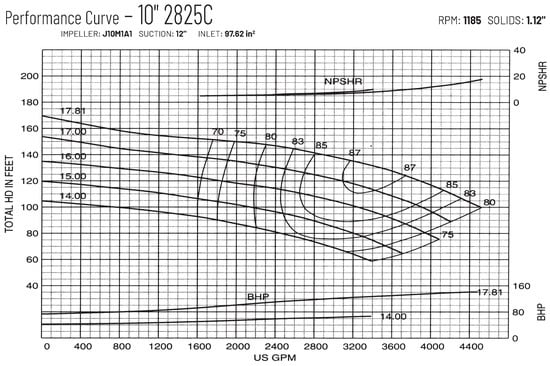
Figure 2.
Performance curves of the FAIRBANKS 10” 2825C pump.
Since the curves were presented graphically, numerical data for the performance curves and efficiency contours had to be manually extracted from the image. Regression analysis was conducted for each pump’s impeller diameter using the collected data to derive equations approximating the total head and efficiency. By extracting and fitting data points from these curves, discrete values were transformed into continuous relationships described by mathematical equations. The performance curves after extraction and fitting are depicted in Figure 3.
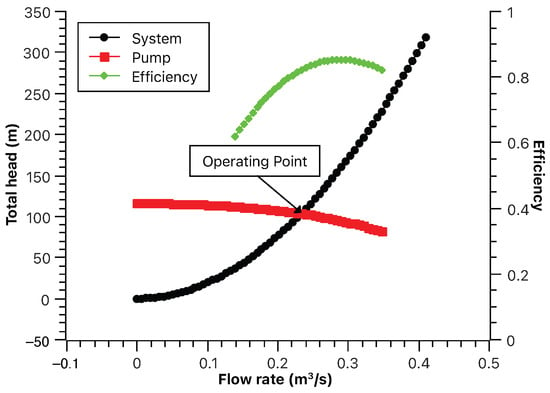
Figure 3.
Determination of the pump operating point.
These equations, denoted as vs. Q for total head and vs. Q for efficiency, enable the accurate predictions of the pump’s performance at any flow rate within its operational range. With the pump’s head and efficiency at a given flow rate now known, the system operating point, efficiency, and brake horsepower can be calculated based on Equation (1).
2.1.2. Required Pump Head of the System
The system’s required pump head, , is determined by the system flow rate Q, fluid density , gravitational acceleration g, and hose parameters including length L, diameter D, and the roughness of the hose material k. Additionally, the nozzle characteristics such as exit diameter , the number of nozzles , and head loss coefficient contribute to the overall system performance, with hose resistance being determined by the factor f. These parameters collectively govern the pump head required for the clam dredge system. A detailed derivation of Equation (1) is presented in Appendix A.
Equation (2) defines the efficiency of a clam dredge, denoted as . It is expressed as the ratio of the power generated by the jet to the Brake HorsePower (BHP) of the pump.
where represents the pump head, Q denotes the flowrate, is the efficiency of the pump, stands for fluid density, and represents the jet speed. With jet head = , can be written as
The brake horsepower of the pump is defined as Equation (4).
2.1.3. Inclusion of Minor Losses
Minor losses are defined as the loss in head associated with local disturbances to the flow from elements such as bends, valves, fittings, etc. Table 3 refers to the minor losses coefficients for different elements. The head loss from an element can be described using its minor loss coefficient, K:

Table 3.
Minor losses coefficients.
The total minor loss in a system equals the sum of the minor losses of each element. Therefore, the total energy loss in the dredge system can be expressed as
where is the flow rate, f is the Darcy friction factor of the hose, is the minor loss coefficient of the ith element, L is the hose length element, D is the hose diameter, and is the pipe diameter at the element.
2.2. CFD Method
The commercial software Ansys/Fluent (Version 21.2) is used to conduct the CFD approach. The governing equations solved are presented in this section.
2.2.1. Conservation of Mass
The equation for conservation of mass can be written as follows:
where is the density of the fluid. is the velocity vector of the fluid, t represents time.
2.2.2. Conservation of Momentum
The conservation of momentum in an inertial reference frame is described by
where p is the pressure, is the stress tensor, and is the gravitational body force.
The stress tensor is given by
where is the molecular viscosity, I is the unit tensor, and the second term on the right-hand side represents the effect of volume dilation.
2.2.3. Transport Equations for the Standard k– Model
The standard k– turbulence model is used to simulate turbulent flows. The simulation operates at a Reynolds number of approximately which places the flow well into the fully turbulent regime, making an eddy-viscosity model appropriate. While other models such as the k– SST and the realizable k– provide improved accuracy near walls and in adverse pressure gradient regions, the standard k– model remains widely used for general-purpose internal flow predictions, especially where wall resolution is not the primary concern. Originally proposed by Launder et al. [32], the standard k– model solves two transport equations for the turbulent kinetic energy (k) and its dissipation rate (), using the Boussinesq approximation for turbulence closure. The model constants ( = 0.09, = 1.44, = 1.92, = 1.0, = 1.3) are used.
The turbulence kinetic energy, k, and its rate of dissipation, , are calculated from the following transport equations:
In these equations, represents the production of turbulence kinetic energy due to the mean velocity gradients. , , and are constants. and are the turbulent Prandtl numbers for k and , respectively.
The turbulent viscosity, , is computed by combining k and as follows:
where is a constant.
2.2.4. Numerical Scheme
The FLUENT solver was employed with a second-order discretization scheme. The pressure–velocity coupling was handled using the SIMPLE algorithm. Convergence was monitored through residuals, with a criterion set at . The boundary conditions were specified as follows: velocity inlet and pressure outlet, with the latter set to atmospheric pressure. No-slip wall conditions were applied in internal flow simulations.
2.2.5. Loss Coefficients
The loss coefficients in Equation (1) can be determined using the CFD method. The calculation of the loss coefficient is defined as Equation (13):
where the inlet velocity, denoted as , and the exit velocity, denoted as , are calculated by dividing the flow rate by the respective areas of the inlet and outlet. represents the gauge pressure at the inlet, while the outlet pressure is assumed to be at ambient level. These values, , , and , are obtained from the CFD results.
2.3. Experimental Method
2.3.1. A Full-Scale Experimental Test
To eliminate potential scaling effects, a full-scale experimental test of the original manifold (as shown in Figure 4) was conducted at the Department of Marine and Coastal Sciences at Rutgers University. The dimensions of the manifold and jets are shown in Figure 5. The experiment replicated the flow rate used in the CFD simulations, and pressure distribution was measured at 36 designated locations within the manifold. The correlation between the experimental measurements and the CFD results is presented in Section 3.2.1.
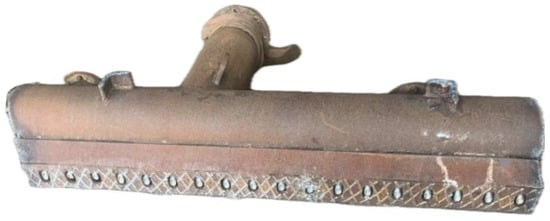
Figure 4.
Old manifold employed in the experimental tests.
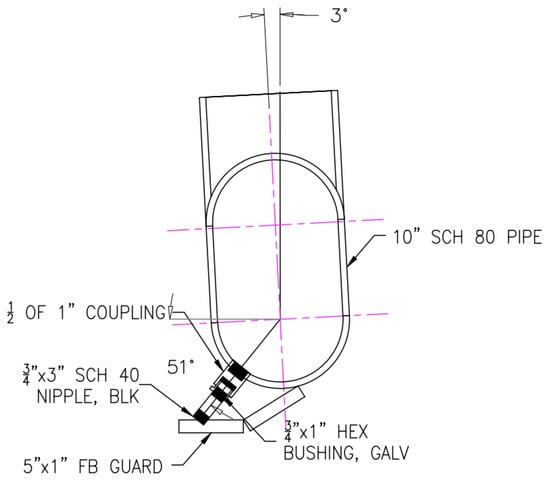
Figure 5.
Dimensions of the manifold and jets.
2.3.2. A Replica Experimental Test
This study utilizes the UT 3D printing facility to fabricate the experimental manifold model. Three-dimensional printing employs computer-aided design (CAD) software to construct layers of melted plastic, gradually forming the desired object. Three-dimensional printing enables the creation of components with flexible geometry and reduced production costs. We can tailor the design of jets and manifolds to our specific experimental needs.
Figure 6 shows the design of the 3D-printed manifold. Notably, the manifold and jets are separate, allowing for the easy connection and testing of different jet configurations, minimizing the time required for prototyping new designs.
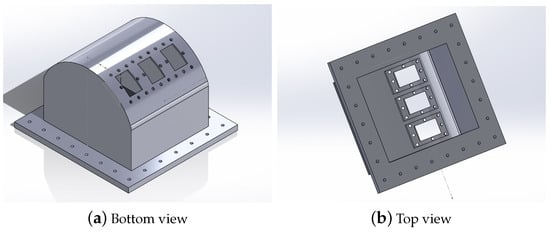
Figure 6.
Design of experimental manifold.
Figure 7 presents a comparison between two types of jets used in experimental tests. Figure 7a,b show the original 2-step jet and the rectangular jet, respectively. The original circular design features a circular entrance and exit, characterized by decreasing radii in incremental steps, and sharp edges at both the entrance and exit points. The rectangular jet includes a rectangular entrance and exit, featuring rounded corners and a converging size. Rounded edges are implemented for the jet inlet, while sharp edges are utilized at the jet exit. In subfigures (c) and (d), the view of the jets is transparent, allowing for a visualization of their internal structure and components.

Figure 7.
Jets employed in experimental test.
Figure 8 depicts the complete experimental setup, showing the combination of the 3D-printed manifold and jet components. The printing speed for the model is influenced by factors like nozzle diameter, material properties, print settings and model size. In this specific case, the manifold size has a printing time of several days. Each jet, while smaller, may have required several hours.
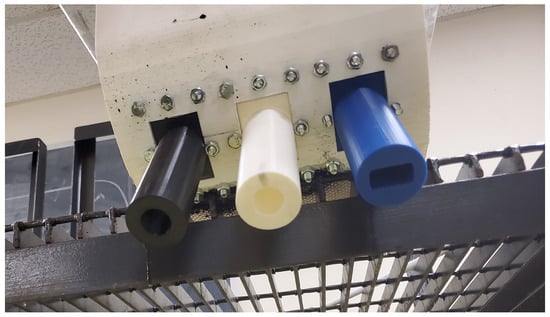
Figure 8.
Three-dimensional printed experimental manifold and jets.
3. Results and Discussion
3.1. Analytical Analysis
This section illustrates how the analytical method can lead to more efficient dredge systems in the case of the hose and the pump.
3.1.1. Determination of the Pump Operating Point
The pump is just one part of the clam dredge system. The operating point ensures the pump delivers the flow rate and pressure needed for the system to function correctly.
To find the operating point, besides the pump operating curves provided by the manufacturer, we need to consider another critical curve: the total head required for the clam dredge system, as described in Equation (1).
The total head curve of the pump ( vs. Q) exhibits a characteristic trend. It starts with a high value on the left and gradually descends towards the right as the flow rate (Q) increases. This decline in total head is a consequence of the pump encountering greater resistance with higher flow rates, thereby reducing the total head generated.
Figure 3 depicts how to find the operating points for a case with = 0.42, corresponding to the CFD results in Section 3.3.2. These figures visually represent the interplay between the pump’s total head curve and the total head requirements of the clam dredge system, facilitating the determination of the pump’s operating point under varying conditions.
3.1.2. Effect of Hose Dimensions
This section investigates the influence of hose dimensions, including length and diameter, on the brake horsepower (BHP) and jet speed (Vjet) of the dredging system.
Figure 9a illustrates the impact of hose length on the performance parameters. As hose length increases or decreases from the reference value, changes in BHP and Vjet are observed. Similarly, Figure 9b depicts how variations in hose diameter affect the system’s performance. The x axis shows the dimension of the hose and the y axis represents the percentage with respect to the reference value. A reference value of 1 corresponds to the following parameters: hose length of 91.44 m, hose diameter of 0.2032 m, 24 jets, jet diameter of 1.59 × m, and a Goulds Pump 3415 with an 0.4699 m diameter impeller. Figure 9a shows that BHP displays a decreasing trend as the hose length increases. Vjet exhibits a steeper decrease compared to BHP, indicating a more significant impact of the hose length on jet velocity. (b) shows that BHP, and Vjet all increase as the hose diameter increases. Vjet again exhibits a steeper increase compared to BHP, suggesting a stronger dependence on hose diameter for achieving higher jet velocities.
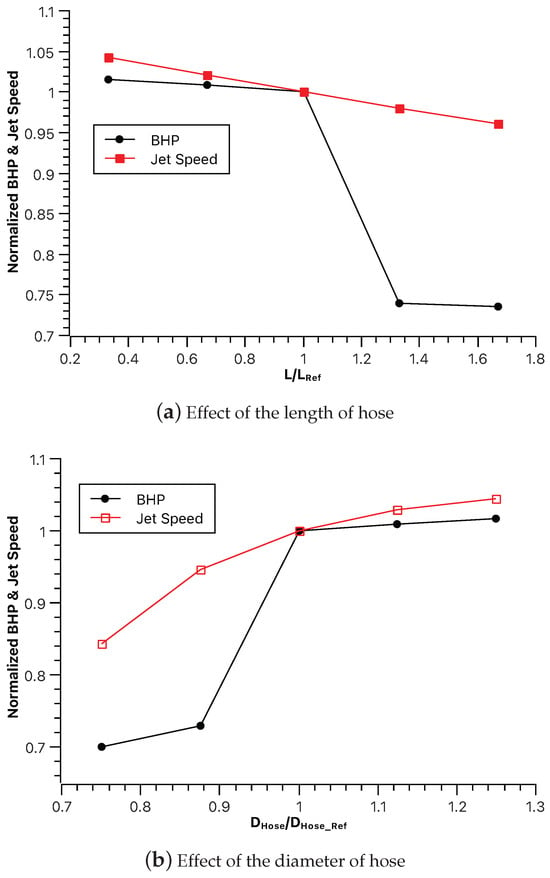
Figure 9.
Effect of hose dimensions.
3.1.3. Effect of Jets Number and Diameter
The influence of the number of jets () and the diameter of the jet on BHP and Vjet is shown in Figure 10. From Figure 10a, increasing the number of jets leads to an increase in both BHPs. This is because, with more jets, the pump needs to work harder to maintain pressure and deliver water through all jets, resulting in higher power consumption and flow rate. Increasing leads to a decrease in Vjet. With more jets, the total flow is divided among them, reducing the individual jet velocity. Figure 10b shows that increasing the diameter of the jet leads to an increase in BHP. Larger diameter jets offer less resistance to flow, allowing the pump to deliver more water with less effort. However, this might require higher pumping power to achieve the same pressure. Increasing the diameter of the jet leads to a decrease in Vjet due to pressure drops within the manifold.
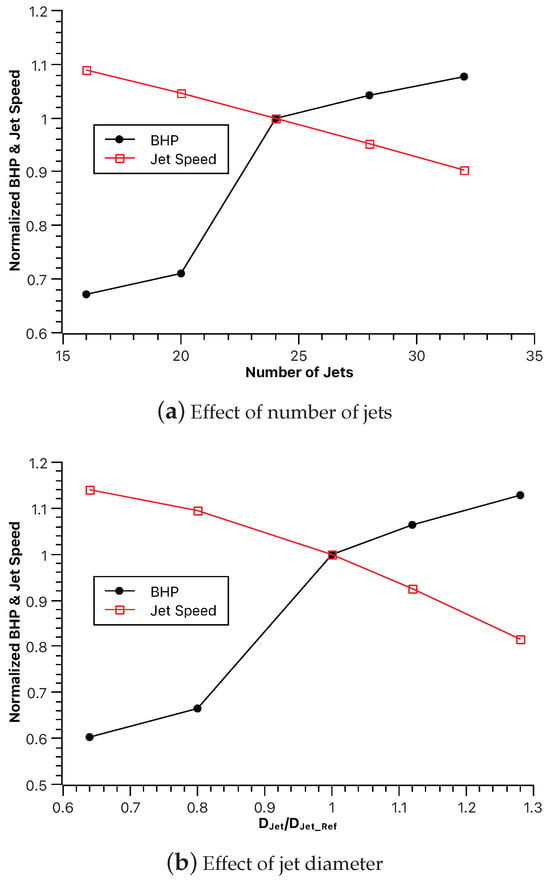
Figure 10.
Effect of jet dimensions.
More jets require more pressure head, potentially leading to higher production costs. Larger diameter jets offer less resistance, but they might require higher pumping power to achieve the same pressure, impacting overall system efficiency. While increases flow rate, it decreases individual jet velocity. This might affect the scouring depth and pattern, requiring further analysis in Section 3.3.4.
3.1.4. Effect of Impeller Diameter
Figure 11 illustrates the influence of the impeller diameter on BHP and Vjet. Increasing impeller diameter generally leads to increases in BHP. This aligns with the expectation of larger impellers having a greater capacity to move water, requiring more power to operate. Vjet increases continuously with the increasing impeller diameter. This suggests that the higher flow rate from the larger impeller directly translates to a higher jet velocity despite potential pressure drops.
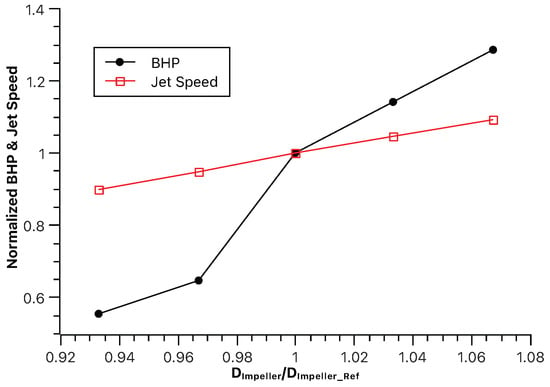
Figure 11.
Effect of impeller diameters.
3.1.5. Effect of the Pump Type
The impact of the pump type on jet speed, brake horsepower, and clam dredge efficiency was investigated by transitioning from the Fairbanks 2825A to the Goulds 3415 10X12-22 pump.
Figure 12, Figure 13 and Figure 14 depict the effect of pump type on jet speed, brake horsepower, and clam dredge efficiency, respectively. Switching from the Fairbanks 2825A to the Goulds 3415 pump, the impact of two impeller diameters was investigated. The larger impeller configuration is represented by the green group, while the smaller impeller is represented by the red group. Green group required 3.7% more power but yielded a 5.6% increase in jet speed. Additionally, dredge efficiency improved by 13.8%. This suggests the larger impeller delivers higher flow at the same pressure or operates near its optimal efficiency point. The red group consumed 10.5% less power compared to the baseline. However, the jet speed increase was minimal (0.3%). Despite this, dredge efficiency still rose by 13.8%.
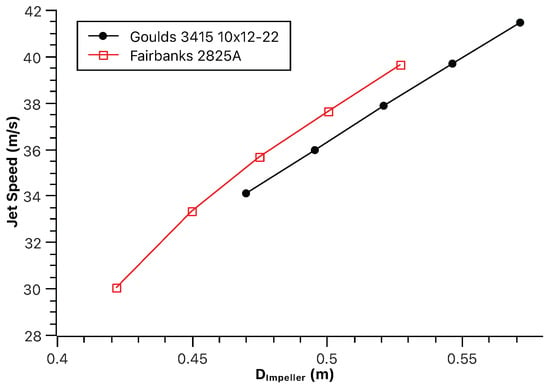
Figure 12.
Effect of the pump type on jet speed.
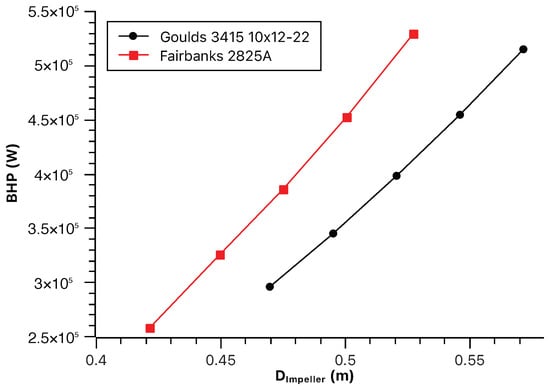
Figure 13.
Effect of the pump type on brake horsepower.
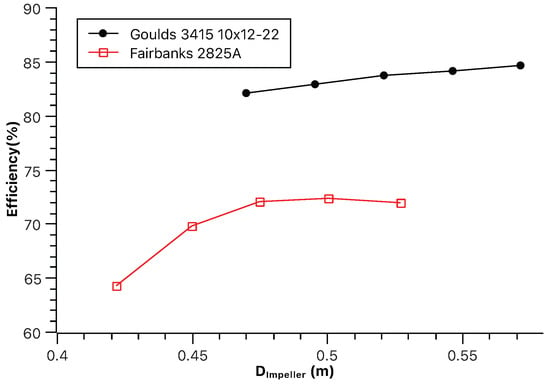
Figure 14.
Effect of the pump type on clam dredge efficiency.
The Goulds 3415 pump, regardless of impeller size, seems to offer the potential for increased efficiency compared to the Fairbanks pump in this case. If maximizing jet speed is crucial, a larger impeller within a pump like the Goulds 3415 might be a good choice, even if it requires more power. Even with a smaller jet speed increase, the smaller impeller group still achieves the same efficiency gain (13.8%) as the larger impeller. This suggests that depending on the specific needs of the operation, a smaller impeller can be a viable option for power savings without compromising efficiency too much.
3.2. Experimental Tests
3.2.1. Experimental Validation of Computational Pressure
Figure 15 illustrates the correlation between the predicted pressures generated by CFD and the pressures measured in an experimental test conducted at Rutgers University using pressure transducers. We are measuring pressure because it suffices as a proxy for efficiency because lower pressure drops indicate reduced energy losses, which correlate with improved operational efficiency. These locations correspond to pressure taps installed along the manifold’s length, specifically at evenly spaced intervals. The flow rate was controlled to match the CFD input using a calibrated pump flow controller. The x axis represents the gauge number, while the y axis indicates the pressure in pa and the differences in percentage. The data points correspond to the pressures measured inside the manifold during the experiment.
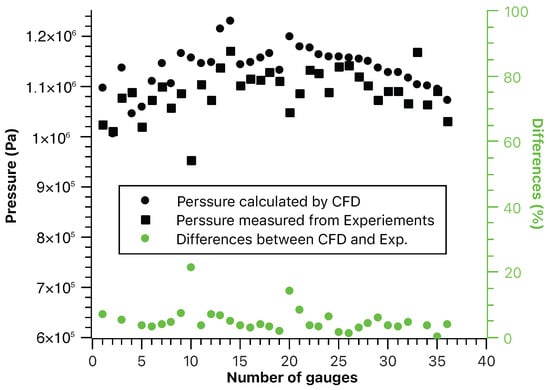
Figure 15.
Experimental validation between computational pressure and tested pressure.
This figure provides insight into the agreement between predicted and measured pressures, facilitating an evaluation of the predictive accuracy of the CFD method compared to experimental results. The “differences (%)” axis represents the percentage difference between CFD-predicted and experimentally measured pressures, calculated as . Most of the differences fall within the range of 10%, indicating good agreement. However, one outlier exhibits a higher deviation of around 20%, suggesting a potential discrepancy in that specific case.
3.2.2. Experimental Tests of Replica Model on Flow Rate
We printed our manifold and our original jets using UT’s 3D printers. As shown in Figure 7, the internal section of the nozzle has several discontinuous sections, which lead to the local separation of the flow and abrupt pressure changes along the nozzle, which eventually result in increased head loss. We then decided to improve the nozzle geometry by using a more tapered shape, where results from our CFD analysis (details of which are given in the next section) shows that the corresponding loses coefficients is much smaller. This improved design was found that would increase the jet speed by , while would increase the pump power, BHP, by . Given that jet force goes with the square of the jet speed, this would increase the jet force on the sea-floor by about . However, constructing this improved geometry posed challenges. Hence, an alternative proposal suggested using a nozzle with continuous slit geometry across the manifold, facilitated by two closely positioned plates with an area equal to the sum of all exit areas of the nozzles. This geometry would be created by 2 plates which should be very close to each other, with an area equal to the sum of all the exit areas of the nozzles. Given the difficulty of building such a geometry on UT’s 3D printers, in order to test this improved geometry, we decided to instead use a rectangular exit area for the nozzles equal to that of each circular nozzle.
The original and the new geometry were tested, as shown in Figure 16. The jet speeds were measured by collecting and weighing the amount of water coming out of each nozzle over 10 s. The average over three measurements was taken. It was found that the jet speed of the improved rectangular jet was 3.006 m/s versus 2.758 m/s of that of the original round jet. That was a 9% larger jet speed which would correspond to a 19% increased pressure/force on the sea floor.
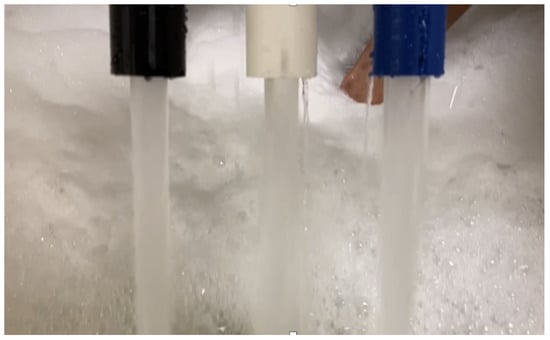
Figure 16.
Experimental flow rate test.
3.3. Computational Analysis
We performed computational fluid dynamics (CFD) analysis by running ANSYS/Fluent/v212 on the high-performance computer systems at Texas Advanced Computing Center (TACC) at UT Austin. Our simulations addressed two types of flows: (a) the flow inside the manifold and through the nozzles; and (b) the flow in the domain around the jets between the exit from the nozzle and the sea-floor. Various nozzle geometries and number of nozzles were used.
3.3.1. Convergence Test
A mesh convergence test was performed using three different mesh sizes: 5 million, 7.5 million, and 10 million cells. Due to the use of the standard k– turbulence model, the dimensionless wall distance () was maintained between 50 and 200 around the manifold, which is appropriate for wall-function-based approaches. Figure 17 compares the pressure profile extracted along the jet centerline for three successively refined hybrid meshes. The computational mesh was hybrid, with tetrahedral elements near the walls and hexahedral elements in the core flow region, as shown in in Figure 18b. Based on these results, the mesh with 5 million cells was selected for the subsequent simulations.
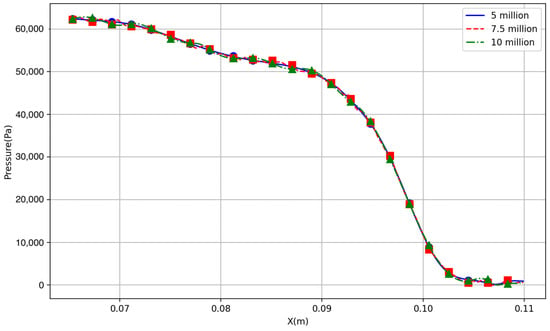
Figure 17.
Grid-convergence study for the CFD solver. Pressure distribution along the jet axis for all tested meshes.
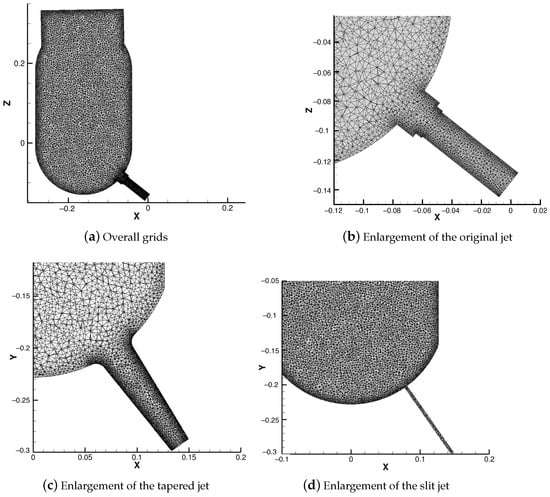
Figure 18.
Computational grids for the original manifold.
3.3.2. Comparison of Tapered and Original Jets
This section compares the performance of a tapered jet with round corners to the original, stepped jets used in a dredge system.
Figure 19 provides an overview of the dredge manifold featuring the original jets. Computational grids employed for the original manifold are illustrated in Figure 18, with subfigure (a) depicting the overall grids and subfigures (b)–(d) showcasing an enlargement of the jet regions. The dimensions of the jets are specified as follows: the inlet diameter measures 208 mm, while the outlet diameter is 21 mm. At the inlet, the velocity is 1.5 m/s, situated at the top of the jet. Similarly, at each jet outlet, the velocity measures 29.6 m/s.
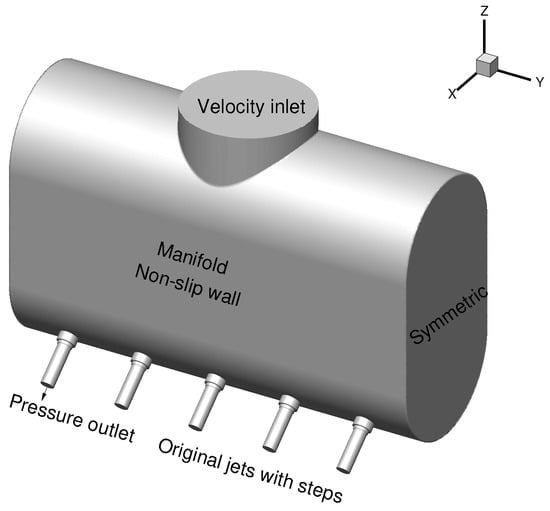
Figure 19.
Dredge manifold with original jets.
The simulation utilized approximately 5 million cells for its computational domain. The total CPU time required for the simulation ranged from 1 to 1.5 h. The simulation was executed using 48 CPUs. The type of CPU employed for the simulation was Stampede2 Intel(R) Xeon(R) Platinum 8160.
Figure 20 compares the flow patterns between the original two-step jet and the tapered jet with round corners. By changing from the original design with steps to a tapered jet with round corners and decreasing the jet loss coefficient from 0.42 to 0.14, the following changes were observed: (1) The flowrate increased by 6.6% from /min to /min. (2) The jet speed increased by 6.6% from 37.84 m/s to 40.34 m/s, resulting in a 13.6% increase in the force exerted by the jet on the sand, as the force is proportional to the square of the jet speed. (3) The pump head decreased by 1.5% from 154.67 m to 152.42 m. (4) The brake power (BHP) increased by 3.6% from 488.5 kW to 505.6 kW, as BHP is directly proportional to the product of pump head and pump flowrate.
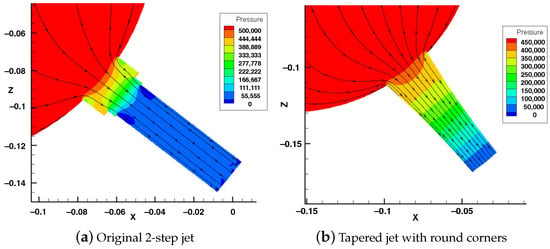
Figure 20.
Different views of the flow.
3.3.3. Comparison of Tapered and Slit Jets
This section compares the flow characteristics and performance of a tapered jet with round corners and a slit jet under another pump head conditions. Figure 21a illustrates the streamline distribution and pressure variations in the manifold equipped with the tapered jet. The inlet conditions were characterized by a velocity of 15 m/s, a flow rate of 8.58 × /s, and an inlet area of 5.72 × . Conversely, at the outlet, the velocity reduced to 9.1 m/s, with a corresponding negative flow rate of −8.58 × /s and an outlet area of 9.42 × . Gauge pressure was measured in Pascals for this analysis. Figure 21b depicts streamlined distributions and pressure profiles within the manifold equipped with the slit jet configuration. At the inlet, the velocity was measured to be m/s, resulting in a volumetric flow rate Q of and an area A of square meters. Conversely, at the outlet, the velocity decreased to m/s, corresponding to a volumetric flow rate of and an area A of square meters. The slit nozzle ended up having larger head losses than the tapered jet, due to the fact that the nozzle is attached to the manifold without a smooth transition.
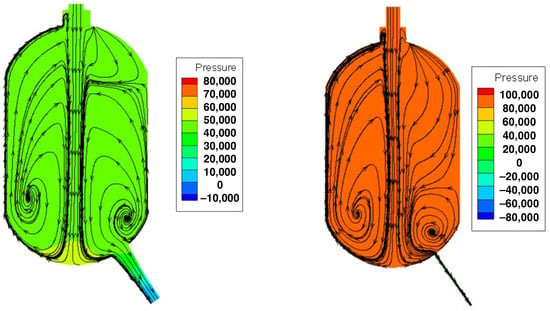
Figure 21.
Streamlines and pressures for the manifold.
3.3.4. Scouring Effects of Different Jets
Building upon the insights gained in previous sections regarding the internal pressure and flow dynamics within the manifold, this section examines the external performance of three jet configurations in terms of their scouring effect and the pressure on the seafloor, in order to assess its effectiveness in removing sand from the seafloor. Three jet geometries are investigated: the circular jet, representing a common baseline configuration; the rectangular jet, exploring potential advantages in channeling flow direction; and the slit jet, a thin, blade-like jet hypothesized to offer the most efficient scouring effect based on prior research. The analysis focuses on two key aspects. Firstly, we observed the shape and behavior of the ejected water stream beyond the manifold outlet, considering factors such as jet numbers and the interval between jets. Furthermore, this study examines how each jet configuration affects the seafloor by analyzing both the width of the scour and the pressure distribution on the seabed.
The computational domains and meshes for simulating jets for rectangular and slit jets are depicted in Figure 22. A refined mesh is utilized around the jet inlet and bottom wall for both configurations. This increased mesh density ensures the accurate capture of the flow variations and gradients expected in these regions. The overall mesh size for both simulations is approximately 3 million elements. The rectangular jet simulation utilizes 48 CPUs and takes approximately 4 h to complete. The slit jet simulation employs the same 48 CPUs but requires significantly less computational time, finishing in only 30 min. The rectangular jet might involve more intricate flow features due to its corners and edges, requiring more computational effort to solve the governing equations accurately.
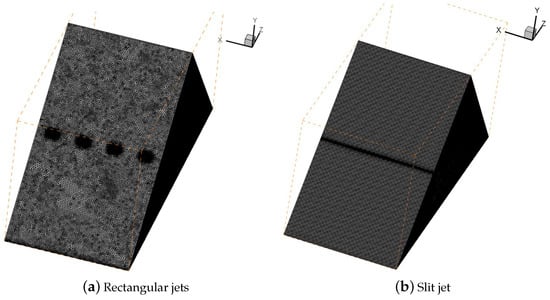
Figure 22.
Computational domain.
Figure 23 illustrates the streamlines for four rectangular jets and a slit jet, all with the same total area. Compared to the rectangular jets, the slit jet appears to have a wider area of impact and extends further away from the seawall. Additionally, the slit jet exhibits a wider span in the vertical direction (normal to the seawall). The wider area of impact and vertical span of the slit jet could potentially lead to increased scouring.
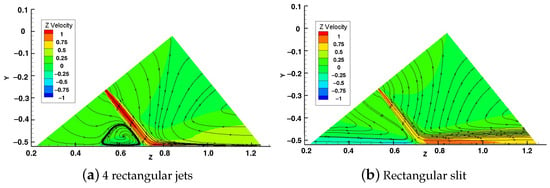
Figure 23.
Computed flow streamlines and velocities around jets and seafloor for various types of jets. Velocities are made non-dimensional with respect to the jet speed. The output area equals to 4 rectangular jets.
A similar study in the case of the domain between the exit from the nozzle and the sea-floor resembles the actual spacing, and the resulting pressure distributions on the seafloor, what we call the pressure footprint of the jets on the seafloor, are shown in Figure 24. The total areas and jet speeds are identical for both the rectangular jets and the slit jet configurations. As anticipated, the pressure footprint of the slit jet exhibits uniform pressure distribution in the direction perpendicular to the flow, but with a narrower extent along the flow direction. In contrast, the rectangular jets show slender regions of higher pressure between the individual jets. This phenomenon arises from the impinging of neighboring jets against each other in the lateral direction, creating localized stagnation points with elevated pressures.

Figure 24.
Pressure footprints on the sea floor.
3.3.5. Effect of Manifold Shape on Flow
The slit nozzle shown in Figure 21b ended up having larger headlosses than the original jet, due to the fact that the nozzle is attached to the manifold without a smooth transition. To make a slit nozzle with smooth transition, we had to alter the bottom part of the manifold, as shown on the right of Figure 25. By using analytical method, we found that this modified manifold reduced the headlosses and ended up with producing a 6% faster jet than the original manifold and nozzle. At this point, and as we started looking into modified manifolds, we realized that an additional significant benefit may come from providing a smooth transition of the “neck” of the manifold, where the water enters from the hose. Preliminary study indicated that we may end up with more than 15% increase in the jet speeds.
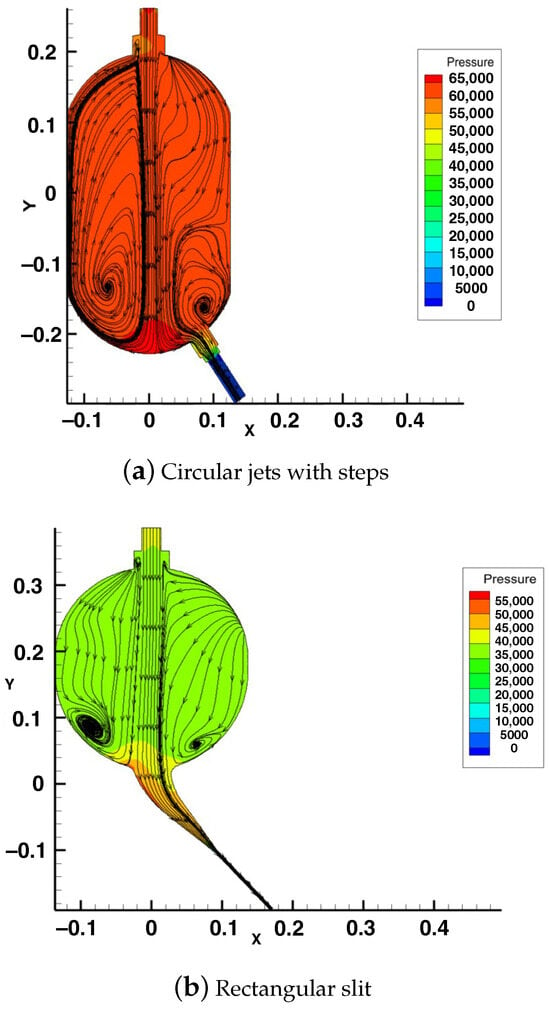
Figure 25.
Jet speed strength and distribution after its exit.
3.3.6. Manufacturable Slit Nozzle Design
Previous studies indicate that a slit jet offers the most efficient scouring effect. However, fabricating a thin rectangular jet presents a significant manufacturing challenge. This section proposes a novel “buildable” manifold design with a gradual transition from the manifold to the outlet jet, addressing the manufacturability issue while aiming to retain the performance benefits of the slit jet. Drawing inspiration from prior evaluations of various manifold configurations, this work assesses the performance of this new design.
Figure 26 shows how the computational domain of the slit nozzle. It consists of a rectangular inlet with a long, narrow slot outlet. The aspect ratio (ratio of the width to the height) of the outlet is much larger than 1, resulting in a thin sheet-like opening.
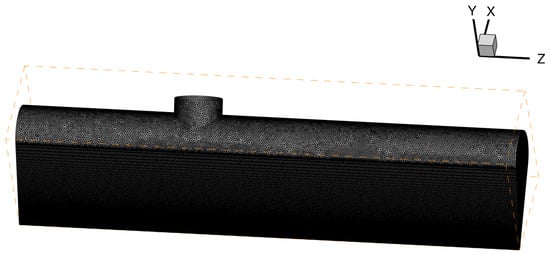
Figure 26.
Computational domain for the manufacturable slit nozzle that can generates a flat, sheet-like jet of fluid.
3.3.7. A Comparison of the Slit Nozzle Design and the Original Design of the Full Manifold
To avoid the influence of scale, full-scale runs were conducted for both the slit and original manifolds. Both manifolds had an inlet area of with a velocity of 4.838 m/s, and an outlet area of 7.54 × with a velocity of 28 m/s. The overall length of the manifold is 2.64 m. The slit nozzle design shown in Figure 27 is enlarged to this length. The original manifold is shown in Figure 28. The manifold has a velocity inlet, and is equipped with 24 nozzles that act as outlets. The full manifold use a mesh with 11.5 million elements. Unstructured meshes are used for their flexibility in conforming to complex geometries, particularly the curved surfaces of manifolds. The presence of inflation layers around the wall boundary are much finer than the elements in the bulk of the mesh. This refinement is necessary because boundary layers in fluid flow simulations require a finer mesh to accurately capture velocity the gradient. For the k– model with wall functions, the recommended range is typically between 30 and 300. This ensures that the wall function provides accurate results.
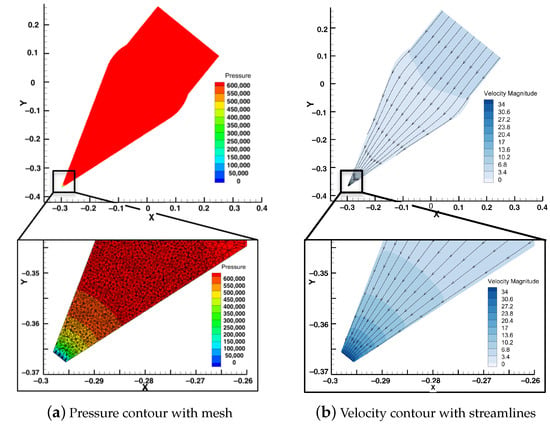
Figure 27.
Computational results for the slit nozzle design, = 0.062, 85.24% reduction compared with the original circular design.

Figure 28.
Geometry and dimensions of the original full -scale manifolds.
The original manifold yielded a loss coefficient of 0.499. The slit manifold produced a lower loss coefficient of 0.076, with a mesh consisting of 14.7 million elements. It demonstrates a significant reduction (83%) in the loss coefficient. This is similar to the small-scale run results, as shown in Section 3.3.6, which exhibited an 85.24% reduction. This improvement, as illustrated in Figure 27, is due to the streamlines being straight, with no separations or vortices.
4. Conclusions
This paper presents the development of an enhanced clam dredge system through a comprehensive approach integrating theory, CFD, and experimental analysis. Here is a summary of the key findings:
We developed an analytical tool, which can be used to assess the effect of the main parameters of the hose and manifold on the operating point for various pump characteristics, and to determine the corresponding flow-rate through the pump, the BHP of the pump and the jet speeds. The results show the following: (1) Increasing hose length reduces brake horsepower (BHP) and jet velocity (Vjet), with Vjet experiencing the steepest decline. Increasing hose diameter increases BHP and Vjet, with Vjet showing the most significant rise. (2) Increasing the number of jets increases BHP but decreases Vjet due to the flow division among more jets. Increasing the jet diameter increases BHP but decreases Vjet due to pressure drops. (3) Larger impeller diameters increase BHP and Vjet continuously. (4) By switching from the Fairbanks 2825A to the Goulds 3415 pump, the smaller impeller consumed 10.5% less power but without losing too much speed. This implies that finding the right balance between jet, impeller and pump is crucial for maximizing jet velocity without excessive energy use. The analytical method can be a useful tool in deciding which is the best combination of parameters (including pump impeller diameter) for highest jet speed with least consumed pump power.
Our CFD research allowed us to assess the flow through the manifold and the nozzles and helped us determine the internal shape of the nozzles which resulted in smaller headlosses. It also helped us assess the effect of the jets on the pressure distributions on the sea-floor, by using different nozzle shapes (original, rectangular, slit), which should be related to the effectiveness of the jets in excavating the seafloor. The results show the following: (1) Replacing the original stepped jets with tapered jets featuring round corners reduced the jet loss coefficient from 0.42 to 0.14. This led to a 6.6% increase in flowrate and jet speed, a 13.6% increase in jet force, a 1.5% decrease in pump head, and a 3.6% increase in BHP. (2) The tapered jet exhibited lower head losses than the slit jet due to smoother flow transitions. The slit jet, lacking a gradual transition, resulted in greater energy dissipation. (3) Among circular, rectangular, and slit jets, the slit jet exhibited the widest and farthest-reaching scouring effect, making it more effective for sediment removal. (4) The proposed slit nozzle design achieves an 85.24% reduction in loss coefficient for small-scale runs and an 83% reduction for full-scale runs compared to the original circular jet design.
The CFD results for the pressure inside the manifold were validated through full-scale experimental tests. The pressure differences between CFD and experimental tests are within 10%. Additionally, the replica experiment confirmed that the rectangular jet (of the same area as the circular) will end-up with larger jet speed (by 9%), while the rest of the parameters remain the same. This translates into force/pressures on the seafloor about 19% larger.
This study has several limitations that should be addressed in future work. The experimental validation relies on the relationship between pressure drop and energy loss. However, it can be improved by directly evaluating the overall efficiency of the entire system. Although the proposed slit nozzle design offers efficiency gains, its commercial implementation presents challenges, including increased manufacturing costs due to the novel geometry and the need for the precise alignment of manifold transitions. These factors could raise both initial investment and maintenance requirements, highlighting the need for a thorough techno-economic analysis to support industry adoption. Additionally, circular economy principles could be explored to facilitate end-of-life reuse or recycling of the nozzles. Future research should focus on the collaborative optimization of multiple nozzles to improve scouring efficiency, examine dynamic jet interactions, and develop adaptive control systems for real-time performance optimization.
Author Contributions
Methodology, N.H.K.; Software, N.H.K.; Validation, N.H.K.; Investigation, N.H.K.; Writing—original draft, R.Y.; Writing—review & editing, R.Y.; Supervision, R.Y.; Project administration, R.Y. All authors have read and agreed to the published version of the manuscript.
Funding
This research received no external funding.
Data Availability Statement
The original contributions presented in this study are included in the article. Further inquiries can be directed to the corresponding author.
Acknowledgments
The authors acknowledge the Texas Advanced Computing Center (TACC) at The University of Texas at Austin for providing computational resources under number ASC24071 that have contributed to the research results reported within this paper.
Conflicts of Interest
The authors declare no conflicts of interest.
Nomenclature
| Pump head (m) | |
| Total head losses (m) | |
| p | Pressure (Pa) |
| Specific weight of seawater () | |
| g | Gravitational acceleration () |
| z | Elevation (m) |
| V | Velocity (m/s) |
| h | Water depth (m) |
| Length of the hose (m) | |
| Inner diameter of the hose (m) | |
| Inner sectional area of the hose () | |
| Hose resistance factor (dimensionless) | |
| Reynolds number (dimensionless) | |
| k | Absolute roughness of the hose material |
| Kinematic viscosity of seawater (/s) | |
| Q | Flow rate (/s) |
| Number of jets (dimensionless) | |
| Jet diameter at its exit (m) | |
| Jet loss coefficient (dimensionless) |
Appendix A. Derivation of the Required Pump Head of the Clam Dredge System
By applying the energy equation between the sea level “o” and point “1”, just before entering the manifold, we get
where is the pump head, and are the total headlosses from point “o” to “1”; g is the gravitational acceleration and is the specific weight of the sea water.
Equation (A1) with the conditions on the calm sea level: (gage), (DATUM; reference for z), and , and taking , where h is the water depth becomes:
where is the (gage) pressure in the hose just upstream of the manifold, and is mean velocity inside the hose.
We then apply the energy equation between point “1” and “2” (point at the exit of jet):
where are the headlosses through the manifold and jets. is the mean velocity through each jet. It should be noted at the headlosses through the manifold, as well as those as the water enters from the hose to the manifold should also be included.
Equation (A3) with the approximation , and (the exit pressure of the jet should be the hydrostatic pressure at the sea-floor) becomes
At this point, we must determine the expressions for and . are the headlosses from the location where the seawater is scooped from the sea to the pump inlet, the headlosses from the pump outlet to the entrance to the hose, and the headlosses over the length of the hose. In this work, we only considered the headlosses over the hose, which can be expressed as follows:
where and are the length and the hose inner diameter, respectfully, and is the resistance factor through the hose which is general is a function of the Reynolds number () and of the relative roughness of the hose material ; where k is the absolute roughness and is the kinematic viscosity of the seawater. Equation (A7) can be rewritten in terms of the flowrate Q through the hose, by using the expression , where is the inner sectional area of the hose:
We then express the headlosses, through the manifold and the jets as follows:
which can be written in terms of the flowrate Q, where is the number of jets, and the jet diameter at its exit, as follows:
where is the loss coefficient, which is determined from our computational analysis, as described in Section 2.2.
By substituting the expressions, we just determined for and , the final equation which relates with Q is derived below:
Equation (A11) represents the demand curve for the dredge system, and it will be useful in determining the operating point, when coupled with a given pump, as described in Section 2.1.
References
- Meyer, T.; Cooper, R.A.; Pecci, K.J. Performance and environmental effects of a hydraulic clam dredge. Mar. Fish. Rev. 1981, 43, 14–22. [Google Scholar]
- Smolowitz, R.J.; Nulk, V.E. The design of an electrohydraulic dredge for clam surveys. Mar. Fish. Rev. 1982, 44, 1–18. [Google Scholar]
- You, R.; Kinnas, S.A. VIScous Vorticity Equation (VISVE) model applied to 2-D turbulent flow over hydrofoils. Ocean Eng. 2022, 256, 111416. [Google Scholar] [CrossRef]
- You, R.; Kinnas, S.A. A viscous vorticity method for predicting 2-D turbulent cavitating flows. Ocean Eng. 2024, 309, 118521. [Google Scholar] [CrossRef]
- You, R.; Kinnas, S.A. A 3-D Viscous Vorticity Model for Predicting Turbulent Flows over Hydrofoils. J. Mar. Sci. Eng. 2023, 12, 45. [Google Scholar] [CrossRef]
- You, R.; He, G.; Wang, J.; Liu, P. CIP-based analysis on strongly nonlinear interaction between solitary wave and submerged flat plate. Ocean Eng. 2019, 176, 211–221. [Google Scholar] [CrossRef]
- Wang, J.; He, G.; You, R.; Liu, P. Numerical study on interaction of a solitary wave with the submerged obstacle. Ocean Eng. 2018, 158, 1–14. [Google Scholar] [CrossRef]
- Fuller, W.P.; Wagner, R.J.; Lewis, R.E. US Hydrodynamic Dredging Challenges and Opportunities. Transp. Res. Rec. 2024, 2678, 487–500. [Google Scholar] [CrossRef]
- Beck, R.F.; Newman, J.N.; Tuck, E.O. Hydrodynamic forces on ships in dredged channels. J. Ship Res. 1975, 19, 166–171. [Google Scholar] [CrossRef]
- Liu, R.; Cao, L.; Zhang, Y.; Wang, Z. Numerical analysis of axial force on dredging pump considering influence of axial clearance. Trans. Chin. Soc. Agric. Eng. 2014, 30, 101–108. [Google Scholar]
- Cao, L.; Wu, T.; Hu, J. CFD analysis and size optimization of the overflow duct in a trailing suction hopper dredger. In Proceedings of the ISOPE International Ocean and Polar Engineering Conference, ISOPE, Shanghai, China, 5–10 June 2022; p. ISOPE–I. [Google Scholar]
- Miedema, S.; Becker, S. The Use of Modeling and Simulation in the Dredging Industry, in Particular the Closing Process of Clamshell Dredges. In Proceedings of the CEDA Dredging Days, CEDA, Amsterdam, The Netherlands, 27–29 June 1993; p. 26. [Google Scholar]
- Petetta, A.; Herrmann, B.; Virgili, M.; Bargione, G.; Vasapollo, C.; Lucchetti, A. Dredge selectivity in a Mediterranean striped venus clam (Chamelea gallina) fishery. Fish. Res. 2021, 238, 105895. [Google Scholar] [CrossRef]
- Tuck, I.; Bailey, N.; Harding, M.; Sangster, G.; Howell, T.; Graham, N.; Breen, M. The impact of water jet dredging for razor clams, Ensis spp., in a shallow sandy subtidal environment. J. Sea Res. 2000, 43, 65–81. [Google Scholar] [CrossRef]
- Weida, K. Design of dredging device for immersed gravel bed and analysis of water jet. In Proceedings of the 2021 7th International Symposium on Mechatronics and Industrial Informatics (ISMII), Zhuhai, China, 22–24 January 2021; pp. 52–56. [Google Scholar]
- Chen, Z.; Wang, Y.; Li, Y. Design and Dynamic Analysis of Pipeline Dredging Devices. Fluid Dyn. Mater. Process. 2023, 19, 1349–1367. [Google Scholar] [CrossRef]
- Teamia, I.; Younes, M.; El Sawaf, I.; Halawa, M. Experimental Study of the Effect of Mixing Chamber Length and Diffuser Angle on the Performance of Dredging Jet Pump. In Proceedings of the Sixteenth International Water Technology Conference, Istanbul, Turkey, 7–10 May 2012; p. 16. [Google Scholar]
- Yin, J. Study on mechanism of cutting hard soil by high pressure water jet. In Proceedings of the ISOPE International Ocean and Polar Engineering Conference, Honolulu, HI, USA, 16–21 June 2019; p. ISOPE–I. [Google Scholar]
- Cao, L.; Xiao, Y.; Wang, Z.; Luo, Y.; Zhao, X. Pressure fluctuation characteristics in the sidewall gaps of a centrifugal dredging pump. Eng. Comput. 2017, 34, 1054–1069. [Google Scholar] [CrossRef]
- Obregon, L.; Valencia, G.; Forero, J.D. Efficiency optimization study of a centrifugal pump for industrial dredging applications using CFD. Int. Rev. Model Simul. 2019, 12, 245–252. [Google Scholar] [CrossRef]
- Ramirez, R.; Avila, E.; Lopez, L.; Bula, A.; Forero, J.D. CFD characterization and optimization of the cavitation phenomenon in dredging centrifugal pumps. Alex. Eng. J. 2020, 59, 291–309. [Google Scholar] [CrossRef]
- Peng, L.; Zi-ze, S.; Dong, H.; Peng-cheng, G. Experimental Research on Enhancing the Dredging Performance of Airlift Pump Aided by Water Jet. China Rural Water Hydropower 2023, 9, 153–158. [Google Scholar]
- El-Sawaf, I.; Halawa, M.; Younes, M.; Teaima, I. Study of the different parameters that influence on the performance of water jet pump. In Proceedings of the Fifteenth International Water Technology Conference, IWTC, Beijing, China, 27–30 May 2011; Volume 15. [Google Scholar]
- Mueller, N. Water jet pump. J. Hydraul. Div. 1964, 90, 83–113. [Google Scholar] [CrossRef]
- Loney, D.; Cotterman, K.; Brown, D.; Mitchell, K. Improving waterway network maintenance using dredge portfolio optimization methods. In Proceedings of the Western Dredging Association and Texas A&M University Center for Dredging Studies “Dredging Summit and Expo”, Chicago, IL, USA, 4–7 June 2019; pp. 132–146.
- Blazquez, C.A.; Adams, T.M.; Keillor, P. Optimization of mechanical dredging operations for sediment remediation. J. Waterw. Port. Coast. Ocean Eng. 2001, 127, 299–307. [Google Scholar] [CrossRef]
- Paarlberg, A.J.; Guerrero, M.; Huthoff, F.; Re, M. Optimizing dredge-and-dump activities for river navigability using a hydro-morphodynamic model. Water 2015, 7, 3943–3962. [Google Scholar] [CrossRef]
- Cárdenas-Gutiérrez, J.A.; Valencia Ochoa, G.; Duarte Forero, J. Parametric analysis CFD of the hydraulic performance of a centrifugal pump with applications to the dredging industry. J. Eng. Sci. Technol. Rev. 2020, 13, 8–14. [Google Scholar] [CrossRef]
- Korkmaz, K.B.; Werner, S.; Bensow, R. Verification and validation of CFD based form factors as a combined CFD/EFD method. J. Mar. Sci. Eng. 2021, 9, 75. [Google Scholar] [CrossRef]
- Oyuela, S.; Ojeda, H.R.D.; Arribas, F.P.; Otero, A.D.; Sosa, R. Investigating fishing vessel hydrodynamics by using EFD and CFD tools, with focus on total ship resistance and its components. J. Mar. Sci. Eng. 2024, 12, 622. [Google Scholar] [CrossRef]
- Fırat, E.; Oruç, V.; You, R.; Biçer, U.; Devecioğlu, A.G. Reduction of fluid forces on a circular cylinder in the laminar flow regime using a pair of airfoils. Ocean Eng. 2025, 339, 122074. [Google Scholar] [CrossRef]
- Launder, B.E.; Spalding, D.B. The numerical computation of turbulent flows. In Numerical Prediction of Flow, Heat Transfer, Turbulence and Combustion; Elsevier: Amsterdam, The Netherlands, 1983; pp. 96–116. [Google Scholar]
Disclaimer/Publisher’s Note: The statements, opinions and data contained in all publications are solely those of the individual author(s) and contributor(s) and not of MDPI and/or the editor(s). MDPI and/or the editor(s) disclaim responsibility for any injury to people or property resulting from any ideas, methods, instructions or products referred to in the content. |
© 2025 by the authors. Licensee MDPI, Basel, Switzerland. This article is an open access article distributed under the terms and conditions of the Creative Commons Attribution (CC BY) license (https://creativecommons.org/licenses/by/4.0/).