Abstract
A FEM model of Shallow Wave Equations (SWE-FEM) is studied, taking into account the variable bathymetry of semi-enclosed sea basins. The model, with a spatially varying Coriolis term, is implemented for the description of combined refraction–diffraction effects, from which the eigenperiods and eigenmodes of extended geographical sea areas are calculated by means of a low-order FEM scheme. The model is applied to the western Mediterranean basin, illustrating its versatility to easily include the effects of geographical characteristics like islands and other coastal features. The calculated resonant frequencies and modes depend on the domain size and characteristics as well as the location of the open sea boundary, and it is shown to provide results compatible with tide measurements at several stations in the coastal region of France. The calculation of the natural oscillation modes in the western Mediterranean basin, bounded by open boundaries at the Strait of Gibraltar and the Strait of Sicily, reveals a natural period of around 6 h corresponding to the quarter-diurnal tidal components, which are stationary and of roughly constant amplitude on the northern coast of the basin and on the west coast of Corsica (France). On the east coast of Corsica, on the other hand, these components are of very low amplitude and in phase opposition. The semi-diurnal tidal components observed on the same tide gauges north of the basin and west of Corsica are also quasi-stationary although they are not resonant. Resonant oscillations are also observed at lower periods, especially at a period of around 3 h at the Sète station. This period corresponds to a higher-order natural mode of the western Mediterranean basin, but this resonance seems to be essentially linked to the presence of the Gulf of Lion, whose shallowness and the width of the shelf at this point induce a resonance. Other oscillations are also observed at lower periods (T = 1.5 h at station Fos-sur-Mer, T = 45 min in the Toulon harbour station), due to more local forcing.
1. Introduction
Resonant oscillations are often observed in basins, from the scale of harbours or bays to the scale of ocean basins, forced by variations in water level at their entrance due to storm events, tides, and tsunamis or variations in atmospheric pressure. In particular, the prediction of tidal flows is important concerning environmental and climate considerations, ecological impacts, and tidal energy technology applications. The periods of resonant oscillations, ranging from a few minutes for harbours and bays to a day or more for ocean basins, depend on the size and depth of the basin as well as its semi-open or closed contour [1]. Tidal waves can thus be amplified on the scale of the ocean basin, such as the semi-diurnal tide in the North Atlantic [2], or of semi-open bays, as in the Bay of Fundy, which is well known for its huge tidal range [3]. In the Mediterranean Sea region, the overall tidal range is low, 20–30 cm, mainly due to the components K2, S2, M2, and N2 for the semi-diurnal group and K1, P1, O1, and Q1 for the diurnal group; see e.g., Rey et al. [4] and Mc Donagh et al. [5]. This is due roughly equally to the astronomical forces applied to the Mediterranean basin and to forcing of the Atlantic tide through the Strait of Gibraltar [6]. Larger tidal ranges are observed in some areas, in particular in the semi-enclosed Adriatic Sea, where the size of the tidal range, around 120 cm, is explained by the presence of resonant modes due to the basin configuration, with periods of 21.5 h and 10.9 h, close to the periods of the tidal components [7].
The complex tidal dynamics of the shallow Strait of Gibraltar have also been the subject of numerous studies over the years. In particular, Lafuente et al. [8] have shown the complexity of this zone, with the Atlantic tide to the west, which is progressive towards the north and has a significant tidal range, and the Mediterranean tide to the east, which is stationary, with the phase of the tidal signal appearing constant over most of the western Mediterranean basin. The shallowness of the Strait of Gibraltar also favours nonlinear energy transfers between tidal components. Lafuente et al. [8] showed the amplification, on the Mediterranean side, of the quarter-diurnal components MS4, M4, and MN4 by the nonlinear effect and suggested a resonant period of oscillation of the western Mediterranean basin of 6.25 h, close to that calculated by Defant of 5.96 h [9]. The quarter-diurnal components thus generated can propagate freely in the western Mediterranean, as observed on a smaller scale for harmonic components of waves over a sill [10].
Harmonic analyses of tidal signals in the western Mediterranean show indeed the presence of MS4, M4, and MN4 components, with respective amplitudes in Marseilles (France) of 0.41, 0.62, and 0.24 cm [11] and for respective amplitudes of 6.80 cm, 2.42 cm, and 1.41 cm for M2, S2, and N2. The harmonic rate (6.3% for the M2 component) is significantly higher than that observed in Trieste, Italy (see Medvedev et al. [7]), 0.4% for M2, 0.08% for S2 (S4 not observed in Marseille), while the amplitudes of the fundamental components are higher (26.59 cm for M2 and 15.92 cm for S2). It should also be noted that the harmonic rate for the M2 component observed in Marseille is on the same order of magnitude as that observed mainly on the West Atlantic coast between the Bay of Biscay and Brittany [12] for an M2 component amplitude on the order of one meter.
Resonant oscillations can also be forced by the atmospheric pressure variations associated with storms, as in the Adriatic Sea, where they cause submersion phenomena [13]. Mc Donagh et al. [5] have modelled the effect of the tide on circulation in the Mediterranean Sea, comparing results from tidal and non-tidal calculations. The energy spectra derived from their calculations showed the presence of energy peaks in the vicinity of the periods of the semi-diurnal and diurnal tidal components, suggesting a resonance effect in the Mediterranean basin for these frequency ranges. The high relative amplitudes of the quarter-diurnal harmonic components in the western Mediterranean, despite its very large depth, also suggest the presence of basin-wide amplification effects for these waves.
Several works based on Shallow Wave Equations (SWEs) have been recently presented to study resonance periods and spatial characteristics of modes with applications to tsunami and shelf resonance in extended sea basins; see, e.g., [14,15]. The aim of the present study is to calculate the natural oscillation periods of the western Mediterranean basin, paying particular attention to frequencies close to the tidal, quarter-diurnal, and semi-diurnal signals, in order to identify resonances associated with the amplitudes of the fundamental and harmonic tidal components. It is also based on the analysis of tide gauge data along the French coastline. For this purpose, an FEM model of the SWE is presented, taking into account the variable bathymetry of semi-enclosed basins. The model has already been applied successfully, in conjunction with the modified mild-slope equation, to coastal areas with bays or harbours for swells and infragravity gravity waves; see Karathanasi et al. [16] and Belibassakis and Rey [17]. The present SWE-FEM model is extended to the study of larger-scale basins for longer waves, taking into account the Coriolis effect. The model is implemented for the description of combined refraction–diffraction effects, from which the eigenperiods and eigenmodes on extended geographical sea areas are calculated and applied to the western Mediterranean basin, shown in Figure 1. As a special case of interest, results are presented from the study of the tidal components along the coastal area of France, shown in Figure 1, where, moving from west to east, information and data are available from coast and tide gauges from the HTM-NET network (https://htmnet.mio.osupytheas.fr/, accessed on 20 May 2025) and Shom (https://refmar.shom.fr/, accessed on 20 May 2025) for the stations of Port-Vendres, Sète, Fos-sur-Mer, Marseille, Toulon, and Nice; the locations of Ajaccio and Solenzara on Corsica Island will be used for comparison and discussion.
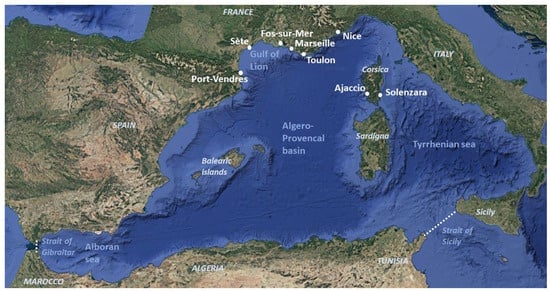
Figure 1.
The geographical area of the western Mediterranean basin with openings at (i) the Gibraltar straits on the west side and (ii) the Sicily–Africa straits on the east side, shown by using dashed lines. Tide gauge data from the stations of (1) Port Vendres, (2) Sète, (3) Fos-sur-Mer, (4) Marseille, (5) Toulon, (6) Nice, (7) Ajaccio, and (8) Solenzara will be used for comparison and discussion.
The aim of the present model is to identify the natural periods of oscillation of the western Mediterranean basin and show its applicability on the scale from ocean basins to bays and gulfs. As with conventional circulation models, the approach is not to calibrate the model for accurately representing the dynamics of the basin, such as taking account of the tide in the dynamics, but to identify the resonances and spatial characteristics of eigenmodes taking into account the Coriolis effect. The above phenomena could lead to the amplification of waves, which increases the risks and associated damage. Especially, the risk of flooding associated with extreme climatic events or tsunamis and meteo-tsunamis can be amplified on the scale of large basins and bays. The aim of taking better account of the studied resonance phenomena is to improve forecasting of such risks.
2. The SWE Model for Sea Basin Resonances
A standard model describing shallow-water phenomena over a general bathymetry domain is based on the Shallow Wave Equations, consisting of conservation of mass and momentum in a depth-integrated form, which read
where denotes horizontal components and t > 0 is the time. In the above equations, is the free-surface elevation and is the horizontal depth-averaged velocity. In addition, is the depth and g = 9.81 m/s2 is the gravitational acceleration. Moreover, the spatially dependent term f is the Coriolis term, defined by , with Ω = 7.2722 × 10⁻⁵ rad/s and the latitude. Finally, denotes the unit vector directed upwards. Considering small free-surface elevation and flow velocity, the nonlinear SWE (NSWE) model (1) is linearized by dropping higher-order terms. Moreover, by assuming harmonic solution and the linearized SWE (LSWE) system becomes
Solving Equation (2) for the flow velocity components, we obtain
and using the above in the first part of Equation (2), we finally obtain the following second-order partial differential equation:
where .
In the case of constant depth domain Ω or in the case of 1D problems, where the bathymetry and the eigenmodes are dependent only in one coordinate, the latter term is zero. Moreover, by assuming slowly varying sea bottom topography, this term becomes very small and can be neglected, i.e., . In such cases, the following simplified model is obtained:
The above equation is considered together with standard homogenous Neuman and/or Dirichlet boundary conditions, as follows:
where and it can be solved for obtaining the eigensolutions consisting of the set of eigenfrequencies and eigenmodes , respectively.
3. SWE-FEM Formulation as a Nonlinear Eigenvalue Problem
Following previous works, the problem for determining the resonances over extended domains is treated by formulating it as a nonlinear eigenvalue problem. In this case, the SWE (5a) supplemented by a Neumann condition , where n indicates the normal vector on the coastal boundary (directed outwards from the domain) and a homogeneous Dirichlet condition along the open sea boundaries, as indicated by the dashed segment AB in Figure 2. The latter are considered appropriate for the studied problem, indicating that the entrance interface AB connecting the finite sea basin domain with the infinite exterior region corresponds to a nodal line; see, e.g., Rabinovich [1]. A difficulty arises from the fact that the coefficient of the SWE Equation (5) is dependent on the solution (ω) introducing implicit nonlinearity.
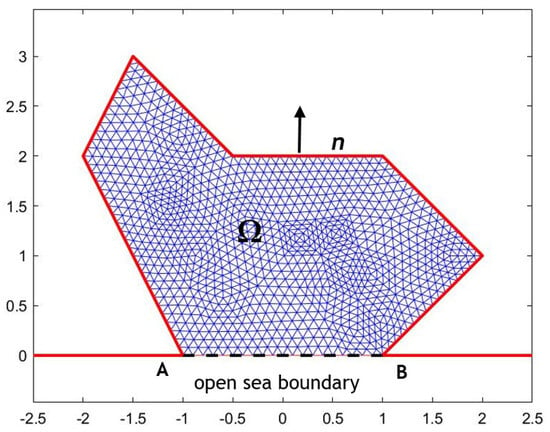
Figure 2.
Variable bathymetry Ω and FEM discretization of the ocean domain with open-sea boundary AB shown by using a dashed line.
As an example, the mesh on the domain covering the West Med Sea region is shown in Figure 3, where the number of elements is Ne = 22,343 and total nodes N = 12,523. Bathymetric data in the studied West Med Sea region presented in Figure 4 are from GEBCO (2023) Compilation Group (doi:10.5285/f98b053b-0cbc-6c23-e053-6c86abc0af7b; see also https://www.gebco.net/, accessed on 20 May 2025), and the shoreline data are from the GHHS database by Wessel & Smith [18] (see also https://www.soest.hawaii.edu/pwessel/gshhg/, accessed on 20 May 2025). In the open sea boundaries on the western side in the Gibraltar straits (A′B′) and on the eastern side in the Sicily–Africa straits (AB), homogeneous Dirichlet conditions are used.
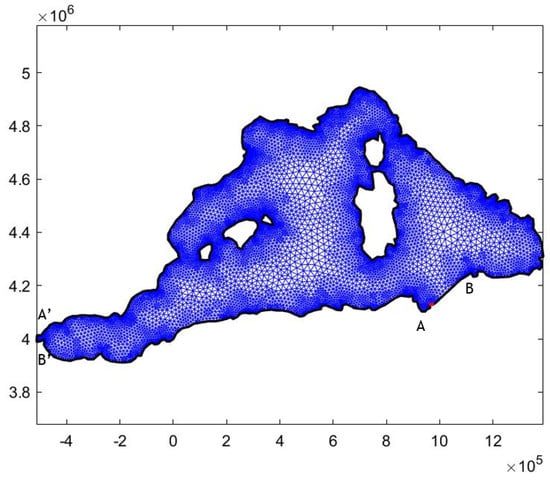
Figure 3.
FEM mesh in the West Med Sea region. The open sea boundary on the western side is the Gibraltar straits (A′B′) and on the eastern side is the Sicily–Africa straits (AB). The number of elements is Ne = 22,343 and total nodes N = 12,523.
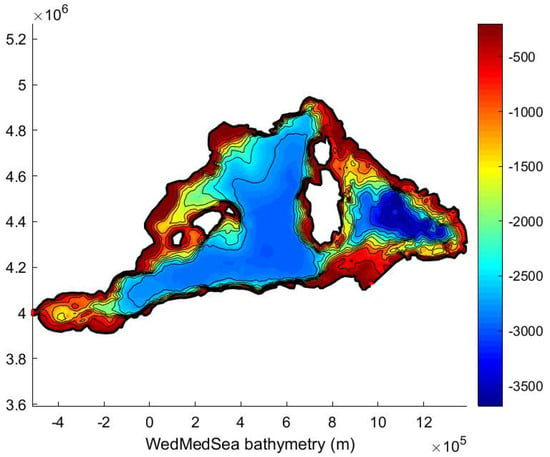
Figure 4.
Bathymetric and coastline data in the studied West Med Sea region.
In the present work, the above nonlinear eigenvalue problem is numerically treated by using a low-order FEM model, described below. Let denote the finite-element discretization of the domain by means of the Ne total number of triangular elements, and introduce the following approximation:
where denote the linear (pyramid-like) shape functions associated with each j-node of the triangulation corresponding to the finite element subdivision.
Accordingly, the SWE (1) is put in the following discrete form:
where the FEM-stiffness and mass matrices are defined, respectively, by
and denotes the inner product of functions d and e in the domain. In the above discrete formulation, the Neumann boundary condition for is satisfied as a natural condition. The Dirichlet boundary condition for is satisfied as an essential one by setting the values of the unknowns for all j-nodes on the entrance boundary equal to zero, corresponding to nodal lines. As concerns the nearshore/coastal zone, there is no viscous damping model applied there, but only a homogeneous normal (Neumann) boundary condition at the coastline is implemented, which approximately treats also the wave reflection at the continental slopes.
In the case of the constant depth region and assuming shallow water conditions, the coefficient is constant. Thus, the eigenvalue Equation (8) is solved by calculating the corresponding eigenvalues of the Laplace equation in the horizontal domain :
and we obtain the eigenfrequencies as follows:
In the case of the general bathymetry domain characterized by depth function and general wave conditions, the numerical solution of the nonlinear eigenvalue problem (8) is calculated by iterations. The iterative scheme starts with an initial approximation of the eigenfrequencies, which is obtained by means of the LSWE using the average depth in the domain:
Next, starting from the lowest eigenfrequency (n = 1), the coefficients are calculated in the domain , the stiffness and mass matrices are updated for each frequency and the eigenvalue problem is repeatedly solved. The above procedure is iterated until convergence , where denotes the iteration index and ε is the tolerance. In the examples presented below, three iterations are found to be enough for numerical convergence. After convergence of the iterative process, the corresponding eigenperiods are obtained from the calculated eigenfrequencies, as follows:
4. Application to the Western Mediterranean Sea Basin
The first eigenperiods in the West Med Sea basin as obtained by the present nonlinear SWE-FEM model, using the mesh of Figure 3, are listed in Table 1. Moreover, the first six calculated eigenmodes are plotted in Figure 5, Figure 6, Figure 7, Figure 8, Figure 9 and Figure 10. It is noted here that the calculated eigenmodes are normalized, and thus, the amplitudes presented using the colour plots in the following figures have only relative meaning.

Table 1.
First six eigenperiods in minutes and hours as calculated by the present nonlinear eigenvalue problem based on the SWE-FEM model.
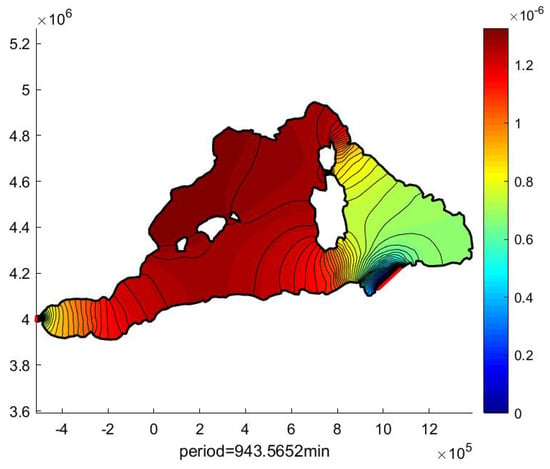
Figure 5.
Calculated first SWE-FEM eigenmode in the West Med Sea region.
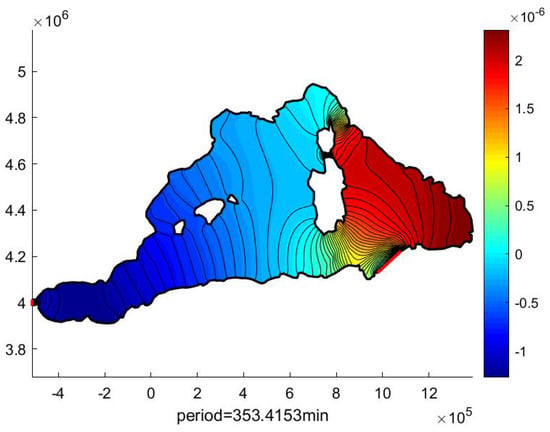
Figure 6.
Calculated second SWE-FEM eigenmode in the West Med Sea region.
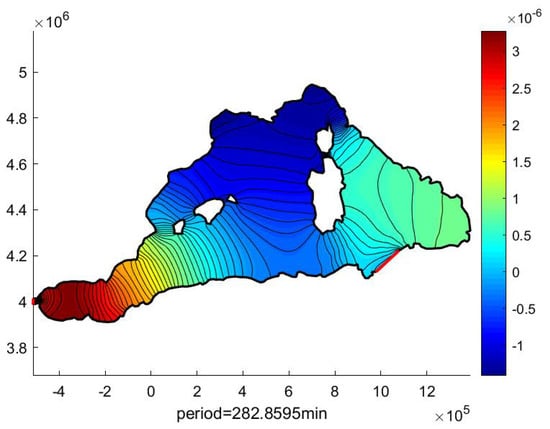
Figure 7.
Calculated third MMSE eigenmode in in the West Med Sea region.
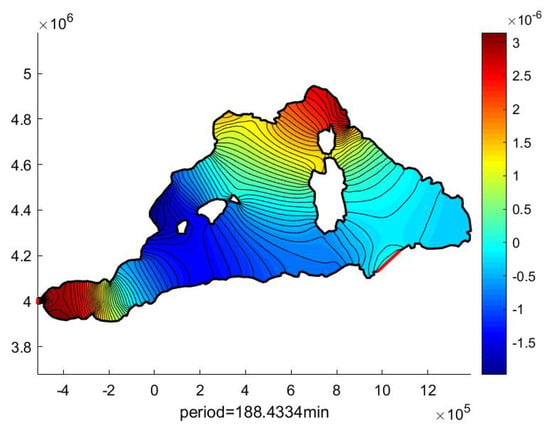
Figure 8.
Calculated fourth SWE-FEM eigenmode in the West Med Sea region.
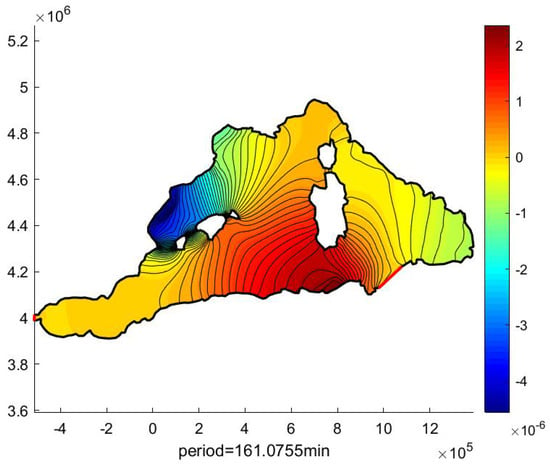
Figure 9.
Calculated fifth SWE-FEM eigenmode in the West Med Sea region.
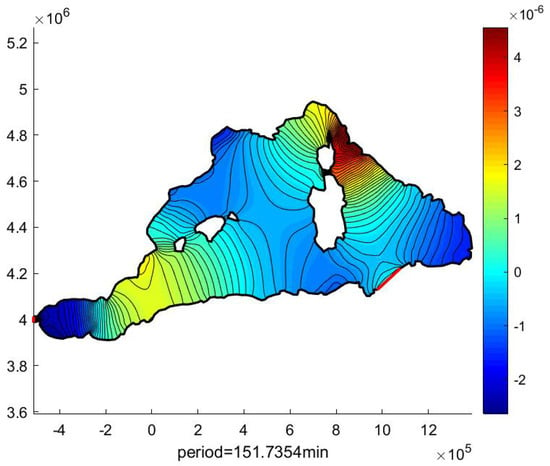
Figure 10.
Calculated sixth SWE-FEM eigenmode in the West Med Sea region.
5. Comparison with Observations and Discussion
5.1. Tide Gauge Location and Spectral Analysis
The time series for the year 2020 for the stations shown in Figure 1 was used for comparisons between observations and calculations, as the data series for that year was almost complete. However, to identify the tidal components, we used a longer time series obtained for the Ifremer station of the HTM-NET network in Toulon Bay for the years 2014 to 2024. The amplitude spectra obtained by Fast Fourier Transform (FFT) of the signals is shown in Figure 11, allowing us to identify the tidal components of significant amplitude. For the terdiurnal tide, the components are very weak but indicated on the figure, as we will see that they are of greater amplitude for the Solenzara station east of Corsica (see Figure 1). The observation of the tidal signals—diurnal, semi-diurnal, quarter-diurnal, and terdiurnal—as well as the seiches at shorter periods are discussed in the following subsections in relation to the resonance conditions calculated by the present SWE-FEM in the western Mediterranean basin, as described in the previous section.
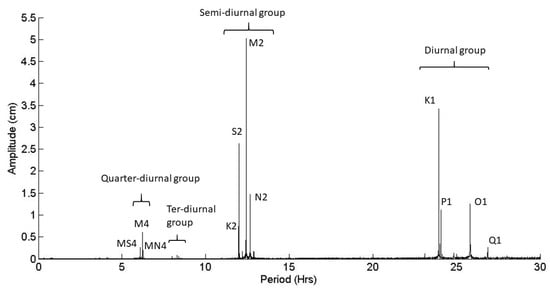
Figure 11.
Amplitude spectrum of the temporal series of the water level (2014 to 2024) at station Ifremer/Toulon (HTM-NET networks).
5.2. Semi-Diurnal and Diurnal Tide Components
As depicted in Figure 12, the evolution of the phase between the stations of each of the tidal components is very weak, particularly for the semi-diurnal tide, which is well known (see, e.g., Tsimplis et al. [6]). However, the largest resonance period calculated, of 15.72 h (see Figure 5), lies between the periods of the semi-diurnal and diurnal groups. The oscillation nodes for the semi-diurnal components are therefore located to the east of the islands of Corsica and Sardinia, while those for the diurnal components are located beyond the Strait of Messina, in the eastern Mediterranean. The measurement stations to the west of the islands are therefore located in an area close to the antinodes, i.e., where the phase changes little spatially for quasi-stationary waves, particularly for the semi-diurnal components, which is in agreement with the calculated pattern plotted in Figure 5. For diurnal components, the change is slightly greater, but it remains small for the K1 component, which is the largest.
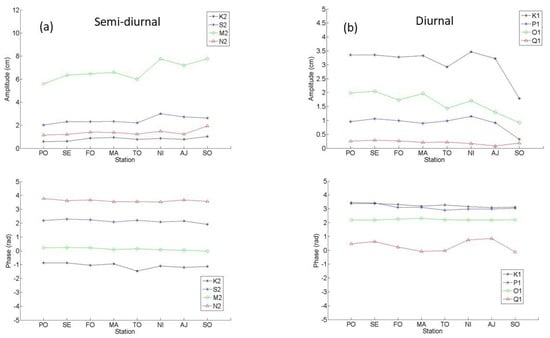
Figure 12.
Amplitudes and phases of (a) semi-diurnal and (b) diurnal tide components calculated for the year 2020 at the stations Port Vendres (PO), Sète (SE), Fos-sur-Mer (FO), Marseille (MA), Toulon (TO), Nice (NI), Ajaccio (AJ), and Solenzara (SO).
5.3. Quarter-Diurnal Components
Figure 13 shows the amplitudes and phases of the quarter-diurnal components. It can be seen that their phase is almost identical for all the stations in the north of the Algero-Provencal basin to the west of Corsica and Sardinia, and that it is opposite for the Solenzara station, to the east of the islands, in the Tyrrhenian sea (see Figure 13b).

Figure 13.
Measured (a) amplitudes and (b) phases of the quarter-diurnal tide in the seven stations of the French coast shown in Figure 1. The arrows indicate the change in phase sign in Solenzara station at the east side of Corsica Island.
This is in total agreement with the calculation (see Figure 6), which shows a resonance period of T = 5.89 h, very close to the quarter-diurnal tidal components. The amplitudes of these components are much lower at Solenzara, to the east of the islands. They are therefore probably generated by the Gibraltar sill through nonlinear transfer of the semi-diurnal components and amplified by the configuration of the basin.
5.4. Terdiurnal Components
Although their amplitudes remain low, the SK3 and NK3 components shown in Figure 14 are observed at the Solenzara station, unlike the other stations located in the western basin. However, their amplitude is similar to or even greater than the quarter-diurnal components for NK3.
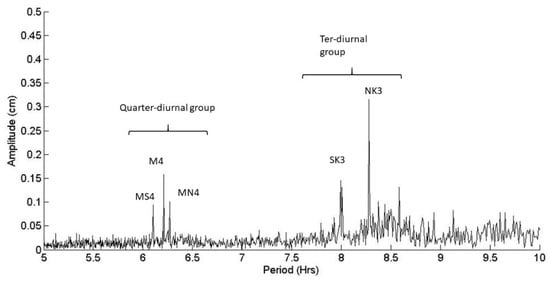
Figure 14.
Measured amplitude of the quarter-diurnal and terdiurnal tide in Solenzara station.
5.5. Seiching
The calculated eigenperiods below the range of quarter-diurnal tidal components are 4.7 h, 3.14 h, 2.68 h, 2.3 h, etc. Figure 15 shows the FFTs for the stations in the 0–10 h range. There are no observed resonance peaks around 4.7 h. A peak at 3.7 h is observed for all the stations in the western basin (with the exception of Solenzara).
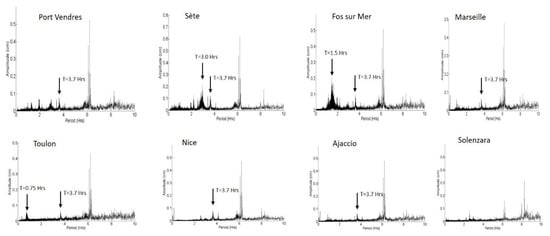
Figure 15.
FFT in the range 0–10 h of the eight stations of the French coast shown in Figure 1.
Fairly large peaks are observed for some stations, notably at 45 min in Toulon, 1.5 h in Fos-sur-Mer, and 3 h in Sète. According to Table 1, this amplification is not due to a resonance phenomenon on the scale of the western basin. It should also be noted that these components do not result from interactions with the M2 component, which has the greatest amplitude.
Sliding FFTs of five periods were performed on the station data to identify level oscillation events. No signature was found for the period T = 3.7 s. The peaks observed correspond, in fact, to seiches generated during events lasting a few days. On the scale of ports and bays, these seiches are well known. For example, the harbour of Toulon is the seat of seiches at periods of about 17 min and about 45 min (see Belibassakis and Rey [17]).
At Sète and Fos-sur-Mer in particular, seiches are observed with longer periods of 3 h and 1.5 h, respectively, as shown in Figure 15. The 3 h seiching corresponds to a period specific to the western basin. Note that it corresponds to a quarter-wave resonance in the Gulf of Lion between the continental slope and the coast. Indeed, the propagation time of a long wave, as observed and modelled in 2003 for a tsunami-type wave, is 45 min between the continental slope and the Sète tide gauge; see Figure 2 in Sahal et al. [19]. This time lag corresponds to the 3 h period observed. At Fos-sur-Mer, the plateau is narrower and the period of oscillation smaller.
Such oscillations of significant amplitude were observed in March 2020. Measured amplitudes are presented in Figure 16a for the stations of Port-Vendres, Sète, Fos-sur-Mer, and Toulon. The evolution of the atmospheric pressure at the stations of Sète and Ifremer/Toulon are presented in Figure 16b. The seiches observed at Sète and at Fos-sur-Mer are undoubtedly generated by the rapid variation in atmospheric pressure, with a drop of almost 20 hPa followed by a rise of almost 25 hPa at Sète and a little less at Toulon, and its evolution was delayed by about 3.5 h between the west (Sète) and the east (Toulon), as shown by the data recorded at Sète and Toulon. Even if the relationship between sea level and barometric pressure does not exactly follow the isostatic inverted-barometer response, we clearly see the averaged water level (with respect to seiching characteristic time) follows the air pressure evolution. In Toulon harbour, oscillation at a period of order of 45 min may be due to a more local forcing, as observed for various types of atmospheric and/or marine forcings, as shown and discussed in the next section.
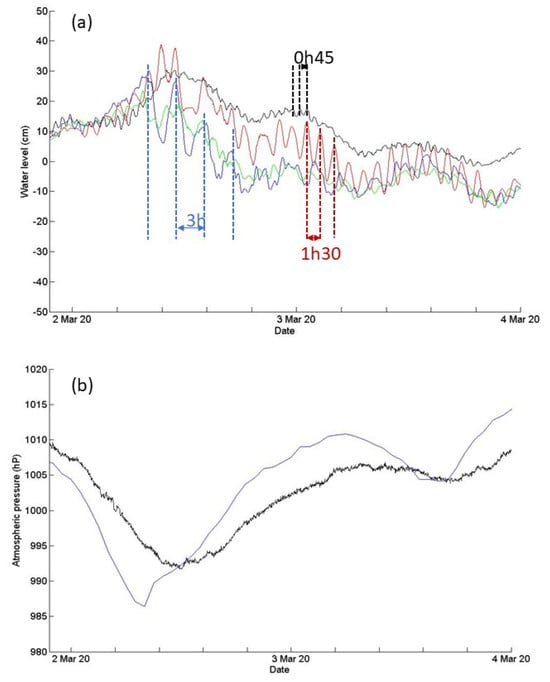
Figure 16.
Seiching observed in March, 2020. (a) Series of water levels time-averaged over a moving window of 20 min at stations of Port Vendres (green), Sète (blue), Fos-sur-Mer (red), Toulon (black lines). (b) Atmospheric pressure at Sète (blue line) (source www.infoclimat.fr/archives, accessed on 20 May 2025) and at Ifremer/Toulon (black line) stations (source https://htmnet.mio.osupytheas.fr/, accessed on 20 May 2025).
6. Application to the Nearshore Area Including the Gulf of Giens near Toulon, France
In order to further demonstrate the applicability of the model to the calculation of the resonances at the scale of ocean basins over a wide range of basin sizes for which the Coriolis force must be taken into account for the dynamics of long waves, in this section an example in the nearshore region of Southern France is presented. In particular, the present method is applied to calculate the first (larger) eigenperiods in an extended nearshore area near Toulon, France including the gulf of Giens; see Figure 17. The open sea boundary is indicated by a thick dashed line. This region has a much smaller extent of 30 km by 10 km and was analysed in a previous study by Belibassakis & Rey [17] using the modified mild-slope model in conjunction with an FEM scheme (MMS-FEM). In this case, the first eigenperiods have been calculated to be on the order of tens of hours, rendering the present SWE-FEM model also applicable.
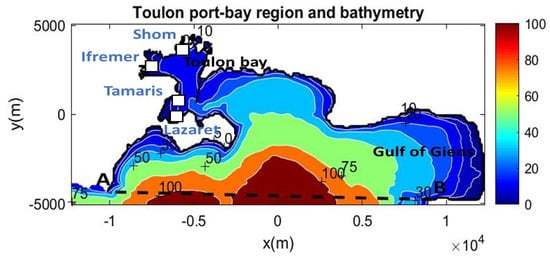
Figure 17.
Bathymetry of the Toulon port-bay and nearshore/coastal region including the Gulf of Giens in the western part. The part corresponding to the studied area is the region north of the entrance AB of length 5.9 km, as shown by the dashed line. The positions of the Shom, Ifremer, Tamaris, and Lazaret stations are indicated by squares.
Results are presented below, including the effects of the Coriolis term and compared against MMS-FEM predictions. The FEM mesh defined in the extended Toulon–Giens nearshore region is presented in Figure 18 and includes also the breakwater in the Toulon bay-port area. It is noted that the studied resonance periods correspond to long waves. Their wavelength is much greater than the size of the breakwater, which is modelled as an impermeable hard boundary where a Neuman boundary condition is applied.
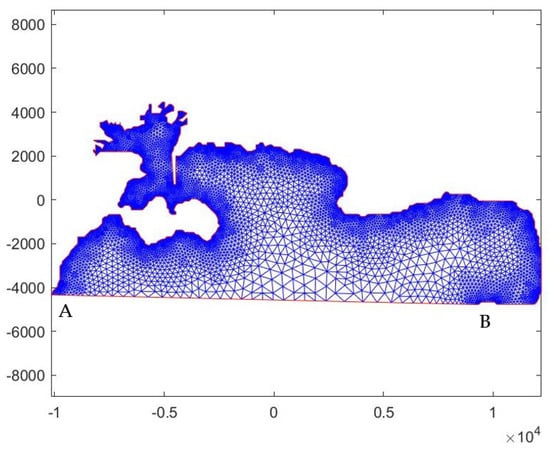
Figure 18.
FEM mesh in the extended Toulon–Giens region. The number of elements is Ne = 18,884 and total nodes N = 10,198.
The first four calculated eigenperiods are listed in Table 2 and are compared with the corresponding prediction by the MMS-FEM model. The corresponding calculated eigenmodes for the first and third eigenperiods in the region are illustrated in Figure 19 and Figure 20, respectively. We observe that the present results are fully compatible with the predictions of the mild-slope model.

Table 2.
First eigenperiods (in min) as calculated by (a) the present SWE-FEM model in the Toulon–Giens region compared with (b) the MMS-FEM model.
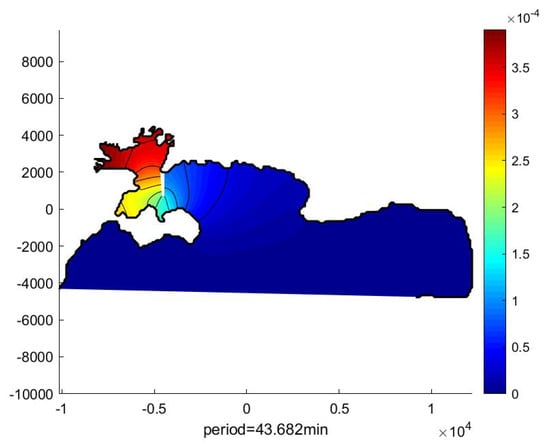
Figure 19.
Calculated first eigenmode in the Toulon–Giens region by the present SWE-FEM.
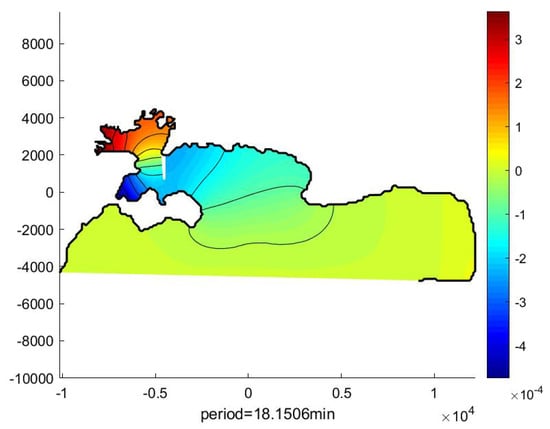
Figure 20.
Calculated third eigenmode in the Toulon–Giens region by the present SWE-FEM.
The measured maxima of amplitudes (half-ranges) in several stations along the French coast, described in more detail by Belibassakis & Rey [17], are calculated through either direct analysis of the time series or by calculation of the maximum amplitude of the Fourier coefficient, for T = 44 min and T = 18 min, using a moving window for coexisting seiching periods or for noisy signals.
Results are presented comparatively in Table 3 concerning the amplitudes in the stations relative to the Ifremer station, and we observe that the present SWE-FEM model predictions are in good agreement with the measured relative amplitudes.

Table 3.
Relative amplitude in the stations Lazaret, Tamaris, and Shom with respect to Ifremer station. Comparison of predictions by the present SWE-FEM model listed in the last column.
7. Conclusions
In the present work, a nonlinear model of Shallow Wave Equations (SWEs) is presented, taking into account the variable bathymetry of extended semi-enclosed sea basins. The model with spatially varying Coriolis term is implemented for the description of resonances, from which the eigenperiods and eigenmodes of extended geographical sea areas are calculated by means of a low-order FEM scheme. The model is applied to the western Mediterranean basin, illustrating its versatility to easily include effects of geographical characteristics like islands and other coastal features. The calculated resonant frequencies and modes depend on the domain size and characteristics as well as the location of the open sea boundary and are shown to provide results compatible with tide measurements at several stations in the coastal region of France. Indeed, calculation of the natural oscillation modes in the western Mediterranean basin, bounded by open boundaries at the Strait of Gibraltar and the Strait of Sicily, reveals a natural period of around 6 h, corresponding to the quarter-diurnal tidal components, which are stationary and of roughly constant amplitude on the northern coast of the basin and on the west coast of Corsica (France). On the east coast of Corsica, on the other hand, these components are of very low amplitude and in phase opposition. The resonance periods calculated for the lowest periods are 4.7 h, 3.14 h, 2.68 h, 2.3 h, etc. They are not found in the analyses of the tide gauge signals except for the one at around 3 h, observed on the Sète tide gauge. However, this resonant oscillation appears to be more related to variations in water level on the scale of the Gulf of Lion. It does not generate a significant oscillation on the scale of the western basin in the case presented, which is nevertheless energetic with water level variations of around 30 cm associated with the resonant oscillation. Moreover, the present SWE-FEM is applied to calculate the first eigenperiods in an extended nearshore area near Toulon, France, including the gulf of Giens, and the results are verified against predictions obtained by the modified mild-slope model, illustrating its good modelling capabilities also for smaller regions.
Author Contributions
Conceptualization, K.B. and V.R.; methodology, K.B. and V.R.; software, K.B.; validation, V.R.; writing—original draft preparation, K.B. and V.R.; writing—review and editing, K.B. and V.R.; visualization, K.B. and V.R. All authors have read and agreed to the published version of the manuscript.
Funding
This research received no external funding.
Data Availability Statement
The original contributions presented in th.e study are included in the article. Further inquiries can be directed to the corresponding author.
Acknowledgments
Support of K. Belibassakis to visit the University of Toulon is acknowledged. T. Missamou, from the Mediterranean Institute of Oceanography (MIO), is acknowledged for the installation and the maintenance of the HTM-NET stations (Ifremer, Tamaris, Lazaret in the present), D. Mallarino from the OSU Pytheas institute for the HTM-NET website maintenance. For the other sites, water level data are provided by the Shom site (https://refmar.shom.fr/, accessed on 20 May 2025). Atmospheric data for the location of Sète are provided by Infoclimat (www.infoclimat.fr/archives, accessed on 20 May 2025).
Conflicts of Interest
The authors declare no conflicts of interest.
References
- Rabinovich, A.B. Seiches and Harbor Oscillations. In Handbook of Coastal and Ocean Engineering; Young, C.K., Ed.; World Scientific: Singapore, 2009; pp. 193–236. [Google Scholar]
- Heath, R.A. Estimates of the resonant period and in the semi-diurnal tidal band in the North Atlantic and Pacific Oceans. Deep Sea Res. Part A Oceanogr. Res. Pap. 1981, 28, 481–493. [Google Scholar] [CrossRef]
- Godin, G. The resonant period of the Bay of Fundy. Cont. Shelf Res. 1988, 8, 1005–1010. [Google Scholar] [CrossRef]
- Rey, V.; Dufresne, C.; Fuda, J.L.; Mallarino, D.; Missamou, T.; Paugam, C.; Rougier, G.; Taupier-Letage, I. On the use of long term observation of water level and temperature along the shore for a better understanding of the dynamics: Example of Toulon area, France. Ocean Dyn. 2020, 70, 913–933. [Google Scholar] [CrossRef]
- McDonagh, B.; Clementi, E.; Goglio, A.C.; Pinardi, N. The characteristics of tides and their effect on the general circulation of the Mediterranean Sea. Ocean Sci. 2024, 20, 1051–1066. [Google Scholar] [CrossRef]
- Tsimplis, M.N.; Proctor, R.; Flather, R.A. A two-dimensional tidal model for the Mediterranean Sea. J. Geophys. Res. Ocean. 1995, 100, 16223–16239. [Google Scholar] [CrossRef]
- Medvedev, I.P.; Vilibic, I.; Rabinovitch, A.B. Tidal resonance in the Adriatic Sea: Observational evidence. JGR Ocean. 2020, 125, e2020JC016168. [Google Scholar] [CrossRef]
- Lafuente, J.G.; Almazan, J.L.; Castillejo, F.; Khribeche, A.; Hakimi, A. Sea Level in the Straight of Gibraltar. Int. Hydrogr. Rev. 1990, 67, 111. [Google Scholar]
- Defant, A. Physical Oceanography; Pergamon Press: New York, NY, USA, 1960. [Google Scholar]
- Massel, S.R. Harmonic generation of waves propagating over a submerged step. Coast. Eng. 1983, 7, 357–380. [Google Scholar] [CrossRef]
- Wöppelmann, G.; Marcos, M.; Coulomb, A.; Martin Miguez, B.; Bonnetain, P.; Boucher, C.; Gravelle, M.; Simon, B.; Tiphaneau, P. Rescue of the historal water level record of Marseille (France) from 1885 to 1988 and its extension back to 1849–1851. J. Geod. 2014, 71, 869–885. [Google Scholar] [CrossRef]
- Pairaud, I.L.; Lyard, F.; Auclair, F.; Letellier, T.; Marsaleix, P. Dynamics of the semi-diurnal and quarter-diurnal internal tides in the Bay of Biscay. Part 1: Barotropic tides. Cont. Shelf Res. 2008, 28, 1294–1315. [Google Scholar] [CrossRef]
- Bajo, M.; Ferrarin, C.; Umgiesser, G.; Bonometto, A.; Coraci, E. Modelling the barotropic sea level in the Mediterranean Sea using data assimilation. Ocean Sci. 2023, 19, 559–579. [Google Scholar] [CrossRef]
- Cort’es, P.; Catal’an, P.A.; Ar’anguiz, R.; Bellotti, G. Tsunami and shelf resonance on the northern Chile coast. J. Geophys. Res. Ocean. 2017, 122, 7364–7379. [Google Scholar] [CrossRef]
- Ren, Z.; Liu, H.; Jimenez, C.; Wang, Y. Tsunami resonance and standing waves in the South China Sea. Ocean Eng. 2022, 262, 112323. [Google Scholar] [CrossRef]
- Karathanasi, F.; Karperaki, A.; Gerostathis, T.; Belibassakis, K. Offshore-to-Nearshore Transformation of Wave Conditions and Directional Extremes with Application to Port Resonances in the Bay of Sitia-Crete. Atmosphere 2020, 11, 280. [Google Scholar] [CrossRef]
- Belibassakis, K.; Rey, V. Estimation of harbor and bay resonances by MMS-FEM model with application to the bay of Toulon France. Oceanologia 2024, 66, 66402. [Google Scholar] [CrossRef]
- Wessel, P.; Smith, W.H.F. A Global Self-consistent, Hierarchical, High-resolution Shoreline Database. J. Geophys. Res. 1996, 101, 8741–8743. [Google Scholar] [CrossRef]
- Sahal, A.; Roger, J.; Allgeyer, S.; Lemaire, B.; Hébert, H.; Schindelé, F.; Lavigne, F. The tsunami triggered by the 21 May 2003 Boumerdès-Zemmouri (Algeria) earthquake: Field investigations on the French Mediterranean coast and tsunami modelling. Nat. Hazards Earth Syst. Sci. 2009, 9, 1823–1834. [Google Scholar] [CrossRef]
Disclaimer/Publisher’s Note: The statements, opinions and data contained in all publications are solely those of the individual author(s) and contributor(s) and not of MDPI and/or the editor(s). MDPI and/or the editor(s) disclaim responsibility for any injury to people or property resulting from any ideas, methods, instructions or products referred to in the content. |
© 2025 by the authors. Licensee MDPI, Basel, Switzerland. This article is an open access article distributed under the terms and conditions of the Creative Commons Attribution (CC BY) license (https://creativecommons.org/licenses/by/4.0/).