1. Introduction
As climate change continues to increase the sea levels and exacerbate the frequency and intensity of extreme weather events, coastal regions face unprecedented challenges in managing flooding risks [
1]. The adaptation strategies focus on enhancing the resilience of these structures to withstand higher wave overtopping discharges and flooding. One of the most common adaptation measures is increasing the crest height of the existing coastal protection structures [
2]. However, this approach can be limited by the need to maintain recreational spaces and public access along urban coastlines. Therefore, innovative design solutions are necessary to balance flood protection with community needs. Among the various strategies employed to protect these vulnerable areas, storm walls (or, in some papers, retreated wave walls [
3] or seawalls [
4]) have emerged as a viable solution for coastal defense infrastructure.
Storm walls are engineered structures designed to prevent the encroachment of seawater during extreme weather events. Their primary function is to reduce the risk of coastal flooding or limit overtopping of coastal infrastructure, such as breakwaters. Storm walls are typically placed along coastlines, harbors [
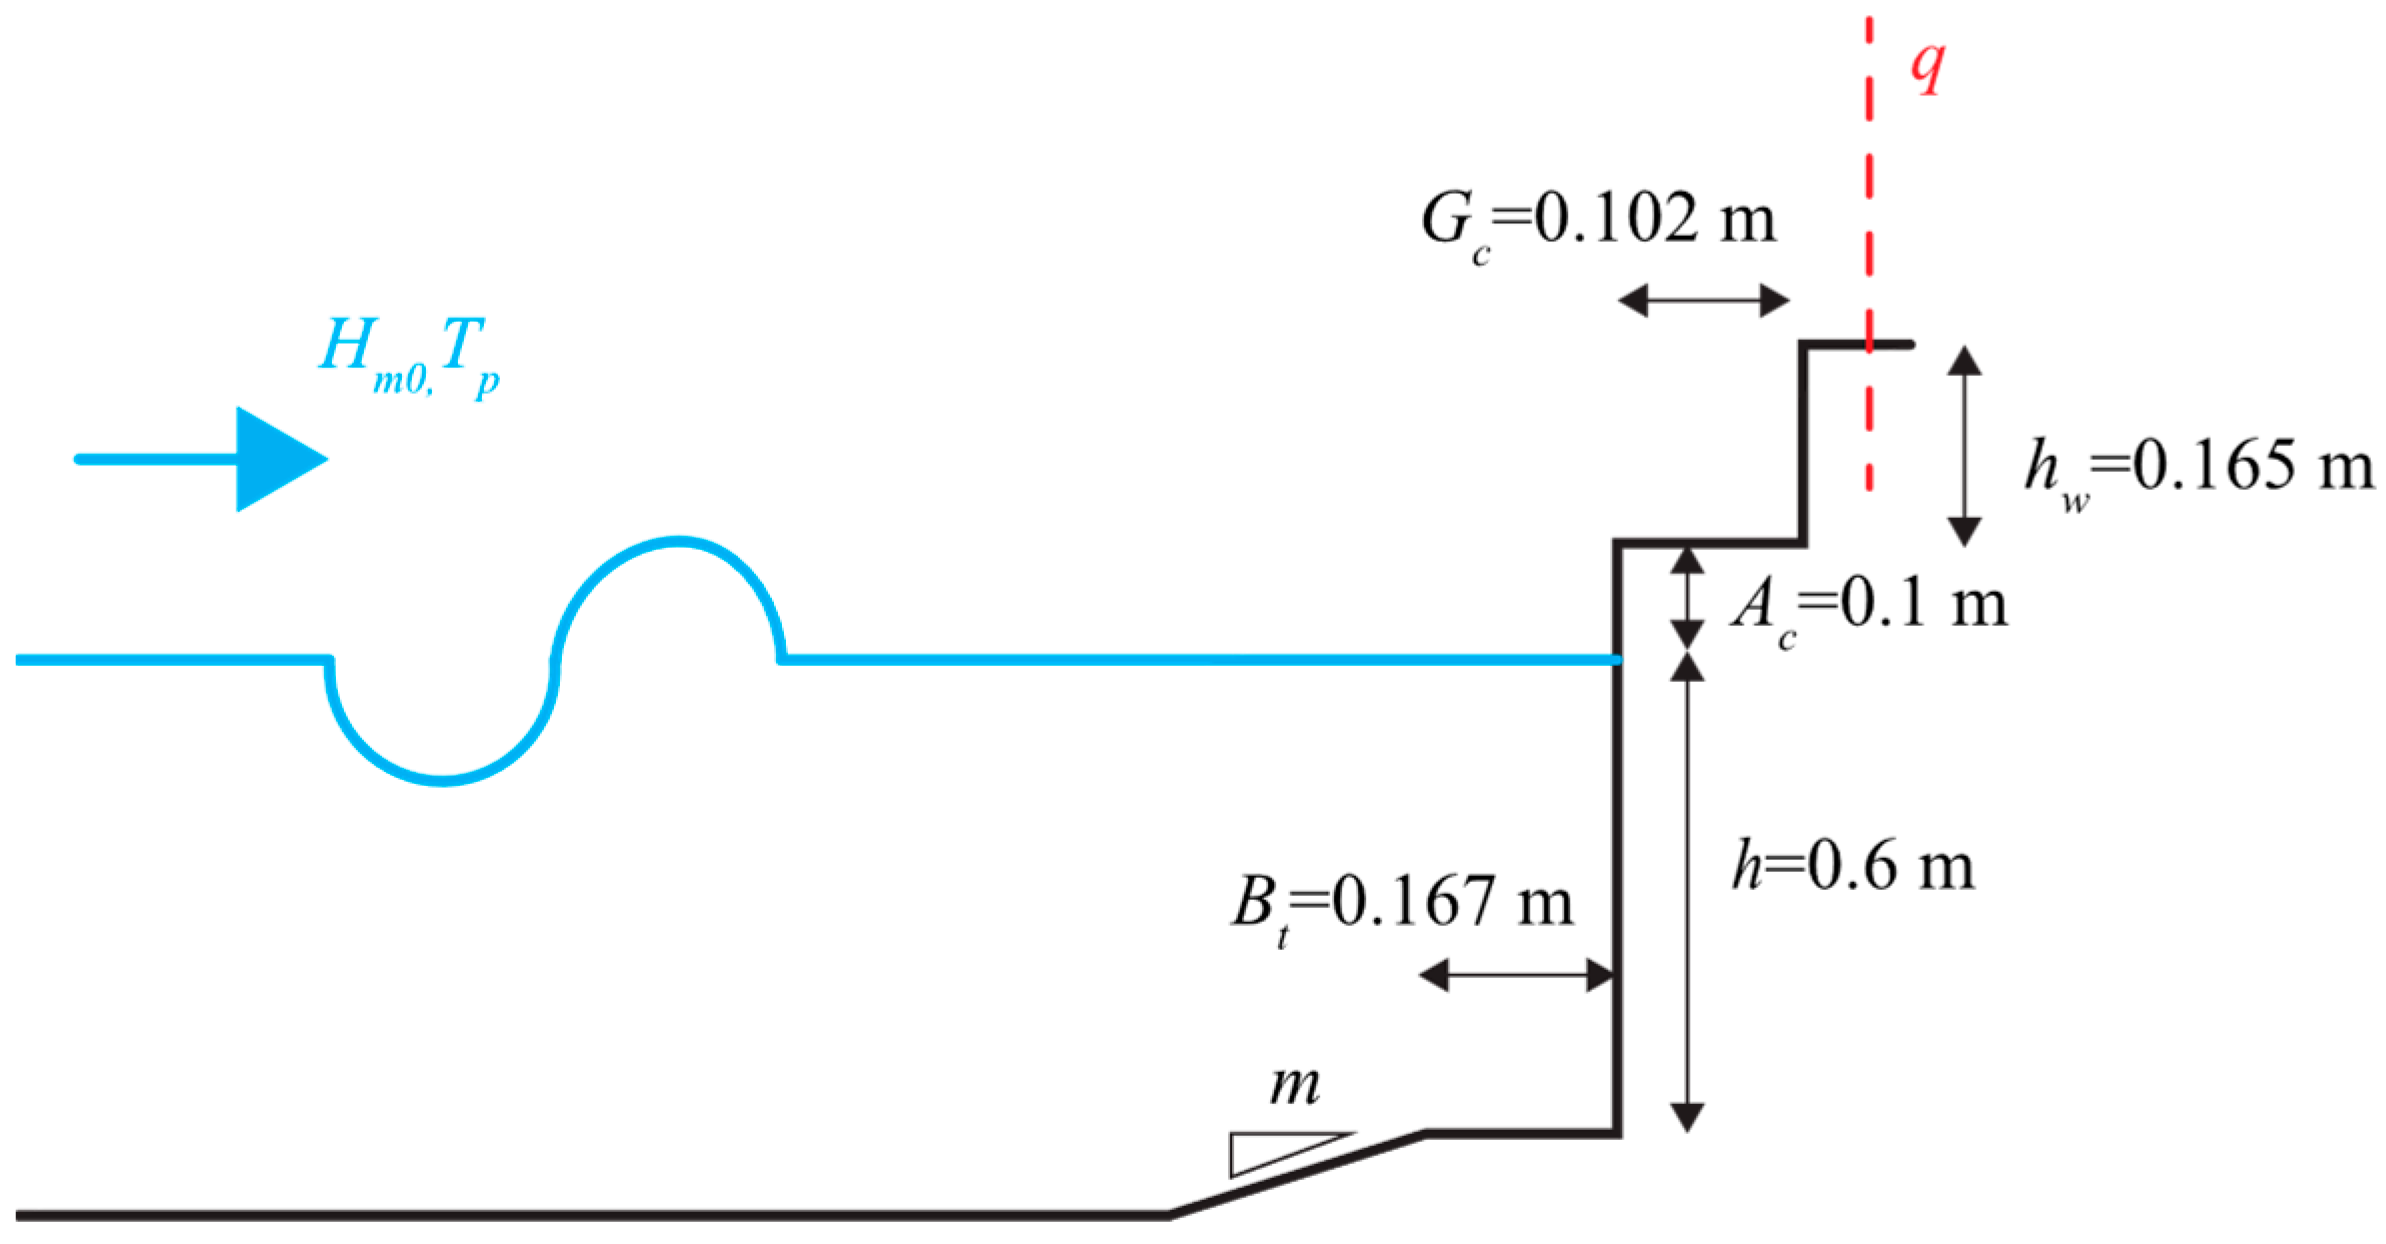
5], and other vulnerable areas at a distance on the order of a wave length from the vertical wall edge or lower. The design parameters of storm walls, such as the distance from the plain vertical wall edge and wall height, should be chosen depending upon various local conditions, including the designed significant wave height,
Hs, and peak period,
Tp, wave direction, as well as designed water levels, and the specific hydrodynamic environment. These design parameters could be deduced using buoy measurements [
6], regional and global reanalysis models [
7,
8], or commonly in semi-sheltered areas with the use of downscaling [
9,
10].
The use of storm walls is particularly prevalent in urban coastal areas where the risk of flooding is heightened due to population density and infrastructure development, especially in many low-elevation coastal zones (LECZs). They exhibit higher rates of population growth and urbanization, and this trend is expected to continue [
1]. At the same time, LECZs are vulnerable to coastal risks such as storm surges, overtopping, and coastal flooding and their exposure will increase with foreseen sea-level rise related to climate change scenarios, which could be additionally exacerbated in subsiding coasts of the Mediterranean. The European Flood Directive 2007/60/EC points out the urgency of flood risk management plans while the Sendai Framework for Disaster Risk Reduction 2015–2030, endorsed by the UN General Assembly, highlights the need to adopt a multi-hazard approach for management across different sectors [
11,
12]. Identifying adaptive planning for urban and LECZ communities is thus mandatory, and in this perspective, the development of innovative coastal protection systems, or adaptation measures of existing structures, is necessary. These structures serve not only as protective barriers to reduce costs due to coastal flooding during extreme storm events but also as integral components of urban planning and development. In many cases, storm walls are designed to accommodate recreational spaces, such as promenades, which can enhance the aesthetic appeal of coastal areas while providing essential flood protection [
13]. However, the dual function of these structures can complicate their design, as recreational use may limit the height and configuration of the walls. Well-designed storm walls can incorporate walkways, parks, and other public spaces, allowing communities to enjoy the waterfront while benefiting from enhanced flood protection. This dual functionality is particularly important in urban settings, where the demand for recreational spaces often competes with the need for effective flood defenses.
The amount of overtopping that occurs over storm walls can be assessed using the Eurotop manual [
14], machine learning methods such as ANNs [
15,
16], particularly in complex settings, or numerical modeling techniques to accurately estimate wave overtopping, as cited in [
17]. However, the Eurotop manual’s [
14] recommendations for storm wall implementation are confined to smooth breakwaters, omitting guidance for vertical wall applications. Moreover, [
17] emphasizes the importance of considering the interdependencies of different structural elements when designing storm walls. For example, the interaction between a storm wall and a promenade can influence overtopping discharges, necessitating a comprehensive approach to design that accounts for these complexities.
The authors in [
4] conducted physical model studies to evaluate the performance of various crest modifications for seawalls, providing valuable insights into the effectiveness of different design strategies. The findings indicate that the placement and design of storm walls significantly influence their effectiveness, particularly under low freeboard conditions. For instance, a storm wall positioned on the landward edge of a promenade performs better than one located seaward [
4]. The study reveals that a simple promenade extending landward of a vertical wall provides very little reduction without a storm wall, whereas a storm wall located on the landward edge of a promenade is more effective under low freeboard conditions. Their findings also suggest that while increasing the height of storm walls is a common approach, the integration of additional features, such as parapets and promenades, can significantly enhance overtopping reduction [
4]. Romano adopts another perspective, stating that wave overtopping discharges can increase significantly (up to 2.55 times those observed with flushed wall configurations), highlighting the need for careful consideration of wall positioning and design in storm wall applications. It should be highlighted here that [
18] used regular waves in their study, while [
4] used irregular waves in their laboratory setting. To summarize, current research on storm wall design for vertical walls relies on experimental (such as [
4]) and numerical SWASH methods (such as [
19]); however, CFD and data-driven approaches remain unexplored.
On the other hand, the present knowledge on crest modifications using storm walls to reduce overtopping on sloping coastal structures such as dikes is extensive. Information about these prediction formulas and design requirements are presented in Eurotop [
14] in detail. Also, a similar level of knowledge is not available for the modification of plain vertical structures such as urban seawalls. The location of urban vertical walls exposes waves to impulsive wave conditions that mostly generate impulsive overtopping conditions for which limited knowledge exists for storm wall usage as well.
The focus of this study is on the overtopping behavior over a retreated storm wall on a plain vertical seawall, a configuration increasingly common in coastal urban areas, especially in the Mediterranean Sea, as an adaptive response to rising sea levels and changing storm patterns. This paper concentrates specifically on the restricted heights of storm walls for flood protection, specifically those found within historical urban areas where local authorities enforce a maximum height (cca. 50 cm) to preserve the historical aesthetic appeal of the area. Examples can be found in numerous locations, such as Rovinj and Split. As existing vertical walls are retrofitted or new vertical walls are designed with the forethought of future adaptation to climate change-induced sea-level rise, it is essential to predict the performance of these complex systems accurately. To accommodate this, this paper proposes a
reduction coefficient equation for use with the Eurotop empirical model for plain vertical walls with steep foreshores (
m > 1:10) and steep waves (
s0 > 0.03) [
14], which could be commonly found in the Mediterranean Sea. Overall, by proposing a reduction coefficient to the already established empirical equations, this paper offers a practical guideline for engineers and coastal managers seeking to improve the resilience of storm walls in the face of rising sea levels.
3. Result
3.1. Solution Verification
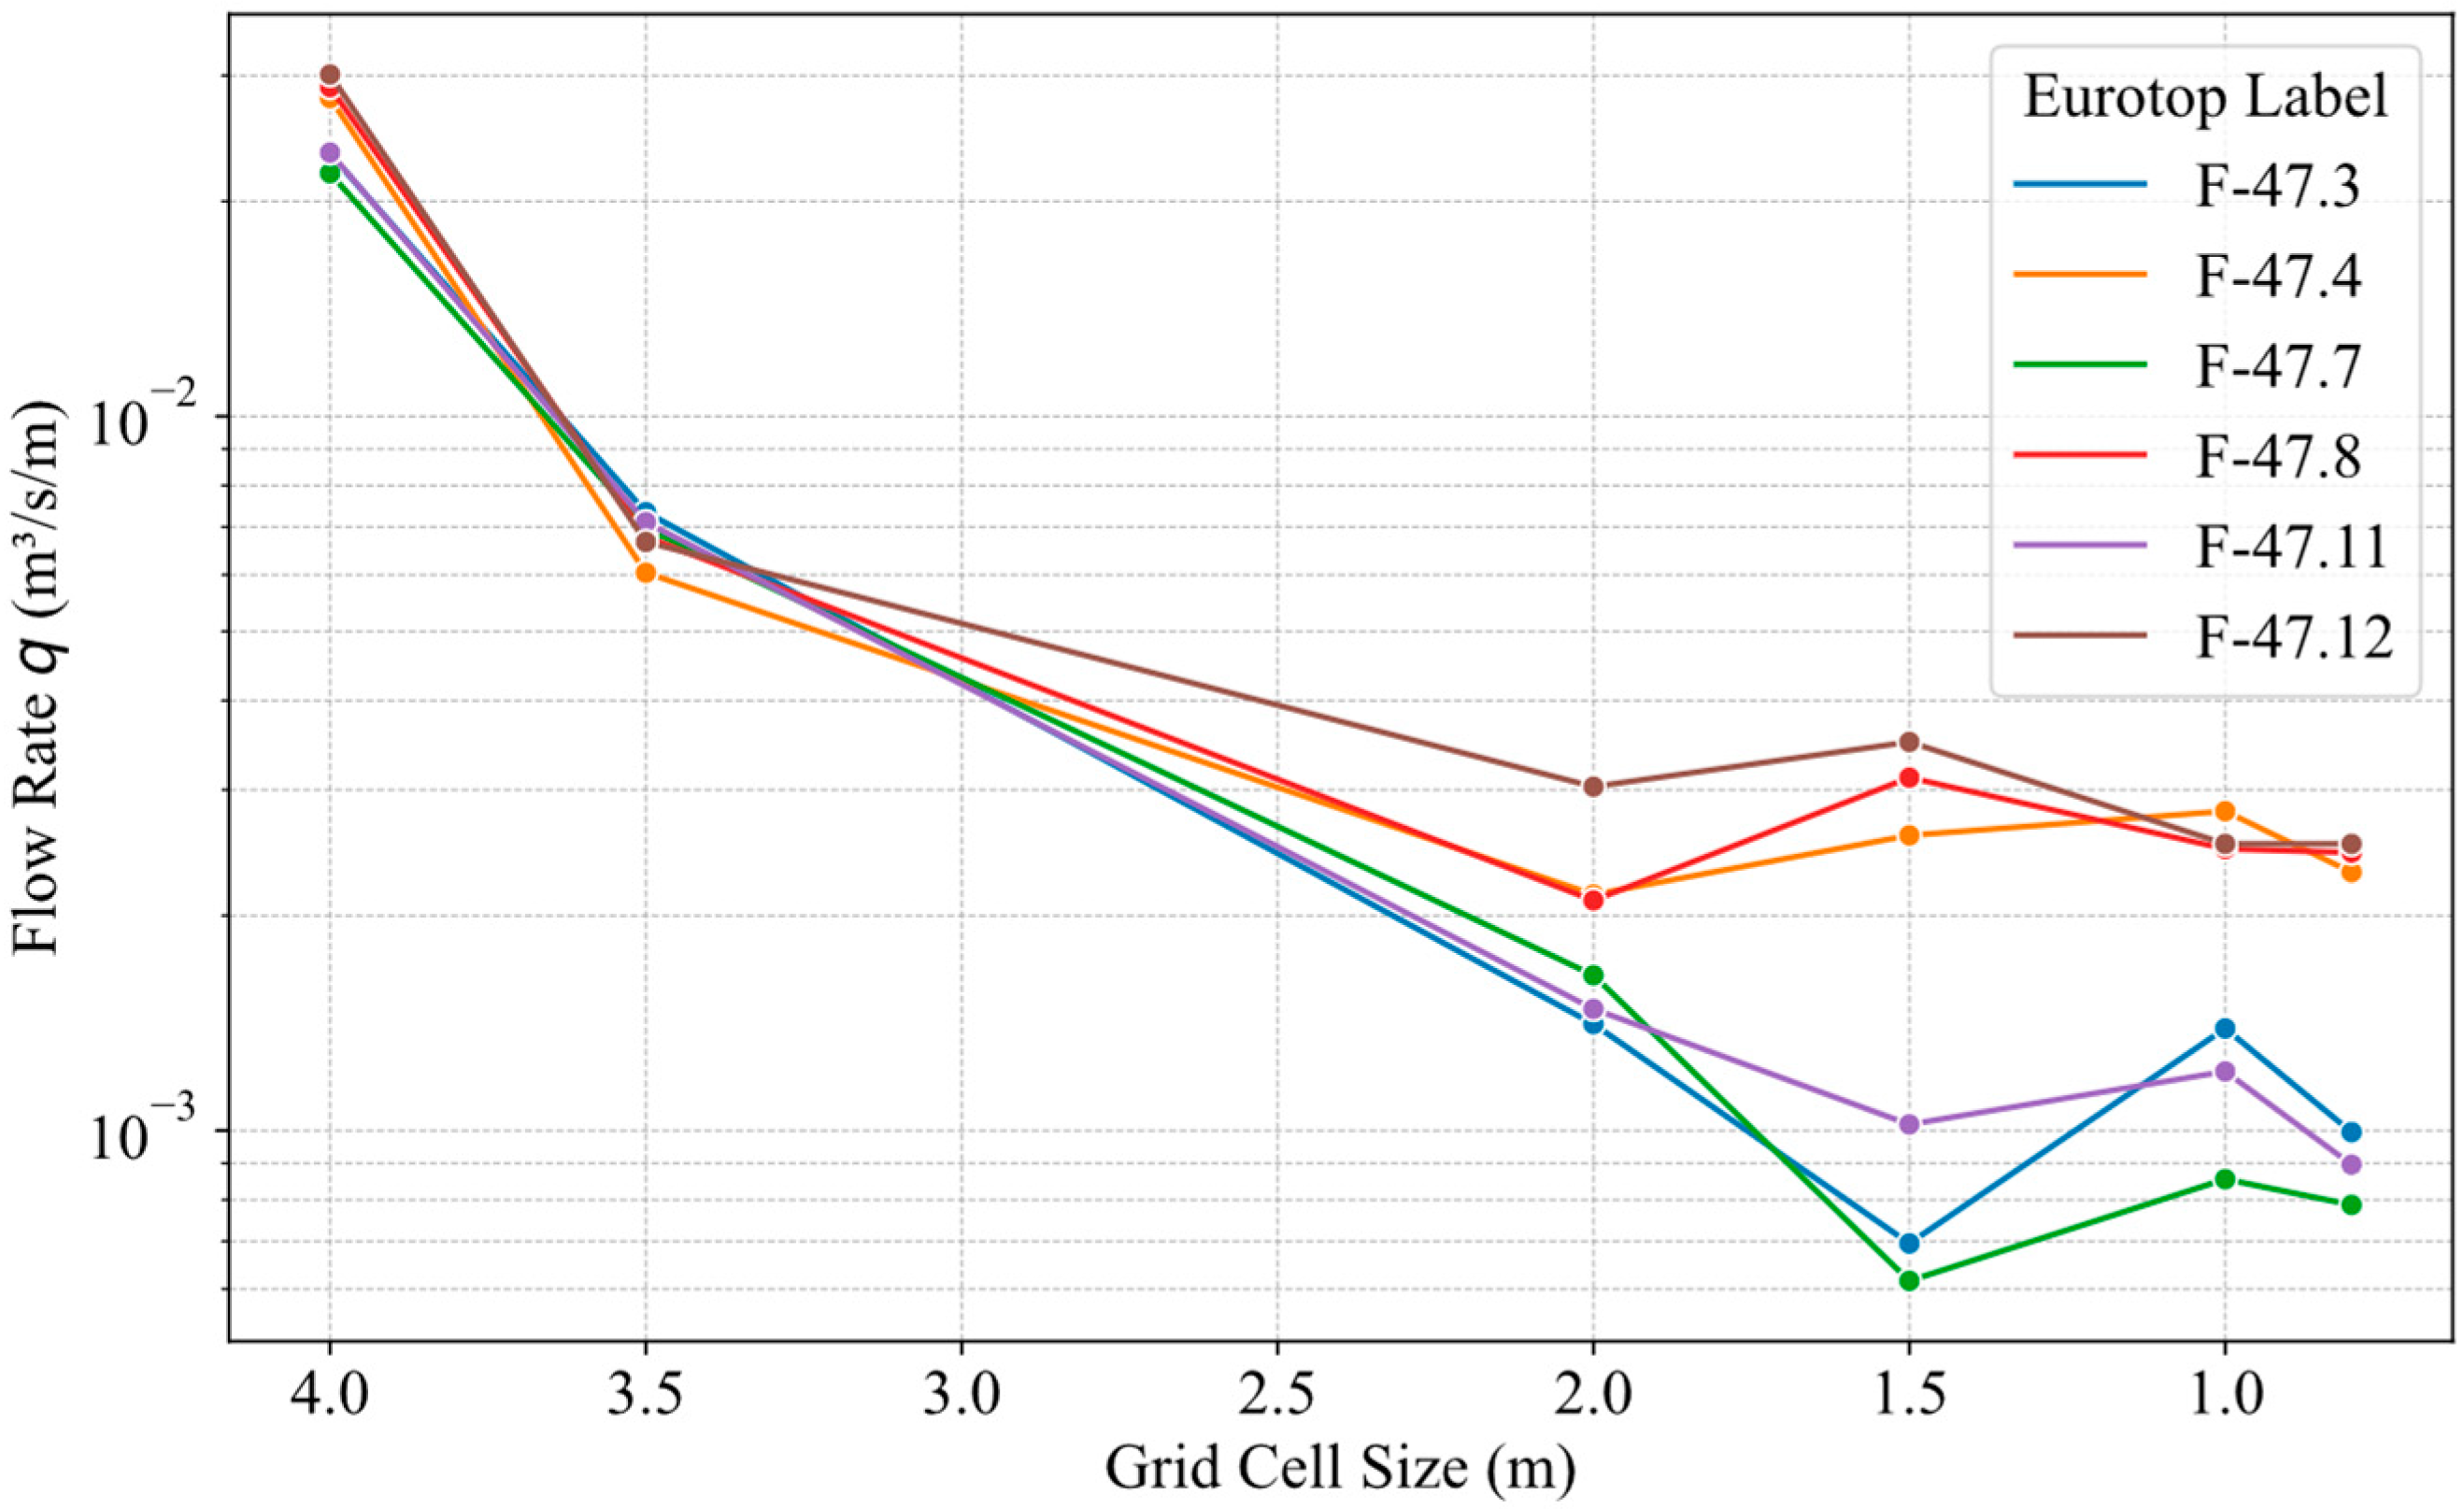
Figure 3 illustrates the results of the solution verification. The grid cells are systematically reduced to enhance horizontal spatial resolution. For the given control test cases (F-47.3, F-47.4, F-47.7, F-47.8, F-47.11, and F-47.12 as shown in
Table 1), as the horizontal resolution increases, all test cases demonstrate convergence. Specifically, three test cases converge to the value of order
m
3/s/m, while the other three converge to the value of order
m
3/s/m.
Considering that each test case (F-47.3, F-47.4, F-47.7, F-47.8, F-47.11, and F-47.12 as shown in
Table 1) has a peak wavelength of either 74.88 m or 81.25 m, the highest resolution setting achieves a wavelength-to-resolution (
) ratio of approximately 100. As per the guidelines provided in the SWASH user manual [
37], this ratio is recommended for satisfactory calculation accuracy.
It is notable that when a horizontal resolution of approximately is reached, the convergence is almost reached. The testing results indicate that a horizontal spatial resolution of is sufficient to remove any uncertainties that might result from the convergence issues related to resolution. Therefore, the grid resolution will be used in the rest of the results given in this paper.
3.2. Validation
Figure 4 illustrates the validation of results obtained from the SWASH numerical model against the physical scale tests documented in the Eurotop/CLASH database (more details in
Section 2.2, such as scaling). The comparison reveals that almost all test cases fall within the bounds of the factor 2 and factor ½ line. Furthermore, the green dashed line represents a perfect fit between the simulated overtopping values and the measured ones from the physical tests. The close alignment of most test cases with this ideal line further highlights the accuracy of the numerical model in replicating real-world overtopping scenarios.
This outcome demonstrates a high degree of agreement between the numerical simulations and the physical model results. According to established validation criteria, results falling within a factor of three of the measured values are considered very good, while those within a factor of five are deemed acceptable [
17,
19]. The SWASH model consistently exhibits overprediction, with an average bias of 0.00027, while the strong correlation (
r = 0.98) and low root mean square error (RMSE = 0.000381) between simulated and measured data indicate a high degree of agreement. Therefore, the overall consistency observed here underscores the robustness of the SWASH model.
3.3. Results of Parameter Study
Figure 5 shows a grid of scatterplots and histograms that visualizes relationships between multiple variables in a dataset. It provides a comprehensive overview of how variables are distributed and correlated. The density of the dots (test cases) in the scatterplots shows the distribution of the used input variables and the distribution of the output variable (overtopping,
q). The sampling of the test cases is accomplished through the implementation of a Latin Hypercube Sampling scheme (described in
Section 2.3).
As outlined in the previous section and detailed in the methodology, the sampling process was conducted across seven different input parameters. The parameter spaces were sufficiently populated to capture the potential variability in each parameter. The correlation matrix (
Figure 5) reveals limited correlation between the overtopping rate and most input variables, with the only notable correlation (r > 0.6, in red in
Figure 5) observed being with the significant wave height,
Hm0. Other input variables show low (r < 0.6, in purple in
Figure 5) or no correlation (r < 0.3, in blue in
Figure 5) with the overtopping rate,
q.
In addition to the direct relationship exploration of input variables and overtopping, we composed common non-dimensional parameters used in the Eurotop manual [
14] and compared them to the composite overtopping rate (
) for each test case (
Figure 6). Among the parameters considered, the highest correlation with the overtopping rate (
) was observed with the non-dimensional crest height (
) and the impulsive wave condition (
) in front of the vertical wall. The former is widely used in the literature, such as in the Eurotop manual [
14] and in Equation (1) shown in
Section 2.4, to describe the functional dependence of non-dimensional overtopping. With the increase in crest height,
Rc, it is expected that the overtopping rate should decrease, which is reasonable and in alignment with other studies and the Eurotop manual. It is, however, of significant importance to observe a strong negative correlation (r < 0.6, red in
Figure 6) between the wave impulse condition (
) and the overtopping. With waves becoming more impulsive (
is decreasing), the overtopping significantly increases.
Additionally, the non-dimensional storm wall height (
) showed a moderate correlation (r = 0.3–0.6, purple in
Figure 6) with overtopping (
); with the increase in the storm wall height, the overtopping tends to decrease, which is logical by itself. Furthermore, the non-dimensional promenade width (
) demonstrated a moderate negative correlation (r = 0.3–0.6, purple in
Figure 6) with overtopping. It is shown that with greater promenade width,
Gc, the overtopping,
q, is expected to decrease, even though there is a great scatter for low
.
In general, non-dimensional input variables that include wave parameters showed increased correlation with overtopping rate; only foreshore steepness showed a decreased correlation, which also showed lower correlation when directly correlated with overtopping rate (
q) in
Figure 5. Additionally, the higher correlation between
Hm0 and
q is also observed in the non-dimensional input variables that contain
Hm0 and
.
3.4. Overtopping Results
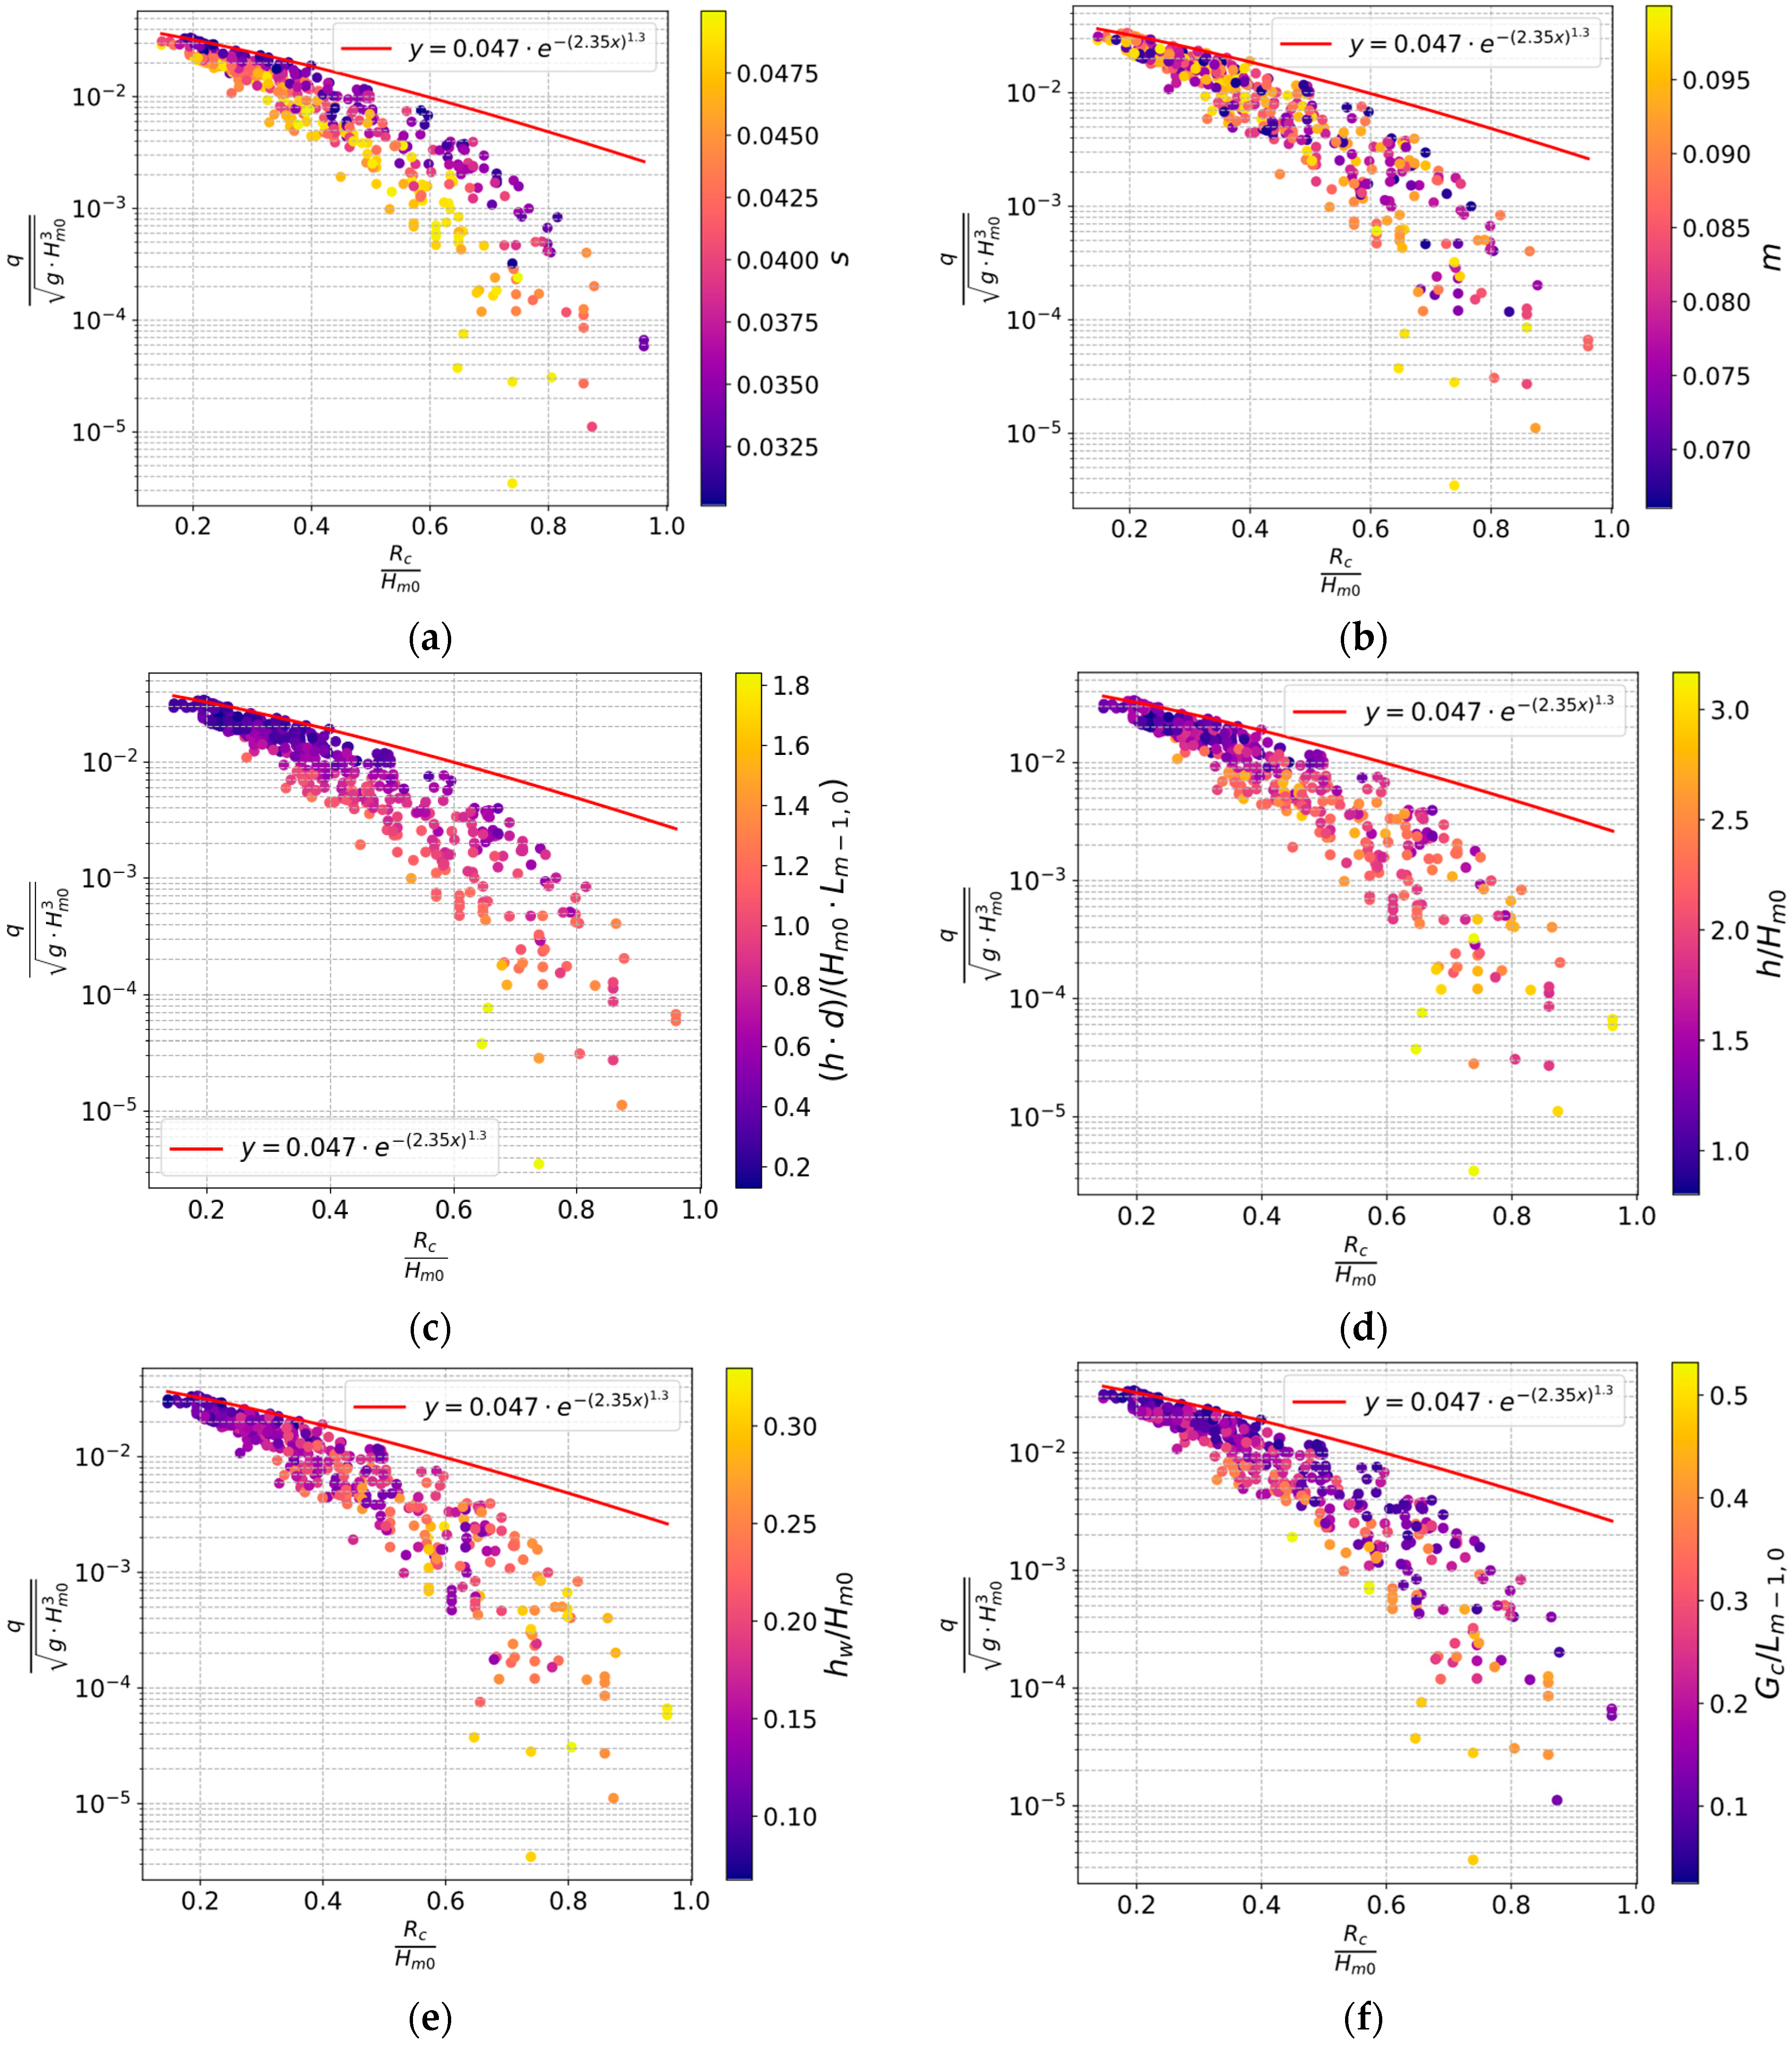
Using the dimensionless crest height
on the x-axis as is common in the Eurotop manual, we analyzed overtopping behavior and plotted the results in scatter plots, as shown in
Figure 7. This approach is common in the Eurotop manual, where
demonstrates the strongest correlation in explaining dimensionless overtopping over a structure, as was also observed in this study (described in
Section 3.3). To improve the understanding of the overtopping process, we explored the predictive capacity of this parameter in relation to other dimensionless variables analyzed within the study, seeking to identify descriptive patterns.
In the analysis, each
Figure 7a–f utilized distinct color schemes to represent different dimensionless parameters. This included wave steepness,
s, foreshore slope,
m, water depth in front of the wall normalized by wave height,
, condition for impulsive waves,
, storm wall height normalized by wave height,
, and promenade width normalized by wavelength,
. The dot color scheme allowed for a visual distinction of how each parameter examined on the color bar influenced the overtopping behavior on the y-axis.
Wave steepness emerged as an important factor, with higher steepness values leading to reduced overtopping for the same
(visually confirmed on
Figure 7a by a lower y-axis position of yellow dots—representing high wave steepness—across all x values). Waves with higher steepness exhibit increased instability and breaking, thus leading to greater energy dissipation (more wave components are near the break limit) when reaching the promenade that precedes the storm wall. In contrast, the influence of the foreshore slope was less clear. The small range of slopes tested, from 1:7 to 1:10, likely limited the ability to observe significant dot color trends. A broader range of foreshore slopes might reveal more definitive relationships with overtopping.
The condition for impulsive waves showed a clear dot color trend: as the waves became more impulsive ( decreases for increasingly impulsive wave conditions), overtopping decreased. Impulsive waves violently break at the vertical wall edge, resulting in high-momentum flows across the promenade that violently clash against the storm wall and overtop the storm wall.
A similar trend was observed when the water depth was normalized by significant wave height () to the condition for impulsive waves ().
The dimensionless storm wall height, , also showed a decreasing trend in overtopping as the storm wall height increased. However, this dot color trend was less significant because storm wall height is already implicitly incorporated into the dimensionless crest height, . Also, the limited variability in storm wall height (20–50 cm) further weakened the observed dot color trends. It is hypothesized that a broader range of storm wall heights would yield more obvious patterns.
Dimensionless promenade width, , showed a significant effect on overtopping. Longer promenade width led to reduced overtopping, as waves overtopping lose energy over the extended surface before reaching the storm wall. This effect could become more pronounced with higher friction coefficients on the promenade surface. In this study, a friction coefficient representative of concrete was used (Manning coefficient of 0.012 for all test cases), which reflects common coastal construction materials for this type of structure. Increasing the promenade width or roughness would further dissipate wave energy, minimizing overtopping.
3.5. Reduction Factor Parametrization
Using Eurotop Equation (2) presented in
Section 2.4, we calculated the reduction factors,
, values required to ensure that the Eurotop dimensionless overtopping predictions perfectly align with those obtained from SWASH simulations. It is important to note that the Eurotop equation without the reduction factor,
, is specifically designed for plain vertical walls without a storm wall. In
Figure 8, all dimensionless parameters are plotted against the
values. Data point values of
are determined so they would give a perfect match between overtopping in SWASH simulations and the empirical formula from
Section 2.4.
The parameter
is no longer the dominant dimensionless parameter influencing
, as the
is already included in Eurotop Equation (2), thus mitigating the influence on
(
Figure 8).
The results indicate that the combination of
and
(
Figure 8c) shows the most definitive dot color trend for fitting
into the empirical model. Additionally, wave steepness demonstrates a clear influence on
, with an increase in wave steepness leading to a decrease in
. Analysis of other dimensionless parameters revealed less definitive dot color trends influencing
.
The dimensionless storm wall height, , also has an influence on , but its effect is not as significant as that of the , due to the implicit inclusion of the hw parameter in Eurotop Equation (2) through Rc (Rc = Ac + hw)
To account for the hydrodynamic behavior of storm walls, we aim to develop an equation for
as part of the Eurotop equation for plain vertical walls (referenced in
Section 2.4). This
formulation incorporates dimensionless parameters that proved the most influential for prediction in non-dimensional overtopping assessment (
Figure 8), namely the condition for impulsive waves,
, and the promenade width normalized with the mean wavelength
. The structure of Equation (8) mirrors that of the existing literature ([
4,
38,
39] and the Eurotop manual [
14], section 5.4.7, for smooth dikes), where individual reduction factors are multiplied by coefficients and an intercept is added:
where
(used in [
4,
38] to consider influence of promenade width to overtopping) and
(used in [
14] to determine the impulsiveness of the wave condition), thus giving
After conducting the fitting procedure for the coefficients a and b in Equation (8), the following parameter coefficient values have been determined:
Parameter a is estimated at −0.7 (95% CI: −0.763, −0.635), and parameter b at 0.75 (95% CI: 0.744, 0.769). The accuracy of Equation (10) is shown visually in
Figure 9. The applicable range of Equation (10) is depicted in
Figure 6, which shows the ranges of the dimensionless parameters considered herein.
The empirical model using Eurotop empirical Equation (3) with the gamma value calculated using Equation (10) against the overtopping calculated using SWASH demonstrates excellent predictive performance. The empirical equation demonstrates a strong correlation (r = 0.94), low root mean squared error (RMSE = 0.0032), and mean absolute error (MAE = 0.0025), resulting in a high R2 value of 0.87, which signifies that the model explains approximately 87% of the variance in the data.
4. Discussion
This paper details the effects of adding storm walls to existing plain vertical walls located on steep foreshores with gradients ranging from 1:7 to 1:10 and demonstrates how this modification significantly reduces the rate of wave overtopping and lessens the potential for flooding. In this scenario, as described in
Section 2.4, the foreshore itself can be considered as part of the structure according to Eurotop guidelines when using empirical equations. Because the foreshore in this study was quite steep and short, the waves did not have an extended area over which to deform and break, unlike what would have occurred on a less steep foreshore; thus, the foreshore’s influence on wave–structure interactions—a significant factor—could not be observed.
The results of the overtopping analysis strongly corroborate the broader findings presented in [
4], indicating that a seaward storm wall situated at the seaward edge of a promenade (flush position of the storm wall) is demonstrably less effective at mitigating overtopping than a landward storm wall. In contrast to the study conducted by [
4], which only investigated two positions of the storm wall, our comprehensive research examined numerous positions, ultimately yielding the same general conclusion: a storm wall positioned further from the plain vertical edge demonstrates a more significant reduction in overtopping compared to a flush storm wall. On the other hand, [
18] found that overtopping can increase at a certain distance of the storm wall from the vertical wall edge. They found that overtopping reaches a maximum at
. We were not able to observe this phenomenon because this ratio was not in the within the parameter range of this study (minimum
is 4.2).
Interestingly, in [
4], the non-dimensionless parameter
stayed a dominant factor used to describe the influence of low-crested storm walls with a parapet. In this study,
did not have a dominant role in the formulation of
, but the influence of
was still strong.
It should be noted that was already used to calculate in previous formulations for a smooth dike (Eurotop manual section 5.4). The role of the in evaluating the reduction parameter was significant in this study, indicating that as the promenade width increased, the overtopping should decrease, similar to the explanation provided in section 5.4 of the Eurotop manual for reducing overtopping on a smooth dike with a storm wall.
Results in [
4] indicated that the type of wave–structure interaction (the impulsive/non-impulsive conditions) has a significant influence on the performance of different superstructures and this was also confirmed in this study.
It should be noted that Equation (10) does not capture possible non-linear terms in the interaction between the two non-dimensional parameters (
and
). However, from
Figure 8c, the interaction terms should not be substantive, and are omitted from Equation (10) to reduce complexity to an order similar to other Eurotop reduction factors. In this way, we have maintained linear behavior for the reduction factor following the already established reduction factor in Eurotop section 5.4.7 for smooth dikes.
The typical working range of in this study is between 0.4 and 0.75, and it is recommended to use this working range, while the extension of the input parameter range and could be completed in future studies.
5. Conclusions
This paper analyzes the effects that storm walls placed atop vertical walls on steep foreshores have, emphasizing their potential for significantly decreasing the rates of overtopping and consequently lessening the risks of flooding. The reliability of our findings is further supported by numerical modeling using the verified and validated SWASH model (V&V method description is given in
Section 2.2 and V&V results are given in
Section 3.1 and
Section 3.2). This adaptation approach highlights the crucial role of civil engineering strategies in mitigating the effects of climate change, especially in vulnerable areas such as the Mediterranean Sea region, which is increasingly threatened by rising sea levels.
An extensive parameter study was completed to assess the impact of several non-dimensional parameters, such as
,
,
,
,
,
s, and
m, for predicting overtopping trends. Although several variables revealed stable and predictable patterns during the study, further investigation is needed to fully understand the influence of other variables, specifically foreshore slope and storm wall height, requiring analysis across a wider array of conditions for improved comprehension. Specifically, storm wall height was explored in this paper in a narrow range (0.1–0.3 m) as found in practice in the Mediterranean atop vertical walls. While the reduction factors put forward in this research are particular to the specific geometries and conditions tested, they provide important insights that are valuable for integrating crest modifications into existing vertical wall designs, through the use of the Eurotop framework. From the tested non-dimensional parameters,
and
proved to have the most predictive power when constructing an equation for calculating the reduction factor
. Generally speaking, a longer relative promenade,
, correlates with reduced overtopping, as do more impulsive wave conditions,
, in front of the vertical wall. While the developed equation for the reduction factor,
, is primarily suitable for the non-dimensional parameter ranges illustrated in
Figure 6, rigorous testing has confirmed its reliability within the typical parameter ranges encountered in the Mediterranean Sea.
Future studies should aim to thoroughly numerically test the application of other superstructure adaptation strategies such as stilling wave basins and the inclusion of parapets on the storm walls. Given the potential benefits, the assessment of the reduction factor, , should be extended to encompass other superstructure adaptation strategies aimed at mitigating the hazards of climate change, thereby improving the overall effectiveness of mitigation efforts. Also, including the commonly used correction for wave obliqueness would be another way to improve the reduction factor parametrization. On the other hand, using machine learning design tools would allow for more accurate storm wall influence predictions compared to empirical expressions.
By integrating empirical findings with practical considerations, this study offers valuable guidance for urban coastal design. It emphasizes the need for balancing overtopping mitigation with the aesthetic and functional requirements of pedestrian-friendly storm walls and promenades. As climate change accelerates, ongoing innovation in storm wall design will remain essential for safeguarding coastal communities, ensuring resilience against extreme weather events, and protecting vital infrastructure.


