Article

Wave–Current Interactions in the Agulhas Retroflection: The Beluga Reefer Accident

by
Victor Edem Setordjie
1,2,*,
Aifeng Tao
1,2,*,
Shuhan Lin
1,2 and
Jinhai Zheng
1,2
1
Key Laboratory of Ministry of Education for Coastal Disaster and Protection, Hohai University, Nanjing 210024, China
2
College of Harbour, Coastal and Offshore Engineering, Hohai University, Nanjing 210024, China
*
Authors to whom correspondence should be addressed.
J. Mar. Sci. Eng. 2025, 13(7), 1275; https://doi.org/10.3390/jmse13071275
Submission received: 18 April 2025 / Revised: 21 June 2025 / Accepted: 21 June 2025 / Published: 30 June 2025
(This article belongs to the Section Physical Oceanography)

Abstract

The Beluga Reefer accident underscores the hidden risks associated with complex wave–current interactions along South Africa’s coastline, particularly in the Agulhas Current retroflection zone. This study utilized ERA5 reanalysis and CMEMS surface current data to analyze the sea state conditions at the time of the accident. While the wind speeds were moderate (5.42 m/s) and windsea heights were relatively low (0.99 m), the significant wave height (Hs) peaked at 3.24 m, with a strong opposing NE Agulhas Current (1.27 m/s) inducing wave steepening and group compression, creating transient hazardous conditions despite a low overall wave steepness (0.0209). Just before the accident, the directional disparity (Δθ) between the swell and windsea systems collapsed sharply from 167.45° to 8.98°, providing a false sense of stability. The synergy of these conditions at the accident site triggered the event, demonstrating that visually aligned wave conditions can mask dangerous underlying interactions. These findings highlight the critical need for integrated wave–current diagnostics in maritime forecasting to better predict complex hazards and enhance vessel safety.

1. Introduction

Maritime transportation remains a cornerstone of global trade, with over 80% of the world’s goods transported by sea [1]. This industry has, however, been plagued by ship accidents, affecting not only the integrity of vessels but also the safety of the passengers, crew, and marine environment. Even with advancements in technology and safety procedures, accidents like capsizing, collisions, and groundings still happen frequently and have disastrous results [2]. There are also less visible but equally important incidents, such as crew deaths, cargo shifts, and mechanical failures. The interaction between human variables and environmental conditions at sea, in some cases, significantly increases the risks seafarers are exposed to [3].
Advanced navigational instruments, such as radar systems, GPS, and weather prediction software, are installed on modern ships to foresee and react to unfavorable circumstances. However, incidents attributable to technical failures or human oversight continue to occur despite these advancements [4]. While the advent of autonomous vessels offers the potential to mitigate human error, significant challenges remain in establishing complete trust in automated systems during unforeseen environmental scenarios, as illustrated in our case study. While the SOLAS (Safety of Life at Sea) Convention, for instance, requires crew training and safety standards, the dependence on sensor-based systems and reduced human oversight heightens safety risks [5]. Empirical investigations accentuate the heightened risks associated with marine operations in adverse sea conditions, particularly in regions characterized by rapidly fluctuating weather patterns.
Globally, the expansion of the merchant fleet by over 50% in the past 15 years has been accompanied by a significant increase in ship accidents, especially in congested port areas such as those in the Mediterranean, where collision risk, vessel age, and severe weather contribute significantly to accident frequency [6]. These findings underscore the global relevance of studying sea state and navigation hazards, not just in hotspot regions like the Mediterranean, but also along coastlines such as South Africa’s. Numerous studies have highlighted that the coastal regions of South Africa are at substantial risk from rogue waves. The intricate nature of sea surface dynamics amidst fluctuating meteorological conditions presents considerable challenges for maritime safety, especially in areas susceptible to abrupt climatic transitions [7]. The 3000 km coastline of South Africa is known for its numerous ship accidents caused by extreme wave events [8], largely due to its exposure to the long, continuous, perennial severe wave climate from the Southern Ocean [9], and the influence from the Agulhas current retroflection [10]. Strategically located at the confluence of three oceans, South Africa plays a pivotal role in the global maritime network [11]. Although literature concerning South Africa’s wave climatology is relatively sparse, its coastal waters are predominantly swell-dominated [12]. The coastline is typically divided into regions: West Coast, South Coast, Port Elizabeth/Port Alfred, Transkei, and KwaZulu-Natal, each with unique oceanographic characteristics [13]. Wave patterns also vary significantly along the coastline, with most systems approaching from the southwest [8]. Although wave events and rogue waves significantly contribute to maritime accidents, other environmental variables equally exert a crucial influence. Sudden storm surges and wave–current interactions can cause rapid changes in water levels, creating hazardous conditions for ships. An abrupt change in wind speed, direction, and wind shear can also cause instability. Significant differences in the directions of different wave trains (cross-seas) can have a strong impact on the navigation of ships. The combination of these environmental stressors and wave dynamics often creates perfect conditions for maritime accidents. The interaction of wind, sea, and swell waves, current, distinguished by their respective generation mechanisms, engenders a highly variable wave spectrum, typically characterized by dual peaks that signify local wind-generated waves and remote swells. Statistical metrics, including significant wave height (Hs), wave period (Tm), and wave direction (θ), are routinely used to describe sea states, with Hs acting as a very useful indicator of operational risk [14]. However, as Toffoli, et al. [15] demonstrated, even sea states with relatively low Hs but high wave steepness can lead to catastrophic outcomes, underscoring the limitations of relying solely on Hs for risk assessment. These conclusions are supported by the Beluga Reefer event, in which a sudden arrival of extreme wave conditions during a known storm corridor led to disastrous crew exposure, following trends seen in earlier accidents like the Johann Schulte (2000) [16] and Arafura (2021) mishaps [17]. The Beluga Reefer accident involved crew fatalities from shipping water, a phenomenon where waves overtop the freeboard, flooding decks with violent water flows. This occurs when wave height exceeds the deck height, often amplified by vessel motions and steep waves [18]. In this case, opposing currents likely intensified wave steepness, promoting plunging breakers that overwhelmed the forward deck during mooring operations. It has been discovered that poor communication and the pilot’s insensitivity to pre-accident situational awareness were the primary causes of accidents involving bulk carriers [19]. This is reflected in the human conditions surrounding our case study.
The continued occurrence of such incidents highlights the persistent risks in maritime operations, particularly under extreme weather conditions. Any ship accident that results in a loss of life, destruction of the ship, or significant environmental harm is considered a ‘very serious maritime casualty’ by the International Maritime Organization (IMO) [20]. Similar to the Beluga Reefer disaster, incidents like Arafura [17], Johann Schulte [16], and Castillo De Valverde [21] highlight the persistent risks of crew fatalities during heavy weather, often due to procedural failures in managing hazardous operations. These events underscore the need for real-time meteorological strategies and adaptive risk frameworks to address the interplay between environmental stressors and human decision-making under duress [21]. Despite significant progress in predictive meteorological modeling, operational procedures frequently exhibit a deficiency in converting forecasts into implementable safety measures. As noted by Ma, et al. [22], frameworks addressing human factors, such as HFACS, unveil enduring deficiencies in crew decision-making amid rapidly changing maritime conditions. The Beluga Reefer incident serves as a pertinent illustration of this disconnection. While adverse weather forecasts were available, the decision of the crew to secure mooring lines during active storm conditions reflects a critical misalignment between risk perception and procedural safeguards, a recurring theme in maritime accident investigations [23].
While existing studies on ship accidents provide valuable insights, there remains a gap in research focused on case-specific and location-specific analyses [24]. This study looks at a ship disaster that claimed the lives of two crew members, with two others sustaining injuries, along the coast of South Africa. The Beluga Reefer disaster underscores a repeating maritime safety issue where adverse sea conditions interact with human error and procedural failures. Although the ship itself was unharmed structurally, the incident revealed systemic weaknesses at the intersection of human operational decision-making shortcomings, specifically in risk mitigation frameworks and emergency response protocols, and dynamic environmental stressors (such as extreme weather and navigational hazards) [25]. We present an analysis of the sea state parameters during the Beluga Reefer accident, focusing on the role of environmental factors, specifically wave and meteorological dynamics, during the event. To assess how environmental conditions contributed to the accident, this study examined not only significant wave height, wave period, and wave direction, but also the role of ocean currents. Wave–current interactions are known to significantly modulate wave propagation by increasing wave steepness and altering wave direction, especially in areas of strong current gradients or retroflection zones [26]. The Agulhas Current system, which flows through the study region, can exhibit speeds exceeding 1 m/s, and when opposing dominant wave directions, can enhance the likelihood of hazardous sea states due to wave steepening [10]. Our goal is to show how operational choices and environmental dynamics interact in maritime accidents by examining high-resolution wave spectrum data and sea characteristics during the accident. The Beluga Reefer case provides a critical lens to explore these dynamics, particularly the role of sea state parameters (e.g., crossing seas, wave steepness, and wave spectrum) in escalating human exposure risks. The influence of extreme weather conditions and dynamic sea states during the Beluga Reefer disaster highlights the critical importance of accurate wave forecasting and real-time sea state assessment in mitigating risks, particularly in high-risk areas like the South African coastline.

2. Data and Methods

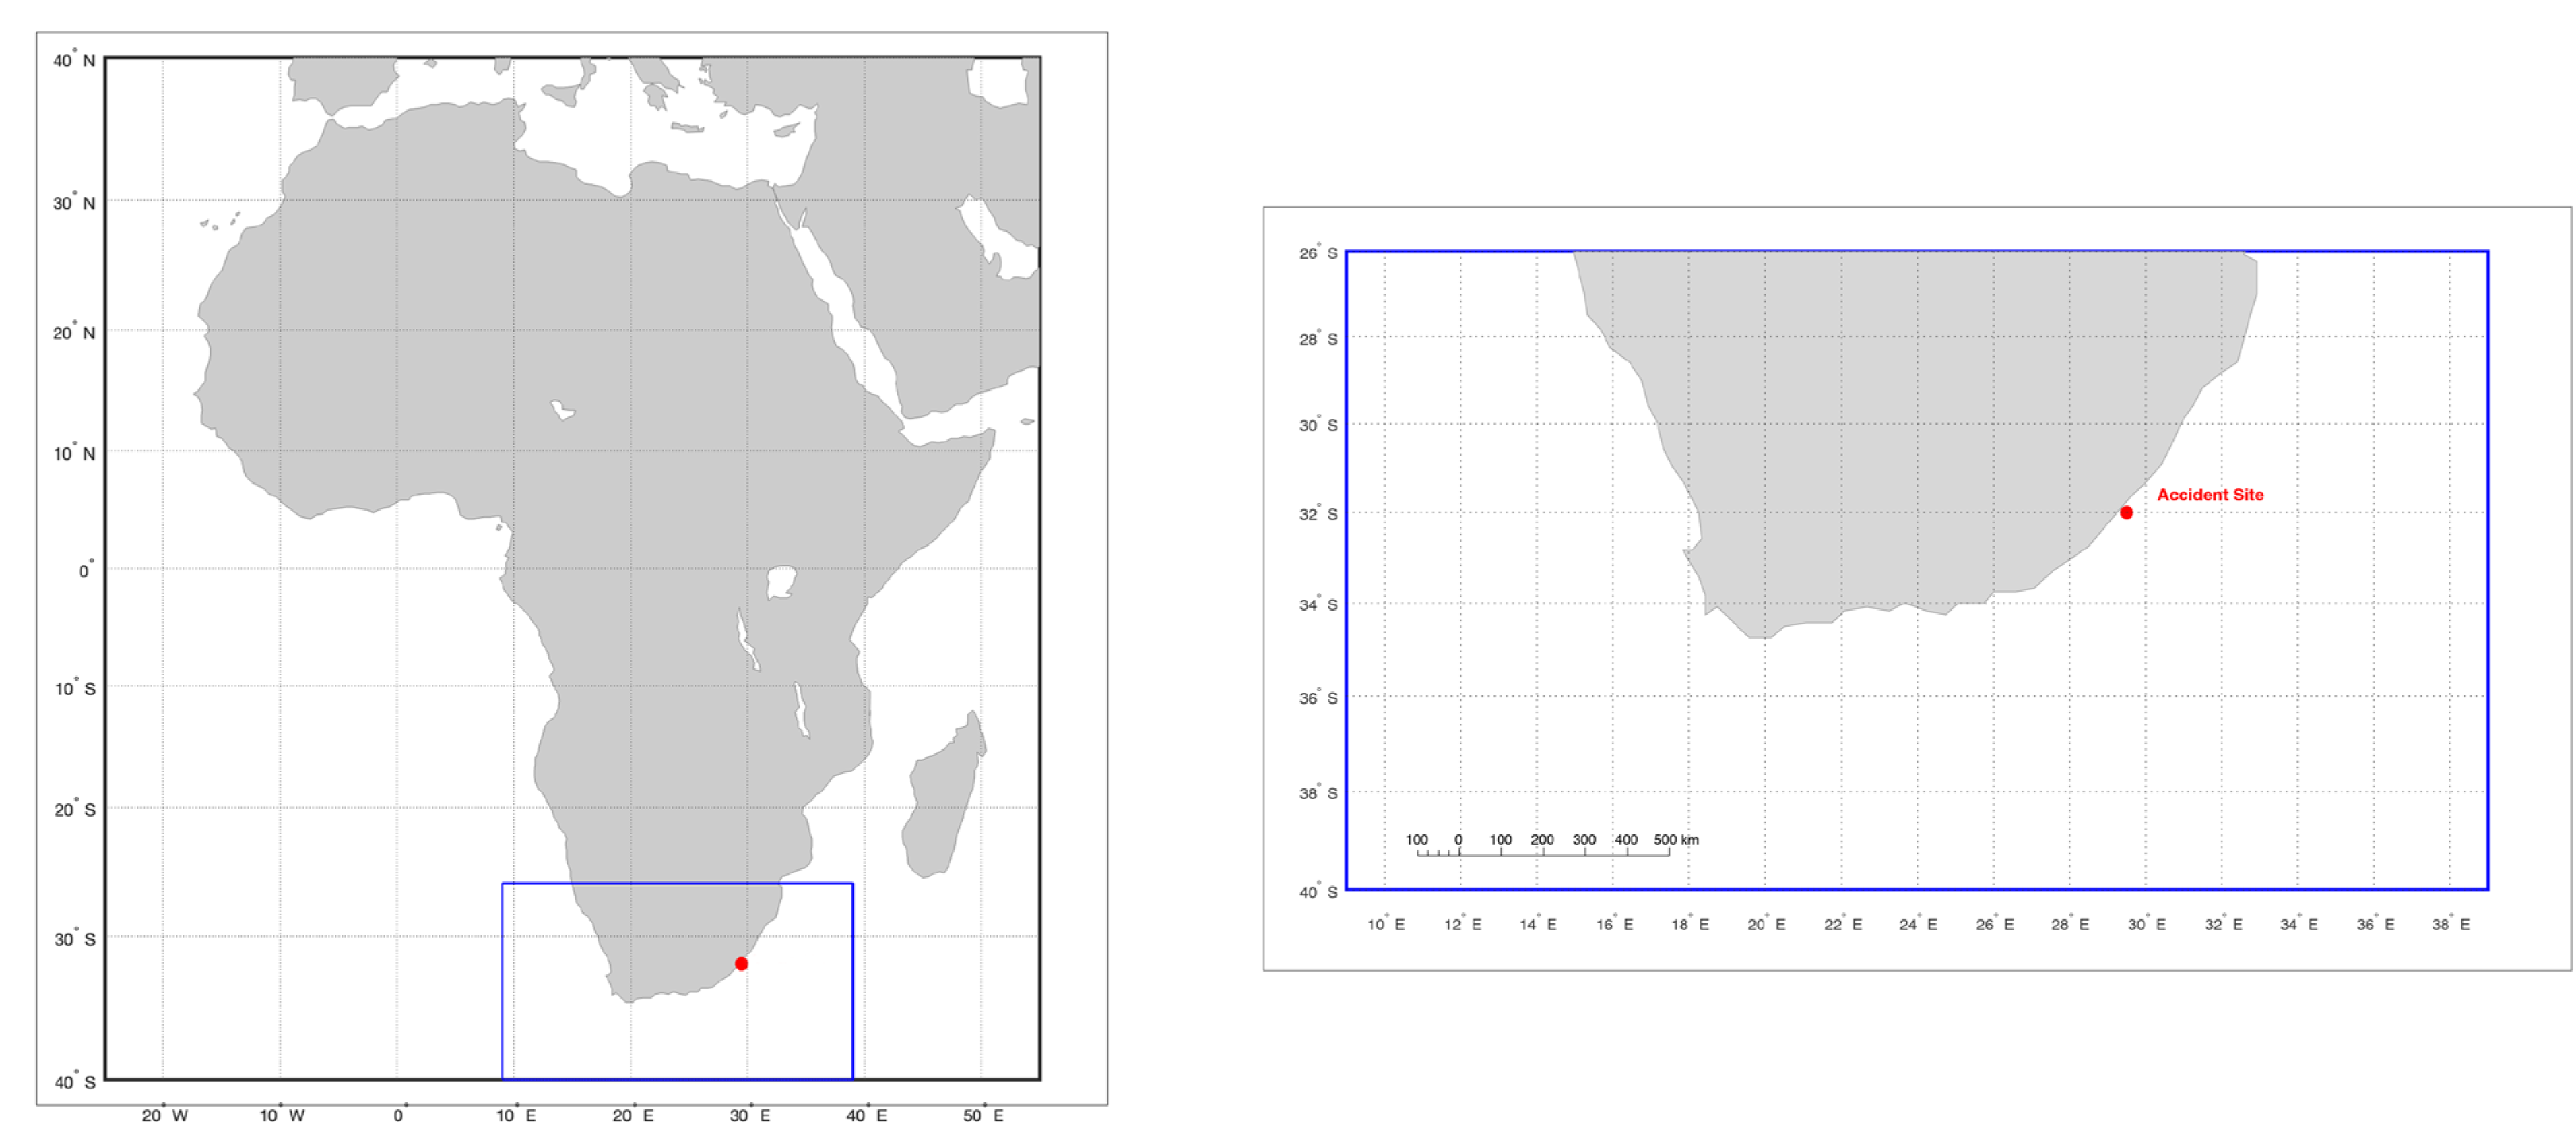
2.1. The Beluga Reefer Accident

Two mariners tragically died on the afternoon of 30 June 2023, when a refrigerated 149 m cargo vessel, Beluga Reefer, was en route from Durban to Port Elizabeth, South Africa, during a period of adverse weather conditions. The vessel encountered large waves and severe sea states, which resulted in a tragic accident on board. At the time of the incident, four crew members were at the forward mooring station to secure mooring lines. The vessel was struck by a series of large waves, which caused the crew members to be violently thrown off their feet. They were propelled into the ship’s structure and deck machinery by the force of the waves. Among the four crew members, two suffered fatal injuries, one sustained a minor injury, and one had emergency medical assistance ashore. The location of the accident is graphically represented in Figure 1. This accident provides a valuable case study for an ocean engineering analysis of wave conditions, particularly in understanding how extreme wave events contribute to onboard hazards.
This occurrence was selected due to its unequivocal association with wave-generated hazards, its capacity to illuminate deficiencies in operational safety, and its significance in enhancing ocean engineering methodologies. By examining wave data derived from the ERA5 reanalysis dataset and current data from CMEMS, it is possible to reconstruct the wave and current conditions prevailing during the accident and establish correlations with the conduct of the vessel.

2.2. Data Sets

2.2.1. Global Integrated Shipping Information System

The current study relies on maritime data sourced from the International Maritime Organization’s (IMO) Global Integrated Shipping Information System (GISIS). This repository is extensively leveraged for scholarly research concerning maritime safety on a global scale, as it is routinely updated and meticulously maintained by the IMO [27]. For this analysis, the dataset was extracted from the GISIS platform, emphasizing accident documentation, vessel specifications, and operational data relevant to the Beluga Reefer accident. The GISIS data provides essential insights regarding vessel classifications, flags, operational routes, and the outcomes of incidents, thereby enabling trend analysis and the assessment of variables associated with accident risk under diverse operational and environmental conditions [28]. This dataset proves to be especially beneficial in maritime safety research, as it supports the investigation of human, operational, and environmental factors that contribute to maritime accidents [29]. Data about the accident’s timing, meteorological conditions, vessel routes, crew positions, and all other critical reports related to the Beluga Reefer accident are extracted from this source. The International Maritime Organization (IMO) organizes incident data into groups that include marine incidents, marine casualties, and very serious marine casualties, depending on the intensity of the situations. Per the IMO and guidelines, such as the Code of the International Standards and Recommended Practices for a Safety Investigation into a Marine Casualty or Marine Incident (Casualty Investigation Code), a ‘very serious marine casualty‘ is delineated as a marine casualty that results in the total loss of the ship or a fatality or significant environmental damage [30]. The situation picked for scrutiny in this report has been identified by the IMO as a ‘very serious marine casualty’, which caused the unfortunate demise of two people. By amalgamating these data with environmental parameters, such as sea state characteristics, we can offer a more comprehensive understanding of the causative factors associated with accidents.

2.2.2. Wave and Current Data

ERA5 reanalysis data, generated by the European Centre for Medium-Range Weather Forecasts (ECMWF), is used in our study to collect sea state and meteorological conditions during the Beluga Reefer accident. ERA5 provides high-resolution, hourly data on atmospheric and oceanic conditions, including wind direction and speed, swell direction, and significant wave height. The dataset offers a temporal resolution of 1 h and a spatial resolution of approximately 31 km [31]. This dataset is widely recognized for its accuracy and reliability in providing historical meteorological and oceanographic data, especially in regions with limited direct observational data [32]. It is one of the most comprehensive and high-resolution datasets available, providing global hourly data with detailed spatial coverage and vertical information up to 100 m above the surface. This makes it ideal for studying marine weather and sea state dynamics over long periods [33]. To evaluate the influence of surface currents on wave behavior at the accident site, we utilized hourly current velocity fields from the Copernicus Marine Environment Monitoring Service (CMEMS)’s global ocean physics reanalysis product (global_analysisforecast_phy_001_024). This product is generated using the NEMO ocean model at 1/12° horizontal resolution and 50 vertical levels, assimilating satellite altimetry, sea surface temperature, and in situ observations. It provides daily analyses and 10-day forecasts of 3D ocean currents, temperature, salinity, and sea level across the global ocean. The dataset is well-suited for studying surface current–wave interactions due to its high temporal and spatial resolution [34]. This research concentrated on critical parameters such as 2D wave spectrum, significant wave height, wave steepness, and ocean currents, as these variables considerably impact vessel stability and operational safety. The utilization of ERA5 and CMEMS data facilitated an accurate reconstruction of atmospheric conditions and sea states at the time of the event, thus allowing for a thorough analysis of how the weather and marine conditions contributed to the accident.
The extracted data covers the area surrounding the accident site (−32.15°, 29.26°) for the duration from June 29 to July 1, 2023. This time window was chosen to capture the dynamic sea conditions leading up to, during, and following the accident, allowing for a comprehensive assessment of the environmental factors influencing the Beluga Reefer accident. The hourly temporal resolution data enabled the detection of fine-scale variations in wave conditions, facilitating a more precise understanding of the wave dynamics in the immediate vicinity of the accident. Additionally, wave directions were adjusted within a 0–360° scale to account for the circular nature of directional data, ensuring that angular differences were computed with the utmost precision and avoiding potential misinterpretations that might arise from unwrapped angular data. This approach provided a robust foundation for the analysis of the relationship between sea state parameters and the accident’s outcome.

2.3. Methodology—Analysis of Sea States During Ship Accident

To more accurately reflect the conditions at the exact accident location, a triangular linear interpolation technique was applied to the surrounding ERA5 grid points to estimate values at the precise coordinates of the accident site (−32.15°, 29.26°). This method is geometrically equivalent to interpolation within a planar surface bounded by three known vertices and provides a stable, physically meaningful estimate of conditions at the target location. Full bilinear interpolation could not be applied due to the absence of oceanic data at one of the ERA5 data points (Q12). This is because the accident location is quite close to the coast and is bound by only 3 oceanic data points. This localized approach helps capture finer spatial gradients in wave parameters, especially given the 28.1 km distance between the closest ERA5 node and the ship’s GPS-recorded position. The grid points used for the interpolation are Q11 (−32.50°S, 29.00°E), Q22 (−32.00°S, 29.50°E), Q12 (−32.00°S, 29.00°E) and Q21 (−32.50°S, 29.50°E), represented in Table 1. Additionally, interpolated plots (see Figure 2) provide a space-resolved view of wave dynamics from a Lagrangian perspective, mimicking the ship’s experience more faithfully. This approach captures the evolving sea state as experienced directly by the vessel, rather than relying solely on the nearest grid data. The results derived from the interpolation are consistent with previous studies conducted in the same region, reinforcing the validity of the use of ERA5 for this case study [24,35].
Significant wave height, which represents the average height of the highest third of surface ocean waves, (Hs) and mean wave period, the average time it takes for two consecutive wave crests, on the surface of the ocean, to pass through a fixed point, (Tm) are sea state parameters widely used to estimate the sea state conditions [36]. A high Hs and Tm represent a large and energetic sea state, but studies have shown that rough seas were often experienced with relatively low Hs values [15]. This throws light on the insufficiency of just these parameters in determining the state of the sea during extreme events like ship accidents. Coupling these sea state indicators with other important parameters gives a better overview of analyzing the sea state during an accident [36]. Table 2 shows the parameters investigated in this study. The parameters used in this study are analyzed for both swell and windsea, as the oceans surrounding the study area are a mix of swell and windsea waves [37]. Hourly surface current data were retrieved from the CMEMS dataset for the target date of 30 June 2023, at 13:00 UTC, from the Copernicus Marine Environment Monitoring Service (CMEMS). The dataset used is the GLO12 1/12° hourly surface forecast, which includes zonal (u) and meridional (v) components of current velocity. Vector fields and magnitudes were analyzed to compare current direction against dominant wave propagation. The speed and direction of the currents at the accident site were then used to understand how the local currents could potentially influence wave propagation and steepness in the region.
The Beluga Reefer accident occurred during the austral winter season, a period characterized by rougher seas and adverse wave conditions [38]. The accident occurred between 13:51 and 14:15 (UTC +1) on 30 June, corresponding to 13:00 UTC on 30 June. UTC is the time zone used in the ERA5 dataset [39]. The data was cropped to a spatial domain surrounding the accident site to concentrate on relevant conditions at the time of the accident.
To identify cross-sea conditions, we investigated the differences in direction between windsea and swell components of the wave field. Cross-seas are defined by the intersection of two independent wave trains propagating from different directions, frequently resulting in chaotic sea states due to the absence of phase coherence among wave trains [15]. For each time step in the ERA5 dataset, the absolute angular difference (∆θ) between the windsea direction (θ_wind) and the swell wave direction (θ_swell) was computed as follows:
Δ θ =   θ w i n d θ s w e l l
To guarantee that all directional differences were articulated within a circular angular range of 0° to 180°, values surpassing 180° were normalized through their supplementary angles.
Δ θ =                   Δ θ ,   i f   Δ θ   180 ° 360 ° Δ θ ,   i f   Δ θ > 180 °
To identify cross-sea conditions, a threshold of 30° was used to define the minimum angular difference between wind sea and swell directions. This value, which aligns with both past research and common forecasting practices, marks the point at which the two wave systems are misaligned enough to produce cross-sea effects. Using this threshold, spatiotemporal maps were created at each time step to show where cross-seas occurred across the study area. Locations where the directional difference (Δθ) met or exceeded 30° were marked as having cross-sea conditions. This simple classification made it easier to study how widespread cross-sea events were, how often they occurred, and how long they lasted in different areas over time. We also examined the temporal evolution of the cross-sea to identify periods of high cross-seas.
As part of the sea state characterization, wave steepness was analysed to evaluate the potential contribution of wave geometry to operational risks during the Beluga Reefer accident. Wave steepness, defined as the ratio of significant wave height, Hs, to the deep-water wavelength, L, was computed using the following:
S = H s L = 2 π H s g T p 2
where Tp is the peak wave period, and g is gravitational acceleration. This dimensionless parameter is a recognized indicator of nonlinearity and wave-breaking potential, with values exceeding 0.04 typically associated with hazardous conditions. L, representing the deep-water wavelength.
This formulation enables a direct estimation of steepness using ERA5-derived Hs and Tp values at each grid point and time step. Threshold-based classification was then applied to assess wave steepness regimes. This classification was used with cross-sea diagnostics to identify compound hazardous wave conditions where steep and misaligned wave systems co-occurred. Temporal analysis of wave steepness was subsequently conducted to investigate patterns of wave energy.

3. Results and Discussion

At the accident site, wave conditions immediately preceding and during the accident were dominated by long-period swell. Specifically, at the accident time, the Hs for combined waves was 3.24 m. Combined waves refer to a combination of windseas and swell waves. The Hs for swell and windsea were 3.04 m and 0.99 m, respectively. Mean wave periods (Tm) were 10.51 s for swell, 4.13 s for windsea, and 9.96 s for combined waves. The significantly higher swell wave height and period confirm swell dominance over locally generated windsea. Figure 3 shows the spatial distribution of Hs for combined waves, showing the wave direction (θ) in the accident region.
The temporal evolution right before and after the accident was investigated. There was an Hs peak of 3.24 m at the time of the accident, which is sufficient to necessitate a rough-sea warning according to the warning guidelines set up by the WMO [36]. The Hs at the time of the accident indicates relatively high wave energy compared to earlier conditions (Figure 4). While Hs is a critical indicator of sea state severity, the following analysis explores whether this alone was sufficient to cause the incident or whether additional contributing factors, such as wave steepness, cross-sea development, and wave–current interactions, played a more decisive role.
Between 07:00 and 13:00 (the time of the accident), the total Hs at the accident site rose markedly from about 2.0 m to a peak of 3.24 m. This increase was primarily driven by the swell component, while the windsea Hs showed an opposite trend, decreasing from about 1.5 m to 0.99 m at the time of the accident, and further dropping to around 0.1 m afterward. Larger swell waves (3.04 m) exert greater hydrodynamic forces on vessels, raising the risk of synchronous rolling or parametric rolling in following seas, especially if wave periods resonate with the ship’s natural roll period. While the increase in the swell Hs from just below 2 m to 3 m may appear modest, it occurred over a relatively short time span (between 07:00 and 13:00) and coincided with a sharp decline in windsea activity. This shift marked a transition toward a more swell-dominated sea state, characterized by longer-period (10.51 s), lower-steepness waves that are often visually deceptive but carry considerable energy. A similar trend is observed for the Tm, where that of the swell has an upward trend and that of the windsea has a downward trend. This explains the Tm value of 10.51 s for swell and 4.13 s for windsea, as is common for deep-water waves that have moved from far-off storms.
Wave steepness plays a critical role in determining the stability and response of ships at sea, particularly by influencing the likelihood of wave breaking, vessel slamming, and water shipping over the bow [40]. Previous investigations have shown that a significant proportion of maritime accidents (60% of examined cases) occurred under sea state conditions with wave steepness values between 0.0300 and 0.0450 [15]. In the case of the Beluga Reefer, the interpolated wave steepness at the time of the accident was 0.0209 (Figure 5), below the commonly cited hazardous threshold of 0.04. While this suggests moderate conditions by scalar standards, it may obscure the impact of wave–current interactions. Specifically, when waves are opposed by a current, as was the case with the Agulhas Current (flowing at 1.27 m/s, nearly opposite to the wave direction), the wave steepness increases due to processes like wave compression, refraction, and Doppler shifting. These continuous processes can gradually steepen waves, even when bulk steepness values remain low. Such modulation of the wave field can lead to the formation of steep, short-crested waves, increasing the likelihood of vessel instability, especially when waves are aligned at high angles relative to the ship. The relatively low average steepness (0.0209) does not rule out the dynamic processes of wave–current interactions, which are capable of producing hazardous conditions that contributed to the accident.

3.1. Crossing Seas

Crossing sea states has been shown to create hazardous sea conditions and cause large waves [41]. In a global study examining ship accidents related to rough seas, Zhang and Li [42] identified that 45% of the 755 recorded incidents occurred in crossing seas where the angle ( Δ θ ) exceeded 30°. Based on this, we use 30° as the threshold for assessing the crossing seas. Figure 6 shows a rose diagram of the swell and windsea directions in the study region at the accident time. The swell waves show a strong directionality, with most of the swell waves approaching from the south-west, from the Southern Ocean. This corroborates what was discovered in the previous literature [43]. Wave direction (swell-dominant) was ≈204°at the accident time, opposed by the Agulhas Current. Global forecasting models like ECMWF’s Integrated Forecasting System (IFS) often exclude or insufficiently resolve surface current effects, leading to potential underestimation of wave severity in current-dominated regions [44]. At the time of the accident, the cross-seas (Δθ) were below the threshold (8.98°). A temporal analysis of Δθ is shown in Figure 7, giving us a more detailed view of the cross-sea condition before, during, and after the accident. Hours before the accident, cross-sea conditions dominated the region, gradually collapsing into a near-aligned wave system (Δθ = 8.98°). We retain Δθ (swell–windsea angular difference) only as a diagnostic of the brief directional collapse immediately before the accident (Δθ dropped from ≈170° to ≈9° between 10:00 and 13:00 UTC). This sudden alignment visually disguised the persistent spectral bimodality but, because windsea energy was negligible, did not itself modify the load on the vessel. Calmer sea conditions have been known to be those with the largest danger of an accident [45]. This is confirmed by another sharp increase in the cross-seas hours after the accident.

3.2. Wave–Current Interactions

Wave–current interactions are known to significantly influence wave steepness and overall sea hazard levels, especially in dynamically active regions like the Agulhas Current zone [46]. The spatial distribution of CMEMS hourly surface current data at the accident time and location is shown in Figure 8a. At the exact time and location of the accident, the current speed was 1.27 m/s (Figure 8c), and the current direction was southwestward (41.7°). The current was opposing the wind and wave direction (214° and 204°, respectively), as shown in Figure 8b. While the Agulhas Current was relatively consistent during the day of the accident, our earlier analysis shows that the wave field evolved significantly. In particular, the arrival and intensification of a long-period swell from the SW leading up to the accident, combined with the opposing current, created conditions for maximum steepness amplification and directional compression at the accident time. This convergence of energetic wave input and persistent current flow constitutes a high-risk window for extreme wave behavior, even if the current itself did not change substantially, as wave–current opposition amplifies spectral energy transfer [10], particularly in Agulhas retroflection zones. Peak current coincided with maximal swell energy arrival, creating optimal steepening conditions during deck operations.
Winds were moderate (5.42 m/s from 214°) and seasonally typical (Figure 9), but insufficient to generate consequential windsea at the accident site; consequently, the primary hazard mechanism is identified as swell–current interactions rather than local wind forcing.

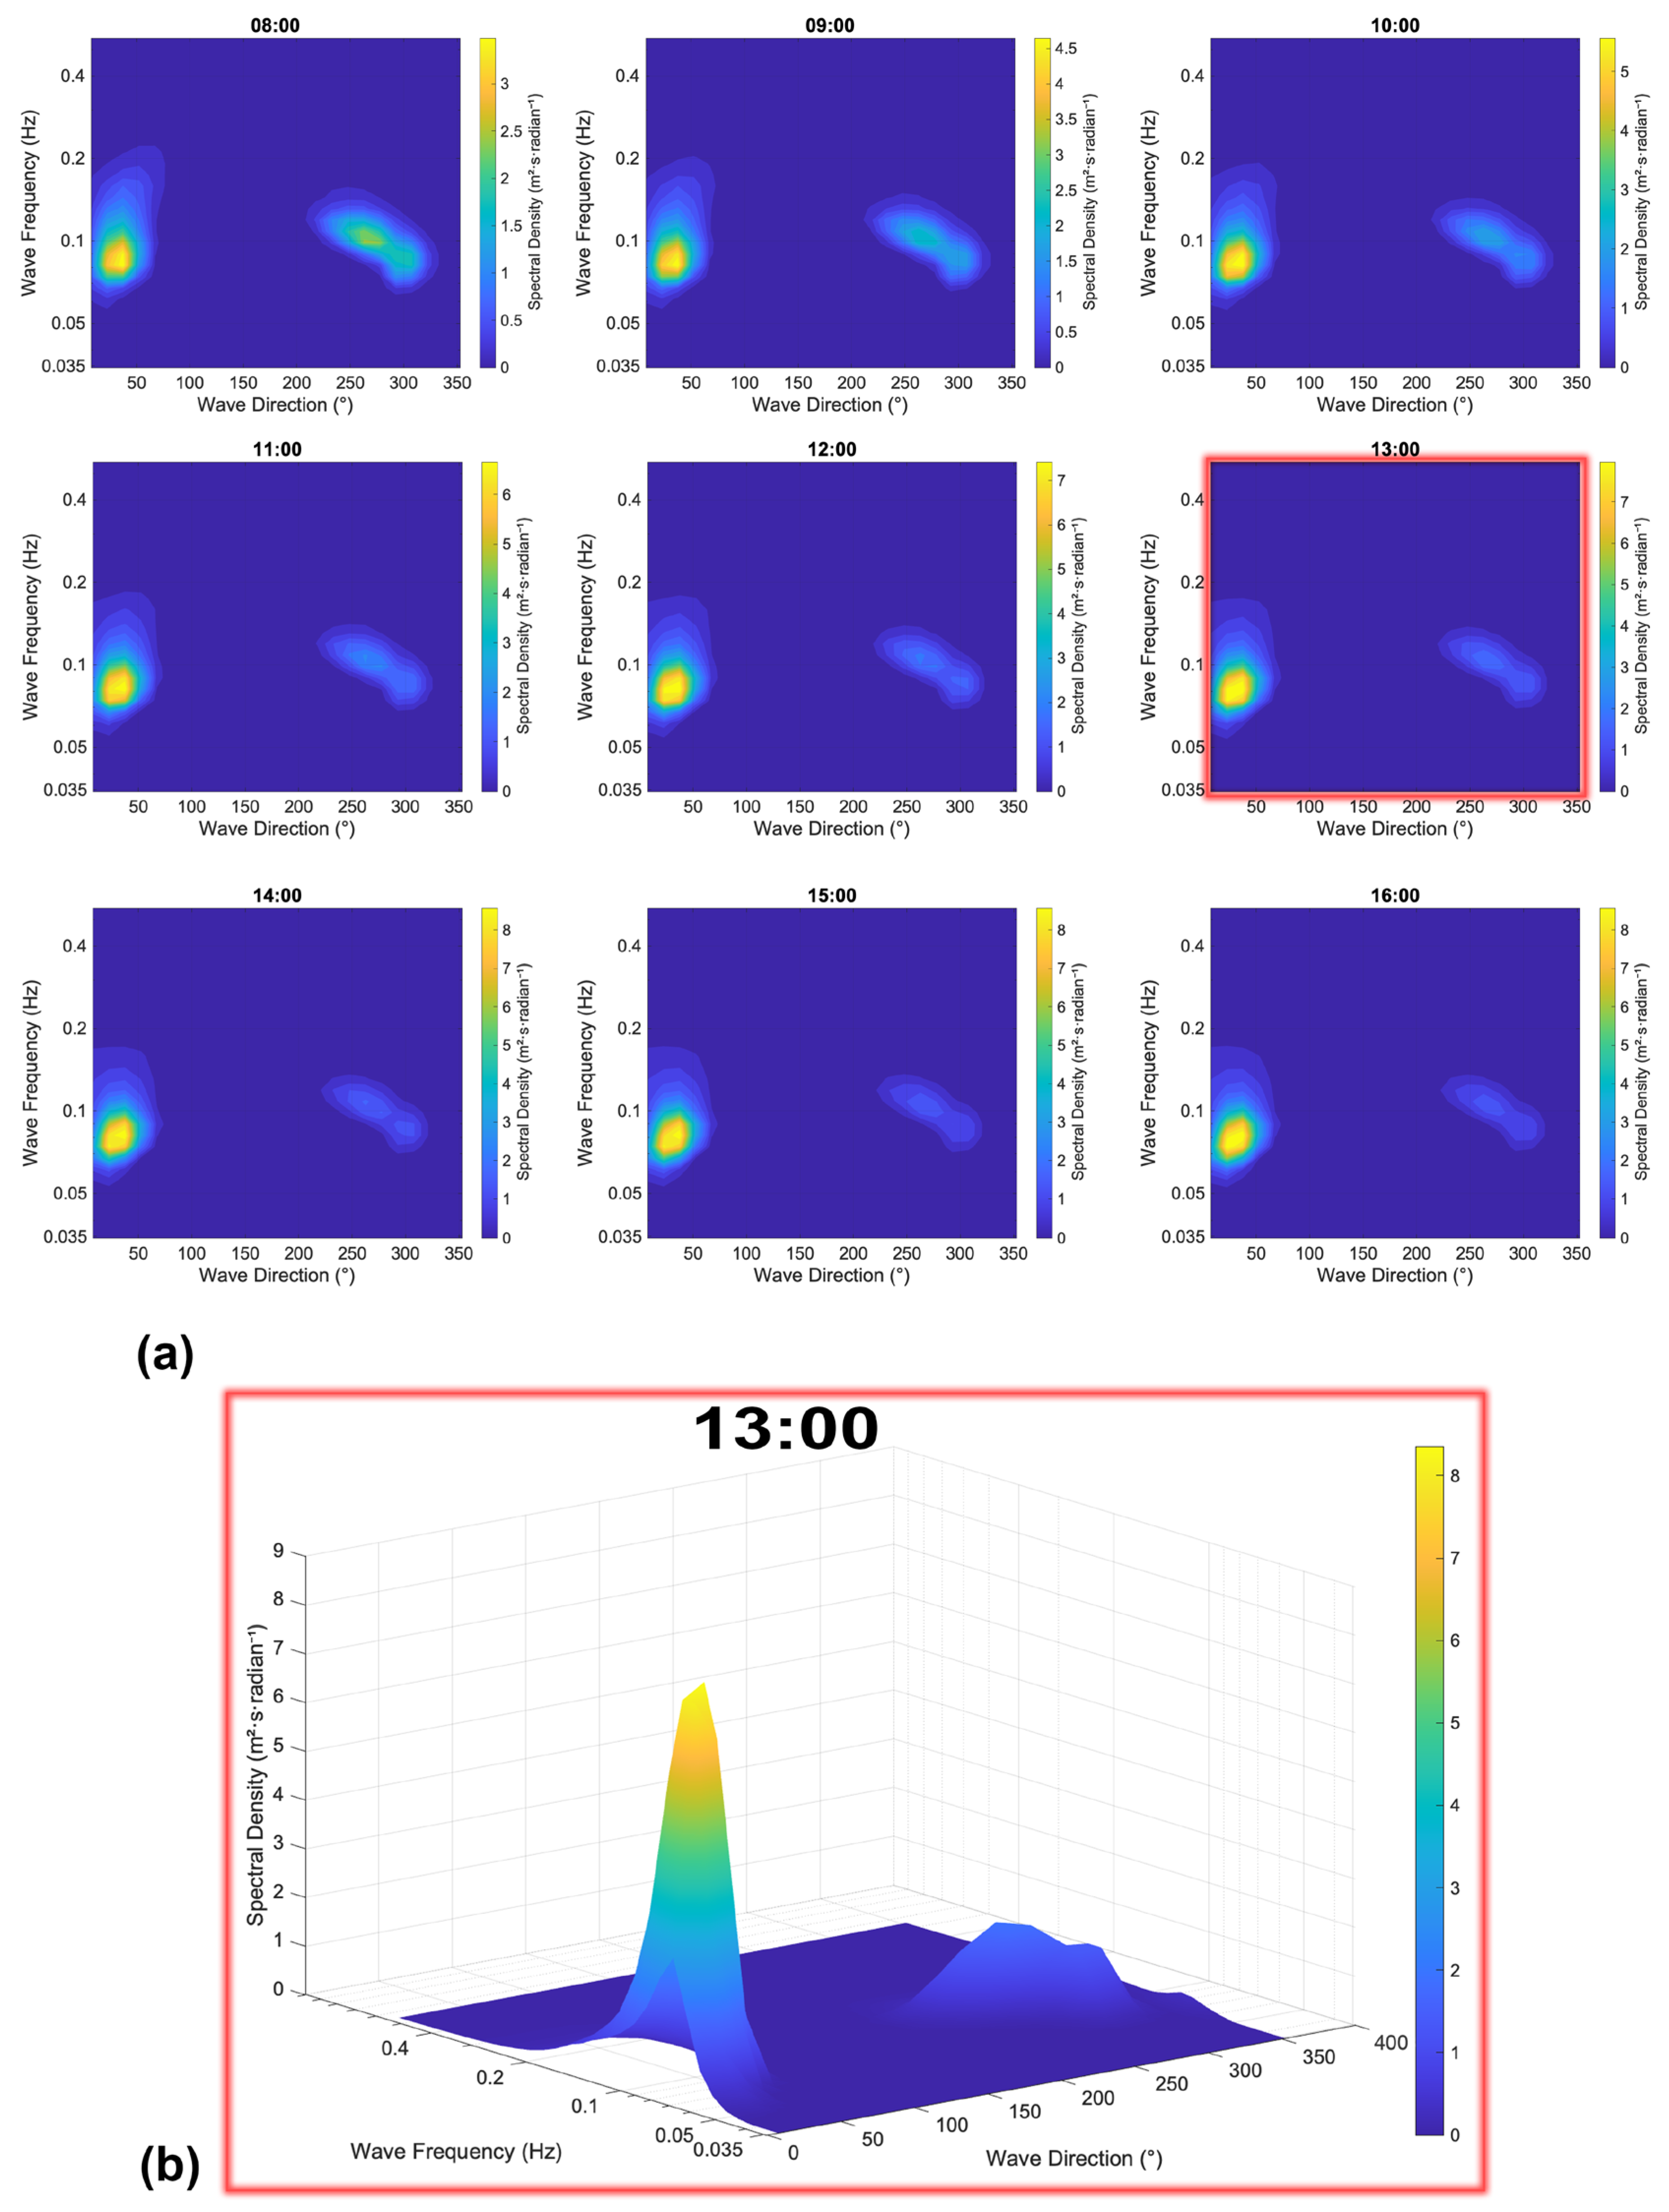
3.3. Two-Dimensional Wave Spectrum

The rapid reduction in directional disparity (from 167.45° to 8.98°) before the accident marked a collapse of cross-sea conditions into a seemingly aligned wave field. However, as seen in the Louis Majesty case [45], such transitions can obscure underlying wave complexity. In our case study, the directional wave spectrum was dominated by a single significant spectral peak propagating from the southwest at ∼0.08 Hz (12.5 s period) with high energy density (∼8 m2·s·radian−1). Given the direction, frequency, and energy level, this system is characteristic of Southern Ocean swell generated by extratropical cyclones, which often propagate northward from high-latitude storm tracks into the subtropics, as is reflected in the scalar wave direction shown earlier. There was a secondary spectral component, which exhibited substantially lower energy density (∼1.8 m2·s·radian−1) and did not contribute significantly to wave hazards (Figure 10). Critically, the dominant swell propagated directly against the south-westward Agulhas Current (1.27 m/s), an opposition known to shorten wavelength, increase frequency, and steepen wave faces through Doppler compression. This wave–current opposition is a well-documented mechanism for wave amplification in the Agulhas retroflection zone. This interaction shortened wavelengths and increased steepness, creating conditions conducive to breaking waves and producing green water on deck at the observed significant wave height (3.24 m). The accident resulted from current-modulated swell amplification rather than wave system interactions. Vessel operations during peak steepness conditions, which likely led to unstable sea states, are known to exacerbate roll resonance and broaching in beam-on encounters.

3.4. Mechanistic Interpretation of the Accident

At about 13:00 UTC, the Beluga Reefer was exposed to a short-lived but hazardous synergy of oceanographic processes. First, a persistent long-period swell from the south-west that peaked (≈204°, Tm ≈ 12 s, Hs ≈ 3 m) at the accident time from the Southern Ocean. Secondly, the directional disparity (Δθ) between the swell and windsea collapsed from 167° to 9°, just before the accident, giving the visual impression of a calmer, mono-directional sea yet sharpening wave-group coherence and causing greater energy concentration. Concurrently, there was the presence of the Agulhas Current retroflection, with a local strong opposing flow of ≈1.3 m s−1. Unlike previous hours, this specific alignment enabled wave–current energy focusing at the accident site. Such swell–current opposition induces Doppler shortening, steepening, and localized energy compression, increasing the chances for modulational (rogue-wave) instability. This convergence of energetic SW swell, momentary directional collapse that enabled constructive interference, and peak swell–current amplification produced a transient train of steep, short-crested waves capable of shipping green water and inducing violent ship motions even though the bulk steepness (0.0209) remained below classical breaking criteria. The crew’s presence on the forward mooring deck during this window further heightened vulnerability. We therefore attribute the accident to this narrowly timed compound hazard rather than to steadily acting windsea or background atmospheric conditions.

4. Conclusions

This study investigated the sea state conditions surrounding the Beluga Reefer accident off the South African coast using high-resolution ERA5 wave reanalysis and CMEMS surface current data. By integrating conventional wave metrics such as significant wave height (Hs), mean wave period (Tm), steepness, and directional disparity (Δθ) with 2D wave spectral analysis and surface current vectors, we reconstructed a detailed oceanographic scenario at the time of the incident.
While scalar metrics indicated moderate wind speeds (5.42 m/s) and a relatively low average wave steepness (0.0209), the significant wave height peaked at 3.24 m at the time of the accident, exceeding standard thresholds for rough sea warnings. Critically, the Δθ collapse from 167.45° to 8.98° served as a perceptual hazard; its visual uniformity contributed to risk underestimation by the crew of the Beluga Reefer. Although the sea surface appeared to transition into a more aligned state, spectral analysis revealed two energy peaks: a dominant SW long-period swell (∼0.08 Hz at 30°) and a secondary NE component (∼0.10 Hz at 250°). The secondary spectral component remained mechanistically insignificant to the accident.
The dominant SW swell was nearly directly opposed by the NE Agulhas Current, producing conditions favorable for wave steepening, Doppler shifting, and group compression. While the current itself was relatively consistent throughout the day, the arrival and intensification of long-period swell prior to the accident time created a transient window of maximum wave–current interaction. This convergence of wave and current vectors likely amplified wave energy locally and increased wave groupness, two known precursors to rogue wave formation.
Together, these interactions point to a compound hazard mechanism: wave–current interactions acting on a dynamically evolving wave field. This combination, particularly in a high-energy boundary current zone like the Agulhas retroflection, can trigger nonlinear instabilities such as modulational (Benjamin–Feir) instability, resulting in steep, short-crested wave groups that are not readily predicted by scalar forecasts. The presence of the crew members at the forward mooring deck exposed them to this critical window of vessel turbulence, leading to fatalities.
These findings underscore the critical importance of incorporating local surface current data into operational sea state assessments. Relying solely on bulk parameters can obscure emergent wave–current dynamics that significantly elevate maritime risk. We recommend that forecasting systems in regions with strong boundary currents adopt integrated wave–current frameworks to better anticipate compound hazards and inform vessel routing and safety protocols.

Author Contributions

Conceptualization, V.E.S. and A.T.; Methodology, V.E.S.; Formal analysis, V.E.S. and A.T.; Writing—original draft preparation, V.E.S. and A.T.; Writing—review and editing, A.T., S.L., and J.Z.; Visualization, V.E.S.; Supervision, A.T. and J.Z.; Funding acquisition, A.T. All authors have read and agreed to the published version of the manuscript.

Funding

This work is supported by the National Key Research & Development Program of China (No. 2023YFE0126300; No. 2023YFC3007900), National Natural Science Foundation of China (No. 52271271; No. 52101308), Open Fund of Key Laboratory of Ecological Prewarning, Protection and Restoration of Bohai Sea, Ministry of Natural Resources (No. 2024202), Natural Science Foundation of Jiangsu Basic Research Program (No. BK20220082), and Major Science & Technology Projects of the Ministry of Water Resources (No. SKS-2022025).

Data Availability Statement

The original data presented in the study are openly available in ERA5 reanalysis data at https://cds.climate.copernicus.eu/datasets/reanalysis-era5-single-levels?tab=download (accessed on 15 March 2025).

Conflicts of Interest

The authors declare no conflicts of interest.

References

  1. UNCTAD. Review of Maritime Transport 2024; UNCTAD: Geneva, Switzerland, 2024. [Google Scholar]
  2. Cao, Y.; Wang, X.; Wang, Y.; Fan, S.; Wang, H.; Yang, Z.; Liu, Z.; Wang, J.; Shi, R. Analysis of factors affecting the severity of marine accidents using a data-driven Bayesian network. Ocean Eng. 2023, 269, 113563. [Google Scholar] [CrossRef]
  3. Wang, X.; Xia, G.; Zhao, J.; Wang, J.; Yang, Z.; Loughney, S.; Fang, S.; Zhang, S.; Xing, Y.; Liu, Z. A novel method for the risk assessment of human evacuation from cruise ships in maritime transportation. Reliab. Eng. Syst. Saf. 2023, 230, 108887. [Google Scholar] [CrossRef]
  4. Ronca, V.; Uflaz, E.; Turan, O.; Bantan, H.; MacKinnon, S.N.; Lommi, A.; Pozzi, S.; Kurt, R.E.; Arslan, O.; Kurt, Y.B.; et al. Neurophysiological Assessment of An Innovative Maritime Safety System in Terms of Ship Operators’ Mental Workload, Stress, and Attention in the Full Mission Bridge Simulator. Brain Sci. 2023, 13, 1319. [Google Scholar] [CrossRef] [PubMed]
  5. Joseph, A.; Dalaklis, D. The international convention for the safety of life at sea: Highlighting interrelations of measures towards effective risk mitigation. J. Int. Marit. Saf. Environ. Aff. Shipp. 2021, 5, 1–11. [Google Scholar] [CrossRef]
  6. Marino, M.; Cavallaro, L.; Castro, E.; Musumeci, R.E.; Martignoni, M.; Roman, F.; Foti, E. Analysis on a database of ship accidents in port areas. Data Brief 2023, 48, 109127. [Google Scholar] [CrossRef]
  7. Kharif, C.; Pelinovsky, E.; Slunyaev, A. Rogue Waves in the Ocean; Springer Science & Business Media: Berlin, Germany, 2008. [Google Scholar]
  8. Rautenbach, C.; Barnes, M.A.; Wang, D.W.; Dykes, J. Southern African Wave Model Sensitivities and Accuracies. J. Mar. Sci. Eng. 2020, 8, 773. [Google Scholar] [CrossRef]
  9. Casas-Prat, M.; Hemer, M.A.; Dodet, G.; Morim, J.; Wang, X.L.; Mori, N.; Young, I.; Erikson, L.; Kamranzad, B.; Kumar, P.; et al. Wind-wave climate changes and their impacts. Nat. Rev. Earth Environ. 2024, 5, 23–42. [Google Scholar] [CrossRef]
  10. Ponce de León, S.; Guedes Soares, C. Numerical study of the effect of current on waves in the Agulhas Current Retroflection. Ocean Eng. 2022, 264, 112333. [Google Scholar] [CrossRef]
  11. South African Maritime Safety Authority. Annual Report; South African Maritime Safety Authority: Pretoria, South Africa, 2024. [Google Scholar]
  12. Salonen, N.; Rautenbach, C. Toward nearshore, bathymetry induced wave amplification in False Bay, South Africa. AIP Adv. 2021, 11, 075209. [Google Scholar] [CrossRef]
  13. Rouault, M.; Pohl, B.; Penven, P. Coastal oceanic climate change and variability from 1982 to 2009 around South Africa. Afr. J. Mar. Sci. 2010, 32, 237–246. [Google Scholar] [CrossRef]
  14. Soares, C.G.; Antão, P.; Bitner-Gregersen, E. Analysis of the Frequency of Ship Accidents Under Severe North Atlantic Weather. In Proceedings of the Design and Operation For Abnormal Conditions, London, UK, 6–7 November 2001; pp. 221–230. [Google Scholar]
  15. Toffoli, A.; Lefèvre, J.M.; Bitner-Gregersen, E.; Monbaliu, J. Towards the identification of warning criteria: Analysis of a ship accident database. Appl. Ocean Res. 2005, 27, 281–291. [Google Scholar] [CrossRef]
  16. Isle of Man Government Marine Administration. Johann Schulte—Casualty Investigation CA 63; Isle of Man Government Marine Administration: Douglas, Isle of Man, 2000. [Google Scholar]
  17. Federal Bureau for the Investigation of Maritime Accidents. Report on the Investigation into a Fatal Accident on Board Vlcc ARAFURA; Federal Bureau for the Investigation of Maritime Accidents: Brussels, Belgium, 2021. [Google Scholar]
  18. Khojasteh, D.; Tavakoli, S.; Dashtimanesh, A.; Dolatshah, A.; Huang, L.; Glamore, W.; Sadat-Noori, M.; Iglesias, G. Numerical analysis of shipping water impacting a step structure. Ocean Eng. 2020, 209, 107517. [Google Scholar] [CrossRef]
  19. Cao, Y.; Wang, X.; Yang, Z.; Wang, J.; Wang, H.; Liu, Z. Research in marine accidents: A bibliometric analysis, systematic review and future directions. Ocean Eng. 2023, 284, 115048. [Google Scholar] [CrossRef]
  20. Batalden, B.M.; Sydnes, A.K. Maritime safety and the ISM code: A study of investigated casualties and incidents. WMU J. Marit. Aff. 2014, 13, 3–25. [Google Scholar] [CrossRef]
  21. The Bahamas Maritime Authority. Marine Safety Investigation Report into a Man Overboard from Castillo De Valverde on 28 May 2020; The Bahamas Maritime Authority: Nassau, Bahamas, 2021. [Google Scholar]
  22. Ma, L.; Ma, X.; Wang, T.; Chen, L.; Lan, H. On the development and measurement of human factors complex network for maritime accidents: A case of ship groundings. Ocean Coast. Manag. 2024, 248, 106954. [Google Scholar] [CrossRef]
  23. Manuel, M.E. Maritime Risk and Organizational Learning, 4th ed.; CRC Press: London, UK, 2011. [Google Scholar]
  24. Veitch, J.; Rautenbach, C.; Hermes, J.; Reason, C. The Cape Point wave record, extreme events and the role of large-scale modes of climate variability. J. Mar. Syst. 2019, 198, 103185. [Google Scholar] [CrossRef]
  25. Grech, M.; Horberry, T.; Koester, T. Human Factors in the Maritime Domain, 1st ed.; CRC Press: Florida, CA, USA, 2019. [Google Scholar]
  26. Rusu, L.; Bernardino, M.; Guedes Soares, C. Modelling the influence of currents on wave propagation at the entrance of the Tagus estuary. Ocean Eng. 2011, 38, 1174–1183. [Google Scholar] [CrossRef]
  27. Hamann, R.; Sames, P.C. Updated and expanded casualty analysis of container vessels. Ship Technol. Res. 2022, 69, 158–169. [Google Scholar] [CrossRef]
  28. Li, H.; Zhou, K.; Zhang, C.; Bashir, M.; Yang, Z. Dynamic evolution of maritime accidents: Comparative analysis through data-driven Bayesian Networks. Ocean Eng. 2024, 303, 117736. [Google Scholar] [CrossRef]
  29. Antão, P.; Sun, S.; Teixeira, A.P.; Guedes Soares, C. Quantitative assessment of ship collision risk influencing factors from worldwide accident and fleet data. Reliab. Eng. Syst. Saf. 2023, 234, 109166. [Google Scholar] [CrossRef]
  30. International Maritime Organization. Casualty Investigation Code; International Maritime Organization: London, UK, 2008. [Google Scholar]
  31. Omonigbehin, O.; Eresanya, E.O.; Tao, A.; Setordjie, V.E.; Daramola, S.; Adebiyi, A. Long-Term Evolution of Significant Wave Height in the Eastern Tropical Atlantic between 1940 and 2022 Using the ERA5 Dataset. J. Mar. Sci. Eng. 2024, 12, 714. [Google Scholar] [CrossRef]
  32. Sreelakshmi, S.; Bhaskaran, P.K. Wind-generated wave climate variability in the Indian Ocean using ERA-5 dataset. Ocean Eng. 2020, 209, 107486. [Google Scholar] [CrossRef]
  33. Eveloy, V.; Ahmad, S.; Masood, H.; Islam, M.D. Investigation of the resource characteristics, capacity factors and levelized cost of wind and solar power generation in the United Arab Emirates based on ERA-5 reanalysis. Energy Rep. 2025, 13, 2277–2306. [Google Scholar] [CrossRef]
  34. Lellouche, J.M.; Greiner, E.; Le Galloudec, O.; Garric, G.; Regnier, C.; Drevillon, M.; Benkiran, M.; Testut, C.E.; Bourdalle-Badie, R.; Gasparin, F.; et al. Recent updates to the Copernicus Marine Service global ocean monitoring and forecasting real-time 1/12° high-resolution system. Ocean Sci. 2018, 14, 1093–1126. [Google Scholar] [CrossRef]
  35. Wepener, V.; Degger, N. Chapter 5—South Africa. In World Seas: An Environmental Evaluation, 2nd ed.; Sheppard, C., Ed.; Academic Press: Cambridge, MA, USA, 2019; pp. 101–119. [Google Scholar]
  36. World Meteorological Organization. Guide to Wave Analysis and Forecasting; World Meteorological Organization: Geneva, Switzerland, 1998. [Google Scholar]
  37. Camus, P.; Losada, I.; Izaguirre, C.; Espejo, A.; Menéndez, M.; Pérez, J. Statistical wave climate projections for coastal impact assessments. Earth’s Future 2017, 5, 918–933. [Google Scholar] [CrossRef]
  38. Yuan, X.; Patoux, J.; Li, C. Satellite-based midlatitude cyclone statistics over the Southern Ocean: 2. Tracks and surface fluxes. J. Geophys. Res. Atmos. 2009, 114, D04106. [Google Scholar] [CrossRef]
  39. Hersbach, H.; Bell, B.; Berrisford, P.; Hirahara, S.; Horányi, A.; Muñoz-Sabater, J.; Nicolas, J.; Peubey, C.; Radu, R.; Schepers, D.; et al. The ERA5 global reanalysis. Q. J. R. Meteorol. Soc. 2020, 146, 1999–2049. [Google Scholar] [CrossRef]
  40. Costa, S.; Oliveira, T.C.A.; Abdolali, A. Wind-wave steepness offshore the North American east coast. J. Ocean Eng. Sci. 2025; in press. [Google Scholar] [CrossRef]
  41. Onorato, M.; Residori, S.; Bortolozzo, U.; Montina, A.; Arecchi, F.T. Rogue waves and their generating mechanisms in different physical contexts. Phys. Rep. 2013, 528, 47–89. [Google Scholar] [CrossRef]
  42. Zhang, Z.; Li, X.-M. Global ship accidents and ocean swell-related sea states. Nat. Hazards Earth Syst. Sci. 2017, 17, 2041–2051. [Google Scholar] [CrossRef]
  43. Rosa-Santos, P.; Taveira-Pinto, F.; Veloso-Gomes, F. Experimental evaluation of the tension mooring effect on the response of moored ships. Coast. Eng. 2014, 85, 60–71. [Google Scholar] [CrossRef]
  44. Calvino, C.; Dabrowski, T.; Dias, F. Current interaction in large-scale wave models with an application to Ireland. Cont. Shelf Res. 2022, 245, 104798. [Google Scholar] [CrossRef]
  45. Cavaleri, L.; Bertotti, L.; Torrisi, L.; Bitner-Gregersen, E.; Serio, M.; Onorato, M. Rogue waves in crossing seas: The Louis Majesty accident. J. Geophys. Res. Ocean. 2012, 117, C00J10. [Google Scholar] [CrossRef]
  46. Quilfen, Y.; Yurovskaya, M.; Chapron, B.; Ardhuin, F. Storm waves focusing and steepening in the Agulhas current: Satellite observations and modeling. Remote Sens. Environ. 2018, 216, 561–571. [Google Scholar] [CrossRef]
Figure 1. Study area showing the accident location with a red dot.
Jmse 13 01275 g001
Figure 2. Distance between accident site and bounding data points (also showing contour of Tm).
Jmse 13 01275 g002
Figure 3. Spatial distribution of Hs and θ of combined waves.
Jmse 13 01275 g003
Figure 4. Time Series at Lat: −32.15, Lon: 29.26: (a) Wave height of swell (3.04 m); (b) Tm of swell (10.51 s); (c) Wave height of windsea (0.99 m); (d) Tm of windsea (4.13 s); (e) wave height of combined waves (3.24 m); (f) Tm of combined waves (9.96 s).
Jmse 13 01275 g004
Figure 5. Wave steepness at the location and time of the accident: (a) Jan to Dec 2023; (b) 24 h before and after the accident.
Jmse 13 01275 g005
Figure 6. Wave rose diagram at accident time: (a) swell; (b) windsea.
Jmse 13 01275 g006
Figure 7. Time series of angle differences ( Δ θ ) showing time of accident.
Jmse 13 01275 g007
Figure 8. (a) Surface currents at accident location and time (accident location marked in red); (b) visual representation of current, wind, and wave directions; (c) time series of the current speed (time of accident shown as a red dot).
Jmse 13 01275 g008
Figure 9. Wind rose diagram of accident location for the entire dataset: (a) 1 January 2023 to 31 December 2023; (b) 6 h before and after the accident time.
Jmse 13 01275 g009
Figure 10. (a) Hourly evolution of 2D directional wave spectrum at the accident site from 08:00 to 16:00 UTC. (b) Wave spectrum at accident time outlined in red.
Jmse 13 01275 g010
Table 1. Coordinates and distances of interpolation points.
Grid PointLatitude (°S)Longitude (°E)Distance to Accident Site (km)
Q11−32.5029.0045.95
Q21−32.5029.5044.98
Q12−32.0029.0029.64
Q22−32.0029.5028.10
Table 2. Parameters analysed in the study.
ParameterFormulation
Significant Wave Height, Hs (m) 4   m 0
Mean Wave Period, Tm (s) m 0 m 2
Wave Direction (°) t a n 1 b a
Wind Direction (°) m o d   ( 270 arctan v 10 u 10 .   180 ° π , 360 ° )
Wind Speed (m/s) u 10 2 + v 10 2
Wave Steepness, S   H s L
Current Speed u 2 + v 2
Current Direction m o d   ( 90 ° a t a n 2   v , u ,   360 )
Cross-Seas, Δθθ_wind – θ_swell
2d wave spectrum, S (f, θ)E (f) D (f, θ)
a and b represent the first-order Fourier coefficients of the directional wave spectrum: a is the cosine component, and b is the sine component. These coefficients are derived from the energy distribution across wave directions and frequencies, and are used to calculate the mean wave direction.
Disclaimer/Publisher’s Note: The statements, opinions and data contained in all publications are solely those of the individual author(s) and contributor(s) and not of MDPI and/or the editor(s). MDPI and/or the editor(s) disclaim responsibility for any injury to people or property resulting from any ideas, methods, instructions or products referred to in the content.

