Article

Structural Analysis and Redrawing of a Sailing Catamaran with a Numerical and Experimental Approach

by
Giovanni Maria Grasso
1,
Marco Bonfanti
2,
Fabio Lo Savio
3,
Damiano Alizzio
4 and
Ferdinando Chiacchio
1,*
1
Department of Electric, Electronic, Informatics Engineering, University of Catania, Via S. Sofia, 4, 95100 Catania, Italy
2
Department of Agriculture, Food & Environment, University of Catania, Via S. Sofia, 100, 95100 Catania, Italy
3
Department of Civil Engineering and Architecture, University of Catania, Via S. Sofia, 54, 95100 Catania, Italy
4
Department of Civil, Energy, Environmental and Material Engineering (DICEAM), Mediterranean University of Reggio Calabria (UNIRC), Via Graziella Vito, 89122 Reggio Calabria, Italy
*
Author to whom correspondence should be addressed.
J. Mar. Sci. Eng. 2025, 13(7), 1270; https://doi.org/10.3390/jmse13071270
Submission received: 13 May 2025 / Revised: 19 June 2025 / Accepted: 26 June 2025 / Published: 29 June 2025
(This article belongs to the Section Marine Environmental Science)

Abstract

This study investigates the structural behavior of a sailing catamaran subjected to wind, wave, and self-weight loads, with the ultimate goal of improving the structural design through redrawing techniques. A digital model was developed using Creo software 6 and analyzed through Finite Element Analysis (FEA), complemented by experimental deformation tests conducted under dry conditions and controlled loading. These tests provided a reliable dataset for calibrating and validating the numerical model. The analysis focused on the structural responses of key components—such as bulkheads, hulls, and beam-to-hull connections—under both isolated as well as combined load scenarios. Most structural elements demonstrated low deformation, confirming the robustness of the design; however, stress concentrations were observed at the connecting plates, highlighting areas for improvement. The vessel’s overall stiffness, though advantageous for structural integrity, was identified as a constraint in weight redrawing efforts. Consequently, targeted structural modifications were proposed and implemented, resulting in reduced material usage, construction time, and overall costs. The study concludes by proposing the integration of advanced composite materials to further enhance performance and efficiency, thereby laying the groundwork for future integration with digital and structural health monitoring systems.

1. Introduction

In the last decade, the increasing use of catamarans as high-speed transport vessels has intensified the need for detailed studies on hydrodynamic loads, in order to develop structures that are both lightweight and safe. Most existing research has focused on the fluid dynamic behaviour of monohulls and the central structure of multihulls under wave-induced loads [1,2,3,4,5,6,7,8,9].
The widespread adoption of composite materials in yacht, military, and fast-craft design—including SES, SWATH, and catamarans—has achieved significant weight reductions but also introduced critical challenges related to structural integrity. Fibre-reinforced polymer (FRP) composites, while efficient, are prone to damage mechanisms such as matrix cracking, fibre-matrix debonding, fibre fracture, and interlaminar delamination [10].
In high-speed catamarans, slamming loads on the wetdeck represent a critical design factor. These loads, induced by wave impacts, are often responsible for structural failures—particularly at the beam connection zones—and are challenging to predict accurately. Although Classification Societies provide empirical formulas for estimating local impact pressures, these are often insufficiently precise. For this reason, finite element analysis (FEA) is widely employed to better simulate dry-load conditions, as seen in the works of Hermundstad et al. (1995) [11] and Dessi et al. (2005) [12]. The integration of numerical simulations and experimental measurements, as recommended by Cook et al. [13], remains a best practice.
Designers of large, high-speed catamarans face a structural dilemma: balancing lightweight construction—essential for speed and payload capacity—with the strength needed to withstand extreme ocean conditions. In some cases, excessive slamming has caused severe damage to longitudinal beams, stern frames, and internal supports. Fatigue cracking, common in aluminum structures, also affects composites due to the vibrations induced by repeated slamming.
As discussed in several papers [14,15,16], the structural analysis of ships is a critical task, not only due to the complexity of load conditions and material behavior, but also because structural health monitoring remains a challenging endeavor, as widely discussed in the literature. Despite technological advancements, the optimal placement of sensors, the interpretation of collected data, and the integration of monitoring systems on board still pose significant difficulties that reinforce the need for accurate and predictive structural design from the outset. Such approaches still rely heavily on accurate modeling and calibration of the structural behavior of the vessel. This further highlights the relevance of our work, which focuses on experimentally validating and optimizing the finite element model of a sailing catamaran under dry load conditions. A reliable structural model remains essential not only for prediction and design but also as the foundation for advanced digital applications such as digital twins.
To overcome these challenges, advanced stress analysis and structural redrawing methods—particularly those focused on composite reinforcement—have been implemented. As discussed in [1], the pioneering instrumentation enabled real-time deformation monitoring during sailing, revealing key features of slamming-induced whipping. Complementary theoretical approaches, ranging from 2D models [17] to advanced 3D modal analyses [11], have improved our understanding of whipping phenomena, though limitations remain in accurately predicting amplitude [18]. While slamming has been extensively studied in ferries and military catamarans, it continues to pose significant challenges for sailing catamarans, particularly during high-speed ocean crossings [19]. These vessels, being considerably lighter, are often designed with low bridge decks to enhance stability and aesthetics; however, this configuration increases their vulnerability to slamming-induced damage, particularly around the main girder, where fatigue—common in metallic structures—and delamination—typical in composite materials—are frequent failure modes.
Previous studies on slamming in sailing vessels have mainly focused on monohulls [20,21,22], emphasizing the need for motion-based prediction tools. Strip theory, initially introduced by Korvin-Kroukovsky and Jacobs [23] and refined over the decades [24,25], remains a cornerstone for estimating ship motions and predicting slamming risk. However, lightweight sailing catamarans are particularly sensitive to pitching, which can compromise both navigational safety and sail performance. Grande (2002) [26] proposed a dedicated strip-theory model tailored to catamaran slamming, while other approaches have incorporated Fluid–Structure Interaction (FSI) simulations of wedge-like structures in free-fall water entry scenarios [27].
The activity carried out in this study aimed to identify a design and structural redrawing solution by modifying ribs, longitudinal structures, and various panels to improve structural performance (achieving equal or lower stress levels) and reduce weight. To achieve this, the design was restructured to eliminate aluminum components and reduce stress concentrations at the connection points with the composite material through a targeted morphological design.
This study extends previous research by focusing on the structural behaviour of a composite sailing catamaran under dry loading conditions. In this context, dry loading refers to structural load applications performed while the vessel is supported on land, i.e., outside the water, within a controlled, non-hydrodynamic environment. These tests facilitate the assessment of the hull’s mechanical response independent of fluid-structure interactions. Section 2 outlines the naval design principles providing methods to calculate the loading conditions for the analysis. Section 3 details the deformation measurements obtained using strain gauges strategically placed on the hull. Section 4 presents the experimental tests, while Section 5 introduces the FEA model developed to simulate identical load conditions for validation purposes. In Section 6, the validated model is employed to simulate stress and displacement under real sailing loads. Section 7 explores the replacement of aluminum connecting beams with a composite central structure, highlighting material and weight redrawing. Finally, Section 8 presents the main conclusions.

2. Methods for the Calculation of Loading Conditions

The principal target of the study is the redrawing of the pre-existing project on the Langevin F40 Catamaran. For this reason, the following protocol was implemented:
“Dry” experimental tests on the F40 catamaran
Creation of a CAD/FEA model from the results of the “dry tests”
Improvements to the construction elements and materials
This paper examines the behaviour of a sailing pleasure catamaran under load, analysing the deformations and relative displacements experienced by its structural components. Load determination was based on the work of Cook et al. [13], combining experimental measurements with a finite element analysis on the model of the actual boat. Specifically, a “dry” calibration was carried out by applying known loads and measuring local deformations on the connecting beams between the two hulls using strain gauges. Then, the deformations induced by wave motion were measured in the same structures, using the prior calibration data. Finally, an FEA model was created to correlate the predicted strains with those measured on the research catamaran “Educat” during calibration. The technical limitation of the work of Cook et al. lies in the logistical difficulty to simultaneously obtain wave parameters, motions, and load data for full-scale vessels, allowing only statistical predictions rather than establishing transfer functions suitable for evaluating various operational conditions and the most severe loading conditions. In order to overcome the limits of this study, the present study performed “dry” experimental tests using strain gauges and displacement sensors strategically positioned across the entire structure of the catamaran. This setup enabled direct measurement of deformation and load responses on the full-scale catamaran. Additionally, by referencing displacements to the ground—used as an absolute reference system—the experimental procedure allowed for the measurement of absolute displacements, a critical step toward validating a reliable finite element analysis (FEA) model. This approach, based also on the measured internal displacements, is representative of full-scale experimental tests performed within an absolute reference system; it offers a comprehensive representation of stress and displacement distribution for the naval unit model. Once the model has been validated, it was possible to apply extreme stress conditions, evaluating results only by numerical analysis.
For the section of magnitude and application mode of the load, the approach proposed by Varyani et al. [18] was adopted, although based on calculating the impact force of the wave on only one of the two hulls under a known relative velocity. Varyani et al. investigated the fluid-dynamic stresses acting on the Vosper International High Speed Catamaran, obtaining experimental diagrams that illustrate the variation of the non-dimensional pressure coefficient Cp as a function of the squared impact velocity and the generated pressure, as well as the non-dimensional force coefficient Cf as a function of time post-impact.
As far as it concerns the choice of loading application type, considering the different casuistry, wave types, contact area, and impact modality, the results from the studies conducted by NTNU (Norwegian University of Science and Technology, Trondheim), ref. [28] and C.C. Fang et al. [29], were taken into account, particularly relating to the effects of different stresses on the hull [30].
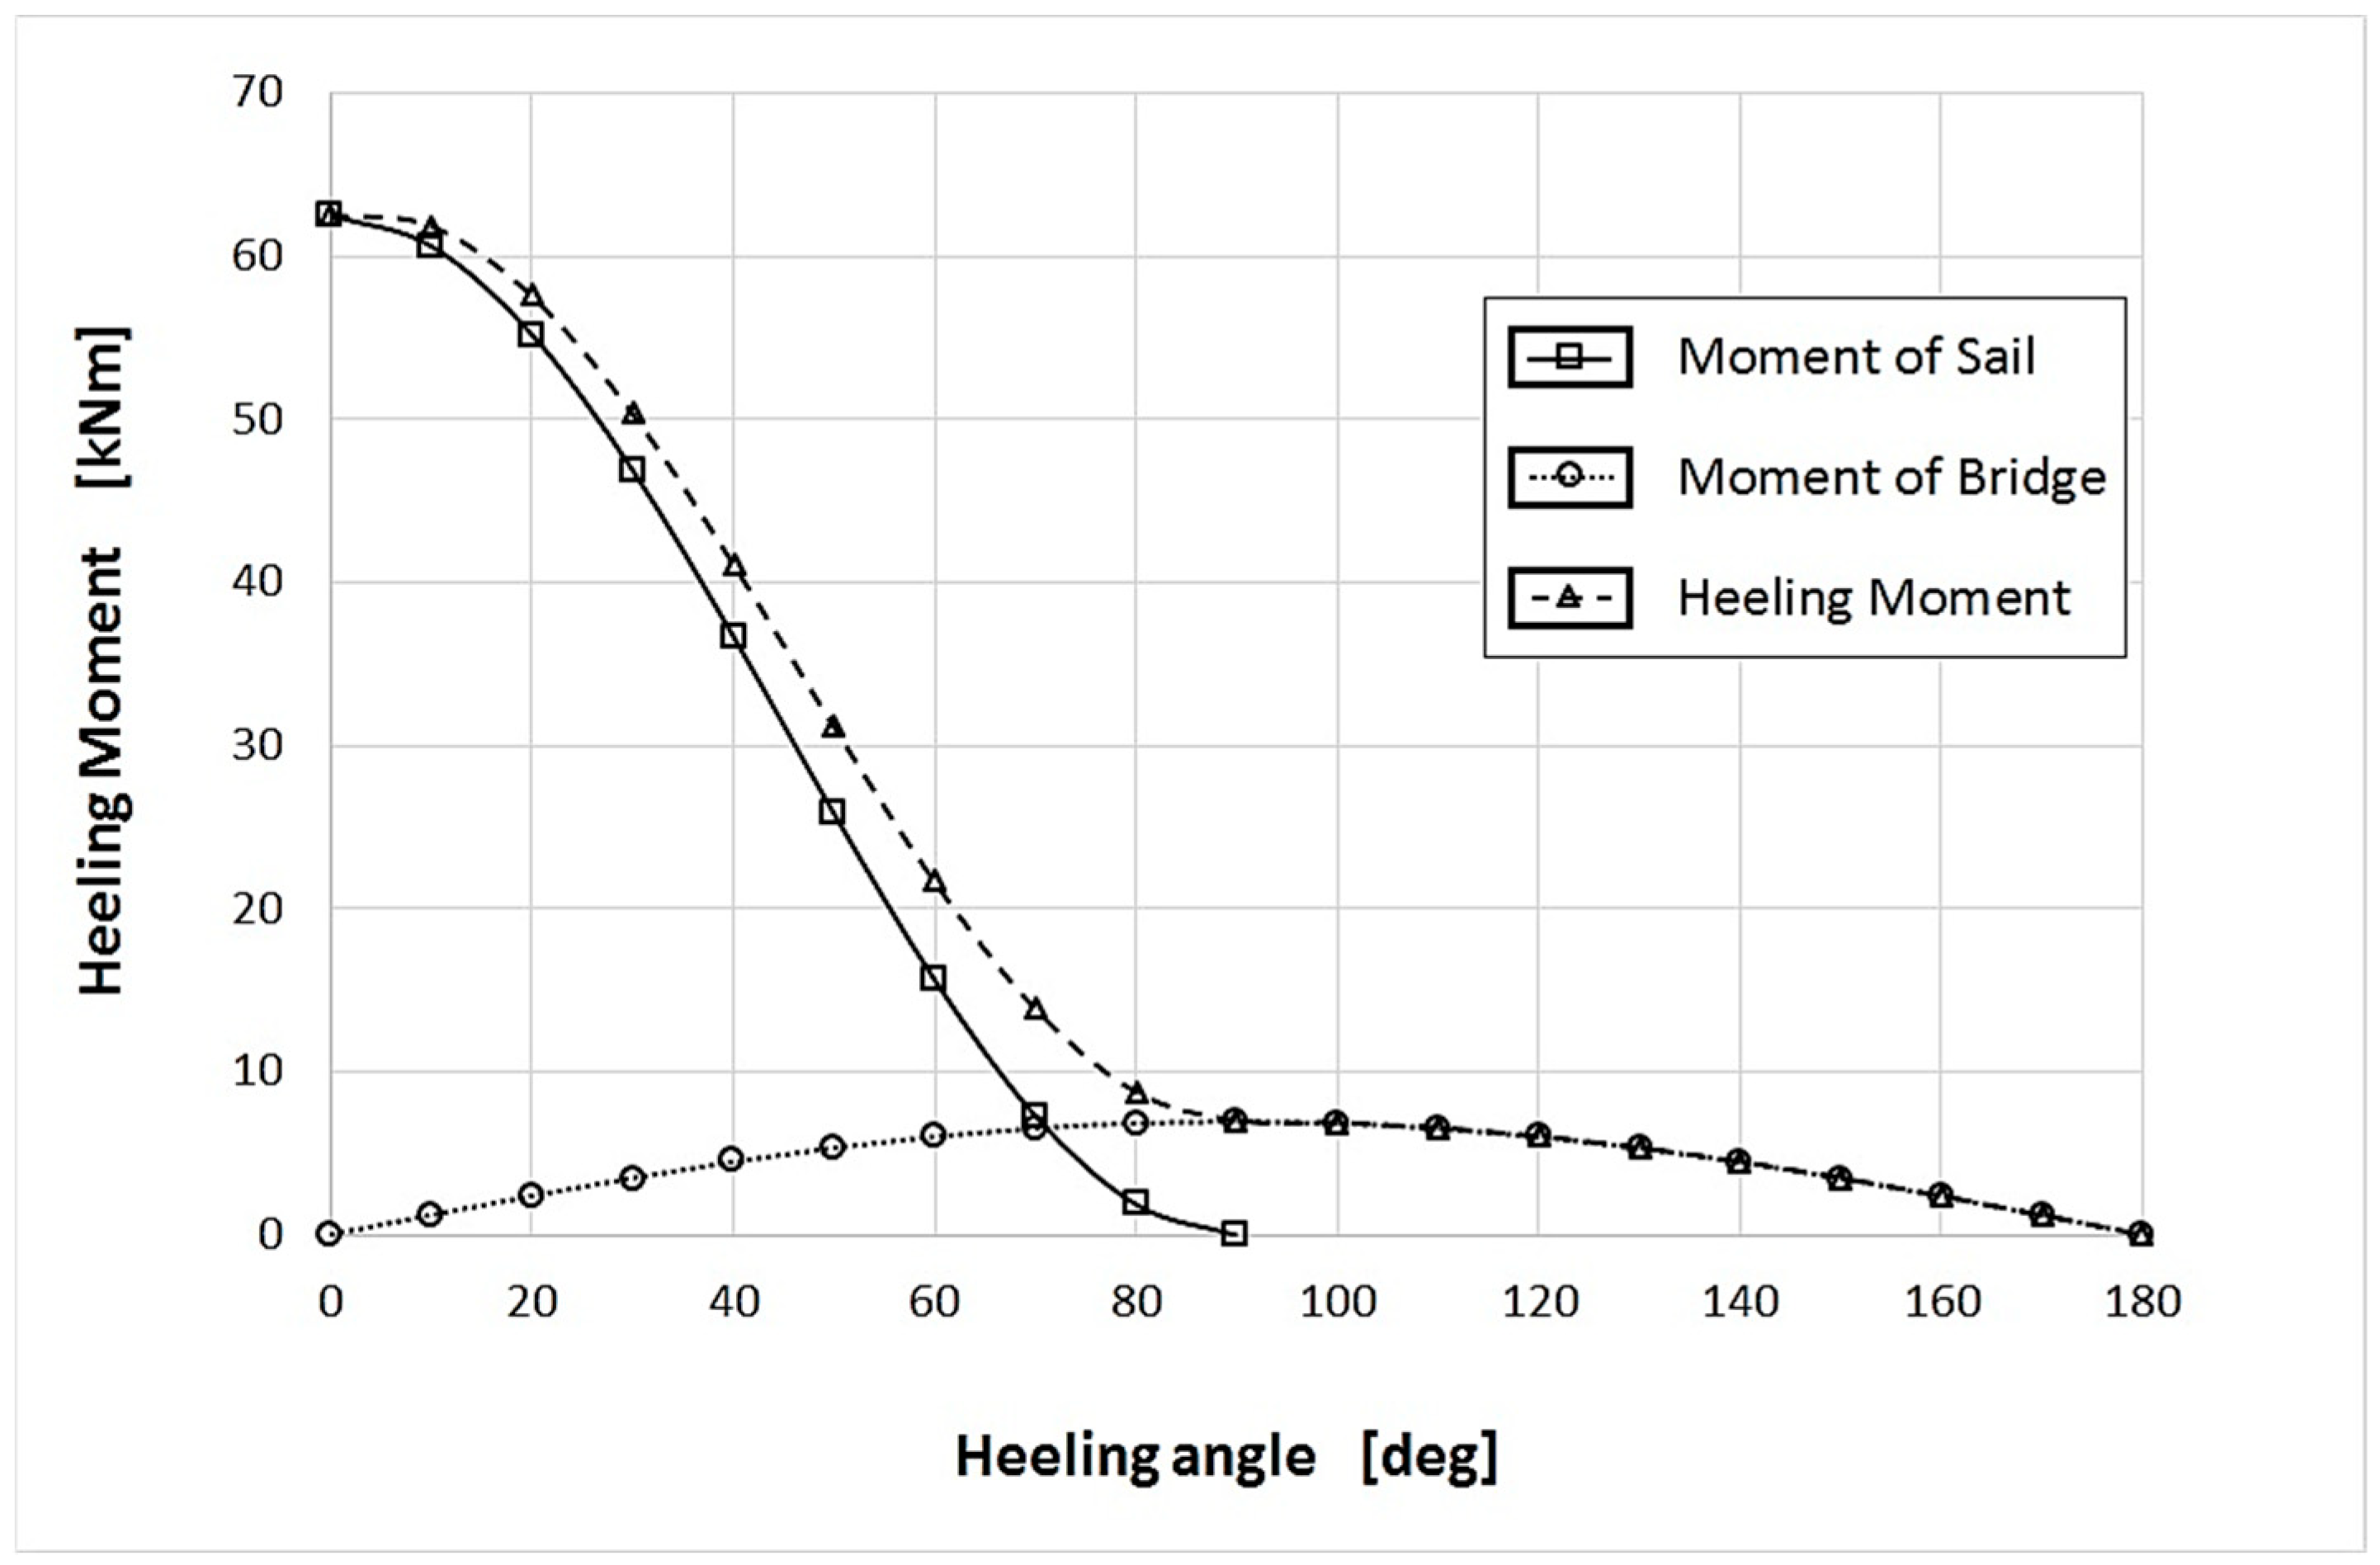
For accurate analysis of catamaran stability, it is essential to assess the heeling forces. As known, the heeling of a boat occurs when there is an equilibrium between heeling moment (of aerodynamic nature) and righting moment (due to the weight of the boat including the crew). The aerodynamic wind thrust on a catamaran generates two different forces: the first force acting on the sails, which decreases with a co-sinusoidal trend; the second one acting on the platform or bridge (whether rigid or canvas material), which increases with sinusoidal trend. In correspondence of large heeling, when the sail is almost horizontal and the wind pressure on the platform approaches levels that could cause capsizing, the heeling force produced by the sail (Fv) is:
F V = 1 2 ρ C v 2 S v
where ρ is the air density, Sv is the vertical projection of the sail area, v is the maximum allowable value of the apparent speed assumed equal to 30 knots, and C is a coefficient depending on the lift coefficient CL and the drag coefficient CD as the sail angle with respect to the ship axis θ changes:
C = C D sin θ + C L cos θ
The moment arm of this force (bv) is:
b v = h   c o s   α
being h the altitude of the sailing center related to the center of gravity, equal to 6.42 m, and α the heeling angle. The heeling force produced by the bridge (Ft) is:
F t = 1 2 ρ C D v 2 A v
with Av that represents the vertical projection of the bridge area and v is the maximum allowable value of the apparent speed.
The moment arm of this force (bt) is:
b t = l / 2   s i n   α
being l = 7.66 m the boat width and α the heeling angle.
The effect of the sails is zero for heeling angles greater than 90°, while the effect of the bridge acts up to α = 180°. The plot of the heeling moment is shown in Figure 1.
The righting moment is obtained from the immersion curve provided for the catamaran under examination, shown in Figure 2.
For immersions up to 900 mm, the curve represents the hull’s drift and follows a linear trend (stretch 1); the second part of the curve is relative to the keel and has a nearly exponential trend (stretch 2). Considering that the total weight of the boat is 1930 kg, when α is equal to zero, the immersion of a hull is 191.2 mm. As heeling increases, one of the two hulls will displace more and more weight up to a maximum of 1930 kg, while the weight displaced by the other hull will progressively decrease until fully emerging from the water. Figure 3 shows how the hull immersion varies as a function of the heeling angle.
It has to be noted that the emersion angle is equal to 10.10°. Starting from this value, the righting force Fat is given by the principle of Archimedes:
F a t = V ρ g
with g the gravity acceleration and ρ V the mass of the displaced volume (V) of water.
It must be pointed out that Fat remains constant and equal to 18,933 N, while the moment arm (ba) varies according to:
ba = l/2 cos α
At α = 169.90°, the displacement curve changes slope because the upper part of the hull (upside down) becomes submerged. The section of the vessel, initially with only one hull in the water, becomes a section of both hulls in the water, including the (dry) center deck.
The displacement curve changes slope as the upper part of the hull out of the water begins to submerge. The vessel, initially supported by only one hull in the water, changes to a configuration where both hulls are in contact with the water, including the (normally dry) center deck.
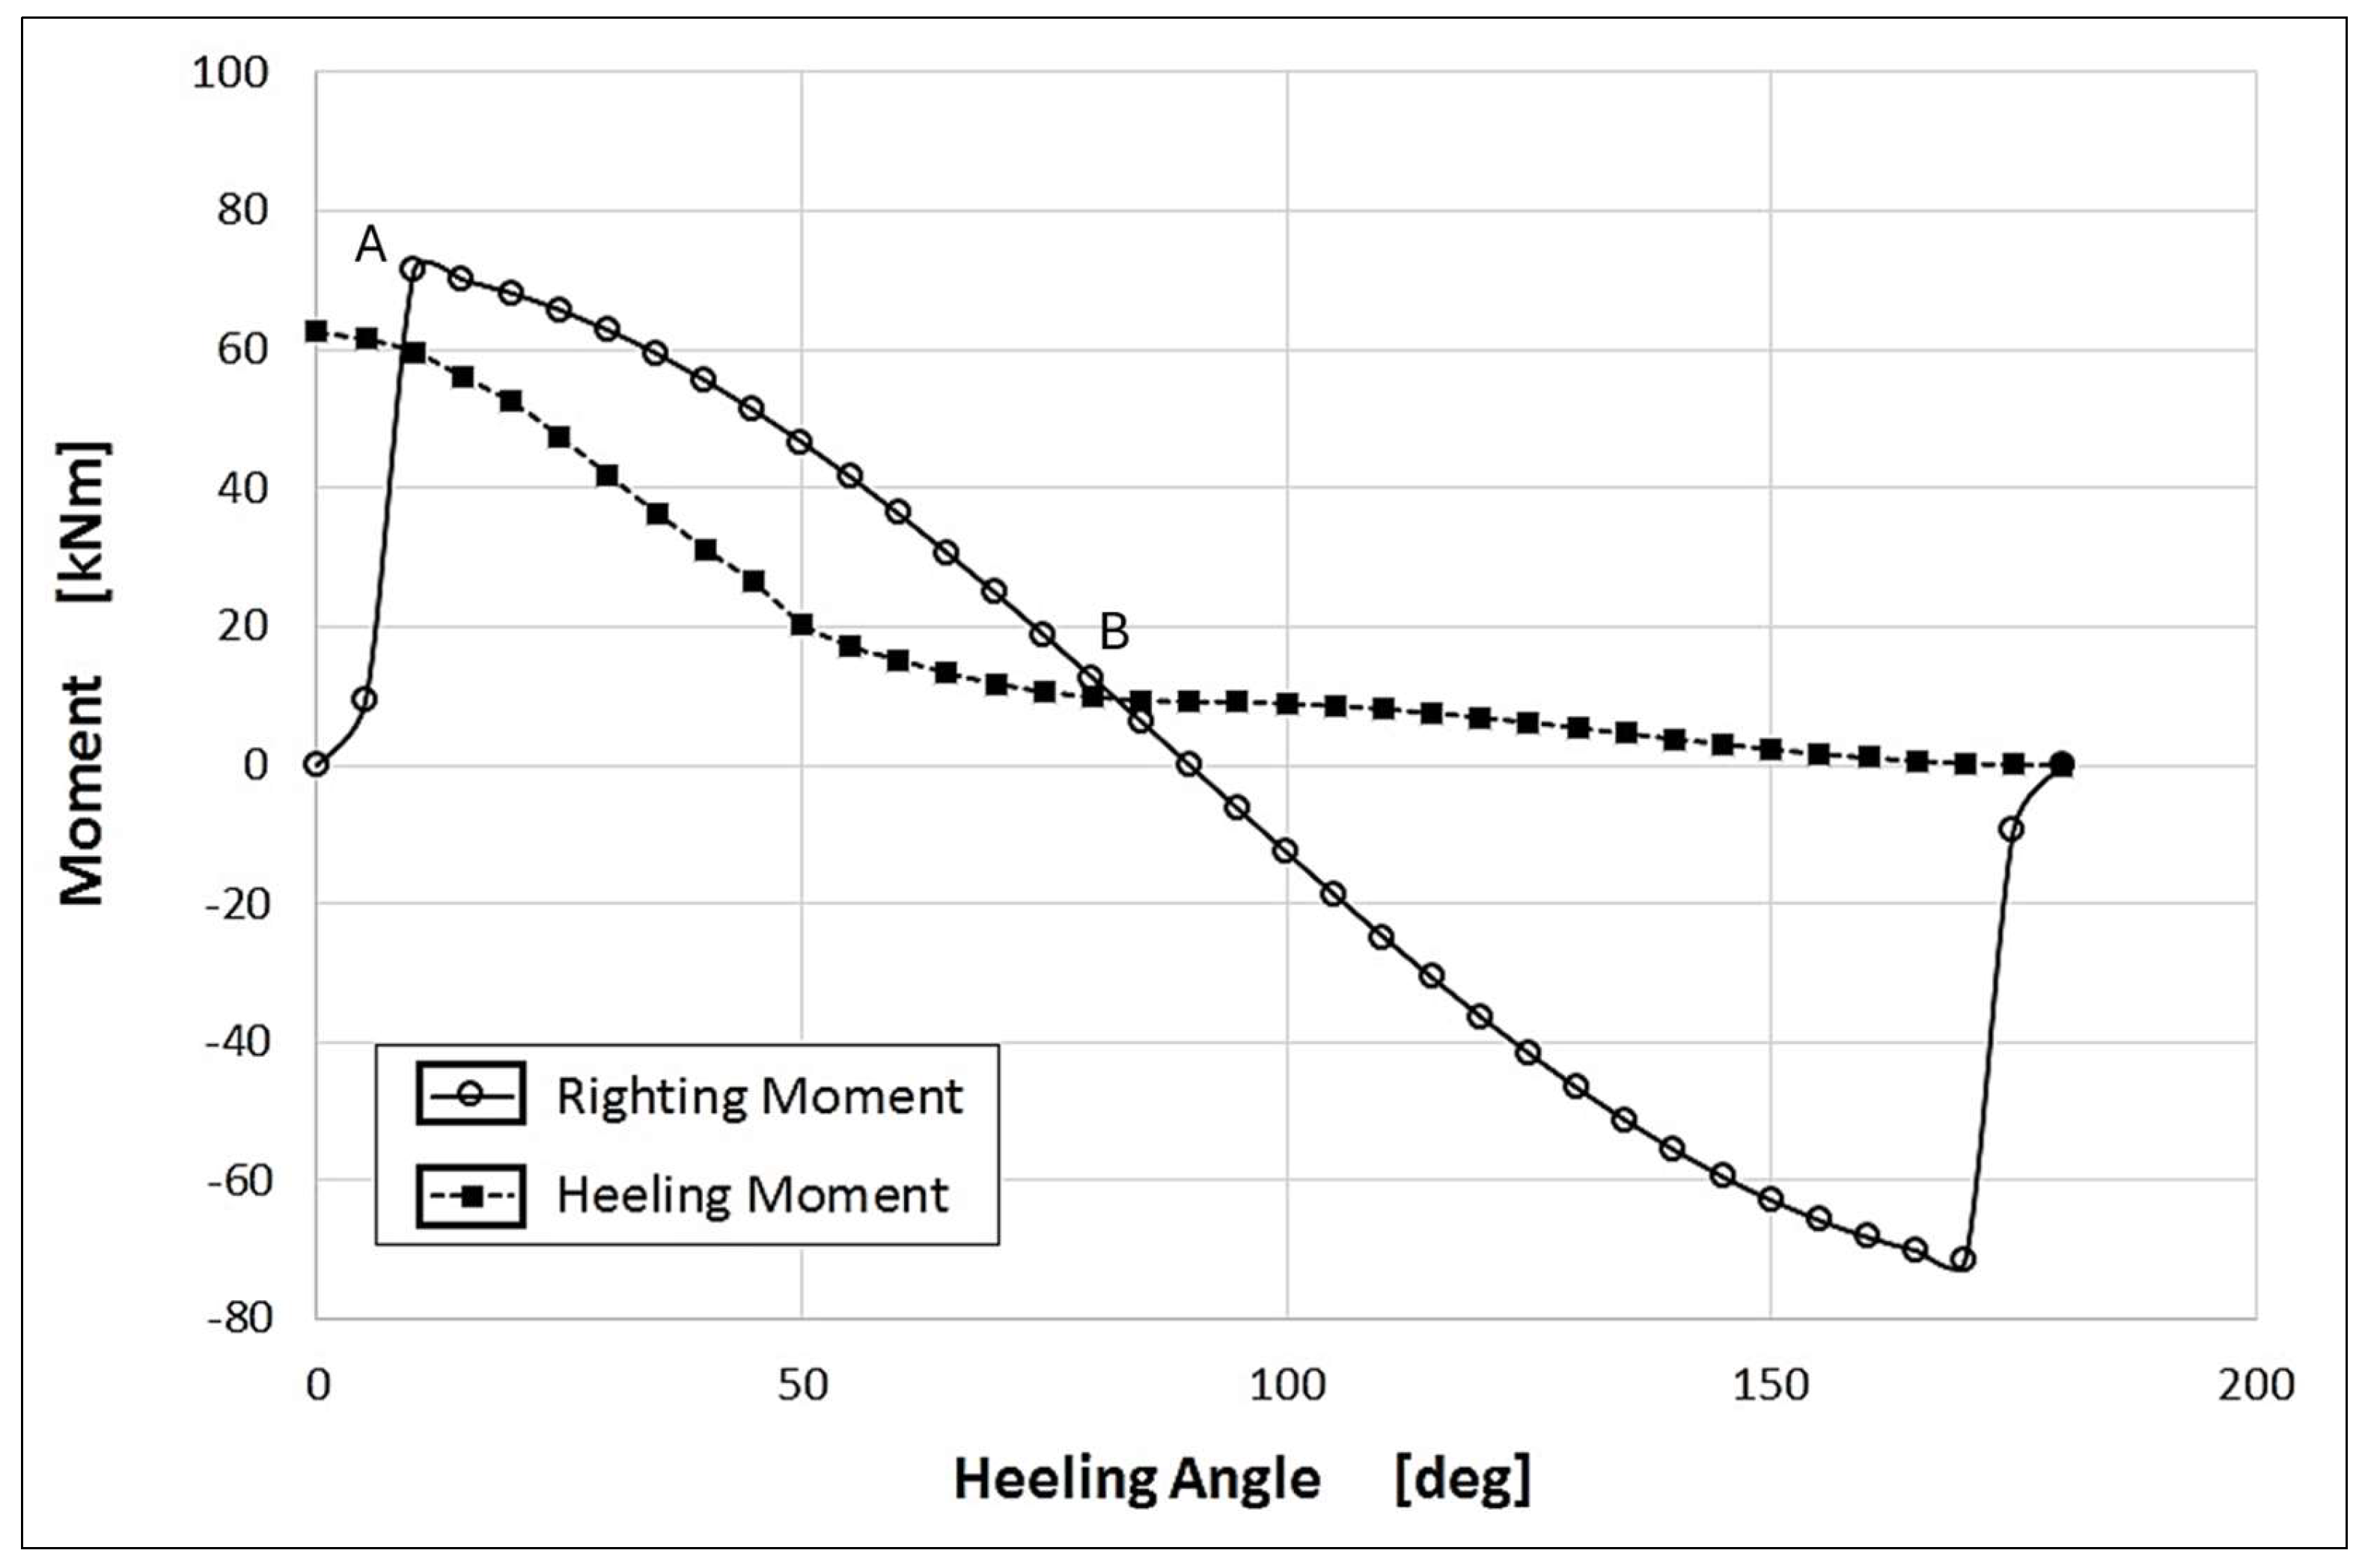
From this angle onward, the dry hull deck starts to submerge. The slope change in the curve follows the same trend observed at the 10.10° point. By representing both the righting moment and the heeling moment on the same diagram, the behaviour of the multihull, even under extreme conditions such as single-hull navigation, can be analysed as shown in Figure 4.
The two points A and B, where the righting and heeling moments are equal, represent two profoundly different situations of equilibrium: point A is a stable equilibrium point: even if the heeling angle increases, the righting moment will always remain greater than the heeling moment and, thus, the boat will tend to return to its original position. On the other hand, point B is an unstable equilibrium point: an increase in the heeling angle would correspond to a heeling moment that is gradually larger than the righting moment, ultimately leading to capsizing. Conversely, if α decreases, the boat quickly straightens up to return to the stable equilibrium at point A. To avoid capsizing, designers typically limit the maximum allowable value for heeling torque so as to induce the breakage of the rig before the boat overturns on the water.
The heeling moment reaches its maximum when the windward hull emerges completely from the water. At this point, it assumes a value equal to twice the product of the boat’s weight (displaced by the submerged hull) and the distance between the boat’s centerline and that of a hull (moment arm). The maximum moment applied was considered as the maximum value of stability reaction of the boat. As is clear from the plot (Figure 4), the reaction moment value is displayed with maximum value at 10.10° heeling. It has been proved useful to analyse the loads due to the maximum heeling moment in order to compare the stress state (FEA) under such conditions. Accurate knowledge of the vessel’s stability is a fundamental step for the development of the reliability of the following FEA model.

3. Experimental Devices (Load System, Strain Gauge Tests)

This paper aims to characterize the stiffness and under-load behavior of the catamaran through the experimental validation of an FEA model. The ultimate goal is to refine the initial design. To achieve this, the catamaran was placed in “dry” conditions (Figure 5a) and positioned on a metal support structure (Figure 5b) constraining each hull at two points, respectively 2.3 m from the bow and 2.2 m from the stern. This setup facilitates stress analysis, enabling an accurate assessment of the catamaran’s performance under load. To prevent undesirable damage during testing, wooden blocks were interposed between the metallic structure and the vessel’s keel (Figure 5c). The experimental setup is described in detail in the following section.

3.1. Electro-Pneumatic Loading System

An upward vertical load was applied at the bow of the right hull. This load was applied using a double-acting pneumatic actuator (Waircom cylinder (Waircom, Milan, Italy), series CPU, bore = 100 mm, stroke = 250 mm) positioned at 0.75 m from the support of the right hull of the catamaran (Figure 6).
The compressed air supply is managed remotely via a PC-PLC system, managed by the Zelio Soft 2 V5.1 software. The PLC used is Zelio SR3B261BD produced by Schneider Electric. The pneumatic circuit moving the actuator is shown in Figure 7. It consists of a compressor (1), a filtering unit (2), an air lubrication unit (4), and a digital pressure regulator (3) feedbacked through a pressure transducer (IFM PA-9024, 0–10 bar) (5). The air coming from the FRL group, through a 5/2 solenoid valve (7) and a quick exhaust valve (8) for each of the 2 ways, produces the movement of the shaft of the double-acting cylinder. To prevent air leakage and annoying noises from the solenoid valve, a pneumatic silencer (6) was used for each way.

3.2. Arrangement of Strain Gauge Rosettes

The assessment of the hull’s response to an applied external load was carried out by adopting both a strain gauge setup to evaluate deformations on the hull and connecting beams, and a displacement sensor system to directly measure the shifting of the hull. The obtained results will then be compared with data from the numerical simulation.
Figure 8a,b show the arrangement of the strain gauge rosettes and the Cartesian reference system adopted, assuming greater deformation in the loaded hull.
To measure the strains induced in the connecting beams, six strain gauge rosettes were used, each with three measuring grids oriented at an angle of 0°/45°/90° (Micro-Measurements: C2A-06-125WW-120). They were placed at a distance of 1/4 of the length of each beam from the right hull, along the y (2, 4, 6) and z (1, 3, 5) directions, respectively (Figure 9a,b).
The deformations induced on the right hull, close to the junctions of the central and rear beams, were measured using five rosettes of the same type as the previous ones, arranged along the x direction (7–11). In particular, rosettes #7 and #8 were arranged at the same cross-section of the hull, on the internal and external walls, respectively. Rosette #9 was arranged symmetrically to #7, relative to the central beam axis (Figure 9c). Rosettes #10 and #11 were symmetrically arranged relative to the stern beam axis on the inner wall of the hull.

3.3. Arrangement of Displacement Sensors

To measure the structural displacements of the hull under vertical loading, laser sensors and centesimal mechanical comparators were positioned according to the scheme shown in Figure 10.
The relative displacements between the two hulls were measured using two comparators (C1 and C2), each placed on one of the two coaxial telescopic beams diagonally connecting the bow of one hull with the stern of the other hull (Figure 10a).
The telescopic beams, specially designed as both a displacement-sensitive element as well as a support for the comparators (Figure 10b), were made of aluminum to avoid affecting the relative displacements between the boat hulls, thereby minimizing the instrumental insertion error.
Each laser displacement sensor (Micro-Epsilon OptoNCDT 1302-200, Ortenburg, Germany) was also fixed to the internal coaxial element of an aluminum telescopic rod. An L-profile was positioned on the rod, acting as a target for the laser beam, to detect the movements of the rod due to the deformations undergone by the hulls of the catamaran (Figure 11). Laser sensors have a range of 60 ± 260 mm, an accuracy of ±0.2%, and a spot diameter of 2.3–2.1 mm.

3.4. Hardware and Software Adopted in the Experimental Tests

Pseudo real-time synchronization between data from strain gauge rosettes, displacement laser sensors, and pressure transducer was achieved by using a NI PXIe-1073 chassis, Austin, TX, USA. This device contains two acquisition boards:
  • PXIe-4330 (25 kS/s, 24-Bit, 8-Channel PXI Strain/Bridge Input Module);
  • PXIe-6341 (500 kS/s, 16-Bit, 16AI + 2AO Channels PXI Multifunction I/O Module).
The whole hardware was controlled by NI LabVIEW software 2021 SP1 that, associated with the Zelio Soft 2 software, also controlled the compressed air supply and regulation system.

4. Experimental Tests (Strain Gauges System)

This chapter presents the experimental tests performed under the load conditions described in Section 2, using the setup detailed in Section 3. A comprehensive explanation of the experimental procedures conducted in dry conditions is provided.

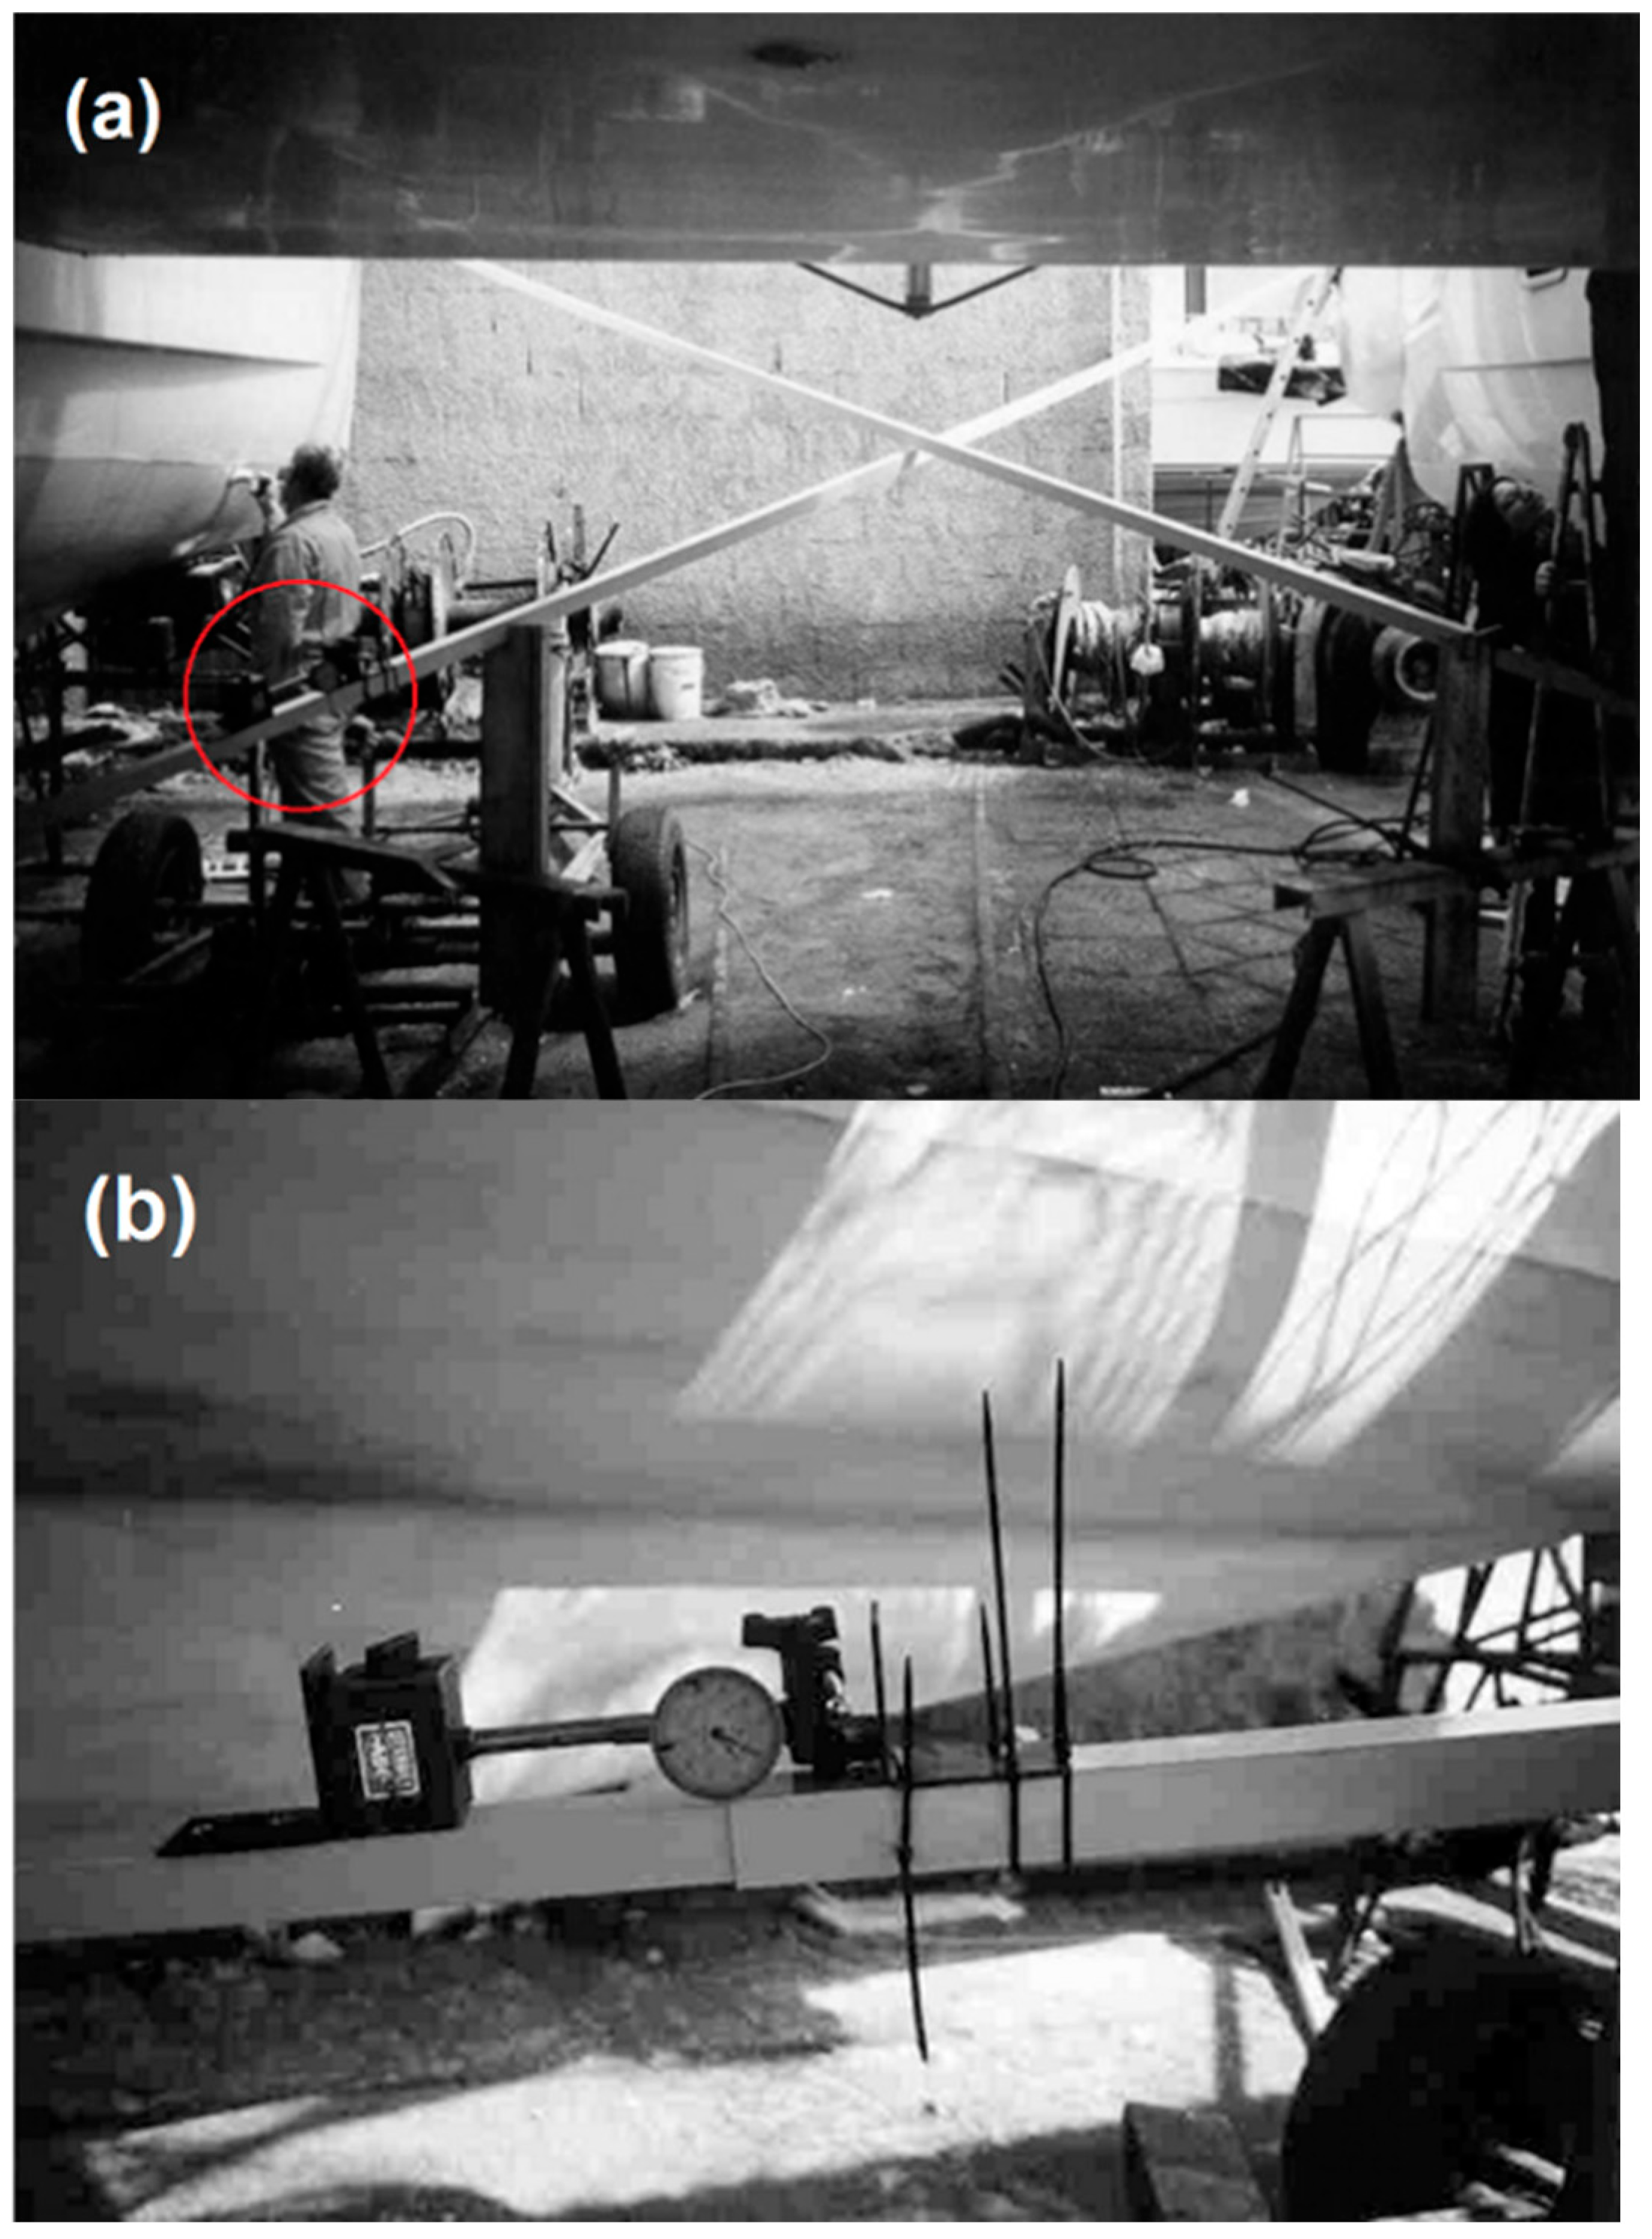
4.1. Pre-Calibration of Loading System

As stated in Section 2, the authors aim to analyze the mechanical behavior of the full-scale boat under “dry” conditions, i.e., with respect to an absolute reference system.
From an initial calibration, the pressure value (6.66 bar) to be supplied to the pneumatic actuator was obtained, so that the L2 sensor, located near the load application point, measured a displacement of 100 mm. For this reason, the loading was performed with increasing pressure up to 6.66 bar, in increments of 1 bar per step, except for the last one.
Based on the technical characteristics of the pneumatic actuator, each set pressure value corresponds to a well-defined load value (Table 1).
From the initial calibration, the elongation measured at each loading step was observed to tend to stabilize to a constant value approximately 5 min after applying the load. For this reason, the pressure was kept constant for 5 min and the elongation was acquired every minute.

4.2. Viscoelastic Behaviour of the Composite Material

A creep phenomenon was observed at each loading step, indicating viscoelastic behaviour by the composite material comprising the hulls. The elongation curves exhibited a consistent temporal trend across all load scenarios (from 785 N to 5225 N, as shown in Figure 12). This viscoelastic behavior, observed at each loading step, can be described using the following experimental parametric relationship:
s = F 0 k ( 1 e k t η * )
where s is the measured elongation (mm), F0 is the force applied at the time t = 0, t is the time of the loading application (min), k is the stiffness (N/mm), and is the lineic viscosity (N·min/mm) of the composite, respectively. As expected, the Equation (8) describes the Kelvin–Voigt model, typical of the viscoelastic response of composites.
As shown in Figure 12, Kelvin–Voigt’s model describes a pseudo-exponential curve tending asymptotically to F0/k. Table 2 shows elongation values from the L2 sensor after 5 min from loading, those estimated for and k values at each load step.
The best value and the standard deviation of k are kbest = 53.15 N/mm and σκ = 1.01 N/mm, respectively. Referring to Figure 13, the lineic viscosity η* derives from the slope of the tangent through the origin to the curve (F0/η*). Table 3 shows the displacement speed with respect to the air pressure (loads) and time. The best value and the standard deviation of η* are η*best = 40.12 N·min/mm and ση* = 0.55 N·min/mm, respectively.

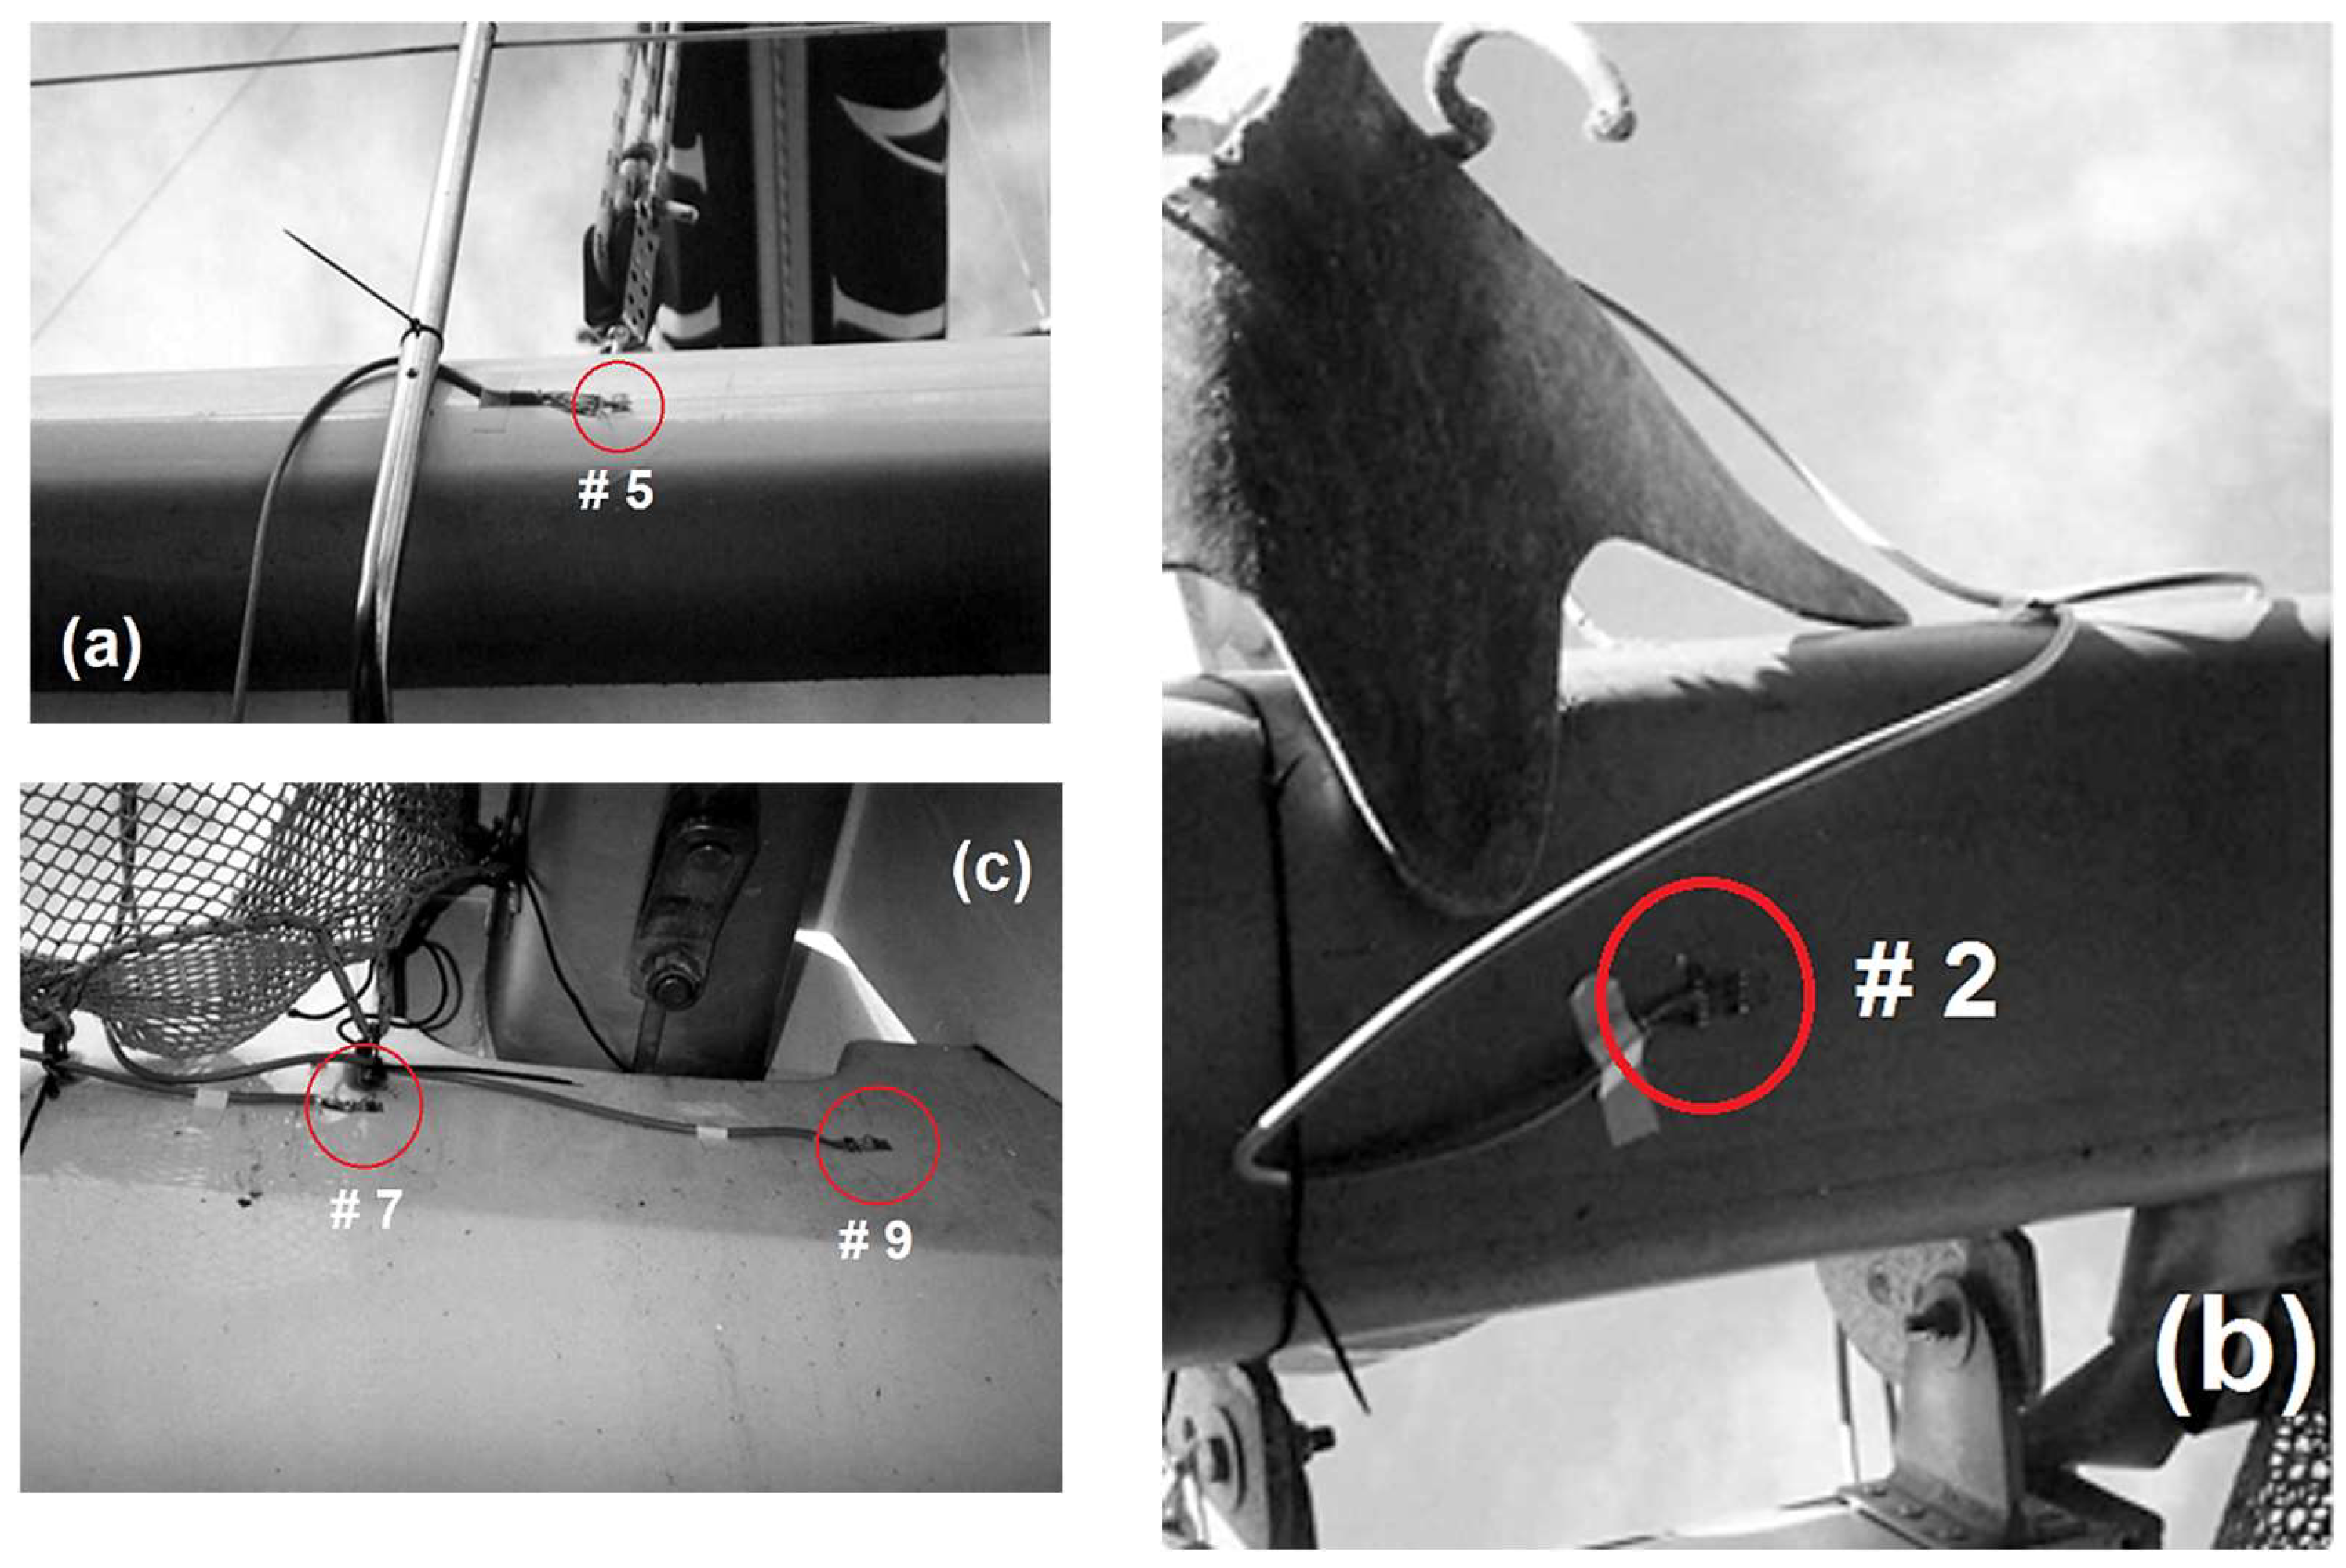
4.3. Results from Strain-Gauge Rosettes

As is known, the measurement procedure of the plane deformation with rectangular strain gauge rosettes allows us to obtain the deformation along the direction of each grid. From now on, readers can refer to Appendix A for the detailed formulas. Therefore, the values of ν w = 0.4 and ν c = 0.33 are the Poisson ratios of the wood (beams) and composite (hulls), respectively.
Using the Von Mises criterion, the equivalent deformation value (was obtained from the principal components. Table 4 shows the experimental data obtained.
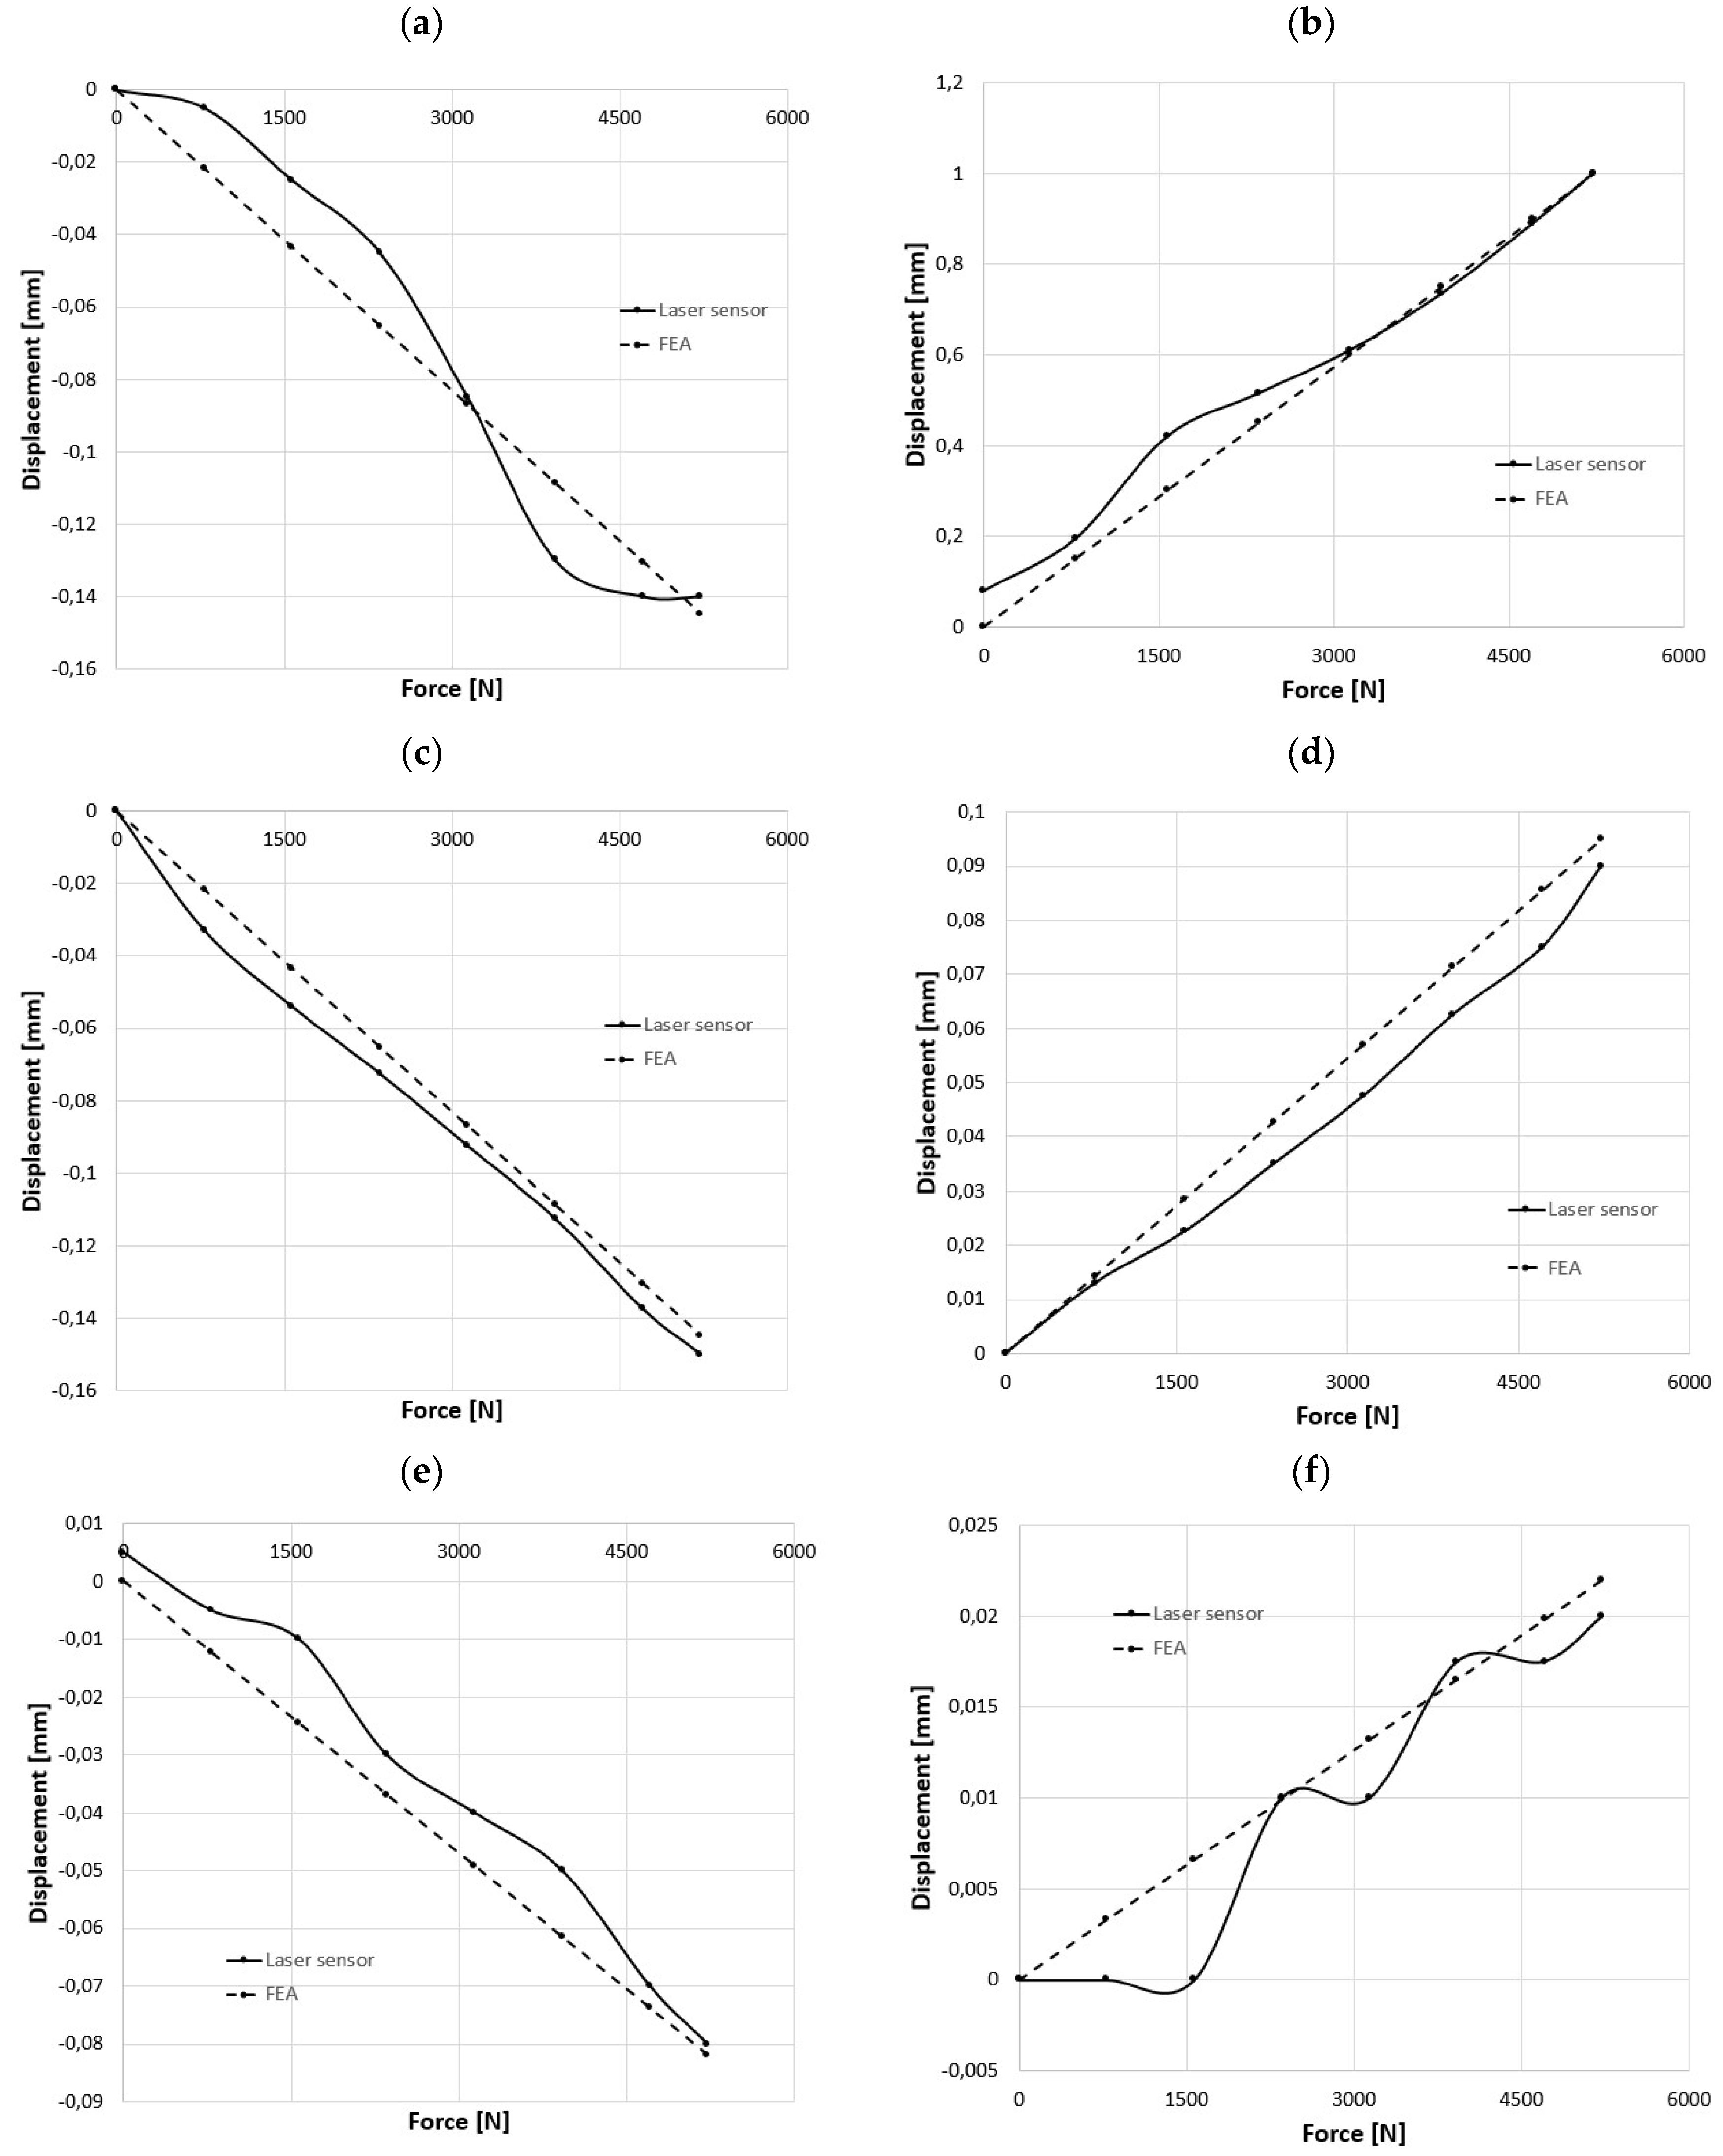
The elongation values obtained after 5 min of loading application were in good agreement with the expected results (Figure 12).
It is interesting to note how, in particular, for the centesimal comparators 1, 2, 5, and 6, the trends are clearly discernible and with limited maximum deviations compared to the full-scale value of 25%. Comparators 3 and 4, however, presented anomalous results, which was predictable due to the intrinsic construction of the measuring instrument. Specifically, the hysteresis cycle between the displacement values for increasing loads and decreasing loads represents the energy lost due to the initial friction force detachment in the sliding of the diagonal beams.
It must be emphasized that the loads applied to the structure showed extremely low values, given their localized application, and thus did not pose any risk of structural damage. Additionally, these stresses resulted in negligible deformations on the constraint (i.e., the potting), allowing it to be approximated as part of the frame.

5. FEA Model

The FEA model was developed starting from the design of the catamaran under study, incorporating the necessary surveys on the multihull. Creo software was used, enabling an accurate reproduction of the complex surfaces. All the parts of the real hull were modeled: bulkheads, beams, beam attachment zones, plates, etc. (see Figure 14).
The sandwich structure constituting the hull consists of 13 layers: 6 of outer skin, 1 of core and 6 of inner skin. For the composite material, the layers were defined according to the lamination table provided below (Table 5), while the remaining materials were considered isotropic. Table 5 shows the original playbook of the composite material used before the redrawing.

5.1. Experimental Data: Laser Measurements

Figure 13 shows the experimental displacement obtained by the laser system in the different positions L1 (Figure 13a), L2 (Figure 13b), L3 (Figure 13c), L4 (Figure 13d), C1 (Figure 13e), and C2 (Figure 13f). The position of the sensors was shown in Figure 8b.

5.2. Comparison Between FEA Model and Experimental Data

Figure 14 shows the FEA model of the original design which was experimentally analysed. It is important to notice the differences between this design and the one shown in Section 7 (Figure 19); the second one includes the performed redrawing. The details of the FEA analysis are clearer in Figures 16–18 and 20.
The following diagrams (Figure 15) show the comparison between the numerical and experimental displacements due to the application of the load (Figure 13 and Table 4).
The figures show a perfectly linear FEA response, whereas the experimental response—particularly for sensors 15/E and 16/F—shows deviations that can be explained by the elasto-plastic behavior of the system. This behavior results from both the composite components and the compliance of the composite–aluminum joints. The load increase lasts for twenty minutes following its application.
The boundary conditions of the mesh model are analogous to those of the catamaran in dry conditions. The boat rests on four supports, with constraints applied at corresponding locations to prevent vertical downward displacement (i.e., the structure cannot move downward). An alternating load was applied to an area on the starboard bow, matching both the position and surface area of the experimentally applied load using the hydraulic piston.

6. Finite Element Analysis of Real Load Situations

Using the FEA model validated in Section 5, this section describes stress and displacement under real sailing loads in order to evaluate the structural limits of single components.

6.1. Wind Action

First of all, the effects of the wind on sails, forestay and shrouds were simulated. The loads considered were therefore:
  • shrouds traction;
  • forestay traction;
  • main-deck weight;
  • mast/rigging weight;
  • boat weight.
The bow and stern of only one hull have been bound, allowing the other hull to experience vertical displacements. The results, obtained through FEA (finite element analysis), showed good agreement with the experimental data (Figure 16), illustrating a typical case where one hull impacts the wave and is loaded, while the other hull receives the load transferred from the first one. This structural interaction is a crucial aspect in naval design, particularly when considering stress analysis and structural redrawing for composite materials in catamaran configurations.

6.2. Wave Action

A further numerical analysis concerned the configuration of immersion of the leeward hull caused by the impact of a wave on the bow of the upwind hull (Figure 17). To determine the stress induced by the wave impact, it was useful to reference the work of Varyani et al. [15]. In particular, the impact with a wave acting on 1/3 of the length of the hull was simulated. For this purpose, the angle of inclination of the topsides of the hull was considered, and Cp was obtained from the relationship: P = 1 2 ρ   C P   V 2 . Once Cp was obtained, the pressure p acting on the hull was calculated by setting ρ equal to the density of the water (1000 kg/m3) and v equal to 10 m/s. Since Cp = 2, the pressure p is equal to 0.01 MPa.

6.3. Joint Action of Wind and Wave

The most critical condition occurs when the wind acts on the same side as the wave while the boat is sailing into the wind (Figure 18). The forces acting (on the hulls) are calculated at an apparent speed of 20 knots with a listing angle of 30° relative to the forward speed of the hull.
The stress values were found to be largely lower than the admissible values for all structural parts. In fact, from the FEA analysis, it emerged that the bulkheads of the ship are not significantly influenced by the considered applied loads; the beams are subjected to much lower stresses than the resistance values prescribed by the manufacturer. Even the beam/hull connection areas, which are the points at greatest risk of breakage for this type of ship, are little stressed. Table 6 shows the displacements and maximum stress values in the three load conditions mentioned above:

7. FEA Model Redrawing

The numerical analysis presented in 
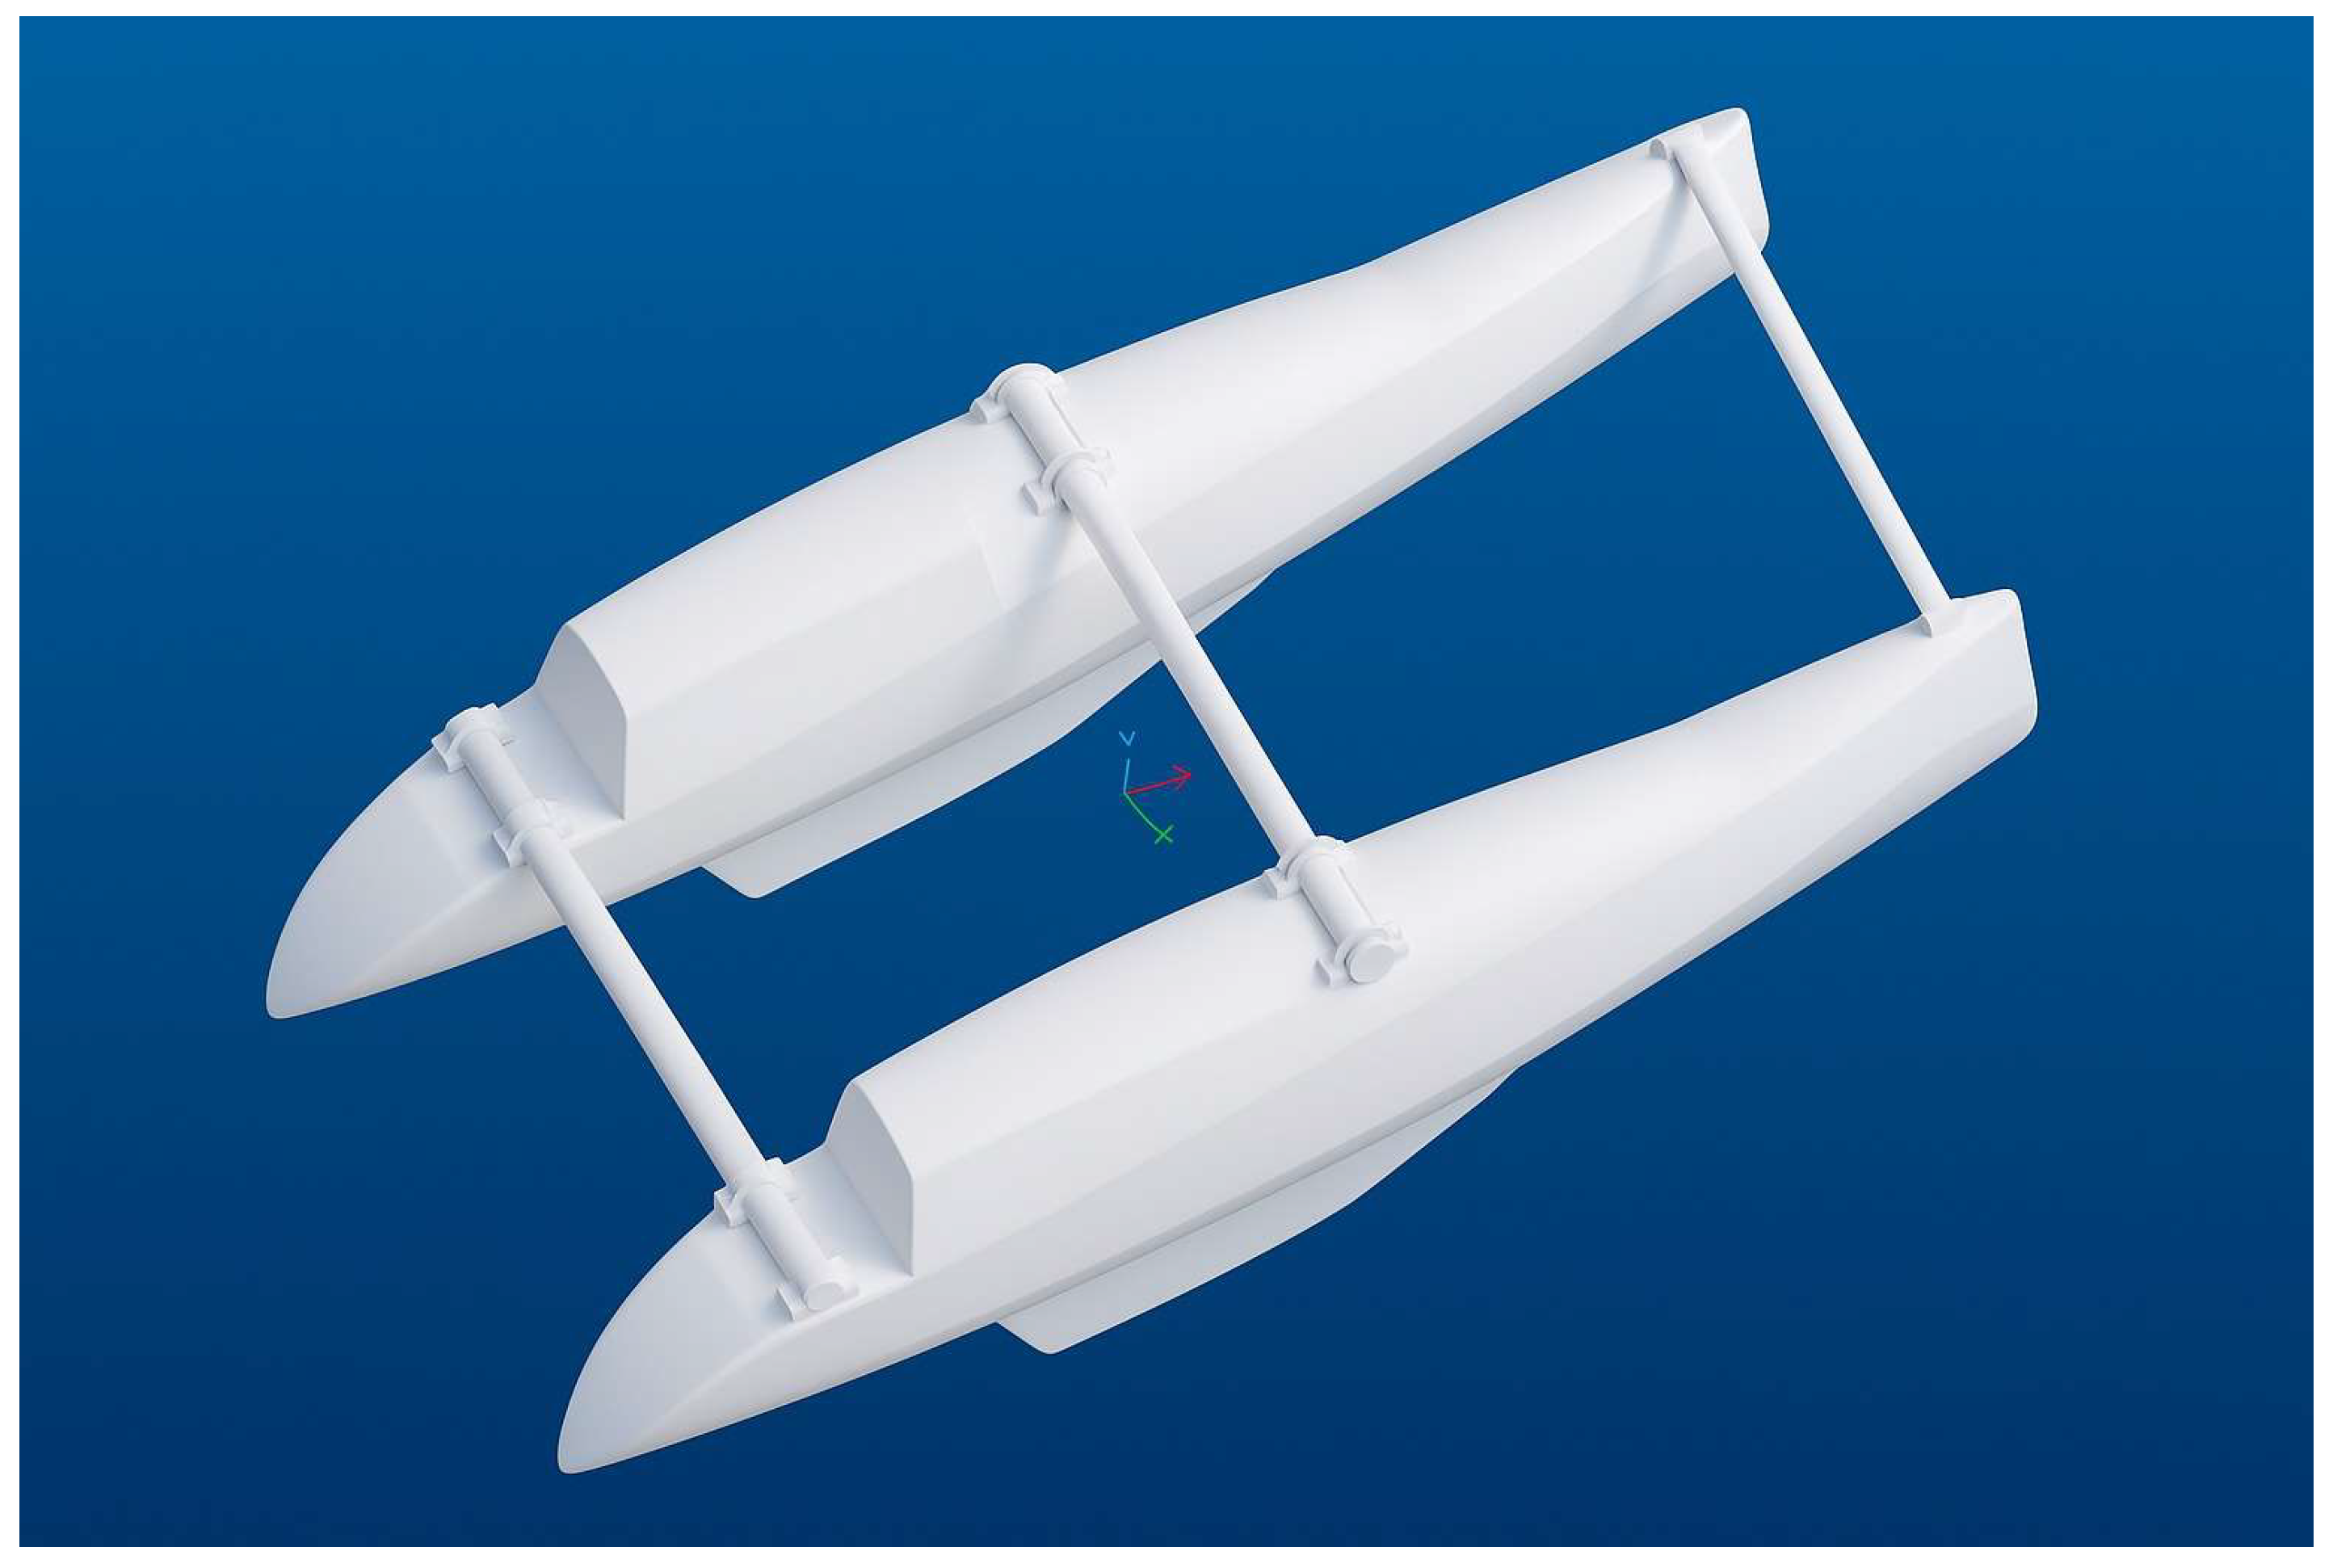
Section 6 shows how the materials are not very stressed, even under extreme conditions, with the exception of the connection area of the beams. Therefore, it was considered appropriate to optimize the model by replacing the connecting beams with structural bulkheads located in the main deck connecting the two hulls. In light of the proposed change, the main deck was no longer a separate part resting on the stern and middle beams; instead, it became a unified structure together with the two hulls. Figure 19 shows the proposed constructive solution.
By operating the proposed structural changes, the moments of inertia of the area resistant sections are greater than those of the beams (Table 7).
Following the proposed structural modifications—particularly the replacement of beam connections with continuous bulkheads integrated into the main deck—a new finite element analysis was conducted. The results are summarized in Table 8 and compared with the original configuration presented in Table 6. The optimized configuration leads to a general redistribution and reduction of stress peaks, especially under combined wind and wave action, which previously represented the most critical condition. In particular:
  • The maximum stress values in the optimized model are more uniformly distributed and no longer concentrated exclusively at the beam junctions.
  • The right bow, which experienced a peak stress of 130 N/mm2 in the original setup, now shows lower or comparable values due to the improved continuity and rigidity provided by the integrated bulkhead.
  • The bulkhead area, previously marked as “idle” (i.e., not contributing structurally), now actively participates in stress distribution, showing moderate stress levels (e.g., 15 N/mm2 under combined loading).
  • Displacements (Xmax, Ymax, Zmax) remain within acceptable limits, with marginal increases due to the more compliant—but better distributed—structural response.
These results confirm the effectiveness of the redrawing strategy in increasing the stiffness of the structure (as supported by the significant growth in the moment of inertia values shown in Table 7) while also enhancing the overall stress distribution. The new configuration is thus structurally more efficient, enabling potential material savings without compromising mechanical performance.
An additional advantage is the reduction in the number of components comprising the structure, which is a key aspect of optimization in naval design. It must be specified how the catamaran was constructed: for each hull, its lower part has been assembled to the superior one, then bulkheads, supports for the connecting beams, counterplans and the connecting beams were added. All the joining zones between the individual parts represent critical points for the boat where adequate stiffness must be guaranteed through careful stress analysis. In contrast, the optimized model features a significant innovation: the lower part of both hulls will be printed as a single piece with the lower part of the central structure, while the upper part of the hulls will be printed in one piece with the interior of the main deck. This redesign eliminates dangerous junction areas, improving overall structural integrity. Only the main deck and the bulkheads need to be added to these composite parts, resulting in a more efficient and robust construction.
In summary, the optimized model offers the following advantages:
  • Minimization of dangerous stress concentrations due to both the elimination of connecting beams and sharp edges; an essential factor in stress analysis that ensures enhanced structural integrity.
  • Material savings, in particular for the gluing coupling, resulting in reduced costs and lower inertial mass, with consequent reduction in stresses in the analysed cases of yaw rotation, asymmetrical slamming and static loads; this material optimization also benefits the composite structure by reducing unnecessary weight without compromising performance.
  • Reduction of the parts to be assembled after moulding, with consequent elimination of critical points such as the connecting elements between the individual constructive parts; this simplification enhances both the efficiency of assembly and the overall robustness of the vessel, aligning with modern naval design practices.
  • The use of the Creo software allows approaching fast prototyping and therefore an industrialized process able to eliminate the problems related to craftsmanship both in terms of precision in processing and in terms of time efficiency during production, aligning with optimization strategies.
  • Expanding the livable space of the multihull with a view to future use in the charter sector, contributing to a more user-friendly naval design in the long term.
This optimization can be further improved using a new OSYS (One Shot injection sYStem) technology which allows a saving of over 15% in terms of mass due to the specific technology. This technology allows the composite injection of structures, even sandwiches, simultaneously with the structures: it is possible to create the different skin components of the hull and deck as well as the structure (also closed structure profiles) and the different hull and deck parts; this allows the elimination of assembly costs both in terms of material and relative mass and in terms of labor since the product is made in a single injection. The OSYS lamination table is shown in Table 9.
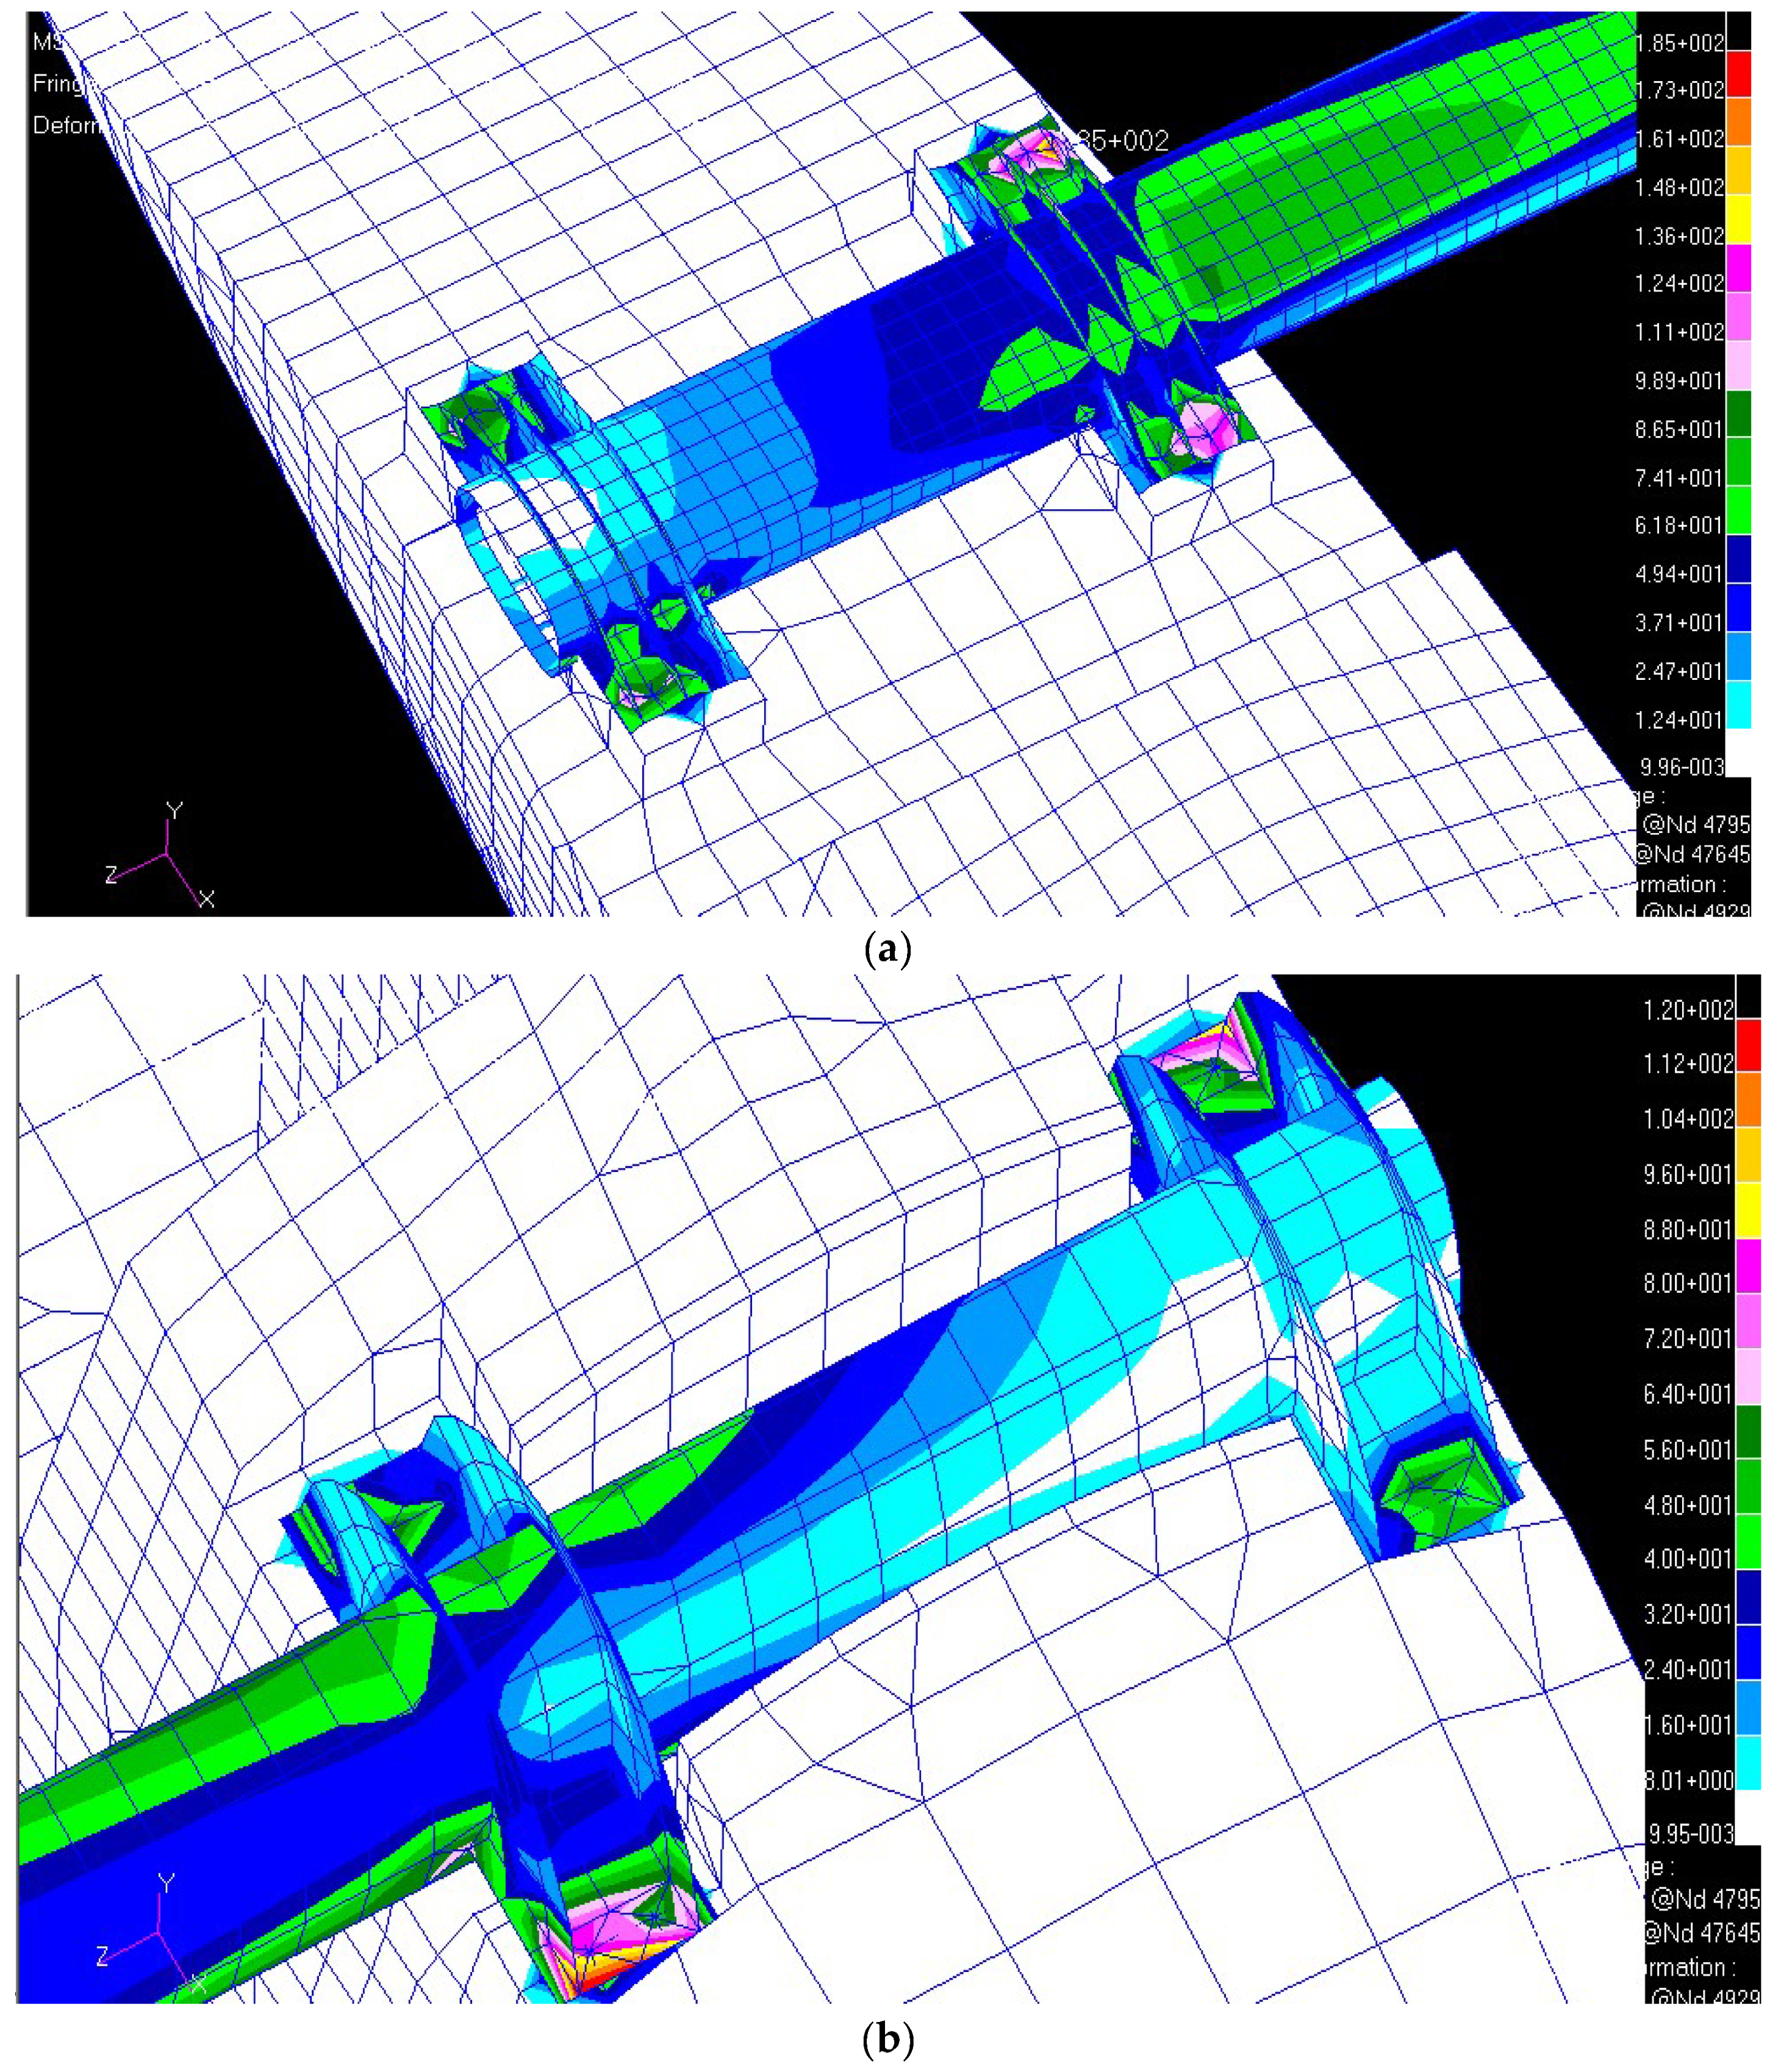
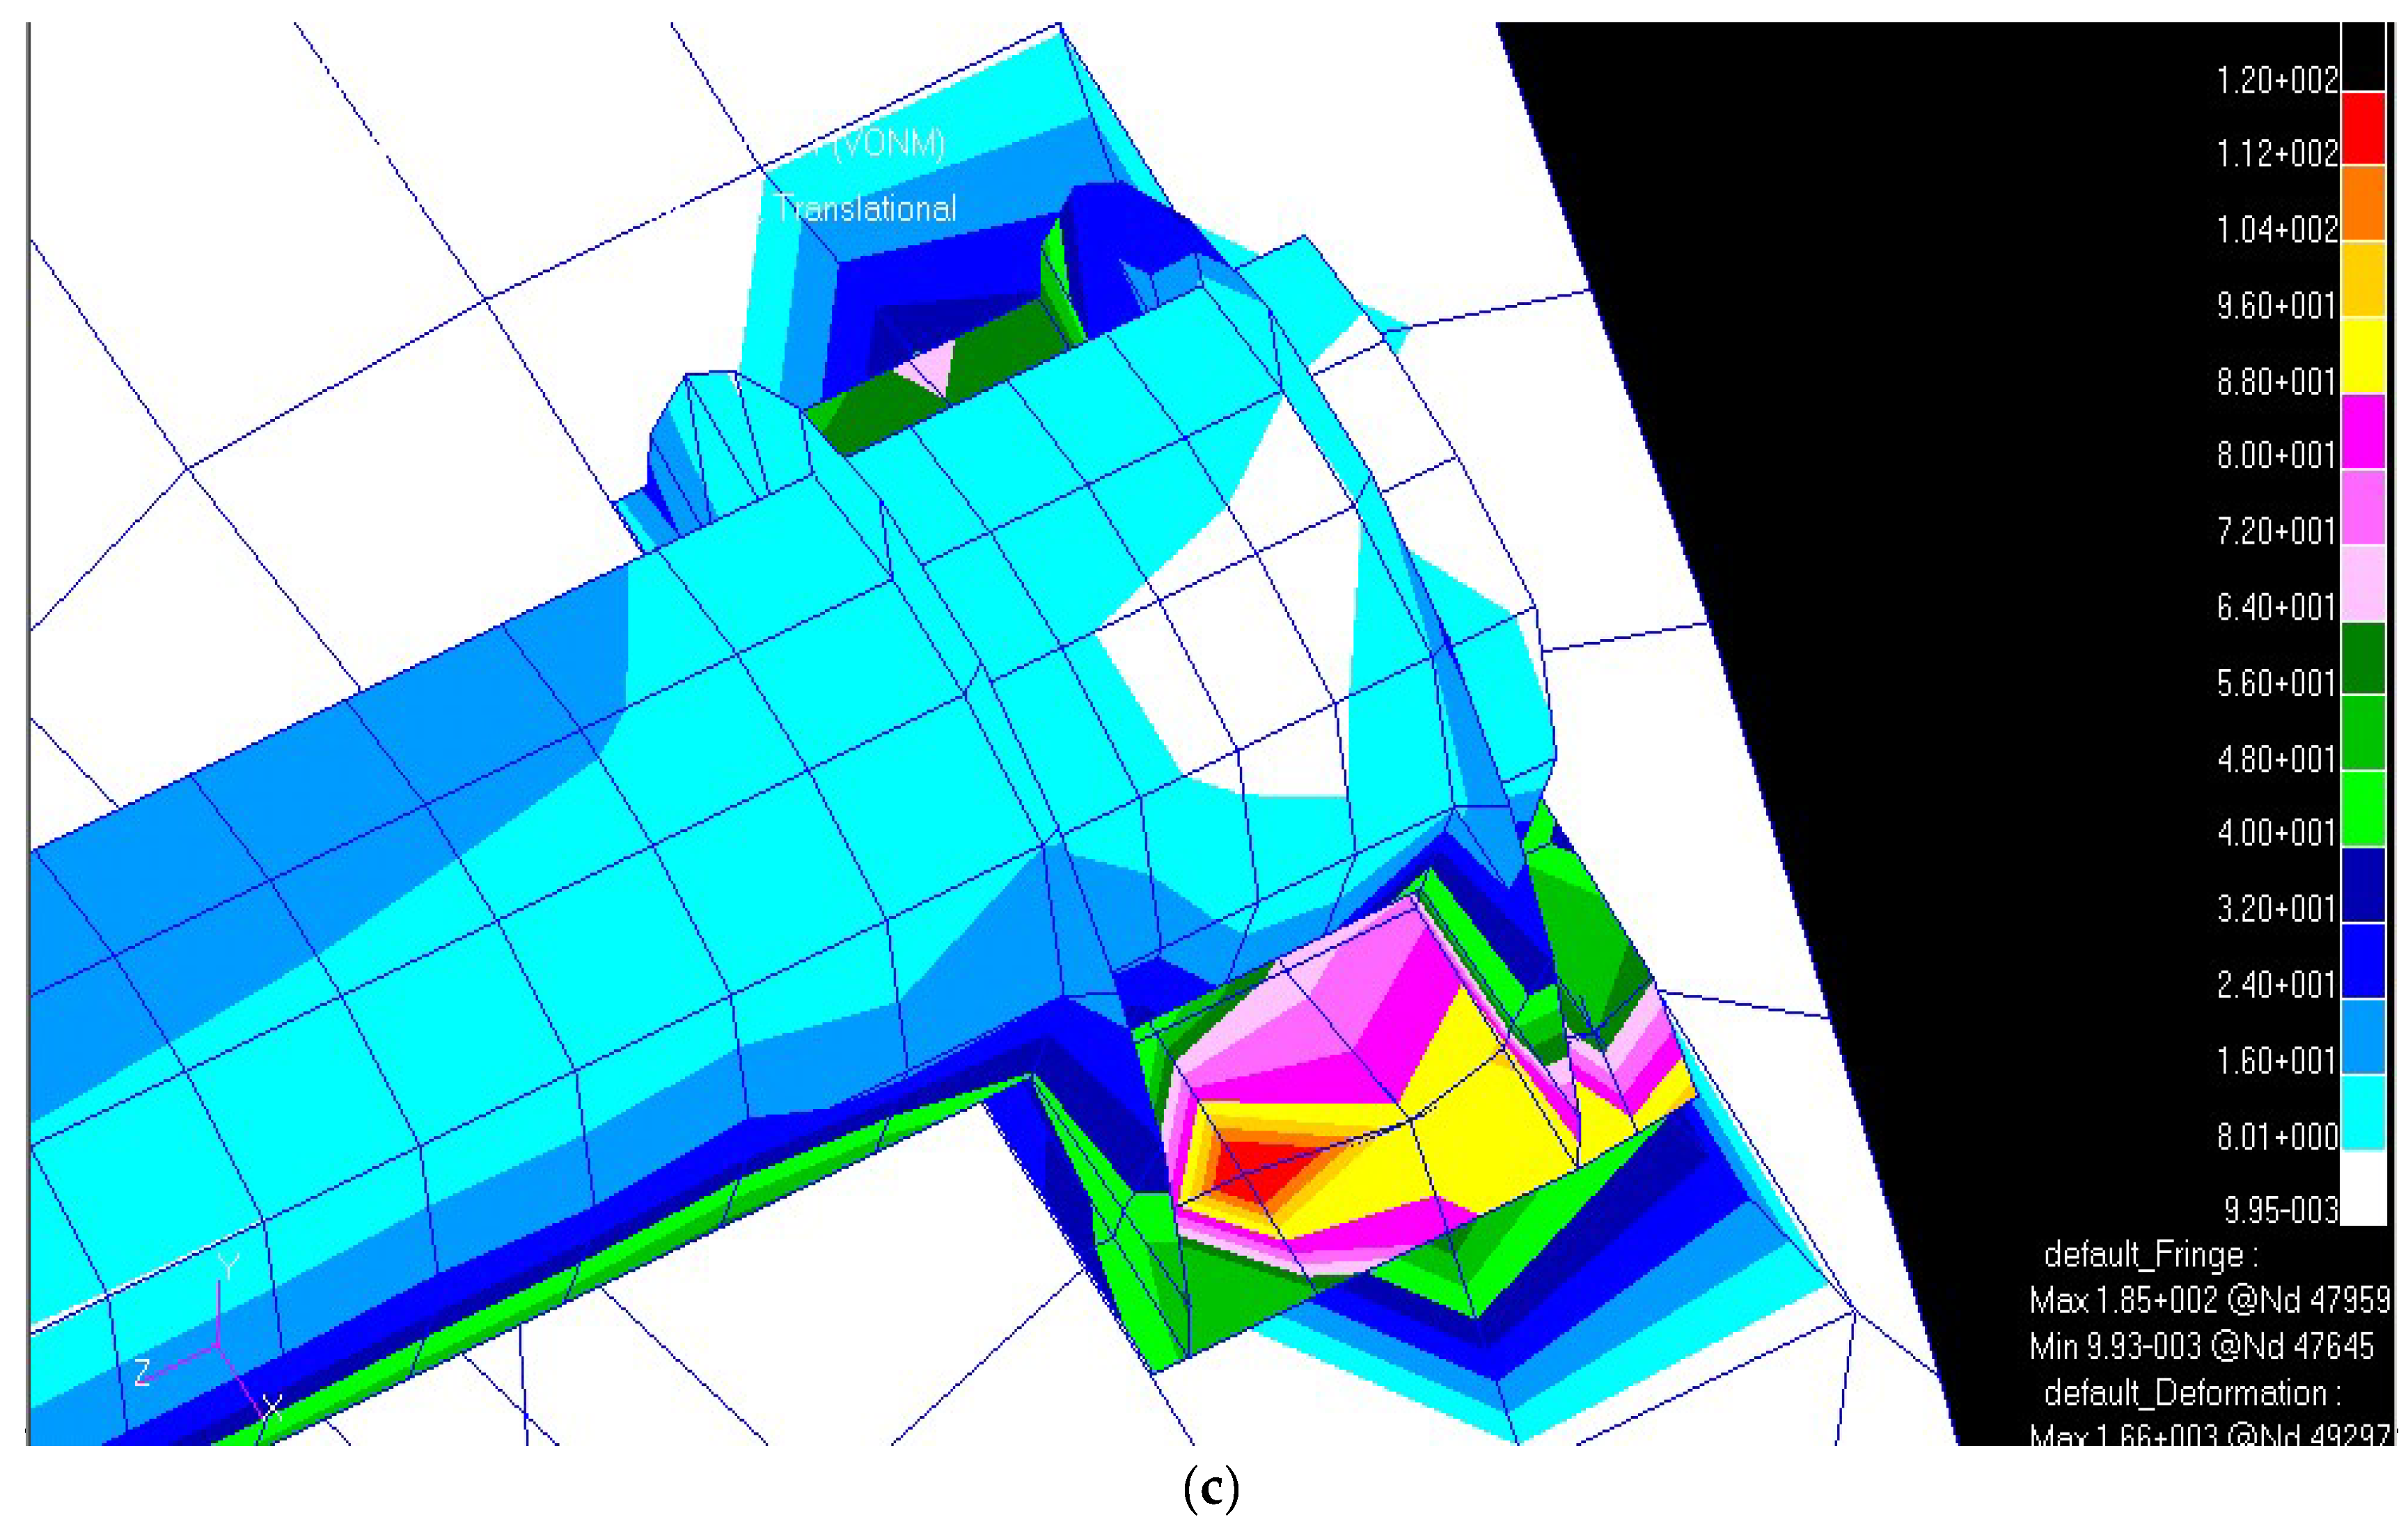
Lamination tables that utilize the patented technology demonstrate reductions in mass, offering substantial optimization in material usage. The structural analysis of Figure 20a–c, in terms of stress analysis under identical load conditions, shows that the structural resistance remains unchanged. This is primarily because the structural resistance was an input parameter in the calculation for applying the new technology, ensuring that the composite materials maintain their strength while achieving weight savings. This approach is particularly relevant in naval design, where optimizing both material performance and mass is crucial to enhance vessel efficiency. The figures of the non-optimized version are shown below to highlight the parts subject to stress concentration; thanks to the morphological redrawing, they are no longer present (i.e., therefore, a direct comparison is not possible).

8. Conclusions

This study focused on the need to analyze and optimize the mechanical behavior of a sailing catamaran, with particular emphasis on naval design principles. An initial literature review on multihull characteristics provided the theoretical foundation for the research. Subsequently, experimental tests were conducted in dry conditions to characterize the vessel’s stiffness and load-bearing behavior, serving as validation for a finite element model developed in Creo. The software proved effective for accurately replicating the geometry of the actual vessel, and careful attention was paid to defining material properties—particularly the 13-layer composite sandwich structure based on the provided lamination table.
The numerical model, calibrated by including the weights of the structure, mast, sails, and model itself, showed good agreement with the experimental results. Once validated, the model was used to simulate critical load scenarios, including wind loads, wave loads, and their combined effects. The most severe condition—the combination of wind and wave loads—was analyzed in detail. The stress analysis showed that even under extreme conditions, the structure operates well below the safety limits of the materials used. Significant stress concentrations were observed only at the beam attachment points, highlighting localized criticalities rather than systemic weaknesses. These results suggest that the current design likely exceeds structural requirements, leaving room for optimization, which can begin with a morphologic redrawing of the catamaran.
This opens the door to redesign strategies aimed at reducing the number of composite layers and refining the geometry—such as increasing radii at directional changes—to decrease stress concentrations. Such optimizations can reduce material use and production costs while maintaining or even improving safety and performance. These findings have clear implications for more efficient and cost-efficient catamaran manufacturing. Looking ahead, future developments may focus on integrating real-time structural health monitoring systems with the validated numerical model. Furthermore, applying the same methodology to different hull geometries and load cases could broaden the applicability of this approach, offering a robust framework for the structural redrawing of lightweight marine vessels in a variety of operating conditions.

Author Contributions

Conceptualization, G.M.G.; methodology, G.M.G.; software, M.B.; validation, D.A.; formal analysis, G.M.G. and F.L.S.; data curation, M.B., F.C. and D.A.; investigation, D.A.; resources, writing—original draft preparation, G.M.G., F.C. and F.L.S.; project administration, G.M.G. All authors have read and agreed to the published version of the manuscript.

Funding

This research received no external funding.

Data Availability Statement

The data presented in this study are available on request from the corresponding author.

Conflicts of Interest

The authors declare no conflicts of interest.

Appendix A

This appendix shows the relationships of the deformation provided by the Rosette strains on the directions of strain gauge grids (a, b and c):
ε a = ε x c o s 2 θ a + ε y s i n 2 θ a + γ x y c o s θ a s i n θ a ε b = ε x c o s 2 θ b + ε y s i n 2 θ b + γ x y c o s θ a s i n θ b ε c = ε x c o s 2 θ c + ε y s i n 2 θ c + γ x y c o s θ a s i n θ c
These equations provide the Cartesian components of the deformation (εx, εy, εxy), from which the main deformations (ε1, ε2) and their orientation (α) can be obtained:
ε 1 = ε x + ε y 2 + 1 2 ε x ε y 2 + γ x y 2 ε 2 = ε x + ε y 2 1 2 ε x ε y 2 + γ x y 2 g 2 α = γ x y ε x ε y
The value of the third main deformation component (ε3) was obtained from the values of ε1 and ε2:
ε 3 = ν 1 ν ε 1 + ε 2
Using the Von Mises criterion, the equivalent deformation value ( ε ¯ ) was obtained from the principal components.
ε ¯ = 2 3 ε 1 ε 3 2 + ε 1 ε 2 2 + ε 3 ε 2 2
Table A1. Results depending on different displacement coefficients.
Rosette 1
Forceεaεbεcεxεzγxzε1ε2ε3
7858.3−2.9−13.58.3−13.5−0.78.3−13.53.513.3
156910.8−4.8−19.510.8−19.5−1.010.8−19.55.818.7
235413.3−6.7−25.413.3−25.4−1.413.3−25.48.124.2
313816.1−8.9−32.116.1−32.1−1.816.1−32.110.730.5
392318.1−10.4−36.818.1−36.8−2.118.1−36.912.534.9
470720.6−12.3−42.820.6−42.8−2.520.6−42.814.840.5
522522.6−13.8−47.522.6−47.5−2.822.6−47.516.644.9
Rosette 2
Forceεaεbεcεxεyγxyε1ε2ε3
7857.72.5−3.67.7−3.61.07.7−3.6−2.77.2
15695.12.8−3.15.1−3.13.55.5−3.5−1.45.4
23542.63.0−2.62.6−2.66.14.0−4.00.04.6
3138−0.33.3−2.1−0.3−2.19.03.4−5.81.65.6
3923−2.33.5−1.7−2.3−1.711.03.5−7.52.77.1
4707−4.83.8−1.3−4.8−1.313.64.0−10.04.09.4
5225−6.84.0−0.9−6.8−0.915.64.5−12.25.111.3
Rosette 3
Forceεaεbεcεxεzγxzε1ε2ε3
78520.115.5−10.320.1−10.321.223.4−13.6−6.522.7
156930.924.1−16.030.9−16.033.236.2−21.3−9.935.2
235441.832.6−21.741.8−21.745.249.0−28.9−13.447.6
313854.042.3−28.254.0−28.258.863.5−37.6−17.261.7
392362.749.2−32.762.7−32.768.473.7−43.7−20.071.7
470773.557.7−38.473.5−38.480.484.5−51.4−23.484.1
522582.264.6−43.082.2−43.090.096.7−57.5−26.194.1
Rosette 4
Forceεaεbεcεxεzγxzε1ε2ε3
78512.45.4−1.712.4−1.70.012.4−1.7−7.111.7
156919.38.3−2.919.3−2.90.219.3−2.9−10.918.1
235426.211.2−4.226.2−4.20.326.2−4.2−14.724.6
313834.114.5−5.534.1−5.50.434.1−5.5−19.031.9
392339.616.8−6.539.6−6.50.539.6−6.5−22.037.0
470746.519.7−7.746.5−7.70.646.5−7.7−25.843.5
522552.022.0−8.752.0−8.70.752.0−8.7−28.948.6
Rosette 5
Forceεaεbεcεxεyγxyε1ε2ε3
78517.15.1−8.017.1−8.01.117.1−8.0−6.116.18
156924.88.0−10.224.8−10.21.524.8−10.2−9.723.19
235432.410.9−12.432.4−12.41.832.4−12.4−13.430.24
313841.114.2−14.941.1−14.92.241.1−14.9−17.538.24
392347.216.6−16.647.2−16.62.547.2−16.6−20.443.91
470754.919.5−18.854.9−18.82.854.9−18.8−24.150.99
522561.021.8−20.561.0−20.53.161.0−20.5−27.056.65
Rosette 6
Forceεaεbεcεxεyγxyε1ε2ε3
7850.6−0.2−0.90.6−0.90.00.6−0.90.20.92
15696.62.0−3.06.6−3.00.46.6−3.0−2.46.21
235412.64.1−5.112.6−5.10.712.6−5.1−5.011.77
313819.46.5−7.419.4−7.41.019.4−7.4−8.018.08
392324.28.2−9.024.2−9.01.324.2−9.0−10.122.54
470730.210.4−11.130.2−11.11.630.2−11.1−12.728.11
522535.012.1−12.835.0−12.81.935.0−12.8−14.832.57

References

  1. Rasmussen, J. Structural Design of Sandwich Structures. Ph.D. Thesis, Technical University of Denmark, Kongens Lyngby, Denmark, 1989. [Google Scholar]
  2. Baatrup, J. Structural Analysis of Maritime Structures. Ph.D. Thesis, Technical University of Denmark, Kongens Lyngby, Denmark, 1990. [Google Scholar]
  3. Satish Kumar, Y.V.; Mukhopadhyay, M. Finite element analysis of ship structures using a new stiffened plate element. Appl. Ocean. Res. 2000, 22, 361–374. [Google Scholar] [CrossRef]
  4. Mackney, M.D.A.; Ross, C.T.F. Preliminary Ship Design Using One and Two-Dimensional Models. Mar. Technol. 1999, 36, 102–112. [Google Scholar] [CrossRef]
  5. Rao, T.V.S.R.A.; Iyer, N.R.; Rajasankar, J.; Palani, G.S. Dynamic response analysis of ship hull structures. Mar. Technol. 2000, 37, 117–128. [Google Scholar] [CrossRef]
  6. Horsmon, A.W. Lightweight composites for heavy-duty solutions. Mar. Technol. 2001, 38, 112–115. [Google Scholar] [CrossRef]
  7. Korobkin, A. Elastic response of catamaran wetdeck to liquid impact. Ocean Eng. 1998, 25, 687–714. [Google Scholar] [CrossRef]
  8. Wei, P.; Li, C.; Jiang, Z.; Wang, D. Real-time digital twin of ship structure deformation field based on the inverse finite element method. J. Mar. Sci. Eng. 2024, 12, 257. [Google Scholar] [CrossRef]
  9. VanDerHorn, E.; Wang, Z.; Mahadevan, S. Towards a digital twin approach for vessel-specific fatigue damage monitoring and prognosis. Reliab. Eng. Syst. Saf. 2022, 219, 108222. [Google Scholar] [CrossRef]
  10. Neşer, G. Polymer Based Composites in Marine Use: History and Future Trends. Procedia Eng. 2017, 194, 19–24. [Google Scholar] [CrossRef]
  11. Hermundstad, O.A.; Aarsnes, J.V.; Moan, T. Hydroelastic analysis of a flexible catamaran and comparison with experiments. In Proceedings of the FAST’95: Third International Conference on Fast Sea Transportation, Lubeck-Travemunde, Germany, 25–27 September 1995. [Google Scholar]
  12. Ali-Lavroff, J.; Davis, M.R.; Holloway, D.; Thomas, G. The Whipping Vibratory Response of a Hydroelastic Segmented Catamaran Model. In Proceedings of the Ninth International Conference on Fast Sea Transportation, Shanghai, China, 23–27 September 2007. [Google Scholar]
  13. Cook, S.; Couser, P.; Klaka, K. Investigations into wave loads on Catas. In Proceedings of the Hydrodinamics of High Speed Craft Conference (RINA), London, UK, 24–25 November 1999. [Google Scholar]
  14. Silva-Campillo, A.; Pérez-Arribas, F.; Suárez-Bermejo, J.C. Health-monitoring systems for marine structures: A review. Sensors 2023, 23, 2099. [Google Scholar] [CrossRef]
  15. Detection of Safety Critical Cracks and Corrosion in Ships Using Novel Sensors and Systems Based on Ultrasonic Linear Phased Array Technology (SHIP INSPECTOR). Available online: https://cordis.europa.eu/project/id/218432/reporting (accessed on 3 November 2022).
  16. Kvalsvold, J.; Faltinsen, O.M. Hydroelastic modeling of wet deck slamming on multihull vessels. J. Ship Res. 2021, 39, 225–239. [Google Scholar] [CrossRef]
  17. Thomas, G. Wave Slam Response of Large High-Speed Catamarans. Ph.D. Thesis, University of Tasmania, Hobart, Australia, 2003. [Google Scholar]
  18. Varyani, K.S.; Gatiganti, R.M.; Gerigk, M. Motions and slamming impact on catamaran. Mar. Technol. 2000, 27, 729–747. [Google Scholar] [CrossRef]
  19. Ward, L.W. Sailboat Bow IMPact Stresses. In Proceedings of the SNAME 7th Chesapeake Sailing Yacht Symposium, Annapolis, MD, USA, 19 January 1985. [Google Scholar]
  20. Brown, K.C.; Joubert, P.N.; Yan, P. Tests on Yacht Hull Plating. Mar. Technol. 1996, 33, 130–140. [Google Scholar] [CrossRef]
  21. Sugianto, E.; Chen, J.-H.; Permadi, N.V.A. Effect of monohull type and catamaran hull type on ocean waste collection behavior using OpenFOAM. Water 2022, 14, 2623. [Google Scholar] [CrossRef]
  22. Korvin-Kroukovsky, B.V.; Jacobs, W.R. Pitching and Heaving Motions of a Ship in Regular Waves. Trans. SNAME 1957, 65, 88. [Google Scholar] [CrossRef]
  23. Gerritsma, J.; Beukelman, W. Analysis of the modified strip theory for the calculation of ship motions and wave bending moments. Int. Shipbuild. Prog. 1967, 14, 319–337. [Google Scholar] [CrossRef]
  24. Söding, H. Eine Modifikation der Streifen-methode. Schiffstechnik 1969, 16. [Google Scholar]
  25. Salvesen, N.; Tuck, E.O.; Faltinsen, O.M. Ship motions and sea loads. Trans. Soc. Nav. Archit. Mar. Eng. 1970, 78. [Google Scholar]
  26. Grande, K. Prediction of Slamming Occurrence of Catamarans. Ph.D. Thesis, Curtin University, Bentley, Australia, 2002. [Google Scholar]
  27. Lu, T.; Wang, J.; Liu, K.; Zhao, X. Experimental and numerical prediction of slamming impact loads considering fluid–structure interactions. J. Mar. Sci. Eng. 2024, 12, 733. [Google Scholar] [CrossRef]
  28. Chen, Z.; Jiao, J.; Wang, Q.; Wang, S. CFD-FEM simulation of slamming loads on wedge structure with stiffeners considering hydroelasticity effects. J. Mar. Sci. Eng. 2022, 10, 1591. [Google Scholar] [CrossRef]
  29. Fang, C.; Chan, H.S.; Incecik, A. Investigation of motions of catas in regular waves. Ocean. Eng. 1996, 23, 89–105. [Google Scholar] [CrossRef]
  30. Rubino, F.; Nisticò, A.; Tucci, F.; Carlone, P. Marine application of fiber reinforced composites: A Review. J. Mar. Sci. Eng. 2020, 8, 26. [Google Scholar] [CrossRef]
Figure 1. Trend of heeling moment.
Jmse 13 01270 g001
Figure 2. Immersion curve.
Jmse 13 01270 g002
Figure 3. Immersion of the hulls as a function of the heeling angle (α deg.).
Jmse 13 01270 g003
Figure 4. Diagram of righting and heeling moments.
Jmse 13 01270 g004
Figure 5. (a) The catamaran lifted for the load tests; (b) catamaran support positioning; (c) detail of catamaran support.
Jmse 13 01270 g005
Figure 6. Pneumatic actuator.
Jmse 13 01270 g006
Figure 7. Pneumatic circuit.
Jmse 13 01270 g007
Figure 8. (a) Arrangement of the strain gauge rosettes; (b) schematic drawing of the displacement sensors positioning.
Jmse 13 01270 g008
Figure 9. (a) Detail view of strain gauge positioning of the back beam; (b) of the front beam; (c) on the hull connection with beam area.
Jmse 13 01270 g009
Figure 10. (a) Overview of telescopic beams with comparators; (b) detail of the comparator as red-circled in (a).
Jmse 13 01270 g010
Figure 11. Displacement laser sensor and its target.
Jmse 13 01270 g011
Figure 12. Experimental elongation under different load conditions.
Jmse 13 01270 g012
Figure 13. Displacements from laser sensors system in the different positions (a) L1; (b) L2; (c) L3; (d) L4; (e) C1; (f) C2. The y-axis uses Italian-style decimal formatting (comma as decimal separator).
Jmse 13 01270 g013
Figure 14. FEA model using Creo software with the detail of the x-axis (red), y-axis (green), z-axis (cyan).
Jmse 13 01270 g014
Figure 15. Comparison between numerical (FEA) and experimental (laser) displacements, in the different positions (a) L1; (b) L2; (c) L3; (d) L4; (e) C1; (f) C2. The y-axis uses Italian-style decimal formatting (comma as decimal separator).
Jmse 13 01270 g015
Figure 16. Vertical displacements under wind action.
Jmse 13 01270 g016
Figure 17. Displacements along ship axis (y) under wave action.
Jmse 13 01270 g017
Figure 18. Displacements along ship axis (y) under joint action of wind and wave.
Jmse 13 01270 g018
Figure 19. An overview of the optimized model with the detail of the x-axis (red), y-axis (green), z-axis (cyan).
Jmse 13 01270 g019
Figure 20. (a) A detail of the stress analysis in the stern hull–beam coupling; (b) A detail of the stress analysis in the front hull–beam coupling; (c) A detail of the stress analysis in the central hull–beam coupling.
Jmse 13 01270 g020aJmse 13 01270 g020b
Table 1. Loads in dependence on the air pressure.
Pressure (bar)01234566.66
Force (N)0785156923543138392347075225
Table 2. Displacements in dependence on air pressure (loads) and time.
F0(N)785156923543138392347075225
s (t = 5 min)(mm)14.4828.9744.4460.9072.9187.8999.85
s () = F0/k(mm)14.52944.5617388100
k(N/mm)54.1454.1052.9051.4453.7453.4952.25
Table 3. Displacement speed in dependence on air pressure (loads) and time.
F0(N)785156923543138392347075225
F0/η*(mm/min)19.0439.6759.0978.3197.51118.42130.10
η*(N·min/mm)41.2339.5539.8440.0740.2339.7540.16
Table 4. Results depending on different displacement coefficients.
Rosette 1Rosette 2Rosette 3Rosette 4Rosette 5Rosette 6
Force
78513.37.222.711.716.180.92
156918.75.435.218.123.196.21
235424.24.647.624.630.2411.77
313830.55.661.731.938.2418.08
392334.97.171.737.043.9122.54
470740.59.484.143.550.9928.11
522544.911.394.148.656.6532.57
Table 5. Sandwich lamination table.
MaterialsDensityYoung’s ModulusThickness
2024-T3 Aluminum2770 kg/m375,000 MPa7–20 mm
Wood370 kg/m310,000 MPa20 mm
Sandwich
Mat370 kg/m342,000 MPa0.6 mm
Biaxial1200 kg/m342,000 MPa0.6 mm/0–90°
Biaxial1200 kg/m342,000 MPa0.6 mm/±45°
Biaxial1200 kg/m342,000 MPa0.6 mm/0–90°
Biaxial1200 kg/m342,000 MPa0.6 mm/±45°
Mat1200 kg/m342,000 MPa0.6 mm
Airex70 kg/m357 MPa20 mm
Mat1200 kg/m342,000 MPa0.6 mm
Biaxial1200 kg/m342,000 MPa0.6 mm/0–90°
Biaxial1200 kg/m342,000 MPa0.6 mm/±45°
Biaxial1200 kg/m342,000 MPa0.6 mm/0–90°
Biaxial1200 kg/m342,000 MPa0.6 mm/±45°
Mat1200 kg/m342,000 MPa0.6 mm
Table 6. Summary of stress values under wind, wave and wind/wave action.
Wind Action
Xmax = 11 mm (right deck)Ymax = 720 mm (right stern)Zmax = 10 mm (right drift)
Maximum stress = 117 N/mm2 (bolting of right bow)
Bolting stress values
Left bow45 N/mm2Right bow117 N/mm2
Left middle part35 N/mm2Right middle part30 N/mm2
Left stern30 N/mm2Right stern75 N/mm2
Bulkheadsidle
Wave Action
Xmax = 37 mm (right deck)Ymax = 920 mm (right stern)Zmax = 102 mm (left drift)
Maximum stress = 175 N/mm2 (bolting of left bow)
Bolting stress values
Left bow175 N/mm2Right bow50 N/mm2
Left middle part90 N/mm2Right middle part75 N/mm2
Left stern35 N/mm2Right stern105 N/mm2
Bulkheadsidle
Wind/Wave Action
Xmax = 47.7 mm (right deck)Ymax = 1640 mm (right stern)Zmax = 156 mm (left keel)
Maximum stress = 185 N/mm2 (bolting of left bow)
Bolting stress values
Left bow100 N/mm2Right bow130 N/mm2
Left middle part85 N/mm2Right middle part80 N/mm2
Left stern55 N/mm2Right stern185 N/mm2
Bulkheads15 N/mm2
Table 7. Comparison between moments of inertia of resistant section areas corresponding to the ante and post-change configurations.
Middle part beam
F40 Moment of inertiaMoment of inertia optimized
46.000 cm4720.000 cm4
Stern beam
F40 Moment of inertiaMoment of inertia optimized
35.357 cm447.000 cm4
Table 8. Summary of stress values under wind, wave and wind/wave action for the optimized model.
Wind Action
Xmax = 11 mm (right deck)Ymax = 720 mm (right stern)Zmax = 10 mm (right drift)
Maximum stress = 117 N/mm2 (bolting of right bow)
Bolting stress values
Left bow45 N/mm2Right bow117 N/mm2
Left middle part35 N/mm2Right middle part30 N/mm2
Left stern30 N/mm2Right stern75 N/mm2
Bulkheadsidle
WAVE ACTION
Xmax = 37 mm (right deck)Ymax = 920 mm (right stern)Zmax = 102 mm (left drift)
Maximum stress = 175 N/mm2 (bolting of left bow)
Bolting stress values
Left bow175 N/mm2Right bow50 N/mm2
Left middle part90 N/mm2Right middle part75 N/mm2
Left stern35 N/mm2Right stern105 N/mm2
Bulkheadsidle
WIND/WAVE ACTION
Xmax = 47.7 mm (right deck)Ymax = 1640 mm (right stern)Zmax = 156 mm (left keel)
Maximum stress = 185 N/mm2 (bolting of left bow)
Bolting stress values
Left bow100 N/mm2Right bow130 N/mm2
Left middle part85 N/mm2Right middle part80 N/mm2
Left stern55 N/mm2Right stern185 N/mm2
Bulkheads15 N/mm2
Table 9. The play book for composite sandwich applying the OSYS.
MaterialDensityElastic ModuleThickness
Alluminium 2024-T32770 kg/m375,000 MPa7–20 mm
Wood370 kg/m310,000 MPa20 mm
Sandwich
Mat370 kg/m342,000 MPa0.6 mm
UniD 0°1200 kg/m342,000 MPa0.6 mm/0–90°
UniD 90°1200 kg/m342,000 MPa0.6 mm/±45°
UniD-45°1200 kg/m342,000 MPa0.6 mm/0–90°
UniD 45°1200 kg/m342,000 MPa0.6 mm/±45°
Mat1200 kg/m342,000 MPa0.6 mm
Airex70 kg/m357 MPa20 mm
Mat1200 kg/m342,000 MPa0.6 mm
UniD 0°1200 kg/m342,000 MPa0.6 mm/0–90°
UniD 90°1200 kg/m342,000 MPa0.6 mm/±45°
UniD-45°1200 kg/m342,000 MPa0.6 mm/0–90°
UniD 45°1200 kg/m342,000 MPa0.6 mm/±45°
Mat1200 kg/m342,000 MPa0.6 mm
Disclaimer/Publisher’s Note: The statements, opinions and data contained in all publications are solely those of the individual author(s) and contributor(s) and not of MDPI and/or the editor(s). MDPI and/or the editor(s) disclaim responsibility for any injury to people or property resulting from any ideas, methods, instructions or products referred to in the content.

