Abstract
Currently, hydrodynamic models for bay and estuarine systems involve many parameters that require proper calibration to design coastal structures effectively. However, in coastal regions with limited data availability, the implementation of such models becomes challenging. This research introduces a simplified hydrodynamic methodology designed to analyse the impact of hydraulic control structures in shallow waters. This approach offers a computationally efficient alternative that allows engineers to rapidly evaluate the impact of horizontal and vertical constrictions in shallow waters experiencing wave propagation. A practical application is demonstrated in a one-dimensional channel with a length of 200,000 m and an average depth of 5 m. The only parameter required for calibration in the proposed methodology is bed friction. The three analysed scenarios—longitudinal constriction, plan-view constriction, and the influence of bed friction—demonstrate the model’s sensitivity to these variations, highlighting its reliability as a decision-making tool for coastal engineering projects. Moreover, the comparison of the proposed hydrodynamic simulation methodology at the stabilised tidal inlet structure in Cartagena de Indias, Colombia, demonstrated its ability to reproduce observed water levels accurately, reinforcing its reliability and potential for broader application.
1. Introduction
Coastal engineering is a branch of civil engineering concerned with the study, design, and management of infrastructure along coastal zones, which is a constantly evolving field [1,2,3]. This field heavily relies on hydrodynamic models, which are essential for analysing the interactions between the sea and various water bodies, such as bays and lagoons [4,5,6]. Recently, these models have become increasingly sophisticated, incorporating more parameters. As a result, they now require extensive and high-quality datasets for proper calibration. Hydrodynamic models have been successfully applied worldwide when such field data are available.
In this context, Delft3D V4.05.01—developed by Deltares in The Netherlands—uses a structured grid to simulate hydrodynamic processes in bays and estuarine systems [7,8,9]. Likewise, the Danish company DHI has developed MIKE 21 and MIKE 3 for two- and three-dimensional hydrodynamic simulations, respectively [10]. These software tools require an appropriate selection of a Courant number below 1 to maintain numerical stability and ensure model efficiency [11,12,13]. In addition, several Ibero-American countries employ the Coastal Modelling System [14,15], developed by the University of Cantabria, for coastal analysis—particularly because it is freely available.
These models have been employed in the analysis of various coastal engineering structures. Such structures are central to the planning and implementation of civil engineering projects, often representing substantial public and private investment [16]. Their dimensions, therefore, play a crucial role in determining a project’s technical and economic viability. If a hydrodynamic model is not sensitive to changes in these control structures, its practical value from an engineering standpoint is limited. Schlüter et al. (2020) [17] emphasised the importance of sea–coast–river interactions in the planning and designing of coastal engineering works in shallow waters, highlighting their relevance from a governance perspective.
One of the main challenges in hydrodynamic modelling—particularly in developing countries with constrained national budgets—is the limited data availability for model calibration. Consequently, engineers and designers are often forced to assume a wide range of parameters when simulating coastal environments. Given the importance of hydraulic control structures in coastal infrastructure, mathematical models must offer sufficient reliability concerning the calibration data. In this regard, channels influenced by tidal action are frequently studied for planning and construction purposes.
A key difficulty in discretising hydrodynamic models for estuarine and bay systems lies in representing hydraulic control structures. These typically include communication channels between the sea and water bodies, flow regulation gates, bridge-induced constrictions, and flow and navigation channels within estuaries.
Tidal propagation through estuarine channels has been extensively studied using field measurements. Upon entering estuarine systems, the tidal wave undergoes significant distortion due to bottom friction and channel geometry, leading to attenuation and asymmetry between ebb and flood currents. These effects are critical to understanding the transport of dissolved and suspended substances. Studies have investigated tidal modulation due to constrictions at sea–lagoon connections [18] and the role of bottom friction. Ippen (1966) [19] analysed tidal dynamics in rectangular channels with gradual variations in width and depth, both with and without friction, and proposed analytical solutions for predicting water levels and velocities under specific hydrodynamic conditions. The Automated Coastal Engineering System [20] includes a hydraulic computation module that estimates sea-bay connections’ flow rates and water levels. Prandle & Rahman (1980) [21] proposed a novel theory for determining the tidal response in estuaries influenced by barriers, assuming potential-type variations in channel geometry.
Coastal and estuarine zones exhibit complex dynamics governed by hydrodynamic processes such as tides, waves, currents, and flows induced by water level differences—all significantly influenced by hydraulic control structures. These structures—including sea-bay communication channels, sluice gates, bridges, and navigation routes—are fundamental to coastal infrastructure development. Simplified schemes have been developed as more accessible alternatives to complex hydrodynamic models to simulate wave propagation in shallow waters.
In this regard, Leendertse (1967) [22] developed a pioneering computational model to analyse the propagation of long-period waves in coastal zones. Using finite difference methods, Leendertse (1967) [22] demonstrated that wave motion in shallow waters could be effectively modelled through implicit numerical integration. This approach enabled the direct computation of water levels and velocities at each time step, offering numerical stability in long-wave simulations.
Recently, the authors proposed a simplified simulation methodology for hydrodynamic modelling in bays and estuarine systems [23], tailored explicitly to shallow waters. The approach employs an explicit scheme based on linear theory and uses an explicit matrix formulation, allowing for more straightforward computations than traditional complex models. The methodology has been validated in the stabilised tidal inlet structure in Cartagena de Indias (Colombia), demonstrating rapid convergence with real-world data and sensitivity to the bed friction coefficient [4,23].
In this context, the present research introduces a simplified methodology to incorporate the impact of hydraulic control structures into the previously developed hydrodynamic methodology simulations in shallow water by the authors [23]. This approach aims to balance physical accuracy with computational efficiency, facilitating practical application in preliminary coastal engineering studies, particularly during budgeting phases of real-world projects. By incorporating transmission and reflection coefficients, water level adjustments, and bottom friction corrections, the methodology accounts for depth and width constrictions within channels, enabling sensitivity analysis of system behaviour under different hydraulic configurations. The proposed methodology is sensitive to variations in constrictions, whether in depth or width, demonstrating its applicability to real-world projects. It offers a practical tool for sizing coastal infrastructure, particularly in locations where data availability is limited.
2. Theory and Method
This section outlines implementing hydraulic effects associated with coastal engineering structures to simulate wave behaviour in shallow waters. Particularly, the solution of a one-dimensional channel is analysed considering scenarios involving interconnection pathways between the sea and bays or estuaries, flow regulation gates, constrictions due to bridges, flow circulation, and navigation channels within shallow estuarine systems.
The authors have developed a simulation methodology for hydrodynamic modelling in bay and estuarine environments [23], based on the following assumptions [22,24,25,26]: water density is considered uniform throughout the system; no vertical stratification of the water column is accounted for; water is treated as an incompressible phase; the Eulerian approach to mass and momentum conservation is applied under the assumption of an ideal, inviscid fluid; and the model adheres to the shallow water approximation, assuming the applicability of long-wave theory.
2.1. Governing Equations
The authors have developed a simplified simulation methodology for hydrodynamic modelling in shallow waters, as shown in Arrieta-Pastrana et al. (2025) [23]. Particularly, the proposed methodology is based on the law of conservation of momentum described by the following formulas:
And the mass conservation equation is:
where, u, v, and w are water velocities in x, y, and z, respectively, and ρ = water density.
The general governing equations in this publication can be applied to different geometrical configurations of water bodies (see Figure 1a). In this research, a one-dimensional channel can be modelled using a rectangular discretisation, as illustrated in Figure 1b. Depending on the orientation of the one-dimensional channel—either vertical or horizontal—it is only possible to assign a water level boundary condition on the west or south side, respectively.
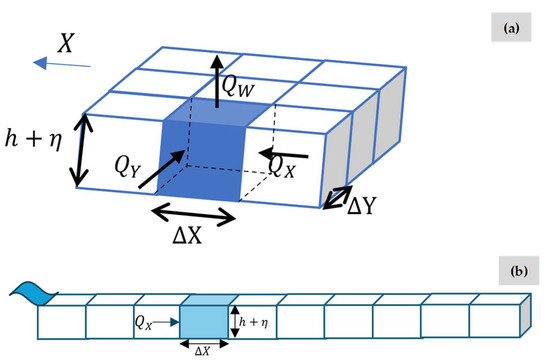
Figure 1.
3D scheme of a discretisation: (a) general scheme; and (b) in a one-dimensional channel.
The solution for a one-dimensional channel corresponds to an explicit method previously developed by the authors. Accordingly, the explicit formulation for a horizontal orientation is given by the authors [23]:
where, = flow in the main direction of the channel, = water surface level in the -axis, = flow area in the -axis (), = mean water depth, = water level, = time step, and are the size steps, = resistance coefficient, = time, = gravitational acceleration, and = . Details of the demonstration of Equation (3) can be found in Arrieta-Pastrana et al. (2025) [23].
2.2. Hydraulic Control Structures
One of the main challenges in discretising a hydrodynamic model is the representation of hydraulic control structures. The most common examples include communication channels between the sea and bays or estuaries, flow regulation gates, constrictions due to bridges, and flow circulation or navigation channels within shallow estuarine environments. The equations presented in this section can be used in complex shapes of water bodies; however, practical applications are conducted in a one-dimensional channel.
These coastal structures are central to civil engineering projects and often involve substantial investment from governments and the wider community. As such, their dimensions play a critical role in determining the project’s feasibility from both technical and economic perspectives. If the model fails to account for the sensitivity to variations in these control structures, it risks losing its engineering relevance.
In this study, a methodology is developed for implementing equations that represent various boundary conditions associated with coastal structures.
The proposed simulation approach is well-suited to model various hydraulic structures within a one-dimensional channel or other water bodies.
2.2.1. Channel Located Between the Sea and the Bay
Figure 2 shows a communication channel between the sea and the bay, featuring horizontal and vertical constrictions (which could be a bridge or another structure).

Figure 2.
Abrupt transition in an open channel: (a) longitudinal profile; and (b) plan view.
Considering the transmission and reflection coefficients of a long wave passing through an abrupt transition, as defined by Tang et al. (2024) [25], then:
where, = transmission coefficient, = Reflection coefficient, = Wave celerity, and = widths before and after a constriction, and and = depths before and after a constriction.
Figure 3 presents a schematic representation of a one-dimensional channel connecting the sea and a bay, in which Sections 0, 1, and 2 are identified.
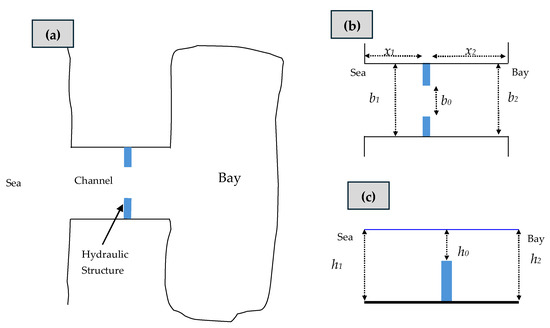
Figure 3.
Schematic representation of a channel between a sea and bay, featuring vertical and horizontal constrictions: (a) general plan view; (b) plan view of the channel zone; and (c) longitudinal profile of the channel zone.
Applying the concept of the transmission coefficient between Sections 1 and 0, following the conventions illustrated in Figure 3, thus:
where, = wave height.
By applying the energy conservation criterion for waves between Sections 0 and 2, and substituting the value of , then:
The previous expression can be summarised as:
where, .
The time taken by the wave to travel from one element to another is given by:
The water level at cross-section 1, in the absence of regulation structures, is determined by the sum of the incident wave and the wave reflected by the wall of the last element of the channel, as follows:
2.2.2. Abrupt Expansion
In Dean & Dalrymple (1991) [26], Equation (15) is presented for calculating the amplitude of the diffracted wave passing through an aperture with a width smaller than a wavelength, at a point located at a distance from the centre of the source with an aperture width . This expression applies to locations far from the source:
where, = Euler–Mascheroni constant (0.577).
Applying the energy conservation equation between an aperture of width and a semicircle of radius , Equation (16) is obtained for estimating the wave’s amplitude at a distance from the source. The schematisation of these structures is presented in Figure 4. This expression can be used to correct the level function:
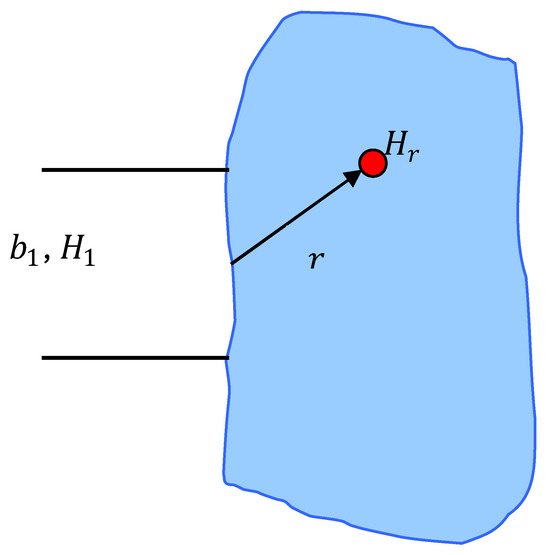
Figure 4.
Schematic representation of abrupt expansion.
2.2.3. Internal Channel
In some shallow estuaries and bays, existing or proposed interior channels aim to improve navigability or enhance water circulation as an environmental solution. These channels generally have a horizontal dimension shorter than the discretisation element size (Δx or Δy), featuring a channel bed with a horizontal central section and sloped sides. Additionally, when the channel is sloped, at least two elements of overlap must be allowed.
A further challenge arises when the channel walls are vertical (though this is uncommon in natural channels), as this would result in two bathymetric values at some vertices of the elements. However, this issue is addressed in layer models [27].
All these challenges result in the modelled channel differing significantly from the existing or proposed design. If it concerns an engineering project, these discrepancies hinder informed decision-making regarding marginal costs versus marginal benefits.
The approach taken in the proposed model involves discretising the channel into elements corresponding to the width of the channel bed and the widths of the slopes (see Figure 5). This method has the disadvantage of resulting in significant elements alongside very small elements, which may lead to potential model instability. This is because the mathematical expressions used in the model calculations do not allow for the independent terms of the solution matrix to be zero, ensuring that a unique solution always exists.
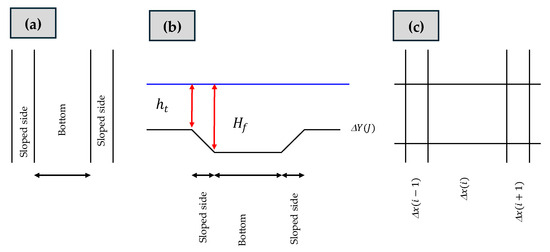
Figure 5.
Schematic representation of an interior channel: (a) plan view; (b) longitudinal profile; and (c) spatial discretisation.
In the case of channels with a diagonal orientation, the channel can be represented in horizontal and vertical segments, as is commonly conducted in most models. In areas where direction changes occur, square elements of the slope width and square elements of the channel bed width are used.
An alternative solution to enhance the representation of the channel is to align it predominantly with the coordinate axes and to include the effect of axis rotation in the Coriolis factor. The channel representation shown in Figure 5 allows for modifications to the dimensions of both the channel and the slopes, thereby generating various design alternatives.
2.2.4. Bottom Friction
This section incorporates the wave routing’s attenuation effect on the water level, induced by bottom friction. One way to account for this influence is by integrating it into the estimation of water levels through the linearised solution, as referenced in Dean & Dalrymple (1991) [26]. This expression is formulated as follows:
where, , Darcy–Weisbach friction coefficient, = magnitude of the maximum velocity, = water depth, = wave number (), = angular frequency (), = wavelength of the original wave, wave period, = water level at the reference point (distance zero), and = water level at a distance .
The reflected wave will be influenced by the friction coefficient, resulting in the following expression:
When the regulation and/or control structure is introduced, it generates a transmitted wave influenced by the so-called , which attenuates the incoming wave entering the channel. The reflected wave that returns is transmitted back to level one with a transmission coefficient , resulting in the water level being expressed as follows:
The incident wave reflected by the hydraulic control structure or constriction is added. If the initial segment from level 1 to the structure is considered as , the depth of the initial segment as , and the estimated travel time of the wave as , it is represented as follows:
Similarly, the water level in the other sections is estimated, for example:
3. Practical Application
A one-dimensional simulation prototype of a rectangular channel was considered. A channel with a length of ( representing the wavelength) and a width of was examined, divided into ten segments, each with a length of , and a non-variable depth of 5 m.
A rectangular channel measuring 20,000 m in width and 200,000 m in length was employed to evaluate the model’s sensitivity to inlet structures with abrupt changes. The channel’s length was subdivided into ten segments of 20,000 m each, resulting in square-shaped elements measuring 20,000 m in width and length (see Figure 6).
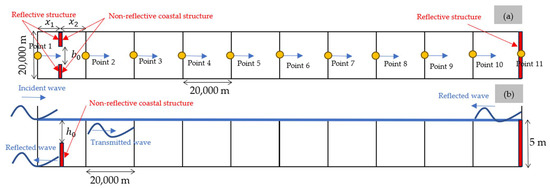
Figure 6.
Scheme of a rectangular open channel between sea and bay: (a) longitudinal profile; and (b) plan view.
Between Sections 1 and 2, where open-sea conditions are imposed, a regulatory structure with sharp transitions in both plan and cross-sectional view was introduced. The structure is assumed to be reflective on the side facing the open sea and non-reflective towards the channel’s interior (initial condition).
In the analysis, a cosinusoidal incident wave with a height of 0.5 m and a period of 24 h is employed. This wave propagates through the channel and is superimposed with the reflected wave. The linear theory for a frictionless channel is given as follows:
where, represents the channel length, denotes the water level of the incident wave, corresponds to the combined water level of the incident and reflected waves, and is the horizontal velocity along the -axis.
To demonstrate the sensitivity of the proposed methodology for simulating hydraulic control structures, three scenarios were analysed, as outlined below:
- Scenario No. 1: Constriction in the longitudinal profile.
- Scenario No. 2: Constriction in the plan view.
- Scenario No. 3: Influence of bottom friction.
3.1. Scenario 1: Constriction in the Longitudinal Profile
In this scenario, a coastal structure with varying crest heights of 1, 2, 3, 4, and 5 m was implemented along the longitudinal profile to create a sudden contraction to evaluate the model’s sensitivity. This configuration does not involve any contraction in the plan view, as the channel width remains constant throughout. Additionally, bottom friction effects are neglected in this simulation.
The resulting variations in water level are presented in Figure 7, based on the application of the proposed methodology. Figure 7a shows the water levels at Point 1 for the different structure heights between Points 1 and 2. The maximum water level at this location, 0.29 m, occurs when the structure height is 1 m. When waves overtop the coastal structure, water levels decrease due to the combined influence of transmitted and reflected wave components, as shown in Figure 7b, where water levels tend to converge across the different cases.
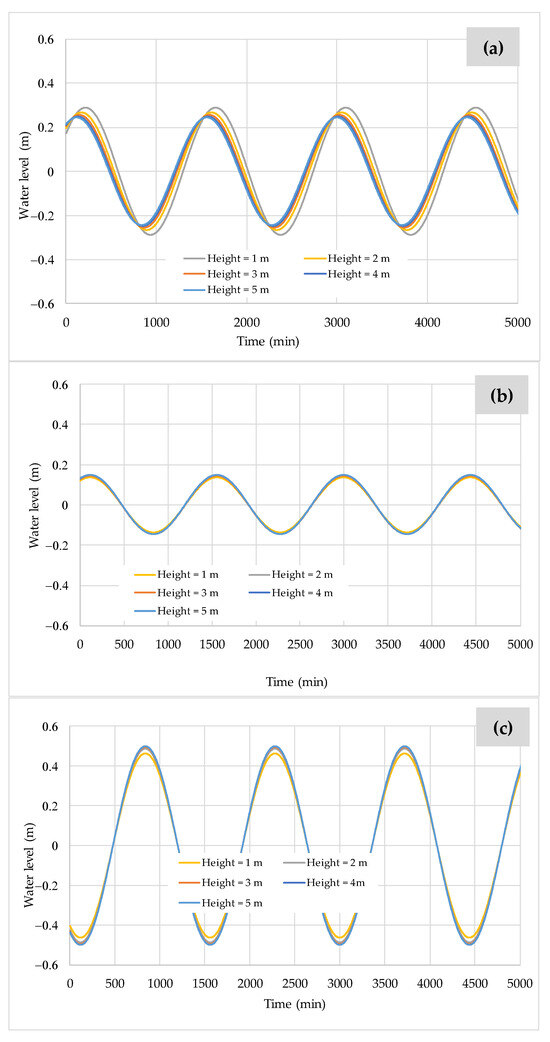
Figure 7.
Water level variations for Scenario No. 1 with different heights of the coastal structure at: (a) Point 1; (b) Point 2; and (c) Point 11.
Water levels increase at the downstream end of the channel because of a reflective structure located at Point 12, as illustrated in Figure 7c. Here, the lowest water levels are observed for a structure height of 1 m, while the highest levels occur with a structure height of 5 m.
Figure 8 presents the maximum water velocities attained along the channel for the different heights of the coastal structure. The highest velocities occur at Point 2, due to the contraction between Points 1 and 2. For structure heights of 4 and 5 m, the maximum velocity reaches 0.67 m/s at this location. In contrast, the lowest velocities are observed at section 11 due to the reflective structure positioned near the downstream end, with an average value of approximately 0.14 m/s.
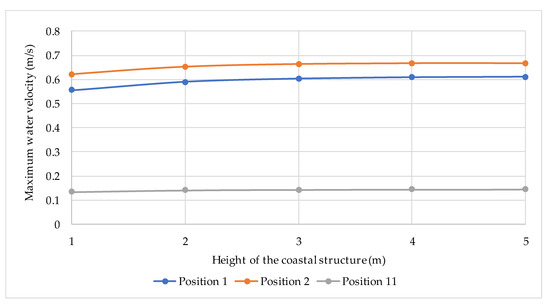
Figure 8.
Maximum water levels for Scenario No. 1.
3.2. Scenario No. 2: Constriction in the Plan View
The constriction in a plan view entails reducing channel width while maintaining a constant depth of 5 m. In this analysis, the width is decreased from 20,000 to 100 m. As illustrated in Figure 9, the water surface elevation at section 1 exhibits a noticeable superelevation in response to the narrowing of the channel.
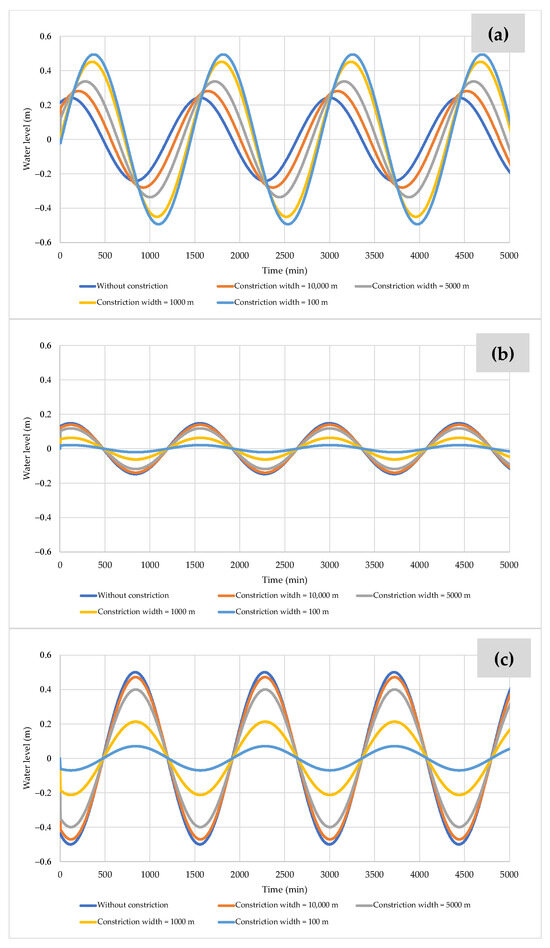
Figure 9.
Water level variations for Scenario No. 2 with different constriction widths at: (a) Point 1; (b) Point 2; and (c) Point 11.
Figure 9a demonstrates that lower constriction widths result in higher water levels at the upstream section. For example, a minimum constriction width of 100 m yields a maximum water level of 0.49 m, whereas a width of 10,000 m corresponds to a level of 0.28 m. The water level declines as the wave propagates from Point 1 to Point 2.
The highest water level is achieved without a constriction with a maximum value of 0.15 m, while the lowest value—0.02 m—is observed for a constriction width of 100 m, as presented in Figure 9b. Figure 9c shows the water levels computed at Point 11, where an increase in elevation is again detected due to a reflective structure situated at the downstream boundary.
Figure 10 illustrates the maximum water velocities along Points 1 to 11 for various constriction widths within the channel. The results indicate that greater constriction widths are associated with higher peak velocities. For example, a constriction width of 5000 m results in a maximum velocity of 0.56 m/s, whereas a width of 1000 m yields a value of 0.30 m/s.
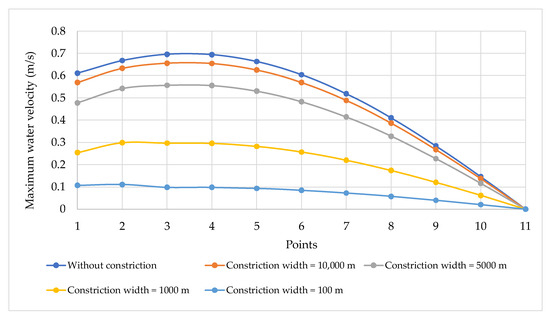
Figure 10.
Maximum water levels for Scenario No. 2.
3.3. Scenario 3: Influence of the Bed Friction
The following simulations consider two channel widths () of 1000 and 100 m, each evaluated with friction coefficients () of 0.01 and 0.04.
Figure 11 presents the results for water level at various points of the rectangular channel (Points 1, 2, 6, and 10), for a width of 1000 m and a friction coefficient of 0.01. The results indicate a water level amplification at Point 1, a damping effect of the internal water levels within the channel, and a relative shift in the location of peak values. Figure 12 shows the water velocity results at Points 1, 2, 6, and 10 for the same channel width and friction coefficient. These results demonstrate a decrease in peak velocity values from the seaward boundary towards the interior of the channel, accompanied by a seaward-to-landward shift in the position of peak velocities.
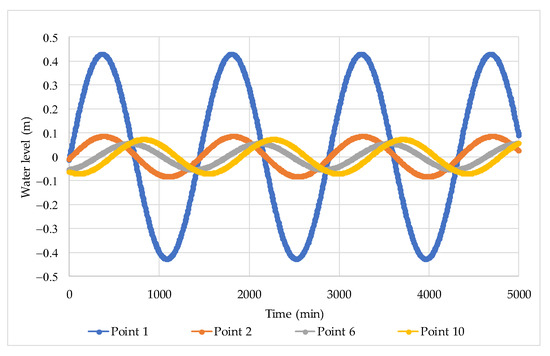
Figure 11.
Water level variations for Scenario No. 3 considering a constriction width of 1000 m and a bed friction of 0.01.
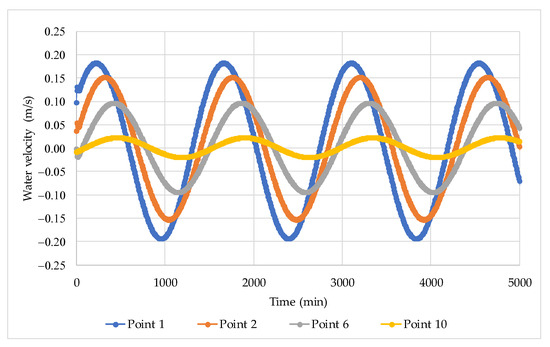
Figure 12.
Water velocity variations for Scenario No. 3 considering a constriction width of 1000 m and a bed friction of 0.01.
Finally, these parameters were adjusted to examine how variations influence the maximum water velocity values in constriction width and friction coefficients. The highest water velocities were observed with a constriction width of 1000 m and a friction coefficient of 0.01, whereas the lowest velocities occurred with the same width but a friction coefficient of 0.04. This finding is significant, as the model is susceptible to selecting the bed friction coefficient, as shown in Figure 13.
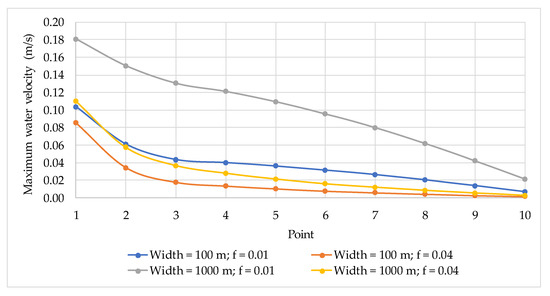
Figure 13.
Maximum water velocity reached for Scenario No. 3 considering various constriction widths and bed friction.
4. Measurement and Comparison of Water Levels
In the city of Cartagena de Indias, Colombia, around the year 2001, a stabilised tidal inlet structure (STIS)—known locally as the “Bocana de Marea”—was constructed to regularly refresh all the water in the Ciénaga de la Virgen (see Figure 14a). The proposed methodology solely represents the inflow condition from the sea into the Ciénaga de la Virgen. The sluice gates are hydraulically actuated by the water level difference and operate in a single direction only. In the modelled scenario, the water level difference hydraulically actuates the sluice gates. In this scenario, the inflow gates are open, allowing seawater to enter the lagoon, while the outflow gates remain closed. Under these conditions, the incoming wave propagates through the system and may be partially reflected. The modelled situation corresponds to the scenario described in Section 2.2.1. The current research does not account for analysing the water from the Ciénaga de la Virgen towards the sea.
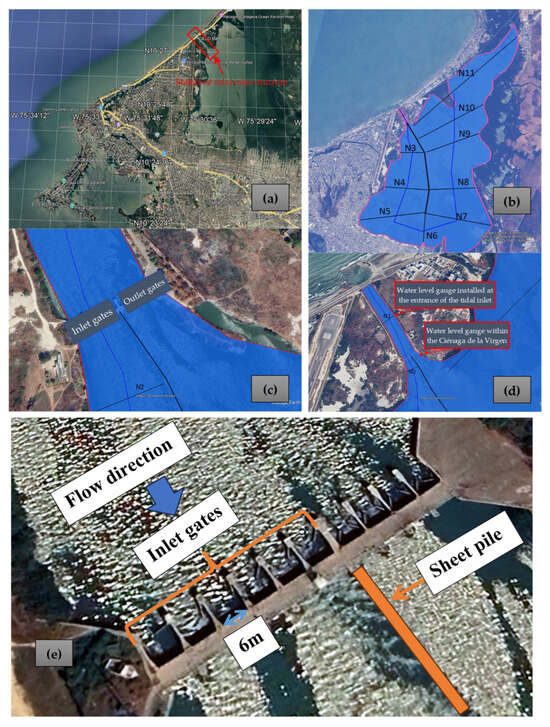
Figure 14.
Geospatial information for model implementation: (a) general location of the Stabilised Tidal Inlet Structure; (b) distribution of the eleven cross-sections (N1 to N11) along the lagoon channel; (c) position of the inlet and outlet gates; (d) placement of water level gauge stations; and (e) flow direction from the sea towards the Ciénaga de la Virgen.
To verify the proposed hydraulic structure model under conditions where consistent in situ data aligned with the model configuration are limited, and given the availability of water level measurements at both the seaward entrance to the inlet and within the lagoon itself, an idealised representation of the Ciénaga de la Virgen was adopted. Considering the predominantly unidirectional flow with spatial variations in cross-sectional geometry, the lagoon was discretised into eleven computational sections (N1–N11) for modelling purposes (Figure 14b).
This hydraulic control structure enforces a unidirectional flow regime through the operation of gated sluices, thereby allowing water to enter or exit the coastal lagoon depending on tidal conditions. During high tide, the system opens the inflow gates—comprising six units, each measuring 6 m in width and 3 m in depth—while simultaneously closing the outflow gates (four units of the same dimensions). Conversely, the inflow gates are shut during low tide, and the outflow gates are opened, enabling drainage from the lagoon to the sea. This regulated mechanism ensures that the flow occurs in a single direction at any given moment, depending on the prevailing tidal phase (Figure 14c). Figure 14d shows the locations of the two water level gauges—one positioned at the seaward entrance to the inlet channel and the other located east of the outflow gates, within the interior of the lagoon. Figure 14e shows the flow direction from the sea towards the Ciénaga de la Virgen through the inlet gates. A sheet pile was constructed to separate the flow directions.
Table 1 presents the geometric characteristics of each of the eleven defined segments. These sections are fundamental to accurately simulating the system’s hydraulic response under tidal forcing using simplified hydrodynamic modelling approaches.

Table 1.
Geometric characteristics of the eleven defined cross-sections (N1–N11).
Figure 15 shows the segment of the water level time series recorded on 25 November 2008 at the Stabilised Tidal Inlet Structure (STIS) and within the Ciénaga de la Virgen, corresponding to the operational phase in which the inflow gates were open, and the outflow gates remained closed. The maximum water level measured at the tidal boundary was 46.72 cm, while within the Ciénaga de la Virgen, it reached 31.0 cm at minute 480. Cross-section N11 is aligned with the water level gauge station inside the Ciénaga de la Virgen. Using the proposed modelling methodology, the comparison between measured and simulated water levels at cross-section N11 is also presented. The results indicate that the methodology effectively represents water level dynamics in systems with coastal hydraulic control structures. In this case, the model captures the observed water level trend from minute 190 onwards, throughout the remainder of the hydraulic event.
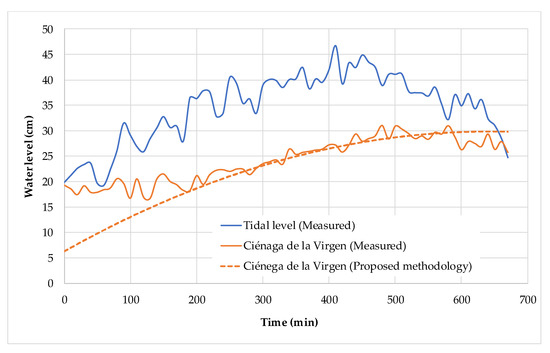
Figure 15.
Comparison between measured and simulated water levels at cross-section N11 using the proposed methodology.
5. Discussion
5.1. Advantages and Limitations
The simplified modelling approach for hydraulic control structures presented herein gives engineers and designers a practical tool to represent hydraulic impacts in shallow waters. By incorporating transmission and reflection coefficients, the proposed methodology enables the calibration of hydrodynamic processes, accounting solely for bed friction. This capability is demonstrated by the model’s sensitivity to varying responses of hydraulic control structures.
An advantage of this approach is its adaptability to diverse hydraulic configurations without the substantial computational demands associated with three-dimensional hydrodynamic models. The methodology developed by the authors proves effective in simulating hydrodynamic behaviour in water bodies and capturing the impact of hydraulic control structures, as illustrated in Section 3, where vertical and horizontal constrictions were evaluated. Building upon the findings of this research, the model can be further extended to channels with tidal inlet structures to study internal water levels. Moreover, the proposed methodology is suitable for computing vertical flows, thus enabling its application for environmental assessments, particularly concerning the mixing of contaminants.
The proposed methodology’s main limitations relate to its application under conditions of nonlinear flow behaviour during extreme events or when subject to rapidly changing boundary conditions. Despite these constraints, Section 3 demonstrates that the methodology can perform hydrodynamic modelling in one-dimensional channels, yielding results that align well with observed hydrodynamic patterns and established numerical models. In addition, the proposed methodology can be employed to model the effects associated with the flow direction from the sea towards estuarine systems.
5.2. New Contributions to the Literature
In Reference [23], the authors developed a fundamental methodology for hydrodynamic modelling in bay and estuarine systems to provide a practical tool that requires only bed friction for calibration, making it suitable for use in data-limited settings. The present study extends this methodology by incorporating the effects of hydraulic control structures in shallow water simulations, specifically considering communication channels between the sea and bays, abrupt expansions, and internal channels. In this context, the current research represents a complementary advancement to the work previously undertaken by the authors [23].
6. Conclusions
The study demonstrates that incorporating hydraulic control structures into simplified hydrodynamic models significantly enhances their capacity to accurately simulate water-level variations in shallow water bodies. Particularly, the analysis is focused on a one-dimensional channel considering the understanding of equations for a channel between sea and bay, an abrupt expansion, an internal channel, and the effect of the bottom friction. The proposed methodology proves effective in capturing the variations in wave propagation and water surface behaviour for three scenarios: (i) constriction in the longitudinal profile, (ii) constriction in the plan view, and (iii) the influence of the bottom friction. The proposed methodology reveals a high sensitivity to the design parameters of a hydraulic control structure in a shallow water system, such as the width and depth of the structure and the bottom friction within the system.
Overall, integrating these control structures within the modelling framework enhances the model’s engineering applicability, providing a practical and computationally efficient tool to support decision-making in the planning and designing of coastal infrastructure projects. A key advantage of the proposed methodology for analysing coastal structures is its suitability for regions with limited data, as calibration can be carried out more easily compared to more complex hydrodynamic models.
The proposed methodology’s application to the stabilised tidal inlet structure in Cartagena de Indias further demonstrated its capability to accurately represent water levels, as verified against data recorded at a water level gauge station.
Future works should focus on implementing the proposed methodology for simulating bay and estuarine systems, specifically applied to one-dimensional channels that incorporate the hydraulic control structures presented in this study.
Author Contributions
Conceptualization, A.A.-P. and E.A.M.-P.; methodology, A.A.-P. and O.E.C.-H.; formal analysis, A.A.-P.; validation, A.A.-P.; writing—original draft preparation, A.A.-P. and E.A.M.-P.; writing—review and editing, H.M.R., M.P.-S., and O.E.C.-H. All authors have read and agreed to the published version of the manuscript.
Funding
This research received no external funding.
Data Availability Statement
The original contributions presented in this study are included in the article. Further inquiries can be directed to the corresponding authors.
Conflicts of Interest
The authors declare no conflicts of interest.
Abbreviations
The following notation was used in this research:
| Flow area in the -axis (m2) | |
| Volume of each element () (m3) | |
| and | Widths before and after a constriction (m) |
| Wave celerity (m/s) | |
| Friction loss coefficient (Chezy coefficient) | |
| Friction coefficient according to the Darcy–Weisbach formulation (-) | |
| Gravitational acceleration (9.81 m/s2) | |
| Mean water depth (m) | |
| Wave height (m) | |
| and | Depths before and after a constriction (m) |
| Transmission coefficient (-) | |
| Transmitted coefficient generated by a hydraulic control structure (-) | |
| Transmitted back coefficient (-) | |
| Reflection coefficient (-) | |
| Wave number () (rad/m) | |
| Wavelength of the original wave (m) | |
| Number of elements used to discretise the domain (-) | |
| Position indicator (integer) in the X direction (-) | |
| Defines the element at the intersection of line i with line j (-) | |
| Position indicator (integer) in the Y direction (-) | |
| Water level at i in the X direction (m) | |
| Flow in the main direction of the channel (m3/s) | |
| A specific radius (m) | |
| Time (s) | |
| Wave period (s) | |
| Magnitude of the maximum velocity (m/s) | |
| Coordinate of point i (-) | |
| Coordinate of point j (-) | |
| Water level (m) | |
| Time interval (step) for the simulation (s) | |
| Spacing in the X direction (m) | |
| Spacing in the Y direction (m) | |
| Mean surface level (m) | |
| Water level at the reference point (distance zero) (m) | |
| Water level at a distance (m) | |
| Angular frequency () | |
| Euler–Mascheroni constant (0.577) |
References
- Esteban, M.D.; López-Gutiérrez, J.S.; Negro, V.; Neves, M.G. Coastal Engineering: Sustainability and New Technologies. J. Mar. Sci. Eng. 2023, 11, 1562. [Google Scholar] [CrossRef]
- Coastal Engineering Research Center (US). Shore Protection Manual; US Army Coastal Engineering Research Center: Fort Belvoir, VA, USA, 1973; Volume 1. [Google Scholar]
- Habib, M.A.; Zarillo, G.A. Construction of a Real-Time Forecast Model with Deep Learning Techniques for Coastal Engineering and Processes: Nested in a Basin Scale Suite of Models. J. Mar. Sci. Eng. 2024, 12, 1152. [Google Scholar] [CrossRef]
- Arrieta-Pastrana, A.; Coronado-Hernández, O.E.; Fuertes-Miquel, V.S. Analysis of the Impact of Hydraulic Gates on a Stabilized Tidal Inlet Structure: Mathematical Model and Data Measurements. Hydrology 2024, 11, 46. [Google Scholar] [CrossRef]
- Ji, Z.-G.; Moustafa, M.Z.; Hamrick, J. Hydrodynamic Modeling of a Large, Shallow Estuary. J. Mar. Sci. Eng. 2024, 12, 381. [Google Scholar] [CrossRef]
- Ganju, N.K.; Brush, M.J.; Rashleigh, B.; Aretxabaleta, A.L.; del Barrio, P.; Grear, J.S.; Harris, L.A.; Lake, S.J.; McCardell, G.; O’Donnell, J.; et al. Progress and Challenges in Coupled Hydrodynamic-Ecological Estuarine Modeling. Estuaries Coasts 2016, 39, 311–332. [Google Scholar] [CrossRef] [PubMed]
- Wang, J.; Chu, A.; Dai, Z.; Nienhuis, J. Delft3D Model-Based Estuarine Suspended Sediment Budget with Morphodynamic Changes of the Channel-Shoal Complex in a Mega Fluvial-Tidal Delta. Eng. Appl. Comput. Fluid Mech. 2024, 18, 2300763. [Google Scholar] [CrossRef]
- Yao, N.E.; Cossa, O.; Wango, T.E.; Monde, S. Turbulent Energy Mapping Using Delft3D on the Ebrié Lagoon in Ivory Coast—Abidjan. Reg. Stud. Mar. Sci. 2021, 43, 101614. [Google Scholar] [CrossRef]
- Rueda-Bayona, J.G.; Osorio, A.F.; Guzmán, A. Set-up and Input Dataset Files of the Delft3d Model for Hydrodynamic Modelling Considering Wind, Waves, Tides and Currents through Multidomain Grids. Data Brief. 2020, 28, 104921. [Google Scholar] [CrossRef] [PubMed]
- DHI Group. Mike 21 & Mike 3 FLOW MODEL FM: Hydrodynamic and Transport Module Scientific Documentation; DHI Group: Hørsholm, Denmark, 2021. [Google Scholar]
- Velasquez-Montoya, L.; Wargula, A.; Tomiczek, T.; Sciaudone, E.J.; Smyre, E. Modeling the Hydrodynamics of a Tidal Inlet during Bay-Side Storms. Estuar. Coast. Shelf Sci. 2023, 280, 108145. [Google Scholar] [CrossRef]
- Ren, L.; Ji, J.; Yang, H.; Wang, H.; Wang, Y.; Zhu, Q.; Guo, L.; Lou, X.; Yao, P.; Zhu, Z.; et al. On the Patterns and Mechanisms of Residual Currents and Suspended Sediment Transport in the Lingdingyang of the Pearl River Delta. Sustain. Horiz. 2025, 13, 100123. [Google Scholar] [CrossRef]
- Chen, X.J. Simulating Hydrodynamics in a Spring-Fed Estuary Using a Three-Dimensional Unstructured Cartesian Grid Model. Estuar. Coast. Shelf Sci. 2012, 115, 246–259. [Google Scholar] [CrossRef]
- Quetzalcóatl, O.; González, M.; Cánovas, V.; Medina, R.; Espejo, A.; Klein, A.; Tessler, M.G.; Almeida, L.R.; Jaramillo, C.; Garnier, R.; et al. SMCε, a Coastal Modeling System for Assessing Beach Processes and Coastal Interventions: Application to the Brazilian Coast. Environ. Model. Softw. 2019, 116, 131–152. [Google Scholar] [CrossRef]
- Software|SMC España. Available online: https://smc.ihcantabria.es/SMC25/en/programas/ (accessed on 15 May 2025).
- Muller, J.R.M.; Chan, Y.C.; Piersma, T.; Chen, Y.P.; Aarninkhof, S.G.J.; Hassell, C.J.; Tao, J.F.; Gong, Z.; Wang, Z.B.; van Maren, D.S. Building for Nature: Preserving Threatened Bird Habitat in Port Design. Water 2020, 12, 2134. [Google Scholar] [CrossRef]
- Schlüter, A.; Van Assche, K.; Hornidge, A.K.; Văidianu, N. Land-Sea Interactions and Coastal Development: An Evolutionary Governance Perspective. Mar. Policy 2020, 112, 103801. [Google Scholar] [CrossRef]
- Hill, A.E. Fortnightly Tides in a Lagoon With Variable Choking. Estuar. Coast. Shelf Sci. 1994, 38, 423–434. [Google Scholar] [CrossRef]
- Ippen, A.T. Tidal Dynamics in Estuaries, Part I: Estuaries of Rectangular Section. In Estuary and Coastline Hydrodynamics; Ippen, A.T., Ed.; McGraw-Hill: New York, NY, USA, 1966. [Google Scholar]
- Automated Coastal Engineering System: Technical Reference. Available online: https://apps.dtic.mil/sti/citations/ADA637708 (accessed on 15 May 2025).
- Prandle, D.; Rahman, M. Tidal Response in Estuaries. J. Phys. Oceanogr. 1980, 10, 1552–1573. [Google Scholar] [CrossRef]
- Leendertse, J.J. Aspects of a Computational Model for Long-Period Water Wave Propagation; RAND Corporation: Santa Monica, CA, USA, 1967. [Google Scholar]
- Arrieta-Pastrana, A.; Coronado-Hernández, O.E.; Fuertes-Miquel, V.S. Hydrodynamic Modelling Techniques for Bays and Estuaries: Simulation Methodology and Practical Application. Water 2025, 17, 623. [Google Scholar] [CrossRef]
- Lynett, P.J.; Kaihatu, J.M. Modeling of Coastal Waves and Hydrodynamics. In Springer Handbook of Ocean Engineering; Dhanak, M.R., Xiros, N.I., Eds.; Springer International Publishing: Cham, Switzerland, 2016; pp. 597–610. ISBN 978-3-319-16649-0. [Google Scholar]
- Tang, P.; Lin, X.; Wang, W.; Zhang, H. Numerical Simulation of Hydrodynamic Performance of an Offshore Oscillating Water Column Wave Energy Converter Device. J. Mar. Sci. Eng. 2024, 12, 2289. [Google Scholar] [CrossRef]
- Dean, R.G.; Dalrymple, R.A. Water Wave Mechanics for Engineers and Scientists; World Scientific: Singapore, 1991; Volume 2, ISBN 978-981-02-0421-1. [Google Scholar]
- Toro, F. A Two Dimensional Finite Element Model for Coastal Hydrodynamic Simulation. Ph.D. Thesis, University of Mississippi, Oxford, MS, USA, 1985. [Google Scholar]
Disclaimer/Publisher’s Note: The statements, opinions and data contained in all publications are solely those of the individual author(s) and contributor(s) and not of MDPI and/or the editor(s). MDPI and/or the editor(s) disclaim responsibility for any injury to people or property resulting from any ideas, methods, instructions or products referred to in the content. |
© 2025 by the authors. Licensee MDPI, Basel, Switzerland. This article is an open access article distributed under the terms and conditions of the Creative Commons Attribution (CC BY) license (https://creativecommons.org/licenses/by/4.0/).