
Evaluation of Coastal Sediment Dynamics Utilizing Natural Radionuclides and Validated In-Situ Radioanalytical Methods at Legrena Beach, Attica Region, Greece

 ,
,  , , ,
, , ,  , , , ,
  , and
, and
Abstract
1. Introduction
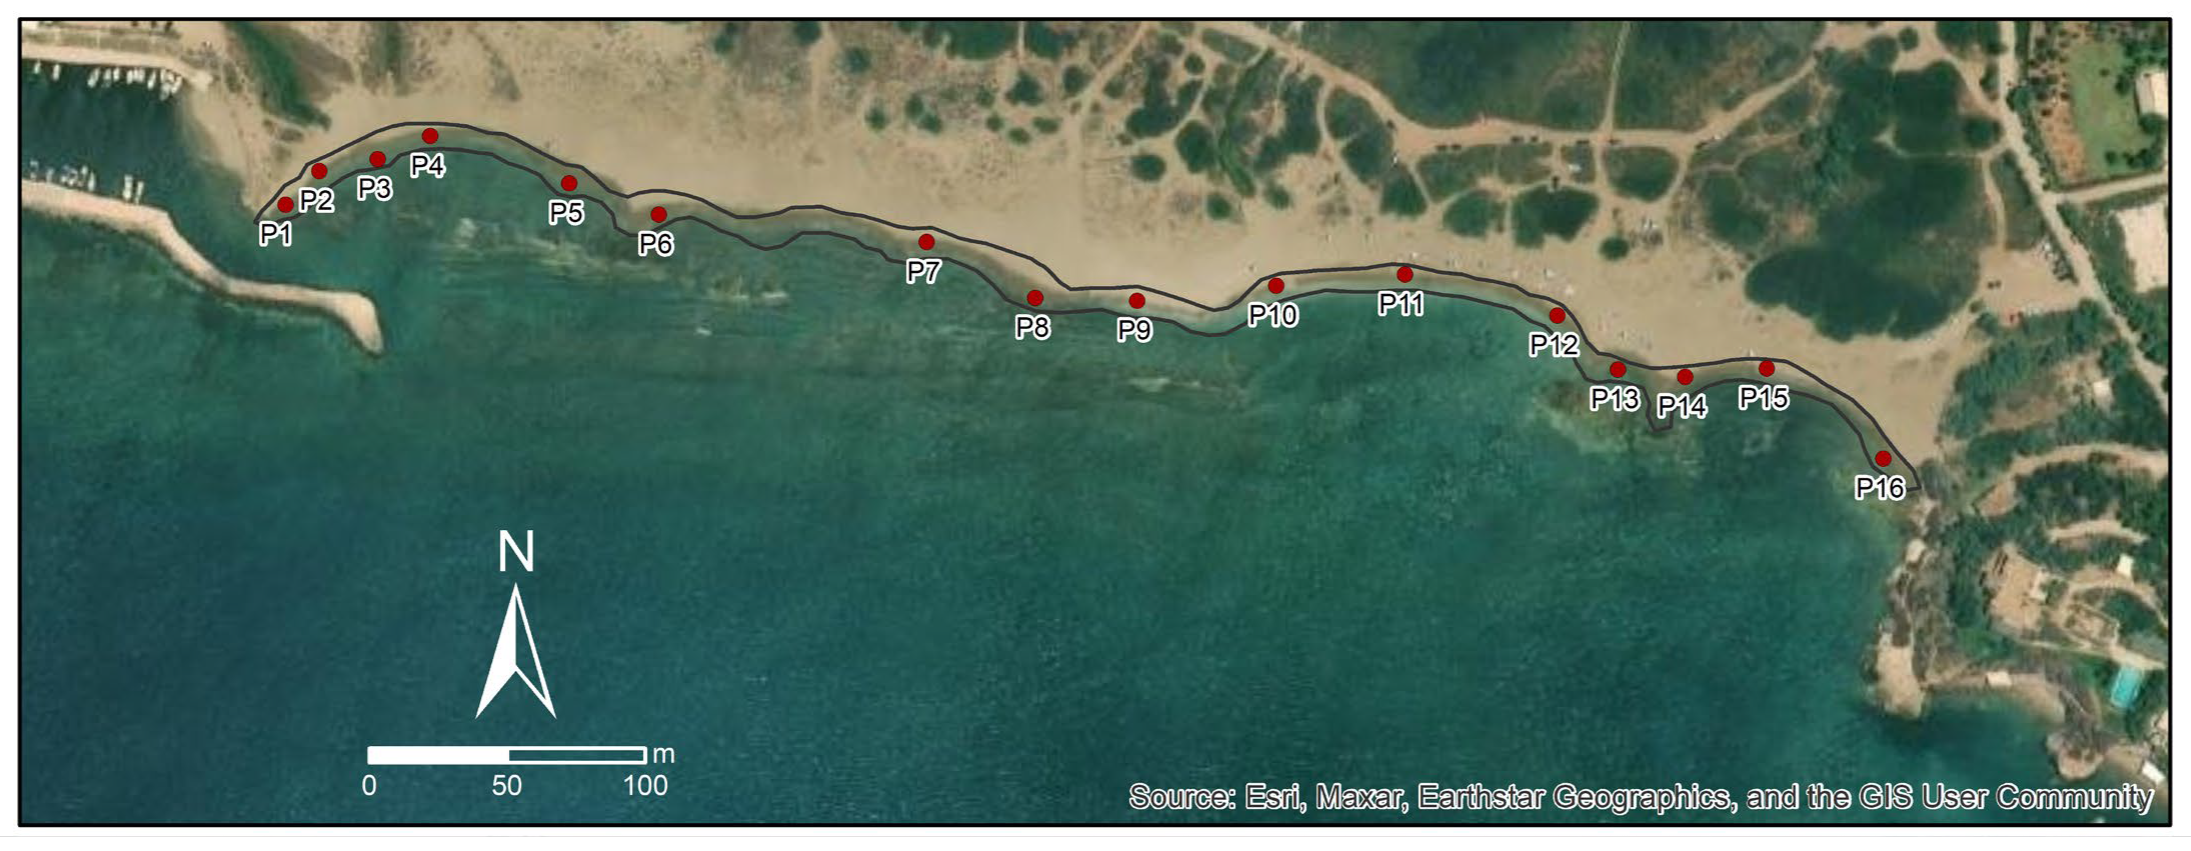
2. Study Area
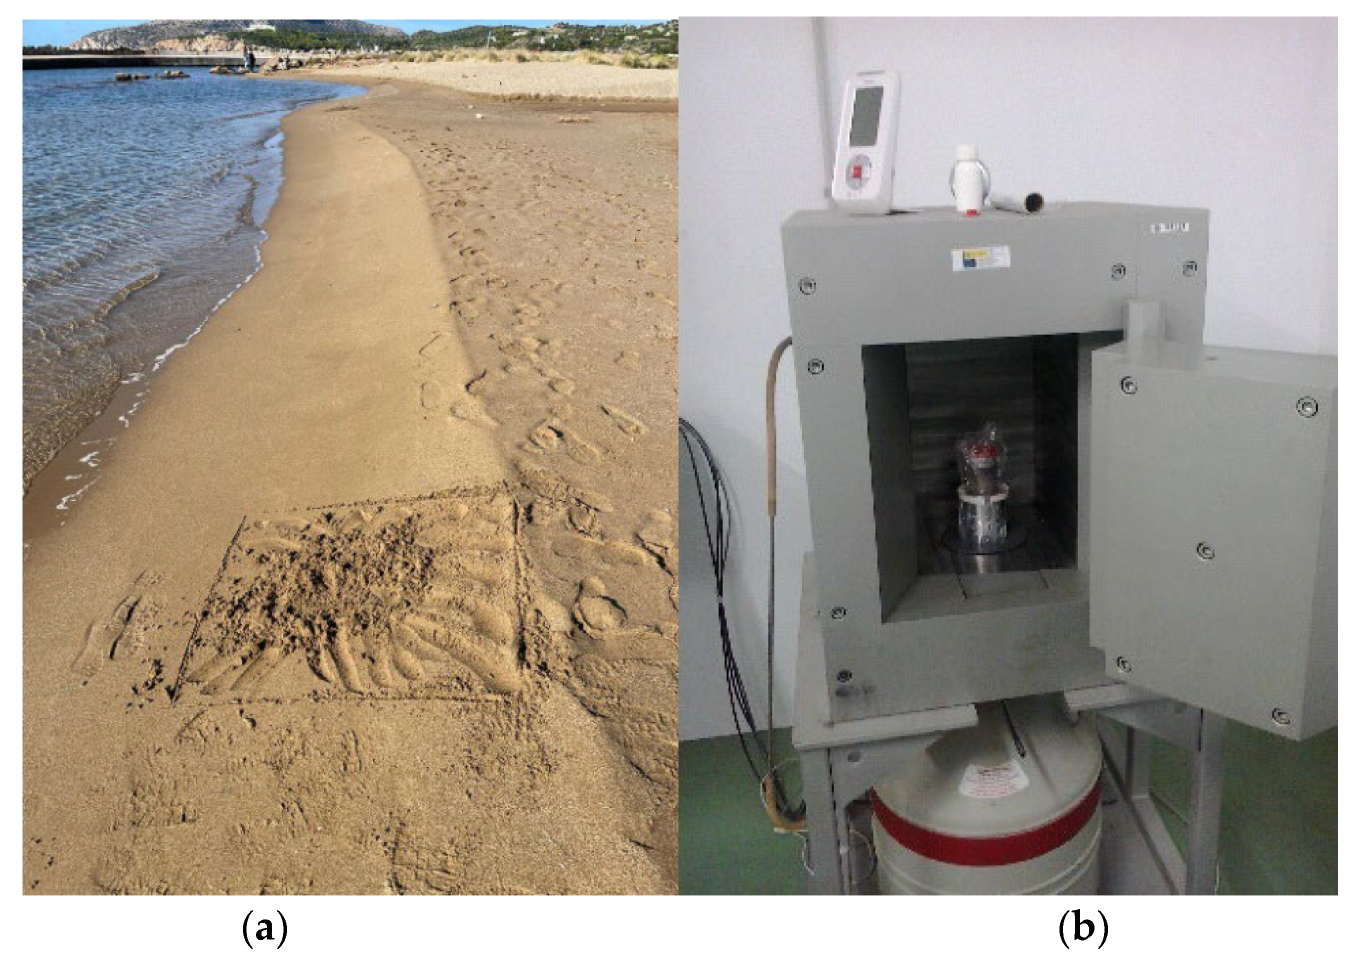
3. Materials and Methods
3.1. KATERINA II Detection System
3.2. MEDUSA Detection System
- Set-up of the system;
- Status view to inspect data and functioning of the system;
- Single and continuous measurement modes;
- View the data in real time plotted on a map;
- Download data for custom post-processing.
3.3. High Resolution Gamma-Ray Spectrometry Analysis
3.4. Numerical Coastal Model of Legrena Bay
3.4.1. Shoreline Evolution and Topo-Bathymetric Data
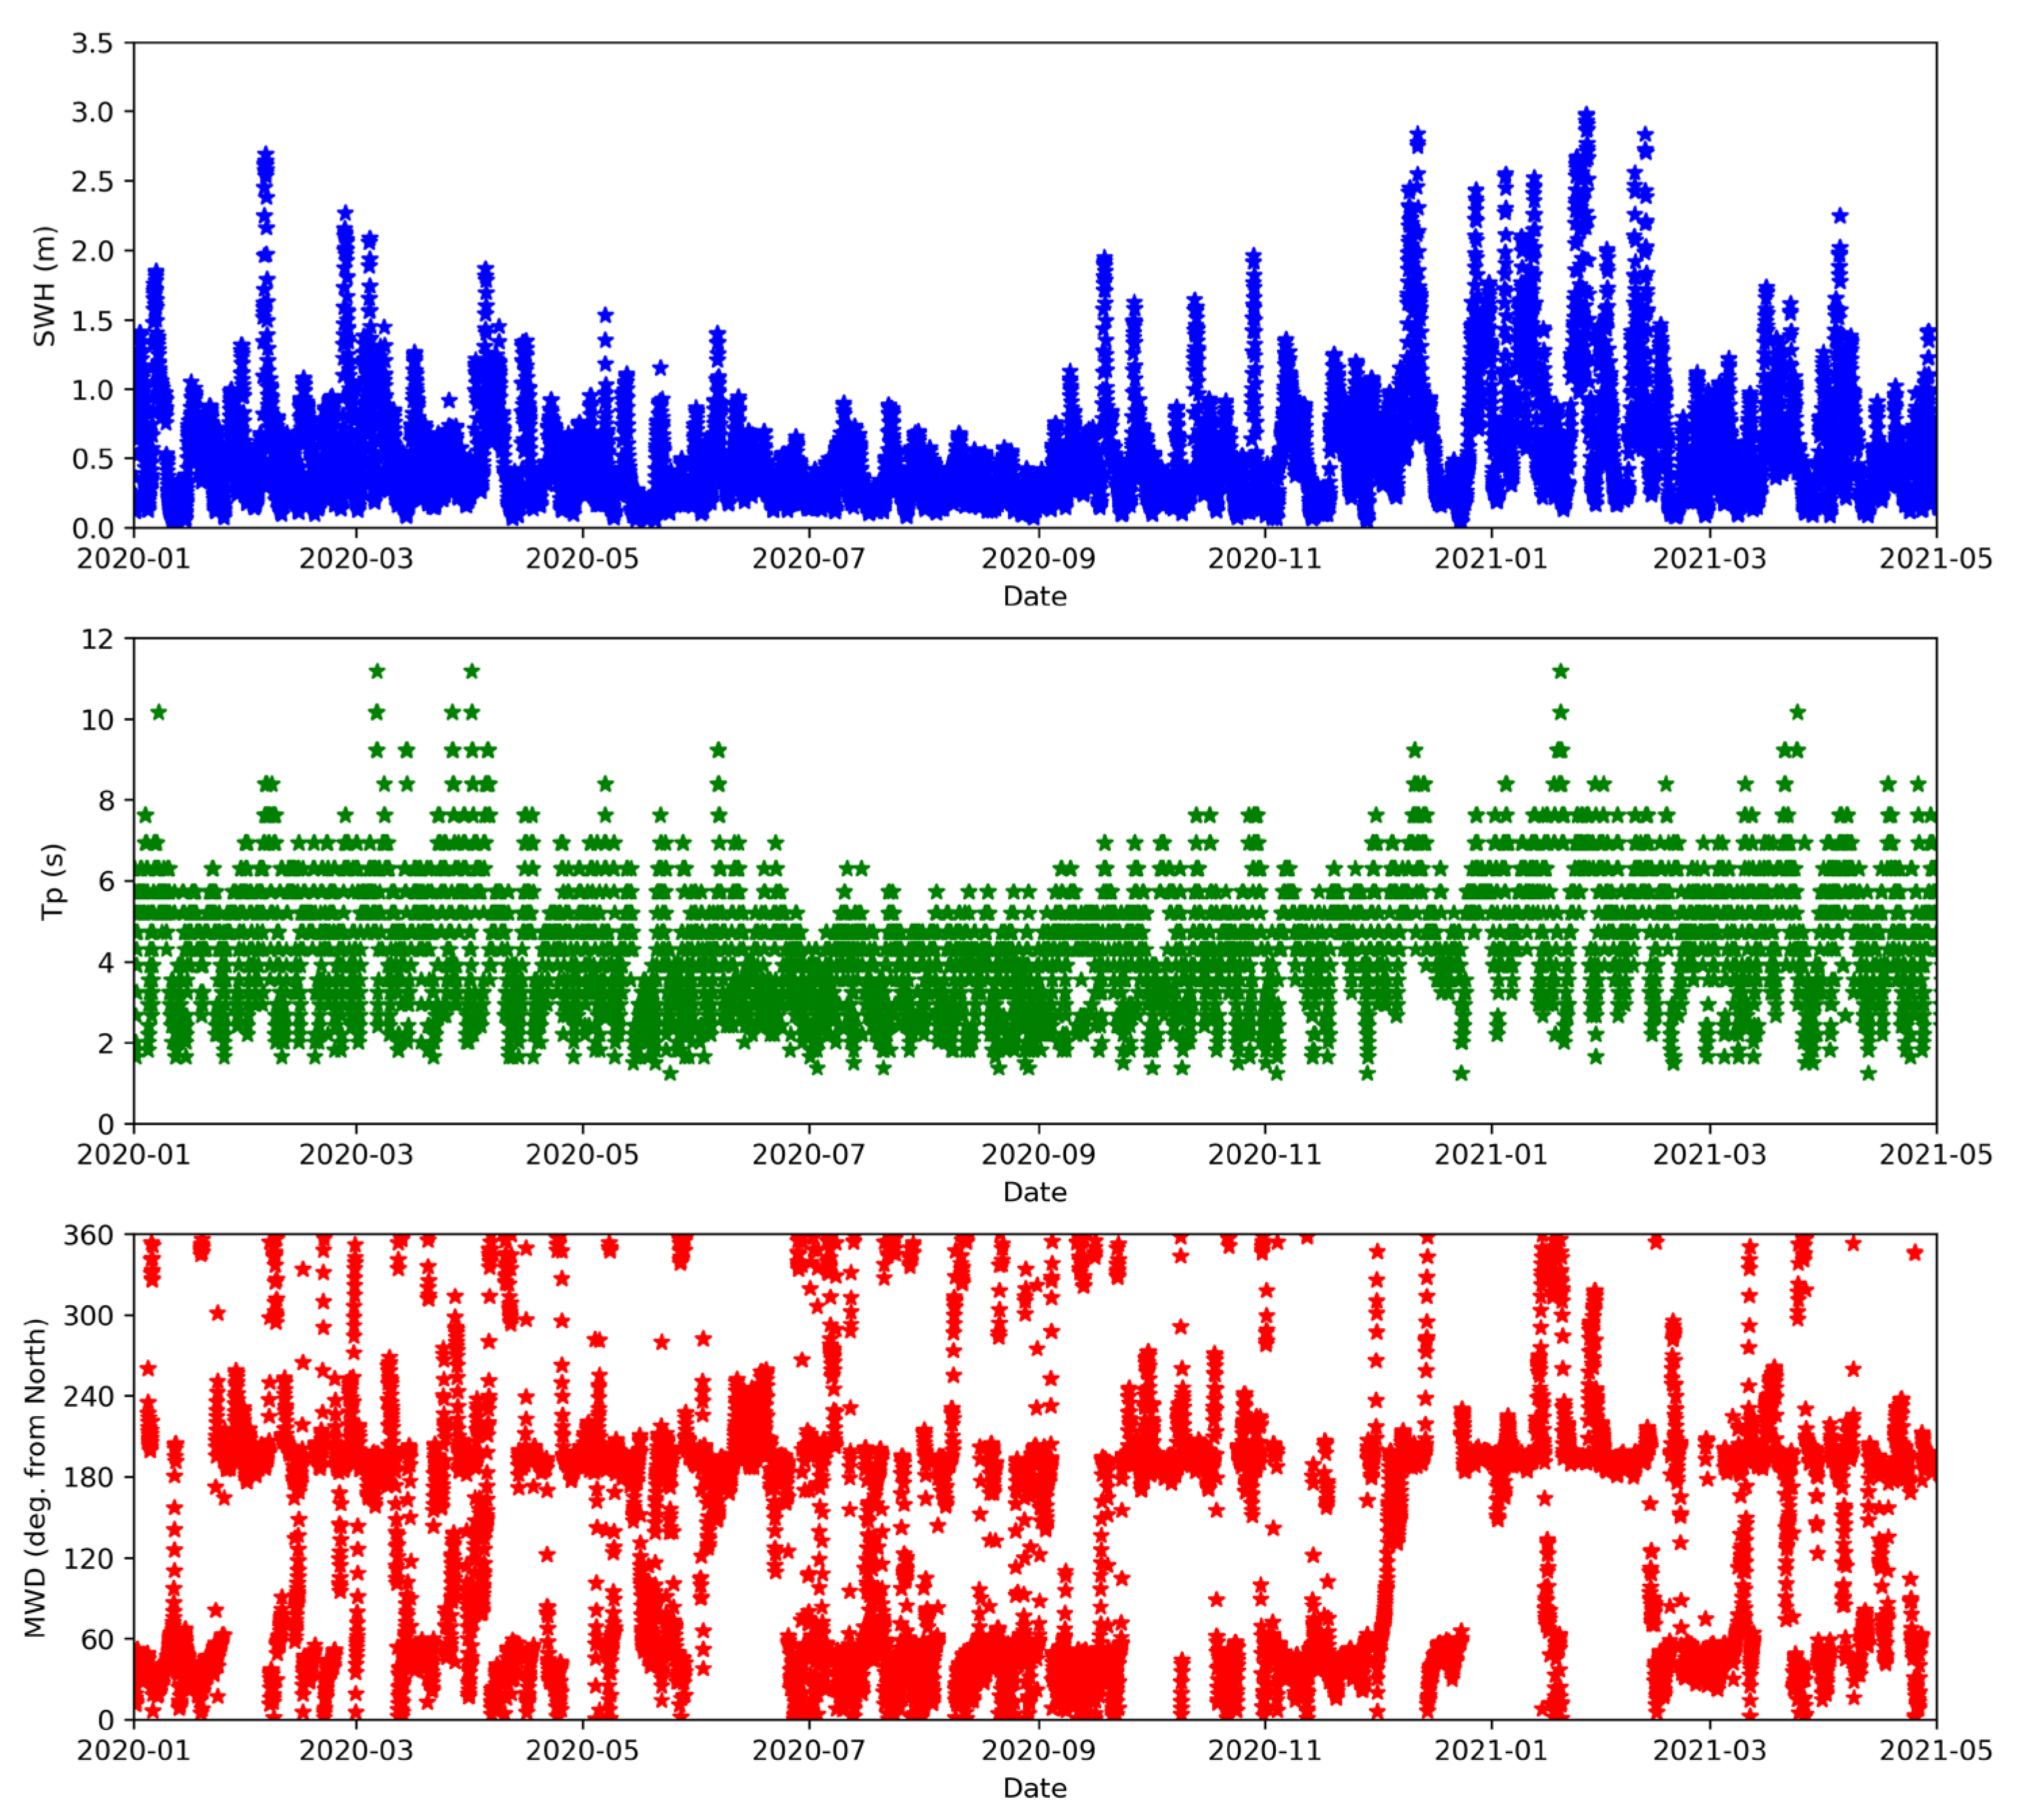
3.4.2. Wave Conditions
3.4.3. Wave Model
4. Results
4.1. KATERINA II System in the Backpack Mode
4.2. KATERINA II System in the Trolley Mode
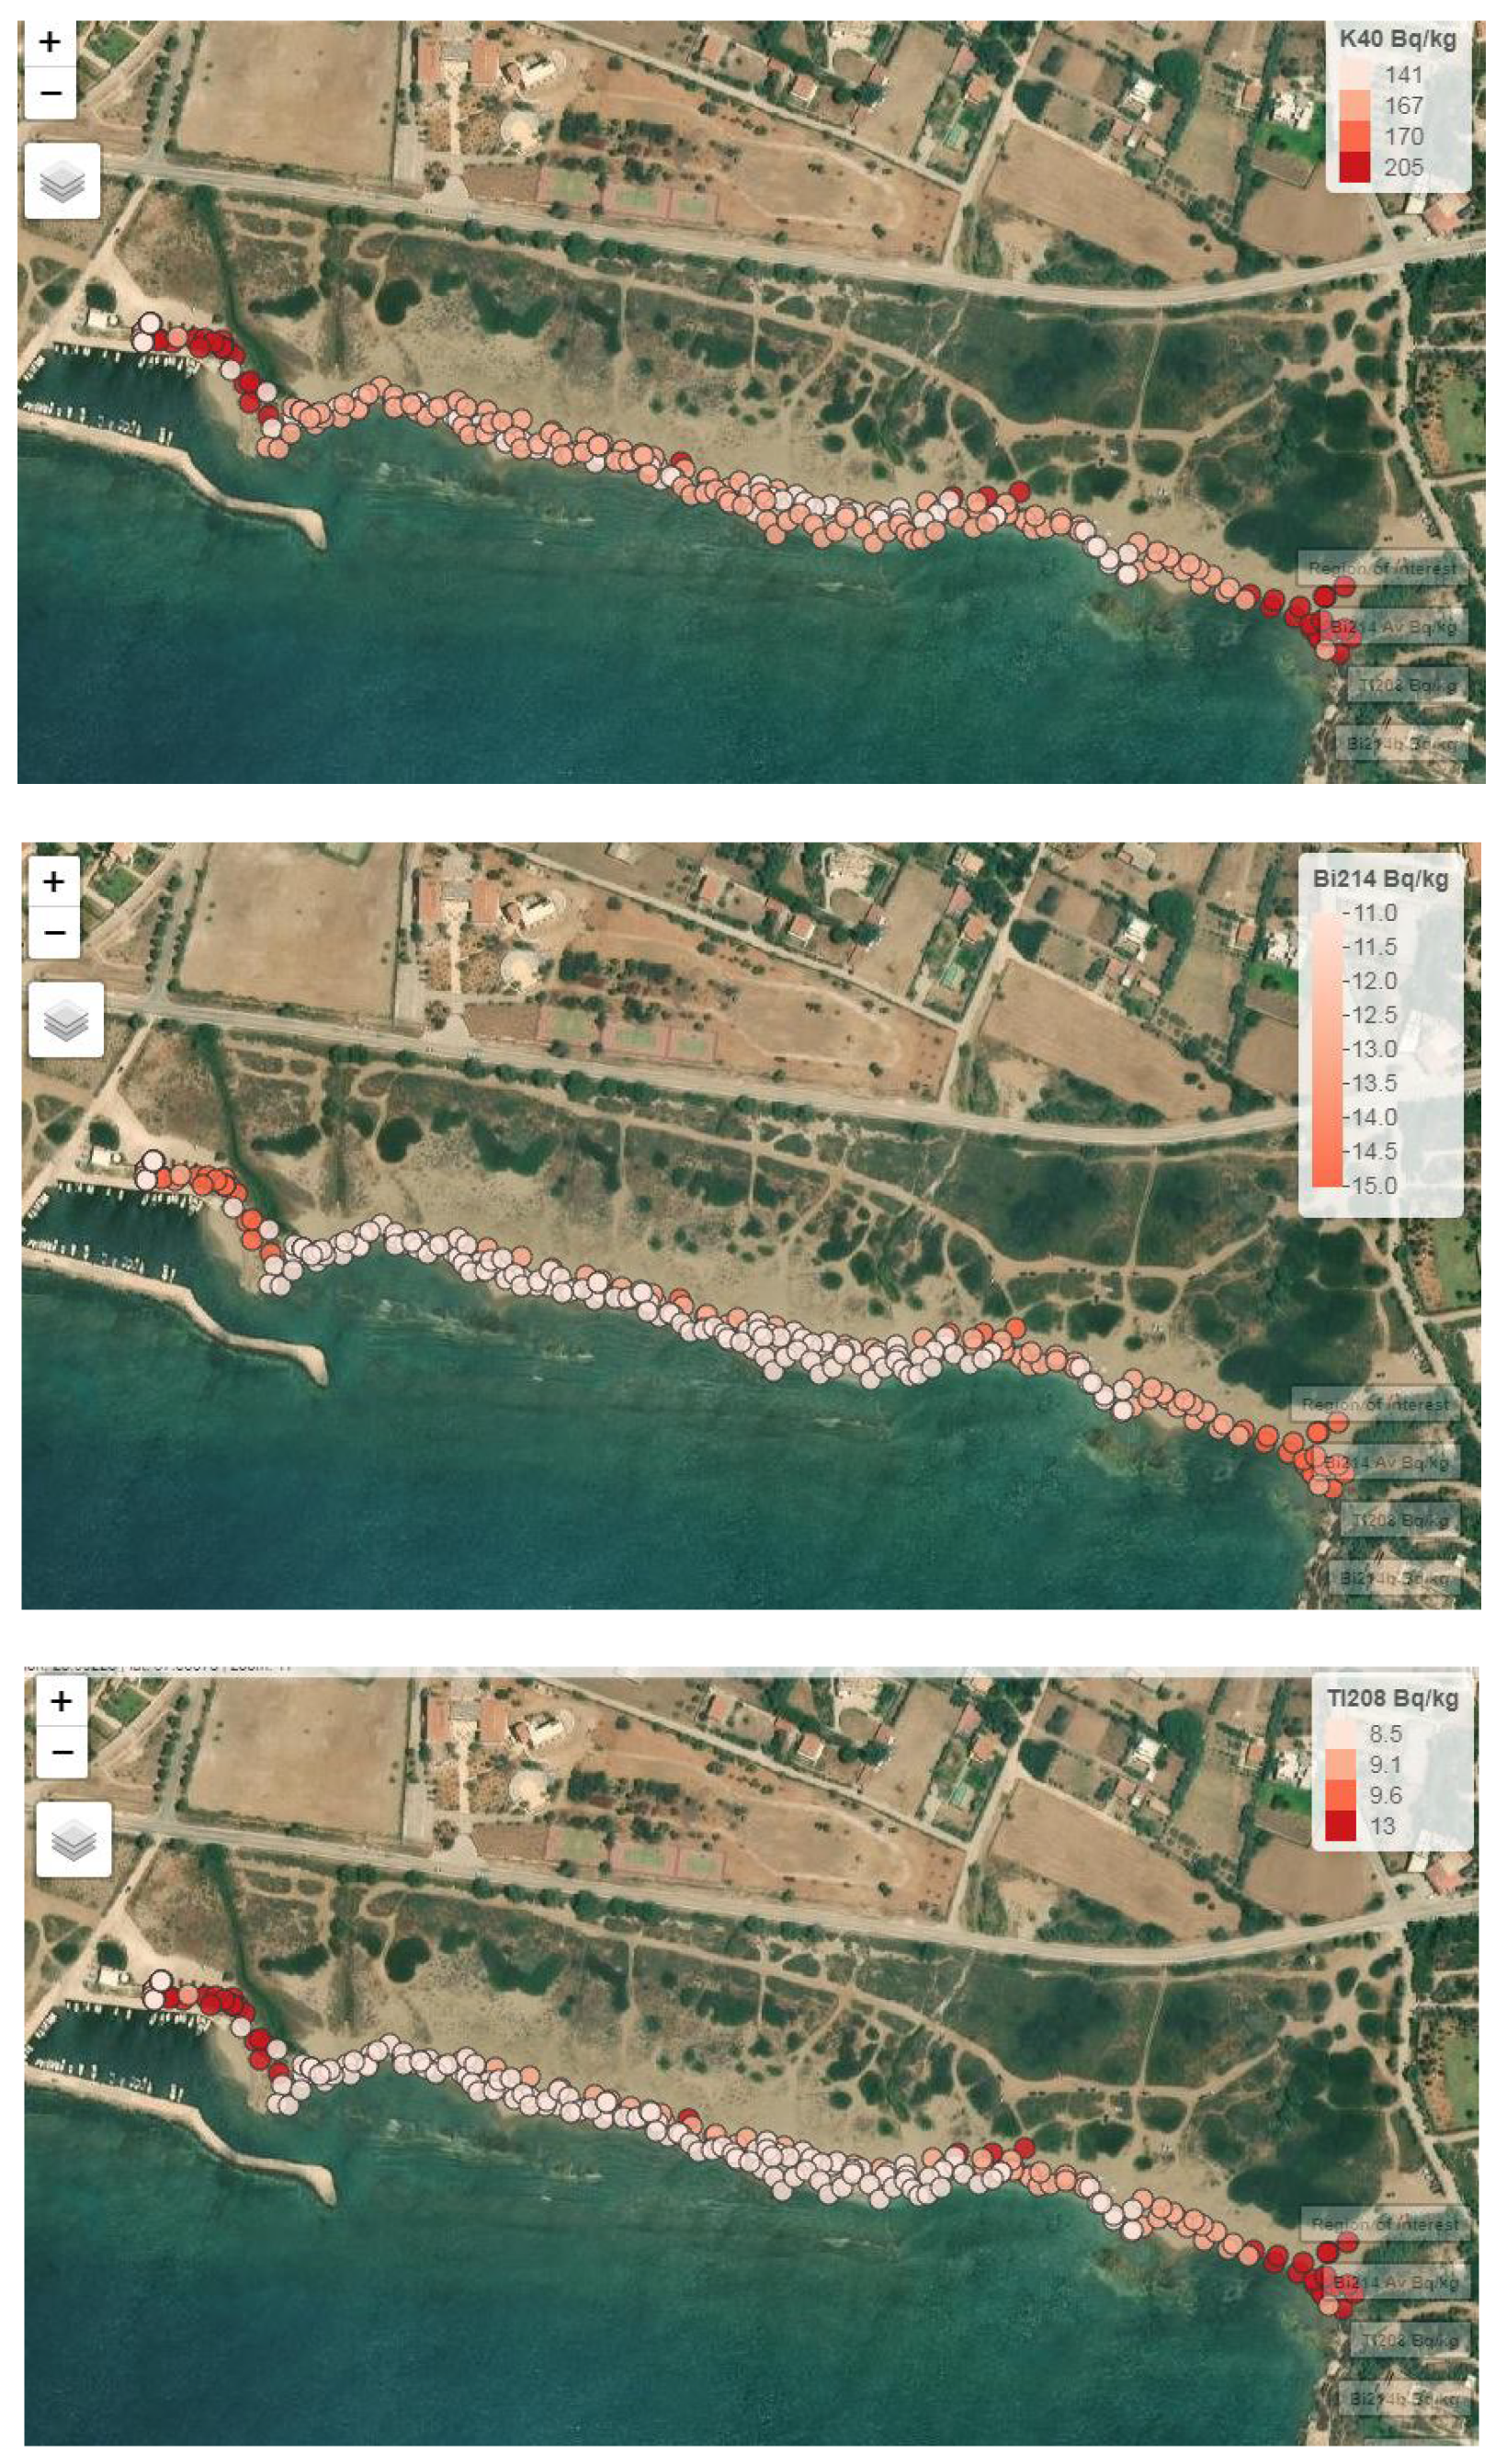
4.3. MEDUSA System
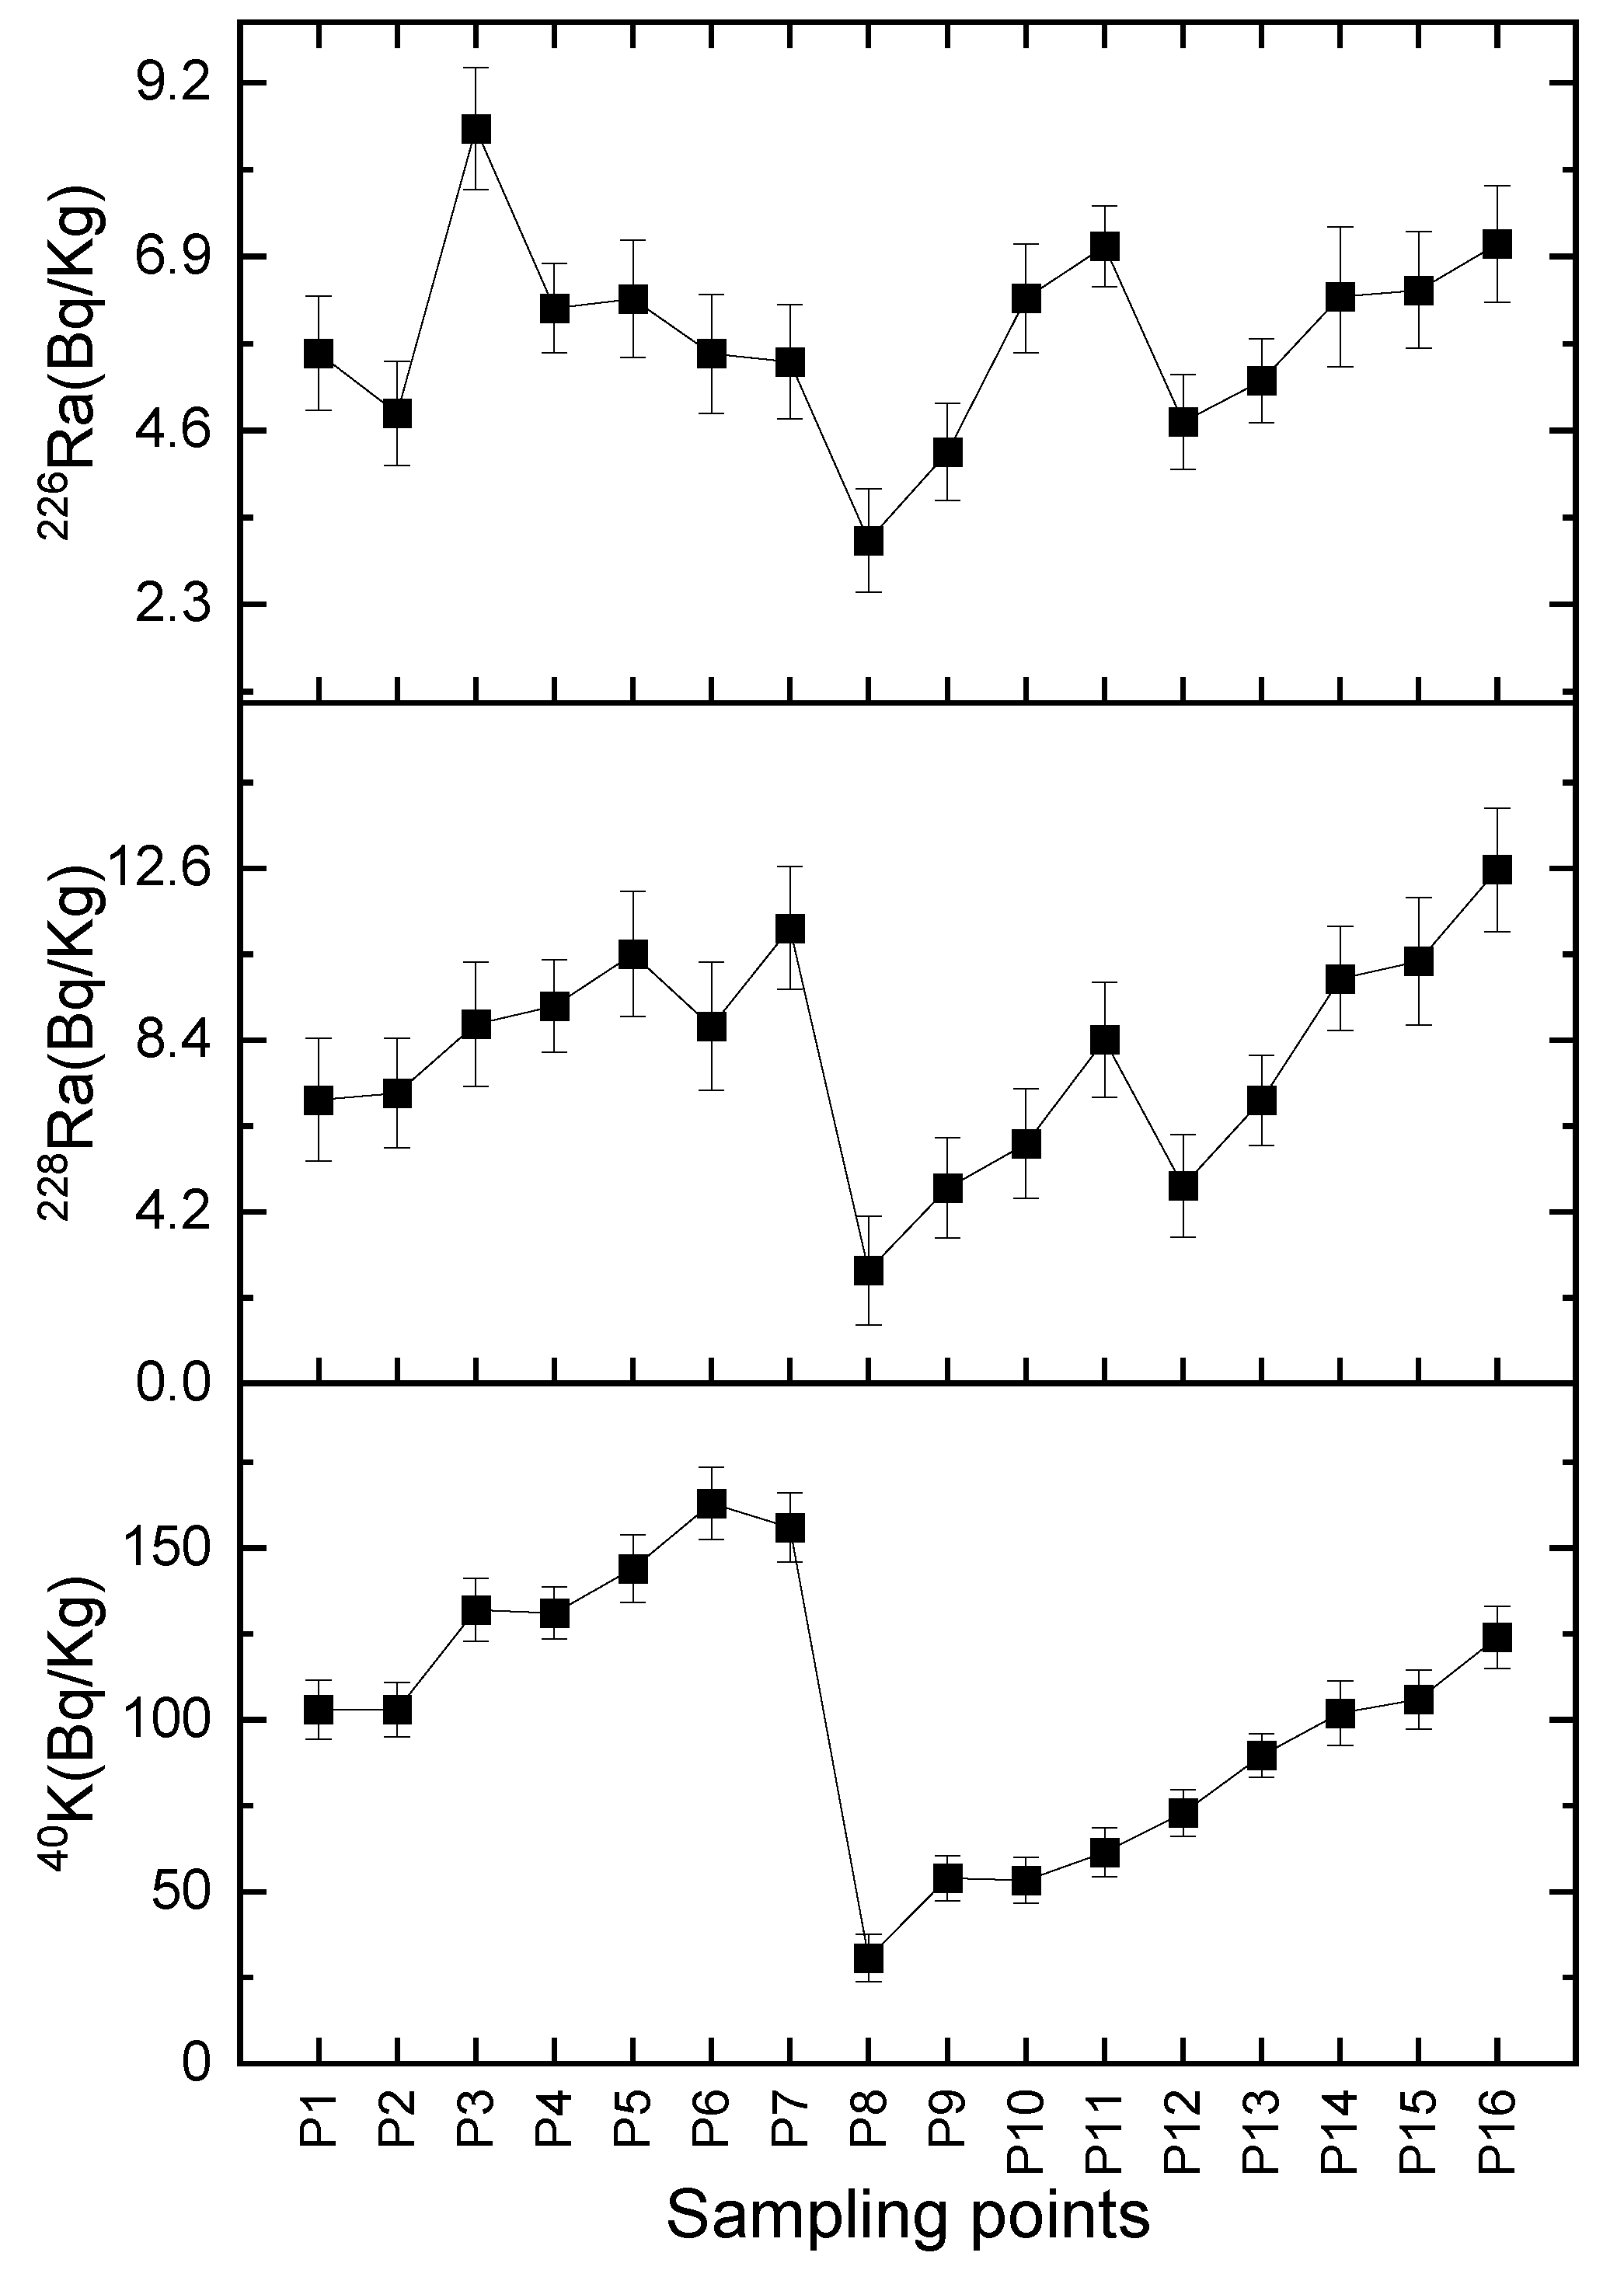
4.4. Validation Though Lab-Based Measurements
4.5. Wave Properties
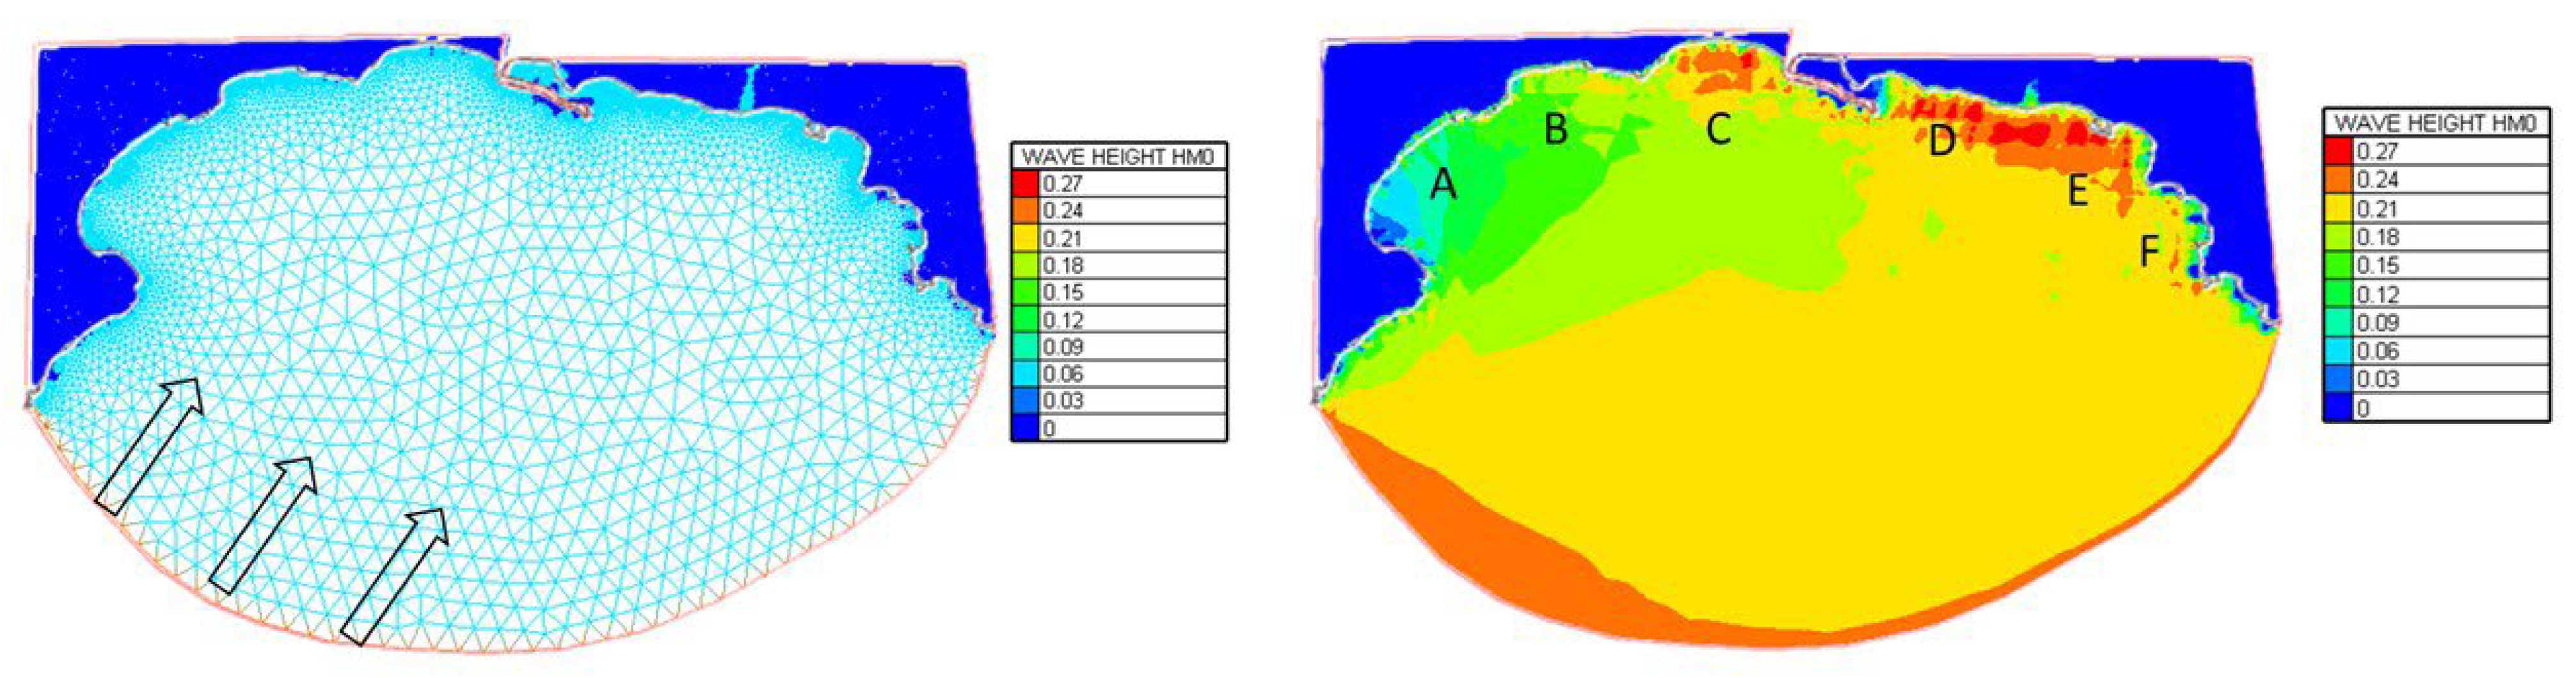
4.5.1. Significant Wave Height
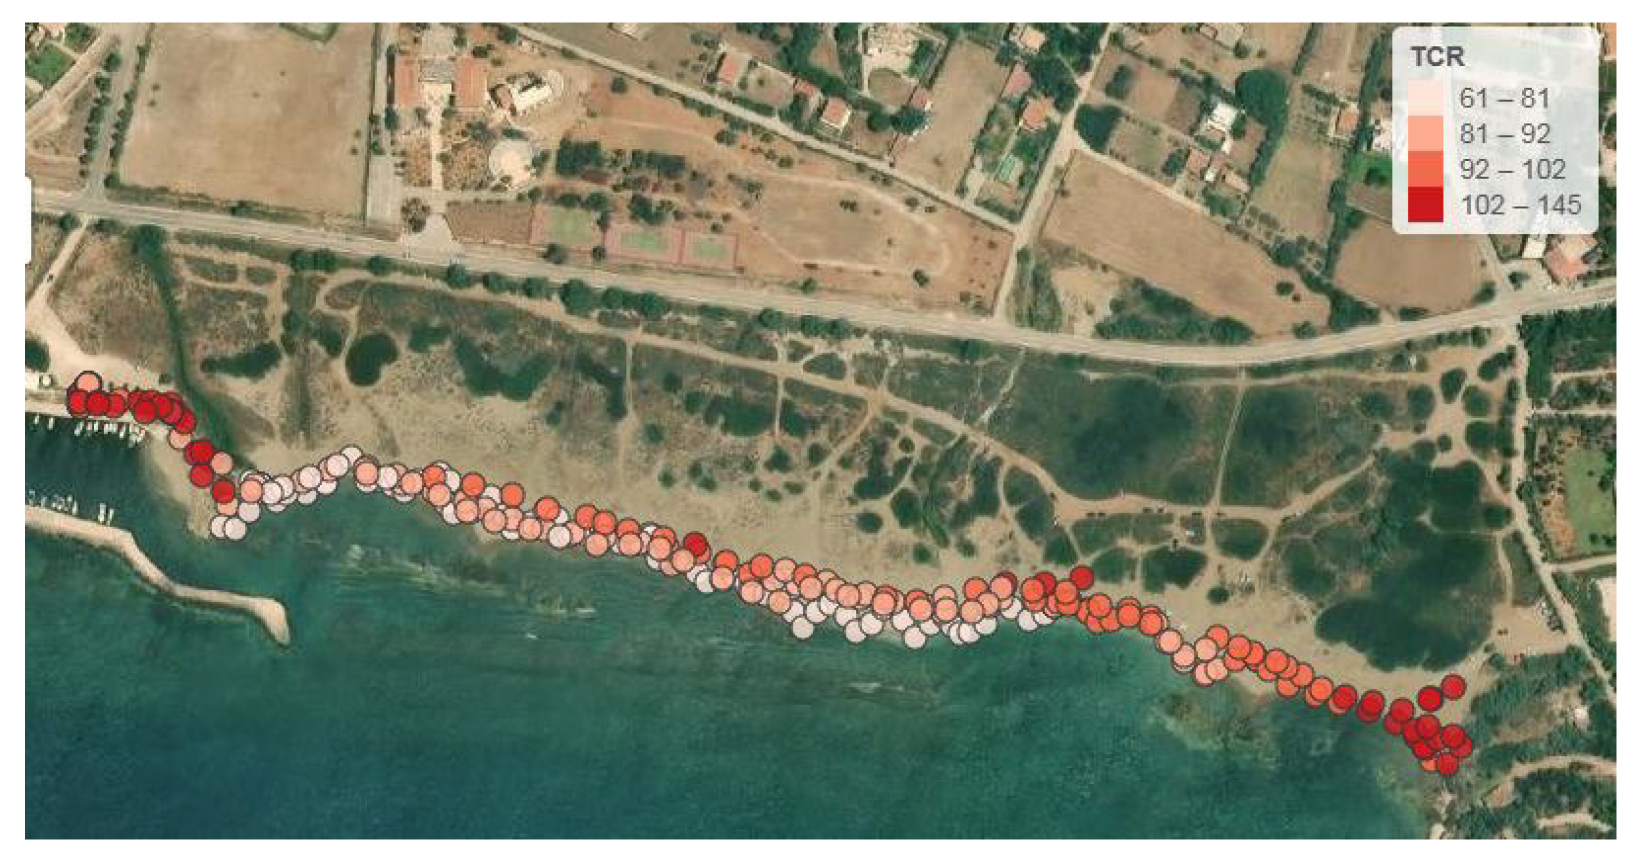
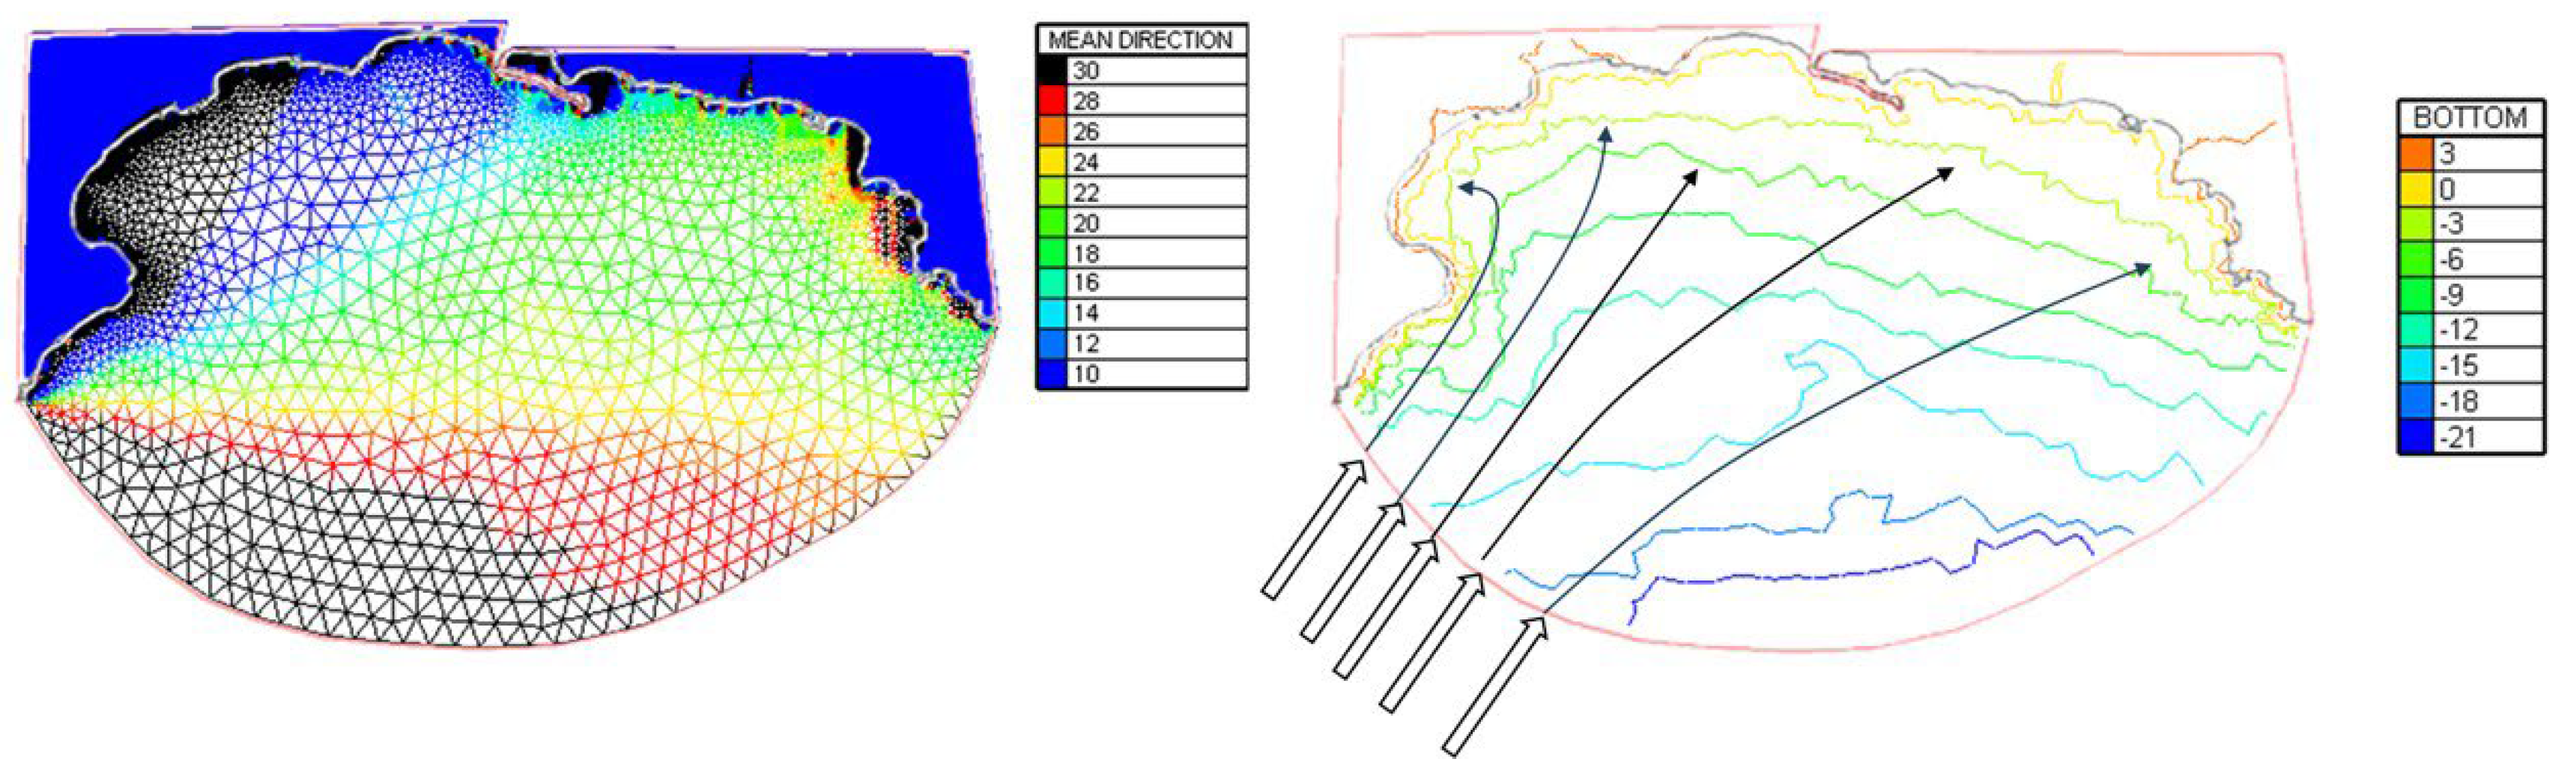
4.5.2. Wave Refraction Pattern
5. Discussion
5.1. Comparison Between In Situ and Lab-Based Methods
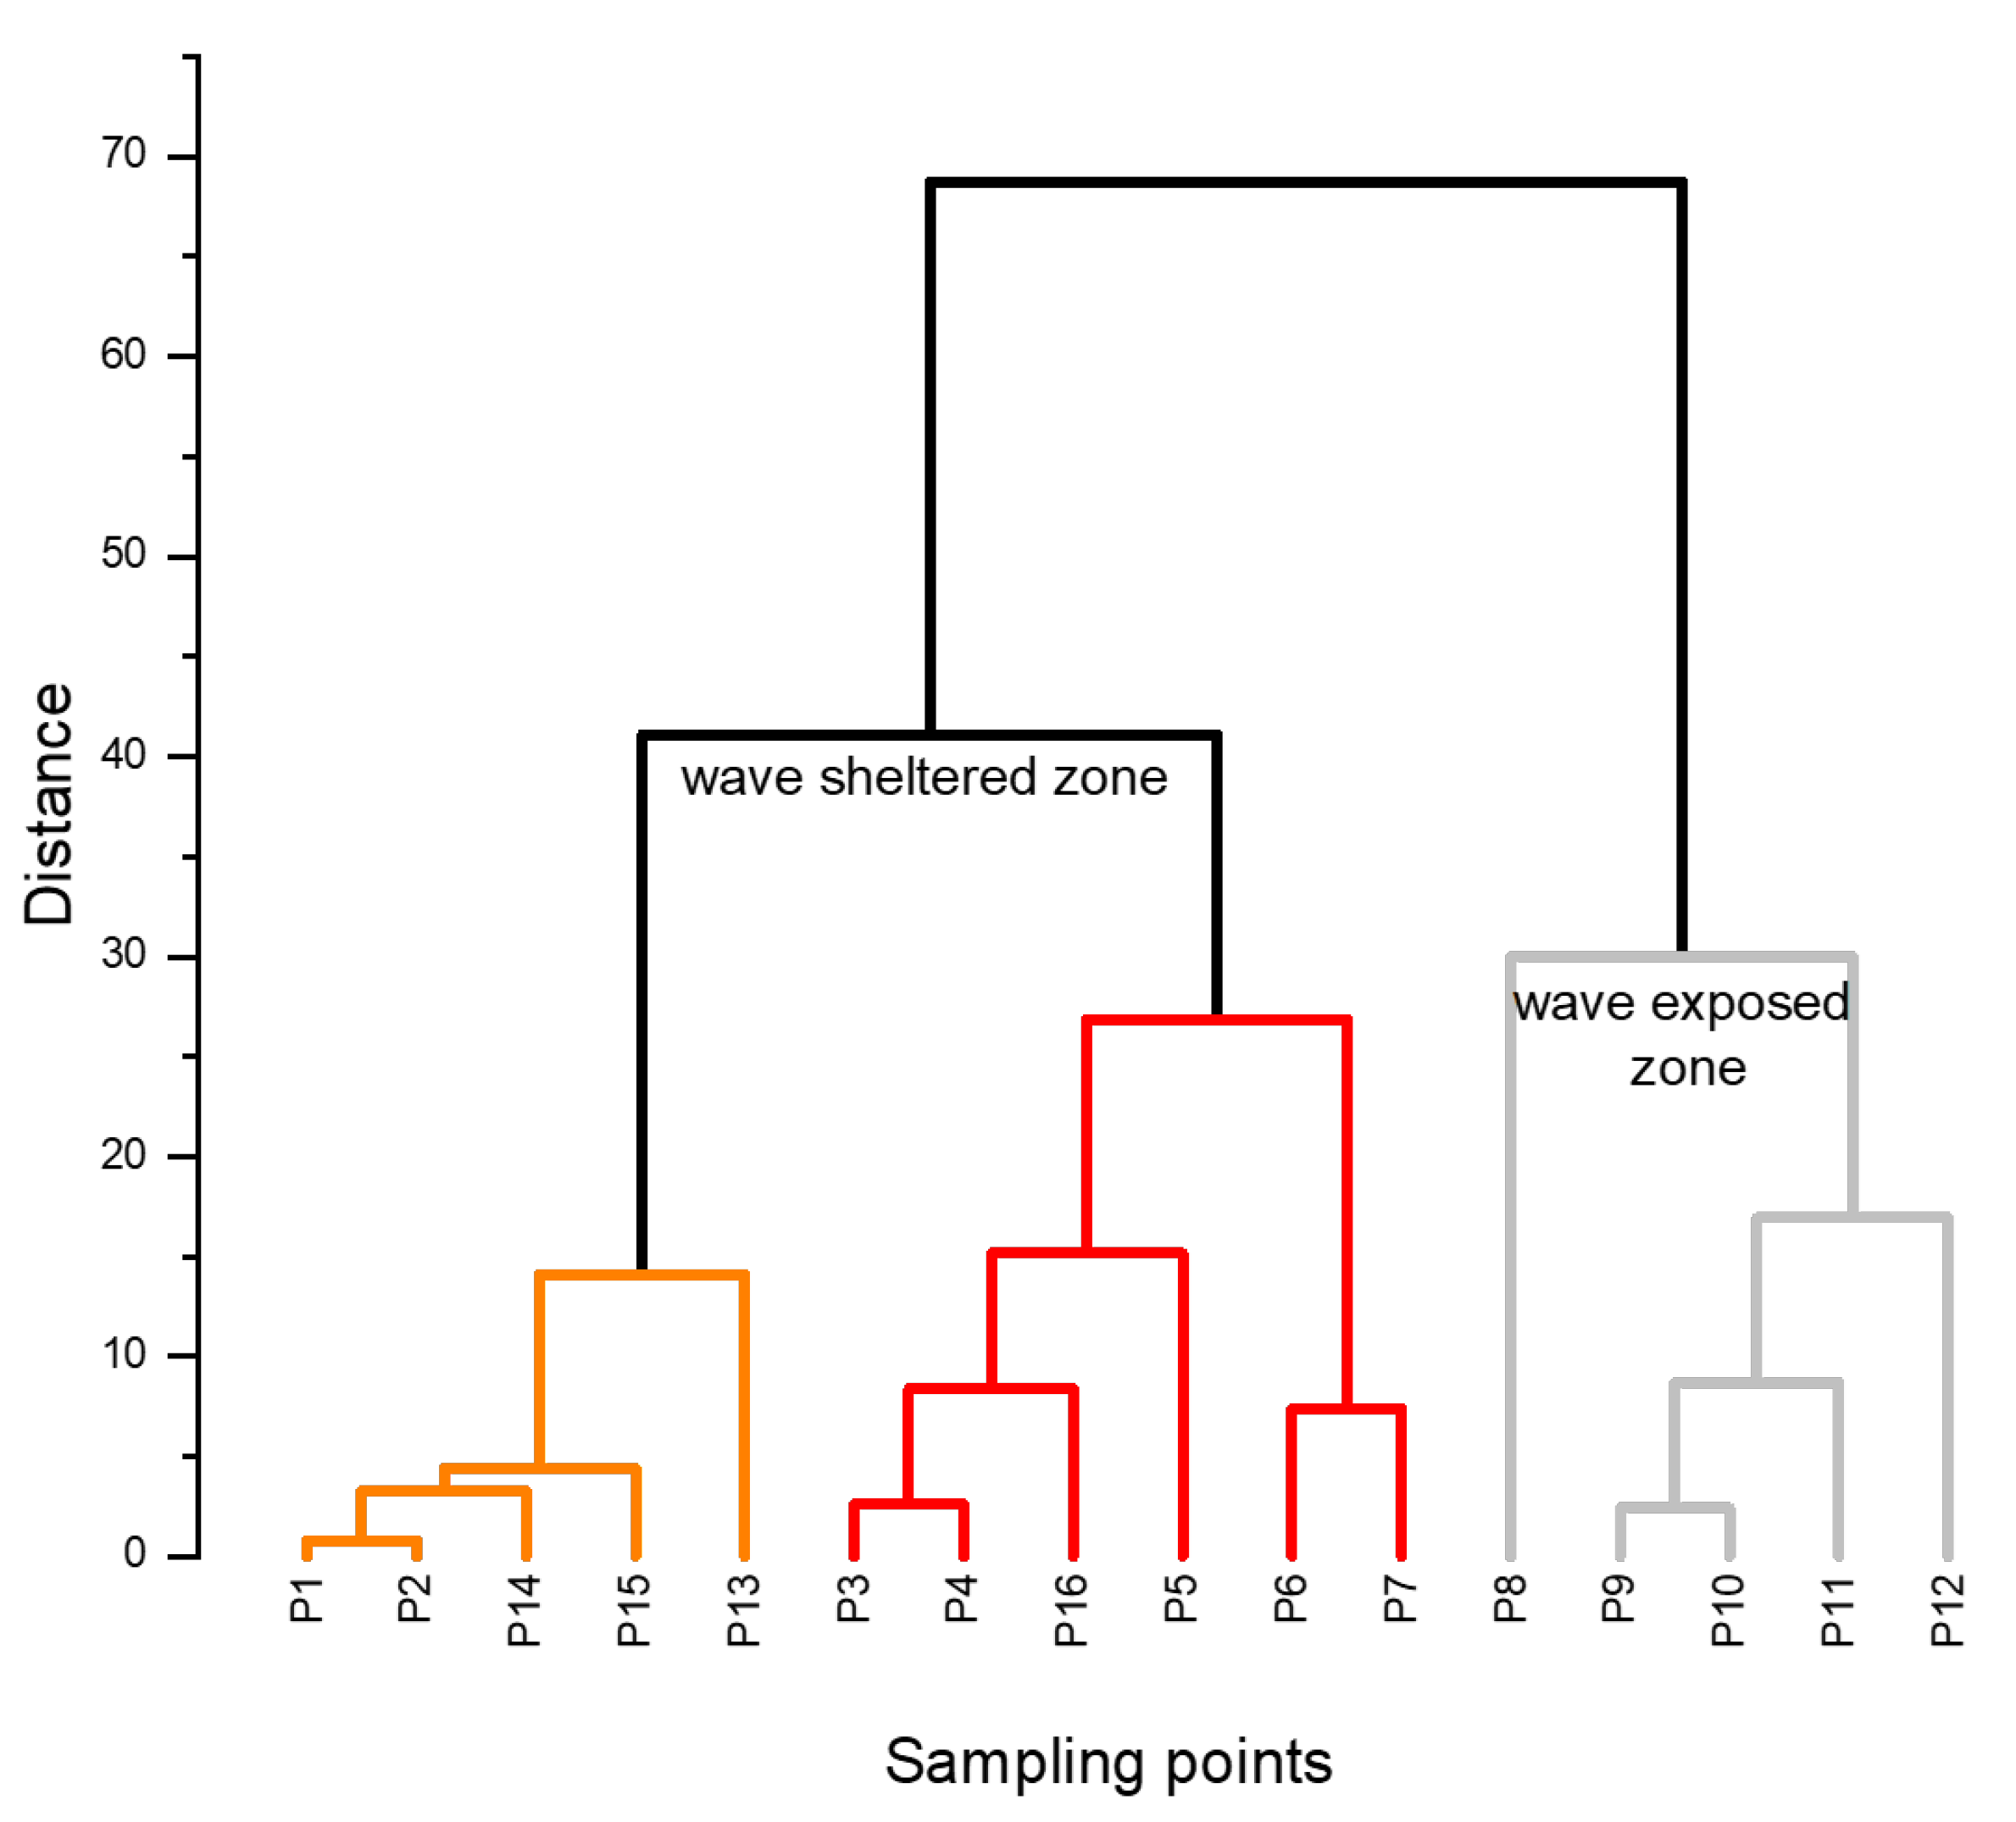
5.2. Statistical Analysis and Cluster Patterns
6. Summary—Perspectives
Author Contributions
Funding
Institutional Review Board Statement
Informed Consent Statement
Data Availability Statement
Acknowledgments
Conflicts of Interest
References
- IAEA. Terminology Used in Nuclear Safety, Nuclear Security, Radiation Protection and Emergency Preparedness and Response 2022 (Interim) Edition; International Atomic Energy Agency: Vienna, 2022. [Google Scholar]
- van Wijngaarden, M.; Venema, L.B.; De Meijer, R.J. Radiometric sand mud characterisation in the Rhine—Meuse Estuary Part B. In situ mapping. Geomorphology 2002, 43, 103–116. [Google Scholar] [CrossRef]
- van Wijngaarden, M.; Venema, L.B.; De Meijer, R.J.; Zwolsman, J.J.G. Radiometric sand—mud characterisation in the Rhine—Meuse estuary Part A. Fingerprinting. Geomorphology 2002, 43, 87–101. [Google Scholar] [CrossRef]
- Koomans, R.L.; de Meijer, R.J. Density gradation in cross-shore sediment transport. Coast. Eng. 2004, 51, 1105–1115. [Google Scholar] [CrossRef]
- Nederbragt, G.; Koomans, R.L. Nourishment of the slope of a tidal channel from experiment to practice. In Proceedings of the 5th International Conference on Coastal Dynamics (CD05), Barcelona, Spain, 4–8 April 2005. [Google Scholar]
- Venema, L.B.; de Meijer, R.J. Natural radionuclides as tracers of the dispersal of dredge spoil dumped at sea. J. Env. Radioact. 2001, 55, 221–239. [Google Scholar] [CrossRef]
- Bezuidenhout, J. Investigating naturally occurring radionuclides in sediment by characterizing the catchment basin geology of rivers in South Africa. J. Appl. Geophy. 2023, 213, 105037. [Google Scholar] [CrossRef]
- de Meijer, R.J.; Donoghue, J.F. Radiometric fingerprinting of sediments on the Dutch, German and Danish coasts. Quat. Int. 1995, 26, 43–47. [Google Scholar] [CrossRef]
- Komar, P.D.; Wang, C. Processes of Selective Grain Transport and the Formation of Placers on Beaches. J. Geol. 1984, 92, 637–655. [Google Scholar] [CrossRef]
- Koomans, R.L. Sand in Motion: Effects of Density and Grain Size (PHD); RUG: Groningen, The Netherlands, 2000. [Google Scholar]
- Tsabaris, C.; Bagatelas, C.; Dakladas, T.; Papadopoulos, C.T.; Vlastou, R.; Chronis, G.T. An autonomous in situ detection system for radioactivity measurements in the marine environment. Appl. Radiat. Isot. 2008, 66, 1419–1426. [Google Scholar] [CrossRef]
- Tsabaris, C.; Androulakaki, E.G.; Ballas, D.; Alexakis, S.; Perivoliotis, L.; Iona, A. Radioactivity Monitoring at North Aegean Sea Integrating In-Situ Sensor in an Ocean Observing Platform. J. Mar. Sci. Eng. 2021, 9, 77. [Google Scholar] [CrossRef]
- Tsabaris, C.; Patiris, D.L.; Adams, R.; Castillo, J.; Henriquez, M.F.; Hurtado, C.; Munoz, L.; Kalpaxis, L.; Verri, M.; Alexakis, S.; et al. In Situ Radioactivity Maps and Trace Metal Concentrations in Beach Sands of a Mining Coastal Area at North Aegean, Greece. J. Mar. Sci. Eng. 2023, 11, 1207. [Google Scholar] [CrossRef]
- Bagatelas, C.; Tsabaris, C.; Kokkoris, M.; Papadopoulos, C.T.; Vlastou, R. Determination of marine gamma activity and study of the minimum detectable activity (MDA) in 4pi geometry based on Monte Carlo simulation. Environ. Monit. Assess. 2010, 165, 159–168. [Google Scholar] [CrossRef]
- Arriola-Velasquez, A.; Tejera, A.; Guerra, J.G.; Alonso, I.; Alonso, H.; Arnedo, M.A.; Rubiano, J.G.; Martel, P. Spatio-temporal variability of natural radioactivity as tracer of beach sedimentary dynamics. Estuar. Coast Shelf S. 2019, 231, 106476. [Google Scholar] [CrossRef]
- Witt, C.; Kopf, A. Submarine Groundwater Discharge in the Nice Airport Landslide Area. J. Mar. Sci. Eng. 2025, 13, 909. [Google Scholar] [CrossRef]
- Tsabaris, C.; Patiris, D.L.; Karageorgis, A.P.; Eleftheriou, G.; Papadopoulos, V.P.; Georgopoulos, D.; Papathanassiou, E.; Povinec, P.P. In-situ radionuclide characterization of a submarine groundwater discharge site at Kalogria Bay, Stoupa, Greece. J. Environ. Ra-dioact. 2012, 108, 50–59. [Google Scholar] [CrossRef]
- Patiris, D.L.; Tsabaris, C.; Maramathas, C.; Alexakis, S.; Roumelioti, S.K. Radioactivity mapping of beach sand by mobile in situ gamma-ray spectrometry. Hell. Nucl. Phys. Soc. Adv. Nucl. Phys. 2023, 30, 116–123. [Google Scholar]
- R Core Team. R: A Language and Environment for Statistical Computing; R Foundation for Statistical Computing: Vienna, Austria, 2020; Available online: https://www.R-project.org (accessed on 1 January 2019).
- van der Graaf, E.R.; Limburg, J.; Koomans, R.L.; Tijs, M. Monte Carlo based calibration of scintillation detectors for laboratory and in situ gamma ray measurements. J. Environ. Radioact. 2011, 102, 270–282. [Google Scholar] [CrossRef]
- QGIS Development Team. QGIS Geographic Information System; Open Source Geospatial Foundation: Beaverton, OR, USA, 2009; Available online: http://qgis.org (accessed on 22 June 2025).
- IAEA. Analytical Quality in Nuclear Applications No. IAEA/AQ/19; International Atomic Energy Agency: Vienna, 2010. [Google Scholar]
- Karfopoulos, K.; Domingos, F.; de With, G.; Michalik, B.; Okyar, H.B.; Maramathas, C.; Salpadimos, N.; Potiriadis, C.; Neculae, V.; Ďurecová, A.; et al. Results of the joint IAEA/EEAE Intercomparison exercise on radioanalytical characterization of NORM samples in the European region. Radiat. Prot. Dosim. 2025, 201, 223–246. [Google Scholar] [CrossRef]
- Arriola-Velásquez, A.C.; Tejera, A.; Guerra, J.G.; Geibert, W.; Stimac, I.; C’amara, F.; Alonso, H.; Rubiano, J.G.; Martel, P. 226Ra, 228Ra and 40K as tracers of erosion and accumulation processes: A 3-year study on a beach with different sediment dynamics. Catena 2021, 207, 105705. [Google Scholar] [CrossRef]
- Korres, G.; Ravdas, M.; Zacharioudaki, A.; Denaxa, D.; Sotiropoulou, M. Mediterranean Sea Waves Reanalysis (CMEMS Med-Waves, MedWAM3 System) Version 1 [Data Set]; Copernicus Monitoring Environment Marine Service (CMEMS): Brussels, Belgium, 2021. [Google Scholar] [CrossRef]
- Escudier, R.; Clementi, E.; Omar, M.; Cipollone, A.; Pistoia, J.; Aydogdu, A.; Drudi, M.; Grandi, A.; Lyubartsev, V.; Lecci, R.; et al. Mediterranean Sea Physical Reanalysis (CMEMS MED-Currents) Version 1 [Data Set]; Copernicus Monitoring Environment Marine Service (CMEMS): Brussels, Belgium, 2020. [Google Scholar] [CrossRef]
- Villaret, C.; Hervouet, J.-M.; Kopmann, R.; Merkel, U.; Davies, A.G. Morphodynamic modeling using the TELEMAC finite-element system. Comput. Geosci. 2013, 53, 105–113. [Google Scholar] [CrossRef]
- Benoit, M.; Marcos, F.; Becq, F. Development of a third generation shallow water wave model with unstructured spatial meshing. In Proceedings of the 25th International Conference on Coastal Engineering (ICCE’1996), New York, NY, USA, 2–6 September 1996; pp. 465–478. [Google Scholar]
- Santoro, P.; Fossati, M.; Tassi, P.; Huybrechts, N.; Piedra-Cuevo, I.; Van Bang, D.P. A coupled wave-current-sediment transport model for an estuarine system: Application to the Río de la Plata and Montevideo Bay. Appl. Math. Model. 2017, 52, 107–130. [Google Scholar] [CrossRef]
- Odom, I.E.; Doe, T.W.; Dott, R.H. Nature of feldspar-grain size relations in some quartz-rich sandstones. J. Sediment. Res. 1976, 46, 862–870. [Google Scholar] [CrossRef]
- JCGM 200:2012; International Vocabulary of Metrology—Basic and General Concepts and Associated Terms (VIM), 3rd ed. Joint Committee for Guides in Metrology, 2012.
- ISO 18589:3:2023; Measurement of Radioactivity in the Environment-Soi-Part 3: Test Method of Gamma-Emitting Radionuclides Using Gamma-ray Spectrometry. International Organization for Standardization: Geneva, Switzerland, 2023.
- ISO 18589:7:2013; Measurement of Radioactivity in the Environment-Soil-Part 7: In Situ Measurement of Gamma-Emitting Radionuclides. International Organization for Standardization: Geneva, Switzerland, 2013.
- ISO 18589:2:2022; Measurement of Radioactivity in the Environment-Soil-Part 2: Guidance for the Selection of the Sampling Strategy, Sampling and Pre-Treatment of Samples. International Organization for Standardization: Geneva, Switzerland, 2022.
- Ramsey, M.H.; Ellison, S.L.R.; Rostron, P. Eurachem/EUROLAB/CITAC/Nordtest/AMC Guide: Measurement Uncertainty Arising from Sampling: A Guide to Methods and Approaches, 2nd ed.; Eurachem, 2019; ISBN 978-0-948926-35-8. [Google Scholar]
- Magnusson, B.; Krysell, M.; Sahlin, E.; Näykki, T. Uncertainty from sampling, Nordtest Report TR 604, 2nd ed.; Nordtest, 2020; ISBN 978-91-89167-31-5. [Google Scholar]
- Achilleos, G.A. The Inverse Distance Weighted interpolation method and error propagation mechanism—Creating a DEM from an analogue topographical map. J. Spat. Sci. 2011, 56, 283–304. [Google Scholar] [CrossRef]
- Gong, G.; Mattevada, S.; O’Bryant, S.E. Comparison of the accuracy of kriging and IDW interpolations in estimating groundwater arsenic concentrations in Texas. Environ. Res. 2014, 130, 59–69. [Google Scholar] [CrossRef]
- Thereska, J. Natural radioactivity of coastal sediments as tracer in dynamic sedimentology. Nukleonika 2009, 54, 45–50. [Google Scholar]
- Yang, W.-F.; Chen, M.; Zhang, X.-X.; Guo, Z.-G.; Li, G.-X.; Ma, Q.; Yang, J.-H.; Huang, Y.-P. Thorium isotopes (228Th, 230Th, 232Th) and applications in reconstructing the Yangtze and Yellow River floods. Int. J. Sediment Res. 2013, 28, 588–595. [Google Scholar] [CrossRef]
- Naeem, N.; Sohail, M.; Ahmed, R.; Masood, S. Application of gamma spectrum analysis techniques for natural radioactivity measurements using NaI(Tl) detector. Env. Monit Assess. 2025, 197, 418. [Google Scholar] [CrossRef]
- Zhao, R.; Liu, L.-Y.; Liu, X.; Liu, Z.-X.; Liang, R.-C.; Ling-Hu, R.-J.; Zhang, J.; Chen, F.-G. Continuum estimation in low-resolution gamma-ray spectra based on deep learning. Nucl. Sci. Technol. 2025, 36, 23. [Google Scholar] [CrossRef]


| 40K | 228Ra | 226Ra | 226Ra/228Ra | |
|---|---|---|---|---|
| 40K | 1 | 0.0004 | 0.0736 | 0.0004 |
| 228Ra | 0.7795 | 1 | 0.0034 | <0.0001 |
| 226Ra | 0.4591 | 0.6857 | 1 | 0.3387 |
| 226Ra/228Ra | −0.7735 | −0.8459 | −0.2559 | 1 |
Disclaimer/Publisher’s Note: The statements, opinions and data contained in all publications are solely those of the individual author(s) and contributor(s) and not of MDPI and/or the editor(s). MDPI and/or the editor(s) disclaim responsibility for any injury to people or property resulting from any ideas, methods, instructions or products referred to in the content. |
© 2025 by the authors. Licensee MDPI, Basel, Switzerland. This article is an open access article distributed under the terms and conditions of the Creative Commons Attribution (CC BY) license (https://creativecommons.org/licenses/by/4.0/).
Share and Cite
Tsabaris, C.; Tejera, A.; Koomans, R.L.; Pham van Bang, D.; Hammouti, A.; Malliouri, D.; Kapsimalis, V.; Martel, P.; Arriola-Velásquez, A.C.; Alexakis, S.; et al. Evaluation of Coastal Sediment Dynamics Utilizing Natural Radionuclides and Validated In-Situ Radioanalytical Methods at Legrena Beach, Attica Region, Greece. J. Mar. Sci. Eng. 2025, 13, 1229. https://doi.org/10.3390/jmse13071229
Tsabaris C, Tejera A, Koomans RL, Pham van Bang D, Hammouti A, Malliouri D, Kapsimalis V, Martel P, Arriola-Velásquez AC, Alexakis S, et al. Evaluation of Coastal Sediment Dynamics Utilizing Natural Radionuclides and Validated In-Situ Radioanalytical Methods at Legrena Beach, Attica Region, Greece. Journal of Marine Science and Engineering. 2025; 13(7):1229. https://doi.org/10.3390/jmse13071229
Chicago/Turabian StyleTsabaris, Christos, Alicia Tejera, Ronald L. Koomans, Damien Pham van Bang, Abdelkader Hammouti, Dimitra Malliouri, Vasilios Kapsimalis, Pablo Martel, Ana C. Arriola-Velásquez, Stylianos Alexakis, and et al. 2025. "Evaluation of Coastal Sediment Dynamics Utilizing Natural Radionuclides and Validated In-Situ Radioanalytical Methods at Legrena Beach, Attica Region, Greece" Journal of Marine Science and Engineering 13, no. 7: 1229. https://doi.org/10.3390/jmse13071229
APA StyleTsabaris, C., Tejera, A., Koomans, R. L., Pham van Bang, D., Hammouti, A., Malliouri, D., Kapsimalis, V., Martel, P., Arriola-Velásquez, A. C., Alexakis, S., Androulakaki, E. G., Eleftheriou, G., Kilel, K., Maramathas, C., Patiris, D. L., & Affum, H. (2025). Evaluation of Coastal Sediment Dynamics Utilizing Natural Radionuclides and Validated In-Situ Radioanalytical Methods at Legrena Beach, Attica Region, Greece. Journal of Marine Science and Engineering, 13(7), 1229. https://doi.org/10.3390/jmse13071229