Abstract
The upper facilities of polar marine equipment face severe freezing risks in ice-covered regions, necessitating energy-efficient electric heat tracing design. Existing models neglect coupled environmental factors (temperature–wind–humidity), leading to the overestimation of heating power. In this paper, experiment and CFD simulation are used to study the change of convective heat transfer coefficients of electric tracing circular tube components under the polar coupling environmental conditions of wind speed of 0~8 m/s, temperature of −40~0 °C, and air relative humidity of 10~95%, and the corresponding mathematical prediction model is established. The results show that increasing the wind speed and relative humidity will both increase the convective heat transfer coefficient of the circular tube, while the temperature is inversely proportional to the convective heat transfer coefficient of the circular tube. The convective heat transfer coefficient shows an average growth rate of only 2.8–3.8% as the temperature decreases from −10 °C to −40 °C, which is significantly lower than the effects of wind speed (average growth rate 59–50%) and humidity (average growth rate 7.5–12.7%). When the wind speed exceeds 2 m/s, the growth rate of humidity’s effect on the coefficient increases from 17.82% to 33.96%. Mathematical prediction models can provide certain references for the calculation and design of reasonable heating amounts for anti-icing and de-icing of polar equipment’s circular tube components under ice-covered regions.
1. Introduction
Ice-covered regions are characterized by harsh climatic conditions, including extremely low temperatures, strong wind speeds, and high-humidity air [1]. In such environments, engineering structures often face severe thermal-moisture loads; for example, cold air accompanied by strong winds significantly enhances heat dissipation from structural surfaces, leading to a sharp drop in structural temperature [2]. Meanwhile, humid air at low temperatures easily causes ice formation on structural surfaces. These factors collectively lead to ice accumulation on the surfaces of marine engineering equipment and ship structures, threatening their safety and normal operation [3]. Existing studies have shown that wind-driven ice accumulation at low temperatures can reduce structural stability and material performance, increasing operational risks and maintenance costs [4].
In recent years, research on the convective heat transfer (CHT) characteristics of engineering structure surfaces in ice-covered regions has made notable progress, yet many scientific challenges remain unresolved. In experimental research, due to the difficulties of on-site testing in polar regions, many scholars have resorted to simulating polar climates in low-temperature wind tunnels and environmental laboratories. Yu et al. [5] conducted forced CHT experiments on circular tubes under low-temperature and high-wind-speed conditions and found that the CHT coefficient on the tube surface increased significantly with increasing wind speed and decreasing ambient temperature, although humidity was not considered in their study. Fand et al. [6] studied the heat transfer rate on the surface of circular tubes under constant wall temperature conditions and proposed a continuous correlation equation for heat transfer in cylindrical bodies subjected to cross-flow in air. Zhao et al. [7] considered turbulent flow in the inlet region and boundary conditions, measured the outer wall temperature to calculate the Nusselt number, and proposed a new correlation formula with an accuracy improvement of over 25%. Haghgoo, M.R. et al. [8] used a combined numerical and experimental approach to compare the flow and heat transfer characteristics between a zigzag cylinder and a straight cylinder in parallel wall channels (Reynolds numbers 626/680, blockage ratio 0.42), revealing that the zigzag cylinder suppresses unsteady vortex shedding to form a steady wake. Zwolińska-Glądys, K. et al. [9] established a correlation for forced convection across a cylinder through experiments, validating its high consistency with classical correlations and revealing the non-monotonic variation of the contact factor with the oncoming air velocity, providing a simplified model for engineering thermal design. Kočí, J. et al. [10] for the first time incorporated relative humidity (RH) as an independent variable into building thermal simulation and energy consumption analysis through closed-loop climatic wind tunnel experiments with controllable environmental parameters. They found that RH could cause changes in the CHT coefficient of up to 37%, and the influence increased significantly when humidity exceeded 50–55%, providing key parameter corrections for improving the accuracy of building energy simulations. Similarly, Xu, Z. et al. [11] were the first to introduce condensation phenomena into the study of forced convection in cross-flow around cylinders. Through experiments and three-dimensional CFD simulations (considering the influence of non-condensable gases), they revealed that heat transfer on the leeward side was enhanced by the development of separation vortices with increasing Reynolds number, and increasing RH significantly increased the average condensation heat transfer coefficient. While experimental studies have provided basic data on the heat transfer laws of components such as circular tubes under polar conditions, most experiments only involve dry air scenarios and do not consider the impact of ice formation on heat transfer under high humidity, especially given that humidity has been identified as a key factor affecting heat transfer coefficients in the above studies.
In numerical simulations, CFD has been widely used in CHT research in cold regions. Many studies focus on improving numerical methods and analyzing turbulence mechanisms for flow around cylinders under conventional conditions. For example, in early research, Wan et al. [12] used an improved very large eddy simulation method to simulate flow around circular tubes, successfully reproducing transient flow fields and heat transfer characteristics at different Reynolds numbers. For special ice-covered regions, some scholars have coupled CFD with ice formation models to simulate ice accumulation processes. Churchill et al. [13] derived a correlation Nusselt number criterion for fluid cross-flow over a single tube based on theoretical and experimental results of Reynolds numbers in laminar boundary layers. Additionally, some studies have attempted to evaluate the applicability of empirical correlations under extreme conditions. Engineering often uses empirical formulas such as Churchill–Bernstein [14] to estimate the CHT coefficients of components like circular tubes, but these formulas are mainly based on experimental data at normal temperature and pressure and do not fully account for changes in air’s physical properties below −40 °C or the impact of surface ice formation. Most scholars have compared the calculation differences of different heat transfer correlations under low-temperature and strong-wind conditions, with results showing significant discrepancies in the heat transfer coefficients provided by each correlation. This indicates that more targeted heat transfer correlations are needed for ice-covered regions. When air contains water vapor, frost or ice layers may form on surfaces, and their porous medium characteristics can hinder CHT. Krasota et al. [15] observed through experiments that when a frost layer appears on a cold surface, the “failure” of CHT between air and the wall is evident, as the frost layer acts as an insulating layer, causing a significant decrease in the heat transfer coefficient. Anna-Lena Ljung [16] studied evaporation under forced convection affected by RH and found that the influence of temperature difference on heat transfer was more pronounced under high-humidity conditions. Davis et al. [17] studied the heat loss of electric heat tracing circular tube components in CHT and found that the larger the temperature difference between the component surface and the fluid, the higher the heat transfer rate. Chaitanya, N V V K et al. [18] revealed the mixed convection characteristics of tandem circular cylinders at low Reynolds numbers (10–40) through two-dimensional numerical simulations. This provides a theoretical basis for flow stability control in thermal equipment design. Ikhtiar et al. [19] used numerical simulations to study forced CHT around two-dimensional steady rotating cylinders and found that the Nusselt number in the vortex shedding region increases with wind speed, while that in the vortex suppression region decreases with wind speed. Karmakar, A et al. [20] systematically revealed the hydrodynamics of falling film flow on horizontal circular tube surfaces through three-dimensional volume of fluid numerical simulations, covering dropwise, in-line jet, staggered jet, and sheet flow patterns (tube diameter and spacing both 16 mm, Reynolds numbers 15–210). Notably, most of the above studies focus on isolated analyses of single working conditions or independent factors (such as low-temperature physical properties, ice formation models, and empirical correlation modifications), lacking systematic reproduction and collaborative mechanism research on multi-physical-field coupling conditions (interactions among low temperature, strong wind, and high-humidity phase change) in complex ice-covered regions. This multi-factor strong coupling effect is precisely the core challenge restricting accurate prediction and optimal design of CHT for circular tubes in cold regions.
In summary, most literature only considers the “dry and cold” scenarios of low temperature and strong wind or focuses on ice formation process simulations while oversimplifying CHT coefficients [21,22,23,24]. There is a lack of in-depth research on the internal coupling effects of surface heat transfer mechanisms under low temperature–wind–humidity coupling conditions. Therefore, this paper takes circular tube components commonly used in polar equipment as the research object to study the action mechanism and laws of surface CHT under the coupled environment of low temperature, strong wind, and high RH. Through a combination of low-temperature wind tunnel experiments and numerical simulations, we aim to reveal the variation characteristics of heat transfer coefficients on circular tube surfaces under humid air conditions, addressing the gap in research on wind–humidity coupling effects in the existing literature. On this basis, this paper will establish a CHT prediction model considering factors such as air temperature, wind speed, and humidity. This model can provide theoretical support for the anti-freezing and thermal insulation design of polar engineering structures and offer quantitative tools for the optimal design of anti-icing measures such as electric heat tracing.
2. Analysis of Factors Affecting CHT in Circular Tubes
The flow–solid–thermal coupling process of electric heat tracing circular tube components involves both CHT and thermal conduction. First, the impact of air RH on CHT is analyzed. Currently, the CHT over a cross-flowing air circular tube is commonly calculated using the empirical formula proposed by Churchill [13], as shown below:
where is the Prandtl number, unitless; is the Reynolds number, unitless. This formula uses the average value of the external ambient temperature and the surface temperature of the tube and is applicable when . Among them, is mainly affected by wind speed, and is mainly affected by external ambient temperature.
The above equation reveals that the CHT coefficient of the circular tube is mainly affected by and , but it lacks the consideration of the external environmental factors such as RH, wind speed, and temperature, which is not applicable to the CHT calculations in complex multi-factor environments in polar regions. From the thermophysical properties of dry and wet air, the change range of is 0.707–0.728 at low temperature, so the change of is negligible. The calculation formula is shown below:
where is the fluid density, kg/m3; is the fluid flow rate, m/s; is the characteristic length, m; is the dynamic viscosity, kg/(m·s).
The change of RH affects the kinetic viscosity in . Wang et al. [25]. summarize the formula for calculating the kinetic viscosity of wet air, as shown in Equation (3). It can be seen that as the humidity content increases, the dynamic viscosity of wet air decreases.
In the formula, is the dynamic viscosity of wet air, kg/(m·s); and are the molecular weights of dry air and water vapor, which are 28.97 and 18.02, respectively; is the dynamic viscosity of dry air, kg/(m·s), and , of which is the temperature of the wet air; is the dynamic viscosity of water vapor, kg/(m·s), and .
As RH increases, the moisture content rises, which in turn reduces the dynamic viscosity of humid air. As a result, the Reynolds number increases, which in turn leads to an increase in the Nusselt number . The relationship between and the CHT coefficient is given by Equation (4), where and are positively correlated. Therefore, the CHT coefficient increases with the increase in RH.
where is the CHT coefficient, W/(m2·K); is the characteristic length, m; is the thermal conductivity, W/(m·K).
On the other hand, analyzing the effect of RH on the temperature of the wall surface of the electric heat tracing circular tube from the perspective of heat conduction, the Fourier’s law-related formula is shown below:
where is the heat flow rate, W; is the same as above; is the heat transfer area of the circular tube, m2; is the temperature gradient in the direction of heat transfer.
When the surface temperature of the cylindrical tube reaches dynamic equilibrium, the parameter remains constant. According to the study by Wang Xinghua et al. [25], if remains constant, an increase in RH leads to an increase in . Based on Fourier’s law, as increases, the temperature gradient decreases, causing the surface temperature of the cylindrical tube to approach the air temperature more closely. This results in an increase in the CHT coefficient.
3. Convection Heat Transfer Experiment of Round Tube Under Electric Accompanying Heat
To accurately measure the CHT coefficients of circular tube components under various environmental factors, a polar complex coupled environment experimental platform was established in the cryogenic laboratory. The platform’s maximum wind speed is 8 m/s, the minimum temperature is −40 °C, and the maximum air RH is 95%.
3.1. Experimental Principles
In this experiment, the variation of CHT coefficient on the surface of the circular tube is determined according to Newton’s cooling Equation (6), which is given below:
where , represent the wall temperature and fluid temperature, K, respectively.
During the experiment, the cylindrical tube component was heated using constant power electric trace heating. When the wall temperature of the cylindrical tube component rises to a certain value and stabilizes, it can be assumed that the wall temperature has reached a steady state, with the heat input from the electric trace heating balanced by the heat output. At this point, the CHT coefficient under these environmental conditions can be calculated using Equation (6).
3.2. Experimental Systems
As shown in Figure 1 and Figure 2, the experimental platform consists of four main components: a fan, an air duct, a controller, and a humidifier. The wind speed is controlled by a variable-frequency fan with adjustable power, and the air outlet is directly connected to the air duct, which is covered by a wind shield to ensure a uniform and stable airflow within the duct. The air duct is supported by a steel frame 1.5 m above the ground, ensuring the same horizontal height for the experimental platform and the fan outlet. Environmental humidity is regulated by a humidifier with adjustable power, which is connected to the air duct via a pipeline. A 100 W humidifier, featuring four adjustable settings, is used to control the RH within the duct. During the experiment, the humidifier’s outlet is connected to the duct through a hose, with the interface sealed to minimize moisture loss.
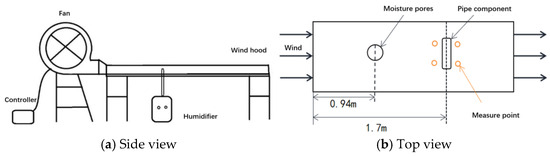
Figure 1.
Side view of the experimental platform.
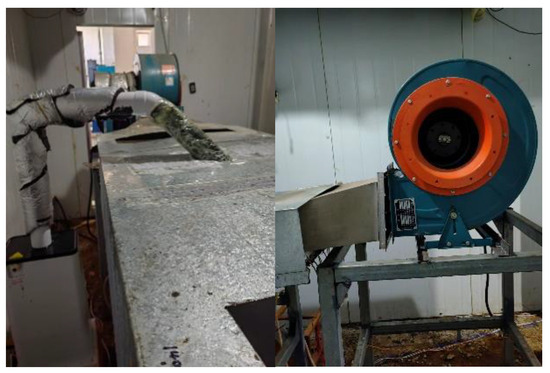
Figure 2.
Physical drawing of duct.
To ensure uniform humidity distribution around the experimental components, the distance between the humidifier and the components is set to 0.7 m. This configuration ensures proper and even humidity diffusion. The humidifier is capable of maintaining a RH range of 10% to 95% within the duct, even under temperature conditions ranging from 0 °C to −40 °C.
After the experimental equipment is debugged and prepared, the circular tube component is fixed at the specified position to prepare for the experiment.
- (1)
- Lower the temperature in the laboratory to ensure that the temperature in the experimental air duct remains at the required experimental temperature;
- (2)
- Turn on the electric tracing band switch to start heating the tube component;
- (3)
- Adjust the control system of the variable-frequency fan to maintain the wind speed at the experimental position at the required experimental wind speed;
- (4)
- Turn on the humidifier and adjust the gear to maintain the RH at the experimental position at the required experimental RH;
- (5)
- Wait until the reading of the temperature paperless recorder no longer changes and remains stable, then record the surface temperature data of the circular tube and various parameters of the experimental environment.
When testing other experimental environmental conditions, repeat steps (1), (3), (4), and (5) above to record the temperatures under different experimental environmental conditions.
To minimize heat loss from the electric heating system to the surrounding air and ensure the accuracy of the experimental data, thermal insulation material is applied in the gaps of the electric heat tracing on the circular tube. Additionally, the wind flow across the tube surface can cause boundary layer separation and flow detachment, resulting in uneven temperature distribution at different positions along the tube wall. To address these issues, temperature measurement points are placed at 45° intervals along the circumferential direction on the windward side of the tube, with a total of five points, as shown in Figure 3. The average temperature is then calculated.
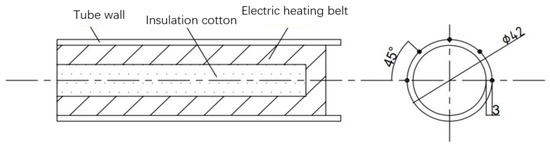
Figure 3.
Layout of measurement points.
3.3. Experimental Uncertainty Analysis
The main sources of error in the experimental process are as follows: (1) a small amount of moisture that does not diffuse at the bottom of the duct condenses into ice, leading to a reduction in the actual RH; (2) the low-temperature laboratory has a large volume, and as a result, the internal temperature field cannot achieve complete uniformity; (3) although thermal insulation material is applied to the electric heat tracing and circular pipe components, some heat loss still occurs; (4) the temperature sensors exhibit a certain degree of measurement error.
The sources of uncertainty of the experimental are provided in Table 1.

Table 1.
Sources of uncertainty.
The combined standard uncertainty is
calculated as (2.5% to 4.0%).
The experimental uncertainty analysis systematically quantifies error sources to validate data reliability. The error sources and quantification are shown in Table 2.
Table 2.
Error sources and quantification.
Errors are classified into Type A (statistical) and Type B (systematic), with total uncertainty synthesized using the root-sum-of-squares method:
Low wind speed (2 m/s), low humidity (40% RH): . High wind speed (8 m/s), high humidity (95% RH): .
The experimental design effectively controlled the uncertainty through instrument calibration, environmental control, and optimization of the data processing procedure. The results showed that the measured values of the CHT coefficient were highly reliable in the polar complex environment.
4. Numerical Simulations
4.1. Physical Model and Mesh Generation
In this study, a two-dimensional model of the circular tube component was established using the ICEM CFD 2022 R1 preprocessing software according to the original dimensions of the tube, and the mesh was generated accordingly. The numerical simulation model of the experimental circular tube component was then created using ANSYS Fluent 2022 R1 to validate the accuracy of the experimental data. A two-dimensional model, which offers higher computational efficiency, was selected. The computational domain for the wet air flow over the round tube component has a length of 0.95 m and a width of 0.4 m, with an outer diameter of 0.042 m and an inner diameter of 0.036 m, as shown in Figure 4.
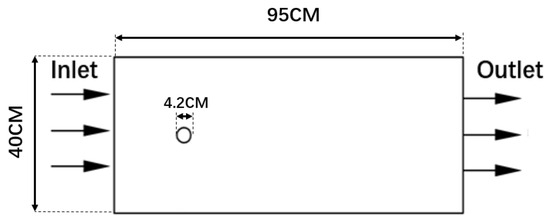
Figure 4.
Fluid computational domain.
The model employs an unstructured mesh. To improve the computational accuracy, mesh refinement was applied in the vicinity of the tube. Due to the irregular shape of the tube, an unstructured finite element mesh was used. Considering the significant flow field variations near and downstream of the tube, the mesh was refined around the tube to capture these changes. The total number of mesh elements was 144,736 (Figure 5).
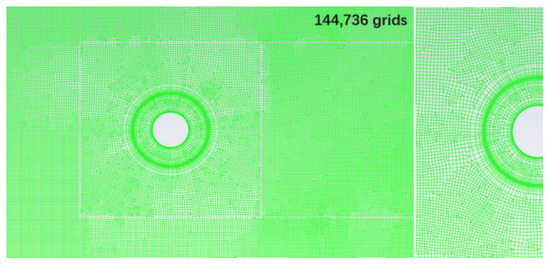
Figure 5.
Mesh generation of the CHT model for a circular tube.
Four mesh numbers (47,463, 79,353, 144,736, and 217,835) were used for mesh independence verification in the simulations. The working conditions were set as follows: temperature of −30 °C, wind speed of 5 m/s, and RH of 40%. Figure 6 shows the average surface temperature of the tread plate for the four mesh sets. When the total number of meshes exceeded 144,736, the variation in the average surface temperature of the tread plate became minimal, satisfying the requirements for mesh independence.
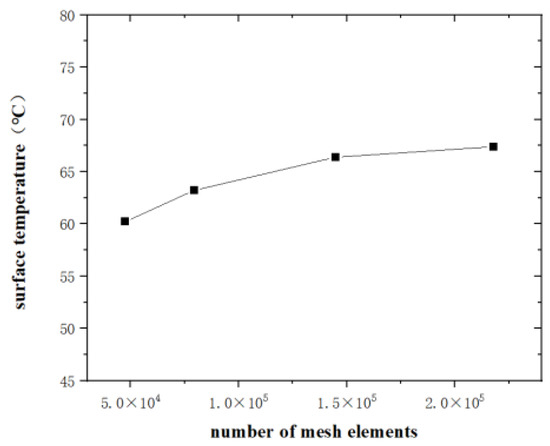
Figure 6.
Grid independency test results.
4.2. Parameter Setting
For incompressible, constant property, and no internal heat source, two-dimensional, steady-state conditions problems, the fundamental equations of fluid mechanics include the continuity equation, the momentum equation, and the energy equation. The equation set is as follows:
The continuity equation, also known as the mass conservation equation:
The momentum equation, also known as the Navier–Stokes equation:
The energy equation:
where is the air thermal conductivity; is the constant-pressure specific heat capacity; and are the velocity components of the airflow in the and directions; is the density of the fluid; is the external force vector; and is the temperature.
The simulation uses species transport Equation (13), where the fluid is modeled as a mixture of ideal gas and water vapor. This avoids unnecessary repetition. The humidity ratio and water vapor mass fraction are calculated using Equations (14) and (15), respectively. The inlet is specified as a velocity inlet, with the flow rate set to the wind speed for the given operating conditions. The outlet is set as a pressure outlet, and the inlet and outlet temperatures are chosen based on the operating conditions. The CFD simulations were conducted under steady-state conditions to simplify computational complexity while capturing the time-averaged heat transfer characteristics under constant environmental parameters. The wall is modeled as a no-slip boundary, with internal wall of the circular tube assigned a fixed heat flux of 1404.49 W·m−2. The experimental setup uses constant-power heating, ensuring the simulation boundary conditions align with measured data for valid validation. The standard turbulence model is selected for the simulation.
where is the moisture content of the air; is the partial pressure of water vapor; is the absolute pressure; is the mass fraction of water vapor; is the local mass fraction of the component; is the source term; is the diffusion coefficient of the component in the mixture; and is the turbulent Schmidt number.
5. Analysis of Experimental Results and Simulation Verification
5.1. Experimental Results
The results from 48 experiments conducted in the low-temperature laboratory are shown in Figure 7, illustrating the changes in the CHT coefficient of the electric heat tracing circular tube components with variations in wind speed, ambient temperature, and RH.
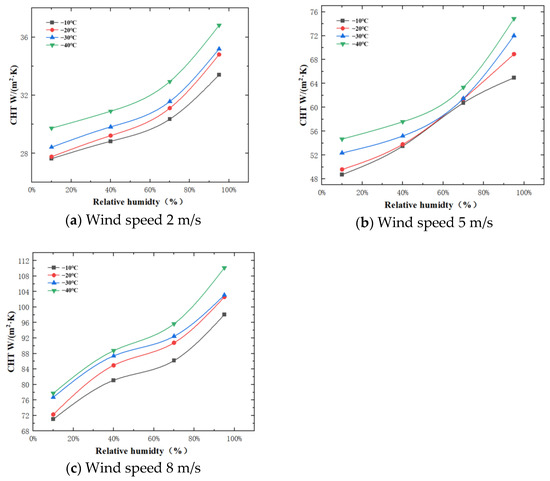
Figure 7.
Variation of CHT coefficient with RH at different wind speeds and ambient temperatures.
Based on the experimental results, it can be concluded that reducing the temperature and increasing the RH and wind speed both lead to an increase in the CHT coefficient of the circular tube components.
When temperature and RH are held constant, increasing the wind speed from 2 m/s to 5 m/s results in an average increase of 59% in the CHT coefficient. From 5 m/s to 8 m/s, the average increase is 50%. This clearly indicates that wind speed has a significant impact on the CHT coefficient of the circular tube components.
When wind speed and temperature are constant, increasing the RH from 10% to 40%, from 40% to 70%, and from 70% to 95% results in average increases in the CHT coefficient of 7.5%, 7.6%, and 12.7%, respectively. This suggests that the effect of humidity on the CHT performance of the circular tube components becomes more pronounced when the RH exceeds 70%. The increase in humidity is attributed to the significant accumulation of water vapor molecules within the boundary layer, which enhances the thermal conductivity of the boundary layer. Moreover, the presence of water vapor alters the fluid’s viscosity within the boundary layer, effectively facilitating the CHT process.
When wind speed and RH are constant, the average growth rates of the CHT coefficient of the circular tube components are 2.8%, 2.5%, and 3.8% as the temperature decreases from −10 °C to −40 °C. This indicates that, compared to wind speed, temperature has a relatively small effect on the CHT coefficient of the circular tube components.
RH’s influence on the CHT coefficient of circular tube components at different wind speeds and temperatures is summarized as follows: When the wind speed is constant and the temperature is −10 °C, −20 °C, −30 °C, and −40 °C, varying RH from 10% to 95% results in average increases in the CHT coefficient of 25.63%, 25.66%, 26.52%, and 26.88%, respectively. This indicates that the increase in RH has a relatively small effect on the growth of the CHT coefficient at different ambient temperatures. When the temperature is fixed, and the wind speed is 2 m/s, 5 m/s, and 8 m/s, the average growth rates of the CHT coefficient with increasing RH from 10% to 95% are 17.82%, 25.52%, and 33.96%, respectively. At a wind speed of 2 m/s, the effect of increasing RH on the CHT coefficient is limited. However, at a wind speed of 8 m/s, the more frequent heat and mass exchange of water vapor at the surface of the circular tube leads to a stronger influence of RH on the CHT coefficient.
In summary:
- When wind speed and temperature are constant, an increase in RH results in an increased CHT coefficient of the circular tube. Similarly, when wind speed and RH are constant, a decrease in temperature promotes an increase in the CHT coefficient. When RH and temperature are constant, an increase in wind speed enhances the CHT coefficient of the circular tube.
- Temperature has a relatively minor effect on the CHT performance of circular tube components, with the CHT coefficient showing an average growth rate of only 2.8–3.8% as temperature decreases from −10 °C to −40 °C, which is significantly lower than the effects of wind speed (average growth rate 59–50%) and humidity (average growth rate 7.5–12.7%).
- When RH exceeds 70%, increasing RH from 70% to 95% leads to an average 12.7% increase in the CHT coefficient; when wind speed exceeds 2 m/s, the average growth rate of humidity’s effect on the coefficient increases from 17.82% to 33.96% as wind speed increases from 2 m/s to 8 m/s.
5.2. Experimental and Simulation Comparative Analysis
To verify the accuracy and applicability of the experimental results, a comparison between the experimental data and the simulation data at three different wind speeds is presented in Figure 8.
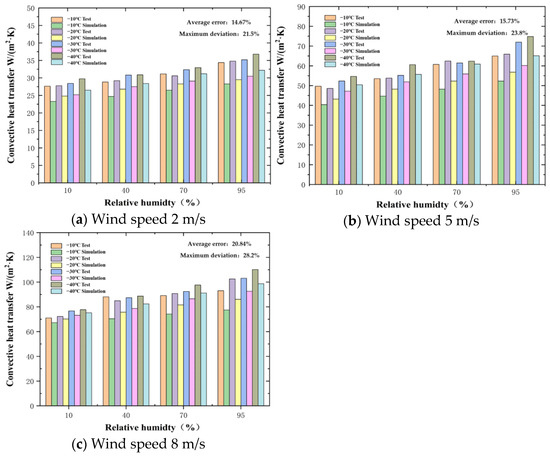
Figure 8.
Comparison of experimental and simulation results.
Under the conditions of constant wind speed and temperature, the changing trends of the simulation results are highly consistent with the experimental data. When the RH increases from 10% to 95%, the CHT coefficients from both simulation and experiment exhibit non-linear growth, and the growth rate significantly accelerates when the humidity exceeds 70%. At a wind speed of 8 m/s and a temperature of −20 °C, the growth rate of the simulation results corresponding to the increase in humidity from 70% to 95% is 18.2%, which is close to the experimental value of 19.5%. The simulation results further verify the significant influence of wind speed on heat transfer. When the wind speed increases from 2 m/s to 8 m/s, the average increase in the simulation results reaches 58.3%, which is basically consistent with the experimental value of 59.8%. The close agreement between the simulation results and the experimental data validates the accuracy of the experimental data.
The CHT coefficients obtained by simulation are all smaller than those measured by experiments. The errors mainly stem from the following aspects:
Limitations of experimental conditions cause fluctuations in the fan power, leading to instantaneous changes in wind speed. Additionally, at low temperatures, moisture partially condenses in the air duct, resulting in the actual humidity being lower than the set value.
Model simplification leads to the simulation not considering the porous medium effect caused by surface ice formation, causing the heat transfer coefficient to be underestimated under high-humidity working conditions.
Although we have encrypted the surrounding grid of the circular tube, the transient characteristics of vortex shedding in the wake region are not fully captured, affecting the simulation accuracy of turbulent heat transfer.
5.3. Numerical CHT Coefficient Prediction Model
When developing a mathematical prediction model for the CHT coefficient under various environmental conditions, this study considers the effects of three environmental factors on the CHT coefficient of the round tube component. Theoretical analysis shows that RH and wind speed influence the Reynolds number, while temperature affects the Prandtl number. According to the study by Yu [5], the range of variation of and as affected by temperature is shown in Table 3.
Table 3.
Range of variation of , .
It can be seen that the changes of and by temperature are negligible. In the fitting process, and can be fixed, and the average value in the range of changes can be taken. When the temperature range is −30~0 °C, and take 0.715 and 0.0228, respectively; when the temperature range is −40~−30 °C, and take 0.726 and 0.0216, respectively. Based on the Churchill formula, a humidity correction term (dynamically adjusting viscosity through Equation (3) is introduced to establish a multivariate regression model:
The least square method was adopted to perform nonlinear fitting on 48 sets of experimental data to optimize the parameters. Based on Equations (16) and (17), the simulation data are fitted, and the results are shown in Figure 9. The corresponding constants are shown in Table 4.
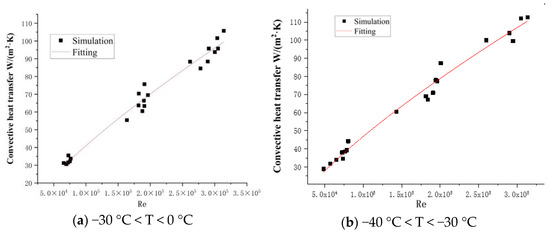
Figure 9.
CHT coefficient fitting.
Table 4.
Fitting constant.
The coefficients of determination, R2, in the fitting results are 96.7% and 98.2%, which are of high confidence.
The prediction model proposed in this paper incorporates the dynamic influence of the moisture content of moist air in Equation (3) on , avoiding the error accumulation in low-temperature regions caused by the fixed physical property assumption in Yu’s model [5]. Through multi-factor coupling modeling and dynamic physical property correction, it achieves the precise prediction of CHT coefficients in complex ice-covered regions (low temperature–wind–humidity) for the first time.
6. Discussion
This study systematically deciphers the coupled effects of wind speed, temperature, and RH on the CHT coefficient of circular tube components in polar ships through integrated experiments and simulations.
Experiments reveal a marked increase in CHT coefficient (up to 12.7%) when RH exceeds 70%. This stems from water vapor enrichment in the boundary layer. The higher thermal conductivity of water vapor versus dry air improves boundary-layer conduction. This effect is amplified at wind speeds >2 m/s due to forced convection accelerating moisture transport and heat-mass exchange. This phenomenon arises from two mechanisms: Increased moisture content lowers the dynamic viscosity of humid air (Equation (3)), elevating the Reynolds number and Nusselt number. Water vapor exhibits 18% higher thermal conductivity than dry air at −30 °C [25], amplifying boundary-layer heat conduction. Increasing wind speed from 2 m/s to 8 m/s elevates CHT coefficient by 109% on average, surpassing the individual impacts of temperature (≤3.8%) or humidity (≤12.7%). This confirms forced convection as the primary driver of heat loss in ice-covered regions, aligning with Yu et al. [7] but extending to quantified multi-factor coupling. Temperature reduction to −40 °C only marginally increases the CHT coefficient (≤3.8%). Prandtl number varies minimally (0.707–0.728) in −40~0 °C, exerting negligible influence on the Nusselt number, consistent with Churchill’s correlation [13], yet unaddressed in traditional humidity-free models.
The proposed CHT model incorporates a dynamic viscosity correction term for humidity, overcoming errors in Yu’s model [5] caused by fixed properties at low temperatures. With R2 > 96.7%, it achieves unprecedented accuracy for low temperature–wind–humidity coupling.
7. Conclusions
This paper theoretically analyzes the influence of RH on the CHT coefficient of circular tube components from both heat transfer and convection perspectives. It also experimentally and numerically determines the CHT coefficient under operating conditions with wind speeds ranging from 0 to 8 m/s, temperatures ranging from −40 °C to 0 °C, and air RH ranging from 10% to 95%. The results indicate the following:
- Under constant wind speed and temperature, an increase in RH leads to an increase in the CHT coefficient of the electric heat tracing circular tube components.
- Wind speed is the dominant factor affecting the CHT performance of circular tube components. When the wind speed increases from 2 m/s to 8 m/s, the CHT coefficient increases by an average of 59–50%. Temperature has a minor effect on the CHT performance of circular tube components. As the temperature decreases from −10 °C to −40 °C, the average growth rate of the CHT coefficient is only 2.8–3.8%.
- When the RH exceeds 70%, increasing RH from 70% to 95% leads to an average 12.7% increase in the CHT coefficient. When the wind speed exceeds 2 m/s, the growth rate of humidity’s effect on the coefficient increases from 17.82% to 33.96%. Finally, based on the simulation results, a prediction model for the CHT coefficient of the circular tube components under low temperature–wind–humidity coupled conditions is established, providing a reference for the cold-proof design of polar equipment circular tube components.
The findings provide critical insights for polar ship design. Wind-speed-driven forced convection is the primary factor in heat loss, necessitating adaptive heating systems for high-wind ice-covered regions. High humidity amplifies heat dissipation, requiring anti-condensation coatings for tube surfaces. Temperature fluctuations have minimal impact, allowing for simplified thermal management strategies. These conclusions can optimize electric heat tracing designs to balance energy efficiency and frost protection in ice-covered regions.
This study only analyzes the effect of low temperature, wind, and humidity coupling on the CHT of circular tube components. Further research is needed to investigate the effects of additional environmental factors (rain, snow, ice) and the CHT characteristics of other typical polar equipment components.
Author Contributions
Conceptualization, H.W. and C.L.; methodology, D.Z.; software, J.C.; validation, H.L. and D.Z.; formal analysis, X.H.; investigation, H.L.; resources, H.W.; data curation, D.Z.; writing—original draft preparation, H.L.; writing—review and editing, H.L.; visualization, C.L.; project administration, D.Z. All authors have read and agreed to the published version of the manuscript.
Funding
National Key Research and Development Program (2024YFC2816304); High-Tech Ship Scientific Research Project of the Ministry of Industry and Information Technology (CBG2N21-2-2); National Natural Science Foundation of China (52071055).
Data Availability Statement
The original contributions proposed in this study are included in the article.
Conflicts of Interest
The authors declare no conflict of interest.
References
- Rosencrans, D.; Lundquist, J.K.; Optis, M.; Bodini, N. The effects of wind farm wakes on freezing sea spray in the mid-Atlantic off-shore wind energy areas. Wind Energy Sci. Discuss. 2025, 10, 59–81. [Google Scholar] [CrossRef]
- Roeder, W.; Baen, P.; Seitz, R. Electric trace heat design methods for de-icing and anti-icing of vessels, support equipment and infrastructure in the Arctic. In Proceedings of the OCEANS 2017–Anchorage 2017, Anchorage, AK, USA, 18–21 September 2017; pp. 7–13. [Google Scholar]
- Shestakova, A. Assessing the risks of vessel icing and aviation hazards during downslope windstorms in the Russian Arctic. Atmosphere 2021, 12, 760. [Google Scholar] [CrossRef]
- ABS. Guide for Building and Classing Vessels Intended for Navigation in Polar Waters; American Bureau of Shipping: Houston, TX, USA, 2008. [Google Scholar]
- Yu, D.; Zhang, D.; Wu, L.; Kong, X.; Yue, Q. Analysis of the influence of convection heat transfer in circular tubes on ships in a polar environment. Atmosphere 2022, 13, 149. [Google Scholar] [CrossRef]
- Fand, R.M.; Keswani, K. A continuous correlation equation for heat transfer from cylinders to air in crossflow for Reynolds numbers from 10–2 to 2 × 10⁵. Int. J. Heat Mass Transf. 1972, 15, 559–562. [Google Scholar] [CrossRef]
- Zhao, Q.; Mao, B.; Zhao, J.; Li, H.; Wei, S.; Bai, X.; Zhang, X.; Zhang, Y. Experimental study on the forced convection heat transfer characteristics of airflow with variable thermophysical parameters in a circular tube. Case Stud. Therm. Eng. 2022, 40, 102495. [Google Scholar] [CrossRef]
- Haghgoo, M.R.; LePoudre, P.P. Flow dynamics and heat transfer characteristics of flows past a zigzag cylinder in a bounded domain. Appl. Therm. Eng. 2024, 257, 124290. [Google Scholar] [CrossRef]
- Zwolińska-Glądys, K.; Korzec, M.; Halibart, J.; Borowski, M.; Marczak, P. Analysis of the Forced Convection of the Exchanger on the Example of an Induction Unit. In Proceedings of the 14th International Conference on Computational Heat and Mass Transfer (ICCHMT 2023), Düsseldorf, Germany, 4–8 September 2023; Springer International Publishing: Cham, Switzerland, 2023; pp. 588–597. [Google Scholar]
- Kočí, J.; Navara, T.; Maděra, J.; Trush, A.; Cacciotti, R.; Pospíšil, S.; Černý, R. Analysis of the Effect of Relative Humidity on the Convective Heat Transfer Coefficient Using Full-Scale Experiments in a Climatic Wind Tunnel. Energies 2025, 18, 810. [Google Scholar] [CrossRef]
- Xu, Z.; Redo, M.A.; Watanabe, M. Convective heat transfer with condensation in crossflow of a circular cylinder: Experiments and simulations. Int. J. Heat Mass Transf. 2024, 224, 125371. [Google Scholar] [CrossRef]
- Wan, P.; Han, X.; Mao, J. Very Large Eddy Simulation of turbulent flow and heat transfer for single cylinder and cylindrical pin matrix. Appl. Therm. Eng. 2020, 169, 114972. [Google Scholar] [CrossRef]
- Churchill, S.W.; Bernstein, M. A correlating equation for forced convection from gases and liquids to a circular cylinder in crossflow. J. Heat Transf. 1977, 99, 300–306. [Google Scholar] [CrossRef]
- Still, M.; Venzke, H.; Durst, F.; Melling, A. Influence of humidity on the convective heat transfer from small cylinders. Exp. Fluids Exp. Methods Their Appl. Fluid Flow 1998, 24, 141–150. [Google Scholar] [CrossRef]
- Krasota, D.; Błasiak, P.; Kolasiński, P. Literature Review of Frost Formation Phenomena on Domestic Refrigerators Evaporators. Energies 2023, 16, 2945. [Google Scholar] [CrossRef]
- Ljung, A.L.; Staffan Lundttrom, T. Evaporation of a sessile water droplet subjected to forced convection in humid environment. Dry. Technol. 2019, 37, 129–138. [Google Scholar] [CrossRef]
- Davis, A.H. Civ. convective cooling of wires in streams of viscous liquids. Lond. Edinb. Dublin Philos. Mag. J. Sci. 1924, 47, 1057–1092. [Google Scholar] [CrossRef]
- Chaitanya, N.V.V.K.; Khambra, S.; Chatterjee, D. Mixed convective transport around tandem circular cylinders in an unconfined medium. Nucl. Eng. Des. 2024, 419, 112969. [Google Scholar] [CrossRef]
- Ikhtiar, U.; Manzoor, S.; Sheikh, N.; Ali, M. Free stream flow and forced convection heat transfer around a rotating circular cylinder subjected to a single gust impulse. Int. J. Heat Mass Transf. 2016, 99, 851–861. [Google Scholar] [CrossRef]
- Karmakar, A.; Acharya, S. Numerical simulation of falling film flow hydrodynamics over round horizontal tubes. Int. J. Heat Mass Transf. 2021, 173, 121175. [Google Scholar] [CrossRef]
- Lou, Y.; Gan, X.; Bu, X.; Zhu, X.; Yu, J.; Lin, G.; Wen, D. Experimental and numerical investigations on jet impingement heat transfer with different nozzles and enhanced surfaces. Case Stud. Therm. Eng. 2024, 61, 104954. [Google Scholar] [CrossRef]
- Li, Y.; Shi, F.; Xin, J.; Peng, L.; Wan, L. Numerical investigation of the heat transfer and flow pattern on tandem triangle-Grooved cylinders. Case Stud. Therm. Eng. 2024, 60, 104808. [Google Scholar] [CrossRef]
- Oldford, D.; Yang, M.; Khan, F.I.; Lye, L.M.; Sulistiyono, H.; Dolny, J. Risk-Based Winterization for Vessels Operations in Arctic Environments. J. Ship Prod. Des. 2013, 29, 199–210. [Google Scholar]
- Nabwey, H.A.; Rashad, A.; Yasmeen, T.; Ahmad, U.; Ashraf, M. Theoretical investigation of the convective heat transfer mechanism along a cantilever shape. Alex. Eng. J. 2024, 99, 124–129. [Google Scholar] [CrossRef]
- Wang, X.H.; Zhou, M.Y.; Chen, H.J. Calculation of thermophysical parameters of humid air. In Proceedings of the 18th Academic Exchange Conference and the 4th Annual Meeting of the National District Energy Committee of the Architectural Society of China, Building Thermal Energy Power Branch; Building Thermal Energy Dynamics Branch, Architectural Society of China, Mudanjiang, China, 8 August 2013; pp. 482–485. [Google Scholar]
Disclaimer/Publisher’s Note: The statements, opinions and data contained in all publications are solely those of the individual author(s) and contributor(s) and not of MDPI and/or the editor(s). MDPI and/or the editor(s) disclaim responsibility for any injury to people or property resulting from any ideas, methods, instructions or products referred to in the content. |
© 2025 by the authors. Licensee MDPI, Basel, Switzerland. This article is an open access article distributed under the terms and conditions of the Creative Commons Attribution (CC BY) license (https://creativecommons.org/licenses/by/4.0/).