Article

Vibration Control of Deepwater Offshore Platform Using Viscous Dampers Under Wind, Wave, and Earthquake

1
Power China Huadong Engineering Corporation Limited, Hangzhou 310000, China
2
Ocean College, Zhejiang University, Zhoushan 316021, China
3
Hainan Institute, Zhejiang University, Sanya 572025, China
*
Authors to whom correspondence should be addressed.
J. Mar. Sci. Eng. 2025, 13(7), 1197; https://doi.org/10.3390/jmse13071197
Submission received: 4 May 2025 / Revised: 3 June 2025 / Accepted: 9 June 2025 / Published: 20 June 2025
(This article belongs to the Section Ocean Engineering)

Abstract

This study investigates the use of viscous dampers (VDs) to reduce the vibration of a deepwater offshore platform under joint wind, wave, and earthquake action. A finite element model was established based on the Opensees software (version 3.7.1), incorporating soil–structure interaction simulated by the nonlinear Winkler springs and simulating hydrodynamic loads via the Morison equation. Turbulent wind fields were generated using the von Kármán spectrum, and irregular wave profiles were synthesized from the JONSWAP spectrum. The 1995 Kobe earthquake record served as seismic input. The time-history dynamic response for the deepwater offshore platform was evaluated under two critical scenarios: isolated seismic excitation and the joint action of wind, wave, and seismic loading. The results demonstrate that VDs configured diagonally at each structural level effectively suppress platform vibrations under both isolated seismic and wind–wave–earthquake conditions. Under seismic excitation, the VD system reduced maximum deck acceleration, velocity, displacement, and base shear force by 9.95%, 22.33%, 14%, and 31.08%, respectively. For combined environmental loads, the configuration achieved 15.87%, 21.48%, 13.51%, and 34.31% reductions in peak deck acceleration, velocity, displacement, and base shear force, respectively. Moreover, VD parameter analysis confirms that increased damping coefficients enhance control effectiveness.

1. Introduction

Offshore platforms have found extensive applications in the realms of oil and gas extraction, marine research and exploration, wind power generation, et al. Within the realm of offshore platforms, there exist two primary classifications: fixed and floating structures, with the jacket offshore platform comprising approximately 95% of total offshore platforms, owing to its exceptional mechanical performance, superior structural safety, and reliability [1]. However, the transition to deepwater deployments intensifies structural vibration in harsh marine environments, such as wind, waves, and currents [2,3,4]. Such vibrations may excite higher-order structural modes, generating localized stress concentrations and fatigue crack propagation to threaten structural security. The structural vibration persists until complete energy dissipation occurs through damping pathways, highly relying on the friction in joints and microcrack friction in reinforced concrete, where the energy dissipation rate remains low under elastic strain ranges [5,6,7]. Conventional vibration mitigation strategies usually prioritize structural stiffening, which is inherently dependent on substantial material consumption to achieve natural frequency modulation. However, such mass-intensive approaches incur prohibitive economic penalties, particularly in deepwater applications [8,9,10]. Consequently, dynamic control methodologies, such as vibration suppression technologies and energy dissipation systems, have been demonstrated to be efficient in vibration control [11,12,13], serving as a pivotal strategy for enhancing the resilience of offshore platforms.
Vibration control strategies bifurcate into active, semi-active, and passive paradigms; the active and semi-active control systems [14,15] are reliant on real-time sensor–actuator networks and external energy supply [16,17]. However, their complexity, energy dependence, and maintenance sensitivity prove prohibitive for offshore infrastructure exposed to harsh marine environments [18,19]. On the other hand, passive control systems do not need external energy and rely on structural motion-generating control forces to enhance structural stability and reliability. Passive control can be divided into the following two categories based on the energy consumption mechanism: (1) dynamic vibration absorbers, such as tuned mass dampers (TMDs) [20], tuned liquid dampers (TLDs) [21], tuned liquid column dampers (TLCDs) [22], et al., and (2) hysteretic or viscoelastic mechanism-based absorbers, such as the friction damper (FD) [23], shape memory alloy (SMA) dampers [24], hydrodynamic buoyant mass damper (HBMD), et al. The TMD is composed of a mass block, springs, and viscous dampers, designed to counteract structural vibrations through resonant energy dissipation. Wu et al. [25] utilized TMDs in offshore platforms under earthquake loads—the maximum displacement and acceleration were reduced by 27% and 32%, respectively. Gavgani et al. [26] utilized the genetic algorithm to obtain the optimal parameters for TMDs and adopted the Latin Hypercube Sampling method to yield the probabilistic distribution of TMDs. While conventional TMDs demonstrate significant vibration mitigation potential, recent advancements have focused on developing enhanced TMD variants to address challenges in multi-hazard environments and structural adaptability. Lin et al. [20] proposed a pounding TMD (PTMD) for the Canton Tower under earthquake loads, and the results showed that the non-uniformly distributed PTMD exhibits better performance than the uniformly distributed one. Pourzangbar et al. [27] analyzed the influence of the frequency ratio, damping ratio, and mass ratio of the pendulum PTMD on jacket dynamic responses. Moreover, owing to the cost efficiency and superior damping performance, the TLD and its variants are utilized to reduce structural vibration by leveraging the resonant sloshing motion of liquid in a container. Jin et al. [28] utilized the TLD to control the earthquake response of the jacket platform, resulting in a larger mass ratio that can provide a more significant earthquake response. Sardar et al. [29] analyzed the effects of the TLD in reducing wave-induced structural vibration; the results demonstrated that the optimal TLD location is the top deck, and the controlling performance was more effective with the mass ratio increasing. Dou et al. [21] developed a coupling numerical model to analyze the effects of the TLD in reducing the nonlinear vibration of supporting structural platforms, finding that the mass ratio of 2% and the frequency ratio of 1% were optimal. Building upon TLD foundations, hybrid and optimized liquid damping systems have emerged to tackle challenges under combined environmental hazards. Colwell et al. [22] used the TLCD to reduce fatigue damage to a jacket platform. Mousavi et al. [30] evaluated the effectiveness of a tuned liquid column–gas damper (TLCGD) in decreasing the vibrations of jacket platforms under earthquake, demonstrating that the optimal frequency of the TLCGD was uncoupled with the area ratio and the head loss coefficient. Moharrami et al. [31] used the HBMD to reduce the wave-induced displacement response of offshore platforms.
Hysteretic mechanism-based absorbers dissipate energy through irreversible material deformation or sliding friction, and their performance does not rely on rate. Golafshani et al. [23] presented a mathematical formulation to evaluate the structural response of the jacket platform, obtaining the optimal parameters of the FD to reduce the wave-induced vibration. Owing to their exceptional energy dissipation capacity and superior fatigue resistance under cyclic loading, SMAs have been increasingly employed in offshore platform vibration control. Enferadi et al. [24] developed an idealized multilinear constitutive model to simulate the hysteretic force–displacement behavior of SMA elements. Numerical implementation of this model demonstrated a reduction in deck displacement, acceleration, and base shear. Ghasemi et al. [32] used the Ideal Gas Molecules Movements algorithm to improve the efficiency of SMAs in a jacket platform—the results indicated that the optimal SMA reduced deck deformation by 47.5%, deck acceleration by 56.5%, and base shear by 28%.
Compared with the above control devices, VDs achieve broadband energy dissipation through fluid shear deformation, which indicates that VDs have advantages in enabling the mitigation of complex dynamic load scenarios, and the velocity-dependent energy dissipation mechanism ensures more stable hysteretic responses [33,34,35]. Moreover, the hermetically sealed hydraulic systems require significantly less maintenance while maintaining corrosion resistance. These attributes position VDs as a superior and economically viable solution for harsh marine environments. Janbazi Rokni et al. [36] applied the VD in a jacket platform and analyzed the effects of the VD configuration on jacket fatigue life, with results demonstrating that fatigue damage with VDs is approximately 0.01 times that without VDs. Emami et al. [37] utilized vertically oriented fluid VDs in a jacket structure to enhance fatigue performance, and the fatigue life of the structural joint was increased by three times. Beyond fatigue life extension, the optimal configuration of VDs has garnered significant attention. Tabeshpour et al. [38] investigated the effects of VDs in enhancing the long-term performance of jacket platforms and proposed the optimal VD arrangement. Vaezi et al. [5] investigated the effects of the brace-viscous damper with different distributions, configurations, and brace stiffness in an offshore platform; the results indicated that the toggle configuration significantly reduced the base shear. However, existing analyses predominantly consider wave loads in isolation, neglecting the coupled dynamics of simultaneous wind, wave, and earthquake multi-hazard excitations, and overlooking the soil–structure interaction, which may amplify drift accumulation through nonlinear superposition and degrade viscous damper functionality.
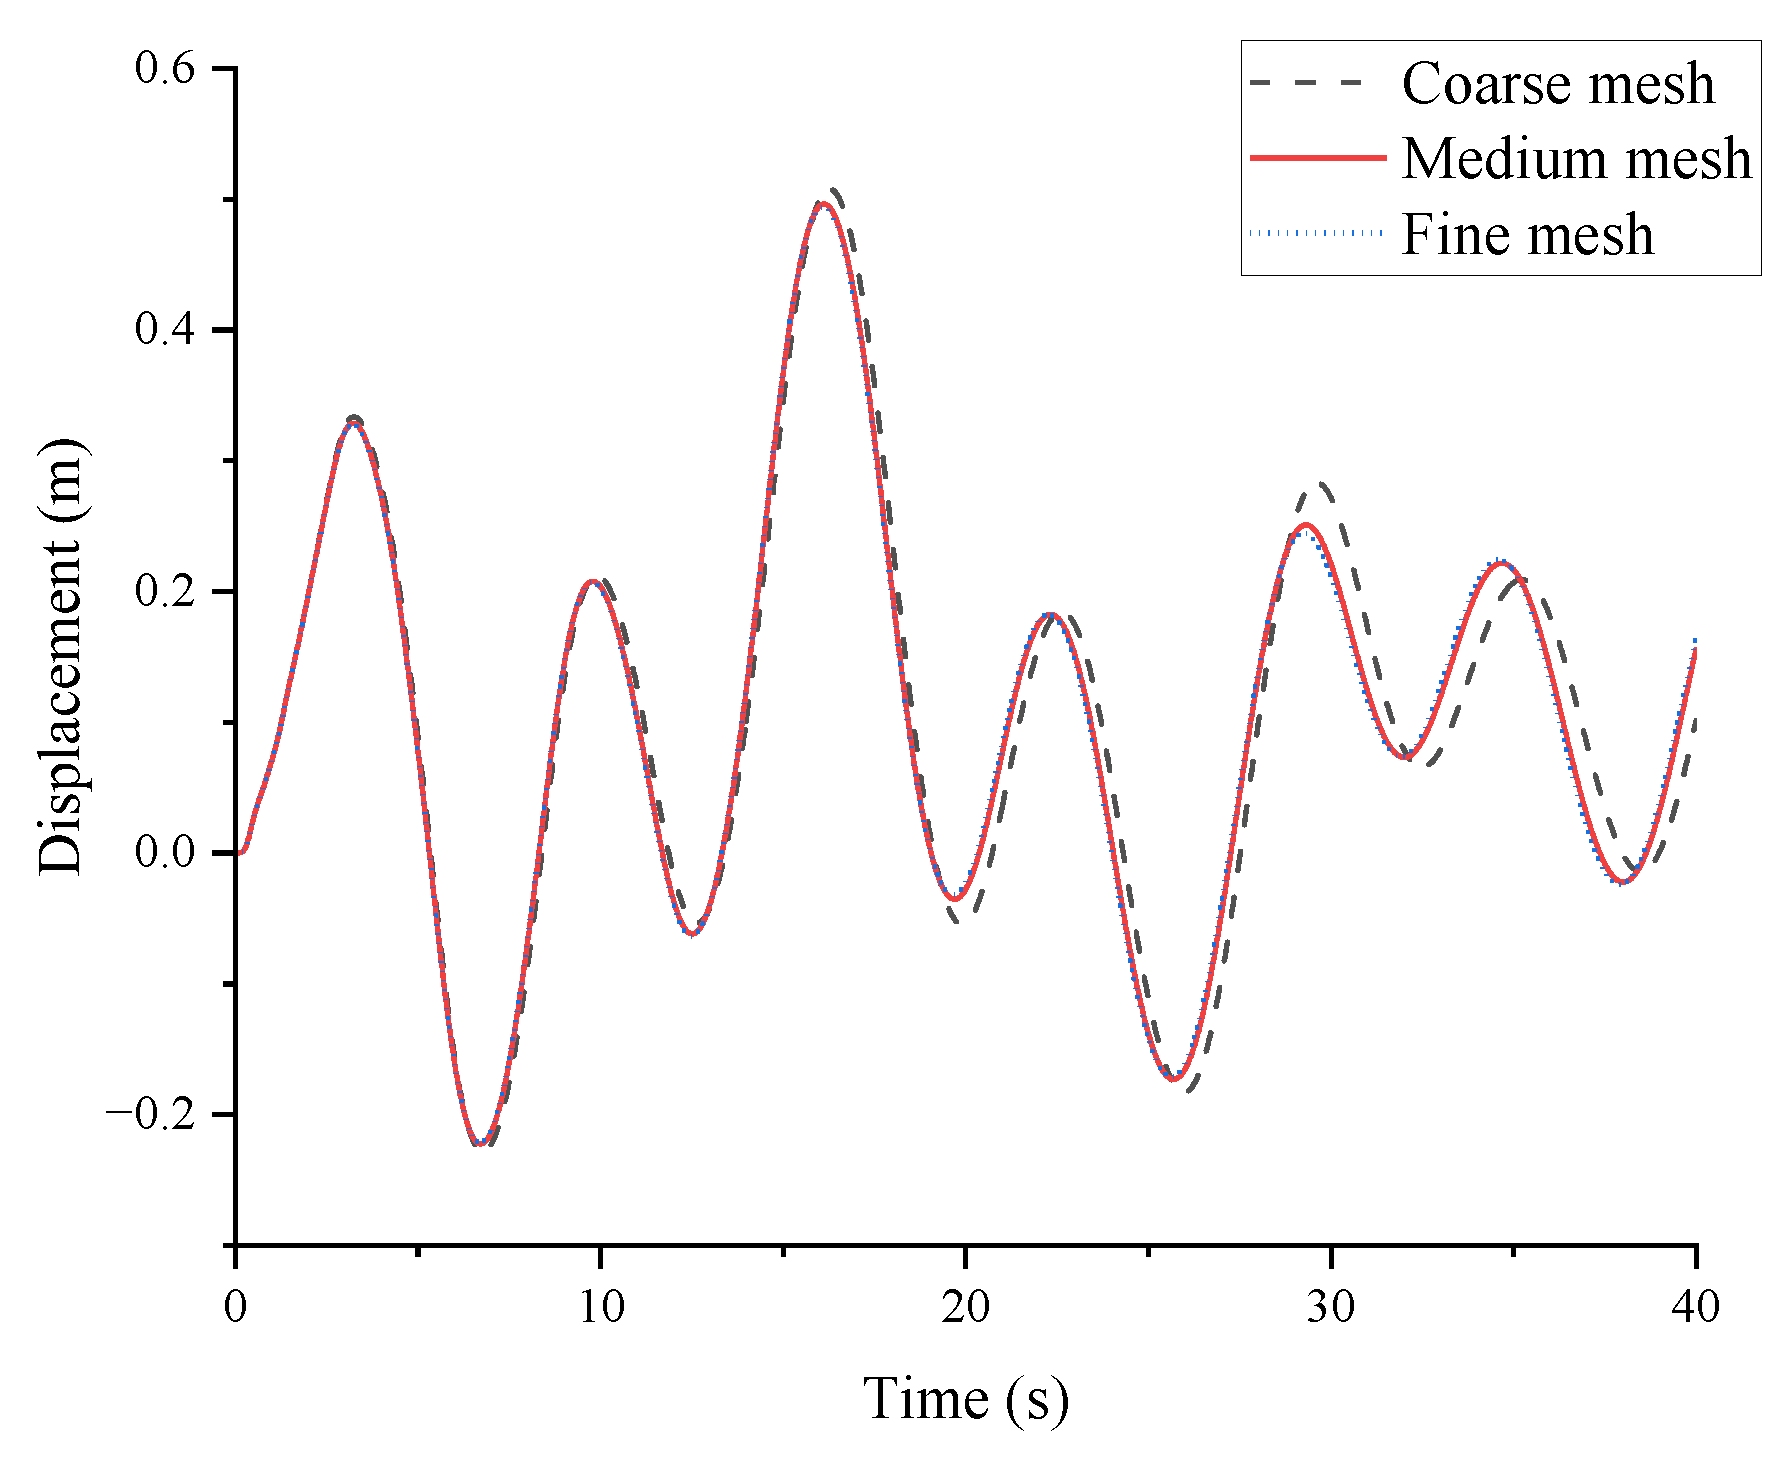
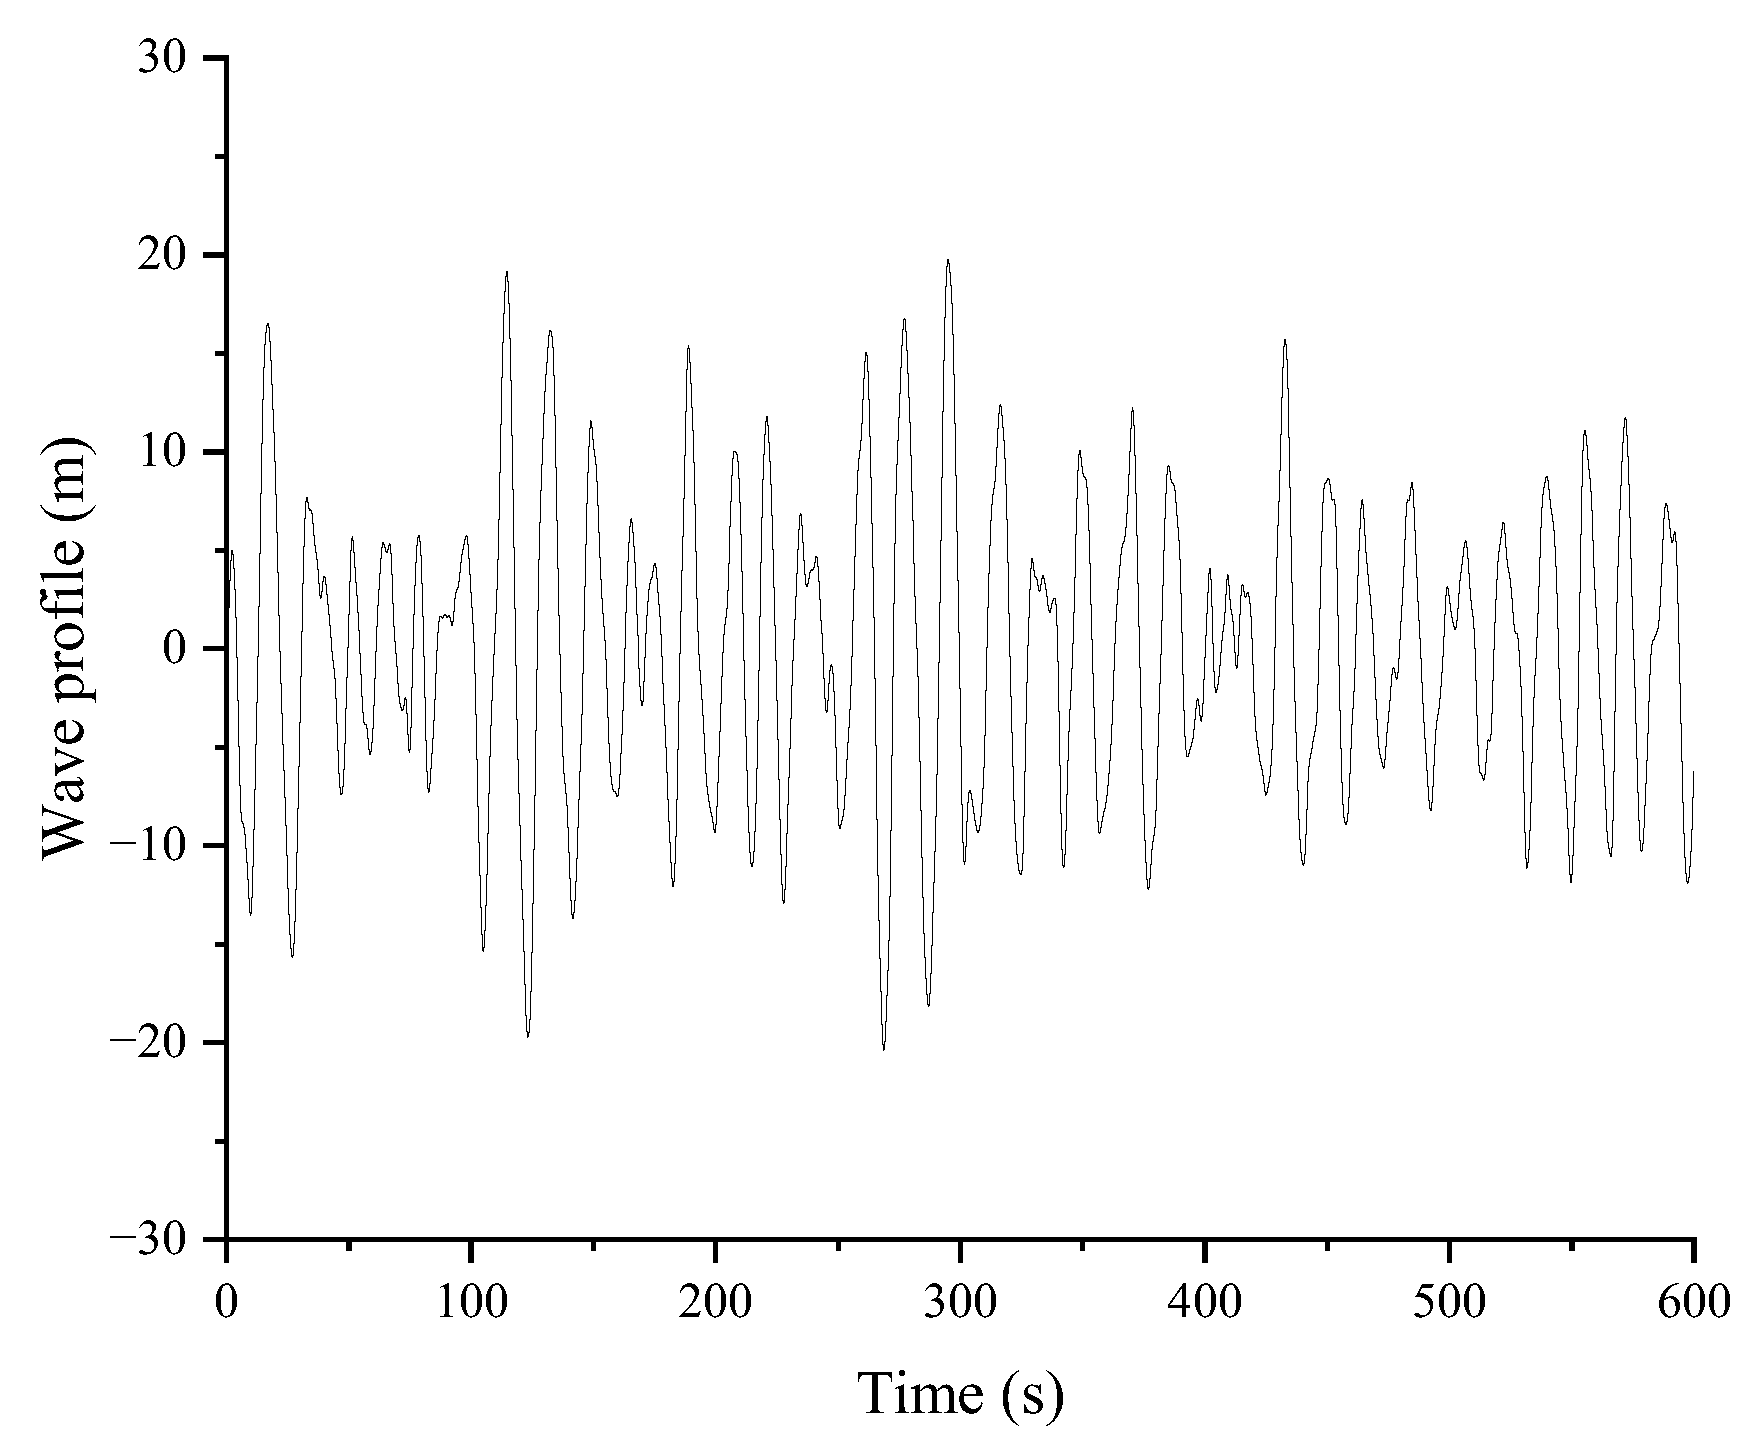
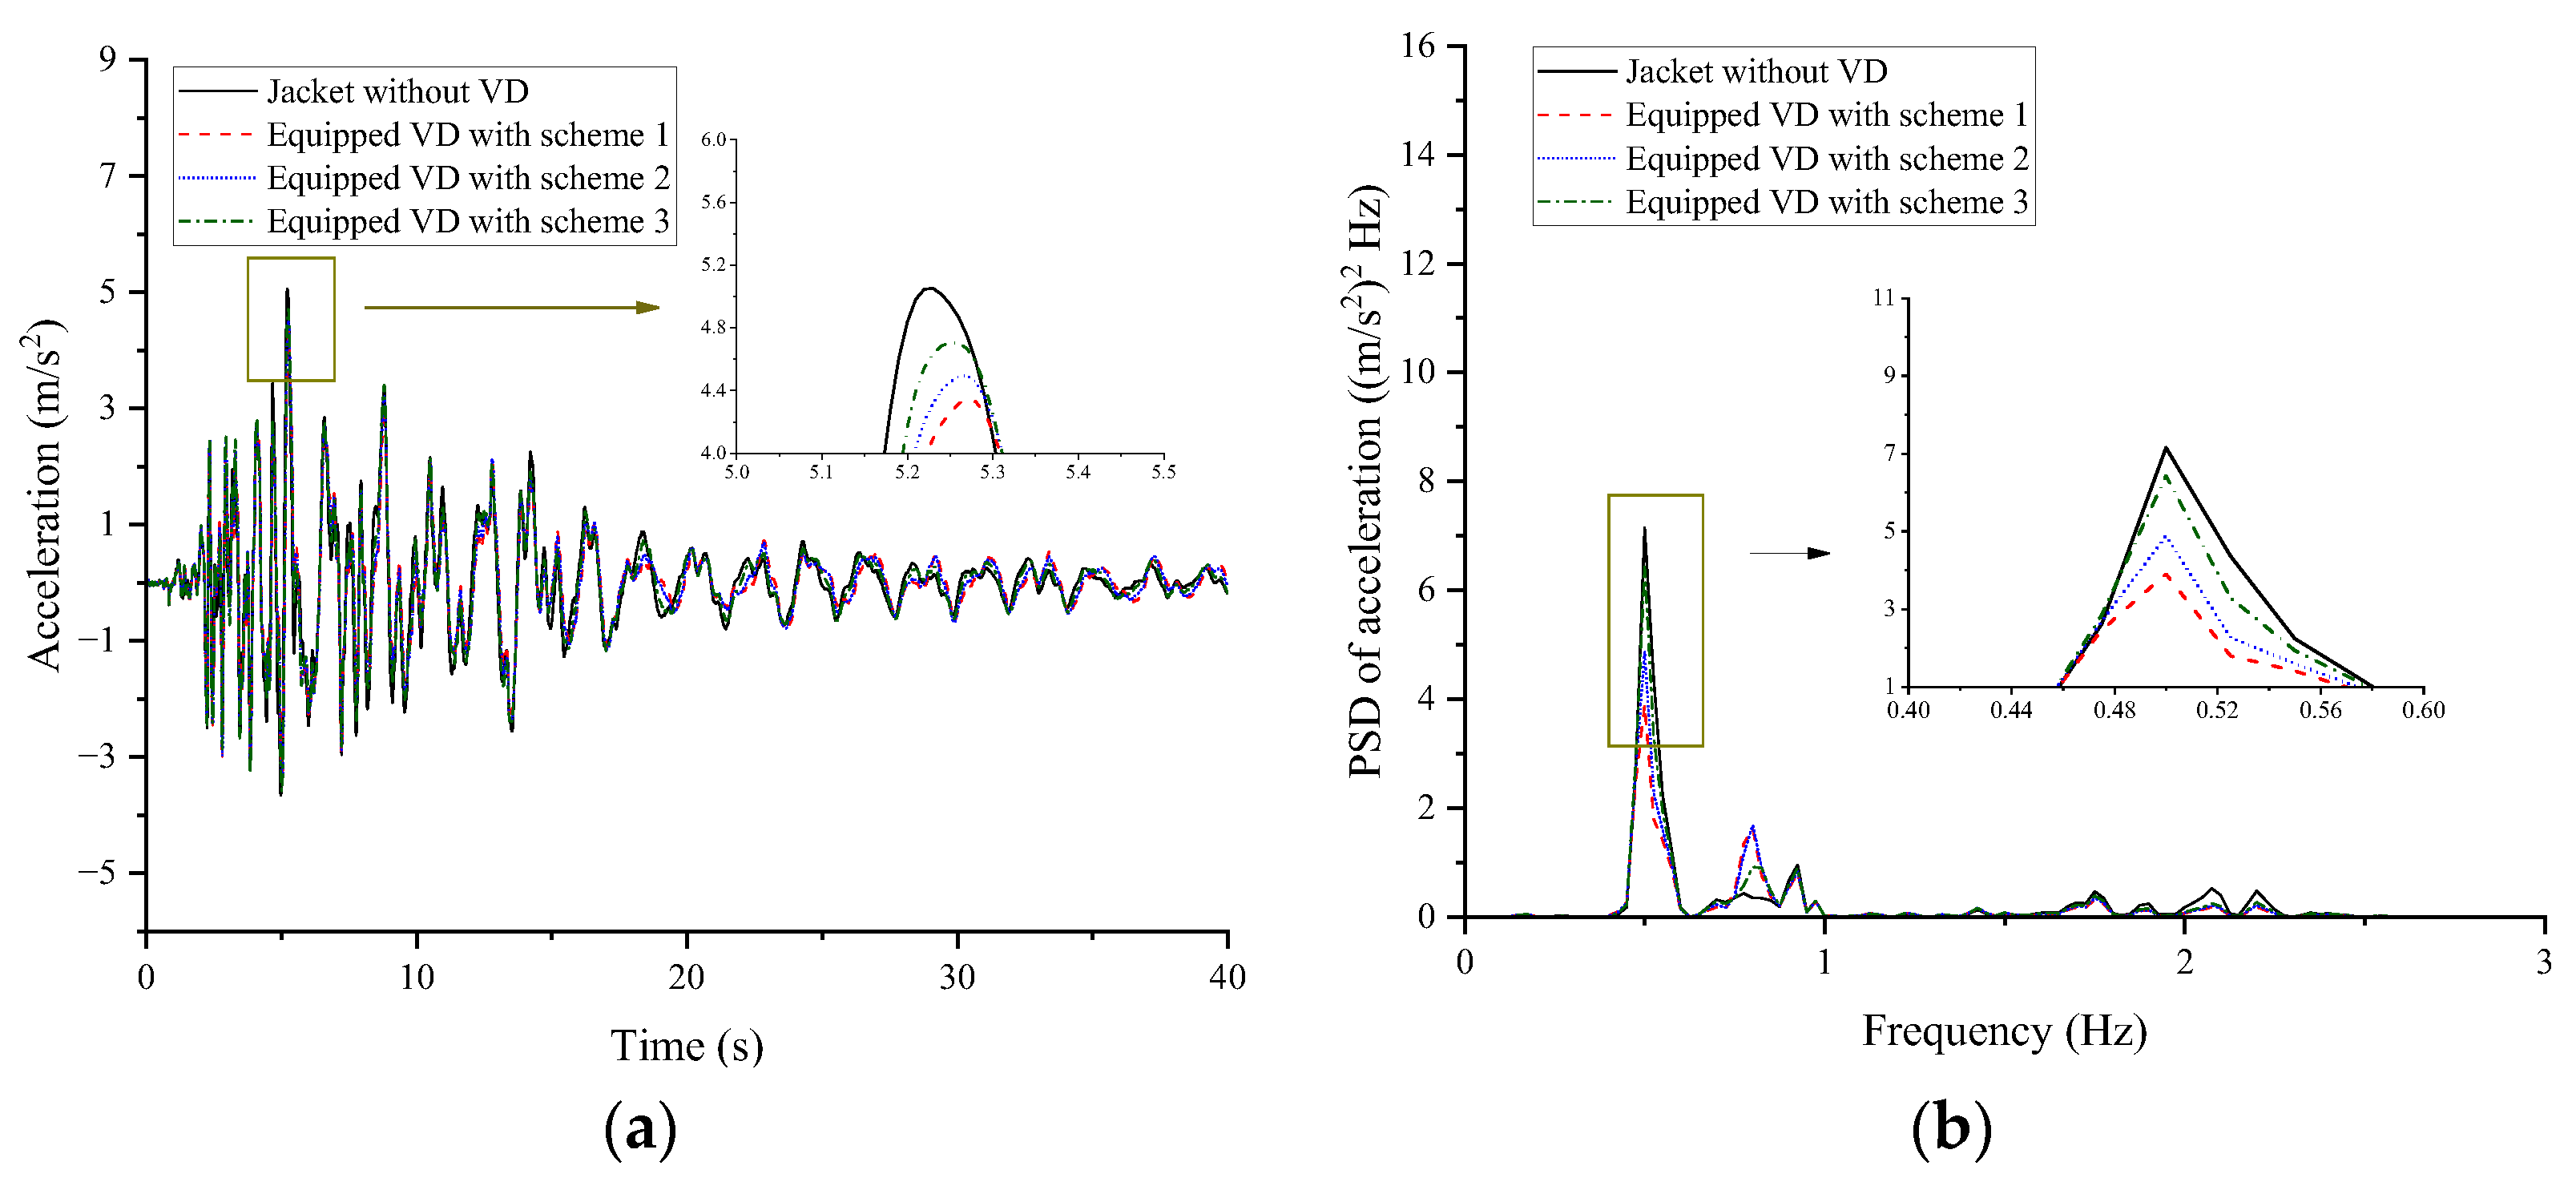
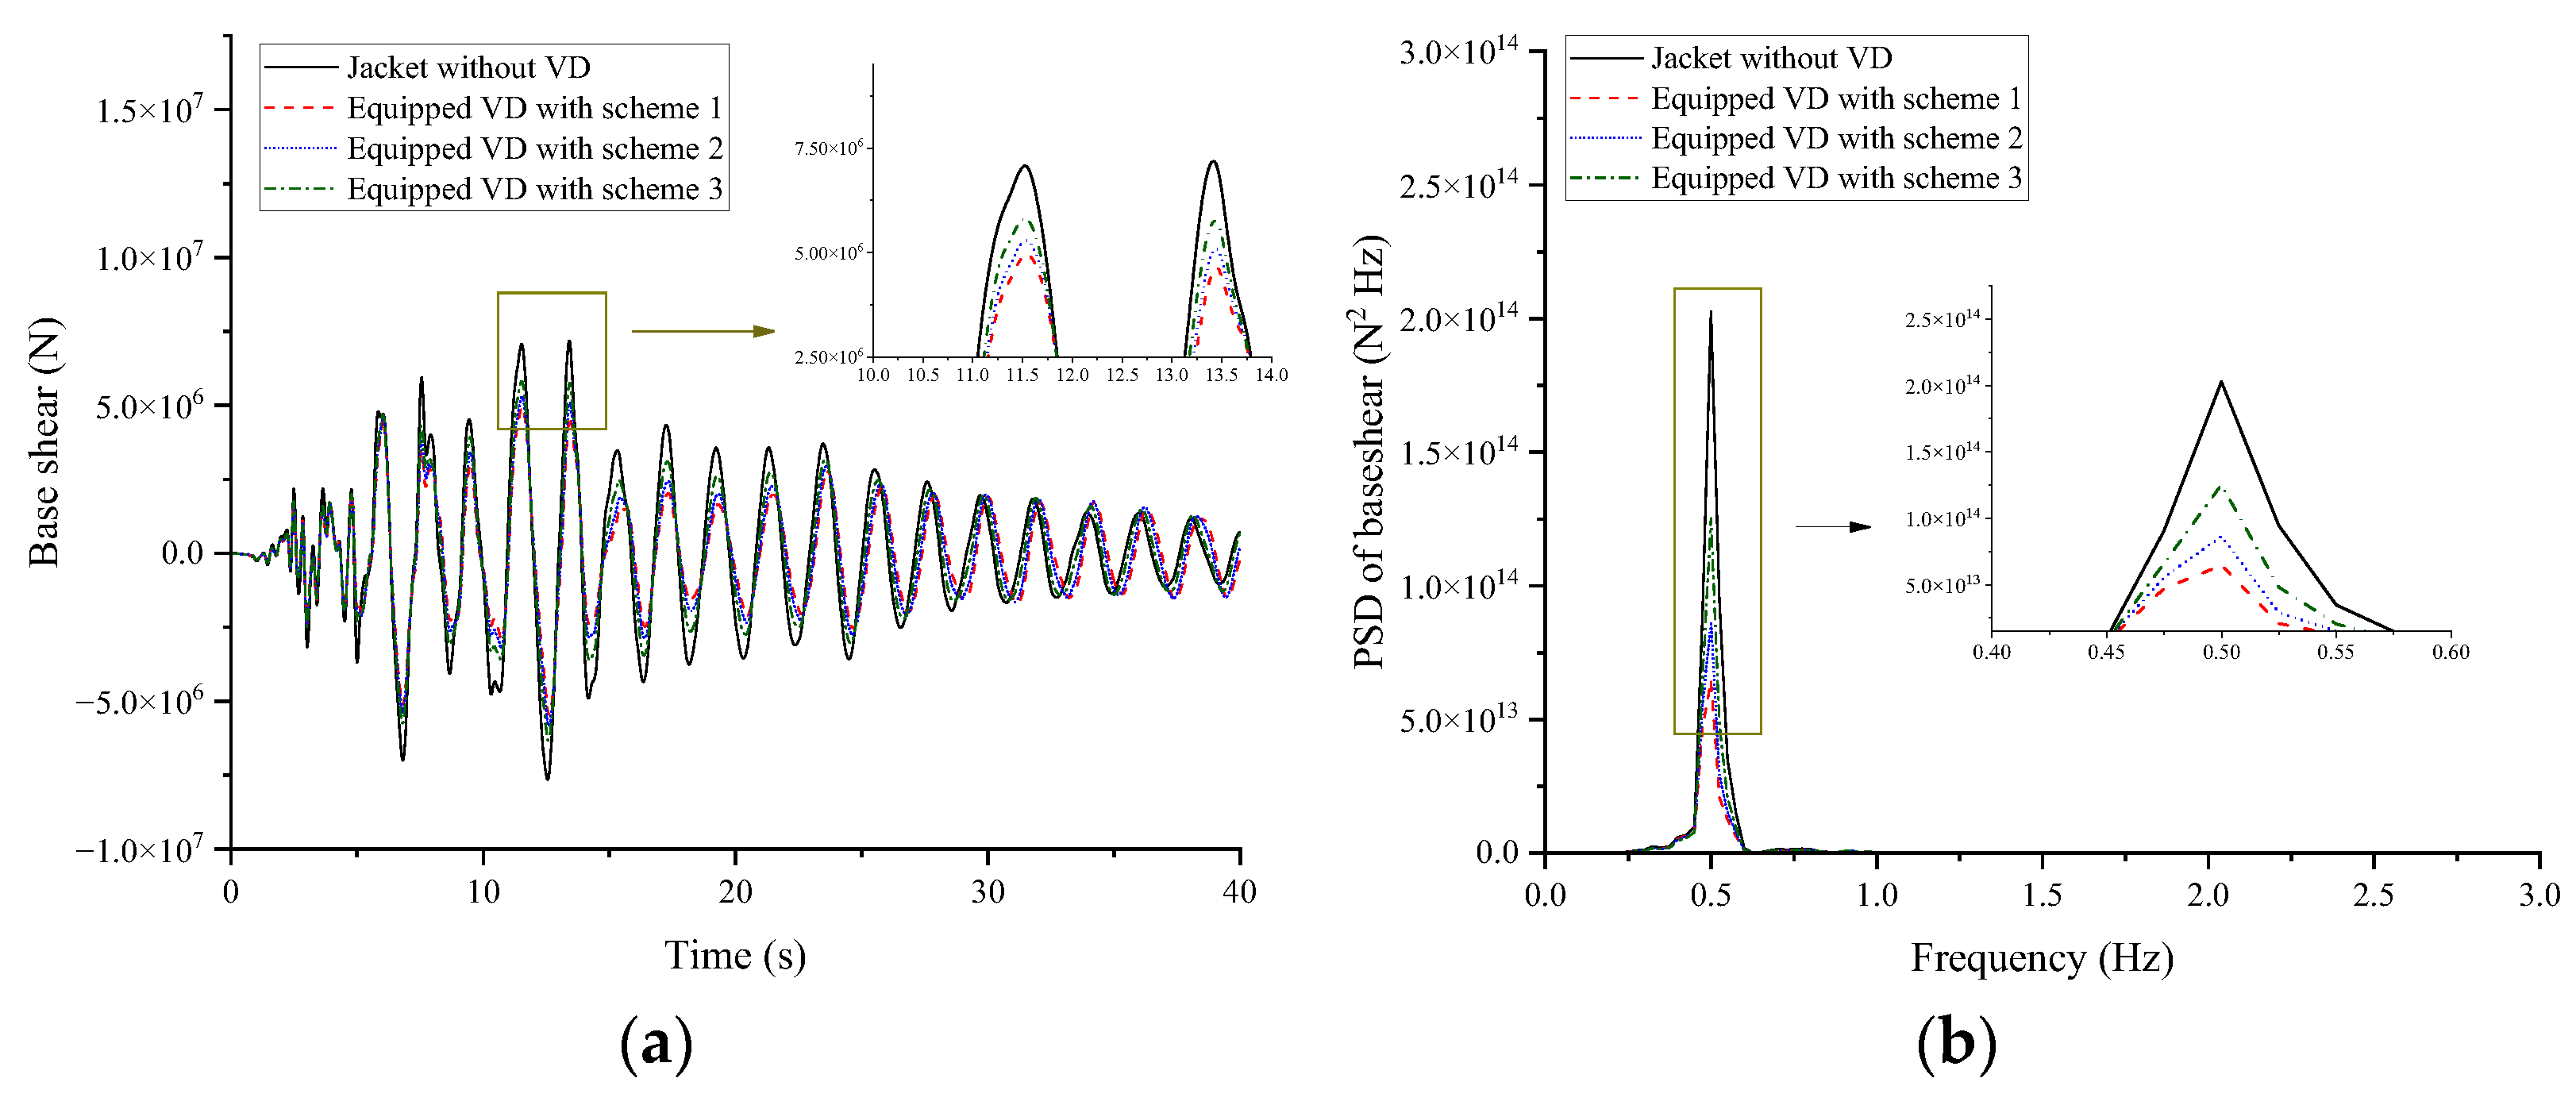
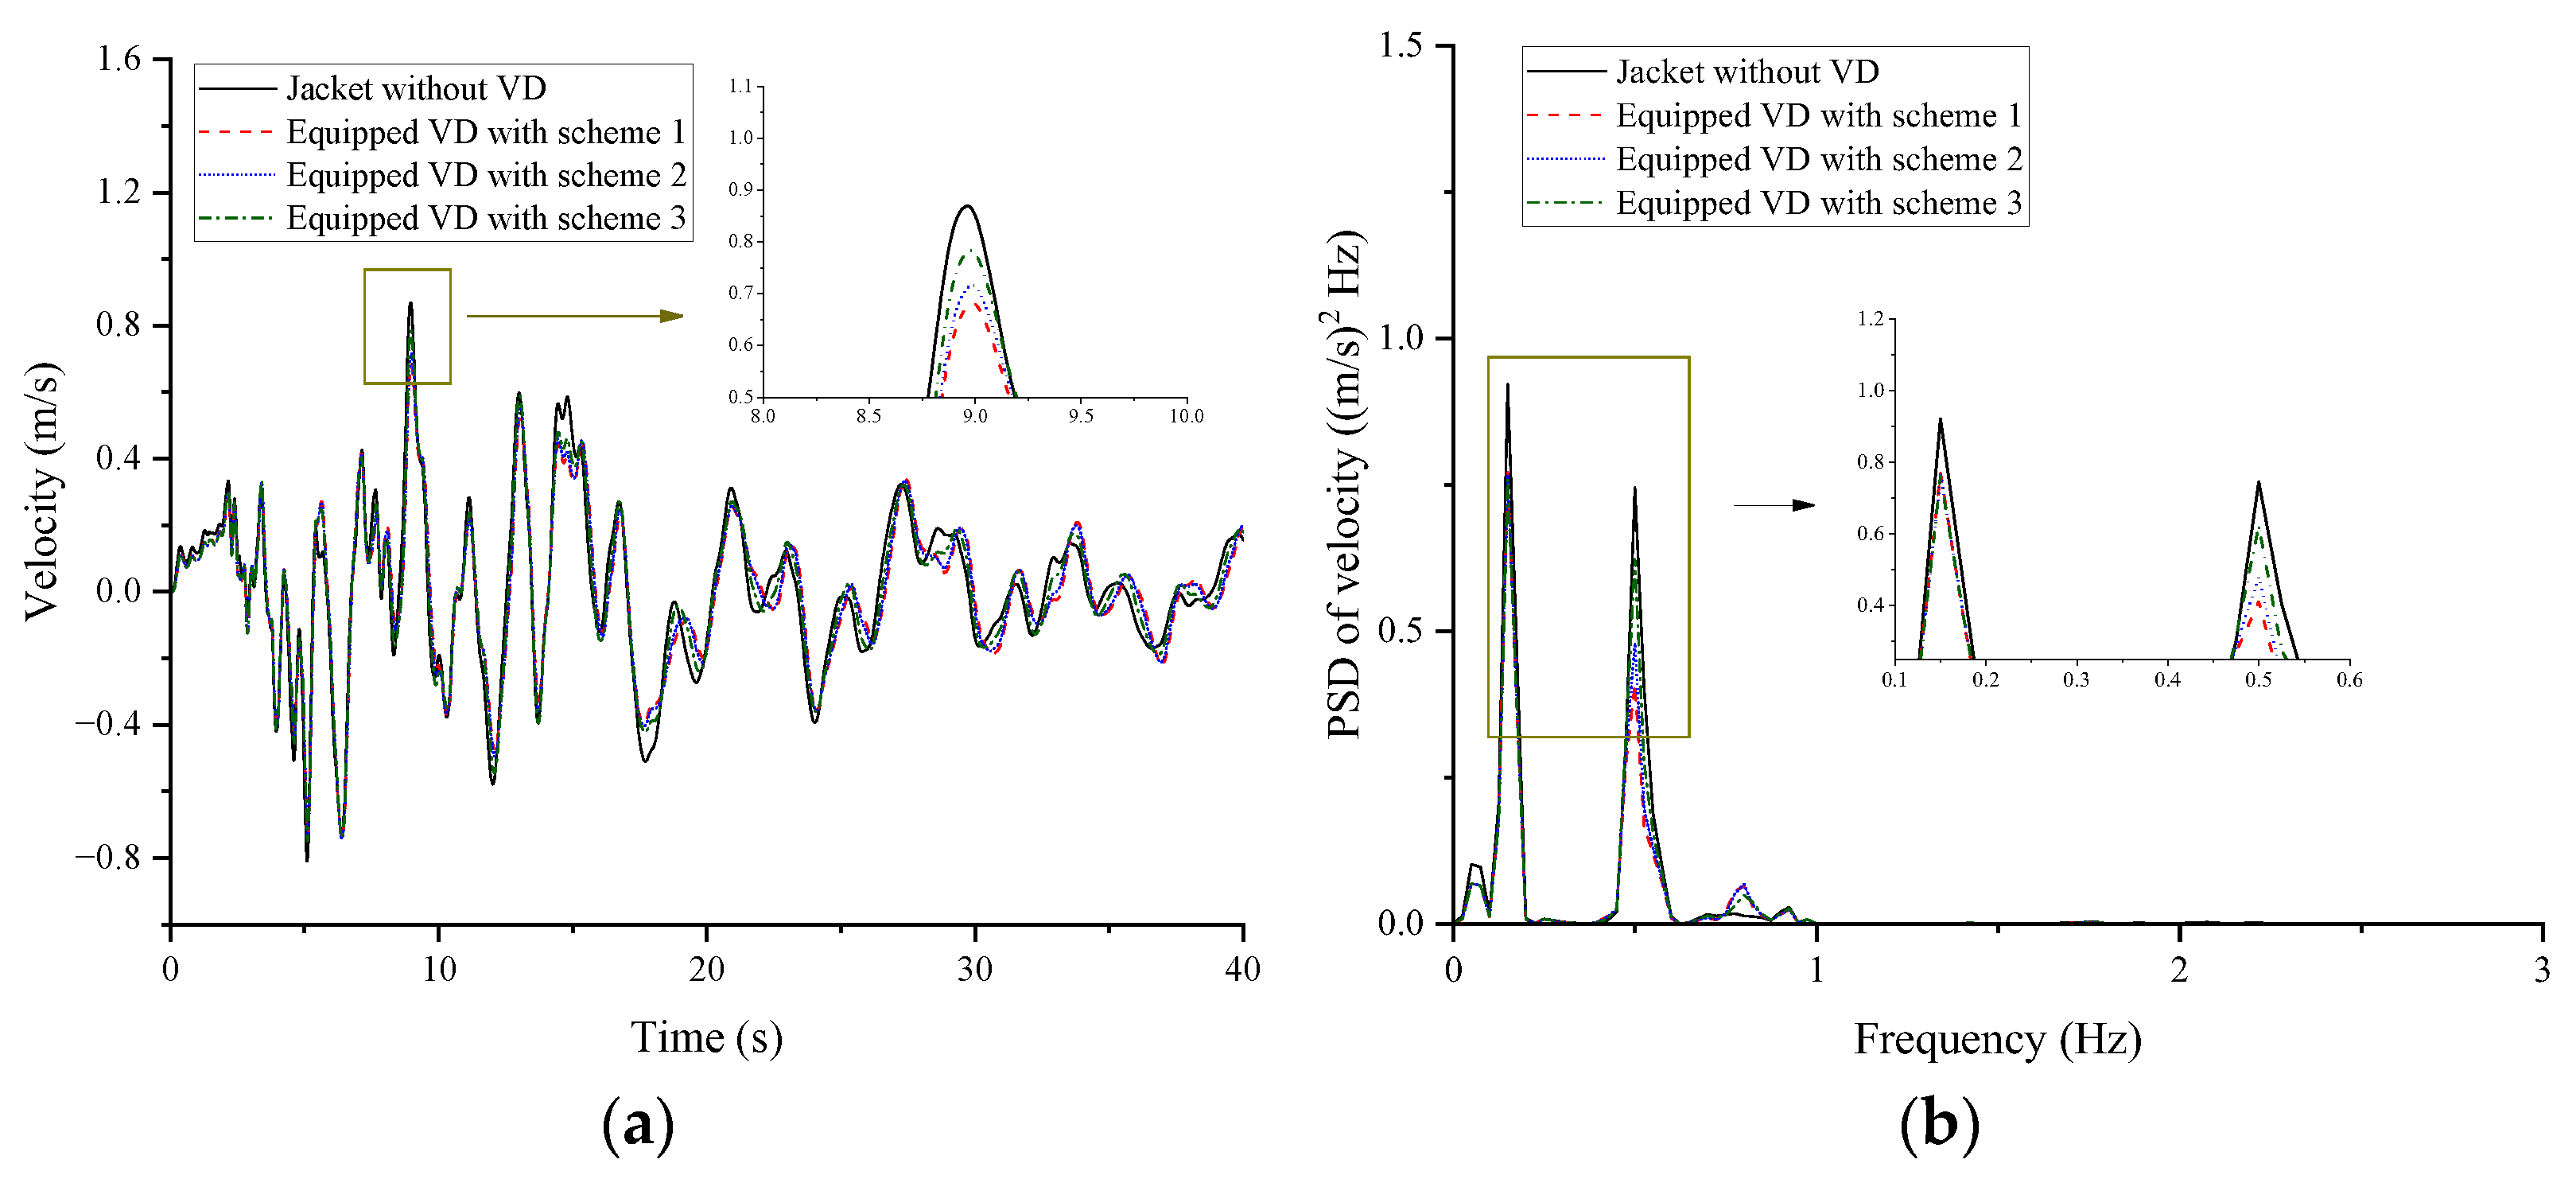
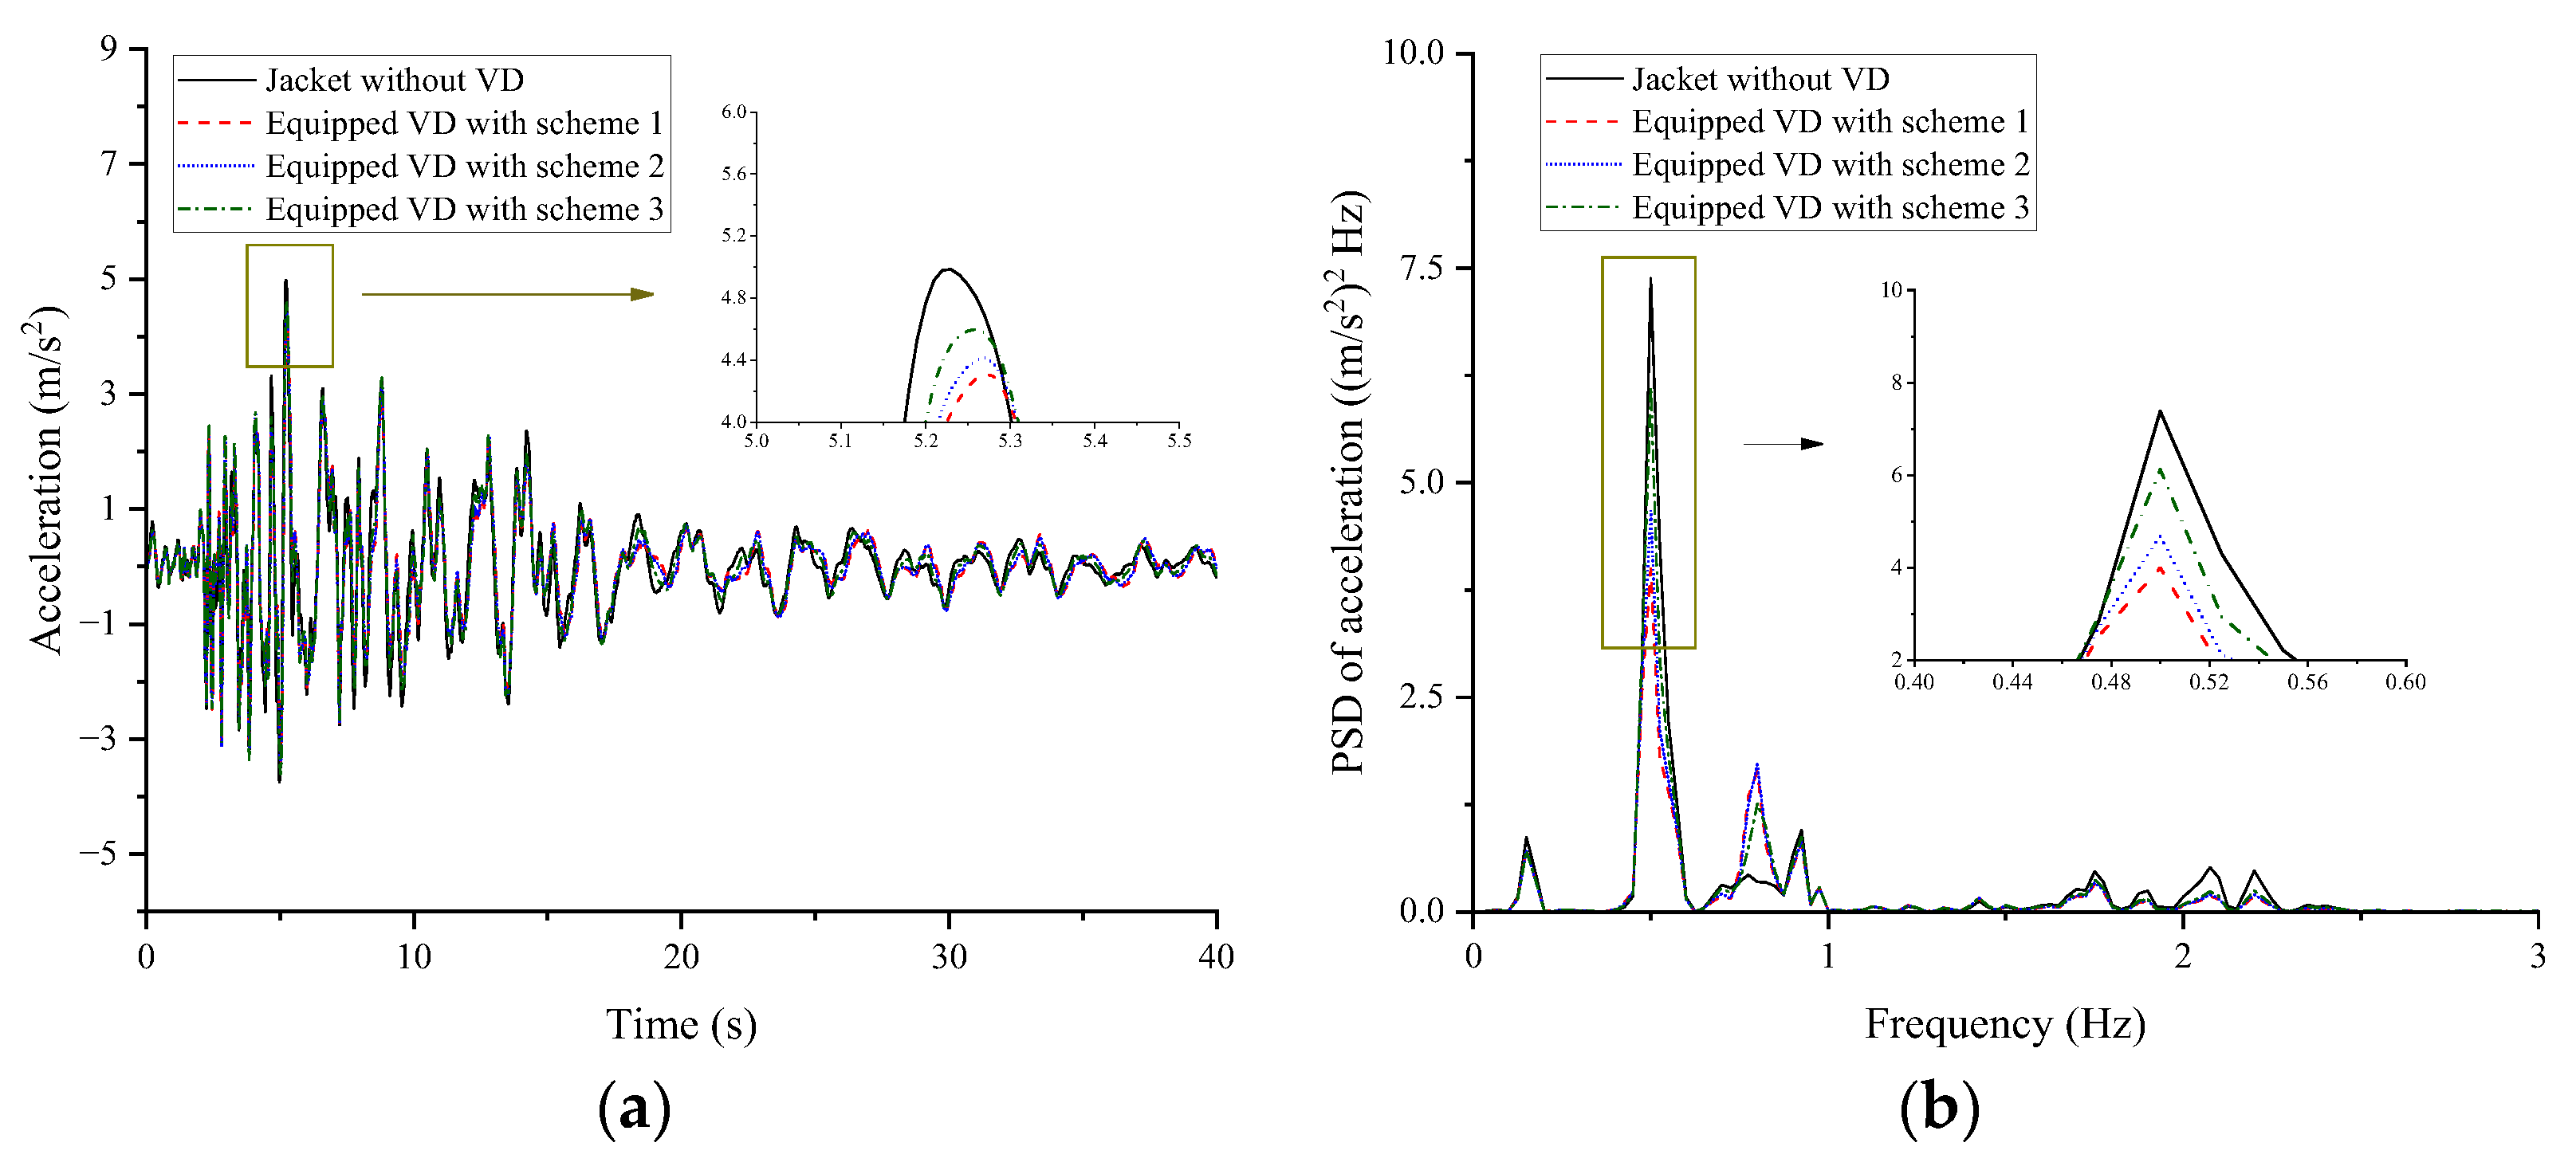
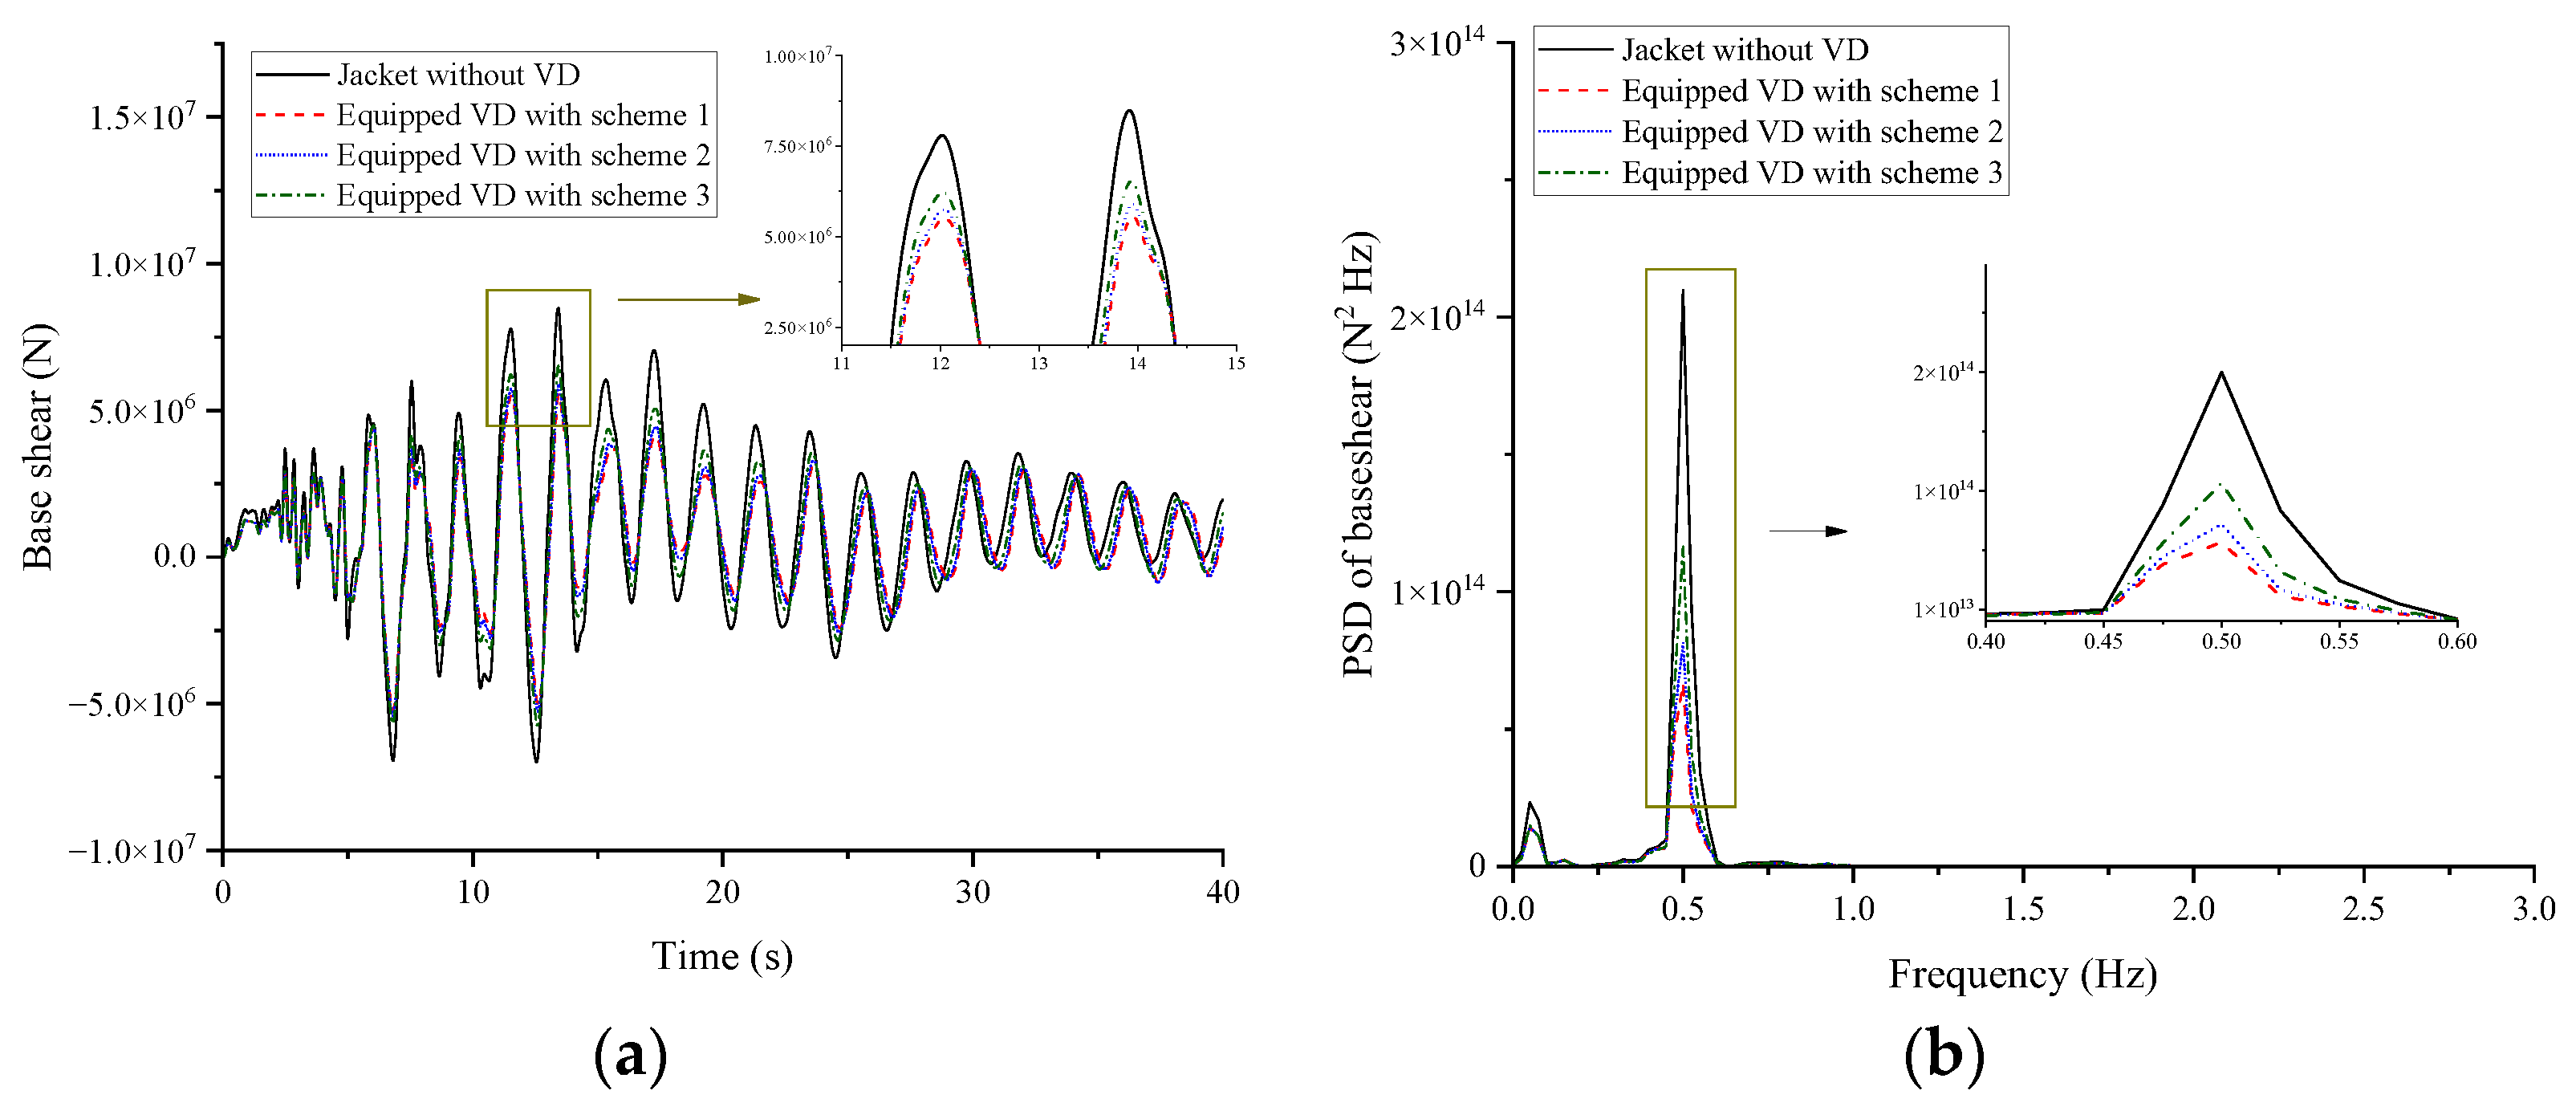
This study investigated the vibration control performance of viscous dampers on a deepwater offshore platform under wind, wave, and earthquake loads. A fine finite element model of the jacket platform was established in the Opensees software, and the soil–structure interaction was considered based on the p-y, t-z, and q-z springs. The wind speed and wave profile were evaluated by the von Kármán and JONSWAP spectrums, respectively, and the corresponding forces were calculated by Morison’s equation. The Kobe 1995 earthquake in Japan was selected as the earthquake excitation. The dynamic responses of the offshore platform equipped with VDs under seismic action only and the joint action of wind, wave, and earthquake excitation were analyzed. The VD-integrated offshore platform demonstrates superior vibration control under both seismic and multi-hazard excitations, achieving significant response reductions in deck displacement, velocity, acceleration, and base shear under earthquake loads, at 9.95%, 22.33%, 14.00%, and 31.08%, respectively, as well as 15.87% in displacement, 21.48% in velocity, 13.51% in acceleration, and 34.31% in base shear for combined wind–wave–earthquake loads. Furthermore, parametric analysis reveals that increasing damping coefficients substantially enhances this control effectiveness.

2. Viscous Dampers

The dynamic behavior of offshore jacket structures under environmental loads such as waves, wind, et al., necessitates a rigorous analysis of structural vibrations. To characterize the time-dependent response of offshore platforms, the governing equations of motion under external excitation have the following expression:
M δ ¨ + C T δ ˙ + K δ = F
where M represents the structural mass matrix. C T indicates the damping matrix. K refers to the structural stiffness matrix. δ , δ ˙ , and δ ¨ define the deformation, velocity, and acceleration of the structure, respectively. F denotes the external forces, including wind load F w i n d , wave and current load F w c , and earthquake loads F e ,
F = F w i n d + F w c + F e
Structural damping refers to the inherent energy dissipation mechanisms within a material or system, arising from internal friction, microstructural hysteresis, and localized deformations, et al. C T can be evaluated by the following equation:
C T = C S + C d a m p e r
where C S represents the damping matrix of the structure. C d a m p e r indicates the added damping matrix due to the damper. The determination of the damping coefficient C A is based on the target damping ratio, and can be yielded by the following formula [33]:
C A = ξ * ξ T s K s π
where ξ d is the target damping ratio. T s represents the natural period of the offshore platform. K s refers to the total stiffness. This study considered the target damping ratio of 10% [37].
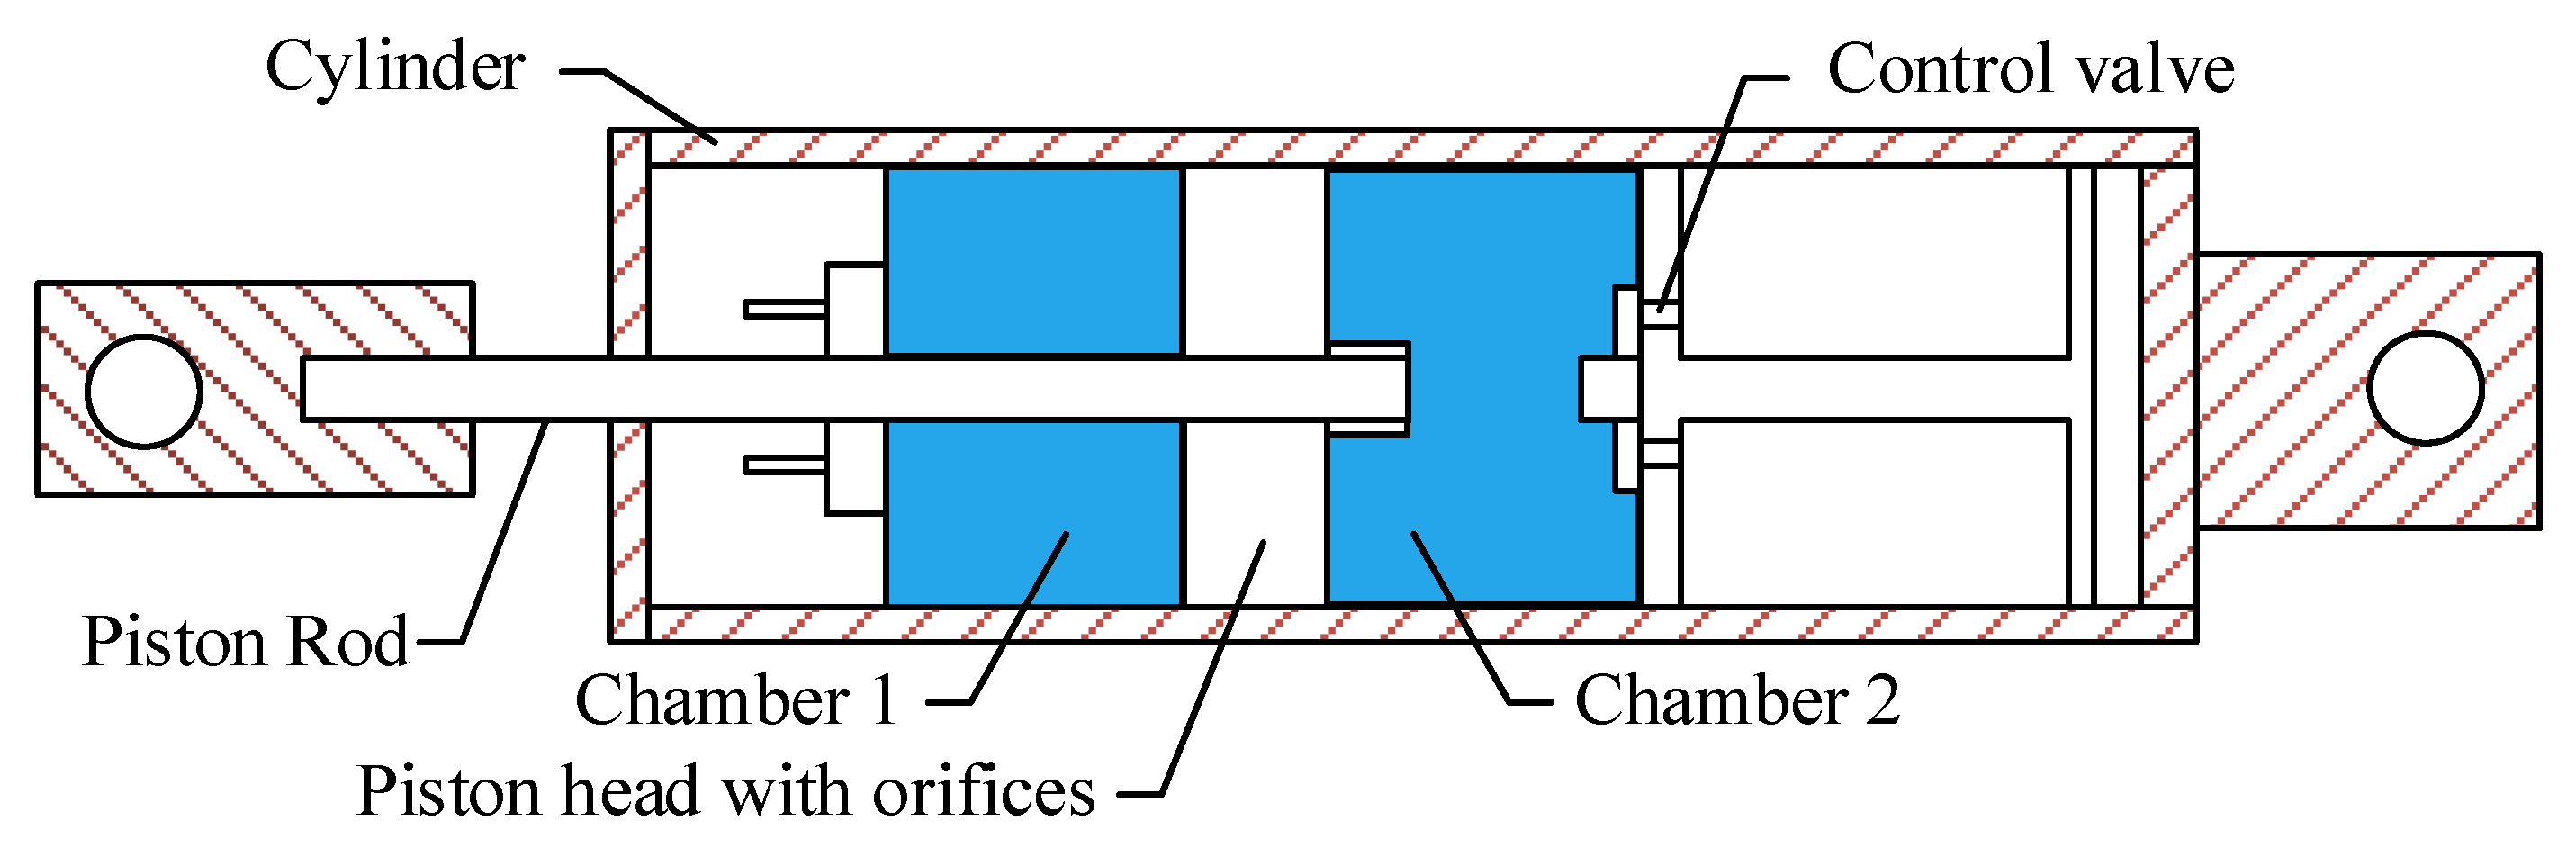
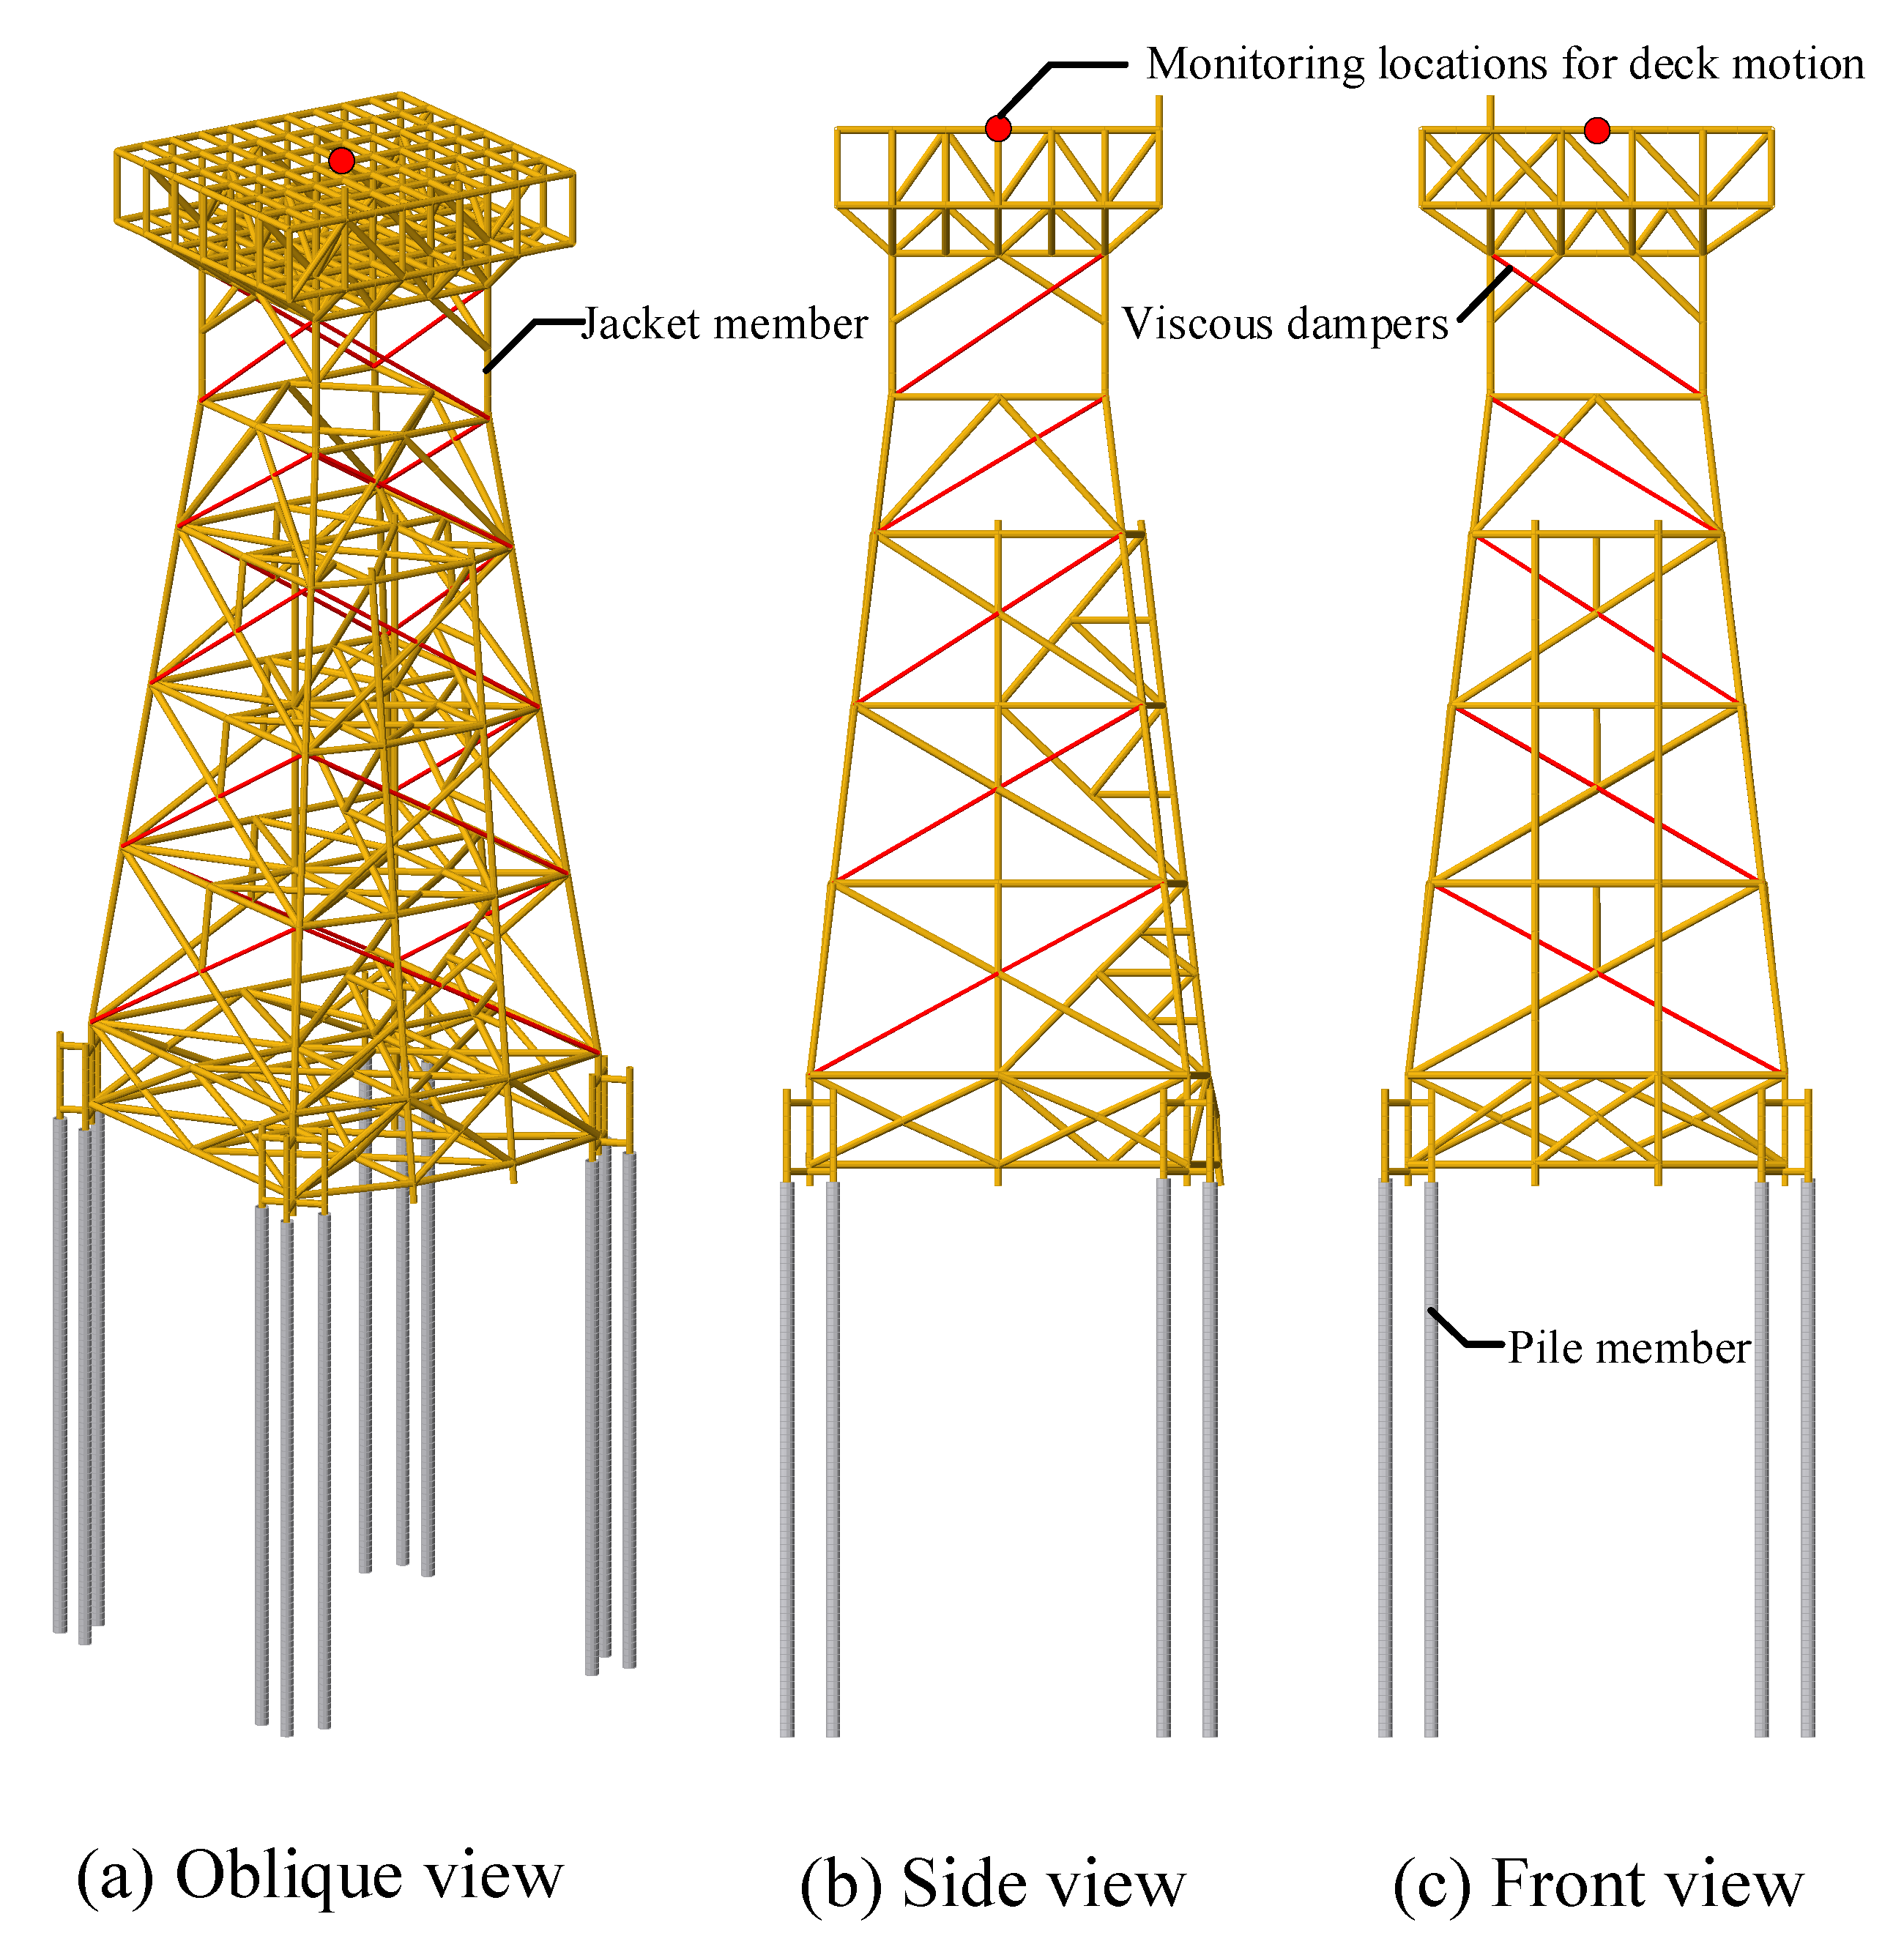
Viscous dampers, as shown in Figure 1, provide supplemental energy dissipation without altering the fundamental frequency characteristics, thereby avoiding resonance risks under operational conditions. Furthermore, the damper’s passive operation eliminates the need for external power or complex control systems, significantly reducing lifecycle costs. The integration of viscous dampers offers a critical balance between dynamic performance and cost efficiency.

3. Offshore Platform Overview and Finite Element Model

3.1. Deepwater Offshore Platform

The deepwater offshore platform, as shown in Figure 2, is designed for water depths of 105 m, consisting of an upper module and a lower jacket substructure. The lower foundation adopts a four-legged jacket-type structure with bucket foundations. After completing the construction, installation, and commissioning of the upper module, the entire structure will be transported offshore for final installation. The upper module features a four-tier layout with plan dimensions of 51 m × 47 m and an overall height of approximately 11 m, with the top deck elevation reaching approximately 48 m above sea level. The deck-mounted functional modules, including electrical distribution equipment, heating, ventilation, air conditioning systems, and fire safety installations, were rigorously incorporated into the finite element (FE) model through equivalent mass modeling techniques.
The jacket foundation incorporates four main legs supported by twelve open-ended steel pipe piles and features six strategically positioned horizontal framing levels along its vertical profile: the uppermost level at +9.0 m above the mean sea level (MSL) interfaces with the topside modules, while subsequent levels descend through −11 m, −36 m, −62 m, −90 m, and −103 m MSL, progressively increasing X-brace density and member wall thickness. The substructure features 55 m × 55 m at the seabed interface, with the legs inclined at a 1:7 slope ratio to enhance lateral stiffness against overturning moments. The piles have a diameter of 2.5 m with a wall thickness of 40 mm and a penetration depth of 80 m, as shown in Figure 3. Moreover, the tubular members of the jacket substructure are fabricated from S355 steel.

3.2. Finite Element Model

This study employs the OpenSees software to develop a high-fidelity finite element (FE) model of the offshore platform for dynamic analysis. As illustrated in Figure 4, the FE model comprises 456 nodes and 956 elements, strategically discretized to balance computational efficiency and resolution. Structural components are modeled using beam–column elements, and the nonlinear pile–soil interaction is simulated using the PySimple1, TzSimple1, and QzSimple1 material models within the OpenSees framework to capture axial, lateral, and tip resistance mechanisms.
Mesh convergence verification was performed to verify the stability and accuracy of the established finite element model, employing three refined discretization schemes. The coarse mesh configuration utilized a uniform 5 m element size for elements, while the medium mesh introduced localized refinement with 3 m elements. The fine mesh implements 1 m elements for the structure. Figure 5 illustrates the jacket top displacements under three meshes. The load case is applied to wind and wave loads, whose parameters are listed in Section 4.1. These results revealed that the coarse mesh overestimated peak displacements by 12% relative to the fine mesh baseline, and the medium mesh exhibited only a 4% deviation. Therefore, this study utilized the medium mesh to evaluate the structural responses considering accuracy and computational efficiency.
Eigenvalue analyses were performed to study the dynamic characteristics of the offshore platform established in this paper. Table 1 lists the first five natural frequencies, and the corresponding mode shapes are visualized in Figure 6. The fundamental modes demonstrate dominant the following behavior: Mode 1 and 4 exhibit global sway along the x-axis; Mode 2 and 5 show y-axis lateral deformation, while Mode 3 manifests as torsional rotation about the z-axis.

3.3. Environmental Load

3.3.1. Wind Load

To simulate the turbulent wind field acting on the offshore platform, the von Kármán spectrum was employed to generate spatially correlated wind velocity time histories. The von Kármán spectrum and longitudinal coherence model endorsed by [39] has the following expression:
S u f = 4 σ u 2 L / u ( 1 + 71 ( f L / u ) 2 ) 5 / 6
S v , w f = 2 σ v , w 2 L / u 1 + 71 ( f L / u ) 2 11 / 6 1 + 189 ( f L / u ) 2
C o h i , j = exp 1 u i = 1 3 A k 2
where S u f indicates the longitudinal wind spectrum. S v , w f defines the lateral and vertical wind spectrum. σ u denotes the standard deviations of longitudinal turbulent wind speed fluctuations. σ v , w refers to the lateral and vertical turbulent wind speed fluctuations. L defines the turbulence scale parameter. u represents the average wind speed at the reference height. C o h i , j defines the coherence between points i and j. Coefficient A k has the following expression:
A k = α k f n k Δ k q k z i z j H p k
where H indicates the reference height. The values of Δ k , q k , p k , r k and α k are listed in Table 2. Moreover, the grid resolution is set to 3 m to balance computational efficiency and accuracy.
The wind speed simulation at a height of 40 m in the target sea area is shown in Figure 7.
The tubular member subjected to the wind load F w i n d is evaluated by the following expression:
F w i n d = p A sin α
where A refers to the cross-sectional area of the member normal to the force. α indicates the angle between the wind direction and the axis of the members. p denotes the wind pressure, determined by
p = 0.00256 V 2 C h C s
where V represents the wind velocity, C h denotes the height coefficient, and C s represents the shape coefficient, which equals 0.5 for tubular members.

3.3.2. Wave and Current Load

This study adopted the JONSWAP spectral formulation [40], with Goda’s empirical parameterization [41], to model waves under finite fetch conditions in coastal waters. The JONSWAP spectrum has been widely recognized in offshore engineering for its validated accuracy in representing non-stationary wind–sea states, as evidenced by its adoption in industry standards such as [39,42].
S J f = B J H 1 / 3 2 T P 4 f 5 exp 1.25 T P f 4 γ p *
B J 0.0624 1.094 0.01915 × ln γ 0.23 + 0.0336 γ 0.185 ( 1.9 + γ ) 1
T p = T 1 / 3 / 1 0.132 γ + 0.2 0.559
p * = exp T p f 1 2 2 σ 2
σ σ a = 0.07 for   f f p σ b = 0.09 for   f > f p
where γ represents the peak control factor. H 1 / 3 indicates the significant wave height. T P denotes the peak wave period. T 1 / 3 refers to the wave period. f p defines the peak frequency. Figure 8 presents a simulated wave elevation time series generated via inverse Fast Fourier Transform.
Morison’s equation is applicable for the tubular member whose cross-sectional dimensions are small-scale compared to the wavelength; therefore, the jacket offshore platform subjected to the wave and current loads F w c can be expressed by
F w c = F D + F I
where F D and F I indicate the drag and inertia forces, respectively:
F D = 1 2 C D D ρ V n V n
F I = 1 4 π C M D 2 ρ V ˙ n
where C D and C M define the drag and inertia coefficient for the member. D indicates the diameter of the member. ρ represents water mass density. V n and V ˙ n refer to the fluid particle velocity and acceleration, respectively.

3.3.3. Earthquake Load

The forces caused by the earthquake can be expressed by the following equation:
F E = M Γ δ ¨ g
where Γ and δ ¨ g define the position vector of external excitation and ground acceleration, respectively.

3.4. Soil–Structure Interaction

This study considers the SSI effects for the offshore platform based on the code [43], which is evaluated by axial and lateral nonlinear Winkler springs. The ultimate bearing capacity Q d has the following expression:
Q d = Q f + Q p = f A S + q A p
where Q f and Q p define the skin friction resistance and the total end bearing. f and q represent the unit skin friction capacity and the end bearing capacity. A S and A p denote the side surface area and gross end area for the pile. The f for the clay, fc, and sand, fs, should be determined by
f c = α c
f S = β p 0
where c represents the undrained shear strength of the soil. p 0 refers to the effective overburden pressure. β indicates the dimensionless shaft friction factor. α refers to the dimensionless factor, determined by
α = 0.5 Ψ 0.5   for   Ψ 1 0.5 Ψ 0.25 for Ψ > 1
where Ψ = c / p 0 . The tz curves for clay and sand are listed in Table 3 and Table 4.
The q values for clay, qc, and sand, qs, have the following expression:
q c = 9 c
q s = N q p 0
where N q is the dimensionless bearing capacity factor. The qz curves for clay and sand are shown in Table 5.
The lateral ultimate resistance p u c for clay is expressed as
p u c = 3 c + γ X + J c X D for   X < X R 9 c for   X X R
where γ represents the effective unit weight of soil. X indicates the depth. J refers to the dimensionless empirical constant. XR defines the depth below the soil surface to the bottom of the reduced resistance zone, determined by
X R = 6 D γ D c + J
Table 6 shows the py curves for soft clay.
The lateral ultimate resistance of sand p u for shallow ( p u s s ) and deep ( p u s d ) depths is expressed as
p u = min p u s s , p u s d
p u s s = C 1 × H + C 2 × D × γ × H
p u s d = C 3 × D × γ × H
where C 1 , C 2 , and C 3 are coefficients. H represents the depth. The py curves for sand are expressed by
P = A × p u × tanh k × H A × p u × y
where A refers to the factor accounting for cyclic or static loading conditions, valuing max 3 0.8 H / D , 0.9 for static loading. k defines the initial modulus of the subgrade reaction. The py, tz, and qz curves at different depths of the offshore platform pile foundation are shown in Figure 9.

4. Vibration Control of Offshore Platform Using Viscous Dampers

4.1. Metocean Conditions

The offshore platform is located in a deepwater region off the coast of Zhejiang Province, China, as illustrated in Figure 10, where the marine environment is characterized by high-intensity typhoons and stratified seabed geology.
Environmental parameters encompass wind and wave characteristics. The design wind speed for a 100-year return period at a 10 m height is 37 m/s. Table 7 details the extreme return period wave characteristics and current velocities. The 100-year return period storm condition exhibits a significant wave height of 32.2 m paired with a spectral peak period of 18.9 s, while currents demonstrate marked asymmetry between flood and ebb phases.
Subsea geotechnical conditions, as shown in Table 8, established through a campaign of boreholes below the mud line, reveal a stratigraphic sequence critical to foundation design. From the seabed downward, four distinct sand-dominated strata are identified: an upper loose sand unit transitioning to medium-dense sands with gradual increases in effective unit weight and friction angle. These are underlain by three clay interlayers with undrained shear strength, progressively intensifying from 96 kPa to 179 kPa. The basal soil unit comprises highly compacted sand, forming a competent bearing stratum for pile tip embedment.
For the Zhejiang coastal region, a design peak ground acceleration (PGA) of 0.3 g for the earthquake should be considered with a 475-year return period, based on the code [44]. To comply with code requirements, the 1995 Kobe earthquake’s JR Takatori station record was linearly scaled to achieve a target PGA of 0.3 g, as shown in Figure 11.

4.2. Viscous Damper Layout Scheme

The jacket platform, as shown in Figure 2, characterized by a multi-tiered space-beam configuration with interconnected vertical legs, horizontal diaphragms, and X-bracing systems, exhibits pronounced vibrations and inter-story drift accumulation subjected to wind, wave, and seismic loads. Moreover, the vibration control performance exhibits parametric sensitivity to both the damper position and parameter setting. Therefore, rather than uniform spatial distribution, advanced layout optimization prioritizes damping contributions in high-deformation zones, such as leg–brace intersections, deck–leg interfaces, et al., which will have significant effects.
As illustrated in Figure 12, this study implements a diagonal arrangement strategy by adding one diagonal member in each X-bracing panel at every platform story with viscous dampers, establishing a multi-tiered energy dissipation system. Compared with the chevron and toggle configuration, the diagonal configuration, transmitting forces along the brace axis, does not introduce secondary bending moments for the beam. Moreover, the diagonal configuration does not require lever arms and extra supports, allowing lighter, economical designs. The effectiveness of the diagonal configuration in reducing structural control has been validated by reference [33].

4.3. Dynamic Responses and Discussion

This section conducts a comparative evaluation of the offshore platform dynamic performance under two distinct excitation regimes: seismic-only and wind–wave–earthquake interactions, quantifying the effectiveness of VDs in reducing acceleration, velocity, displacement of the deck, and base shear forces. The environmental loads were determined based on a 100-year return period for wind speed and wave parameters [39], and the wind, wave, and earthquake loads were implemented concurrently through coupled dynamic analysis. Moreover, the effectiveness of different parameters of VDs in reducing the dynamic response of the structure was analyzed. Table 9 lists the different VD parameters considered in this study.

4.3.1. Seismic-Induced Vibration

The comparison of seismic-induced displacement, velocity, and acceleration of the offshore platform deck of the jacket equipped with VDs versus the without VDs in both the time and frequency domains is systematically presented in Figure 13, Figure 14 and Figure 15. The frequency domain of the four indicators shows two peaks, corresponding, respectively, to the two frequencies of the structure in the direction of seismic action. Compared to the structure without VDs, the acceleration, velocity, and displacement response of the platform equipped with VDs in scheme 1 were significantly reduced by 9.95%, 22.33%, and 14%, respectively. Due to the damping force of VDs relying on the relative velocity at both ends, when the structural displacement reaches its maximum, the relative velocity equals 0, and VDs cannot exert control force. Moreover, displacement represents the time integral of velocity and is therefore influenced by cumulative effects. Consequently, effective displacement regulation requires sustained velocity reduction over multiple cycles, resulting in inherently slower response characteristics compared to VDs’ direct control of velocity or acceleration.
Different VD parameters result in significantly different vibration control outcomes for offshore jacket structures. Table 10 lists the reduction ratios of maximum structural responses for different damper schemes. The reduction ratio of deck displacement, velocity, and acceleration significantly increases with the enhancement of the damping coefficient. Increasing the damping coefficient of VDs enhances energy dissipation capacity by intensifying fluid shear deformation. A higher damping coefficient amplifies the damping force generated at piston velocity and converts the structural kinetic energy into thermal energy.
The influence of VDs on base shear under seismic loads is demonstrated in Figure 16. Structural analysis reveals that the uncontrolled jacket structure experiences significant base shear fluctuations, with peak forces reaching 7183 kN during seismic events. The implementation of VDs substantially mitigates these structural demands through velocity-dependent energy dissipation mechanisms. Scheme 1 achieves the most pronounced reduction, limiting maximum shear to 4951 kN, representing a 31.08% decrease. Scheme 2 and scheme 3 follow with respective shear forces of 5289 kN and 5807 kN, corresponding to reductions of 26.36% and 19.15%. This progressive performance degradation correlates directly with increasing damping coefficient configurations across the schemes, as higher damping coefficients significantly increase the damping forces. Consequently, all three schemes confirm VD systems effectively reduce structural demands under earthquake loads.

4.3.2. Wind-, Wave-, and Earthquake-Induced Vibration

Figure 17, Figure 18 and Figure 19 demonstrate the influence of VDs on the deck of displacement, velocity, and acceleration under the joint wind, wave, and earthquake excitation. Different from seismic loads, the first peak in the frequency domain is the central frequency of wave excitation. The maximum displacement, velocity, and acceleration of the jacket without VDs are 0.75 m, 0.87 m/s, and 4.99 m/s2, respectively. The uncontrolled displacement peak reaches the structural serviceability limit of H/200 (where H refers to the jacket height, 150 m), indicating critical deformation risks. With VDs installed, the maximum displacement is reduced to approximately 0.63 m, demonstrating effective drift constraint control. Moreover, VDs achieve optimal velocity and acceleration reductions of 21.48% and 13.51%, respectively, demonstrating effective kinetic energy dissipation in the joint action of wind, wave, and earthquake excitations. Consistent with seismic load observations, increasing damping coefficients enhance VD performance, as listed in Table 10, primarily due to the increase in damping forces.
As quantitatively demonstrated in Figure 20, the multi-hazard coupling of wind, wave, and seismic excitations generates extreme base shear forces reaching 8480 kN in the uncontrolled jacket structure. The implementation of VDs significantly mitigates these forces, with Scheme 1’s optimal stiffness configuration achieving a base shear reduction to 5570 kN. Consistent with seismic load trends, decreased damping coefficients progressively diminish VD efficacy, with scheme 2 limiting shear forces to 5902 kN, while Scheme 3’s design yields 6533 kN. This confirms that increasing the damping coefficient enhances energy dissipation capacity and improves control effects. Crucially, even the least effective VD configuration maintains vital safety margins, reducing overturning moments by 22.97%.

4.4. Installation, Maintenance, and Costs

VD deployment on jacket platforms prioritizes modularity and subsea compatibility, which enables integration with existing structural nodes through pre-welded flanges. Subsea installation leverages corrosion-resistant materials to withstand high-salinity environments. Pre-installation surface treatments, such as epoxy coatings and sacrificial anode systems, are essential to counteract marine biofouling and electrochemical degradation. During the long-term operation of VDs, maintenance strategies should be implemented to enhance their reliability and stability. These include visual inspections for leaks and damage, testing fluid viscosity, and potentially replacing dampers at recommended intervals. Compared with its counterparts, the VD often presents a more economical solution from the installation and long-term maintenance standpoint. The costs of VDs can be partly offset by saving steel tonnage and minimal maintenance. Moreover, as described in Section 4.3, VDs significantly reduced the structural response to wind, wave, and earthquake loads, thus minimizing damage and related costs.

5. Conclusions

This study evaluated the effects of viscous dampers in reducing the vibration of deepwater offshore platforms under wind, waves, and earthquakes. This study supports the following conclusions:
(1)
Viscous damper installation in diagonal bracing configurations demonstrates significant multi-hazard vibration suppression efficacy, reducing critical structural responses under both isolated seismic events and combined wind–wave–earthquake conditions.
(2)
Under seismic excitation, the offshore platform integrated with VDs demonstrated superior vibration mitigation performance. Compared with the jacket without VDs, the deck displacement, velocity, acceleration, and base shear of the jacket with optimal VDs exhibited reductions of 9.95%, 22.33%, 14.00%, and 31.08%, respectively. Under the combined wind, wave, and earthquake excitations, the maximum deck displacement reaches 0.75 m, the critical limits of design code, but when equipped with VDs, the deck displacement was decreased by 15.87%, satisfying the code requirement, and the deck velocity, acceleration, and base shear were decreased by 15.87%, 21.48%, 13.51%, and 34.31%, respectively.
(3)
The parameters analysis of VDs showed that increasing brace stiffness diminishes vibration control effectiveness, evidenced by velocity reduction plummeting from 22.33% to 5.70% and base shear mitigation dropping from 31.08% to 19.15%. The higher damping coefficient amplifies the damper force, strengthening the absorption rate and dissipation rate of structural kinetic energy, ultimately resulting in more pronounced and rapid suppression of structural vibration responses.
(4)
This study employs a simplified model for VDs that inherently neglects their complex physical behavior under high-strain damping conditions. Such conditions, characterized by high piston velocities, large displacement demands, or severe seismic excitations, introduce unmodeled phenomena. Moreover, a significant temperature rise during extreme loading may cause fluid viscosity reduction and consequent damping coefficient degradation. Future studies will address these effects to enhance predictive accuracy under extreme scenarios.

Author Contributions

Conceptualization, K.J. and L.W. (Lizhong Wang); methodology, H.L. and G.L.; software, H.L. and L.W. (Lilin Wang); validation, H.L. and H.Y.; formal analysis, L.W. (Lizhong Wang); investigation, H.L. and L.W. (Lilin Wang); resources, H.Y. and K.J.; data curation, K.J.; writing—original draft preparation, H.L.; writing—review and editing, K.J., L.W. (Lizhong Wang) and L.W. (Lilin Wang); visualization, H.Y.; supervision, G.L.; project administration, G.L. and K.J.; funding acquisition, K.J. All authors have read and agreed to the published version of the manuscript.

Funding

This research was funded by the National Natural Science Foundation of China (Grant No. 52409144), and the Zhejiang Provincial Pioneer Research & Development Program (Grant No. 2024C03031).

Data Availability Statement

The original contributions presented in this study are included in the article.

Conflicts of Interest

Authors Dr. Jiang, Mr. Lv and Mr. Yu were employed by the company Power China Huadong Engineering Corporation Limited, Hangzhou. The remaining authors declare that the research was conducted in the absence of any commercial or financial relationships that could be construed as a potential conflict of interest.

Abbreviations

The following abbreviations are used in this manuscript:
FDFriction damper
FEFinite element
HBMDHydrodynamic buoyant mass damper
MSLMean sea level
PTMDPounding Tuned mass dampers
SMAShape memory alloy
TLCDTuned liquid column damper
TLCGDTuned liquid column–gas damper
TLDTuned liquid dampers
TMDTuned mass dampers
VDViscous damper

References

  1. Abdel Raheem, S.E.; Abdel Aal, E.M.; Abdel Shafy, A.G.; Fahmy, M.F.; Omar, M.; Mansour, M.H. In-place analysis for design-level assessment of the fixed offshore platform. Ships Offshore Struct. 2021, 16, 892–903. [Google Scholar] [CrossRef]
  2. Kharade, A.; Kapadiya, S.V. Offshore engineering: An overview of types and loadings on structures. Int. J. Struct. Civ. Eng. Res. 2014, 3, 16–28. [Google Scholar]
  3. Sarkar, N.; Ghosh, A.D. A frequency domain study on deck isolation effectiveness in control of wave-induced vibration of offshore jacket platform. Ocean. Eng. 2023, 270, 113682. [Google Scholar] [CrossRef]
  4. Sun, Y.H.; Niu, Q.; Nie, L.W.; Zhang, J.G. Vibration control of offshore platform based on outrigger damping system. Appl. Mech. Mater. 2013, 351, 1112–1116. [Google Scholar] [CrossRef]
  5. Vaezi, M.; Pourzangbar, A.; Fadavi, M.; Mousavi, S.M.; Sabbahfar, P.; Brocchini, M. Effects of stiffness and configuration of brace-viscous damper systems on the response mitigation of offshore jacket platforms. Appl. Ocean. Res. 2021, 107, 102482. [Google Scholar] [CrossRef]
  6. Peng, B.-F.; Chang, B.; Llorente, C. Nonlinear Dynamic Soil-Pile-Structure Interaction Analysis of a Deepwater Platform for Ductility Level Earthquakes; Offshore Technology Conference: Houston, TX, USA, 2005; p. OTC-17274-MS. [Google Scholar]
  7. Xu, T.; Li, Y.; Leng, D. Mitigating jacket offshore platform vibration under earthquake and ocean waves utilizing tuned inerter damper. Bull. Earthq. Eng. 2023, 21, 1627–1650. [Google Scholar] [CrossRef]
  8. Motlagh, A.A.; Shabakhty, N.; Kaveh, A. Design optimization of jacket offshore platform considering fatigue damage using Genetic Algorithm. Ocean. Eng. 2021, 227, 108869. [Google Scholar] [CrossRef]
  9. Shabakhty, N.; Motlagh, A.A.; Kaveh, A. Optimal design of offshore jacket platform using enhanced colliding bodies optimization algorithm. Mar. Struct. 2024, 97, 103640. [Google Scholar] [CrossRef]
  10. Tian, X.; Wang, Q.; Liu, G.; Liu, Y.; Xie, Y.; Deng, W. Topology optimization design for offshore platform jacket structure. Appl. Ocean. Res. 2019, 84, 38–50. [Google Scholar] [CrossRef]
  11. Zhang, B.-L.; Han, Q.-L.; Zhang, X.-M. Recent advances in vibration control of offshore platforms. Nonlinear Dyn. 2017, 89, 755–771. [Google Scholar] [CrossRef]
  12. Ma, R.; Bi, K.; Zuo, H.; Du, X. Inerter-based damping isolation system for vibration control of offshore platforms subjected to ground motions. Ocean. Eng. 2023, 280, 114726. [Google Scholar] [CrossRef]
  13. Leng, D.; Zhu, Z.; Xu, K.; Li, Y.; Liu, G. Vibration control of jacket offshore platform through magnetorheological elastomer (MRE) based isolation system. Appl. Ocean. Res. 2021, 114, 102779. [Google Scholar] [CrossRef]
  14. Lavassani, S.H.H.; Gavgani, S.A.M.; Doroudi, R. Optimal control of jacket platforms vibrations under the simultaneous effect of waves and earthquakes considering fluid-structure interaction. Ocean. Eng. 2023, 280, 114593. [Google Scholar] [CrossRef]
  15. Som, A.; Das, D. Seismic vibration control of offshore jacket platforms using decentralized sliding mode algorithm. Ocean. Eng. 2018, 152, 377–390. [Google Scholar] [CrossRef]
  16. Zhang, B.-L.; Han, Q.-L.; Zhang, X.-M.; Tang, G.-Y. Active Control of Offshore Steel Jacket Platforms; Springer: Berlin/Heidelberg, Germany, 2019. [Google Scholar]
  17. Lackner, M.; Rotea, M.; Saheba, R. Active structural control of offshore wind turbines. In Proceedings of the 48th AIAA Aerospace Sciences Meeting Including the New Horizons Forum and Aerospace Exposition, Orlando, FL, USA, 4–7 January 2010; p. 1000. [Google Scholar]
  18. Hillis, A. Active motion control of fixed offshore platforms using an extended state observer. Proc. Inst. Mech. Eng. Part I J. Syst. Control Eng. 2010, 224, 53–63. [Google Scholar] [CrossRef]
  19. Paul, S.; Datta, T.; Kapuria, S. Control of fixed offshore jacket platform using semi-active hydraulic damper. J. Offshore Mech. Arct. Eng. 2009, 131, 041106. [Google Scholar] [CrossRef]
  20. Lin, W.; Lin, Y.; Song, G.; Li, J. Multiple Pounding Tuned Mass Damper (MPTMD) control on benchmark tower subjected to earthquake excitations. Earthq. Struct. 2016, 11, 1123–1141. [Google Scholar] [CrossRef]
  21. Dou, P.; Xue, M.-A.; Zheng, J.; Zhang, C.; Qian, L. Numerical and experimental study of tuned liquid damper effects on suppressing nonlinear vibration of elastic supporting structural platform. Nonlinear Dyn. 2020, 99, 2675–2691. [Google Scholar] [CrossRef]
  22. Colwell, S.; Basu, B. Tuned liquid column dampers in offshore wind turbines for structural control. Eng. Struct. 2009, 31, 358–368. [Google Scholar] [CrossRef]
  23. Golafshani, A.A.; Gholizad, A. Friction damper for vibration control in offshore steel jacket platforms. J. Constr. Steel Res. 2009, 65, 180–187. [Google Scholar] [CrossRef]
  24. Enferadi, M.H.; Ghasemi, M.R.; Shabakhty, N. Wave-induced vibration control of offshore jacket platforms through SMA dampers. Appl. Ocean. Res. 2019, 90, 101848. [Google Scholar] [CrossRef]
  25. Wu, Q.; Zhao, X.; Zheng, R.; Minagawa, K. High Response Performance of a Tuned-Mass Damper for Vibration Suppression of Offshore Platform under Earthquake Loads. Shock Vib. 2016, 2016, 7383679. [Google Scholar] [CrossRef]
  26. Gavgani, S.A.M.; Homami, P.; Darbanian, R.; Moharrerzadeh, K. Probabilistic assessment of optimum tuned mass damper in offshore platforms considering fluid–structure interaction. Mar. Syst. Ocean. Technol. 2024, 19, 57–67. [Google Scholar] [CrossRef]
  27. Pourzangbar, A.; Vaezi, M. Effects of pendulum tuned mass dampers on the dynamic response of jacket platforms. Ocean. Eng. 2022, 249, 110895. [Google Scholar] [CrossRef]
  28. Jin, Q.; Li, X.; Sun, N.; Zhou, J.; Guan, J. Experimental and numerical study on tuned liquid dampers for controlling earthquake response of jacket offshore platform. Mar. Struct. 2007, 20, 238–254. [Google Scholar] [CrossRef]
  29. Sardar, R.; Chakraborty, S. Wave vibration control of jacket platform by tuned liquid dampers. Ocean. Eng. 2022, 247, 110721. [Google Scholar] [CrossRef]
  30. Mousavi, S.A.; Bargi, K.; Zahrai, S.M. Optimum parameters of tuned liquid column–gas damper for mitigation of seismic-induced vibrations of offshore jacket platforms. Struct. Control Health Monit. 2013, 20, 422–444. [Google Scholar] [CrossRef]
  31. Moharrami, M.; Tootkaboni, M. Reducing response of offshore platforms to wave loads using hydrodynamic buoyant mass dampers. Eng. Struct. 2014, 81, 162–174. [Google Scholar] [CrossRef]
  32. Ghasemi, M.R.; Shabakhty, N.; Enferadi, M.H. Optimized SMA dampers in vibration control of jacket-type offshore structures (regular waves). Int. J. Coast. Offshore Environ. Eng. 2019, 4, 25–35. [Google Scholar] [CrossRef]
  33. Patil, K.; Jangid, R. Passive control of offshore jacket platforms. Ocean. Eng. 2005, 32, 1933–1949. [Google Scholar] [CrossRef]
  34. Dashti, S.; Tarbali, K.; Zhou, C.; Chase, J. Effectiveness of deck-isolation and viscous dampers supplement on enhancing seismic performance of offshore jacket platforms. Ocean. Eng. 2025, 317, 120039. [Google Scholar] [CrossRef]
  35. Kecir, A.; Chatbi, M.; Harrat, Z.R.; Bouiadjra, M.B.; Bouremana, M.; Krour, B. Bending analysis of nano-Fe2O3 reinforced concrete slabs exposed to temperature fields and supported by viscoelastic foundation. Adv. Concr. Constr. 2024, 17, 111–126. [Google Scholar]
  36. Janbazi Rokni, H.; Tabeshpour, M.R. Spectral fatigue analysis of jacket platform under wave load equipped with viscous damper. J. Mar. Sci. Technol. 2019, 24, 855–870. [Google Scholar] [CrossRef]
  37. Emami, M.; Dezvareh, R.; Mousavi, S.A. Contribution of fluid viscous dampers on fatigue life of lattice-type offshore wind turbines. Ocean. Eng. 2022, 245, 110506. [Google Scholar] [CrossRef]
  38. Tabeshpour, M.R.; Rokni, H.J. Frequency domain long-term efficiency of viscous damper in jacket platforms under random wave load. Arab. J. Sci. Eng. 2017, 42, 4523–4534. [Google Scholar] [CrossRef]
  39. API-RP-2A; Planning, Designing, and ConstructingFixed Offshore Platforms-WorkingStress Design. American Petroleum Institute: Washington, DC, USA, 2014.
  40. Lee, U.-J.; Jeong, W.-M.; Cho, H.-Y. Estimation and analysis of JONSWAP spectrum parameter using observed data around Korean Coast. J. Mar. Sci. Eng. 2022, 10, 578. [Google Scholar] [CrossRef]
  41. Goda, Y. Revisiting Wilson’s formulas for simplified wind-wave prediction. Journal of waterway, port, coastal. Ocean. Eng. 2003, 129, 93–95. [Google Scholar]
  42. DNV-GL-ST-0126; Support Structures for Wind Turbines. Det Norske Veritas: Høvik, Norway, 2018.
  43. API-RP-2GEO; Geotechnical and Foundation Design Considerations. American Petroleum Institute: Washington, DC, USA, 2014.
  44. IEC-61400-1; Wind Energy Generation Systems—Part 1: Design requirements. International Electrotechnical Commission: Geneva, Switzerland, 2019.
Figure 1. Schematic diagrams of viscous damper.
Jmse 13 01197 g001
Figure 2. Offshore platform layout.
Jmse 13 01197 g002
Figure 3. Configuration of pile foundation (unit: mm): (a) pile elevation drawing; (b) top view of piles and legs; and (c) pile cross-section.
Jmse 13 01197 g003
Figure 4. FE model of the offshore platform.
Jmse 13 01197 g004
Figure 5. Convergence verification of the finite element model.
Jmse 13 01197 g005
Figure 6. Modal shapes of the offshore platform: (a) modal shape 1; (b) modal shape 2; (c) modal shape 3; (d) modal shape 4; and (e) modal shape 5.
Jmse 13 01197 g006
Figure 7. Wind speed.
Jmse 13 01197 g007
Figure 8. Wave profile.
Jmse 13 01197 g008
Figure 9. (a) py curves at different depths; (b) tz curves at different depths; (c) qz curves at pile tip.
Jmse 13 01197 g009
Figure 10. Location of the offshore platform.
Jmse 13 01197 g010
Figure 11. Time history of ground acceleration for the selected earthquake.
Jmse 13 01197 g011
Figure 12. Viscous damper arrangement scheme.
Jmse 13 01197 g012
Figure 13. Deck displacement without and with different VD schemes under earthquake: (a) time domain; (b) frequency domain.
Jmse 13 01197 g013
Figure 14. Deck velocity without and with different VD schemes under earthquake: (a) time domain; (b) frequency domain.
Jmse 13 01197 g014
Figure 15. Deck acceleration without and with different VD schemes under earthquake: (a) time domain; (b) frequency domain.
Jmse 13 01197 g015
Figure 16. Base shear forces under without and with different VD scheme earthquake: (a) time domain; (b) frequency domain.
Jmse 13 01197 g016
Figure 17. Deck displacement without and with different VD schemes under wind, wave, and earthquake: (a) time domain; (b) frequency domain.
Jmse 13 01197 g017
Figure 18. Deck velocity without and with different VD schemes under wind, wave, and earthquake: (a) time domain; (b) frequency domain.
Jmse 13 01197 g018
Figure 19. Deck acceleration without and with different VD schemes under wind, wave, and earthquake: (a) time domain; (b) frequency domain.
Jmse 13 01197 g019
Figure 20. Base shear forces without and with different VD schemes under wind, wave, and earthquake: (a) time domain; (b) frequency domain.
Jmse 13 01197 g020
Table 1. First three natural frequencies of the offshore platform.
Modal OrderFrequency (Hz)Period (s)
10.1506.667
20.1576.369
30.3273.058
40.5181.931
50.5921.689
Table 2. Coefficients for the coherence model.
k Δ k q k p k r k α k
1 x j x i 10.40.922.9
2 y j y i 10.40.9245
3 z j z i 1.250.50.8513
Table 3. tz curves for clay.
z/Dt/tmax
0.0020.25
0.0130.50
0.0420.75
0.0730.90
0.1001.00
Table 4. tz curves for sand.
z (in)t/tmax
0.0000.00
0.1001.00
1.00
Table 5. q-z curves for clay and sand.
z/DQ/Qp
0.0020.25
0.0130.50
0.0420.75
0.0730.90
0.1001.00
Table 6. py curves for soft clay.
p/puy/yc
00
0.230.1
0.330.3
0.51
0.723
18
1
Table 7. Wave parameters and current velocity for 100-year return period.
Water Level (m) H s (m) T p (s) Current Velocity (m/s)
110.1832.218.91.905
Table 8. Soil property.
No.SoilDepth (m)Effective Weight (kN/m3)Internal Friction Angle (°)Undrained Shear Strength (kPa)
Top (m)Bottom (m)
1Sand010923°-
2Sand1014.29.223.5°-
3Sand14.221.59.526.5°-
4Sand21.533.19.627°-
5Clay33.151.18.8-96
6Sand51.153.19.729°-
7Clay53.165.19-134
8Sand65.167.99.830°-
9Clay67.975.59.2-163
10Clay75.581.99.2-179
11Sand81.982.89.930.5°-
Table 9. Different VD parameters.
VD ParametersDamping Coefficient (N s/m)
Scheme 15.5 × 10⁷
Scheme 25 × 107
Scheme 34.5 × 10⁷
Table 10. Reduction ratios of structural responses for different damper schemes under different loads.
Load ScenarioStructural
Responses
Maximum Value Reduction Ratio (%)
Scheme 1Scheme 2Scheme 3
Earthquake loadsDeck displacement9.955.171.10
Deck velocity22.3316.525.70
Deck acceleration14.0011.006.86
Base shear31.0826.3619.15
Wind, wave, and earthquake loadsDeck displacement15.8715.4314.47
Deck velocity21.4817.559.77
Deck acceleration13.5111.447.72
Base shear34.3130.4022.97
Disclaimer/Publisher’s Note: The statements, opinions and data contained in all publications are solely those of the individual author(s) and contributor(s) and not of MDPI and/or the editor(s). MDPI and/or the editor(s) disclaim responsibility for any injury to people or property resulting from any ideas, methods, instructions or products referred to in the content.

