Article

Assessing Chlorophyll-a Variability and Its Relationship with Decadal Climate Patterns in the Arabian Sea

1
Marine College, Shandong University, Weihai 264209, China
2
Faculty of Marine Sciences, Lasbela University of Agriculture, Water and Marine Sciences, Uthal 90150, Pakistan
3
Ningbo Institute of Digital Twin, Eastern Institute of Technology, Ningbo 315201, China
4
School of Space Science and Technology, Shandong University, Weihai 264209, China
5
Operational Oceanography Institution (OOI), Dalian Ocean University, Dalian 116023, China
6
Dalian Jinshiwan Laboratory, Dalian 116023, China
7
Liaoning Key Laboratory of Marine Real-Time Forecast and Risk Warning, Dalian 116023, China
8
Dalian Technology Innovation Center for Operational Oceanography, Dalian 116023, China
*
Author to whom correspondence should be addressed.
These authors contributed equally to this work.
J. Mar. Sci. Eng. 2025, 13(6), 1170; https://doi.org/10.3390/jmse13061170
Submission received: 19 May 2025 / Revised: 12 June 2025 / Accepted: 12 June 2025 / Published: 14 June 2025
(This article belongs to the Section Physical Oceanography)

Abstract

The Arabian Sea has undergone significant warming since the mid-20th century, highlighting the importance of assessing how decadal climate patterns influence chlorophyll-a (Chl-a) and broader marine ecosystem dynamics. This study investigates the variability of Chl-a, sea surface temperature (SST), and sea level anomaly (SLA) over the past three decades, and their relationships with the Pacific Decadal Oscillation (PDO) and the Atlantic Multidecadal Oscillation (AMO). The mean Chl-a concentration was 1.10 mg/m3, with peak levels exceeding 2 mg/m3 between 2009 and 2013, and the lowest value (0.6 mg/m3) was recorded in 2014. Elevated Chl-a levels were consistently observed in February and March across both coastal and offshore regions. Empirical orthogonal function (EOF) analysis revealed distinct spatial patterns in Chl-a and SST, indicating dynamic regional variability. The SST increased by 0.709 °C over the past four decades, accompanied by a steady rise in the SLA of approximately 1 cm. The monthly mean Chl-a exhibited a strong inverse relationship with both the SST and SLA and a positive correlation with SST gradients (R2 > 0.5). A positive correlation (R2 > 0.5) was found between the PDO and Chl-a, whereas the PDO was negatively correlated with the SST and SLA. In contrast, the AMO was negatively correlated with Chl-a but positively associated with warming and SLA rise. These findings underline the contrasting roles of the PDO and AMO in modulating productivity and ocean dynamics in the Arabian Sea. This study emphasizes the need for continued monitoring to improve predictions of ecosystem responses under future climate change scenarios.

1. Introduction

The ocean plays a pivotal role in maintaining Earth’s ecological balance, providing essential benefits to both human societies and marine life. Monitoring the marine environment is therefore critical due to its profound influence on global ecosystems. In recent years, there has been growing interest in understanding the complex interactions between oceanic ecosystems and global climate change [1,2]. Phytoplankton, as primary producers, form the foundation of the marine food web by driving biogeochemical cycles and supporting higher trophic levels, including fish production. Their biomass is commonly estimated using chlorophyll-a (Chl-a) as a proxy [3,4,5]. Variations in plankton biomass can significantly impact marine biodiversity and human livelihoods [6,7]. For instance, the abundance of large pelagic fish such as tuna is directly linked to the availability of phytoplankton [8]. Overfishing, combined with reduction in plankton biomass, has been identified as a key factor contributing to the decline of tuna stocks in the Indian Ocean [9,10,11]. Additionally, phytoplankton play a vital role in sequestering atmospheric carbon dioxide (CO2), thereby contributing to climate change mitigation [12]. However, rising ocean temperatures driven by climate change have been associated with significant declines in oceanic Chl-a [13,14]. Chl-a is widely recognized as a key indicator of phytoplankton biomass and is sensitive to a range of environmental factors such as temperature, nutrient availability, sunlight, grazing pressure, and species composition [15,16,17,18,19]. Therefore, analyzing Chl-a distribution is essential for assessing the health and productivity of marine ecosystems, particularly in the context of climate variability and increasing anthropogenic pressures.
In the context of global warming, atmospheric circulation patterns can undergo rapid and significant changes. To better understand climate variability beyond short-term fluctuations, it is essential to examine interdecadal timescales [20]. Sea surface temperature (SST) analysis remains a fundamental tool for investigating such long-term oceanic variations. Among the most studied interdecadal climate signals are the Atlantic Multidecadal Oscillation (AMO) and the Pacific Decadal Oscillation (PDO) [21,22]. Both of these exert considerable influence on regional and global climate systems. Research suggests that elevated salinity in the north Atlantic enhances surface water sinking, facilitating the transport of heat to deeper ocean layers [23]. Moreover, the acceleration of the Atlantic current around 1999 contributed to increased heat storage in the deep ocean, which in turn played a role in the temporary slowdown of global warming between 2003 and 2012. Recent studies have highlighted a stronger association between the PDO and periods of global warming hiatus compared with the AMO [24,25]. The transition between the positive and negative phases of the PDO have been associated with the rapid global warming observed after 2016. The PDO also plays a significant role in shaping the spatial circulation of Chl-a concentrations across the Pacific Ocean, influencing zonal and basin-wide climate variability [26]. Meanwhile, the AMO has been found to affect a broad range of climate phenomena, including the East Asian summer monsoon, temperature variability, precipitation patterns, and the frequency and intensity of Atlantic hurricanes. Furthermore, the AMO modulates the strength of the El Nino–Southern Oscillation (ENSO) and impacts rainfall distribution in various regions [27,28,29]. For instance, contrasting phases of the AMO have been associated with substantial differences in winter temperatures across Europe [30].
Advances in satellite remote sensing, coupled with improvements in algorithms for measuring Chl-a, have greatly improved our understanding of Chl-a distribution and dynamics [31,32]. The empirical orthogonal function (EOF) method is a widely used tool for analyzing spatial and temporal changes in Chl-a concentrations [33]. This approach has been employed in numerous studies to investigate variations in both Chl-a and SST across diverse oceanic regions [34,35]. Chl-a variability has been widely studied in coastal waters, estuaries, boundary currents, and upwelling zones [36,37,38,39]. Fluctuations in Chl-a have been studied at various temporal scales, including daily, seasonal, and annual patterns [40,41,42]. Long-term analyses of Chl-a are particularly important for understanding the impacts of climate change and human activities on ocean ecosystems. These studies reveal links between phytoplankton productivity and broader biogeochemical processes. The accelerating pace of global warming underscores the necessity of studying oceanic variability over extended timescales to better understand its ecological impacts [20].
The Indian Ocean, which is recognized as one of the most biologically productive regions on Earth, has experienced significant warming in recent decades [43]. Within its northern sector, the Arabian Sea plays a pivotal role in modulating the summer monsoon through complex air–sea interactions [44]. This region exhibits pronounced seasonal and interannual variations in both its physical and biogeochemical properties [45]. The Arabian Sea marine ecosystem is profoundly affected by global climate changes and is characterized by limited ecological resilience [46,47]. Known for its exceptional biological productivity [48], its surface dynamics are governed by the monsoon-driven annual cycle of air–sea forcing and heat fluxes. Open ocean currents are predominantly influenced by the Ekman drift, while thermal patterns are modulated by local heat fluxes [49]. The region’s circulation is further complicated by the presence of numerous eddies and mesoscale features [50]. During the southwest monsoon, intense winds drive ocean currents along the western boundary, facilitating cross-hemispheric water transport and triggering dynamic processes such as the Somali upwelling, which profoundly influences the ocean dynamics, thermohaline structure, and SST in the Arabian Sea [51]. The region also displays diverse patterns of SST, Chl-a, and salinity, driven in part by freshwater inflows [5]. Coastal ecosystems, including mangroves, estuaries, lagoons, and rocky and sandy shores, add to the region’s ecological complexity [5,52]. Variations in the Chl-a concentration serve as key indicators of primary productivity, which is vital to the marine food web and supports essential fishery resources [3,4,5].
Despite extensive research on seasonal and event-specific variations in oceanographic parameters within the Arabian Sea, studies on decadal-scale oceanic and climatological variability remain limited [11,51]. In recent decades, the frequency and intensity of extreme climate events, such as cyclones and typhoons, have increased, potentially altering oceanic properties, including the Chl-a distribution [53]. Therefore, this study aims to investigate the decadal variability of key oceanic parameters, including Chl-a, SST, SST gradient magnitude (GM), and sea level anomaly (SLA), while assessing their relationships with the PDO and AMO indices. To achieve this, the empirical orthogonal function (EOF) analysis is applied to regionally tuned, reconstructed Chl-a datasets, with four principal component modes used to explore spatial and temporal variability. This comprehensive analysis seeks to elucidate the combined effects of environmental changes, climate variability, and anthropogenic activities on the Arabian Sea’s vital marine ecosystem. By integrating satellite remote sensing, EOF analysis, and climate oscillation indices, this study provides valuable insights into the dynamic interactions shaping the Arabian Sea and highlights implications for the sustainable management of its marine resources.

2. Materials and Methods

2.1. Study Area

The Arabian Sea, positioned between the Indian subcontinent and the Arabian Peninsula, is a key part of the northern Indian Ocean (Figure 1). The semi-enclosed basin exhibits complex oceanographic features driven by strong monsoonal winds and regional circulation and is rich in marine biodiversity. The Arabian Sea, particularly the Indus River Delta region, receives substantial freshwater inflow, which enhances nutrient availability and supports high productivity. The continental shelf along the Indus Delta is relatively broad, and the Balochistan coast features a narrow and steep continental shelf (Figure 1). This region remains a critical zone for investigating climate variability and marine ecosystem processes.

2.2. Remote Sensing Observation Data

The monthly climatological satellite data of the SST with a resolution of 0.05° × 0.05° during 1982–2022, Chl-a with 4 × 4 km (1998–2022), and the monthly SLA from Global Ocean Gridded L4 products with a spatial resolution of 0.25° × 0.25° (1993–2021), were derived from the Copernicus Marine and Environment Monitoring Service (CMEMS) [54], https://data.marine.copernicus.eu/product/SST_GLO_SST_L4_REP_OBSERVATIONS_010_011/description; https://data.marine.copernicus.eu/products (accessed on 4 November 2024); https://data.marine.copernicus.eu/product/SEALEVEL_GLO_PHY_L4_MY_008_047/description) (accessed on 4 November 2024).
Spatial and temporal trends for the SST and Chl-a were analyzed using EOF’s four modes, applying methodology by Emery and Thomson [55] and Beckers and Rixen [56]. EOF analysis is a widely applied statistical technique used to uncover dominant modes of variability from spatially distributed time-series data. Researchers frequently use EOF analysis to investigate spatial patterns, seasonal cycles, and long-term changes in various oceanographic variables. The SST gradient magnitude (SST GM) was calculated using the method proposed by Belkin and O’Reilly [57]:
G M = G x 2 + G y 2
where Gx and Gy are calculated as
G x = 1 0 + 1 2 0 + 2 1 0 + 1 x 1 4   T  
G y = + 1 + 2 + 1 0 0 0 1 2 1 x 1 4   T
G x and G y represent the SST GM in the zonal meridional directions and T defines temperature. Thermal fronts were identified using a threshold of SST gradient (°C/km) greater than 0.05 °C/km [58,59].

2.3. PDO and AMO

The monthly PDO index data during 1982–2022 were obtained from the NOAA global climate monitoring services (https://www.ncei.noaa.gov/access/monitoring/pdo/ (accessed on 4 November 2024)) [60], and the PDO’s influences on the Arabian Sea’s SST, Chl-a, and SLA were analyzed. The AMO index data from 1982–2022 were obtained from the climate time series from the Physical Science Laboratory (PSL): (https://psl.noaa.gov/data/correlation/amon.us.long.data (accessed on 4 November 2024)). The relationship between the PDO and AMO with oceanic parameters (Chl-a, SST and SLA) were examined through spatial Pearson correlation analysis. Gridded datasets were used to calculate the correlation coefficients at each spatial grid point across the Arabian Sea, allowing for the identification of regional patterns and potential influences of these climate indices.

3. Results

3.1. Decadal Variations in SST and SST GM

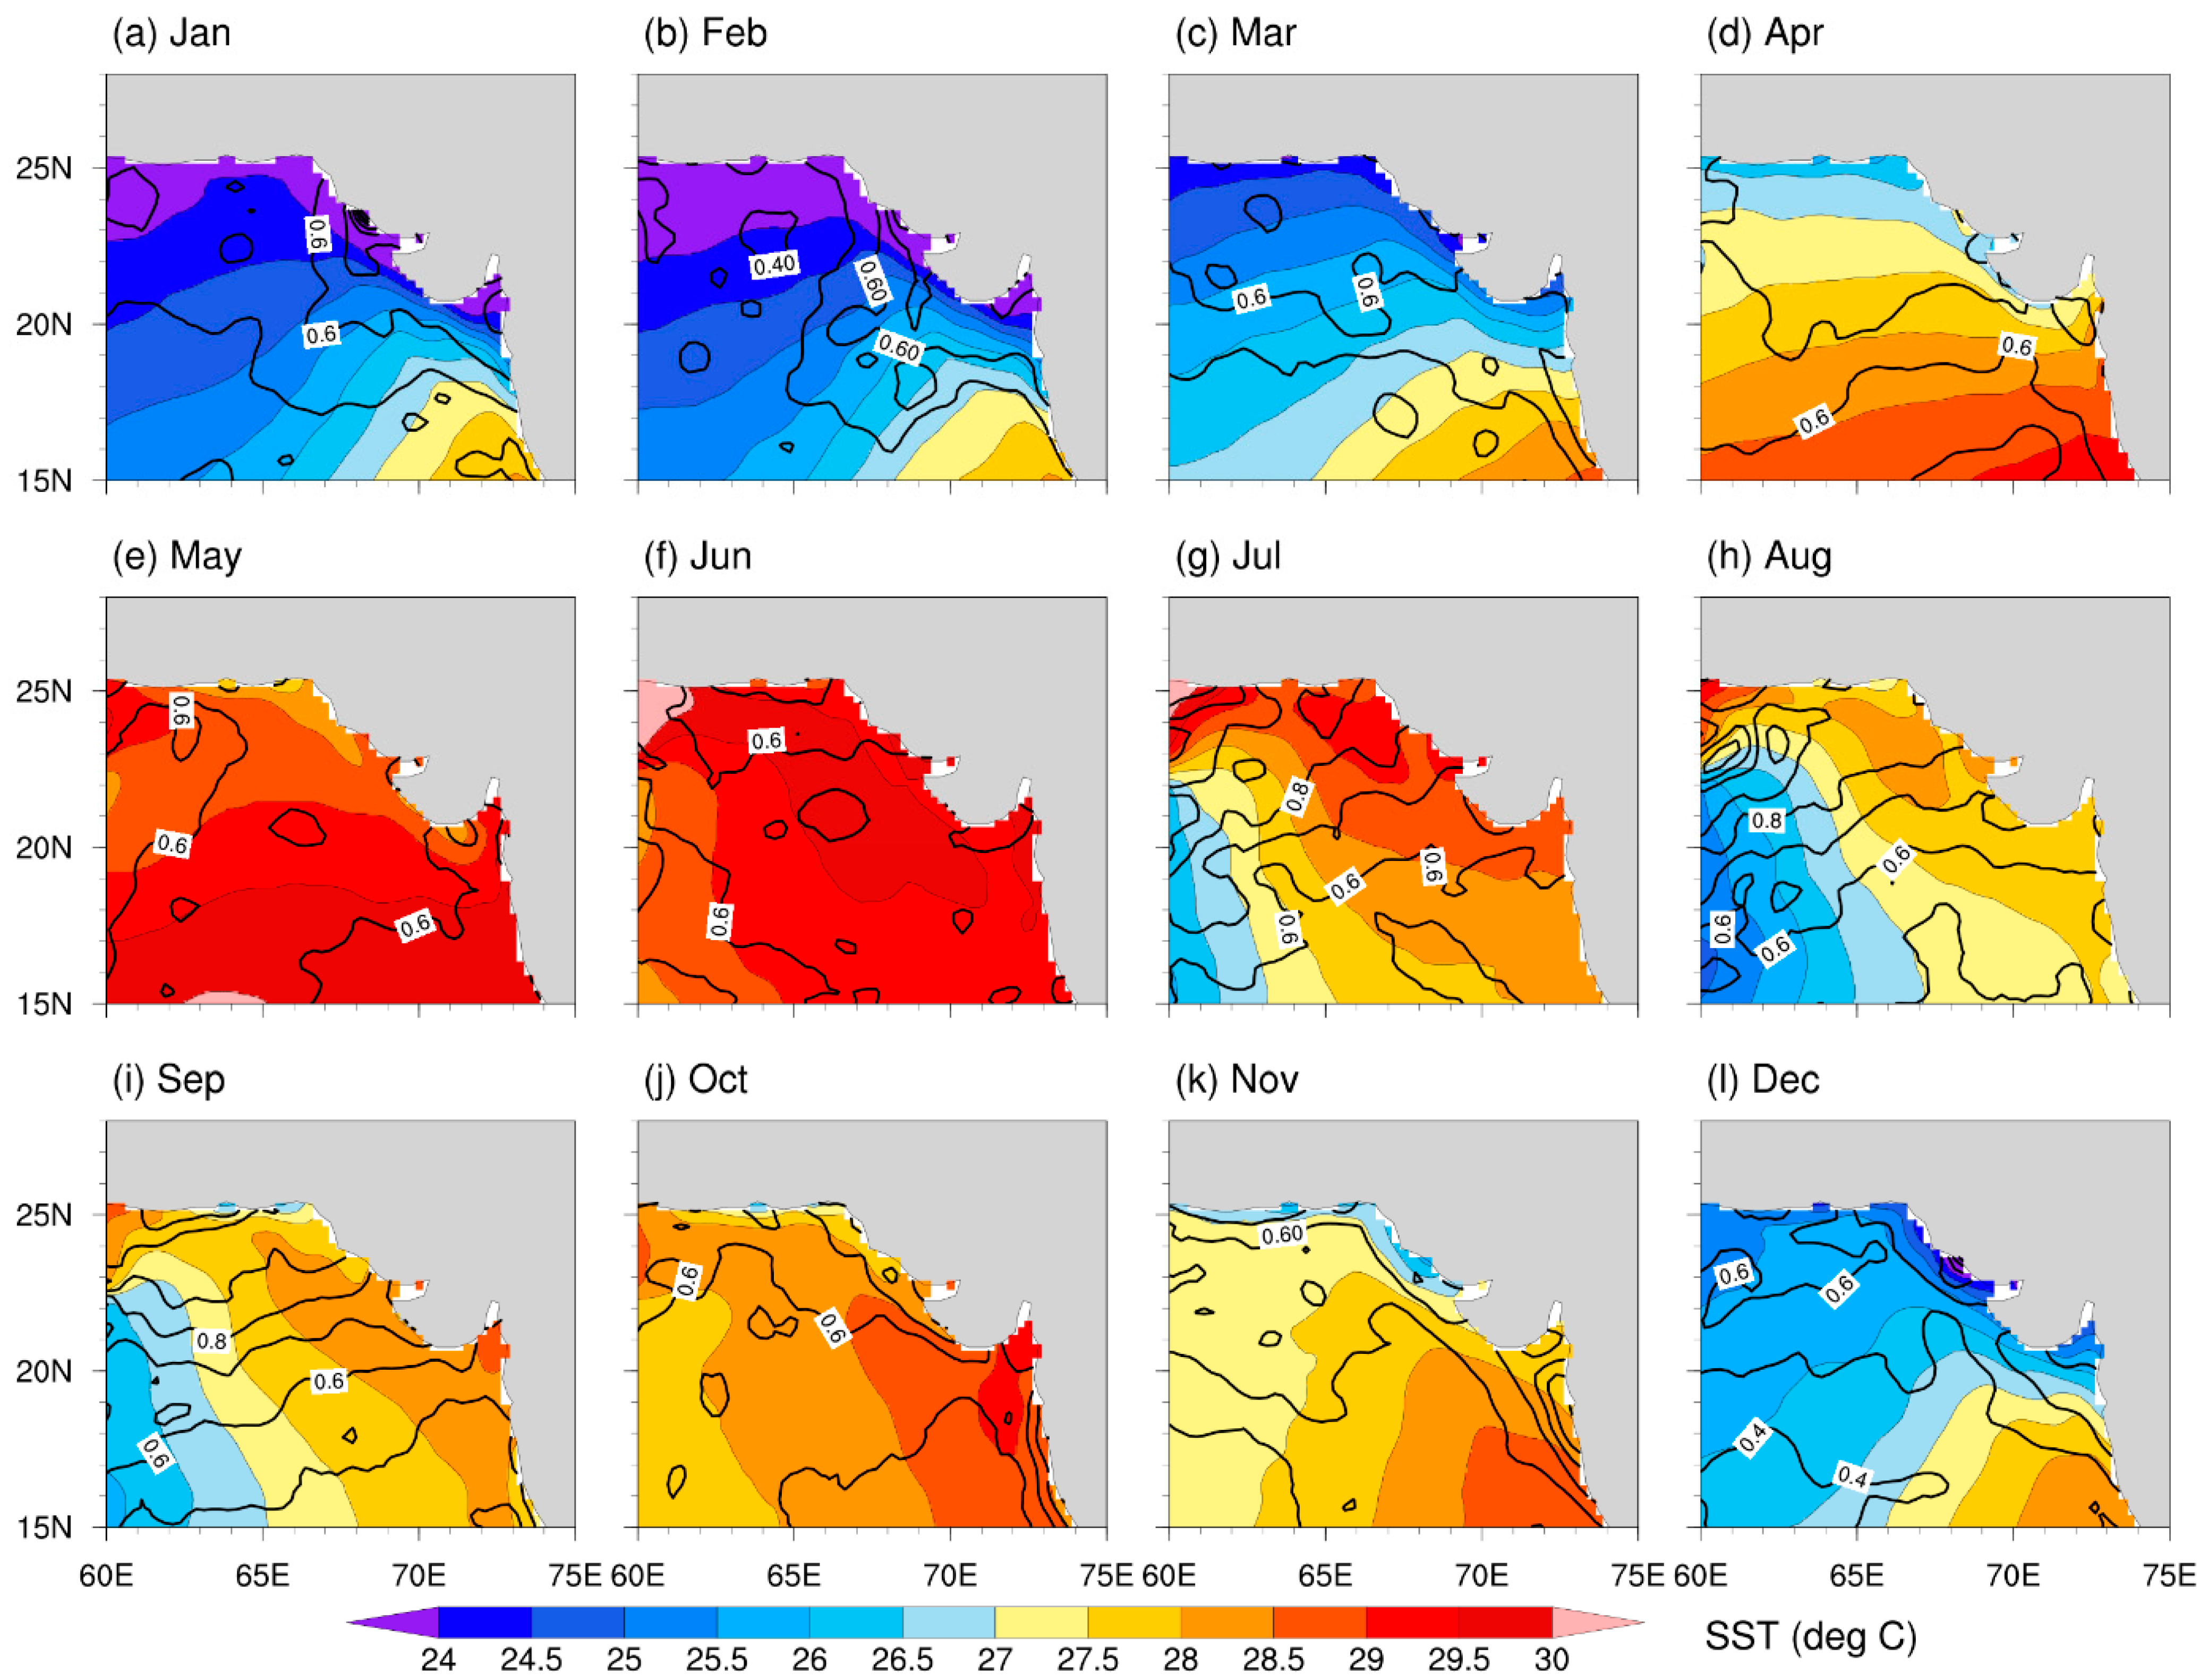
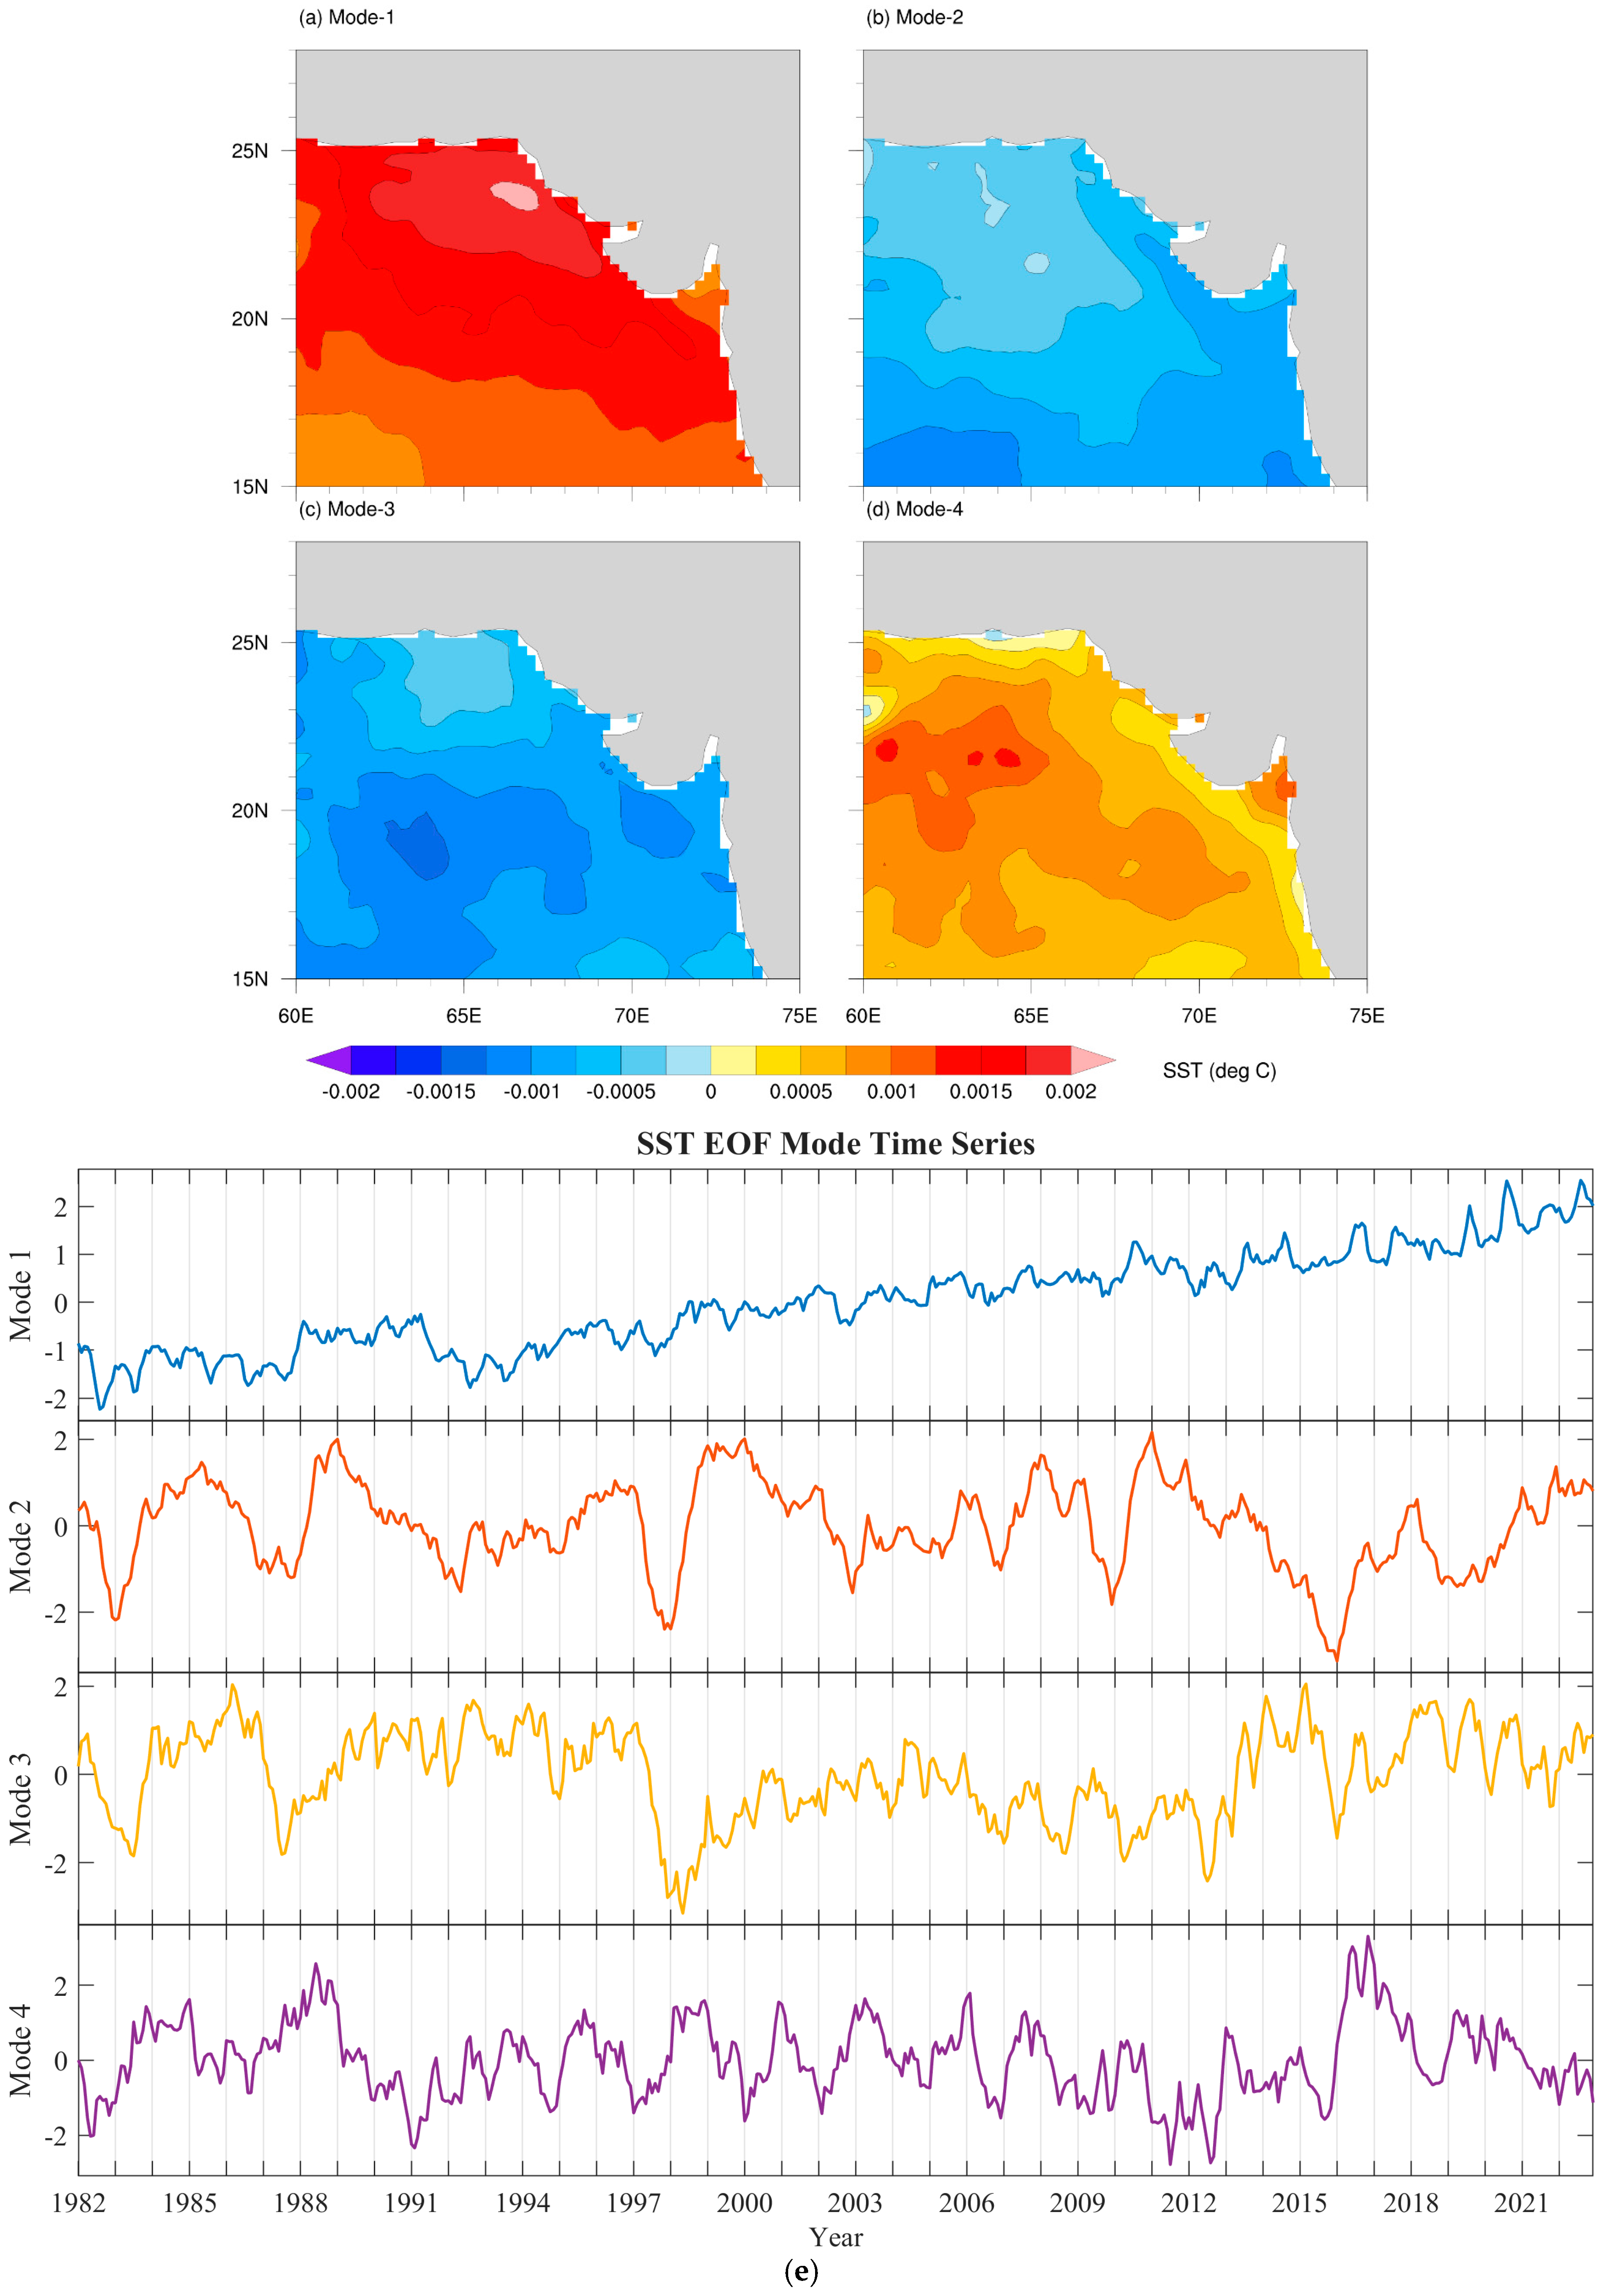
Over the past four decades, the Arabian Sea has shown a significant warming trend, with the SST increasing by 0.71 °C overall. The lowest annual SST was observed in 1984 (26.62 °C) and the highest in 2010 (27.96 °C), with a long-term mean of 27.32 °C (±0.346 °C). The warming rate accelerated from 0.14 °C from 1982–2001 to 0.19 °C during 2002–2022. Spatially, the monthly mean SST exceeded 28 °C between April and July, particularly along the eastern Arabian Sea, while cooler conditions (<27 °C) dominated from November to March. Notably, the coldest winter region overlaps with the warmest summer zone, reflecting strong seasonal contrast (Figure 2). The SST GM peaked along Pakistan’s coast, which is linked to the Indus River’s freshwater (24.0° N, 67.5° E) discharge and upwelling off Balochistan (24.8° N, 61–65.5° E), with the strongest gradients from September to February, reaching >0.1 °C/km, and decreasing from March to August, remaining confined to coastal areas (Supplementary Figure S1). EOF analysis revealed four dominant SST modes (Figure 3). Mode 1 showed a uniform warming pattern across the basin, representing a dominant positive anomaly relative to the long-term mean (Figure 2a). The corresponding time series (Figure 3b) exhibited a steady and persistent increase in the SST, indicating basin-wide warming over the study period. Modes 2 and 3 displayed negative SST anomalies defined as deviations below the climatological average in both coastal and offshore areas, though recent years indicate a shift toward warming (Figure 3b,c). Their time series revealed mostly negative values, with notable interannual fluctuations and a slight warming trend in recent years, suggesting possible shifts in regional thermal gradients. Mode 4 displayed moderate warming centered offshore (Figure 3d), with the time series showing alternating positive and negative phases but overall, a gradual warming trend. These temporal patterns highlight dominant long-term warming signals modulated by intermittent cooling phases and regional variability across the Arabian Sea (Figure 3e). Mode 1 exhibited the consistent increase in the EOF SST in the Arabian Sea (Figure 3e).

3.2. Decadal Climatological Variations of Chl-a

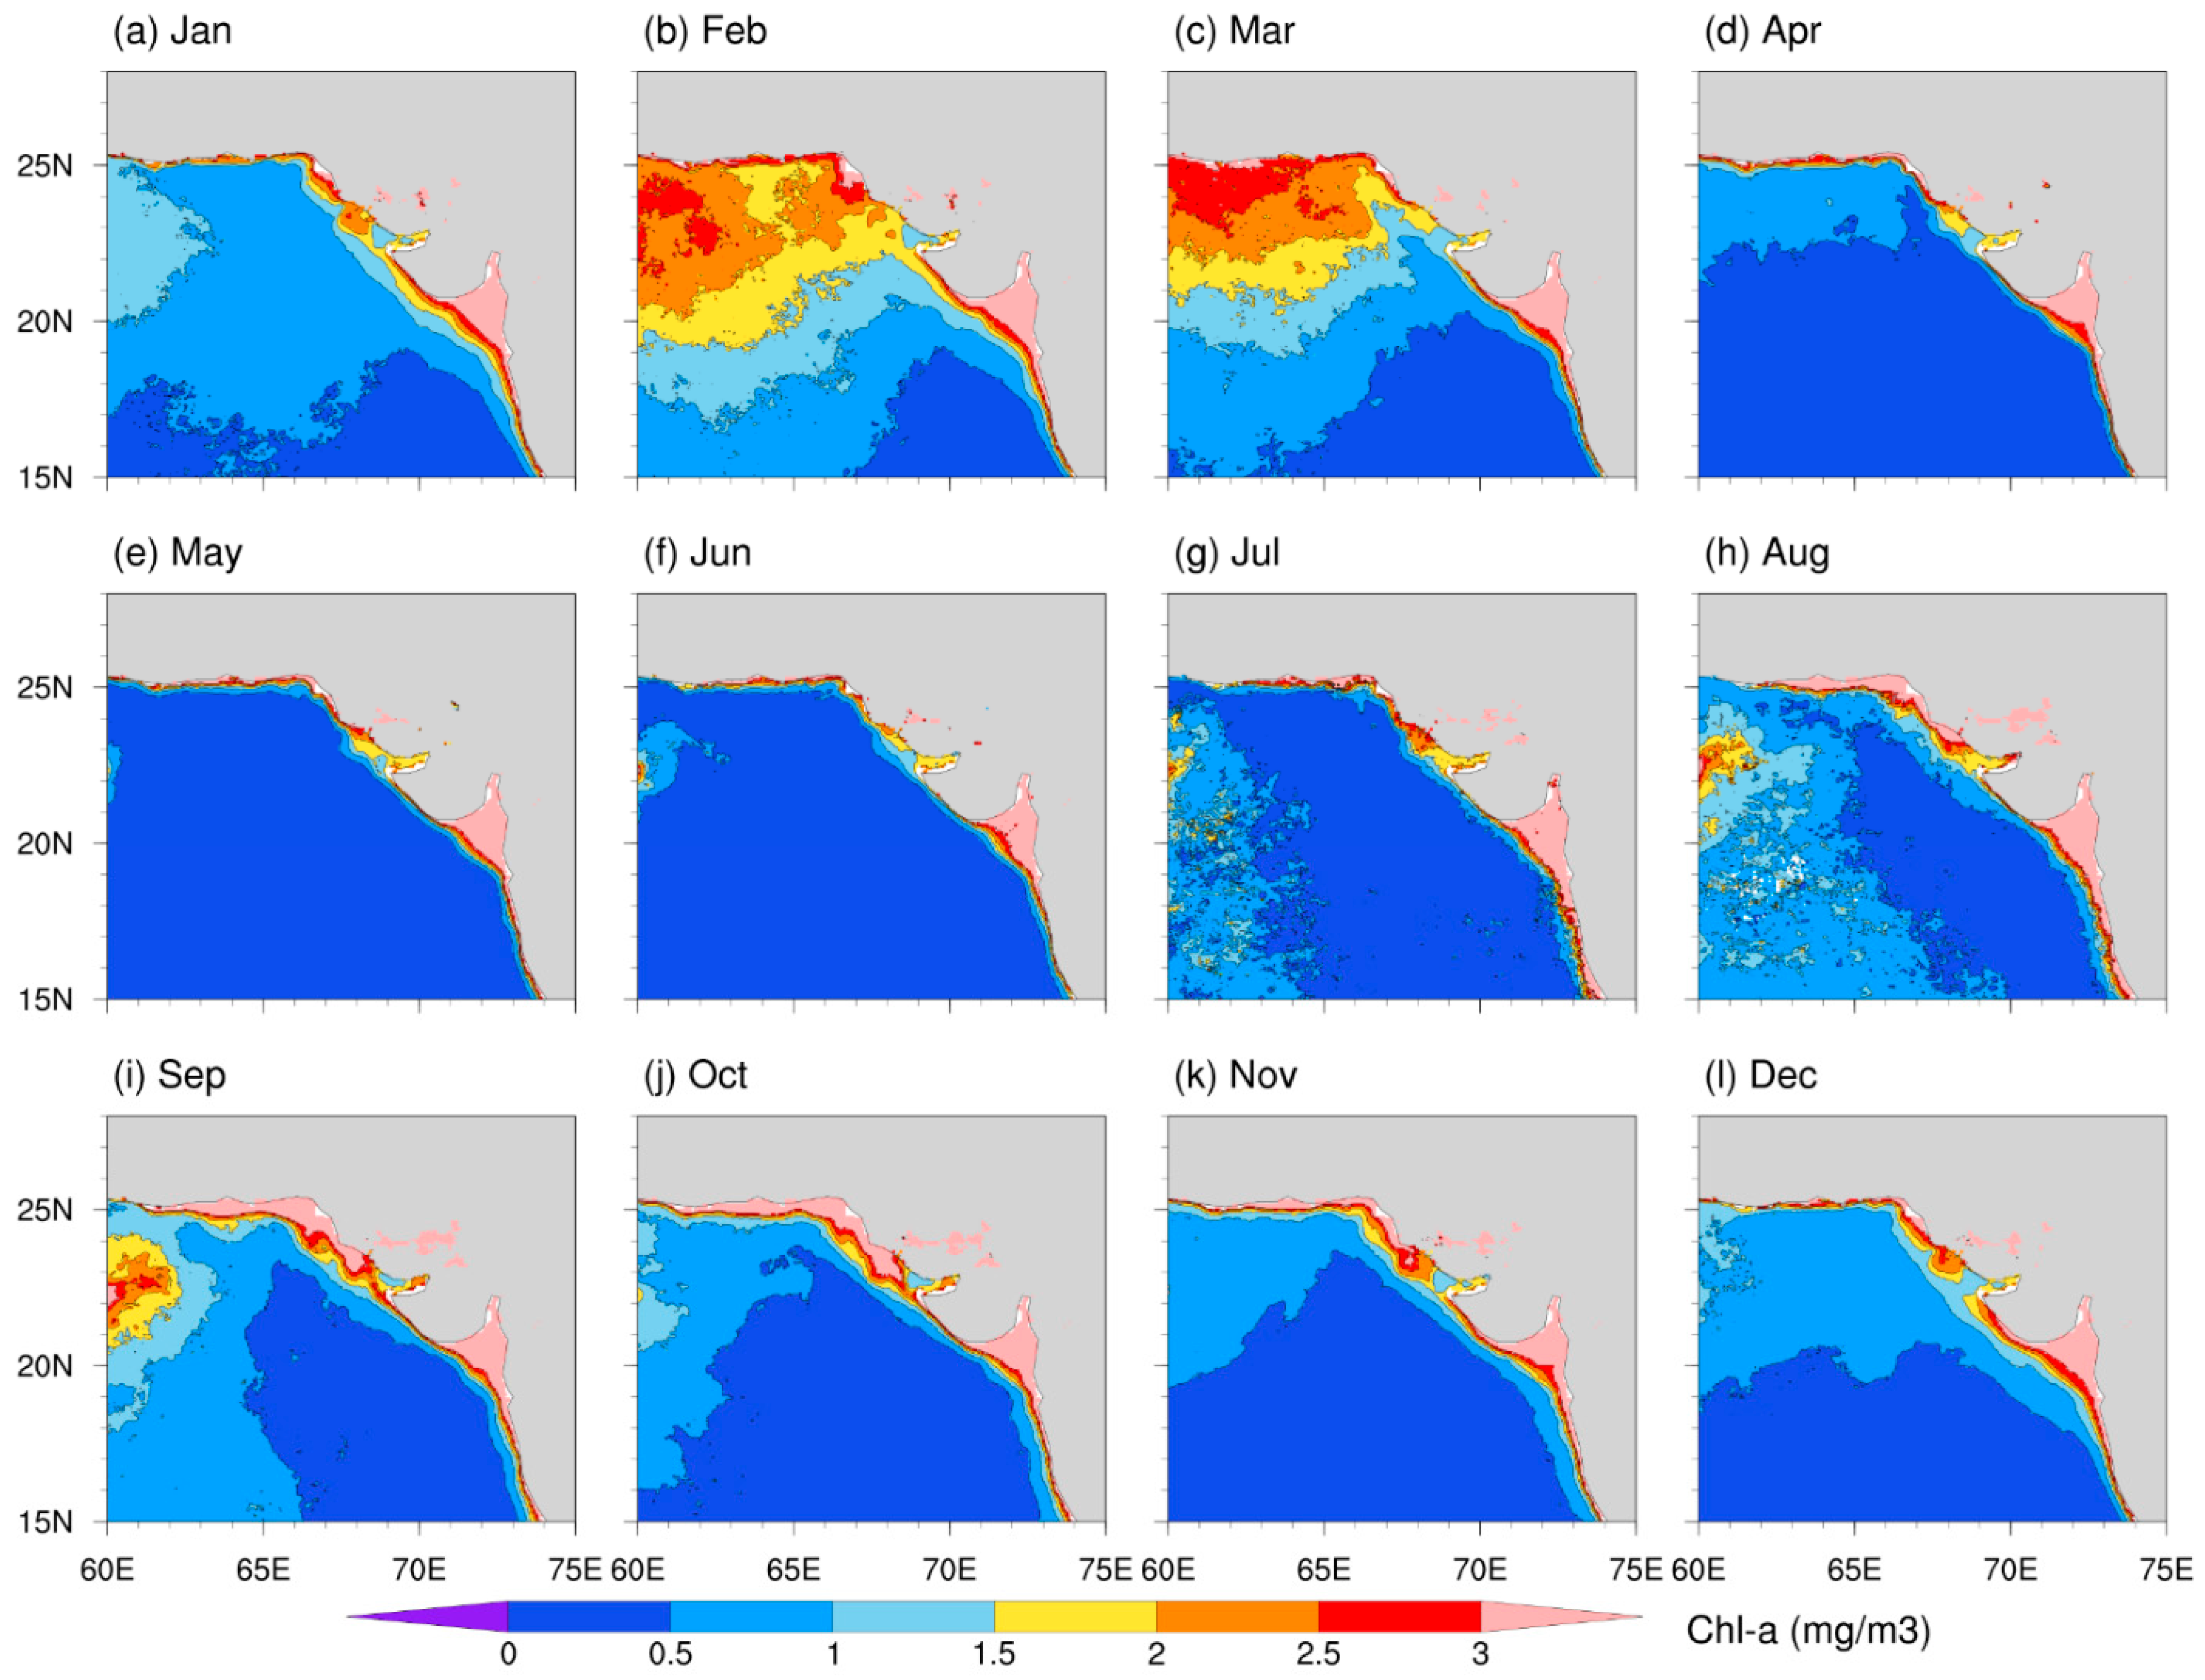
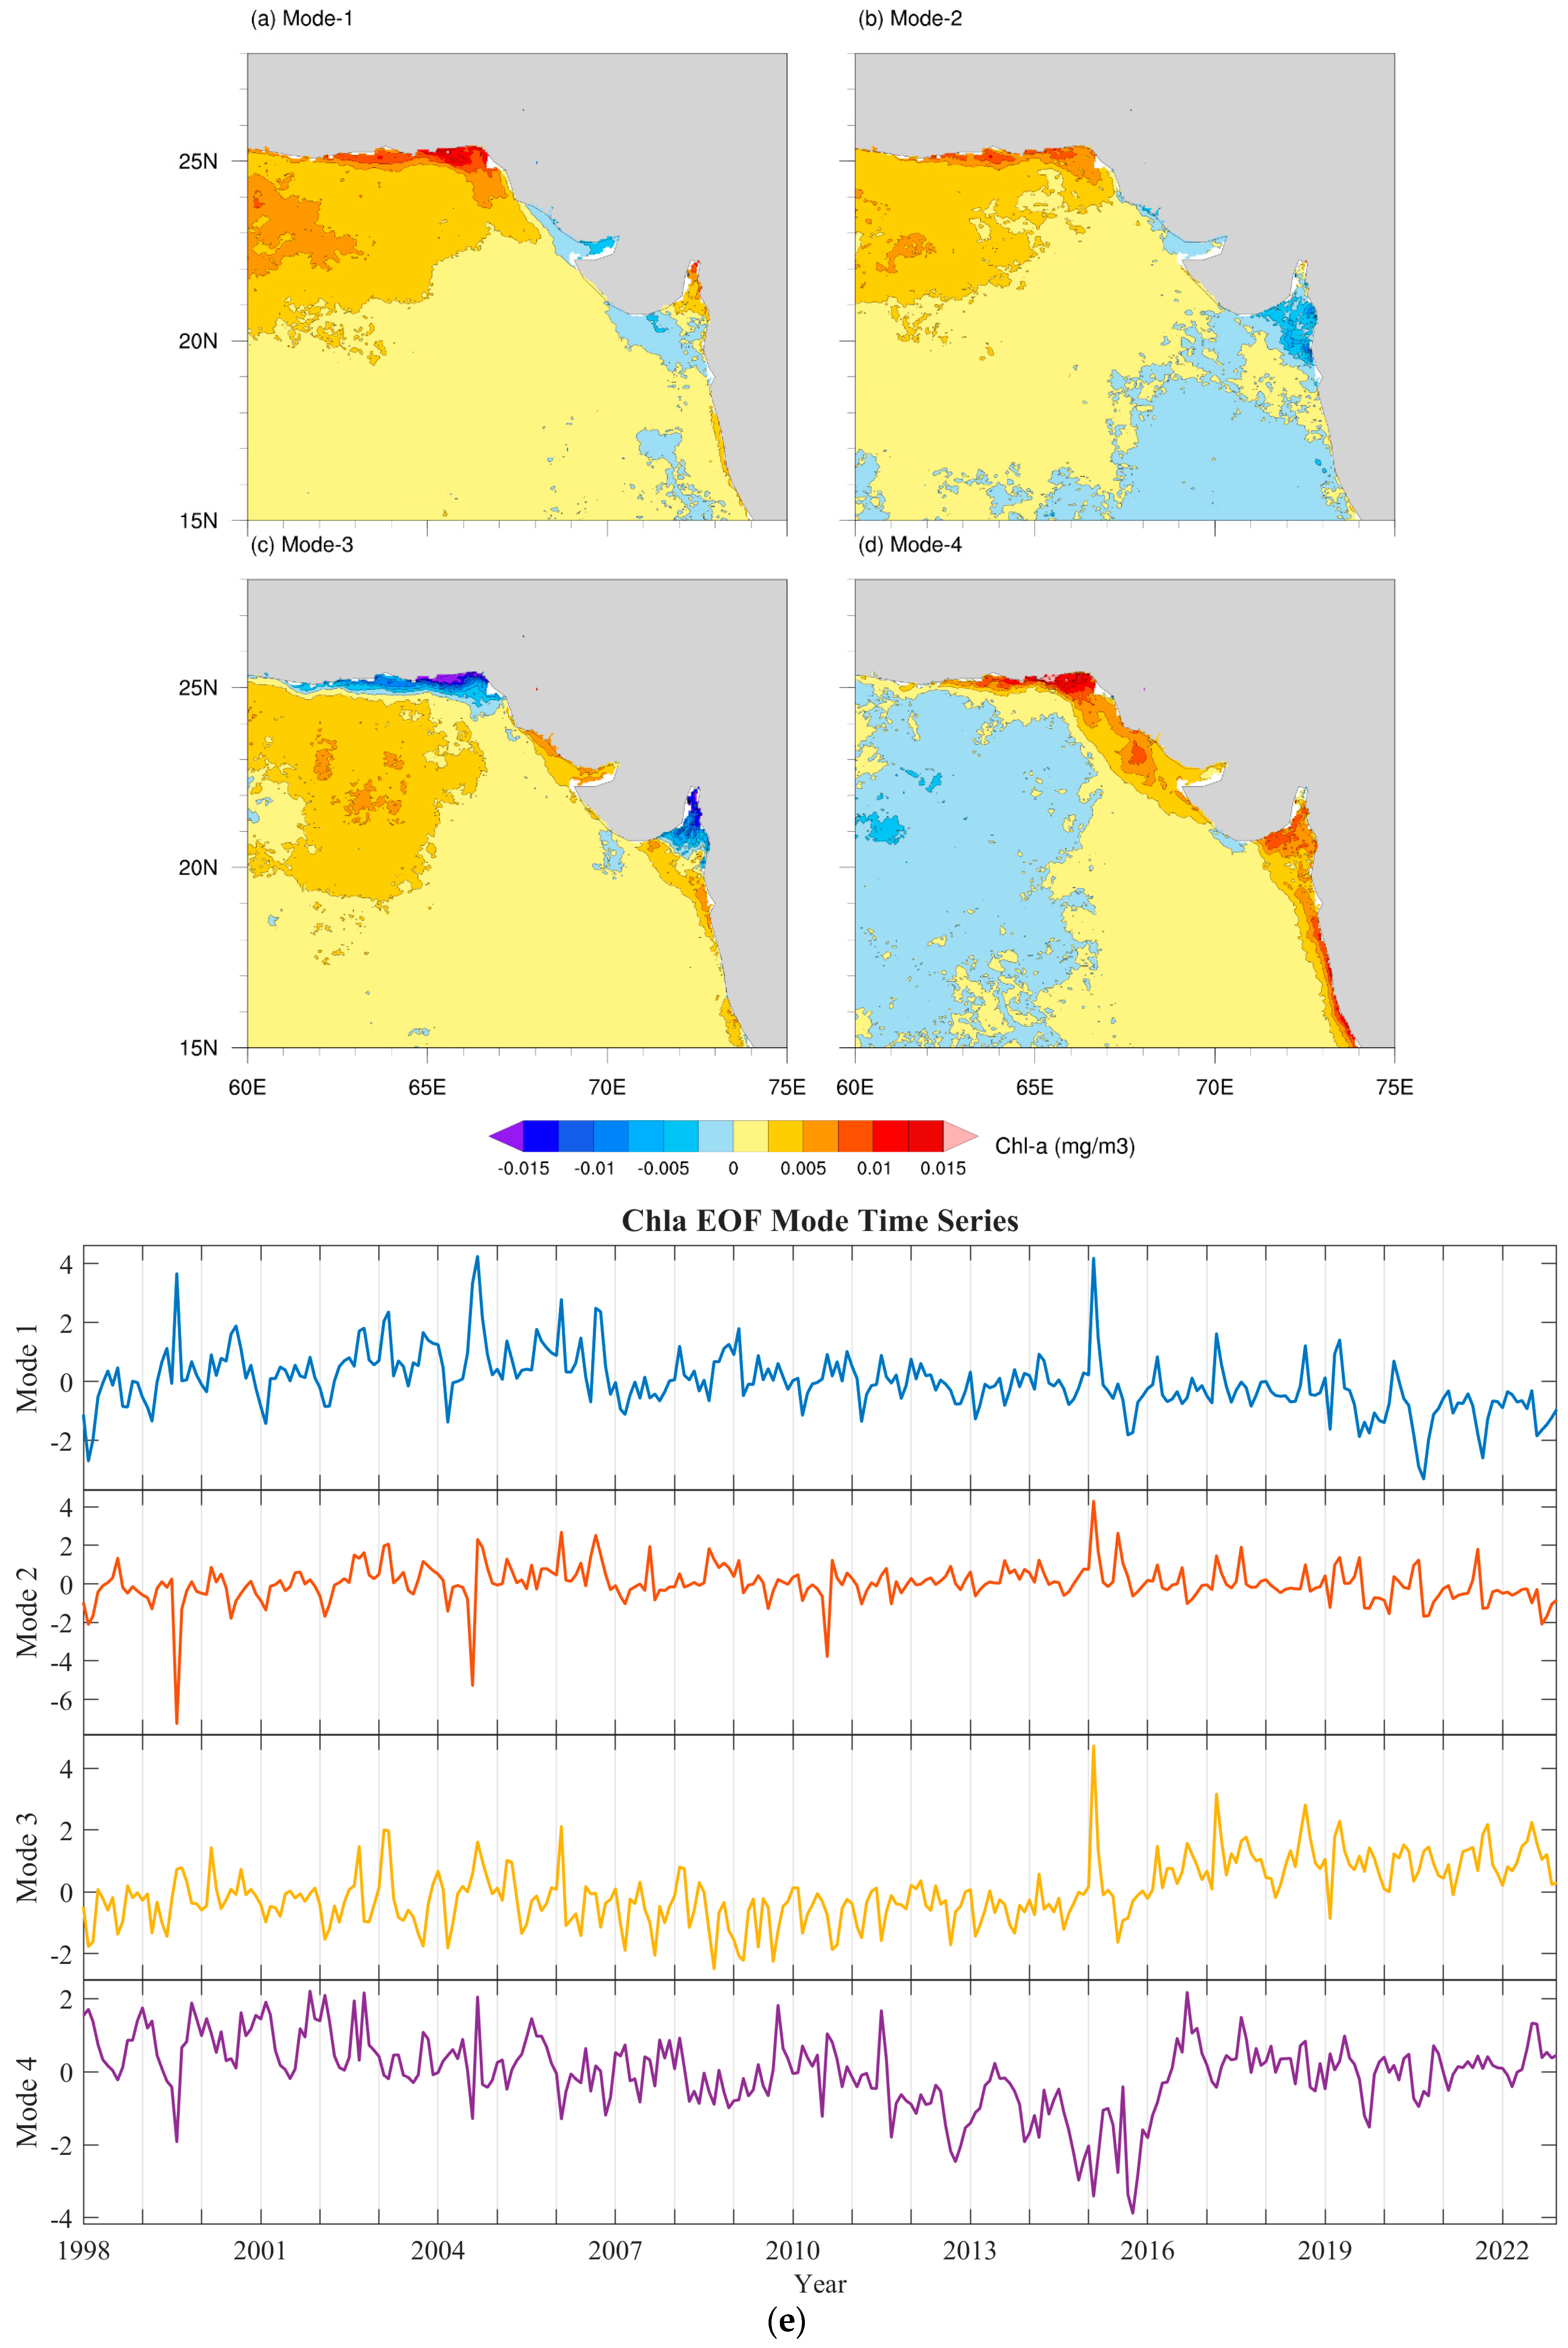
During the study period, the highest annual average Chl-a concentrations (>2 mg/m3) were recorded in 2009 and 2013, while the lowest value (0.6 mg/m3) occurred in 2014. The overall mean Chl-a across three decades was 1.10 ± 0.40 mg/m3. Comparatively lower levels (<0.8 mg/m3) were observed during the last decade. The monthly climatology (1998–2022) showed peak Chl-a concentrations (>2.5 mg/m3) during February and March across both the coastal and offshore regions (Figure 4b,c). From April to January, high concentrations were largely confined to coastal areas, with offshore waters showing much lower levels (Figure 4). EOF analysis identified four modes of Chl-a variability in the Arabian Sea (Figure 5). Modes 1 and 2 exhibited broadly similar spatial patterns, with positive anomalies defined as elevated Chl-a concentrations above the climatological mean across the region. Mode 1 explained 45.12% and Mode 2 explained 27.38% of the total variance (Figure 5a,b). The time series of Mode 2 showed moderate fluctuations, with occasional negative values during January and February and August and September, which are likely linked to seasonal biological activity (Figure 5e). Mode 3, accounting for 16.22% of the variance, showed positive offshore anomalies and negative coastal anomalies (Figure 5c), with a noticeable increasing trend in recent years (Figure 3a), possibly indicating changing nutrient dynamics. Mode 4 explained 11.28% of the variance, revealing strong positive anomalies along the coast and negative values offshore (Figure 5d). This pattern reflects the impacts of coastal processes, including freshwater input from the Indus River and upwelling along the Balochistan coast. The river supplies nutrient-rich water that enhances productivity, while coastal upwelling brings deeper, nutrient-laden waters to the surface, supporting elevated Chl-a concentrations in nearshore regions and reflecting the influence of these coastal processes (Figure 5d). Mode 4’s time series showed alternating positive and negative phases, reflecting episodic variability (Figure 5e). These temporal patterns emphasize the complex dynamics of Chl-a, driven by regional environmental processes, monsoonal forcing, and interannual variability.

3.3. Decadal Variability of the SLA

A consistent increasing trend in the annual mean SLA was observed from 1993 to 2021 across the Arabian Sea. The decadal average SLA over this period was 0.41 ± 0.334 cm. Decadal analysis showed an increase of 0.06 cm from 1993–2002, 0.34 cm from 2003–2012, and 0.65 cm from 2013 to 2021. Overall, the SLA rose by more than 1.02 cm during the entire study period (Supplementary Figure S2). The lowest SLAs were recorded in 1999 and 2001, while the highest occurred in 2021. The monthly mean climatology reveals seasonal variability, with the SLA exceeding 1 cm in November, starting near the coast and expanding offshore, peaking between April and June. A decline in the SLA is evident from July to October, beginning in the coastal areas and extending offshore. Standard deviation contours further highlight the variability pattern throughout the year (Supplementary Figure S2).

3.4. PDO and AMO Indices

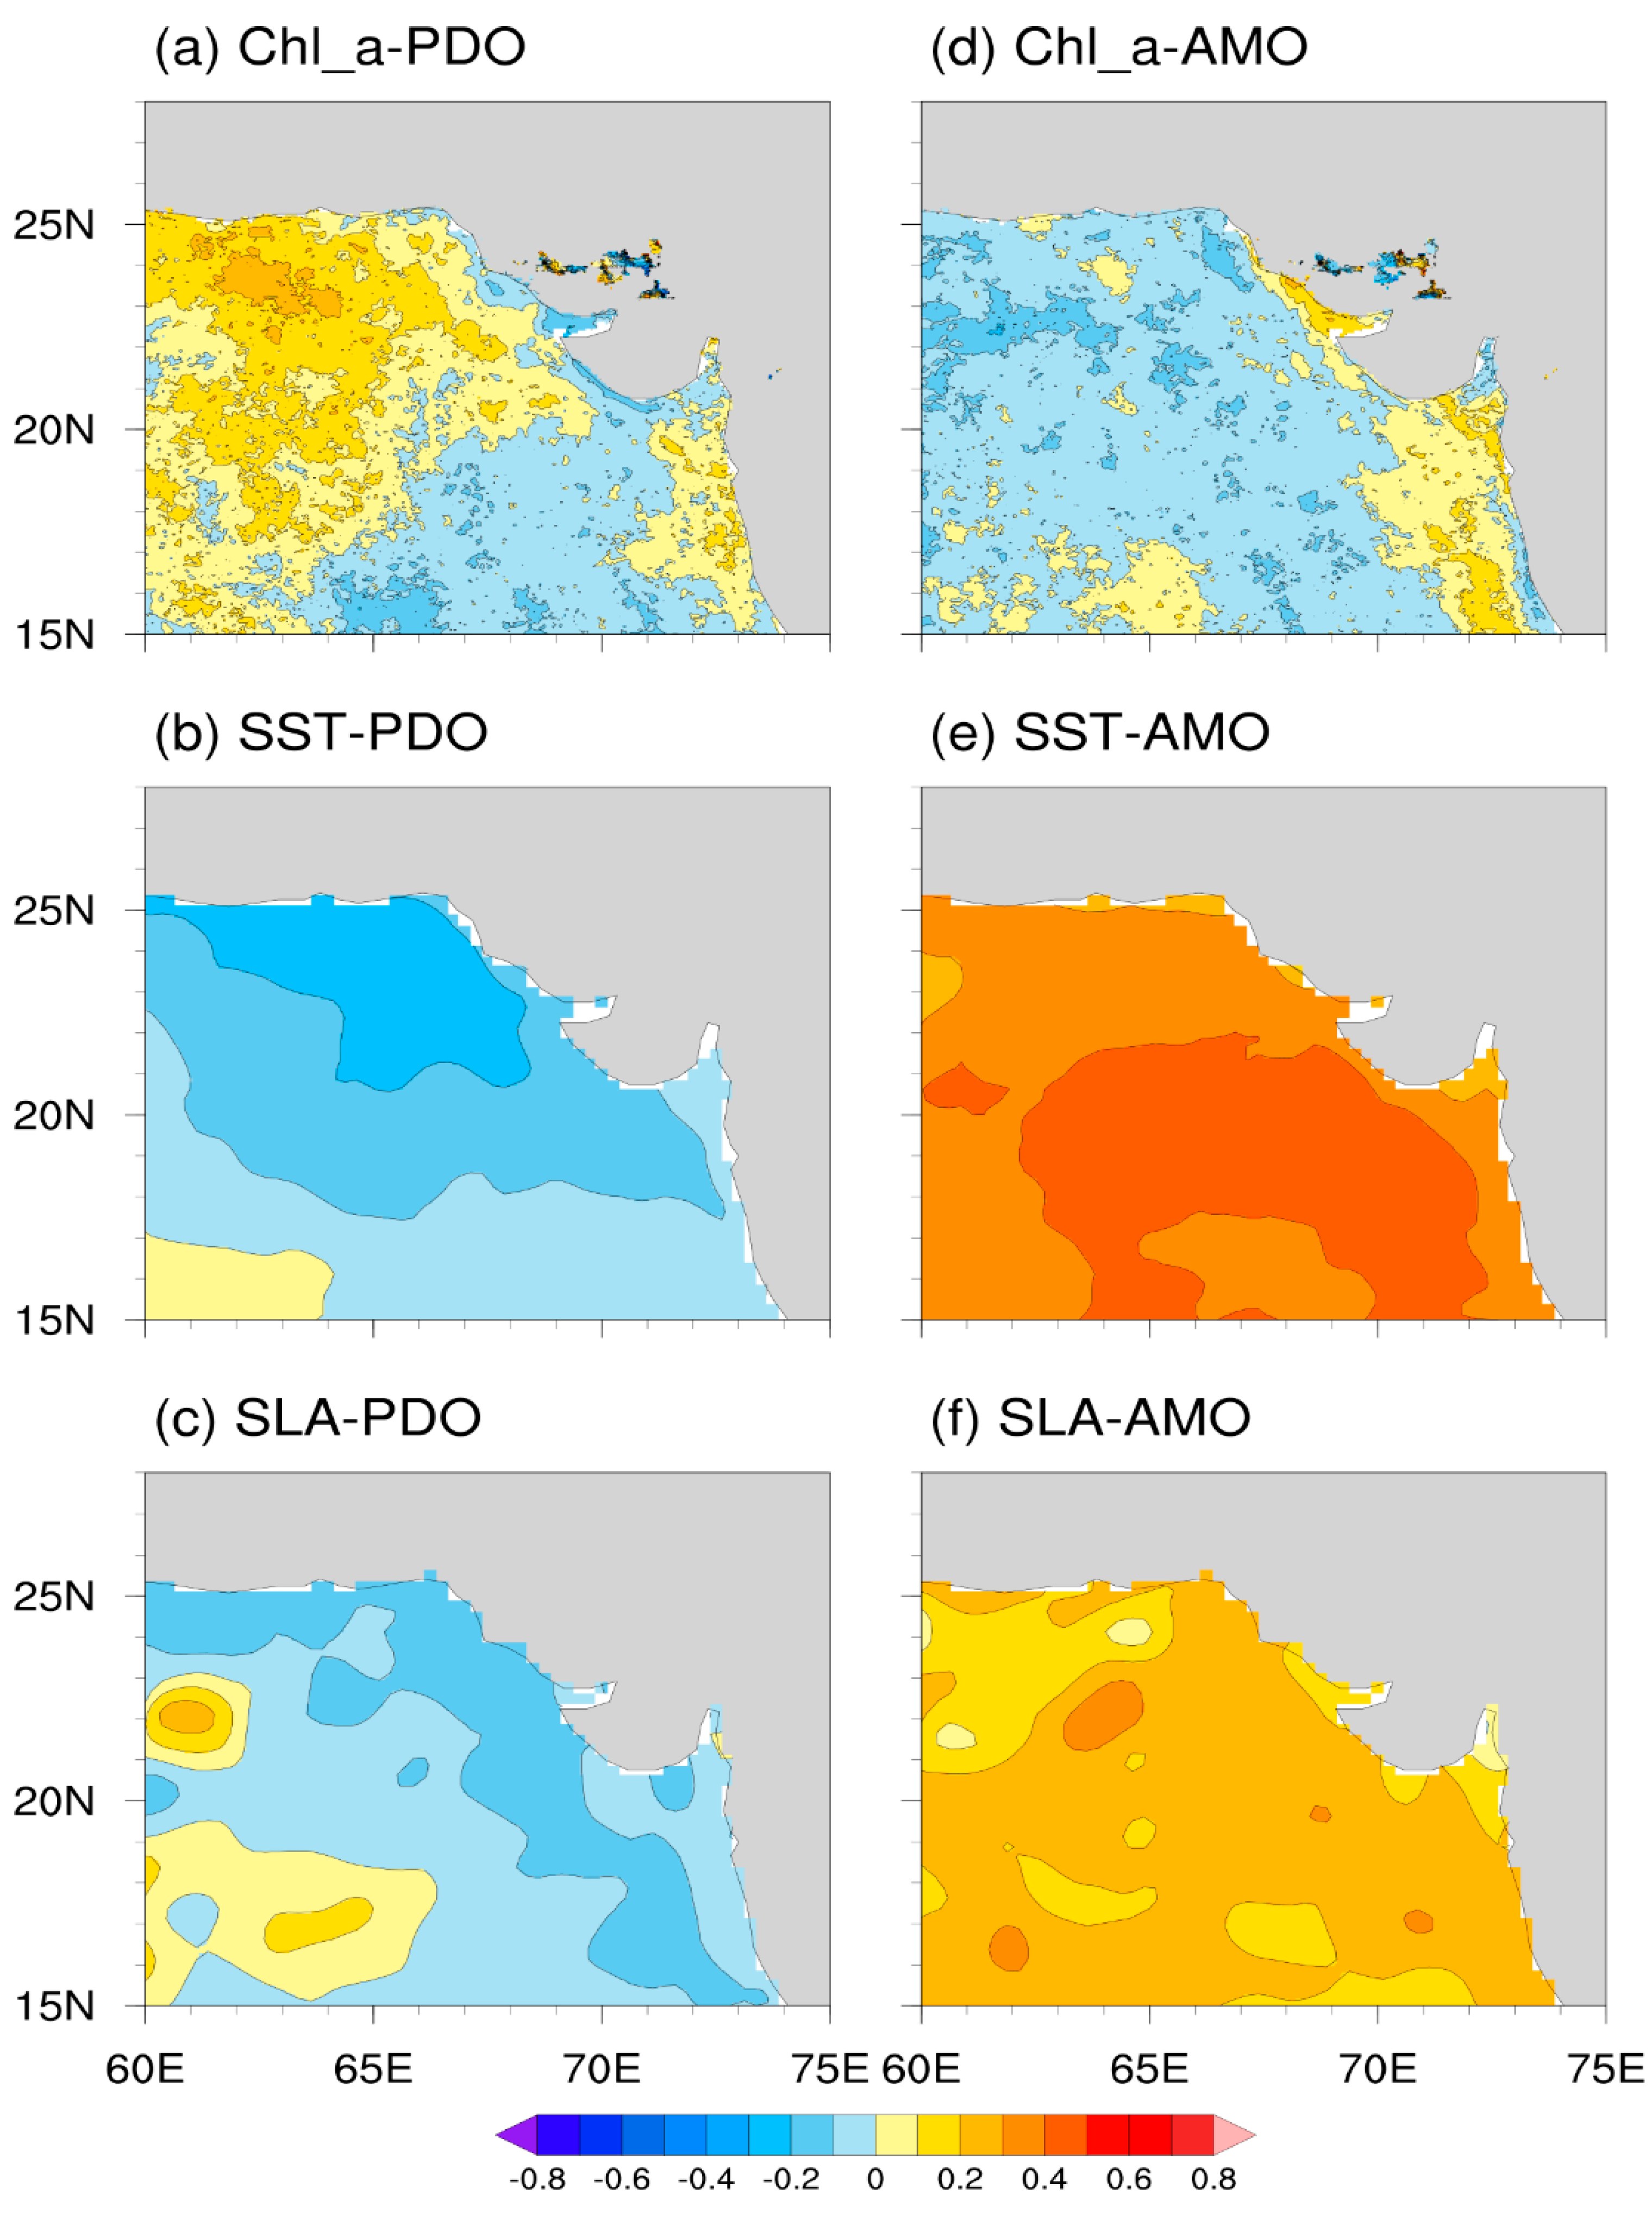
The PDO and AMO are major climate oscillations that influence the oceanic and atmospheric conditions both within and beyond their respective basins. There is a distinct spatial correlation of the PDO and AMO on oceanic conditions in the Arabian Sea (Figure 6). Over the past four decades, the PDO index showed a declining linear trend (−0.036), while the AMO exhibited an increasing trend (0.011) (Figure 7). The PDO displayed a distinct negative and positive phase, reflecting its oscillatory nature. The AMO remained negative from 1982 to 2000, then shifted to a positive phase from 2001 to 2022, highlighting its altering climate influence (Figure 7). To assess their relationships with oceanic variables, this study conducted linear regression analyses between each index and satellite-derived Chl-a, SST, and SLA. The resulting R2 values are presented in Figure 6, which includes spatial correlation maps. A positive correlation (R2 > 0.5) was observed between the PDO and Chl-a (Figure 6a), while the PDO showed a negative correlation with the SST and SLA (Figure 6b,c). The positive spatial correlation between the PDO and Chl-a suggest that PDO-related variability may enhance nutrient availability and biological productivity in the Arabian Sea. In contrast, the negative correlation of the PDO with the SST and SLA implies that the PDO-associated atmospheric circulation may induce surface cooling and a lower SLA. Conversely, the AMO was negatively correlated with Chl-a but positively spatially correlated (R2 > 0.5) with the SST and SLA (Figure 6d–f). The AMO showed a negative spatial correlation with Chl-a, indicating the potential suppression of productivity during the warm AMO phases, while it was positively correlated with the SST and SLA, reflecting large-scale warming and thermal expansion patterns. These spatial correlation results suggest that the PDO and AMO exert opposite influences on oceanic parameters in the Arabian Sea (Figure 6).

4. Discussion

The Arabian Sea plays a crucial role in influencing monsoon variability, regional climate shifts, and extreme weather events. In recent decades, the region has experienced significant warming, posing substantial threats to the Indian Ocean nations and increasing their vulnerability to climate change impacts. The Arabian Sea supports diverse oceanographic processes during both summer and winter, making it one of the most biologically productive marine ecosystems globally. This productivity is primarily driven by coastal upwelling and wind-induced circulation patterns [49,61]. However, increased water-column stratification due to ocean warming impedes vertical nutrient mixing, potentially reducing primary productivity in the euphotic zone and affecting fisheries and ecosystem health [10,62]. This study examined the decadal variability of Chl-a in the Arabian Sea and its relationship with key oceanic variables, including the SST, SLA, PDO and AMO. As Chl-a is a key proxy for phytoplankton biomass and ecosystem productivity, monitoring its trends is critical for assessing the impacts of climate change and anthropogenic pressures. This study utilized satellite-derived datasets and EOF analysis to assess the spatial and temporal variability of Chl-a concentrations. While many global studies have explored SST and Chl-a variability, few have specifically addressed their decadal trends in the Arabian Sea. This research fills that gap by offering new insights into the interactions of these variables over time and space.
Chl-a dynamics are predominantly influenced by large-scale oceanic circulation [42]. This analysis revealed maximum Chl-a concentrations (>2 mg/m3) in 2009 and 2013, with a decadal average of approximately 1.1 mg/m3 (±0.40 mg/m3). The highest inshore and offshore Chl-a levels were observed between February and March, while coastal patches persisted from April to January. EFO analysis effectively captured these spatial and temporal Chl-a dynamics, distinguishing between coastal and offshore regimes [34,63,64]. Coastal regions exhibit persistently high Chl-a concentrations (>3 mg/m3), which are influenced by nutrient-rich riverine inputs, particularly from the Indus River. The Arabian Sea typically displays higher productivity during the winter monsoon [48]. Consistent decadal Chl-a patterns have been documented throughout the basin [65]. An elevated coastal Chl-a is likely due to freshwater discharges that enhances nutrient availability [66,67]. The EOF’s fourth mode emphasized the significant role of the Indus River’s (24.0° N, 67.5° E) discharges in sustaining coastal Chl-a levels, echoing findings from other regions such as the Ariake Sea [68], where river discharge, SST, and precipitation collectively influence Chl-a. Chl-a concentrations declined progressively with increasing distance from the coast (Figure 4). Nutrient availability remains the primary limiting factor for phytoplankton growth globally [69,70,71].
Globally, the negative relationship between SST and Chl-a is well-documented, where warmer SSTs correlate with lower Chl-a and vice versa [10,62,71,72]. Boyce et al. [73] reported a 60% global decline in Chl-a, with this trend expected to continue. However, significant regional disparities exist. Prakash et al. [74] noted a declining Chl-a trend in the Arabian Sea, but the current study did not show such a significant decrease (Figure 7). Instead, relatively higher Chl-a levels were maintained compared with other regions, which are likely supported by the continuous nutrient-rich river inflows [69,75,76,77]. Similar seasonal Chl-a variations have been reported in the China Sea [78,79], yet long-term studies in the Arabian Sea remain scarce. The current analysis showed stable average Chl-a levels over the past three decades with minor interannual fluctuations (Figure 7). Discrepancies in Chl-a trends may arise from differing time series, oceanographic variables, and spatial coverage.
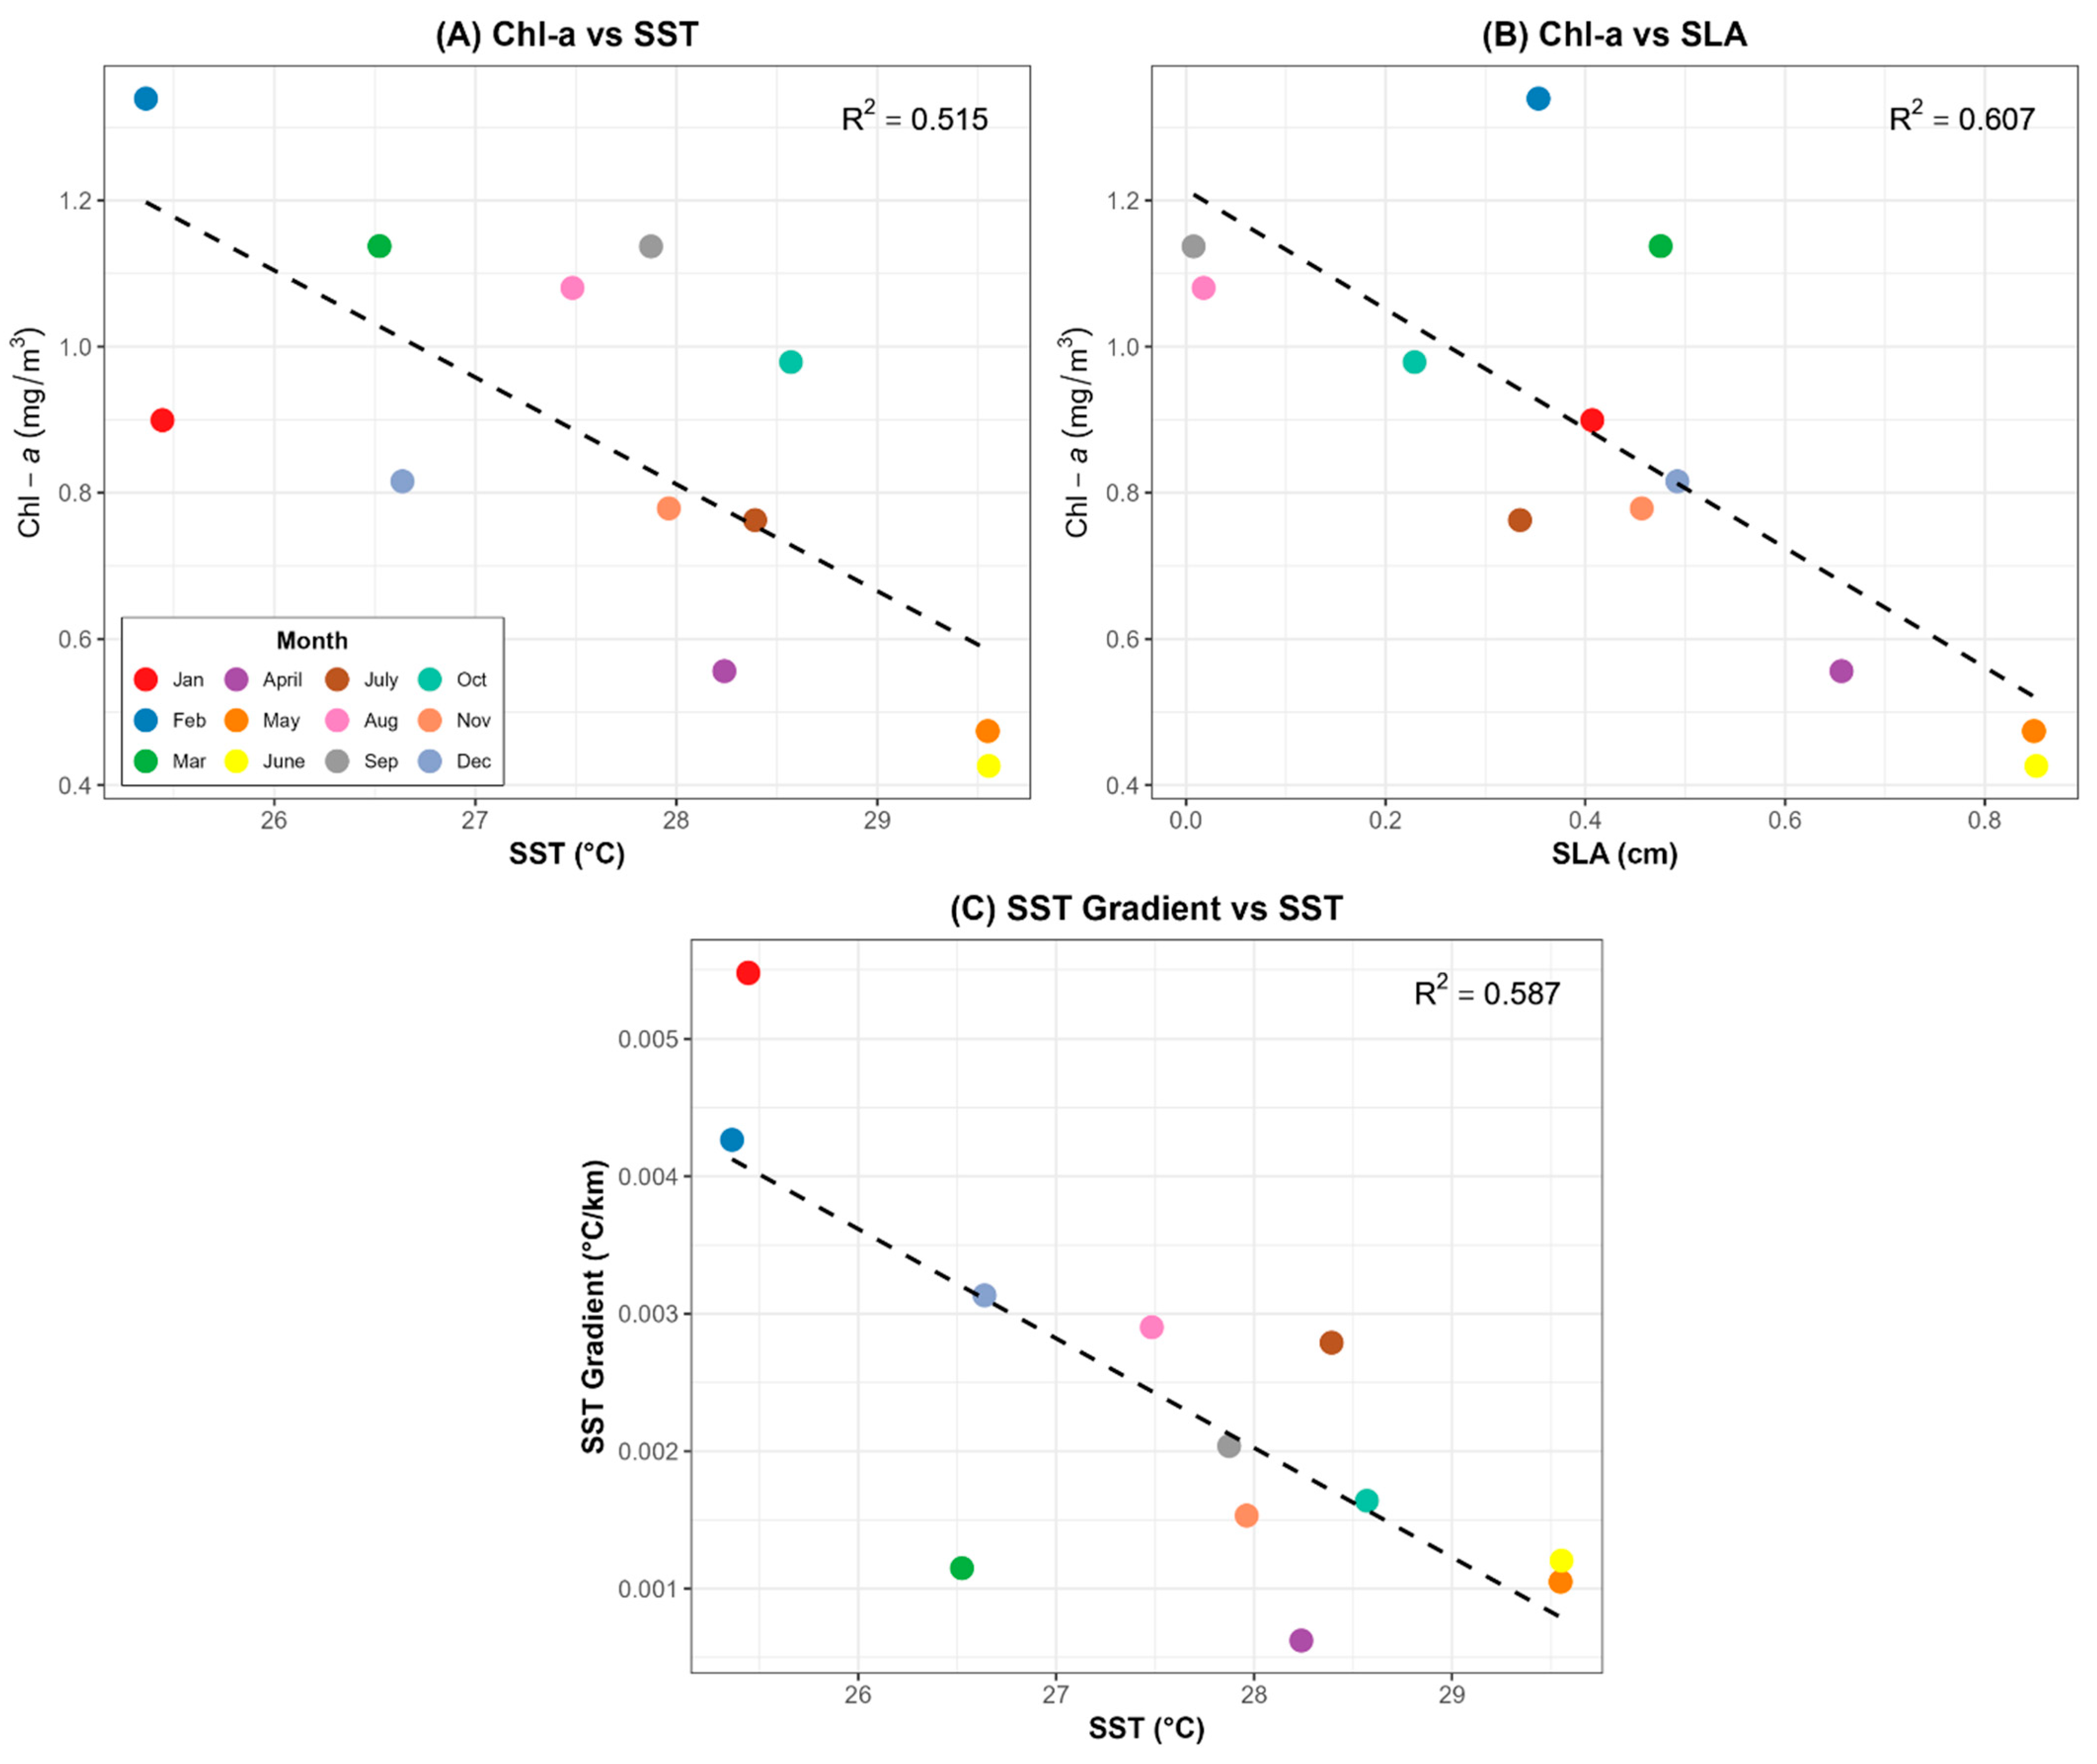
The monthly mean area average Chl-a exhibited a strong correlation with the mean SST and SLA with significant coefficients (R2 > 0.5) (Figure 8a,b), which is consistent with observations in the Persian Gulf [80]. Different colors represent the monthly area averages, illustrating the fluctuations in the Chl-a variability throughout the study period (Figure 8). A positive correlation was also noted between the area’s averaged SST and SST GM (R2 = 0.58) (Figure 8c), in agreement with earlier studies on primary productivity and oceanic variables [81,82]. The influence of large-scale climate oscillations was also evident. The PDO exhibited a decreasing trend over the past decades in a linear regression analysis (−0.036), indicating variability across its positive and negative phases, while the AMO showed an increasing trend (0.011) (Figure 7). Chl-a displayed a relatively positive correlation with the PDO but a negative association with the AMO (Figure 6a,d). These observations emphasize the complex interplay of the biological, physical, and chemical processes driving Chl-a dynamics in the Arabian Sea [83,84].
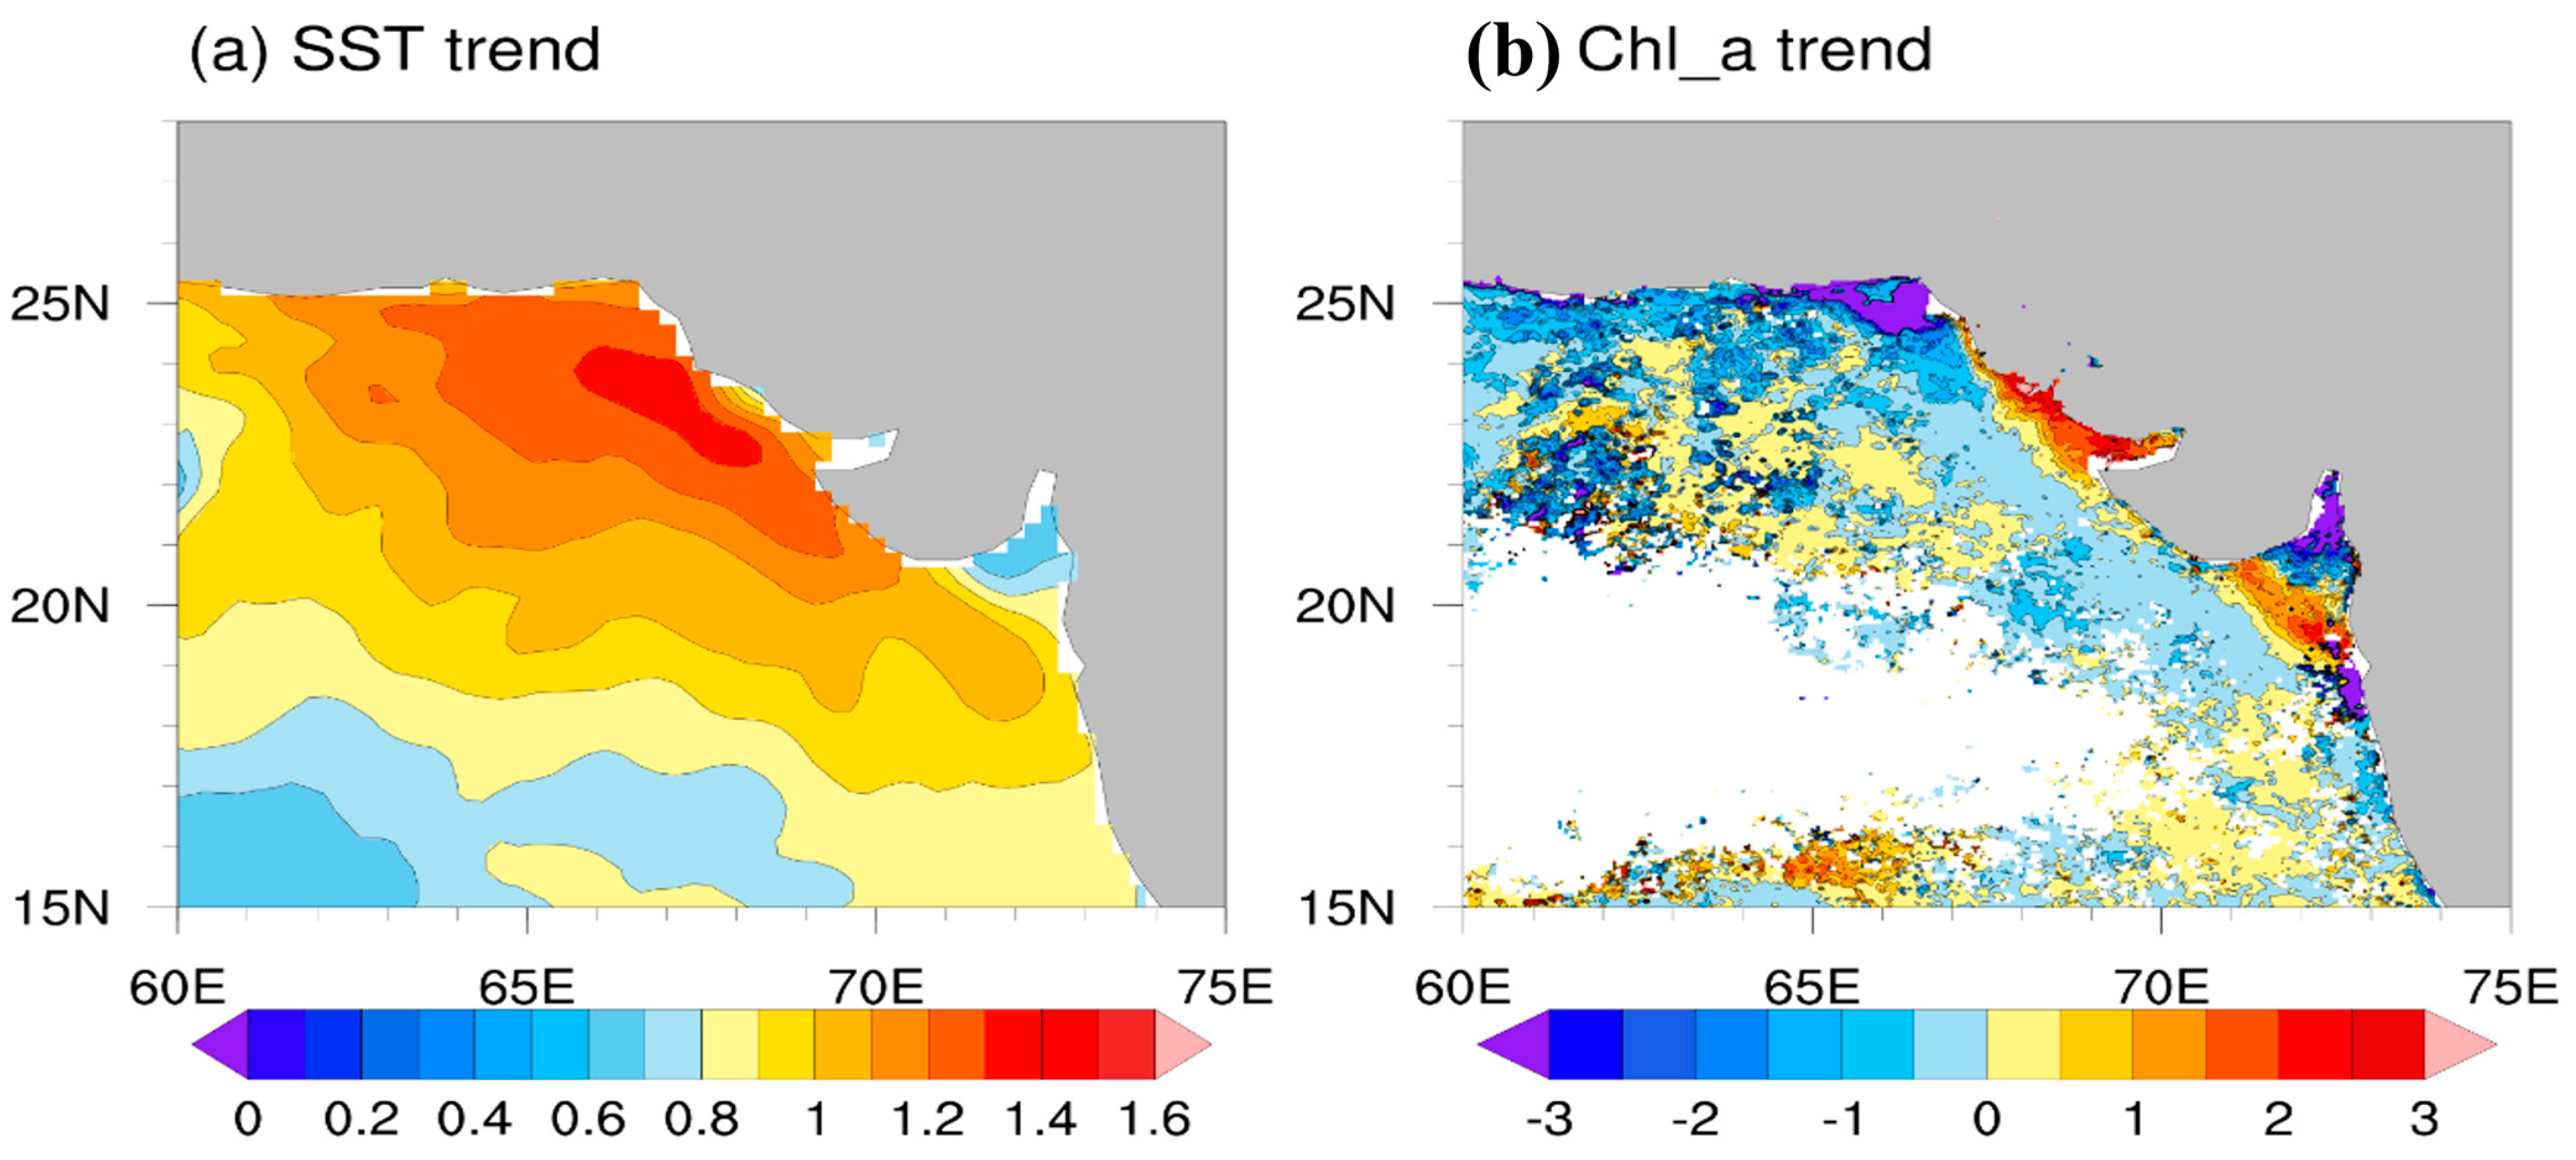
The acceleration of global warming since the Industrial Era, especially after a period of stabilization between 2003 to 2012, has profound implications for interannual and interdecadal climate variability [28,85,86]. This study found that the Arabian Sea’s SST increased by 0.709 °C over the past four decades, with an average SST of 27.32 °C (±0.346 °C). This warming surpasses the Gulf region’s mean SST of 26.7 °C for 1982–2020 [87]. Comparatively, the global and Red Sea warming rates are 0.07 °C and 0.17 °C per decade, respectively [88,89], while the Gulf shows a faster rate of 0.41 °C per decade and a sharp increase of 0.7 °C between 2003 and 2018 [90]. The SST in the Indian Ocean is rising at a rate higher than the global average [91]. In the Arabian Sea, the SST has shown a continuous upward trend over the last four decades (R2 = 0.65), with peaks in 2010 and 2022 (>27.9 °C) (Figure 7). Spatial analysis revealed stronger warming in the coastal areas (>1.6 °C) compared with offshore regions (<0.6 °C). The highest SSTs were recorded in 2010, while February remained the coolest month, which is consistent with earlier studies [92]. The observed SST rise of 0.709 °C exceeds the broader Indian Ocean’s warming of 0.4 °C [93]. Projections under various CO2 emission scenarios forecast additional increases of 1.5–4.0 °C [94]. Such warming may further affect water column stratification and nutrient supply to the euphotic zone, potentially impacting Chl-a levels [94,95].
EOF analysis supported these findings, with Modes 1 and 4 consistently showing an increase in the SST, while Modes 2 and 3 indicated cooler SST patterns. Mode 4 also highlighted cooler temperatures near the coast, which are possibly influenced by riverine inflows (Figure 3). Thermal fronts similar to those in Japanese coastal waters [68] were also detected along the Pakistan coast. Decadal SST GM analysis showed coastal temperature gradients intensifying from <0.07 °C/km in September to >0.1 °C/km by February, driven by freshwater discharge and shelf mixing. Comparable patterns were observed in the Arabian Sea, South Atlantic, California, and Chinese waters [96,97,98,99,100]. These fronts, associated with a higher SST GM, often coincide with increased Chl-a, supporting fishery productivity [5,66,101]. This study adds a decadal perspective, contrasting prior seasonal assessments. The Arabian Sea warming rates are consistent with global projections, which potentially threaten productivity [10,102]. The SST variability showed a temporal association with the AMO and PDO patterns, where the AMO aligned with a general warming trend and the PDO exhibited more oscillatory behavior [23,44]. These climate indices were also associated with Chl-a variability, which was potentially mediated through changes in wind patterns and ocean stratification (Figure 6b,e). The SLA trends showed a steady rise of 1.3 mm/year, which is consistent with the global average [103,104]. From 1993 to 2021, the SLA rose from 0.06 cm to 0.65 cm across the decades, with notable seasonal variability that was higher in summer and along the coasts in winter (Supplementary Figure S2, Figure 7). Similar increasing trends were reported along the Oman coast and in the broader Indian Ocean [105,106,107]. SLA inversely correlated with Chl-a (R2 = 0.6) (Figure 8b), reflecting patterns in the South China Sea [71,108]. Overall, this rising SLA, influenced by the SST and winds, emerges as a key driver of the declining productivity in the Arabian Sea [109,110].
The decadal trends of Chl-a concentration showed consistently higher Chl-a concentrations (>3 mg/m3), while offshore waters exhibited lower values, with occasional patches of higher productivity (Figure 9b). Decadal trends revealed spatial heterogeneity, with certain areas experiencing increased Chl-a, suggesting enhanced productivity, while other regions showed declines, which are likely linked to variations in nutrient availability, SST, and circulation patterns (Figure 9b). Regarding the spatial distribution of the average SST and its long-term trend across the Arabian Sea, the higher values (~1.5) represent local trend intensities, while offshore regions exhibit lower values (Figure 9a). Overall, this study emphasizes the decadal variability in the SST, SLA and major climate indices (PDO and AMO), which significantly shape Chl-a dynamics and productivity in the Arabian Sea. These interactions affect primary productivity and underline the need for long-term monitoring under changing climate conditions.

5. Conclusions

This study assessed the decadal variability of Chl-a in the Arabian Sea and its relationship with ocean dynamics and climate indices. Over three decades, the average Chl-a was 1.10 mg/m3, with peak levels along the coast during February and March. EOF analysis revealed distinct spatial patterns, highlighting the influence of freshwater inflow from the Indus River (24.0° N, 67.5° E) and coastal upwelling along the Balochistan coast (24.8° N, 61–65.5° E). The SST increased by 0.709 °C, while SLA increased over 1 cm during the study period. The monthly mean Chl-a variability showed a moderate to strong relationship with the SST and SLA (R2 > 0.5). This association indicates that elevated SST and SLA may be associated with reduced Chl-a levels. The PDO was positively associated with Chl-a but negatively with the SST and SLA, whereas the AMO showed the opposite pattern. These associations suggest that basin-scale climate oscillations may play an important role in modulating environmental conditions that influence marine productivity in the Arabian Sea. As SST and SLA trends continue to rise, these findings underscore the importance of incorporating climate variability considerations into marine resource management to sustain fisheries, protect biodiversity, and support coastal resilience. Efforts should focus on strengthening monitoring programs using both satellite and in-situ data, alongside developing predictive models to anticipate changes in ocean productivity. Future studies should also explore the combined impacts of regional monsoon variability, river discharge, and anthropogenic pressures on marine ecosystems. Scenario-based modeling could further inform sustainable management plans and mitigation strategies for the anticipated impacts of climate change on the Arabian Sea ecosystem.

Supplementary Materials

The following supporting information can be downloaded at https://www.mdpi.com/article/10.3390/jmse13061170/s1: Figure S1: Monthly sea surface temperature gradients for the Indus River (24.0° N, 67.5° E) and the Balochistan region (24.8° N, 61–65.5° E) from 1982–2022 in the Arabian Sea. The SST gradient (°C/km) is >0.05 °C/km (Jing et al., 2015 [58]; Lao et al., 2023 [59]); Figure S2: Monthly climatological observations of the SLA (cm) and contour lines of the standard deviation from 1993-2021 in the Arabian Sea.

Author Contributions

M.A.K.: conceptualization, data curation, investigation, formal analysis, methodology, writing—original draft, writing—review and editing; V.C.: equal contribution as first author, conceptualization, data curation, investigation, formal analysis, writing—review and editing; M.T.: formal analysis, methodology, validation, writing—review and editing; C.L.: methodology, software, visualization, writing—review and editing; L.Z.: formal analysis, resources, software, writing—review and editing; Z.L.: data curation, investigation, project administration, validation, writing—review and editing; A.B.: validation, writing—review and editing; J.S.: funding acquisition, supervision, formal analysis, validation, writing—review and editing. All authors have read and agreed to the published version of the manuscript.

Funding

This study was funded by the Science and Technology Plan of Liaoning Province (2024JH2/102400061), the Dalian Science and Technology Innovation Fund (2024JJ11PT007), the Dalian Science and Technology Program for Innovation Talents of Dalian (2022RJ06), the Liaoning Province Education Department’s scientific research platform construction project (LJ232410158056); and the basic scientific research funds of Dalian Ocean University (2024JBPTZ001).

Data Availability Statement

Data generated or analyzed during this study are provided in this article; however, the online data link is provided in the Materials and Methods section for the sea surface temperature, Chlorophyll-a and sea level anomaly product data from the Copernicus Marine and Environment Monitoring Service (CMEMS): https://data.marine.copernicus.eu/products (accessed on 4 November 2024).

Acknowledgments

The present work is supported by the Shandong University, Marine College, Weihai (202367800206) and is funded by the corresponding author (Jun Song). We also thank the Data Support from the National Marine Scientific Data Center (Dalian), the National Science & Technology Infrastructure of China (https://www.dlou.edu.cn / (accessed on 4 November 2024)), the Liaoning Marine Scientific Data Center, and the Dalian Marine Scientific Data Center for providing valuable data and information. We also thank the reviewers for carefully reviewing the manuscript and providing valuable comments to help improve this paper.

Conflicts of Interest

The authors declare no conflicts of interest.

References

  1. Arteaga, L.; Pahlow, M.; Oschlies, A. Global patterns of phytoplankton nutrient and light colimitation inferred from an optimality-based model. Glob. Biogeochem. Cycles 2014, 28, 648–661. [Google Scholar] [CrossRef]
  2. Boyer, T.P.; Baranova, O.K.; Coleman, C.; Garcia, H.E.; Grodsky, A.; Locarnini, R.A.; Mishonov, A.V.; Paver, C.R.; Reagan, J.R.; Seidov, D.; et al. World Ocean Database 2018; Mishonov, A.V., Ed.; NOAA Atlas NESDIS: Silver Spring, AR, USA, 2018; p. 87. [Google Scholar]
  3. Balaguru, K.; Foltz, G.R.; Leung, L.R.; Emanuel, K.A. Global warming-induced upper-ocean freshening and the intensification of super typhoons. Nat. Commun. 2016, 7, 13670. [Google Scholar] [CrossRef]
  4. Bryndum-Buchholz, A.; Tittensor, D.P.; Blanchard, J.L.; Cheung, W.W.L.; Coll, M.; Galbraith, E.D.; Jennings, S.; Maury, O.; Lotze, H.K. Twenty-first-century climate change impacts on marine animal biomass and ecosystem structure across ocean basins. Glob. Change Biol. 2019, 25, 459–472. [Google Scholar] [CrossRef] [PubMed]
  5. Kalhoro, M.A.; Ye, H.; Liu, C.; Zhu, L.; Liang, Z.; Tang, D. Impact of sea surface temperature fronts on the spatial distribution of jellyfish in the northern Arabian sea. Estuar. Coast. Shelf Sci. 2025, 312, 109033. [Google Scholar] [CrossRef]
  6. Colwell, R.R. Global climate and infectious disease: The cholera paradigm. Science 1996, 274, 2025–2031. [Google Scholar] [CrossRef]
  7. Harvell, C.; Burkholder, K.J.; Colwell, R.; Epstein, P.R.; Grimes, D.; Hofmann, E.; Lipp, E.; Osterhaus, A.; Overstreet, R.M. Emerging marine diseases—Climate links and anthropogenic factors. Science 1999, 285, 1505–1510. [Google Scholar] [CrossRef]
  8. Lee, P.F.; Chen, I.C.; Tzeng, W.N. Spatial and temporal distribution patterns of bigeye tuna (Thunnus obesus) in the Indian Ocean. Zool. Stud. Taipei 2005, 44, 260–270. [Google Scholar]
  9. Myers, R.A.; Worm, B. Rapid worldwide depletion of predatory fish communities. Nature 2003, 423, 280–283. [Google Scholar] [CrossRef]
  10. Roxy, M.K.; Modi, A.; Murtugudde, R.; Valsala, V.; Panickal, S.; PrasannaKumar, S.; Ravichandran, M.; Vichi, M.; Lévy, M. A reduction in marine primary productivity driven by rapid warming over the tropical Indian Ocean. Geophys. Res. Lett. 2016, 43, 826–833. [Google Scholar] [CrossRef]
  11. Kalhoro, M.A.; Qun, L.; Zhu, L.; Zhaoyang, J.; Liang, Z. Assessing Fishing Capacity of Two Tuna Fish Species Using Different Time-Series Data in Pakistan, Northern Arabian Sea. Estuar. Coast. Shelf Sci. 2024, 299, 108692. [Google Scholar] [CrossRef]
  12. Breitburg, D.; Levin, L.A.; Oschlies, A.; Grégoire, M.; Chavez, F.P.; Conley, D.J.; Garçon, V.; Gilbert, D.; Gutiérrez, D.; Isensee, K.; et al. Declining oxygen in the global ocean and coastal waters. Science 2018, 359, eaam7240. [Google Scholar] [CrossRef] [PubMed]
  13. Bristow, L.A.; Callbeck, C.M.; Larsen, M.; Altabet, M.; Dekaezemacker, J.; Forth, M.; Canfiled, D.E. N2 production rates limited by nitrite availability in the Bay of Bengal oxygen minimum zone. Nat. Geosci. 2017, 10, 24–29. [Google Scholar] [CrossRef]
  14. Brown, C.J.; Fulton, E.A.; Hobday, A.J.; Matear, R.J.; Possingham, H.P.; Bulman, C.; Christensen, V.; Forrest, R.E.; Gehrke, P.C.; Gribble, N.A.; et al. Effects of climate-driven primary production change on marine food webs: Implications for fisheries and conservation. Glob. Change Biol. 2010, 16, 1194–1212. [Google Scholar] [CrossRef]
  15. Blix, K.; Li, J.; Massicotte, P.; Matsuoka, A. Developing a New Machine-Learning Algorithm for Estimating Chlorophyll-a Concentration in Optically Complex Waters: A Case Study for High Northern Latitude Waters by Using Sentinel 3 OLCI. Remote Sens. 2019, 11, 2076. [Google Scholar] [CrossRef]
  16. Chen, B.; Liu, H. Relationships between phytoplankton growth and cell size in surface oceans: Interactive effects of temperature, nutrients, and grazing. Limnol. Oceanogr. 2010, 55, 965–972. [Google Scholar] [CrossRef]
  17. Chen, S.; Smith, W.O.; Yu, X. Revisiting the Ocean Color Algorithms for Particulate Organic Carbon and Chlorophyll-a Concentrations in the Ross Sea. J. Geophys. Res. Ocean. 2021, 126, e2021JC017749. [Google Scholar] [CrossRef]
  18. Harding, L.W., Jr.; Mallonee, M.E.; Perry, E.S. Toward a Predictive Understanding of Primary Productivity in a Temperate, Partially Stratified Estuary. Estuar. Coast. Shelf Sci. 2002, 55, 437–463. [Google Scholar] [CrossRef]
  19. Chen, S.; Meng, Y. Phytoplankton Blooms Expanding Further Than Previously Thought in the Ross Sea: A Remote Sensing Perspective. Remote Sens. 2022, 14, 3263. [Google Scholar] [CrossRef]
  20. Liu, P.; Sui, C.H. An observational analysis of the oceanic and atmospheric structure of global-scale multi-decadal variability. Adv. Atmos. Sci. 2014, 31, 316–330. [Google Scholar] [CrossRef]
  21. Bjerknes, J. Atlantic air-sea interaction. Adv. Geophys. 1964, 10, 1–82. [Google Scholar]
  22. Folland, C.K.; Parker, D.E. Observed Variations of Sea Surface Temperature; Springer: Dordrecht, The Netherlands, 1990; pp. 21–52. [Google Scholar]
  23. Chen, X.; Tung, K.K. Global surface warming enhanced by weak Atlantic overturning circulation. Nature 2018, 559, 387–391. [Google Scholar] [CrossRef] [PubMed]
  24. England, M.H.; Mcgregor, S.; Spence, P.; Meehl, G.A.; Timmermann, A.; Cai, W.; Gupta, A.S.; McPhaden, M.J.; Purich, A.; Santoso, A. Recent intensification of wind-driven circulation in the Pacific and the ongoing warming hiatus. Nat. Clim. Change 2014, 4, 222–227. [Google Scholar] [CrossRef]
  25. Wu, S.; Liu, Z.Y.; Cheng, J.; Li, C. Response of North Pacific and North Atlantic decadal variability to weak global warming. Adv. Clim. Change Res. 2018, 9, 95–101. [Google Scholar] [CrossRef]
  26. Martinez, E.; Antoine, D.; D’Ortenzio, F.; Gentili, B. Climate-driven basin-scale decadal oscillations of oceanic phytoplankton. Science 2009, 326, 1253–1256. [Google Scholar] [CrossRef]
  27. Si, D.; Ding, Y. Oceanic forcings of the interdecadal variability in East Asian summer rainfall. J. Clim. 2016, 29, 7633–7649. [Google Scholar] [CrossRef]
  28. Geng, T.; Yang, Y.; Wu, L.X. On the mechanisms of Pacific Decadal Oscillation modulation in a warming climate. J. Clim. 2019, 32, 1443–1459. [Google Scholar] [CrossRef]
  29. Zhang, G.; Zeng, G.; Li, C.; Yang, X. Impact of PDO and AMO on interdecadal variability in extreme high temperatures in North China over the most recent 40-year period. Clim. Dyn. 2020, 54, 3003–3020. [Google Scholar] [CrossRef]
  30. Hao, X.; He, S.; Wang, H. Asymmetry in the response of central Eurasian winter temperature to AMO. Clim. Dyn. 2016, 47, 2139–2154. [Google Scholar] [CrossRef]
  31. Martiorena, S.; Siegel, D.A.; Peterson, A. Optimization of a semi-analytical ocean color model for global scale applications. Appl. Opt. 2002, 41, 2705–2714. [Google Scholar] [CrossRef]
  32. Hu, C.; Lee, Z.; Franz, B. Chlorophyll-a algorithm for oligotrophic oceans: A novel approach based on three-band reflectance difference. J. Geophys. Res. 2012, 117, C01011. [Google Scholar]
  33. Brickley, P.J.; Thomas, A.C. Satellite-measured seasonal and inter-annual chlorophyll variability in the Northeast Pacific and Coastal Gulf of Alaska. Deep-Sea Res. 2004, 51, 229–245. [Google Scholar] [CrossRef]
  34. Li, Y.; He, R. Spatial and temporal variability of SST and ocean color in the Gulf of Maine based on cloud-free SST and chlorophyll reconstructions in 2003–2012. Remote Sens. Environ. 2014, 144, 98–108. [Google Scholar] [CrossRef]
  35. Ning, J.; Chen, K.; Gaube, P. Diverse variability of surface chlorophyll during the evolution of gulf stream rings. Geophys. Res. Lett. 2021, 48, e2020GL091461. [Google Scholar] [CrossRef]
  36. Legaard, K.R.; Thomas, A.C. Spatial patterns in seasonal and interannual variability of chlorophyll and sea surface temperature in the California Current. J. Geophys. Res. 2006, 111, C06032. [Google Scholar] [CrossRef]
  37. Philippart, C.J.M.; Van-Iperen, J.M.; Cadee, G.C.; Zuur, A.F. Long-term field observations on seasonality in chlorophyll-a concentrations in a shallow coastal marine ecosystem, the Wadden Sea. Estuar. Coasts 2010, 33, 286–294. [Google Scholar] [CrossRef]
  38. Liu, D.; Chen, C.; Gong, J.; Fu, D. Remote sensing of chlorophyll-a concentrations of the Pearl River Estuary from MODIS land bands. Int. J. Remote Sens. 2010, 31, 4625–4633. [Google Scholar] [CrossRef]
  39. Liu, X.; Wang, J.; Cheng, X.; Du, Y. Abnormal upwelling and chlorophyll-a concentration off South Vietnam in summer 2007. J. Geophys. Res. 2012, 117, C07021. [Google Scholar] [CrossRef]
  40. Mercado, J.M.; Ramírez, T.; Cortés, D.; Sebastián, M.; Reul, A.; Bautista, B. Diurnal changes in the bio-optical properties of the phytoplankton in the Alborán Sea (Mediterranean Sea). Estuar. Coast. Shelf. Sci. 2006, 69, 459–470. [Google Scholar] [CrossRef]
  41. Holm-Hansen, O.; Naganobu, M.; Kawaguchi, S.; Kameda, T.; Krasovski, I.; Tchernyshkov, P.; Priddle, J.; Korb, R.; Brandon, M.; Demer, D.; et al. Factors influencing the distribution, biomass, and productivity of phytoplankton in the Scotia Sea and adjoining waters. Deep. Sea Res. Part II 2004, 51, 1333–1350. [Google Scholar] [CrossRef]
  42. Signorini, S.R.; Franz, B.A.; McClain, C.R. Chlorophyll variability in the oligotrophic gyres: Mechanisms, seasonality and trends. Front. Mar. Sci. 2015, 2, 1. [Google Scholar] [CrossRef]
  43. Hoegh-Guldberg, O.; Cai, R.; Poloczanska, E.S.; Brewer, P.G.; Sundby, S.; Hilmi, K.; Fabry, V.J.; Jung, S.; Skirving, W.; Stone, D.A.; et al. Chapter 30—The Ocean. In Climate Change, 2014: Impacts, Adaptation, and Vulnerability. Part B: Regional Aspects; Cambridge University Press: Cambridge, UK, 2014; pp. 1655–1731. Available online: https://hdl.handle.net/10037/6969 (accessed on 14 May 2024).
  44. Sun, C.; Li, J.; Kucharski, F.; Kang, I.S.; Jin, F.F.; Wang, K.; Wang, C.; Ding, R.; Xie, F. Recent acceleration of Arabian Sea warming induced by the Atlantic-western Pacific trans-basin multidecadal variability. Geophys. Res. Lett. 2019, 46, 1662–1671. [Google Scholar] [CrossRef]
  45. Valsala, V.; Murtugudde, R. Mesoscale and intraseasonal air-sea CO2 exchanges in the western Arabian Sea during boreal summer. Deep Res. Part I Oceanogr. Res. Pap. 2015, 103, 101–113. [Google Scholar] [CrossRef]
  46. Johns, W.E.; Yao, F.; Olson, D.B.; Josey, S.A.; Grist, J.P.; Smeed, D.A. Observations of seasonal exchange through the Straits of Hormuz and the inferred heat and freshwater budgets of the Persian Gulf. J. Geophys. Res. 2003, 108, 3391. [Google Scholar] [CrossRef]
  47. Parvaresh, A.; Hassanzadeh, S.; Bordbar, M.H. Statistical analysis of wave parameters in the north coast of the Persian Gulf. Ann. Geophys. 2005, 23, 2031–2038. [Google Scholar] [CrossRef]
  48. Madhupratap, M.; Kumar, S.P.; Bhattathiri, P.M.A.; Kumar, M.D.; Raghukumar, S.; Nair, K.K.C.; Ramaiah, N. Mechanism of the biological response to winter cooling in the Northeastern Arabian Sea. Nature 1996, 384, 549–552. [Google Scholar] [CrossRef]
  49. Shetye, S.R.; Gouveia, A.D.; Shenoi, S.S.C. Circulation and water masses of the Arabian Sea. In Biogeochemistry of the Arabian Sea; Lal, D., Ed.; Indian Academy of Sciences: New Delhi, India, 1994; pp. 9–25. [Google Scholar]
  50. Böhm, E.; Morrison, J.; Manghnani, V.; Kim, H.S.; Flagg, C. The Ras Al Hadd Jet: Remotely sensed and acoustic Doppler current profiler observations in 1994–1995. Deep Sea Res. Part II Top. Stud. Oceanogr. 1999, 46, 1531–1549. [Google Scholar] [CrossRef]
  51. Lee, C.M.; Jones, B.H.; Brink, K.H.; Fischer, A.S. The upper-ocean response to monsoonal forcing in the Arabian Sea: Seasonal and spatial variability. Deep Res. Part II Top. Stud. Oceanogr. 2000, 47, 1177–1226. [Google Scholar] [CrossRef]
  52. Sanaullah, S.; Yang, D.; Zhong, R.; Zhao, L.; Shafi, M.; Akbar, A.J. Mangrove dynamics in Pakistan: A long-term study of coastal ecosystem shifts over more than three decades. Ecol. Indic. 2025, 174, 113452. [Google Scholar] [CrossRef]
  53. Kalhoro, M.A.; Chinta, V.; de Mutsert, K.; Song, G.; Liu, C.; Tahir, M.; Liang, Z. Impact of tropical cyclone Biparjoy on oceanic parameters in the Arabian Sea. Mar. Pollut. Bull. 2024, 208, 117046. [Google Scholar] [CrossRef]
  54. Good, S.; Fiedler, E.; Mao, C.; Martin, M.J.; Maycock, A.; Reid, R.; Roberts-Jones, J.; Searle, T.; Waters, J.; While, J.; et al. The current configuration of the OSTIA system for operational production of foundation sea surface temperature and ice concentration analyses. Remote Sens. 2020, 12, 720. [Google Scholar] [CrossRef]
  55. Emery, W.J.; Thomson, R.E. Data Analysis Methods in Physical Oceanography; Elsevier Science: Amsterdam, The Netherlands, 2014. [Google Scholar]
  56. Beckers, J.M.; Rixen, M. EOF calculations and data filling from incomplete oceanographic datasets. J. Atmos. Ocean. Technol. 2003, 20, 1839–1856. [Google Scholar] [CrossRef]
  57. Belkin, I.M.; O’Reilly, J.E. An algorithm for oceanic front detection in chlorophyll and SST satellite imagery. J. Mar. Syst. 2009, 78, 319–326. [Google Scholar] [CrossRef]
  58. Jing, Z.; Qi, Y.; Du, Y.; Zhang, S.; Xie, L. Summer upwelling and thermal fronts in the northwestern South China Sea: Observational analysis of two mesoscale mapping surveys. J. Geophys. Res. Ocean. 2015, 120, 1993–2006. [Google Scholar] [CrossRef]
  59. Lao, Q.; Liu, S.; Ling, Z.; Jin, G.; Chen, F.; Chen, C.; Zhu, Q. External dynamic mechanisms controlling the periodic offshore blooms in Beibu Gulf. J. Geophys. Res. Ocean. 2023, 128, e2023JC019689. [Google Scholar] [CrossRef]
  60. Zhang, Y.; Wallace, J.M.; Battisti, D.S. ENSO-like Interdecadal Variability: 1900–93. J. Clim. 1997, 10, 1004–1020. [Google Scholar] [CrossRef]
  61. Wiggert, J.; Hood, R.; Banse, K.; Kindle, J. Monsoon-driven biogeochemical processes in the Arabian Sea. Prog. Oceanogr. 2005, 65, 176–213. [Google Scholar] [CrossRef]
  62. Behrenfeld, M.J.; O’Malley, R.T.; Siegel, D.A.; McClain, C.R.; Sarmiento, J.L.; Feldman, G.C.; Milligan, A.J.; Falkowski, P.G.; Letelier, R.M.; Boss, E.S. Climate-driven trends in contemporary ocean productivity. Nature 2006, 444, 752–755. [Google Scholar] [CrossRef] [PubMed]
  63. Espinosa-Carreon, T.L.; Strub, P.T.; Beier, E.; Ocampo-Torres, F.; Gaxiola-Castro, G. Seasonal and interannual variability of satellite derived chlorophyll pigment, surface height, and temperature off Baja California. J. Geophys. Res. 2004, 109, C03039. [Google Scholar] [CrossRef]
  64. Le, C.; Hu, C.; Cannizzaro, J.; English, D.; Kovach, C. Climate-driven chlorophyll a changes in a turbid estuary: Observation from satellites and implications for management. Remote Sens. Environ. 2013, 130, 11–24. [Google Scholar] [CrossRef]
  65. Peter, B.N.; Sreejith, M.; Siswanto, E. Variability of Arabian Sea surface circulation and chlorophyll distribution: A remote sensing estimation. Terr. Atmos. Ocean. Sci. 2022, 33, 22. [Google Scholar] [CrossRef]
  66. Greer, A.T.; Cowen, R.K.; Guigand, C.M.; Hare, J.A. Fine-scale planktonic habitat partitioning at a shelf-slope front revealed by a high-resolution imaging system. J. Mar. Syst. 2015, 142, 111–125. [Google Scholar] [CrossRef]
  67. Polikarpov, I.; Saburova, M.; Al-Yamani, F. Diversity and distribution of winter phytoplankton in the Arabian Gulf and the sea of Oman. Cont. Shelf Research 2016, 119, 85–99. [Google Scholar] [CrossRef]
  68. Yang, M.; Khan, F.A.; Tian, H.; Liu, Q. Analysis of the Monthly and Spring-Neap Tidal Variability of Satellite Chlorophyll-a and Total Suspended Matter in a Turbid Coastal Ocean Using the DINEOF Method. Remote Sens. 2021, 13, 632. [Google Scholar] [CrossRef]
  69. Tang, D.L.; Kawamura, H.; Luis, A.J. Short-term variability of Phytoplankton blooms associated with a cold eddy in the northeastern Arabian Sea. Remote Sens. Environ. 2002, 81, 82–89. [Google Scholar] [CrossRef]
  70. Tang, D.L.; Kawamura, H.; Lee, M.A.; Dien, T.V. Seasonal and spatial distribution of chlorophyll-a concentrations and water conditions in the Gulf of Tonkin, South China Sea. Remote Sens. Environ. 2003, 85, 475–483. [Google Scholar] [CrossRef]
  71. Yi, Y.; Xing, X.; Liu, H.; Yuana, Y.; Wanga, Y.; Chai, F. The variability of chlorophyll-a and its relationship with dynamic factors in the basin of the South China Sea. J. Mar. Syst. 2019, 200, 103230. [Google Scholar] [CrossRef]
  72. Tang, S.; Dong, Q.; Liu, F. Climate-driven chlorophyll-a concentration interannual variability in the South China Sea. Theor. Appl. Climatol. 2011, 103, 229–237. [Google Scholar] [CrossRef]
  73. Boyce, D.G.; Dowd, M.; Lewis, M.R.; Worm, B. Estimating global chlorophyll changes over the past century. Prog. Oceanogr. 2014, 122, 163–173. [Google Scholar] [CrossRef]
  74. Prakash, P.; Prakash, S.; Rahaman, H.; Ravichandran, M.; Nayak, S. Is the trend in chlorophyll-a in the Arabian Sea decreasing? Geophys. Res. Lett. 2012, 39, L23605. [Google Scholar] [CrossRef]
  75. Dey, S.; Singh, R.P. Comparison of chlorophyll distributions in the northeastern Arabian Sea and southern Bay of Bengal using IRS-P4 Ocean Color Monitor data. Remote Sens. Environ. 2003, 85, 424–428. [Google Scholar] [CrossRef]
  76. Shanthi, R.; Poornima, D.; Raja, K.; Sarangi, R.K.; Saravanakumar, A.; Thangaradjou, T. Inter-annual and seasonal variations in hydrological parameters and its implications on chlorophyll a distribution along the southwest coast of Bay of Bengal. Acta Oceanol. Sin. 2015, 34, 94–100. [Google Scholar] [CrossRef]
  77. Devi, K.N.; Sarangi, R.K. Monitoring of monthly scale chlorophyll concentration variability in the Bay of Bengal and Arabian Sea using MODIS Aqua Satellite Data. J. Geomat. 2023, 17, 1–10. [Google Scholar] [CrossRef]
  78. Zhao, N.; Zhang, G.; Zhang, S.; Bai, Y.; Ali, S.; Zhang, J. Temporal-spatial distribution of chlorophyll-a and impacts of environmental factors in the Bohai sea and yellow sea. IEEE Access 2019, 7, 160947–160960. [Google Scholar] [CrossRef]
  79. Zhu, Q.; He, X.; Pan, D.; Fang, G.; Frouin, R.J.; Yoo, H.R.; Won, J.-S.; Feng, A. Climatology and long-time change of the sea surface temperature and chlorophyll concentration in East China Seas. In Proceedings of the Remote Sensing of the Coastal Ocean, Land, and Atmosphere Environment, Incheon, Republic of Korea, 11–14 October 2010; p. 310012. [Google Scholar] [CrossRef]
  80. Bordbar, M.H.; Nasrolahi, A.; Lorenz, M.; Moghaddam, S.; Burchard, H. The Persian Gulf and Oman Sea: Climate variability and trends inferred from satellite observations. Estuar. Coast. Shelf Sci. 2024, 296, 108588. [Google Scholar] [CrossRef]
  81. Doney, S.; Ruckelshaus, M.; Duffy, J.E.; Barry, J.P.; Chan, F.; English, C.A.; Galindo, H.M.; Grebmeier, J.M.; Hollowed, A.B.; Knowlton, N.; et al. Climate Change Impacts on Marine Ecosystems. Annu. Rev. Mar. Sci. 2012, 4, 11–37. [Google Scholar] [CrossRef]
  82. Henson, S.; Beaulieu, C.; Lampitt, R. Observing climate change trends in ocean biogeochemistry: When and where. Glob. Change Biol. 2016, 22, 1561–1571. [Google Scholar] [CrossRef]
  83. Singh, R.P.; Chaturvedi, P. Comparison of chlorophyll concentration in the Bay of Bengal and the Arabian Sea using IRS-P4 OCM and MODIS Aqua. Indian J. Mar. Sci. 2010, 39, 334–340. [Google Scholar]
  84. Poddar, S.; Chacko, N.; Swain, D. Estimation of chlorophyll-a in northern coastal Bay of Bengal using Landsat-8 OLI and Sentinel-2 MSI sensors. Front. Mar. Sci. 2019, 6, 598. [Google Scholar] [CrossRef]
  85. Cheng, J.; Liu, Z.; Zhang, S.; Liu, W.; Dong, L.; Liu, P.; Li, H. Reduced interdecadal variability of Atlantic Meridional Overturning Circulation under global warming. Proc. Natl. Acad. Sci. USA 2016, 113, 3175–3178. [Google Scholar] [CrossRef]
  86. Zhu, X.; Dong, W.; Wei, Z.; Guo, Y.; Gao, X.; Wen, X.; Yang, S.; Zheng, Z.; Yan, D.; Zhu, Y.; et al. Multi-decadal evolution characteristics of global surface temperature anomaly data shown by observation and CMIP5 models. Int. J. Climatol. 2018, 38, 1533–1542. [Google Scholar] [CrossRef]
  87. Al-Senafi, F. Atmosphere-Ocean Coupled Variability in the Arabian/Persian Gulf. Front. Mar. Sci. 2022, 9, 809355. [Google Scholar] [CrossRef]
  88. Lough, J.M. Small change, big difference: Sea surface temperature distributions for tropical coral reef ecosystems, 1950–2011. J. Geophys. Res. Ocean. 2012, 117, 1950–2011. [Google Scholar] [CrossRef]
  89. Chaidez, V.; Dreano, D.; Agusti, S.; Duarte, C.M.; Hoteit, I. Decadal trends in Red Sea maximum surface temperature. Sci. Rep. 2017, 7, 8144. [Google Scholar] [CrossRef] [PubMed]
  90. Hereher, M.E. Assessment of climate change impacts on sea surface temperatures and sea level rise-The Arabian Gulf. Climate 2020, 8, 50. [Google Scholar] [CrossRef]
  91. Fox-Kemper, B.; Hewitt, H.T.; Xiao, C.; Aðalgeirsdóttir, G.; Drijfhout, S.S.; Edwards, T.L.; Golledge, N.R.; Hemer, M.; Kopp, R.E.; Krinner, G.; et al. Ocean, Cryosphere and Sea Level Change. In Climate Change 2021: The Physical Science Basis; Contribution of Working Group I to the Sixth Assessment Report of the Intergovernmental Panel on Climate Change; Masson-Delmotte, V., Zhai, P., Pirani, A., Connors, S.L., Péan, C., Berger, S., Caud, N., Chen, Y., Goldfarb, L., Gomis, M.I., et al., Eds.; Cambridge University Press: Cambridge, UK; New York, NY, USA, 2011; pp. 1211–1362. [Google Scholar] [CrossRef]
  92. Muhammad, S.; Memon, A.A.; Muneeb, M.; Ghauri, B. Seasonal and spatial patterns of SST in the northern Arabian Sea during 2001–2012. Egypt. J. Remote Sens. Space Sci. 2016, 19, 17–22. [Google Scholar] [CrossRef]
  93. Mohan, S.; Mishra, S.K.; Sahany, S.; Behera, S. Long-term variability of Sea Surface Temperature in the Tropical Indian Ocean in relation to climate change and variability. Glob. Planet. Change 2021, 199, 103436. [Google Scholar] [CrossRef]
  94. Rhein, M.; Rintoul, S.; Aoki, S.; Campos, E.; Chambers, D.; Feely, R.; Gulev, S.; Johnson, G.; Josey, S.; Kostianoy, A.; et al. Observations: Ocean. In Climate Change 2013: The Physical Science Basis; Contribution of Working Group I to the Fifth Assessment Report of the Intergovernmental Panel on Climate Change; Stocker, T., Qin, D., Plattner, G.K., Tignor, M., Allen, S., Boschung, J., Nauels, A., Xia, Y., Bex, V., Midgley, P., Eds.; Cambridge University Press: Cambridge, UK; New York, NY, USA, 2013; pp. 255–316. [Google Scholar]
  95. Field, C.; Barros, V.; Dokken, D.; Mach, K.; Mastrandrea, M.; Bilir, T.; Chatterjee, M.; Ebi, K.; Estrada, Y.; Genova, R.; et al. IPCC, 2014. In Climate Change 2014: Impacts, Adaptation, and Vulnerability. Part A: Global and Sectoral Aspects; Contribution of Working Group II to the Fifth Assessment Report of the Intergovernmental Panel on Climate Change; Cambridge University Press: Cambridge, UK; New York, NY, USA, 2014; p. 1132. [Google Scholar]
  96. Vipin, P.; Sarkar, K.; Aparna, S.G.; Shankar, D.; Sarma, V.V.S.S.; Gracias, D.G.; Krishna, M.S.; Srikanth, G.; Mandal, R.; Rao, E.P.R. Evolution and Sub-Surface Characteristics of a Sea Surface Temperature Filament and Front in the Northeastern Arabian Sea during November– December 2012. J. Mar. Syst. 2015, 150, 1–11. [Google Scholar] [CrossRef]
  97. Saraceno, M.; Provost, C.; Piola, A.R. On the Relationship between Satellite-Retrieved Surface Temperature Fronts and Chlorophyll a in the Western South Atlantic. J. Geophys. Res. Ocean. 2005, 110, C11. [Google Scholar] [CrossRef]
  98. Taylor, K.E.; Stouffer, R.J.; Meehl, G.A. An overview of CMIP5 and the experiment design. Bull. Am. Meteorol. Soc. 2012, 93, 485–498. [Google Scholar] [CrossRef]
  99. Lan, Y.C.; Lee, M.A.; Liao, C.H.; Lee, K.T. Copepod community structure of the winter frontal zone induced by the Kuroshio branch current and the China coastal current in the Taiwan Strait. J. Mar. Sci. Technol. 2009, 17, 1–6. [Google Scholar] [CrossRef]
  100. Ye, H.; Kalhoro, M.A.; Morozov, E.; Tang, D.L.; Wang, S.; Thies, P.R. Increased chlorophyll-a concentration in the South China Sea caused by occasional sea surface temperature fronts at peripheries of eddies. Int. J. Remote Sens. 2018, 29, 4360–4375. [Google Scholar] [CrossRef]
  101. Alemany, D.; Acha, E.M.; Iribarne, O.O. Marine Fronts are Important Fishing Areas for Demersal Species at the Argentine Sea (Southwest Atlantic Ocean). J. Sea Res. 2014, 87, 56–67. [Google Scholar] [CrossRef]
  102. Bopp, L.; Resplandy, L.; Orr, J.; Doney, S.; Dunne, J.; Gehlen, M.; Halloran, P.; Heinze, C.; Ilyina, T.; Séférian, R. Multiple stressors of ocean ecosystems in the 21st century: Projections with CMIP5 models. Biogeosciences 2013, 10, 6225–6245. [Google Scholar] [CrossRef]
  103. Unnikrishnan, A.S.; Shankar, D. Are sea-level-rise trends along the coasts of the north Indian Ocean consistent with global estimates? Glob. Planet. Change 2007, 57, 301–307. [Google Scholar] [CrossRef]
  104. Sreeraj, P.; Swapna, P.; Krishnan, R.; Nidheesh, A.G.; Sandeep, N. Extreme Sea level rise along the Indian Ocean coastline: Observations and 21st century projections. Environ. Res. Lett. 2022, 17, 114016. [Google Scholar] [CrossRef]
  105. Han, W.; Meehl, G.A.; Rajagopalan, B.; Fasullo, J.T.; Hu, A.; Lin, J.; Large, W.G.; Wang, J.W.; Quan, X.W.; Trenary, L.L.; et al. Patterns of Indian ocean sea-level change in a warming climate. Nat. Geosci. 2010, 3, 546–550. [Google Scholar] [CrossRef]
  106. Shafeeque, M.; George, G.; Akash, S.; Smitha, B.R.; Shah, P.; Balchand, A.N. Interannual variability of chlorophyll-a and impact of extreme climatic events in the South Eastern Arabian Sea. Reg. Stud. Mar. Sci. 2021, 48, 101986. [Google Scholar] [CrossRef]
  107. Chinta, V.; Kalhoro, M.A.; Liang, Z.; Tahir, M.; Song, G.; Zhang, W. Decadal climate variability of chlorophyll-a in response to different oceanic factors in the Western Indian Ocean: The sea of Oman. Clim. Dyn. 2024, 62, 8675–8690. [Google Scholar] [CrossRef]
  108. Wang, G.; Li, J.; Wang, C.; Yan, Y. Interactions among the winter monsoon, ocean eddy and ocean thermal front in the South China Sea. J. Geophys. Res. 2012, 117, C08002. [Google Scholar] [CrossRef]
  109. Kemp, A.C.; Horton, B.P.; Donnelly, J.P.; Mann, M.E.; Vermeer, M.; Rahmstorf, S. Climate related sea-level variations over the past two millennia. Proc. Natl. Acad. Sci. USA 2011, 108, 11017–11022. [Google Scholar] [CrossRef]
  110. Meng, L.; Zhuang, W.; Zhang, W.; Ditri, A.; Yan, X. Decadal Sea level variability in the Pacific Ocean: Origins and climate mode contributions. J. Atmos. Ocean. Technol. 2019, 36, 689–698. [Google Scholar] [CrossRef]
Figure 1. Map of the study area (Arabian Sea), showing the coastlines of Pakistan and India, including the Indus River Delta and the Balochistan coastal region (Source: https://www.gebco.net/data-products/gridded-bathymetry-data (accessed on 2 June 2025)).
Jmse 13 01170 g001
Figure 2. Monthly mean sea-surface temperature maps with contour lines (standard deviation) showing regions for the Indus River (24.0° N, 67.5° E) and Balochistan region (24.8° N, 61–65.5° E) from 1982–2022 in the Arabian Sea.
Jmse 13 01170 g002
Figure 3. (ad) EOF modes’ spatial variability of the SST (°C) in the Arabian Sea. (e) EOF modes’ time series variability of the SST (°C) from 1982–2022 in the Arabian Sea.
Jmse 13 01170 g003
Figure 4. Monthly mean Chlorophyll-a (mg/m3) maps, Indus River region (24.0° N, 67.5° E) and the Balochistan region (24.8° N, 61–65.5° E) from 1998–2022 in the Arabian Sea.
Jmse 13 01170 g004
Figure 5. (ad) EOF modes’ spatial variability of Chl-a (mg/m3) in the Arabian Sea. (e) EOF Chl-a (mg/m3) modes’ temporal variability in the Arabian Sea.
Jmse 13 01170 g005
Figure 6. Maps showing the negative and positive spatial correlations between the PDO and Chl-a (mg/m3) (a), the SST (oC) (b), and the SLA (cm) (c), and between the AMO and Chl-a (d), the SST (e), and the SLA (f).
Jmse 13 01170 g006
Figure 7. The annual variation in oceanic climatic parameters, including the SLA (cm), Chl-a (mg/m3), the SST (°C), the SST GM (°C/km), and the decadal PDO and AMO indices during last four decades in the Arabian Sea.
Jmse 13 01170 g007
Figure 8. Monthly average of Chl-a (mg/m3), SST (°C), SST GM (°C/km), and SLA (cm) and the linear correlations among those variables during the study period in the Arabian Sea.
Jmse 13 01170 g008
Figure 9. Decadal trend maps indicating the regional intensity of the SST (°C) (a) and Chl-a (mg/m3) (b) in the Arabian Sea.
Jmse 13 01170 g009
Disclaimer/Publisher’s Note: The statements, opinions and data contained in all publications are solely those of the individual author(s) and contributor(s) and not of MDPI and/or the editor(s). MDPI and/or the editor(s) disclaim responsibility for any injury to people or property resulting from any ideas, methods, instructions or products referred to in the content.