Abstract
Real-time estimation of fish growth offers multiple benefits in indoor aquaculture, including reduced labor, lower operational costs, improved feeding efficiency, and optimized harvesting schedules. This study presents a low-cost, vision-based method for estimating the body length and weight of olive flounder (Paralichthys olivaceus) in tank environments. A 5 × 5 cm reference grid is placed on the tank bottom, and images are captured using two fixed-position RGB smartphone cameras. Pixel measurements from the images are converted into millimeters using a calibrated pixel-to-length relationship. The system calculates fish length by detecting contour extremities and applying Lagrange interpolation. Based on the estimated length, body weight is derived using a power regression model. Accuracy was validated using both manual length measurements and Bland–Altman analysis, which indicated a mean bias of −0.007 cm and 95% limits of agreement from −0.475 to +0.462 cm, confirming consistent agreement between methods. The mean absolute error (MAE) and mean squared error (MSE) were 0.11 cm and 0.025 cm2, respectively. While optimized for benthic species such as olive flounder, this system is not suitable for free-swimming species. Overall, it provides a practical and scalable approach for non-invasive monitoring of fish growth in commercial indoor aquaculture.
1. Introduction
Effective aquaculture management depends on the ability to precisely estimate fish biomass and body length throughout the production cycle [1,2]. Typically, biomass is calculated by counting the number of fish in a given volume of water and multiplying it by their average weight [1]. In South Korea, this process is often carried out manually, with farmers measuring the length and weight of fish taken from tanks or cages. However, handling the fish in this way can be stressful for them and may cause physical injuries, which in turn can hinder growth and affect welfare [3,4]. Manual measurement also tends to be labor-intensive and time-consuming. Accurate biomass data helps farmers decide how much to feed each day, reducing the chances of overfeeding or underfeeding [5]. Monitoring fish size also allows for better control over growth trends and enables the development of feeding plans that reduce waste and help keep the water clean [6]. Consistently gathering this information is key to managing stocking densities and determining when to harvest [7].
Camera-based technology has been applied to noninvasively measure fish behavior, morphology, size, and mass [8]. These tools include single-camera systems operating in the visible to near-infrared range, acoustic imaging techniques using high-frequency multibeam sonar, stereovision systems combining two visible-range cameras, and LiDAR systems employing electromagnetic radiation across the ultraviolet, visible, and infrared spectra [8]. Each approach has strengths and limitations concerning accuracy, system complexity, and applicability to aquacultural environments.
Among these, stereovision systems have been emphasized for their ability to directly reconstruct three-dimensional (3D) information and achieve high measurement precision. However, Shi et al. [9] demonstrated that a binocular stereovision-based method suffers from reduced accuracy due to measurement point errors caused by long distances and poor angular alignment between the fish and cameras, despite integrating hardware and software solutions [9]. Similarly, Tonachella et al. [10] proposed a low-cost and precise fish-length estimation method using a stereoscopic camera combined with deep learning algorithms (You Only Look Once v. 4 and the convolutional neural network), achieving a mean error of ±1.15 cm. Nevertheless, the validation was conducted using plastic fish models rather than live fish, raising concerns about its applicability in real aquacultural settings.
In addition to these efforts, several studies have explored alternative approaches to improve the estimation of fish size and mass without fully implementing stereovision systems. Al-Jubouri et al. [11] demonstrated the feasibility of using dual orthogonal cameras to measure the length of small fish in a laboratory setting. However, the method requires fish to pass directly through the center of the field of view of the camera, resulting in a prolonged experimental duration and sensitivity to lighting variation. Although automatic synchronization was introduced, the need for dual-camera calibration and reliance on specific swimming behavior limits the scalability and robustness of the system in real-time monitoring.
Similarly, Hao et al. [12] developed an automated method for tail fin removal to improve mass prediction accuracy using a 2D image analysis and partial least squares regression. However, the method heavily depends on controlled experimental conditions, off-line processing, and species-specific model tuning, restricting its practical applicability in real-world aquacultural settings.
These approaches require fixed imaging conditions and extensive preprocessing (e.g., background subtraction and coordinate transformations) and involve complex system setups and maintenance. Therefore, simple, low-cost, real-time vision systems that directly measure the morphological traits of fish in operational aquacultural environments are necessary, particularly in indoor farming systems.
This study develops a prototype mobile vision system for real-time fish-length estimation to address these challenges, targeting the olive flounder (Paralichthys olivaceus) reared in indoor aquaculture farms. The system is designed as a low-cost, noninvasive solution to monitor fish growth continuously without manual sampling. This study compares the actual lengths of olive flounders with those estimated using an image processing algorithm applied in the rearing environment. Based on the estimated length, the relationship between the length and weight is established to estimate the body weight indirectly.
2. Materials and Methods
2.1. Data Acquisition
Figure 1 presents an overview of the experimental environment and system for image data acquisition, comprising a sketch (right) and photograph (left) of the experimental environment and system. This experimental environment was set up following the techniques used by Mane and Yangandul [13] with some modifications.
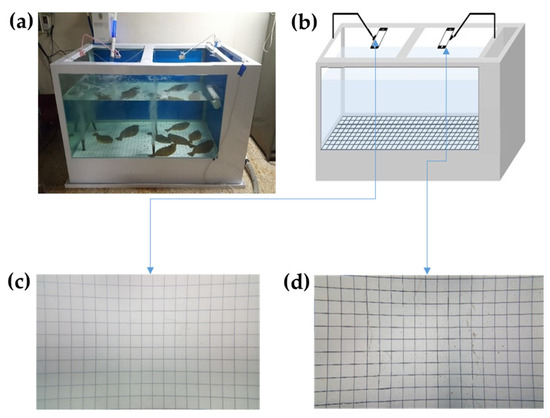
Figure 1.
Experimental environment and image acquisition system: (a) photograph of the tank and camera setup, (b) schematic diagram of the vision-based length estimation workflow, (c) reference grid image captured from the left camera, (d) reference grid image captured from the right camera.
A water tank (2300 × 1195 × 1200 mm, 3.3 m3) was constructed in a laboratory at Chonnam National University (Yeosu, Republic of Korea), containing a 5 × 5 cm grid bottom marked by black vertical and horizontal lines, run in seawater for 72 h. A small-scale recirculating aquaculture system was used, which included a water-cooling unit (model DA-2000-LW, Daeil, Busan, Republic of Korea) and a pair of heating devices (model TLW-A50-2kW, Dongwha Electronics, Busan, Republic of Korea) to maintain stable water temperatures. To ensure constant oxygenation, an oxygen pump (model LP-80A, Youngnam Electronics, Busan, Republic of Korea) continuously delivered air into the system.
Two Samsung Galaxy Note 5 mobile phones (Samsung Electronics Co., Ltd., Suwon, Republic of Korea) with 32 GB memory storage, a 5.7-inch display, 1440 × 2560-pixel resolution, and a primary camera (with 16 MP, f/1.9, 28 mm (wide), ½.6”, 1.12 µm) were employed to capture images from the right and left sides of the tank. Two identical cell phone holders were applied to fix the phones above the water tank surface.
2.2. Dataset Construction
The experiment was conducted with 90 olive flounders (Paralichthys olivaceus: mean ± standard deviation—1182.8 ± 360.8 g; range—642–2313.4 g). First, the fish were anesthetized in a seawater solution containing 100 mgL−1 of ethyl-3-aminobenzoate methane sulfonate (MS222; Sigma-Aldrich Inc., St. Louis, MI, USA) for 3 to 4 min. Then, the fish were put on an electronic scale and a measuring board to measure their weight and length accurately. These values were recorded as the actual length (cm), measured manually on a measuring board. The vision system was used to derive an estimated length (cm). This estimated length was then compared with the actual length to assess the accuracy and bias of the vision-based measurement system.
For image collection, the flounders were divided into groups of 10 and sequentially introduced into the tank. This method minimized overlap between individuals and allowed natural spacing during recording. A total of 180 images were obtained 90 from the left-side camera and 90 from the right-side camera positioned above the water tank, with one image captured per group from each side.
Figure 2 presents the length–weight distribution of the sampled olive flounders, showing a typical power-law relationship (R2 = 0.8425) commonly observed in fish biometric studies. The consistent pixel spacing of the grid allowed for scalable image acquisition. Additional images were also captured from the right-side camera to increase dataset diversity when needed.
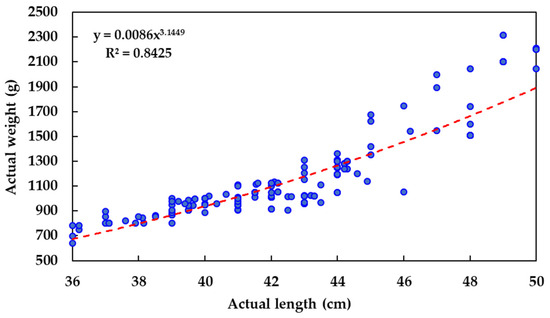
Figure 2.
Scatterplot of the relationship between actual measured length and body weight of olive flounder.
All animal-related procedures were conducted under the approval of Chonnam National University’s Institutional Animal Care and Use Committee (CNU IACUC-YS-2021-6) and carried out in compliance with the institution’s ethical standards and national regulations for animal experimentation.
2.3. Fish Length and Weight Estimation Workflow
Figure 3 illustrates the fish-growth estimation process. A 5 × 5 cm grid was placed at the bottom of the tank to serve as a spatial reference for calibrating the fixed distance between the camera and the tank floor. Two RGB smartphone cameras were installed above the tank on the left and right sides to increase the probability of capturing fish in a non-overlapping posture. However, for the present analysis, only images from a single camera (typically the left-side view) were used for length estimation to maintain a consistent viewing angle and simplify processing. The grid enabled conversion from pixel units to real-world dimensions by establishing a pixel-to-centimeter relationship. The contour of the area occupied by the fish in the image was calculated by counting the number of pixels, and its length was estimated by detecting the extreme points (top, bottom, left, and right) of the contour. The captured image was transmitted in real time to a central computer via Ethernet, where it was recorded in MP4 format for 30 s during each cycle. While the dual-camera setup supported broader coverage for future integration, the current version of the system processed images from a single fixed viewpoint for each fish. All image processing steps were conducted using Python 3.9 [14] and the OpenCV library version 4.5.5 [15].
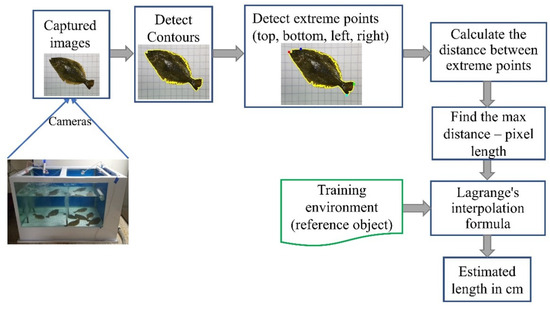
Figure 3.
Workflow of the fish-length estimation process.
2.3.1. Calculation of Location Specific Pixel Size
This method used a 5 × 5 cm grid with known real-world dimensions to derive a location-specific pixel-to-centimeter conversion, as supported in [16,17]. Due to perspective distortion in underwater images, the same object appeared with different pixel sizes depending on its position. Accordingly, a flexible pixel-size grid was implemented using horizontal and vertical 5 × 5 cm stripes. To detect the grid lines, grayscale images were processed using OpenCV’s cv2.HoughLinesP function. Pixel distances from the detected grid lines to the image edges (right and bottom) were measured. These were paired with their corresponding real-world distances (in centimeters) and stored in two reference tables: one for vertical grid lines, which recorded pixel distances from each line to the right edge of the image (reference_v), and another for horizontal grid lines, which recorded pixel distances to the bottom edge (reference_h). These tables served as pixel-to-centimeter lookup tools, customized to each fish’s location in the image.
2.3.2. Calculation of Fish Length
Reference images without fish were captured at a fixed camera height to generate the lookup tables. When fish images were recorded, the contours were extracted and the four extremities (top, bottom, left, and right) were identified.
The maximum pixel distance between these points was selected as the fish’s pixel length. This length was then converted into centimeters by interpolating the corresponding real-world distances from the reference tables (reference_v, reference_h) based on the fish’s position in the frame.
2.3.3. Boundary
The fish contour was extracted from each image using OpenCV’s cv2.findContours function. The contour with the largest area was assumed to represent the fish. From this contour, the extreme points (topmost, bottommost, leftmost, and rightmost) were identified using bounding box and pixel value comparison.
2.3.4. Identification of Contour Extremities
The smallest bounding area was identified by calculating the pixel distances from the left and right contour points to the right edge of the image. This method selected the vertical reference elements closest to these distances from the reference_v file, those greater than the distance from the left point and less than the distance from the right point to the image edge. Similarly, the top and bottom reference elements were identified using the reference_h file. These reference elements contain pixel distances and corresponding real-world distances in centimeters.
2.3.5. Pixel to Fish Body Length Translation
To convert the maximum pixel length into real-world length (in cm), Lagrange interpolation was applied using four surrounding calibration points selected from the reference tables [13,18]. The Lagrange polynomial is defined as
In this study, four nearby points were selected from the reference grid (i.e., from the reference_v and reference_h tables), and their values were used to calculate the interpolated fish length based on its pixel position. This approach allowed for high accuracy in length estimation, even in areas of the image affected by perspective distortion.
2.3.6. Validation of Length Estimation
To assess the accuracy and reliability of the estimated fish body lengths, two complementary statistical analyses were conducted. First, a Bland–Altman analysis was applied to evaluate the agreement between the vision-based length estimates and the manual measurements. This method quantifies the level of agreement by calculating the mean difference (bias) and the 95% limits of agreement (LoA), providing a visual and statistical measure of consistency between two methods [19].
Second, to investigate whether estimation accuracy varied according to fish size, the data were divided into four body length intervals (35–40 cm, 40–45 cm, 45–50 cm, and 50–55 cm). Within each group, the mean absolute error (MAE), mean squared error (MSE), and average bias were calculated. This stratified analysis allowed for the evaluation of potential size-dependent variations in the performance of the vision-based estimation system.
2.3.7. Estimation of Fish Body Weight
Based on the estimated length, fish weight was calculated using a power model, following Lines et al. [20]:
where a, b, and c are regression parameters derived from sample measurements. The constant c was set to zero based on the assumption that a fish of zero length has zero mass.
Weight = a(length)b + c
To apply Equation (2), field data consisting of manually measured lengths and body weights of olive flounder were used to fit a power-law regression model. The resulting regression parameters were subsequently applied to the estimated lengths obtained from the vision-based system in order to predict body weight. This approach enables non-contact estimation of fish biomass using image-derived length data. The resulting regression parameters were subsequently applied to the estimated lengths obtained from the vision-based system in order to predict body weight. Because the estimated lengths were stored as integer values (in cm) during the image processing step, the predicted weights are presented at 1 cm intervals.
3. Results
3.1. Spatial Distortion Patterns in Pixel-to-Centimeter Conversion
Figure 4 presents the pixel-to-centimeter calibration results obtained through Lagrange interpolation of reference grid data. In the vertical direction (Figure 4a), the relationship between pixel position and actual distance exhibited a nearly linear pattern, with little deviation from the reference points. The average scaling factor across this axis was approximately 0.059 cm per pixel.
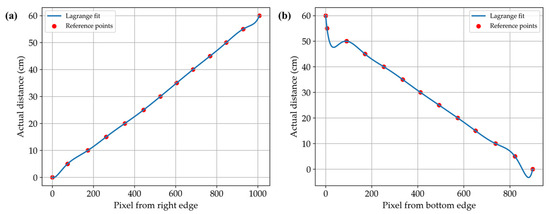
Figure 4.
Pixel-to-centimeter calibration results for the vertical (a) and horizontal (b) directions.
Conversely, the horizontal direction (Figure 4b) exhibited nonlinear scaling, with noticeable distortion at the top and bottom edges of the image. In contrast, the central region from approximately 300 to 700 pixels from the bottom maintained a relatively linear relationship.
3.2. Estimated Fish Length
Estimated fish body lengths from the vision system were similar to those manually measured with the measuring board (Figure 5): R2 = 0.995; mean error = 0.154 cm; and mean squared error (MSE) = 248. Only a very small bias existed, with the model slightly underestimating length (y = 1.01x − 0.31)
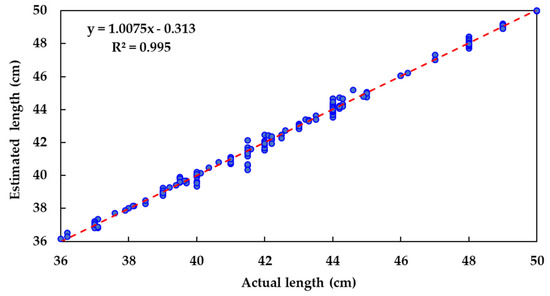
Figure 5.
Relationship between actual and estimated fish lengths.
A Bland–Altman analysis (Figure 6) showed a mean bias of −0.007 cm between the vision-based and manual length measurements, indicating no systematic over- or underestimation. The standard deviation of the residuals was 0.239 cm, and the 95% limits of agreement ranged from −0.475 cm to +0.462 cm. Most data points fell within this range, confirming consistent agreement between the two methods.
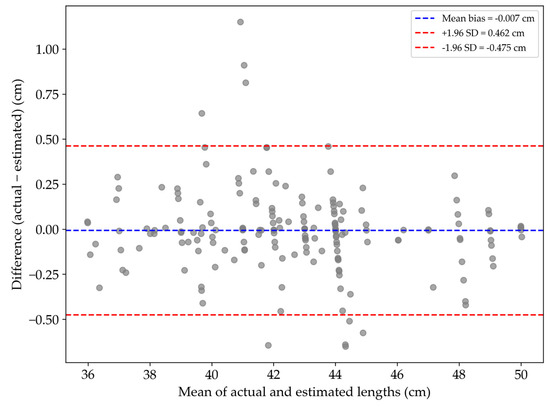
Figure 6.
Bland–Altman plot comparing actual and estimated fish lengths.
Length-wise error analysis (Table 1) showed that the mean absolute error (MAE) ranged from 0.017 cm in the 50–55 cm group to 0.177 cm in the 40–45 cm group. The bias remained within ±0.05 cm across all intervals. These results indicate that the system maintained stable accuracy regardless of fish size.

Table 1.
Error metrics of estimated fish lengths across actual length intervals.
3.3. Estimated Fish Weight
A power-law model was applied to vision-based estimated lengths to derive predicted body weights (Figure 2). As the weight estimation was mathematically derived from length, the strong correlation reflects model consistency but does not serve as independent validation. External weight measurements are required for future validation (Figure 7).
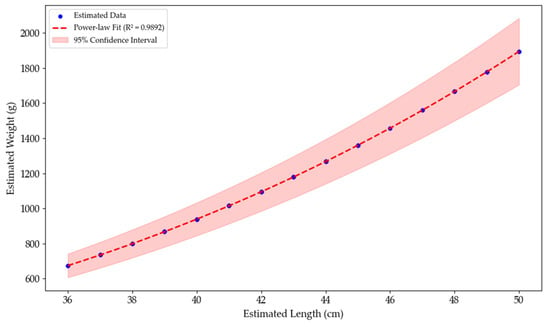
Figure 7.
Power-law regression between vision-based estimated length and estimated body weight of olive flounder.
4. Discussion
The time complexity of the length estimation algorithm in this study follows O(n2), as described by Mane and Yangandul [13], indicating that execution time increases quadratically with input size. This complexity level is efficient and acceptable, given the simplicity of the hardware configuration, comprising only a single processor and two cell phone cameras.
A grid was used as a reference object during the initial calibration phase to convert pixel measurements into real-world units. The olive flounder, a benthic species that typically resides near the tank bottom, presents minimal vertical displacement, enabling consistent pixel-to-centimeter calibration (Figure 4). Based on vertical and horizontal stripes (Figure 1c,d), this calibration process enables accurate 2D measurement by computing the perpendicular pixel distances across both axes. Once the learning environment is established and the camera position is fixed, the system can continue functioning without the grid, relying on the initial calibration parameters.
Mass estimation is critical in aquacultural management because it helps determine appropriate harvesting times and optimizes feeding strategies via feed conversion ratio calculations. However, individual variability in growth patterns and nutritional requirements, especially protein demand, which typically decreases as fish grow [21], must be considered. Estimating fish mass based on image-derived lengths provides a practical tool for adjusting feeding rates following developmental stages [22], contributing to efficient farm management.
Compared to existing systems for estimating fish size and mass, the developed prototype mobile vision system offers a practical balance between technical simplicity and measurement accuracy (Table 2). In contrast to stereovision-based or machine learning–driven approaches that often require complex calibration procedures, controlled environments, or costly equipment [12,23], the proposed system uses smartphone cameras with a grid-based pixel calibration method to perform accurate 2D length estimation in real aquacultural conditions. In Figure 4b, the correction curve along the horizontal axis exhibits pronounced curvature near the upper and lower edges of the image, indicating noticeable spatial distortion in these regions. By contrast, the vertical axis (Figure 4a) maintains an approximately linear relationship between pixel position and actual distance, suggesting minimal distortion along this direction.

Table 2.
Comparison of vision-based fish size and mass estimation methods across species, camera configurations, and algorithmic approaches.
Zhang [24] demonstrated, through empirical analysis, that image distortion varies between the central and peripheral regions, noting that lens distortion parameters are difficult to estimate accurately when calibration patterns occupy only the central area of the image. This observation suggests that the pixel-to-real-world distance ratio may vary nonlinearly as a function of distance from the image center, particularly along the vertical axis corresponding to the horizontal plane of the object.
Applying vertical and horizontal pixel-to-centimeter mapping enables reliable length measurements in indoor tanks, achieving strong regression performance (R2 = 0.995, MSE = 0.058; Figure 5). In addition, the resulting length–weight model revealed a high correlation (R2 = 0.9892), even when evaluated against expanded datasets or conventional sampling methods (Figure 7). Although Hao et al. [12] achieved high accuracy using manual tail fin removal under controlled conditions, their approach lacks scalability in real-world applications. Similarly, although Al-Jubouri et al. [11] proposed a low-cost dual-camera system, their method requires fish to swim through the center of the field of view and is sensitive to lighting. In contrast, the proposed system is noninvasive, portable, and requires minimal setup, making it suitable for commercial indoor fish farming.
Nonetheless, the current approach has some limitations. First, due to the high stocking density of the olive flounder in indoor tanks, overlapping individuals sometimes cause incomplete contour extraction and length underestimation. Although this study focused on isolated individuals, future work could improve performance in dense conditions using advanced segmentation methods, such as ellipse-fitting [25] or deep learning-based instance segmentation.
Second, the system assumes a fixed camera setup after initial calibration with the grid. Although this ensures consistent measurements, it limits flexibility in environments where the camera position could change. Real-time calibration or depth sensing technology (e.g., stereo vision or structured light) could enhance system adaptability.
Third, the current weight estimation uses a power regression model based solely on fish length. This approach does not account for individual differences in conditions or feeding behavior. Future improvements could include multivariate modeling based on the estimated volume, feeding activity, or water quality parameters (e.g., temperature and dissolved oxygen).
Finally, although the dual smartphone setup provides a cost-effective and accessible solution, automated tracking, image enhancement, and segmentation could enable continuous, long-term monitoring. With these enhancements, the system could evolve into a scalable tool for precision aquaculture, supporting the real-time assessment of fish growth, feeding efficiency, and welfare.
Nevertheless, this system is most applicable to benthic species such as olive flounder (Paralichthys olivaceus), which typically rest on the tank floor, allowing for stable imaging and length estimation. Its applicability to free-swimming or pelagic species remains limited. Additionally, in industrial aquaculture environments with high stocking densities, overlapping individuals pose challenges to contour-based identification. Although future integration with instance segmentation is a possibility, a more practical solution is to collect multiple images over time using fixed cameras or smartphones. Isolated individuals can then be sampled from these images, enabling batch-level average length and weight estimation. Given the relatively uniform size distribution within a batch, such sampling provides a reliable reference for growth monitoring.
5. Conclusions
This study proposes a simple, low-cost vision system for estimating the length and weight of olive flounders without physical contact. The fish length was calculated in real-world units using two cell phones and a grid-based reference via pixel measurements and Lagrange interpolation. The method demonstrated high accuracy (R2 = 0.994) with minimal error, and the derived length–weight model also achieved a strong correlation (R2 = 0.9604), indicating its usefulness for biomass estimation and feeding management.
The system is practical for indoor aquaculture, requiring minimal equipment and calibration. However, image quality may be affected by high stocking density or overlapping fish, limiting its performance in some real-world settings. Future work should address these challenges by incorporating advanced segmentation techniques and real-time processing to enhance accuracy and reliability under diverse conditions.
Author Contributions
Conceptualization—I.K. and P.W.P.F.; methodology—I.K., H.T.P.N. and P.W.P.F.; investigation—I.K. and P.W.P.F.; writing—original draft—I.K., H.T.P.N., P.W.P.F., H.J., S.J. and T.K.; writing—review and editing—I.K. and T.K. All authors have read and agreed to the published version of the manuscript.
Funding
This study was supported by a grant from the Korea Institute of Marine Science & Technology Promotion (KIMST), funded by the Ministry of Oceans and Fisheries (RS-2022-KS221676 and RS-2018-KS181194).
Data Availability Statement
The original contributions presented in this study are included in the article. Further inquiries can be directed to the corresponding author.
Conflicts of Interest
The authors declare no conflicts of interest.
References
- Harvey, E.; Cappo, M.; Shortis, M.; Robson, S.; Buchanan, J.; Speare, P. The accuracy and precision of underwater measurements of length and maximum body depth of southern bluefin tuna (Thunnus maccoyii) with a stereo–video camera system. Fish. Res. 2003, 63, 315–326. [Google Scholar] [CrossRef]
- Voskakis, D.; Makris, A.; Papandroulakis, N. Deep learning based fish length estimation: An application for the Mediterranean aquaculture. In Proceedings of the OCEANS 2021 Conference, San Diego–Porto, CA, USA, 20–23 September 2021; pp. 1–5. [Google Scholar] [CrossRef]
- Ashley, P.J. Fish welfare: Current issues in aquaculture. Appl. Anim. Behav. Sci. 2007, 104, 199–235. [Google Scholar] [CrossRef]
- Zhang, S.; Yang, X.; Wang, Y.; Zhao, Z.; Liu, J.; Liu, Y.; Sun, C.; Zhou, C. Automatic fish population counting by machine vision and a hybrid deep neural network model. Animals 2020, 10, 364. [Google Scholar] [CrossRef] [PubMed]
- Lopes, F.; Silva, H.; Almeida, J.M.; Pinho, C.; Silva, E. Fish farming autonomous calibration system. In Proceedings of the OCEANS 2017 Conference, Aberdeen, UK, 19–22 June 2017; pp. 1–6. [Google Scholar] [CrossRef]
- Beddow, T.A.; Ross, L.G.; Marchant, J.A. Predicting salmon biomass remotely using a digital stereo-imaging technique. Aquaculture 1996, 146, 189–203. [Google Scholar] [CrossRef]
- Li, D.; Hao, Y.; Duan, Y. Nonintrusive methods for biomass estimation in aquaculture with emphasis on fish: A review. Rev. Aquac. 2020, 12, 1390–1411. [Google Scholar] [CrossRef]
- Saberioon, M.; Císař, P. Automated within tank fish mass estimation using infrared reflection system. Comput. Electron. Agric. 2018, 150, 484–492. [Google Scholar] [CrossRef]
- Shi, C.; Wang, Q.; He, X.; Zhang, X.; Li, D. An automatic method of fish length estimation using underwater stereo system based on LabVIEW. Comput. Electron. Agric. 2020, 173, 105419. [Google Scholar] [CrossRef]
- Tonachella, N.; Martini, A.; Martinoli, M.; Pulcini, D.; Romano, A.; Capoccioni, F. An affordable and easy-to-use tool for automatic fish length and weight estimation in mariculture. Sci. Rep. 2022, 12, 15642. [Google Scholar] [CrossRef] [PubMed]
- Al-Jubouri, Q.; Al-Nuaimy, W.; Al-Taee, M.; Young, I. An automated vision system for measurement of zebrafish length using low-cost orthogonal web cameras. Aquacult. Eng. 2017, 78, 155–162. [Google Scholar] [CrossRef]
- Hao, Y.; Yin, H.; Li, D. A novel method of fish tail fin removal for mass estimation using computer vision. Comput. Electron. Agric. 2022, 193, 106601. [Google Scholar] [CrossRef]
- Mane, S.S.; Yangandul, C.G. Calculating the dimensions of an object using a single camera by learning the environment. In Proceedings of the 2016 2nd International Conference on Applied and Theoretical Computing and Communication Technology (iCATccT 2016), Bangalore, India, 21–23 July 2016; IEEE: Piscataway, NJ, USA, 2016; pp. 457–460. [Google Scholar] [CrossRef]
- Python Software Foundation. Python Language Reference, version 3.9; Python Software Foundation: Wilmington, DE, USA, 2020; Available online: https://www.python.org (accessed on 30 May 2024).
- Bradski, G. The OpenCV Library, version 4.7.0; Dr. Dobb’s Journal of Software Tools; UBM Technology Group: San Francisco, CA, USA, 2000; Available online: https://opencv.org (accessed on 30 May 2024).
- Pickle, J. Measuring length and area of objects in digital images using Analyzing Digital Images Software. Concord Acad. 2008, 14, 204–216. [Google Scholar]
- Alhasanat, M.N.; Alsafasfeh, M.H.; Alhasanat, A.E.; Althunibat, S.G. RetinaNet-based approach for object detection and distance estimation in an image. Int. J. Commun. Antenna Propag. 2021, 11, 1–9. [Google Scholar] [CrossRef]
- Roy, S.K. Lagrange’s interpolating polynomial approach to solve multi-choice transportation problem. Int. J. Appl. Math. 2015, 1, 639–649. [Google Scholar] [CrossRef][Green Version]
- Bland, J.M.; Altman, D.G. Statistical methods for assessing agreement between two methods of clinical measurement. Lancet 1986, 327, 307–310. [Google Scholar] [CrossRef]
- Lines, J.A.; Tillett, R.D.; Ross, L.G.; Chan, D.; Hockaday, S.; McFarlane, N.J.B. An automatic image-based system for estimating the mass of free-swimming fish. Comput. Electron. Agric. 2001, 31, 151–168. [Google Scholar] [CrossRef]
- Craig, S.R.; Helfrich, L.A.; Kuhn, D.; Schwarz, M.H. Understanding Fish Nutrition, Feeds, and Feeding; Virginia Cooperative Extension: Blacksburg, VA, USA, 2017. [Google Scholar]
- Okorie, O.E.; Kim, Y.C.; Kim, K.W.; An, C.M.; Lee, K.J.; Bai, S.C. A review of the optimum feeding rates in olive flounder (5 g through 525 g) Paralichthys olivaceus fed the commercial feed. Fish. Aquat. Sci. 2014, 17, 391–401. [Google Scholar] [CrossRef]
- Muñoz-Benavent, P.; Andreu-García, G.; Valiente-González, J.M.; Atienza-Vanacloig, V.; Puig-Pons, V.; Espinosa, V. Enhanced fish bending model for automatic tuna sizing using computer vision. Comput. Electron. Agric. 2018, 150, 52–61. [Google Scholar] [CrossRef]
- Zhang, Z. A flexible new technique for camera calibration. IEEE Trans. Pattern Anal. Mach. Intell. 2002, 22, 1330–1334. [Google Scholar] [CrossRef]
- Fitzgibbon, A.W.; Pilu, M.; Fisher, R.B. Direct least squares fitting of ellipses. In Proceedings of the International Conference on Pattern Recognition (ICPR), Vienna, Austria, 25–29 August 1996; Volume 1, pp. 253–257. [Google Scholar] [CrossRef]
Disclaimer/Publisher’s Note: The statements, opinions and data contained in all publications are solely those of the individual author(s) and contributor(s) and not of MDPI and/or the editor(s). MDPI and/or the editor(s) disclaim responsibility for any injury to people or property resulting from any ideas, methods, instructions or products referred to in the content. |
© 2025 by the authors. Licensee MDPI, Basel, Switzerland. This article is an open access article distributed under the terms and conditions of the Creative Commons Attribution (CC BY) license (https://creativecommons.org/licenses/by/4.0/).