Abstract
Rip currents at featureless beaches (i.e., beaches lacking sandbars or channels) are often hydrodynamically controlled, exhibiting intermittent and unpredictable behaviors that pose significant risks to recreational beach users. This study assessed occurrences of rip currents under a range of idealized morphology configurations and hydrodynamic wave forcing parameters using a wave-resolving Boussinesq-type model. Numerical experiments revealed that rip currents with durations on the time scale of 10 min are generated in the forms of vortex pairs, intensified eddies, mega-rips, and eddies shedding from longshore currents. In general, the key conditions that promote rip current formation at featureless beaches include shoreline curvature, headlands, moderately mild beach slopes (e.g., 0.02–0.03), normal or near-normal wave incidence, and large wave heights. Most importantly, this study highlights inherent uncertainties in rip current occurrences, particularly under conditions usually perceived as low risk: low wave heights, short wave periods, oblique wave incidence, and straight shorelines. These conditions can lead to transient rip currents and pose an unexpected hazard that coastal communities should be aware of.
1. Introduction
Rip currents, narrow but powerful seaward water jets originating in the surf zone, pose a significant hazard to beach users at recreational beaches [1]. Hundreds of drownings and rescues related to rip currents have been reported every year around the world (e.g., [2,3,4,5,6]). People in water once caught by a rip current, regardless of their swimming abilities, can be quickly swept into deep water where drowning usually occurs due to panic and exhaustion [7]. Rip currents are commonly categorized as morphologically controlled rips or hydrodynamically controlled rips, depending on their generation mechanisms [8]. Morphologically-controlled rips are mainly associated with variabilities of time-averaged breaking wave forcing [9] due to beach morphology features, and these processes include (i) alongshore variable bathymetry induced non-uniform breaking [10,11], (ii) offshore bathymetric anomalies induced wave focusing [12], and (iii) rigid boundaries induced wave shadowing or longshore current deflections [13,14]. On the other hand, hydrodynamic-controlled rips usually occur at featureless beaches where bathymetric features (e.g., sandbars and channels) to excite the time-averaged forcing variability are absent [8,15,16,17]. Instead, rip currents are mainly generated by purely hydrodynamic processes, including (i) individual wave-breaking induced vorticities [18,19,20], (ii) wave group or infra-gravity waves [21,22,23], and (iii) shear instability of longshore currents [24]. These rip currents, due to their unpredictable and nonstationary locations, can pose a greater potential danger to unsuspecting beach users. In view of these consequences, understanding the occurrence conditions of rip currents at featureless beaches is critical for fostering recreational beach safety and mitigating coastal hazards for coastal communities.
Occurrences of rip currents can be assessed using established empirical matrices that estimate the probability of rip currents based on beach state and hydrodynamic factors. For example, the beach state has long been recognized as a key indicator of possible rip occurrences (e.g., [3,25,26]), and it has been commonly perceived that an intermediate beach state (such as beaches with sand bars) is prone to rip currents ([27]). Based upon beach state classifications [28,29], an assessment method [5] was developed to evaluate rip current hazard using wave breaking height, wave period, sediment fall velocity, and tide range [30,31]. This approach has been successfully implemented in several rip hazard studies (e.g., [32,33,34,35,36]). Other than beach state factors, hydrodynamic factors, including nearshore wave height, direction, and period, have also been employed in a probability theory-based evaluation method [37]. An index system has further incorporated observed rip occurrence evidence from remote sensing, simulated rip current flow characteristics from hydrodynamic modeling, as well as measured rip current velocities from field surveys, optical observations, or radar measurements [33]. The efforts of conducting rip current assessments have effectively improved beach management practices and raised people’s awareness [38,39]. Nevertheless, the existing matrices are mainly developed for assessing morphologically controlled rips, such that the occurrence of hydrodynamic-controlled rip currents at featureless beaches cannot be effectively addressed.
Conditions for rip current occurrences at featureless beaches are complex and can be associated with various hydrodynamic forcing and morphology factors. Wave incidence is a key factor that distinguishes the breaking wave vorticity forcing or shear instability mechanisms for hydrodynamically controlled rip generation; nevertheless, it has been suggested that shear instability rips are relatively uncommon and only expected to occur when exposed to highly oblique incidence and high-energy waves [18]. Wave height is another important factor. Under normal incident waves, when breaking wave vorticity forcing is dominant, wave height was found to be weakly correlated with rip velocities [40], which is different from the typical perception of increasing rip velocities under larger waves for bathymetric-controlled rips [1]. It can be explained that the surf zone has reached a “saturation” of breaking such that the breaking wave forcing gradient along the wave crest is insufficient to drive vorticity generation [41]. In addition to hydrodynamic factors, the influence of beach slope has also been studied. Shallower slopes have been found to promote transient rip currents under normal-incidence swell waves [15], whereas steeper beaches tend to favor rip generation under low-steepness waves [16]. Furthermore, embayed shorelines have been shown to promote the formation of mega-rips with large-scale circulating flow patterns [42], as headlands can obstruct high-angle incident waves and enforce the merging of surf zone eddies [43]. In short, while previous studies have provided important insights into the effects of key forcing factors and the behavior of hydrodynamically controlled rip currents, the combined influence of these factors and their impact on rip currents occurrences at featureless beaches remain to be systematically investigated.
Numerical models have been employed as an effective tool for studying rip currents, which are primarily simulated by two approaches: wave-averaging and wave-resolving models. Wave-averaging models solve the Reynolds-averaged Navier–Stokes (RANS) equations, incorporating a wave forcing term derived from spectrum wave models and expressed as radiation stress [9] or vortex-force formulations [44,45]. Wave-averaging models such as ROMS [42,46,47], COAWST [48], Delft3D [49,50,51], and SCHISM [52,53,54] have successfully simulated rip currents. Nevertheless, since wave-averaging may underestimate vorticity production due to individual wave crest breaking or wave group/infragravity waves and the resulting formation of hydrodynamically controlled rip currents [55]. On the other hand, wave-resolving models are capable of providing a more comprehensive representation of rip current generation mechanisms [15]. Wave-resolving models, such as wave-group resolving model XBEACH (e.g., [35,37,43,56,57,58,59,60,61]), Boussinesq model FUNWAVE (e.g., [16,34,62,63,64,65,66]), models based on the fully nonlinear mild-slope equation [67], higher-order Boussinesq equation [68,69], or Smoothed Particle Hydrodynamics (SPH) method [70], as well as non-hydrostatic models CROCO ([71]) and NHWAVE [72,73], have been widely employed to assess rip current occurrence. A brief summary of the recently published literature on numerical modeling of rip currents is provided in Table S1. In view of this, wave-resolving models are well suited for assessing the occurrences and characteristics of hydrodynamically controlled rips at featureless beaches.
This paper aims to systematically assess occurrences of rip currents at featureless beaches under a range of idealized morphology configurations and hydrodynamic forcing factors. Numerical experiments were conducted using a depth-averaged wave-resolving Boussinesq-type model, FUNWAVE-TVD. The effects of beach morphology (i.e., shoreline configurations and beach slopes) in combination with different wave parameters (i.e., wave incidence angles, wave heights, and wave periods) on rip occurrences were investigated. Our results revealed that rip currents with durations on the time scale of 10 min can occur in the forms of vortex pairs, intensified eddies, mega-rips, and eddies shedding from longshore currents. In general, the key conditions to promote rip current formation at featureless beaches include shoreline curvature, headlands, moderately mild beach slopes (e.g., 0.02–0.03), normal or near-normal wave incidence, and larger wave heights (e.g., Hs > 0.8 m). Most importantly, inherent uncertainties in rip current occurrences were noticed in transient rips generated under low wave heights, short wave periods, oblique wave incidence, and at straight shorelines. These conditions are usually perceived as low risk, thus highlighting an unexpected hazard that coastal communities should be aware of.
2. Materials and Methods
2.1. FUNWAVE-TVD Model
The Boussinesq-type wave model FUNWAVE-TVD (total variation diminishing version of the fully nonlinear Boussinesq wave model) was employed in this study to simulate rip currents at featureless beaches. The FUNWAVE-TVD is developed by [74] based on the initial version of [75]. Depth-averaged current velocities (u,v) and surface elevations (η) are solved using fully nonlinear Boussinesq equations [76,77]. In FUNWAVE-TVD, nearshore hydrodynamics are forced by irregular directional waves using a spectrum wave maker adjacent to the offshore boundary. The wave maker is expressed in the mass conservation equation as a source term C [74,78]:
where x, y represents the cross-shore and alongshore distance, β is a free parameter describing the width of the wave maker, and F is the time series of the source function formulated as:
in which the subscript i corresponds to the wave component index and Di is the source function amplitude for each wave component [78]. Note that each wave component in the discretized spectrum is represented by a single index, such that the number of frequency components is equal to that of directional components. In this way, coherent waves that can lead to stationary wave interference and result in longshore variations of wave heights at a longshore uniform topography can be effectively eliminated. Irregular waves are constructed using the TMA frequency spectrum [79] and the wrapped normal directional spreading function with random phases.
2.2. Numerical Experiments
Numerical experiments were conducted in a model domain of 512 m in the cross-shore (x) direction and 500 m in the longshore (y) direction, with periodic alongshore boundary conditions. The model was discretized in rectangular grids with a spacing of dx = 1 m in the cross-shore and dy = 2 m in the longshore direction, which was validated to be capable of resolving rip currents while maintaining computational efficiency by a sensitivity test (Table S2). The three shoreline configurations shown in Figure 1 were used to examine the effect of shoreline curvature and presence of headlands on rip current occurrences. Figure 1a is a straight shoreline beach (denoted as beach S in this paper), which consists of a constant slope region with a beach slope SLP for x < 400 m and an offshore flat region with a constant depth h for x > 400 m. Figure 1b,c are respectively a curved shoreline beach (denoted as beach C) and the same curved beach but bounded by headlands on the two ends (denoted as beach H). Beach C and H have the same beach bathymetry, and they also have the same depth profile at the beach center where y = 250 m (labeled as transect 1) as that at beach S. For the three bathymetry configurations exhibited in Figure 1, the SLP is 0.03 and the constant depth h is 13 m. Additional bathymetric configurations with different values of SLP and depth h used in this study (see Exp 1 in Table 1) are provided in Figure S1. The shoreline curvature k is defined, based on the parabolic bay shape model [80], as the ratio of embayment width and the shoreline length, and a k of 0.25 was used for beach C and H. To avoid abrupt bathymetric changes due to the shoreline curvature, the beach slopes at Beach C and H are set to uniformly increase towards the two ends, as exhibited by the depth profiles of transects 2 and 3 (see the grey lines in Figure 1b,c). The two headlands at beach H are configured as reflective obstacles with a width of 10 m and a length of 200 m in the model. The wave maker is located at x = 425 m (see red boxes in Figure 1) and the width of the wave maker (w) is set to be 1/4 of the wavelengths. A sponge layer of 60 m is placed near the offshore boundary behind the wave maker to eliminate spurious wave reflections.
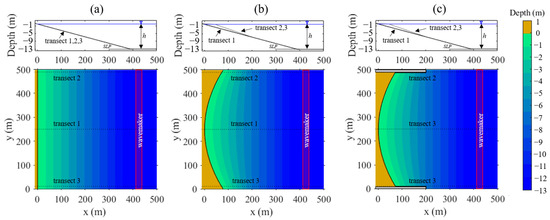
Figure 1.
Model domain of three beaches with different shoreline configurations. (a) a straight shoreline beach (beach S), (b) a curved shoreline beach with no headland (beach C), and (c) a curved shoreline beach bounded by two headlands (denoted as beach H). The depth profiles at transect 1 (y = 250 m) are plotted in black lines, and the two transects 2, 3 (y = 490 m and y = 10 m) are plotted in grey lines. The red box near x = 425 m represents the location of the wave maker.

Table 1.
Summary of incident wave parameters, beach slopes of the numerical experiments, and the corresponding non-dimensional parameters and wavelength.
A total of 144 numerical simulations were performed under a range of incident wave angles (θ = 0, 15, 30, 45°), significant wave height (Hs = 0.4, 0.6, 0.8, 1.0, 1.2 m), peak wave period (Tp = 6, 8, 10, 12 s), as well as a range of beach slopes (SLP = 0.015, 0.02, 0.03, 0.05) for the three shoreline configurations (Beach S, C, H). As shown in Table 1, the input parameters and the corresponding wavelength (λ) and non-dimensional parameters including the amplitude to depth ratio (a/h), the product of wave number and depth (kh), and Ursell number (Ur) were calculated to ensure the generated wave conditions are in the valid range of the Boussinesq wave maker in FUNWAVE-TVD to generate the requested random directionally spread waves [81,82]. Specifically, it is required that λ is at least twice the water depth, a/h is small, kh is smaller than π, and Ur is smaller than 0.12. In this paper, the incident wave angle is the angle between an onshore wave incidence and the cross-shore (x) direction, such that θ = 0° means a normal wave incidence. Frequencies are discretized into 1125 bins of equal energy between fmin = 0.04 s−1 and fmax = 0.5 s−1. Wave directional spread (σθ) and the wave spectrum TMA parameter (γTMA) were set to be constant at 10° and 5, respectively. The γTMA is used to adjust the frequency band width, and a small γTMA means a broadband frequency spectrum and vice versa. Considering that the wave maker generates irregular wave components using a random set of phases, the phase information was saved to enforce the exact same incident wave forcing for the three different shoreline configurations. In addition, each experiment was repeated 10 times using the same incident wave parameters but with different randomly generated phases. Each simulation was set to run for 3600 s from a cold start (i.e., u, v and η set to zero) with a spin-up period of 1200 s, when an equilibrium was validated to be reached (see Figure S2). The other setups followed the previous work [65,66,74] in which the simulated rip current velocities were validated to be consistent with field measurements. Specifically, the adaptive time step based on the Courant–Friedrichs–Lewy (CFL) criterion [74] was used, and the Courant number was set to be 0.5, leading to the time step on the order of 10−2 s. A fixed bottom friction coefficient (Cd) was set to be 0.002. For wave breaking, the shock–capturing scheme [74,83] that has been verified with comparable skill to the artificial eddy viscosity formulation [84] was employed.
2.3. Rip Current Identification and Characterization
Identifying rip currents from the model outputs was conducted using a 1 min average velocity field at 1 min intervals. Note that the 1 min averaging acts as a low-pass filter to remove the oscillating velocities from individual wave orbital motions. This study followed the work by [15] to only consider rip currents that last longer than 2 min, which was sufficient to resolve rip currents including those hydrodynamically controlled rips with relative short durations (i.e., 2–5 min [1]).
A two-step procedure for rip current identification is as follows: First, at each model output time step, rip current flow regions were identified to consist of a set of connected gird points that met the following criteria: (i) the velocity’s offshore component exceeds 0.5 m/s, a threshold based on established hazardous rip current speeds [1]; (ii) the velocity’s offshore component is greater than the alongshore component, i.e., flow direction is within 45° to the x-axis; (iii) the area of the rip current flow region, calculated as the summed area of connected grids that meet (i) and (ii), exceeds 100 m2, a spatial extent threshold determined from trial-and-error to ensure consistency with human perceptions. Second, the identified rip current flow regions were then tracked over time. A rip current occurrence was identified to consist of a set of rip current flow regions that met the following criteria: (iv) the displacement of the rip current flow region’s center in one time step is within 90° to the x-axis or 90° to the rip flow direction (calculated as the mean flow direction of grid points in the same rip current flow region that meet (i) and (ii)); and (v) the duration of a rip current occurrence exceeds a minimum threshold of 2 min. Note that the aforementioned thresholds and criteria were selected with reference to previous studies [1,15] and were further adjusted by trial-and-error using data from this study. The identified rip currents were also manually verified in plotted current fields to ensure consistency with human perceptions of a narrow offshore-directed water jet.
The characteristics of the identified rip currents were quantified using the following five parameters. The number of rip occurrences (nrip) was counted within the 40 min analysis period of each simulation run. For each rip current occurrence, the maximum rip velocity (Umax), defined as the largest offshore-directed velocity (i.e., x-component), served as a measure of rip current strength, with higher values indicating stronger rip currents. Another strength indicator was the offshore extent (ΔX), calculated as the maximum distance of a rip current flow region’s center from the shoreline (x = 0 m), where greater distances reflected stronger rips. The duration (ΔT) of each rip occurrence, measured between starting and ending time steps, represented the temporal scale, while the rip current width (ΔY), calculated as the average cross-shore extent (i.e., y-direction) of the rip current flow region, characterized the spatial scale. When multiple rip occurrences were identified (i.e., nrip > 1) in a simulation run, the maximum Umax value and the average values of ΔX, ΔT, ΔY were used along with the nrip as the five quantitative measures of rip responses to different incident wave and beach morphology conditions. Additionally, two probability measures supplemented the analysis. The percentage of simulation runs with identified rip currents out of the 10 runs (denoted as Prip) was calculated for each experiment case, where higher values indicated greater rip proneness. It is important to note that a Prip between 0 and 1 reflects the uncertainty of rip occurrences due to random wave phases. Another measure was the percentage of rip presence time (denoted as Pt) calculated as the total time steps with identified rip currents divided by the 40 min analysis period, which approximated the occurrence likelihood of rip currents.
3. Results
3.1. Circulation Patterns of Rip Currents at Featureless Beaches
Circulation patterns of identified rip currents exhibit distinct behaviors at the three featureless beaches with different shoreline configurations, as demonstrated in Figure 2 and Figure 3. With sequences of 1 min time-averaged current velocities plotted on top of the vorticity color contours for the two experiments conducted under the normal incidence (θ = 0°, Figure 2) and the oblique incidence waves (θ = 45°, Figure 3) with other settings same (i.e., Hs = 1 m, Tp = 10 s, SLP = 0.03), the circulation patterns and the generation processes of rip currents are briefly described here.
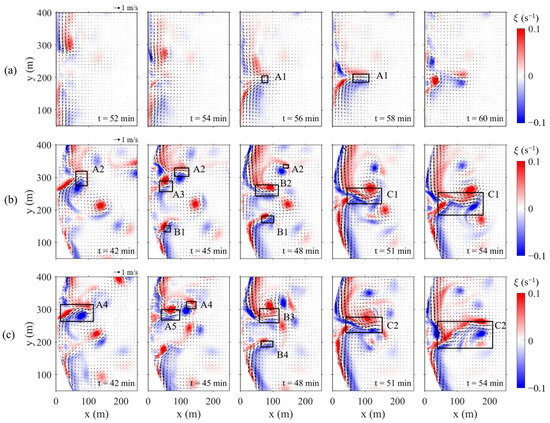
Figure 2.
Circulation patterns of transient rips generated under the normal incidence waves (θ = 0°, Hs = 1 m, Tp = 10 s, σθ = 10°, γTMA = 5) at (a) beach S, (b) beach C, and (c) beach H. Snapshots of 1 min-averaged current velocity vectors are plotted on the vorticity color contours. A1–A5, B1–B4 and C1–C2 are labels of identified rip currents, in which A, B, C represent different forms of rip patterns.
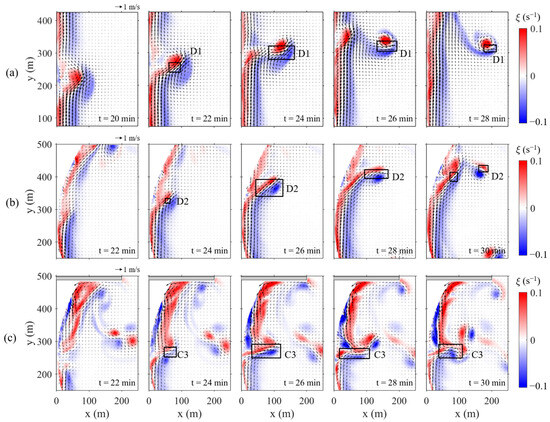
Figure 3.
Circulation patterns of transient rips generated under the oblique incidence waves (θ = 45°, Hs = 1 m, Tp = 10 s, σθ = 10°, γTMA = 5) at (a) beach S, (b) beach C, and (c) beach H. Snapshots of 1 min-averaged current velocity vectors are plotted on the vorticity color contours. C3, D1, D2 are labels of identified rip currents, in which C and D represent different forms of rip patterns.
Under normal incident waves, the formation of a rip current at beach S (Figure 2a) starts when two patches of vorticity with opposite signs moved toward each other along the shoreline (t = 52–54 min). The vorticity patches were intensified by each other and formed a well-defined vortex pair (t = 56 min). The rip current appeared as the offshore-shedding vortex pair and eventually dissipated (t = 58–60 min). This process was consistent with the generation of hydrodynamically controlled transient rips described in previous studies (e.g., [15]). Differently, at beach C and H with curved shorelines (Figure 2b,c), the circulation patterns of rip currents appeared much more complex. At beach C (Figure 2b), two patches of vortices with opposite signs at y ~ 300 m first formed a rip current shedding offshore (t = 42 min), similar to those at beach S, but shortly after a second pair of vortices appeared (t = 45 min), merged with the previous vorticity patch, and formed an intensified eddy propagating towards the center of the bay (t = 48 min). In the meantime, another eddy at y ~ 200 m was propagating towards the center of the bay. A pronounced rip was developed from the convergence of the two eddies (t = 51 min), and the offshore current was accompanied by eddies shedding sideways (t = 54 min). This circulation pattern appeared to be a mega-rip, consistent with the pattern of cellular rips observed at an embayed beach with headlands [8,85]. Similarly, at beach H (Figure 2c), the circulation pattern was also dominated by a mega-rip, and only slight differences were observed in the shape and location of the vorticity patches from those at beach C. It can be inferred that the difference was due to wave propagation and nearshore transformations affected by the presence of reflective headlands at beach H, but the effect appeared minimal under the normal incidence waves.
Under oblique incident waves, the generation and circulation patterns of rip currents appeared quite different from those under the normal waves. At beach S (Figure 3a), a strong longshore current was generated under oblique incidence and meandered with the formation of an offshore-shedding vortex (t = 22–28 min) as a rip current. At beach C (Figure 3b), a strong longshore current was also present (t = 22 min), and the current started to turn away from the shoreline after passing the center of the bay at y ≈ 300 m (t = 24 min), forming an offshore-directed rip current (t = 24–26 min). The rip continued to propagate offshore with a shedding vortex pair while the strong current curved back to the shoreline (t = 30 min). At beach H, different from the dominant longshore current pattern at beach S and beach C, (Figure 3c) a longshore current opposite to the incident wave direction was generated (t = 22 min) and the two opposing currents converged near the center of the bay at y ~250 m (t = 24 min) to form an offshore-directed mega-rip (t = 26 min). The offshore flow meandered with eddies shedding sideways (t = 28–30 min). Different from those under normal waves, the generation and circulation pattern of rip currents at beach H (Figure 3c) were completely different from those at beach C (Figure 3b), which suggests that the wave propagation and nearshore transformation are largely affected due to the presence of reflective headlands under oblique wave incidence.
Similar circulation patterns and rip formation processes to those presented in Figure 2 and Figure 3 were observed in other numerical simulation results. The rip currents identified at the three featureless beaches generally exhibited four forms of circulation patterns. The first form features a well-defined vortex pair that sheds offshore [15], as seen in rips A1 (Figure 2a), A2, A3 (Figure 2b), and A4, A5 (Figure 2c), occurring consistently under normal incidence waves regardless of shoreline shape or headland presence. This form of rip currents was perceived as transient rips and was likely associated with vorticity generation due to breaking waves. The second form appears as offshore-directed flow within an intensified eddy, as seen in B1, B2 (Figure 2b) and B3, B4 (Figure 2c), commonly found at the curved shorelines regardless of headland presence. This form appeared to be merged from surf zone eddies and longshore currents. The third form represents the well-known mega-rip [8], characterized by strong offshore-directed flow evolved from the convergence of two opposing longshore currents, as seen in C1 (Figure 2b), C2 (Figure 2c) and C3 (Figure 3c), which also formed at the curved shorelines regardless of headland presence. Generation of this mega-rip form was possibly associated with alongshore setup gradients due to the shoreline curvature. As waves approached towards the curved shoreline, they tended to develop higher setups near the embayment edges, thus driving two opposing longshore currents towards the center where the convergence led to formation of offshore-directed rip currents. The fourth form features strong longshore currents and offshore shedding vortex, as demonstrated by D1 (Figure 3a) and D2 (Figure 3b), typically occurring under highly oblique incident waves. This form was also perceived as transient rips and was possibly associated with shear instability of the generated strong longshore currents, in addition to breaking wave vorticity forcing (will be discussed in Section 4.3). Notably, rip circulation patterns were observed to evolve during individual rip occurrences, such as the transformation of vortex pair A3 into intensified eddy B1 before eventually developing into mega-rip C1 (Figure 2b). In short, these findings indicate that rip current circulation patterns are largely determined by both wave incidence angles and shoreline configurations.
3.2. The Effects of Beach Morphology on Rip Current Characteristics
Characteristics of rip currents at featureless beaches with different beach morphology configurations (i.e., shoreline configurations and beach slopes) were examined. The effects of shoreline configurations on rip characteristics were examined by comparing the lump-sum statistics (without considering different wave conditions), which were calculated from the 144 numerical experiment cases (a total of 1440 simulation runs). The average number of rip occurrences (nrip) per 40 min period was 4, 7, and 9 for beach S, C, and H, respectively. The 95 percentile durations (ΔT) were 11 min, 13 min, and 14 min for beach S, C, and H, respectively. Note that the identified rip durations were consistent with the O (~10min) pulsation timescales of rip currents reported in previous rip dynamics studies [40,43,86] and field observations [20,87]. The identified rip durations were less than half of the 40 min, which also confirmed that the analysis period was sufficient for characterizing rip currents. The 95 percentiles for maximum rip velocities (Umax) were 1.1 m/s, 1.3 m/s, and 1.3 m/s, while the 95 percentiles for offshore extents (ΔX) were 163 m, 180 m, and 189 m for beach S, C, and H, respectively. Median rip widths (ΔY) were 49 m, 60 m, and 55 m. The identified rip velocities and spatial scales had scales of O (0.1–1 m/s) and O (10–100 m), consistent with those identified in observations [71,87]. The offshore extents of rip currents fell in the range of several tens meters in transient rips [71,88] up to a few hundreds of meters in mega- embayed cellular rips [1,85] reported in field observations. The rip width was also found to be similar as observed transient rip ejections [89]. The lump-sum statistics revealed two major findings about beach shoreline configuration on rip currents. First, while all beaches produced rips of comparable magnitudes, curved shorelines (beach C and H) consistently generated stronger, longer-lasting, and larger rips than the straight shoreline (beach S). Second, rip characteristics at beach C and beach H exhibited a strong similarity but differed notably from those at beach S, suggesting that shoreline curvature can have a greater influence on rip occurrences than headland.
The effects of beach slopes on rip characteristics were examined using results from Exp 1 (Table 1). Figure 4 presents the five rip characteristic parameters (mean values with 95% confidence intervals from the 10 repeated simulations) under a range of different beach slopes for beach S, C, and H under the normal or the oblique wave incidence. At beach S, rip occurrences were only identified at certain beach slopes, i.e., SLP of ≥0.02 under oblique waves (purple marks, Figure 4a) and SLP of 0.02 or 0.03 under normal waves (pink marks, Figure 4a). While the number of rip currents (nrip in Figure 4a) appeared consistently low across slopes, other rip characteristics (Umax, ΔX, ΔT, ΔY in Figure 4b–e) exhibited significant slope dependence. Under oblique waves (pink marks), steeper slopes tended to produce rips with higher offshore velocities (Umax) but smaller offshore extents (ΔX), shorter durations (ΔT), and narrower widths (ΔY). Under normal waves (purple marks), similar trends except in ΔT were also observed, but the variations between SLP of 0.02 and 0.03 appeared to be less pronounced, which indicates that wave incidence affects slope sensitivity at beach S. At beach C, the number of rips increased with slope for both normal and oblique waves, but a maximum was reached at SLP of 0.03 under normal incidence (pink marks in Figure 4f). Umax followed a similar increasing trend (Figure 4g) while other characteristics (ΔX, ΔT, ΔY in Figure 4h–j) reached a maximum at SLP of 0.02 for both wave conditions (except in ΔY for oblique waves). These different trends suggest that stronger rips do not necessarily have longer durations or larger spatial scales at beach C. At beach H, the five rip characteristics (nrip, Umax, ΔX, ΔT, ΔY in Figure 4k–o) exhibited similar patterns as those at beach C. Particularly, rips with maximum durations, offshore extents, and widths were consistently observed at SLP of 0.02. One notable difference from beach C was that rip characteristics under both wave incidences at beach H were similar to each other, as well as to rips under normal waves at beach C. This observation supports our early finding (Section 3.1) that the presence of headlands can affect wave propagation and nearshore transformation under oblique waves, reducing rip characteristics differences between wave incidence conditions. In general, at curved shorelines, a beach slope close to 0.02 might be a favorable condition for rips with large temporal and spatial scales to develop, while stronger rips tend to occur more frequently at SLP of 0.03 under normal incidence or at steeper slopes under oblique waves.
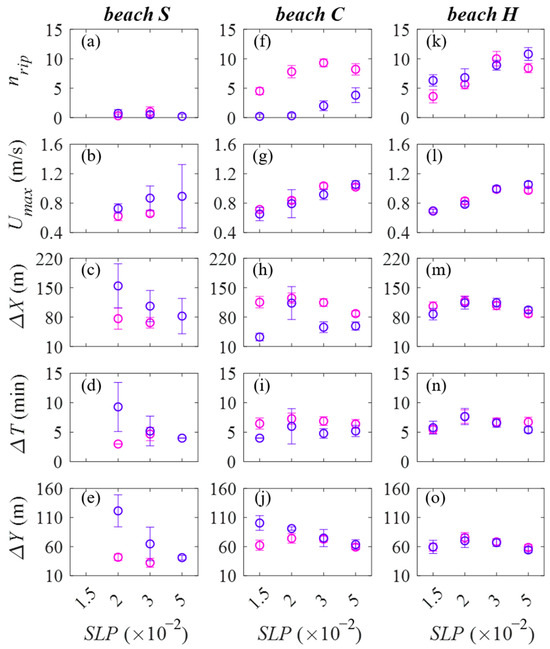
Figure 4.
Rip current responses to different beach slopes (SLP) tested in Exp 1 at the three beaches with different shoreline configurations: (a,f,k) number of rips in each 40 min analysis period, (b,g,l) maximum offshore velocity, (c,h,m) offshore extents, (d,i,n) rip durations and (e,j,o) rip widths. The mean values of the 10 repeated simulations are plotted in circles with the 95% confidence intervals indicated by the vertical lines. Results for the normal incident wave cases are shown by the pink marks and those for the oblique incident wave cases are shown by the purple marks.
In short, the key findings regarding shoreline configuration and beach slope effects on rip currents at featureless beaches are as follows. First, shoreline curvature can promote rip occurrences and increase their strengths and temporal-spatial scales, primarily through the formation of mega-rips (see Figure 2b,c and Figure 3c). Second, headland presence can further promote rip occurrences by modulating oblique wave transformation, generating rips with characteristics similar to those under normal wave incidence (see Figure 4k–o). Third, at straight shorelines, moderately mild beach slopes (SLP ~0.02–0.03) are crucial for rip generation, as both excessively mild and steep slopes may inhibit the formation of surf zone vortices or longshore currents (see Figure 2a and Figure 3a). Fourth, across all shoreline configurations, a consistent pattern was observed where higher offshore velocities occurred at SLP of 0.03 (normal waves) or steeper slopes (oblique waves), while larger spatial scales and longer durations were typically observed at SLP close to 0.02.
3.3. The Effects of Wave Incidences on Rip Current Characteristics
Wave incidence is a key factor controlling rip current occurrence and circulation patterns. Rip characteristics (nrip, Umax, ΔX, ΔT, ΔY) were examined in Figure 5 using results from Exp 2 for a range of wave incidences at the three beaches. At beach S, the number of rips (nrip in Figure 5a) appeared to peak at θ of 15°, indicating near-normal waves with a small oblique angle a favorable condition for rip currents at beach S. Nevertheless, larger offshore velocities (Umax in Figure 5b) were observed under more oblique angles, while peak spatial and temporal scales (ΔX, ΔT and ΔY in Figure 5c–e) were observed at θ of 30°, demonstrating that strongest rip flows do not necessarily have largest extents or longest durations. At beach C, rip currents showed a decreasing trend in nrip (Figure 5f) with increasing wave incidence angles, suggesting a preference for normal waves. Interestingly, most rip characteristics (Umax, ΔX, ΔT in Figure 5g–i) did not exhibit pronounced variations until reaching a highly oblique condition (i.e., θ = 45°), which differed markedly from beach S. Rip widths at beach C (ΔY in Figure 5j) exhibited a subtle peak at θ of 30°, similar to but less pronounced than at beach S. beach H were different from both beach S and C, with all five rip characteristics (nrip, Umax, ΔX, ΔT, ΔY) showing minimal sensitivity to wave incidence. Rip circulation patterns at beach H consistently featured the mega-rip form (such as Figure 2c and Figure 3c) across all tested wave incidence angles. These different responses to wave incidences across the three shoreline configurations highlighted the effects of shoreline curvature and headlands in modifying wave transformation, as oblique waves become refracted to near-normal incidence in embayment configurations and consistently generate mega-rips regardless of original wave approaching angles.
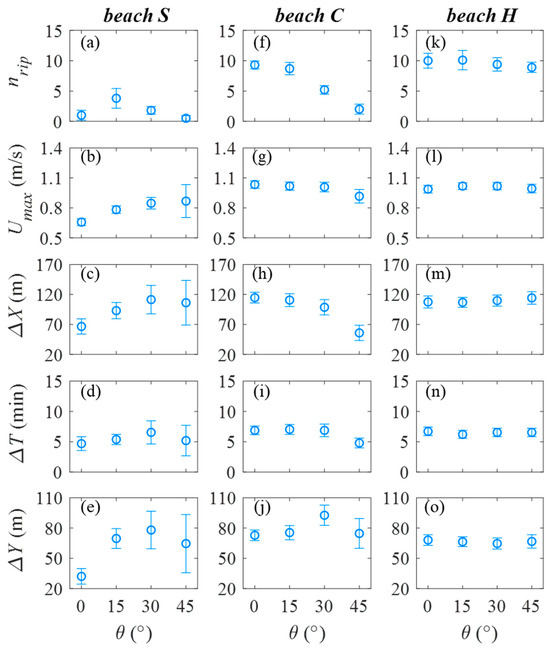
Figure 5.
Rip current responses to different incident wave angles (θ) tested in Exp 2 at the three beaches with different shoreline configurations: (a,f,k) number of rips in each 40 min analysis period, (b,g,l) maximum offshore velocity, (c,h,m) offshore extents, (d,i,n) rip durations, and (e,j,o) rip widths. The mean values of the 10 repeated simulations are plotted in circles with the 95% confidence intervals indicated by the vertical lines.
In short, wave incidence effects on rip currents at featureless beaches are summarized as follows. First, wave incidence angle fundamentally controls rip circulation patterns (see Figure 2 and Figure 3), directly influencing their strengths and temporal-spatial scales. Second, near-normal or normal wave incidence generally promotes rip occurrence across all shoreline configurations, regardless of curvature or headland presence. Third, rip responses to wave incidence are distinct between straight and curved shorelines. At straight shorelines, stronger and longer-lasting rips tend to occur under oblique waves, while at curved shorelines, stronger and larger rips are more favored under normal waves. Fourth, headlands significantly moderate wave incidence effects through refraction processes, making beach H nearly insensitive to varying wave incidence angles, as incoming waves are transformed to near-normal incidence before breaking.
3.4. The Effects of Wave Height and Wave Period on Rip Current Characteristics
Wave heights and wave periods are important factors determining the wave energy condition for rip current occurrences. Here, rip characteristics under different wave heights and wave periods were examined for the normal incidence (θ = 0°) and the oblique incidence (θ = 45°) cases in Exp 3 and 4.
The wave height effect is shown in Figure 6. At beach S, a minimum wave height was required for rip currents to occur, as no rip was generated under low wave heights, i.e., Hs ≤ 0.8 m under normal incidence (pink marks in Figure 6a) and Hs ≤ 0.6 m under oblique incidence (purple marks in Figure 6a). Increasing wave heights led to an increasing number of rips for normal waves, but not much change was observed for oblique waves. On the contrary, increasing wave heights under oblique incidence created stronger rips with higher offshore velocities (Umax in Figure 6b), larger offshore extents (ΔX in Figure 6c), longer durations (ΔT in Figure 6d), and larger widths (ΔY in Figure 6e), which however were not obvious for normal waves. These differences were likely associated with the two distinct rip circulation patterns observed at beach S (Figure 2a and Figure 3a). Under normal wave conditions, increased wave heights could promote the generation of vortex pairs, resulting in greater rip numbers while not significantly affecting the temporal and spatial scales of the vortex-induced rips. For oblique wave incidence, larger wave heights could intensify the wave-induced longshore current, producing stronger, longer-lasting, and larger rip currents that shed off from the amplified longshore flow, without changing the number of rips generated.
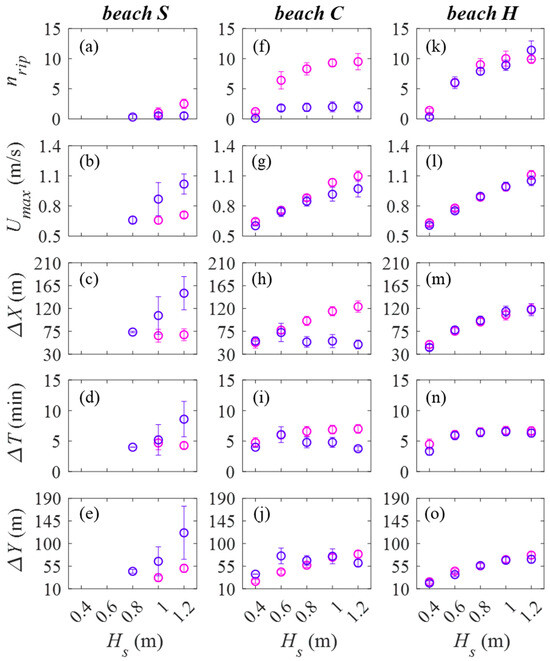
Figure 6.
Rip current responses to different significant wave heights (Hs) tested in Exp 3 at the three beaches with different shoreline configurations: (a,f,k) number of rips in each 1 h simulation, (b,g,l) maximum offshore velocity, (c,h,m) offshore extents, (d,i,n) rip durations, and (e,j,o) rip widths. The mean values of the 10 repeated simulations are plotted in circles with the 95% confidence intervals indicated by the vertical lines. Results for the normal incident wave cases are shown by the pink marks and those for the oblique incident wave cases are shown by the purple marks.
At beach C and H, rip currents were observed at lower wave height (i.e., Hs = 0.4 m) compared to beach S where no rips occurred under this condition. The number of rips showed a clear increasing trend with larger wave heights (nrip in Figure 6f,k). Rip characteristics (Umax, ΔX, ΔT, ΔY) similarly exhibited consistent increasing trends. Their magnitudes were similar across the normal incidence case at beach C (pink marks in Figure 6g–j) and both incidence cases at beach H (Figure 6k–o). This observation was consistent with our earlier finding (Section 3.3) that headland presence can promote the mega-rip circulation pattern regardless of wave incidence angle, and similar responses to increasing wave energy can be expected. Differently, for the oblique incidence case at beach C, while Umax (Figure 6g) continued increasing with wave height, the other rip characteristics (ΔX, ΔT, ΔY) exhibited slight decreasing trends when Hs exceeded 0.6 m (purple marks in Figure 6h–j). This suggests that shoreline curvature may constrain the temporal and spatial scales of rips generated from longshore currents at beach C (Figure 3b), causing the primary response to more energetic waves to be reflected in higher offshore velocities rather than increased rip scales.
The wave period effect is shown in Figure 7. Rip occurrences and characteristics generally exhibited minimal variations across different (peak) wave periods, with the observed trends strongly dependent on both wave incidence and shoreline configuration. For rip number (nrip), shorter wave periods favored rip formation under normal waves at beach S (pink marks in Figure 7a), while longer wave periods promoted rips under oblique waves at beach H (purple marks in Figure 7k). Rip velocity (Umax) trends were more influenced by wave incidence, with larger offshore velocities under normal waves (pink marks in Figure 7b,g,l) occurring near Tp ~ 8 s but shifting to a longer wave period (i.e., ~12 s) under oblique waves (purple marks in Figure 7b,g,l). The other rip characteristics (ΔX, ΔT, ΔY) responded primarily to shoreline configuration. At beach S, the spatial and temporal scales of rip currents were consistent across wave periods, with slight decreases observed for Tp > 8 s under oblique waves (purple marks in Figure 7c–e). At beach C, rip dimensions and durations increased with Tp from 6 s to 8 s but stabilized at larger Tp (Figure 7h–j). At beach H, minor increases in ΔX, ΔT and ΔY with Tp were observed, though the variations were insignificant (Figure 7m–o). These findings indicate that wave period plays a secondary role compared to wave incidence and shoreline configuration in influencing rip currents at featureless beaches, as evidenced by the limited ranges of rip characteristics magnitudes in Figure 7. Nevertheless, the absence of rips at beach S under normal incidence when Tp was 12 s (Figure 7a) suggests that a critical wave period range for rip occurrences may exist for straight shoreline beaches.
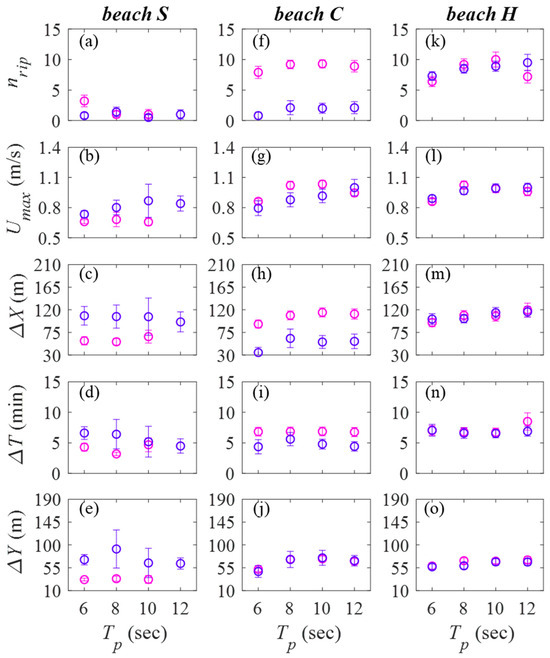
Figure 7.
Rip current responses to different peak wave periods (Tp) tested in Exp 4 at the three beaches with different shoreline configurations: (a,f,k) number of rips in each 40 min analysis period, (b,g,l) maximum offshore velocity, (c,h,m) offshore extents, (d,i,n) rip durations, and (e,j,o) rip widths. The mean values of the 10 repeated simulations are plotted in circles with the 95% confidence intervals indicated by the vertical lines. Results for the normal incident wave cases are shown by the pink marks and those for the oblique incident wave cases are shown by the purple marks.
In short, the wave height and wave period effects on rip currents at featureless beaches are summarized as follows. First, rip occurrences at beach S may require meeting critical wave height or wave period thresholds, while rip currents were generated under all tested conditions at the two curved shorelines (beach C and H), confirming that shoreline curvature and headlands promote rip occurrences. Second, responses of rip characteristics to increasing wave heights can be largely associated with rip circulation patterns. Specifically, larger wave heights can: (i) increase rip occurrences for vortex pair induced rips (e.g., Figure 2a), (ii) amplify both rip strength and their spatial-temporal scales for longshore current-induced rips at a straight shoreline beach (e.g., Figure 3a), (iii) increase only rip velocity for longshore current-induced rips at the curved shoreline beach (e.g., Figure 3b), and (iv) lead to more and stronger, larger, longer-lasting mega-rips (e.g., Figure 2b,c and Figure 3c). Third, wave period influences rip characteristics less significantly than other wave parameters or beach morphology factors previously examined.
3.5. Rip Current Occurrences at Featureless Beaches
Rip current occurrences under combinations of wave height and wave period were investigated using results from Exp 5 (Table 1), examined for three beach configurations under both normal and oblique wave incidence (Figure 8). Variability in rip numbers (nrip in Figure 4, Figure 5, Figure 6 and Figure 7) was observed in the 10 repeated simulations with identical wave spectrum parameters but different random phases. In Figure 8, the percentage of simulation runs in which rip currents were identified out of the total 10 runs (Prip) is shown by the white text label and the percentage of rip presence time (Pt) is represented by the box color. Note that white boxes correspond to conditions where no rip was identified in the 10 repeated simulations (across a total of 400 min), suggesting minimal likelihood of rip occurrence under those wave conditions.
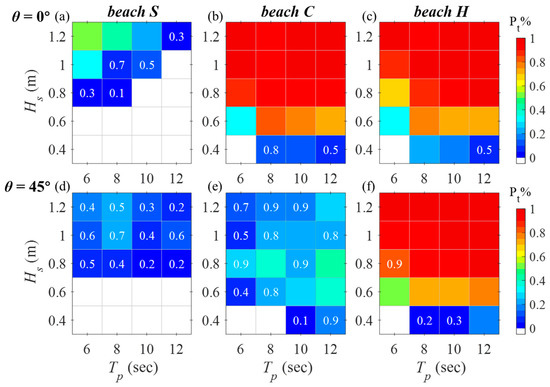
Figure 8.
Rip current occurrences under different combinations of wave height and wave period in Exp 5, at the three beaches with different shoreline configurations for (a–c) the normal incident wave cases and (d–f) the oblique incident wave cases. Box colors represent the percentage of rip presence time (Pt), an indicator of the likelihood of rip occurrence. White boxes correspond to conditions when no rips are identified. The box with a white text label corresponds to conditions when rip currents are identified in some (not all) of the 10 repeated simulations, and the text label is the percentage of simulation runs with rip occurrences identified out of the total 10 runs (Prip).
A key observation from Figure 8 is that rip currents were more likely to occur at curved shorelines (beach C and H) than at the straight shoreline (beach S). While rips were detected in nearly all wave height and period combinations in Exp 5 at beach C and H (except at Hs = 0.4 m and Tp = 6 s), beach S required wave heights exceeding a critical threshold that varied with wave period and wave incidence angle. High Pt (higher than 50%) and Prip of 1 (indicating minimal uncertainty) at curved shorelines (Figure 8b,c,f), in comparison to those under identical wave conditions at beach S (e.g., for Hs ≥ 0.8 m in Figure 8a,d) further demonstrated the high likelihood of rip occurrences at beach C and H. Moreover, normal wave incidence conditions promoted rip occurrences, as evidenced by comparing results under normal waves (Figure 8a,b) with those under oblique waves (Figure 8d,e). Overall, these findings were consistent with the results described in previous sections.
The varying patterns of rip occurrences in Figure 8 can be associated with the previously identified four forms of circulation patterns controlled by shoreline configuration and wave incidence. First, for vortex pair induced rips (e.g., Figure 2a) at beach S under normal waves (Figure 8a), rip currents were more prone (with high likelihood and low uncertainty) to occur during larger wave height combined with shorter wave period. Second, for longshore current-induced rips (e.g., Figure 3a) at beach S under the oblique incident waves (Figure 8d), Pt remained low (i.e., less than 20%) across all tested conditions, though slightly higher probabilities emerged at specific wave period (i.e., 8 s) and wave height (i.e., 1 m). This suggests that rip currents under oblique incidence are more likely to occur in moderate seas, rather than high-energy swells. Third, for longshore current-induced rips (e.g., Figure 3b) at beach C under oblique waves (Figure 8e), larger wave periods and wave heights close to 0.8 m favored rip occurrences, but the variations across conditions were generally not significant. Uncertainties in rip occurrences were consistently observed across all tested conditions. These differences in rip occurrence patterns at beach C from those at beach S highlighted the shoreline curvature’s effect on longshore current-induced rips. Lastly, for mega-rips (e.g., Figure 2b,c and Figure 3c) at beach C under normal waves and at beach H under both incidences (Figure 8b,c,f), larger wave heights combined with longer wave periods corresponded to higher probabilities of rip occurrences, as large Pt > 50% were observed in most tested combinations except Hs ≤ 0.4 m or Tp ≤ 6 s. Wave height dominated the rip occurrence responses over wave period, whose effects appeared diminished at large wave height (e.g., Hs ≥ 0.8 m).
Overall, the analysis of rip occurrences across various wave height and wave period combinations yielded three key findings. First, the distinct rip occurrence patterns reflected the fundamental differences in rip circulation patterns, making critical wave height or wave period thresholds of rip occurrence complicated and highly dependent on the other aforementioned factors. Second, normal wave incidence, shoreline curvature, and headland presence emerged as three primary factors enhancing rip formation at featureless beaches. Last but not least, significant uncertainties persist in rip current occurrence at featureless beaches, particularly at straight shorelines and under low wave heights, short wave periods, and oblique incidence. This supports the argument that these rip currents at featureless beaches are transient rips, which have been commonly perceived as random, episodic rips under the stochastic wave forcing [1,8]. Such uncertainties in rip occurrence need to be paid attention to, as unpredictable rips can pose a greater hazard to those beachgoers who are not aware.
Consequently, appropriate early warning strategies are important for addressing uncertainties in rip current occurrences for practitioners. One potential strategy involves real-time observation systems that use optical cameras to detect rip currents (e.g., [90,91]), providing timely information to beach users and coastal managers. Another strategy is the implementation of model-based nowcast systems, which can predict rip currents based on environmental conditions. Approaches for such predictive modeling are discussed in Section 4.1. In short, to address the uncertainties in rip occurrences, whether through direct observation or indirect prediction models, access to real-time or near real-time information about surf zone conditions is essential for developing effective early warning strategies for rip currents at featureless beaches.
4. Discussion
4.1. Implications for Predicting Rip Current Occurrences at Featureless Beaches
How to utilize the findings of this study to predict rip currents at featureless beaches is discussed here. Usually, rip current prediction is achieved using empirical models or physics-based models (i.e., hydrodynamic models). Empirical models predict rip currents based on established relationships between rip occurrences and environmental factors such as wave, wind, and tidal conditions [8]. This approach is operationally efficient and has long been employed in rip current hazard outlook programs [92,93,94,95,96]. In this study, by systematically assessing rip current occurrences across a wide range of wave and morphology conditions at idealized featureless beaches, the results provide a framework for developing empirical relations at analogous sites. For a specific beach, initial steps involve surveying its morphological configurations and conducting numerical experiments similar to Exp 5, with additional tidal variation tests if the site experiences significant water level fluctuations. Once empirical relationships between rip occurrences and offshore wave conditions are established, operational prediction becomes relatively straightforward.
On the other hand, physics-based hydrodynamic models have seen limited operational use due to their high computational cost in resolving the small spatial and temporal scales of rip currents. Nevertheless, recent advances in high-performance computing and GPU acceleration [64] have opened up the opportunity for operational forecasting using hydrodynamic models, including Boussinesq-type models. Such models can be configured using surveyed morphology and executed routinely to simulate nearshore flow fields, from which rip currents can be identified using the method described in Section 2.3. Wave forcing parameters at the wave maker (i.e., offshore incident wave conditions) can be obtained from regional wave forecast models or real-time wave buoy measurements.
In short, the modeling techniques and analysis procedures for assessing rip current occurrences presented in this study can be adapted to operational rip current prediction for any beach of interest. For empirical models, though substantial upfront effort is required to establish predictive relationships, operational use is computationally efficient. For physics-based models, initial setup demands less effort, but computational resources should be appropriately allocated for operational deployment. For both approaches, accurate and reliable offshore wave data is critical for effective rip current prediction.
4.2. Sensitivity of Rip Occurrence to Directional Wave Spectra Parameters
Section 3 examined the effects of three bulk wave parameters (significant wave height, peak wave period, and dominant wave direction) on rip current occurrences, while directional spread (σθ) and frequency bandwidth (γTMA) are also important parameters for a comprehensive depiction of wave energy distribution across different frequencies and directions. It is important to note that wave conditions described solely by bulk wave parameters are not fully equivalent to those described by directional wave spectrum. To investigate the influence of these two parameters on rip currents, additional numerical experiments were conducted (see Table S3 for a complete summary of all tested scenarios of this study), comparing rip occurrences under the original spectrum conditions (σθ = 10°, γTMA = 5) with those under a narrower directional spread (σθ = 2°, γTMA = 5) and a narrower frequency bandwidth (σθ = 10°, γTMA = 20).
Table 2 presents a comparison of Prip and Pt for the three beaches with different shoreline configurations and two wave incidences under the same wave height and wave period condition (Hs = 1 m, Tp = 10 s). The results showed two distinct responses of rip occurrences to directional spreads and frequency bandwidths. First, rip currents were more likely to occur under a wider directional spread and a narrower frequency bandwidth. This trend was observed at beach S under both incidences and at beach C under oblique waves. At beach S, no rip current were identified under the narrower directional spread (σθ = 2°), consistent with previous studies that suggest a broad directional spread is necessary for generating surf zone eddies and associated rip currents, as waves from multiple directions interact with each other to create alongshore variations in wave height and non-uniform breaking that provides vorticity forcing [10,20]. This alongshore variation in wave forcing is a key factor for rip current formation at featureless beaches, where alongshore variation of bathymetry such as rip channels or other irregular topographies are absent. Second, rip currents appeared to be slightly favored at a narrower directional spread and a wider frequency band, although the variations of Prip and Pt with different σθ and γTMA values were not significant. This response was observed at beach C under normal wave incidence and at beach H under both wave incidences.
Table 2.
Rip occurrences under different directional spread (σθ) and frequency bandwidth (γTMA) for normal (θ = 0°) and oblique (θ = 45°) incidences.
The two distinct responses can be related to different rip circulation patterns. The first response was associated with rip currents formed by surf zone eddies, while the second response corresponded to mega-rips. These differences suggest that the observed rip occurrences at featureless beaches were driven by different generation mechanisms. Mega-rips appeared to be influenced by interactions between incident waves with the embayment configurations, resulting in higher probabilities of occurrence and persistent characteristics across various wave conditions. In contrast, surf zone eddies and associated rips exhibited intermittent and nonstationary features, typical of hydrodynamically controlled transient rips, which will be further discussed in the next section.
To summarize, at beach H, rip current occurrences are relatively insensitive to changes in wave spectra parameters, while at beach S and C, there is significant variability. This highlights that, at featureless beaches without headlands, factors affecting rip current occurrences can be more complex than previously demonstrated, suggesting that directional wave spectra parameters should be considered in rip current prediction models.
4.3. Generation Mechanisms of Transient Rip Currents
At featureless beaches, particularly those with straight shorelines, rip current occurrences were observed to associate with the generation of surf zone eddies (e.g., A1, D1) and exhibited intermittent behaviors. These rip currents were considered as transient rips, as the offshore shedding vortex pair (A1 in Figure 2a) or the longshore current generated shedding eddy (D1 in Figure 3a) appeared consistent with findings from previous numerical studies [15,18]. Here, the generation mechanisms of transient rips A1 and D1 are discussed.
We examined the surface elevation (η), the perturbation vorticity (ω’), the mean alongshore current (V), the significant wave height (Hs), and the two vorticity forcing terms (i.e., breaking wave vorticity forcing and shear instability) when rips A1 and D1 were generated, as shown in Figure 9a–j. The incident wave conditions for A1 and D1 were Hs = 1 m, Tp = 10 s, γTMA = 5, θ = 0°, σθ = 10° and Hs = 1 m, Tp = 10 s, γTMA = 5, θ = 45°, σθ = 10°, respectively. For comparison, a case with no rip (Hs = 1 m, Tp = 10 s, γTMA = 5, θ = 45°, σθ = 2°) is presented in Figure 9k–o. All three cases were simulated at beach S with a SLP of 0.03 and a h of 13 m (Figure 1a). Note that the perturbation vorticity (ω’), representing individual short-crest wave breaking induced vorticity, was calculated by subtracting the time- and alongshore- averaged vorticity from the instantaneous vorticity. The breaking wave vorticity forcing and shear instability terms were computed following the method in [18] as and , where the overbar represents the time- and alongshore- averaging. The wave-breaking force (Fbr) was estimated using the eddy viscosity parameterization [84]. These terms were calculated using 1 Hz model output, with time-averaging over a 1 min interval and alongshore averaging over the range from y = 0 to 500 m.
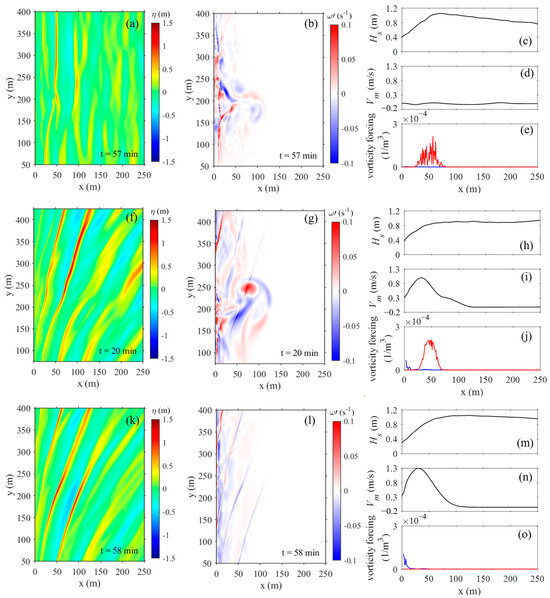
Figure 9.
Transient rip generation mechanisms examined in terms of the instantaneous surface elevation (η) field, (b,g,l) the perturbation vorticity (ω’) field, the cross-shore profiles of (c,h,m) alongshore-averaged significant wave height (Hs), (d,i,n) mean alongshore current (V), and (e,j,o) alongshore-averaged vorticity forcing terms (breaking wave vorticity forcing in red, shear instability vorticity forcing in blue), for three incident wave forcing conditions of (a–e): Hs = 1 m, Tp = 10 s, γTMA = 5, θ = 0°, σθ = 10°; (f–j): Hs = 1 m, Tp = 10 s, γTMA = 5, θ = 45°, σθ = 10°; (k–o): Hs = 1 m, Tp = 10 s, γTMA = 5, θ = 45°, σθ = 2°.
The contribution of individual wave crest breaking to generating transient rip currents was found critical, as clearly illustrated in the two examples. For transient rip A1 (t = 57 min) under normal incidence waves, the instantaneous surface elevation (Figure 9a) revealed two ends of breaking wave crests near where A1 was formed (x ~25 to 100 m, y ~ 150 to 250 m). The perturbation vorticity (Figure 9b) appeared at small spatial scales (~10–50 m) and exhibited offshore-shedding patches of ω’. Similarly, for transient rip D1 (t = 20 min) under oblique waves, instantaneous surface elevation (Figure 9f) showed bending wave crests initiating near x ~50 m. The perturbation vorticity (Figure 9g) was pronounced in patches at scales of ~30 m within x ~ 50–100 m and y ~150–250 m, where D1 shed offshore from longshore currents. In contrast, the no rip case (t = 58 min) showed no significant wave crest bending in surface elevation (Figure 9k), and perturbation vorticity lacked pronounced signals of offshore-shedding eddies (Figure 9l).
The contribution of shear instabilities to generating transient rips appeared negligible, even under oblique wave incidence. For transient rip A1 under normal waves, the longshore current was weak with a speed of less than 0.1 m/s (Figure 9d), with breaking wave vorticity forcing dominating over shear instability term Figure 9e). For transient rip D1 under oblique waves, a stronger longshore current reaching 1.0 m/s was developed (Figure 9i) with shear reached ~0.04 s−1. Yet the shear instability term remained orders of magnitude smaller than breaking wave vorticity forcing (Figure 9j). In the no-rip case, a stronger longshore current (>1.3 m/s) formed under oblique waves with a narrower directional spread (Figure 9n), consistent with [97], which suggests that shear instability of surf zone longshore currents is more pronounced under monochromatic wave conditions. Nevertheless, while the shear instability term appeared intensified near the shoreline (x < 20 m, Figure 9o) compared to Figure 9j, it remained insufficient to drive rip generation. Directional spreading was absent in these cases, eliminating breaking wave vorticity forcing and thus rip generation. Tests with higher oblique angles (θ = 60° and θ = 75°) under narrow directional spreading confirmed this outcome. The calculated breaking wave vorticity forcing incorporates both individual wave crest breaking and wave group effects (the latter not discussed here). Overall, comparisons between D1 and the no-rip case highlighted breaking wave vorticity as the primary driver of transient rips.
In summary, the generation of transient rips, in the form of offshore shedding vortex pairs or longshore current-induced offshore-shedding eddies, is closely associated with individual wave crest breaking. The breaking wave vorticity forcing is the primary driving force at a much larger magnitude than the shear instability mechanism, even when a strong longshore current is present. This finding is consistent with the conclusions of [18,97].
4.4. Limitations, Uncertainties and Future Research Directions
This study provides a focused investigation into the influence of incident wave conditions on rip current occurrences, while other environmental factors, such as wind, tides (i.e., water level changes) and sediment transport (i.e., morphodynamical processes), were not explicitly considered in numerical experiments and design. Including these processes would enable a more realistic and comprehensive representation of physical conditions influencing rip current behavior. First, locally generated wind waves can be as influential as swells in certain coastal areas. Wind forcing becomes particularly important in large-domain simulations, where it significantly modifies nearshore wave conditions. In semi-enclosed basins, wind may also induce water level oscillations such as seiches, which can further influence nearshore circulation patterns and rip current formation [52,54]. Second, tidal variations and other forms of water level change can impact rip current formation by continuously altering the morphology of the shallow surf zone. Rip occurrence is sensitive to beach slope (see Section 3.3) and bottom friction (see Table S4), two parameters that can vary spatially in real-world environments. Consequently, rising or falling water levels may significantly affect the formation and strength of rip currents. Third, nearshore sediment transport and morphodynamical evolution are closely linked to rip current processes. On one hand, sediment transport can gradually transform a featureless beach into one with rip channels or other morphological irregularities. On the other hand, rip currents and associated longshore currents contribute to the redistribution of sediment. The nonlinear morphodynamical feedbacks have been widely studied in the context of rip current systems (e.g., [98,99]). Given these considerations, this study presents a foundational analysis under idealized conditions where wave forcing dominates over other environmental factors, but it does not capture the full complexity of surf zone dynamics including nonlinear morpho-dynamics. Therefore, the results are best interpreted as applicable over short time scales within tidal cycles or prior to significant morphological evolution, and may serve as a basis for future studies incorporating a broader range of physical processes and real-world site conditions.
The modeling results are subject to various sources of uncertainty, which can be categorized into three groups. The first is the inherent variability in rip current occurrences resulting from the different random wave phases generated at the wave maker. This randomness reflects the stochastic nature of rip current formation, and the 95% confidence intervals shown in Figure 4, Figure 5, Figure 6 and Figure 7 provide a quantitative measure of this uncertainty. The second category involves numerical parameter uncertainty, such as that related to spatial resolution. Table S2 presents sensitivity test results from six different grid spacing under the same bathymetric configuration (i.e., beach S with SLP of 0.03) and identical incident wave forcing (Hs = 1.0 m, Tp = 10 s, θ = 0°). The resulting rip current characteristics from higher-resolution grids differed by less than 10% in most cases, indicating mild sensitivity to grid spacing. The third category pertains to physical parameter uncertainty, such as the bottom friction coefficient (Cd). Table S4 compares results from simulations using Cd values of 0.0001 and 0.0003 against the original value of 0.0002. The variation in rip current characteristics across these settings was more pronounced, suggesting that Cd introduces a relatively large degree of uncertainty. In short, these sources of uncertainties highlight the importance of cautious interpretation of the absolute magnitudes of the modeling results. Future field calibration of physical parameters at specific real-world sites could further improve the robustness and practical applicability of the modeling results.
In light of the key findings and limitations of this study, future research directions may be considered to strengthen both the practical applications of this modeling approach and the scientific understanding of rip current dynamics. In particular, field campaigns on a real-world featureless beach, including measurements of current velocities in the surf zone and wave spectral conditions, would provide valuable data for validating the numerical results presented in this study. Applying this method to specific coastal sites under observed conditions could also help evaluate its performance under more complex, real-world morphologies and environmental forcings. In addition, the development of an integrated, real-time system for rip current modeling and detection may offer benefits for coastal safety management, particularly at recreational beaches. Implementing GPU acceleration and lightweight AI models could further enhance the accessibility of this approach for small or remote communities with limited computational resources. Finally, building upon the findings of this study, further investigation into rip current generation mechanisms, such as the roles of shoreline curvature and headlands in vorticity forcing associated with wave breaking and longshore currents, would contribute to a more comprehensive understanding of surf zone dynamics.
5. Conclusions
This paper investigated rip current occurrences at featureless beaches using a wave-resolving Boussinesq-type model, FUNWAVE-TVD. Numerical experiments at three idealized featureless beaches showed rip currents with O (10 min) durations. Four distinct forms of rip circulation patterns were identified: (i) well-defined vortex pairs that shed offshore, (ii) offshore-directed flows in intensified eddies, (iii) mega-rips formed from the convergence of opposing longshore currents, and (iv) offshore shedding vortices from strong longshore currents. Rips with patterns (i) and (iv) exhibited intermittent occurrences and high uncertainties, thus perceived as transient rips. Analysis of these transient rips revealed that breaking wave forcing, particularly the individual wave crest breaking, dominates over the shear instability mechanism, even in scenarios with strong longshore currents under oblique wave incidence.
A systematic assessment of rip current occurrences at featureless beaches explored the effects of beach morphology configurations (i.e., shoreline curvature, headland presence, and beach slopes) and wave parameters (i.e., wave incidence angle, wave height, wave period, directional spread, frequency bandwidth). The following key findings are suggested: (1) Shoreline curvature and headlands tended to promote rip occurrences at featureless beaches. (2) Normal or near-normal wave incidence appeared conducive to rip occurrence across shoreline configurations. (3) Moderately mild beach slopes (e.g., ~0.02–0.03) and larger wave heights (e.g., Hs > 0.8 m) generally corresponded to higher rip occurrence, though rip characteristics (i.e., strengths, temporal-spatial scales) appeared to be strongly associated with respective circulation patterns. (4) Wave period demonstrated limited influence, whereas directional spread and frequency bandwidth emerged as potentially critical factors for rip occurrences. (5) Rip characteristics (velocity, offshore extents, duration, and width) responded differently to wave and morphological factors, indicating that stronger rips were not necessarily those with larger scales or longer durations. (6) Low wave height, short wave period, and oblique wave incidence introduced uncertainty in rip occurrence, particularly at straight shorelines with transient rips. These conditions, though commonly perceived as low risk, can still pose unexpected hazards to beachgoers, an important message for coastal communities to be aware of.
Supplementary Materials
The following supporting information can be downloaded at: https://www.mdpi.com/article/10.3390/jmse13061139/s1, Figure S1: Model domain of three beaches with different shoreline configurations and beach slopes. (a,d,g) straight shoreline beach (beach S), (b,e,h) curved shoreline beach with no headland (beach C), and (c,f,i) curved shoreline beach bounded by two headlands (denoted as beach H). The depth profiles at transect 1 (y = 250 m) are plotted in black lines, with beach slopes of (a–c) 0.015, (d–f) 0.02, (g–i) 0.05. The two transects 2, 3 (y = 490 m and y = 10 m) are plotted in grey lines. The red box near x = 425 m represents the location of the wave maker; Figure S2: Time series of kinetic and potential energy (KE in black lines, PE in grey lines) and enstropy (mean square vorticity) Z integrated over the nearshore region (0 < x < 250 m, 0 < y < 500 m) for simulation cases of normal incidence waves (θ = 0°, Hs = 1 m, Tp = 10 s) at (a) beach S and (b) beach C, oblique incidence waves (θ = 45°, Hs = 1 m, Tp = 10 s) at (c) beach S and (d) beach C. Calculation of KE, PE, and Z follows the Equation (9) provided in [100]. Table S1: Summary of the recently (since 2015) published literature on numerical modeling of rip currents; Table S2: Sensitivity test of rip current characteristics to different model grid spacings; Table S3: List of all scenarios tested and the corresponding simulation parameters, settings. and Exp number; Table S4: Sensitivity test of rip current characteristics to different bottom friction coefficient (Cd).
Author Contributions
Conceptualization, Y.L. and C.D.; methodology, Y.L.; software, Y.L.; validation, Y.L.; formal analysis, Y.L.; investigation, Y.L.; resources, C.D., X.L. and F.Y.; data curation, Y.L.; writing—original draft preparation, Y.L.; writing—review and editing, C.D., X.L. and F.Y.; visualization, Y.L.; supervision, C.D. and X.L.; project administration, C.D.; funding acquisition, C.D. All authors have read and agreed to the published version of the manuscript.
Funding
This research was funded by the Southern Marine Science and Engineering Guangdong Laboratory (Zhuhai) (SML2022SP505), the Natural Science Foundation of Jiangsu Province (bk20230425), and the Startup Foundation for Introducing Talent of Nanjing University of Information Science and Technology (2022r044).
Data Availability Statement
The raw data supporting the conclusions of this article will be made available by the authors on request.
Acknowledgments
We thank Fengyan Shi for valuable advice on the model setups and Chin Wu for his insights on transient rip analysis.
Conflicts of Interest
The authors declare no conflicts of interest.
Correction Statement
This article has been republished with a minor correction to the order of affiliation and special note. This change does not affect the scientific content of the article.
References
- Castelle, B.; Scott, T.; Brander, R.W.; McCarroll, R.J. Rip Current Types, Circulation and Hazard. Earth-Sci. Rev. 2016, 163, 1–21. [Google Scholar] [CrossRef]
- Brighton, B.; Sherker, S.; Brander, R.; Thompson, M.; Bradstreet, A. Rip Current Related Drowning Deaths and Rescues in Australia 2004–2011. Nat. Hazards Earth Syst. Sci. 2013, 13, 1069–1075. [Google Scholar] [CrossRef]
- Arozarena, I.; Houser, C.; Echeverria, A.; Brannstrom, C. The Rip Current Hazard in Costa Rica. Nat. Hazards 2015, 77, 753–768. [Google Scholar] [CrossRef]
- Woodward, E.; Beaumont, E.; Russell, P.; MacLeod, R. Public Understanding and Knowledge of Rip Currents and Beach Safety in the UK. Int. J. Aquat. Res. Educ. 2015, 9, 49–69. [Google Scholar] [CrossRef]
- Li, Z. Rip Current Hazards in South China Headland Beaches. Ocean Coast. Manag. 2016, 121, 23–32. [Google Scholar] [CrossRef]
- Brewster, B.C.; Gould, R.E.; Brander, R.W. Estimations of Rip Current Rescues and Drowning in the United States. Nat. Hazards Earth Syst. Sci. 2019, 19, 389–397. [Google Scholar] [CrossRef]
- Brander, R.W.; Bradstreet, A.; Sherker, S.; MacMahan, J. Responses of Swimmers Caught in Rip Currents: Perspectives on Mitigating the Global Rip Current Hazard. Int. J. Aquat. Res. Educ. 2011, 5, 11. [Google Scholar] [CrossRef][Green Version]
- Dalrymple, R.A.; MacMahan, J.H.; Reniers, A.J.; Nelko, V. Rip Currents. Annu. Rev. Fluid Mech. 2011, 43, 551–581. [Google Scholar] [CrossRef]
- Longuet-Higgins, M.S.; Stewart, R.W. Radiation Stresses in Water Waves; a Physical Discussion, with Applications. Deep-Sea Res. Oceanogr. Abstr. 1964, 11, 529–562. [Google Scholar] [CrossRef]
- Baker, C.M.; Moulton, M.; Chickadel, C.C.; Nuss, E.S.; Palmsten, M.L.; Brodie, K.L. Two-Dimensional Inverse Energy Cascade in a Laboratory Surf Zone for Varying Wave Directional Spread. Phys. Fluids 2023, 35, 125140. [Google Scholar] [CrossRef]
- Reniers, A.J.; MacMahan, J.H.; Thornton, E.B.; Stanton, T.P. Modelling Infragravity Motions on a Rip-Channel Beach. Coast. Eng. 2006, 53, 209–222. [Google Scholar] [CrossRef]
- Houser, C.; Barrett, G.; Labude, D. Alongshore Variation in the Rip Current Hazard at Pensacola Beach, Florida. Nat. Hazards 2011, 57, 501–523. [Google Scholar] [CrossRef]
- Castelle, B.; Coco, G. Surf Zone Flushing on Embayed Beaches. Geophys. Res. Lett. 2013, 40, 2206–2210. [Google Scholar] [CrossRef]
- Scott, T.; Austin, M.; Masselink, G.; Russell, P. Dynamics of Rip Currents Associated with Groynes—Field Measurements, Modelling and Implications for Beach Safety. Coast. Eng. 2016, 107, 53–69. [Google Scholar] [CrossRef]
- Johnson, D.; Pattiaratchi, C. Boussinesq Modelling of Transient Rip Currents. Coast. Eng. 2006, 53, 419–439. [Google Scholar] [CrossRef]
- Suanda, S.H.; Feddersen, F. A Self-similar Scaling for Cross-shelf Exchange Driven by Transient Rip Currents. Geophys. Res. Lett. 2015, 42, 5427–5434. [Google Scholar] [CrossRef]
- Scott, T.; Castelle, B.; Almar, R.; Senechal, N.; Floc’h, F.; Detandt, G. Controls on Flash Rip Current Hazard on Low-Tide Terraced Tropical Beaches in West Africa. J. Coast. Res. 2018, 81, 92–99. [Google Scholar] [CrossRef]
- Feddersen, F. The Generation of Surfzone Eddies in a Strong Alongshore Current. J. Phys. Oceanogr. 2014, 44, 600–617. [Google Scholar] [CrossRef]
- Clark, D.B.; Elgar, S.; Raubenheimer, B. Vorticity Generation by Short-Crested Wave Breaking. Geophys. Res. Lett. 2012, 39, 24604. [Google Scholar] [CrossRef]
- Elgar, S.; Raubenheimer, B. Field Evidence of Inverse Energy Cascades in the Surfzone. J. Phys. Oceanogr. 2020, 50, 2315–2321. [Google Scholar] [CrossRef]
- Reniers, A.J.; Roelvink, J.A.; Thornton, E.B. Morphodynamic Modeling of an Embayed Beach under Wave Group Forcing. J. Geophys. Res. Oceans 2004, 109, C01030. [Google Scholar] [CrossRef]
- MacMahan, J.H.; Reniers, A.J.; Thornton, E.B.; Stanton, T.P. Infragravity Rip Current Pulsations. J. Geophys. Res. Oceans 2004, 109, C01033. [Google Scholar] [CrossRef]
- Long, J.W.; Özkan-Haller, H.T. Low-Frequency Characteristics of Wave Group–Forced Vortices. J. Geophys. Res. Oceans 2009, 114, C08004. [Google Scholar] [CrossRef]
- Özkan-Haller, H.T.; Kirby, J.T. Nonlinear Evolution of Shear Instabilities of the Longshore Current: A Comparison of Observations and Computations. J. Geophys. Res. Oceans 1999, 104, 25953–25984. [Google Scholar] [CrossRef]
- Short, A.D.; Hogan, C.L. Rip Currents and Beach Hazards: Their Impact on Public Safety and Implications for Coastal Management. J. Coast. Res. 1994, 12, 197–209. [Google Scholar]
- Benedet, L.; Finkl, C.; Campbell, T.; Klein, A. Predicting the Effect of Beach Nourishment and Cross-Shore Sediment Variation on Beach Morphodynamic Assessment. Coast. Eng. 2004, 51, 839–861. [Google Scholar] [CrossRef]
- Wright, L.D.; Short, A.D. Morphodynamic Variability of Surf Zones and Beaches: A Synthesis. Mar. Geol. 1984, 56, 93–118. [Google Scholar] [CrossRef]
- Short, A.D. Beaches of the Victorian Coast Port Phillip Bay: A Guide to Their Nature, Characteristics, Surf and Safety; Sydney University Press: Camperdown, Australia, 1996. [Google Scholar]
- Scott, T.M.; Russell, P.; Masselink, G.; Austin, M.J.; Wills, S.; Wooler, A. Rip Current Hazards on Large-Tidal Beaches in the United Kingdom; CRC Press: Boca Raton, FL, USA, 2011. [Google Scholar]
- Wright, L.D.; Short, A.D.; Green, M.O. Short-Term Changes in the Morphodynamic States of Beaches and Surf Zones: An Empirical Predictive Model. Mar. Geol. 1985, 62, 339–364. [Google Scholar] [CrossRef]
- Masselink, G.; Short, A.D. The Effect of Tide Range on Beach Morphodynamics and Morphology: A Conceptual Beach Model. J. Coast. Res. 1993, 9, 785–800. [Google Scholar]
- Hamsan, M.A.S.; Ramli, M.Z. Monsoonal Influences on Rip Current Hazards at Recreational Beaches along Pahang Coastline, Malaysia. Ocean Coast. Manag. 2021, 209, 105689. [Google Scholar] [CrossRef]
- Zhang, Y.; Huang, W.; Liu, X.; Zhang, C.; Xu, G.; Wang, B. Rip Current Hazard at Coastal Recreational Beaches in China. Ocean Coast. Manag. 2021, 210, 105734. [Google Scholar] [CrossRef]
- Zhang, Y.; Hong, X.; Qiu, T.; Liu, X.; Sun, Y.; Xu, G. Tidal and Wave Modulation of Rip Current Dynamics. Cont. Shelf Res. 2022, 243, 104764. [Google Scholar] [CrossRef]
- Hu, P.; Li, Z.; Zhu, D.; Zeng, C.; Liu, R.; Chen, Z.; Su, Q. Field Observation and Numerical Analysis of Rip Currents at Ten-Mile Beach, Hailing Island, China. Estuar. Coast. Shelf Sci. 2022, 276, 108014. [Google Scholar] [CrossRef]
- Surisetty, V.A.K.; Venkateswarlu, C.; Ramesh, M.; Gireesh, B.; Naidu, C.V.; Nair, L.S.; Sharma, R. Practical Use of Smartphone Cameras in Rip Current Monitoring Studies. Ocean Coast. Manag. 2023, 243, 106776. [Google Scholar] [CrossRef]
- Mucerino, L.; Carpi, L.; Schiaffino, C.F.; Pranzini, E.; Sessa, E.; Ferrari, M. Rip Current Hazard Assessment on a Sandy Beach in Liguria, NW Mediterranean. Nat. Hazards 2021, 105, 137–156. [Google Scholar] [CrossRef]
- Uebelhoer, L.; Koon, W.; Harley, M.D.; Lawes, J.C.; Brander, R.W. Characteristics and Beach Safety Knowledge of Beachgoers on Unpatrolled Surf Beaches in Australia. Nat. Hazards Earth Syst. Sci. 2022, 22, 909–926. [Google Scholar] [CrossRef]
- Zhu, D.; Li, Z.; Hu, P.; Wang, B.; Su, Q.; Li, G. Preliminary Investigation and Analysis of Beachgoers’ Awareness of Rip Currents in South China. Int. J. Environ. Res. Public Health 2023, 20, 4471. [Google Scholar] [CrossRef]
- MacMahan, J.H.; Reniers, A.J.; Thornton, E.B. Vortical Surf Zone Velocity Fluctuations with 0 (10) Min Period. J. Geophys. Res. Oceans 2010, 115, C06007. [Google Scholar] [CrossRef]
- Mouragues, A.; Bonneton, P.; Castelle, B.; Marieu, V.; Jak McCarroll, R.; Rodriguez-Padilla, I.; Scott, T.; Sous, D. High-energy Surf Zone Currents and Headland Rips at a Geologically Constrained Mesotidal Beach. J. Geophys. Res. Oceans 2020, 125, e2020JC016259. [Google Scholar] [CrossRef]
- Akan, Ç.; McWilliams, J.; Uchiyama, Y. Topographic and Coastline Influences on Surf Eddies. Ocean Model. 2020, 147, 101565. [Google Scholar] [CrossRef]
- Mouragues, A.; Martins, K.; Bonneton, P.; Castelle, B. Headland Rip Very Low Frequency Fluctuations and Surfzone Eddies During High-Energy Wave Events. J. Phys. Oceanogr. 2022, 52, 2935–2956. [Google Scholar] [CrossRef]
- Craik, A.D.D.; Leibovich, S. A Rational Model for Langmuir Circulations. J. Fluid Mech. 1976, 73, 401–426. [Google Scholar] [CrossRef]
- McWilliams, J.C.; Restrepo, J.M.; Lane, E.M. An Asymptotic Theory for the Interaction of Waves and Currents in Coastal Waters. J. Fluid Mech. 2004, 511, 135–178. [Google Scholar] [CrossRef]
- Kumar, N.; Voulgaris, G.; Warner, J.C. Implementation and Modification of a Three-Dimensional Radiation Stress Formulation for Surf Zone and Rip-Current Applications. Coast. Eng. 2011, 58, 1097–1117. [Google Scholar] [CrossRef]
- Uchiyama, Y.; McWilliams, J.C.; Akan, C. Three-dimensional Transient Rip Currents: Bathymetric Excitation of Low-frequency Intrinsic Variability. J. Geophys. Res. Oceans 2017, 122, 5826–5849. [Google Scholar] [CrossRef]
- Moulton, M.; Elgar, S.; Raubenheimer, B.; Warner, J.C.; Kumar, N. Rip Currents and Alongshore Flows in Single Channels Dredged in the Surf Zone. J. Geophys. Res. Oceans 2017, 122, 3799–3816. [Google Scholar] [CrossRef]
- Feng, X.; Dong, B.; Ma, G.; Feng, W. Topographic and Hydrodynamic Influence on Rip Currents and Alongshore Currents on Headland Beaches in China. J. Coast. Res. 2020, 95, 468. [Google Scholar] [CrossRef]
- Salama, N.M.; Iskander, M.M.; El-Gindy, A.A.; Nafeih, A.M.; Moghazy, H.E.-D.M. Hydrodynamic Simulation of Rip Currents Along Al-Nakheel Beach, Alexandria, Egypt: Case Study. J. Mar. Sci. Appl. 2023, 22, 137–145. [Google Scholar] [CrossRef]
- Schönhofer, J.; Dudkowska, A. Rip Currents in the Southern Baltic Sea Multi-Bar Nearshore Zone. Cont. Shelf Res. 2021, 212, 104324. [Google Scholar] [CrossRef]
- Linares, Á.; Wu, C.H.; Bechle, A.J.; Anderson, E.J.; Kristovich, D.A. Unexpected Rip Currents Induced by a Meteotsunami. Sci. Rep. 2019, 9, 2105. [Google Scholar] [CrossRef]
- Martins, K.; Bertin, X.; Mengual, B.; Pezerat, M.; Lavaud, L.; Guérin, T.; Zhang, Y.J. Wave-Induced Mean Currents and Setup over Barred and Steep Sandy Beaches. Ocean Model. 2022, 179, 102110. [Google Scholar] [CrossRef]
- Liu, Y.; Wu, C.H. Drowning Incidents and Conditions Due to Hidden Flash Rips in Lake Michigan. Sci. Total Environ. 2022, 827, 154314. [Google Scholar] [CrossRef] [PubMed]
- Kirby, J.T. Recent Advances in Nearshore Wave, Circulation, and Sediment Transport Modeling. J. Mar. Res. 2017, 75, 263–300. [Google Scholar] [CrossRef]
- Austin, M.; Masselink, G.; Scott, T.; Russell, P. Water-Level Controls on Macro-Tidal Rip Currents. Cont. Shelf Res. 2014, 75, 28–40. [Google Scholar] [CrossRef]
- McCarroll, R.J.; Castelle, B.; Brander, R.W.; Scott, T. Modelling Rip Current Flow and Bather Escape Strategies across a Transverse Bar and Rip Channel Morphology. Geomorphology 2015, 246, 502–518. [Google Scholar] [CrossRef]
- Castelle, B.; McCarroll, R.J.; Brander, R.W.; Scott, T.; Dubarbier, B. Modelling the Alongshore Variability of Optimum Rip Current Escape Strategies on a Multiple Rip-Channelled Beach. Nat. Hazards 2016, 81, 663–686. [Google Scholar] [CrossRef]
- Stokes, C.; Poate, T.; Masselink, G.; Scott, T.; Instance, S. New Insights into Combined Surfzone, Embayment, and Estuarine Bathing Hazards. Nat. Hazards Earth Syst. Sci. 2024, 24, 4049–4074. [Google Scholar] [CrossRef]
- Castelle, B.; Scott, T.; Brander, R.; McCarroll, R.J.; Tellier, E.; De Korte, E.; Tackuy, L.; Robinet, A.; Simonnet, B.; Salmi, L.-R. Wave and Tide Controls on Rip Current Activity and Drowning Incidents in Southwest France. J. Coast. Res. 2020, 95, 769. [Google Scholar] [CrossRef]
- Mouragues, A.; Bonneton, P.; Castelle, B.; Martins, K. Headland Rip Modelling at a Natural Beach under High-Energy Wave Conditions. J. Mar. Sci. Eng. 2021, 9, 1161. [Google Scholar] [CrossRef]
- O’Dea, A.; Kumar, N.; Haller, M.C. Simulations of the Surf Zone Eddy Field and Cross-Shore Exchange on a Nonidealized Bathymetry. J. Geophys. Res. Oceans 2021, 126, e2020JC016619. [Google Scholar] [CrossRef]
- Wang, H.; Zhu, S.; Li, X.; Zhang, W.; Nie, Y. Numerical Simulations of Rip Currents off Arc-Shaped Coastlines. Acta Oceanol. Sin. 2018, 37, 21–30. [Google Scholar] [CrossRef]
- Yuan, Y.; Yang, H.; Yu, F.; Gao, Y.; Li, B.; Xing, C. A Wave-Resolving Modeling Study of Rip Current Variability, Rip Hazard, and Swimmer Escape Strategies on an Embayed Beach. Nat. Hazards Earth Syst. Sci. 2023, 23, 3487–3507. [Google Scholar] [CrossRef]
- Hong, X.; Zhang, Y.; Wang, B.; Zhou, S.; Yu, S.; Zhang, J. Numerical Study of Rip Currents Interlaced with Multichannel Sandbars. Nat. Hazards 2021, 108, 593–605. [Google Scholar] [CrossRef]
- Ji, X.; Xu, C.; Ren, Z.; Yan, S.; Wang, D.; Yu, Z. Study on the Formation Characteristics and Disaster Mitigation Mechanisms of Rip Currents on Arc-Shaped Beach. J. Mar. Sci. Eng. 2023, 11, 2381. [Google Scholar] [CrossRef]
- Xu, J.; Wang, Y.; Mu, B.; Du, H.; Li, Y.; You, Z.; Yan, S.; Lu, L. Modeling Rip Current Systems around Multiple Submerged Breakwaters. J. Mar. Sci. Eng. 2024, 12, 1627. [Google Scholar] [CrossRef]
- Xu, J.; Yan, S.; Zou, Z.; Liu, Z.; Wang, Y.; Chang, C.; Wang, Z.; You, Z. Flow Characteristics of the Rip Current System Adjacent to a Coastal Vertical Structure for Irregular Waves. Ocean Eng. 2024, 312, 119128. [Google Scholar] [CrossRef]
- Xu, J.; Yan, S.; Zou, Z.; Chang, C.; Fang, K.; Wang, Y. Flow Characteristics of the Rip Current System near a Shore-Normal Structure with Regular Waves. J. Mar. Sci. Eng. 2023, 11, 1297. [Google Scholar] [CrossRef]
- Wei, Z.; Dalrymple, R.A.; Xu, M.; Garnier, R.; Derakhti, M. Short-crested Waves in the Surf Zone. J. Geophys. Res. Oceans 2017, 122, 4143–4162. [Google Scholar] [CrossRef]
- Marchesiello, P.; Auclair, F.; Debreu, L.; McWilliams, J.; Almar, R.; Benshila, R.; Dumas, F. Tridimensional Nonhydrostatic Transient Rip Currents in a Wave-Resolving Model. Ocean Model. 2021, 163, 101816. [Google Scholar] [CrossRef]
- Son, S.; Jung, T.-H.; Shi, F. Vertical Structure of Rip-Currents in the Nearshore Circulation. J. Coast. Res. 2016, 75, 1402–1406. [Google Scholar] [CrossRef]
- Shin, S.; Nam, J.; Son, S.; Kim, I.H.; Jung, T.-H. Field Observation and Numerical Modelling of Rip Currents within a Pocket Beach. J. Coast. Res. 2017, 79, 229–233. [Google Scholar] [CrossRef]
- Shi, F.; Kirby, J.T.; Harris, J.C.; Geiman, J.D.; Grilli, S.T. A High-Order Adaptive Time-Stepping TVD Solver for Boussinesq Modeling of Breaking Waves and Coastal Inundation. Ocean Model. 2012, 43, 36–51. [Google Scholar] [CrossRef]
- Kirby, J.T.; Wei, G.; Chen, Q.; Kennedy, A.B.; Dalrymple, R.A. FUNWAVE 1.0: Fully Nonlinear Boussinesq Wave Model-Documentation and User’s Manual; Center for Applied Coastal Research, University of Delaware: Newark, DE, USA, 1998. [Google Scholar]
- Wei, G.; Kirby, J.T.; Grilli, S.T.; Subramanya, R. A Fully Nonlinear Boussinesq Model for Surface Waves. Part 1. Highly Nonlinear Unsteady Waves. J. Fluid Mech. 1995, 294, 71–92. [Google Scholar] [CrossRef]
- Chen, Q. Fully Nonlinear Boussinesq-Type Equations for Waves and Currents over Porous Beds. J. Eng. Mech. 2006, 132, 220–230. [Google Scholar] [CrossRef]
- Salatin, R.; Chen, Q.; Bak, A.S.; Shi, F.; Brandt, S.R. Effects of Wave Coherence on Longshore Variability of Nearshore Wave Processes. J. Geophys. Res. Oceans 2021, 126, e2021JC017641. [Google Scholar] [CrossRef]
- Bouws, E.; Günther, H.; Rosenthal, W.; Vincent, C.L. Similarity of the Wind Wave Spectrum in Finite Depth Water: 1. Spectral Form. J. Geophys. Res. Oceans 1985, 90, 975–986. [Google Scholar] [CrossRef]
- Hsu, J.R.; Evans, C. Parabolic Bay Shapes and Applications. Proc. Inst. Civ. Eng. 1989, 87, 557–570. [Google Scholar] [CrossRef]
- Suanda, S.H.; Perez, S.; Feddersen, F. Evaluation of a Source-Function Wavemaker for Generating Random Directionally Spread Waves in the Sea-Swell Band. Coast. Eng. 2016, 114, 220–232. [Google Scholar] [CrossRef]
- Torres, M.J.; Lam, M.-A.Y.-H.; Malej, M. Practical Guidance for Numerical Modeling in FUNWAVE-TVD; US Army Engineer Research and Development Center: Hanover, NH, USA, 2022. [Google Scholar]
- Tonelli, M.; Petti, M. Hybrid Finite Volume–Finite Difference Scheme for 2DH Improved Boussinesq Equations. Coast. Eng. 2009, 56, 609–620. [Google Scholar] [CrossRef]
- Kennedy, A.B.; Chen, Q.; Kirby, J.T.; Dalrymple, R.A. Boussinesq Modeling of Wave Transformation, Breaking, and Runup. I: 1D. J. Waterw. Port Coast. Ocean Eng. 2000, 126, 39–47. [Google Scholar] [CrossRef]
- McCarroll, R.J.; Brander, R.W.; Turner, I.L.; Power, H.E.; Mortlock, T.R. Lagrangian Observations of Circulation on an Embayed Beach with Headland Rip Currents. Mar. Geol. 2014, 355, 173–188. [Google Scholar] [CrossRef]
- Elgar, S.; Raubenheimer, B.; Clark, D.B.; Moulton, M. Extremely Low Frequency (0.1 to 1.0 mHz) Surf Zone Currents. Geophys. Res. Lett. 2019, 46, 1531–1536. [Google Scholar] [CrossRef]
- Elgar, S.; Dooley, C.; Gorrell, L.; Raubenheimer, B. Observations of Two-Dimensional Turbulence in the Surfzone. Phys. Fluids 2023, 35, 085142. [Google Scholar] [CrossRef]
- Floc’h, F.; Mabiala, G.R.; Almar, R.; Castelle, B.; Hall, N.; Du Penhoat, Y.; Scott, T.; Delacourt, C. Flash Rip Statistics from Video Images. J. Coast. Res. 2018, 81, 100–106. [Google Scholar] [CrossRef]
- Hally-Rosendahl, K.; Feddersen, F.; Clark, D.B.; Guza, R.T. Surfzone to Inner-shelf Exchange Estimated from Dye Tracer Balances. J. Geophys. Res. Oceans 2015, 120, 6289–6308. [Google Scholar] [CrossRef]
- Liu, Y.; Wu, C.H. Lifeguarding Operational Camera Kiosk System (LOCKS) for Flash Rip Warning: Development and Application. Coast. Eng. 2019, 152, 103537. [Google Scholar] [CrossRef]
- Khan, F.H.; Stewart, D.; De Silva, A.; Palinkas, A.; Dusek, G.; Davis, J.; Pang, A. RipScout: Realtime ML-Assisted Rip Current Detection and Automated Data Collection Using UAVs. IEEE J. Sel. Top. Appl. Earth Obs. Remote Sens. 2025, 18, 7742–7755. [Google Scholar] [CrossRef]
- Lushine, J.B. A Study of Rip Current Drownings and Related Weather Factors. Natl. Weather Dig. 1991, 16, 13–19. [Google Scholar]
- Engle, J.; MacMahan, J.; Thieke, R.J.; Hanes, D.M.; Dean, R.G. Formulation of a Rip Current Predictive Index Using Rescue Data. In Proceedings of the 2002 National Conference on Beach Preservation Technology, Biloxi, MS, USA, 23–25 January 2002; Florida Shore & Beach Preservation Association: Tallahassee, FL, USA, 2002. [Google Scholar]
- Lascody, R.L. East Central Florida Rip Current Program. Natl. Weather Dig. 1998, 22, 25–30. [Google Scholar]
- Schrader, M. Evaluation of the Modified ECFL LURCS Rip Current Forecasting Scale and Conditions of Selected Rip Current Events in Florida. Ph.D. Thesis, University of Florida, Gainesville, FL, USA, 2004. [Google Scholar]
- Meadows, G.; Purcell, H.; Guenther, D.; Meadows, L.; Kinnunen, R.; Clark, G. Rip Currents in the Great Lakes: An Unfortunate Truth. In Rip Currents: Beach Safety, Physical Oceanography, and Wave Modeling; CRC Press International: Boca Raton, FL, USA, 2011; pp. 199–214. [Google Scholar]
- Choi, J.; Kirby, J.T.; Yoon, S.B. Boussinesq Modeling of Longshore Currents in the SandyDuck Experiment under Directional Random Wave Conditions. Coast. Eng. 2015, 101, 17–34. [Google Scholar] [CrossRef]
- McCarroll, R.J.; Brander, R.W.; Turner, I.L.; Leeuwen, B.V. Shoreface Storm Morphodynamics and Mega-Rip Evolution at an Embayed Beach: Bondi Beach, NSW, Australia. Cont. Shelf Res. 2016, 116, 74–88. [Google Scholar] [CrossRef]
- Christensen, D.F.; Raubenheimer, B.; Elgar, S. The Roles of Bathymetry and Waves in Rip-Channel Dynamics. J. Geophys. Res. Earth Surf. 2024, 129, e2023JF007389. [Google Scholar] [CrossRef]
- Feddersen, F.; Clark, D.B.; Guza, R.T. Modeling Surf Zone Tracer Plumes: 1. Waves, Mean Currents, and Low-frequency Eddies. J. Geophys. Res. Oceans 2011, 116, 2011JC007210. [Google Scholar] [CrossRef]


Disclaimer/Publisher’s Note: The statements, opinions and data contained in all publications are solely those of the individual author(s) and contributor(s) and not of MDPI and/or the editor(s). MDPI and/or the editor(s) disclaim responsibility for any injury to people or property resulting from any ideas, methods, instructions or products referred to in the content. |
© 2025 by the authors. Licensee MDPI, Basel, Switzerland. This article is an open access article distributed under the terms and conditions of the Creative Commons Attribution (CC BY) license (https://creativecommons.org/licenses/by/4.0/).