
The Effect of Multiple Factors on the Fatigue Crack Growth Behavior of DH36 Steel in Arctic Environment


Abstract
1. Introduction
2. Test Details
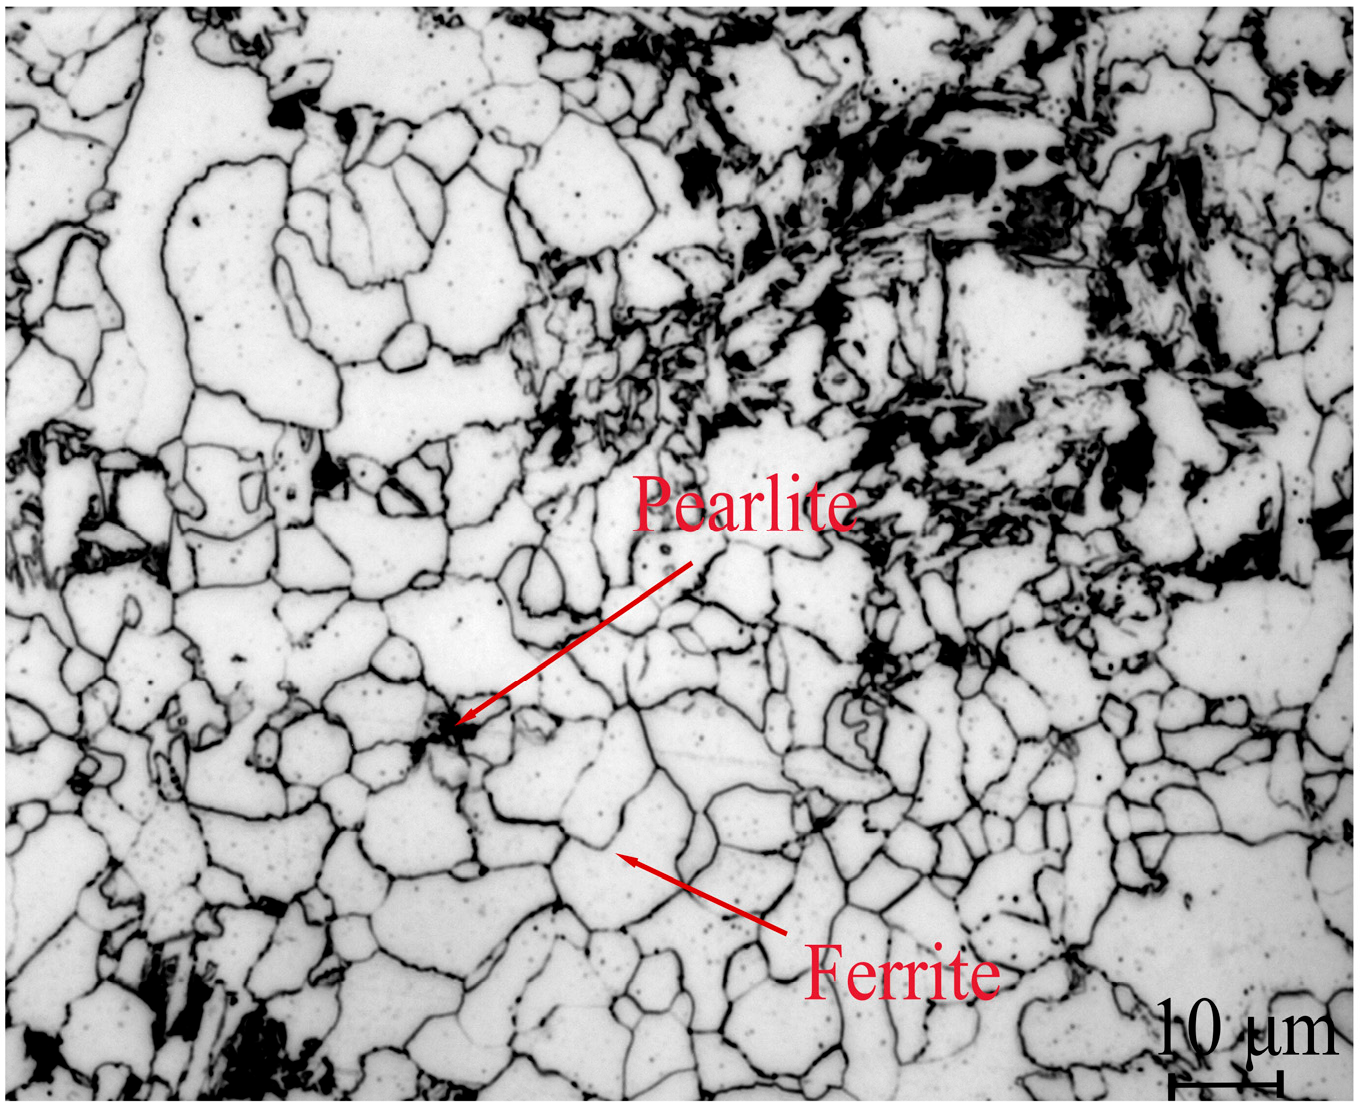
2.1. Test Material
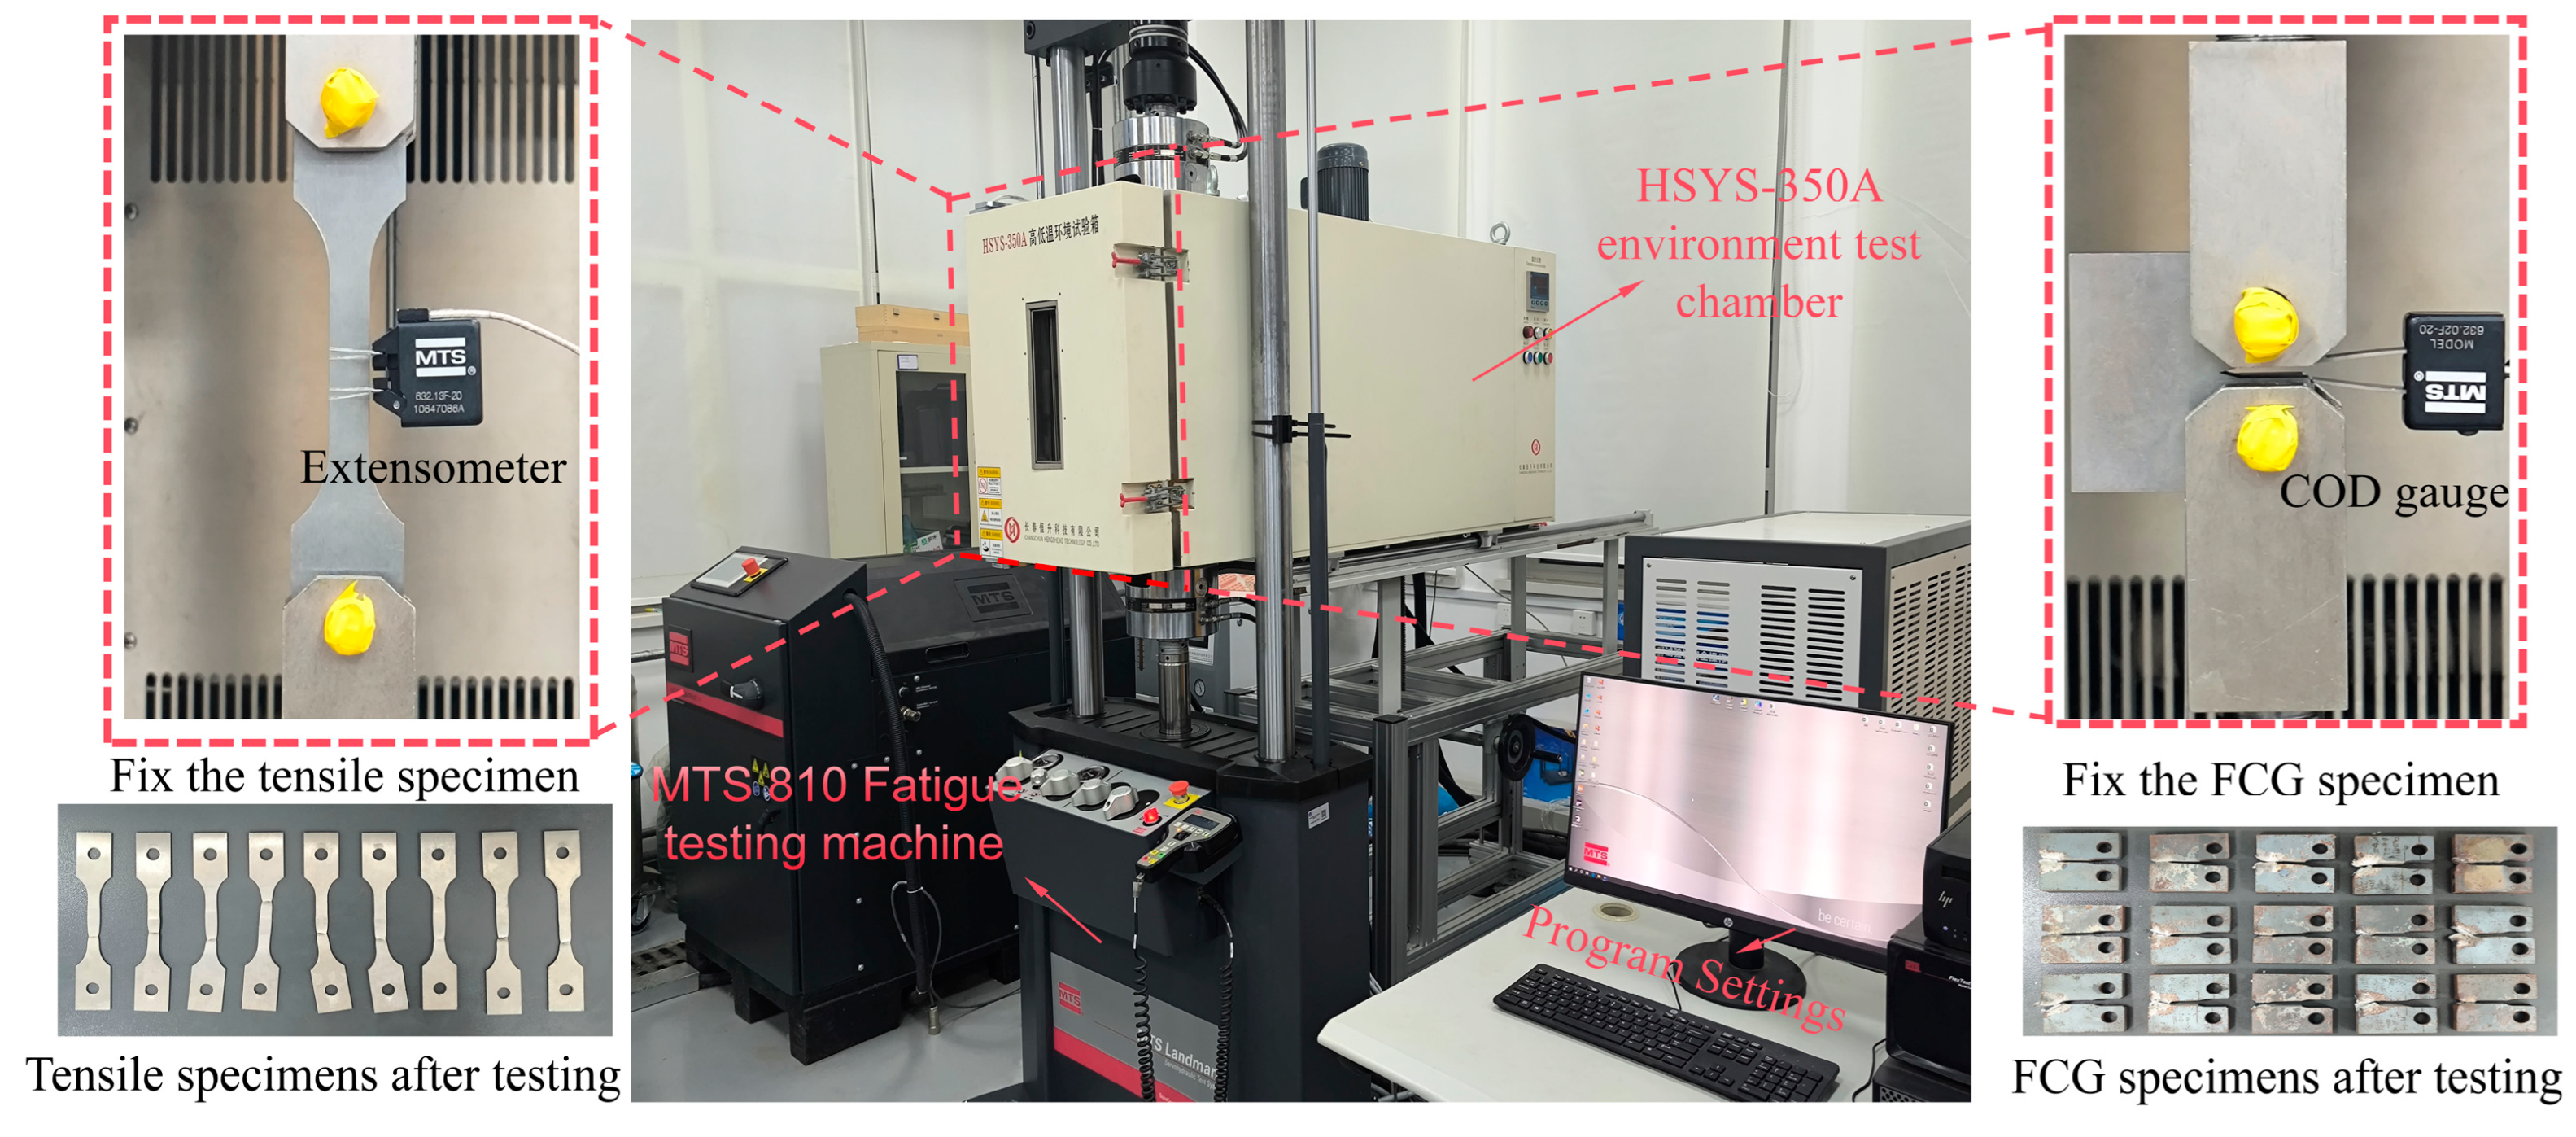
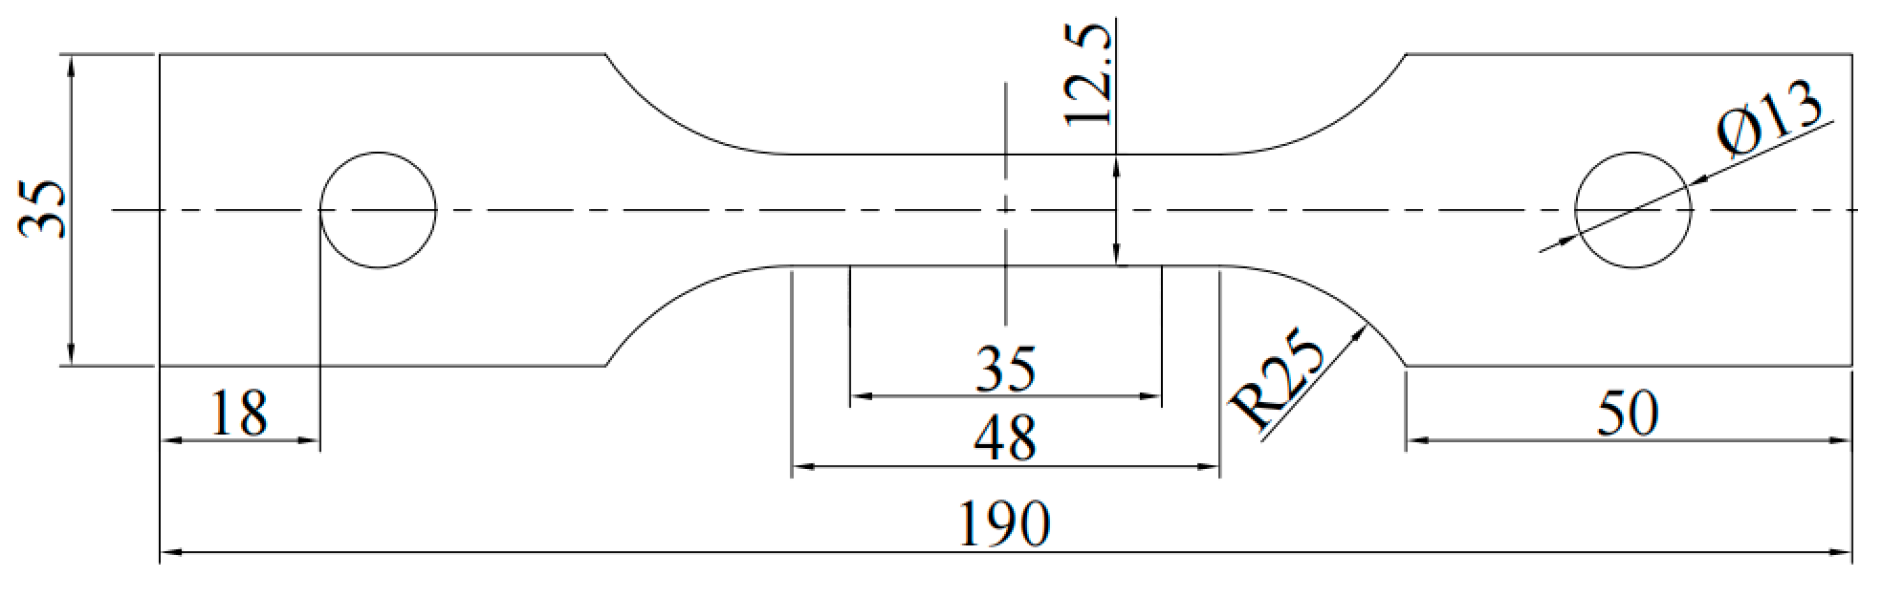
2.2. Tensile Test
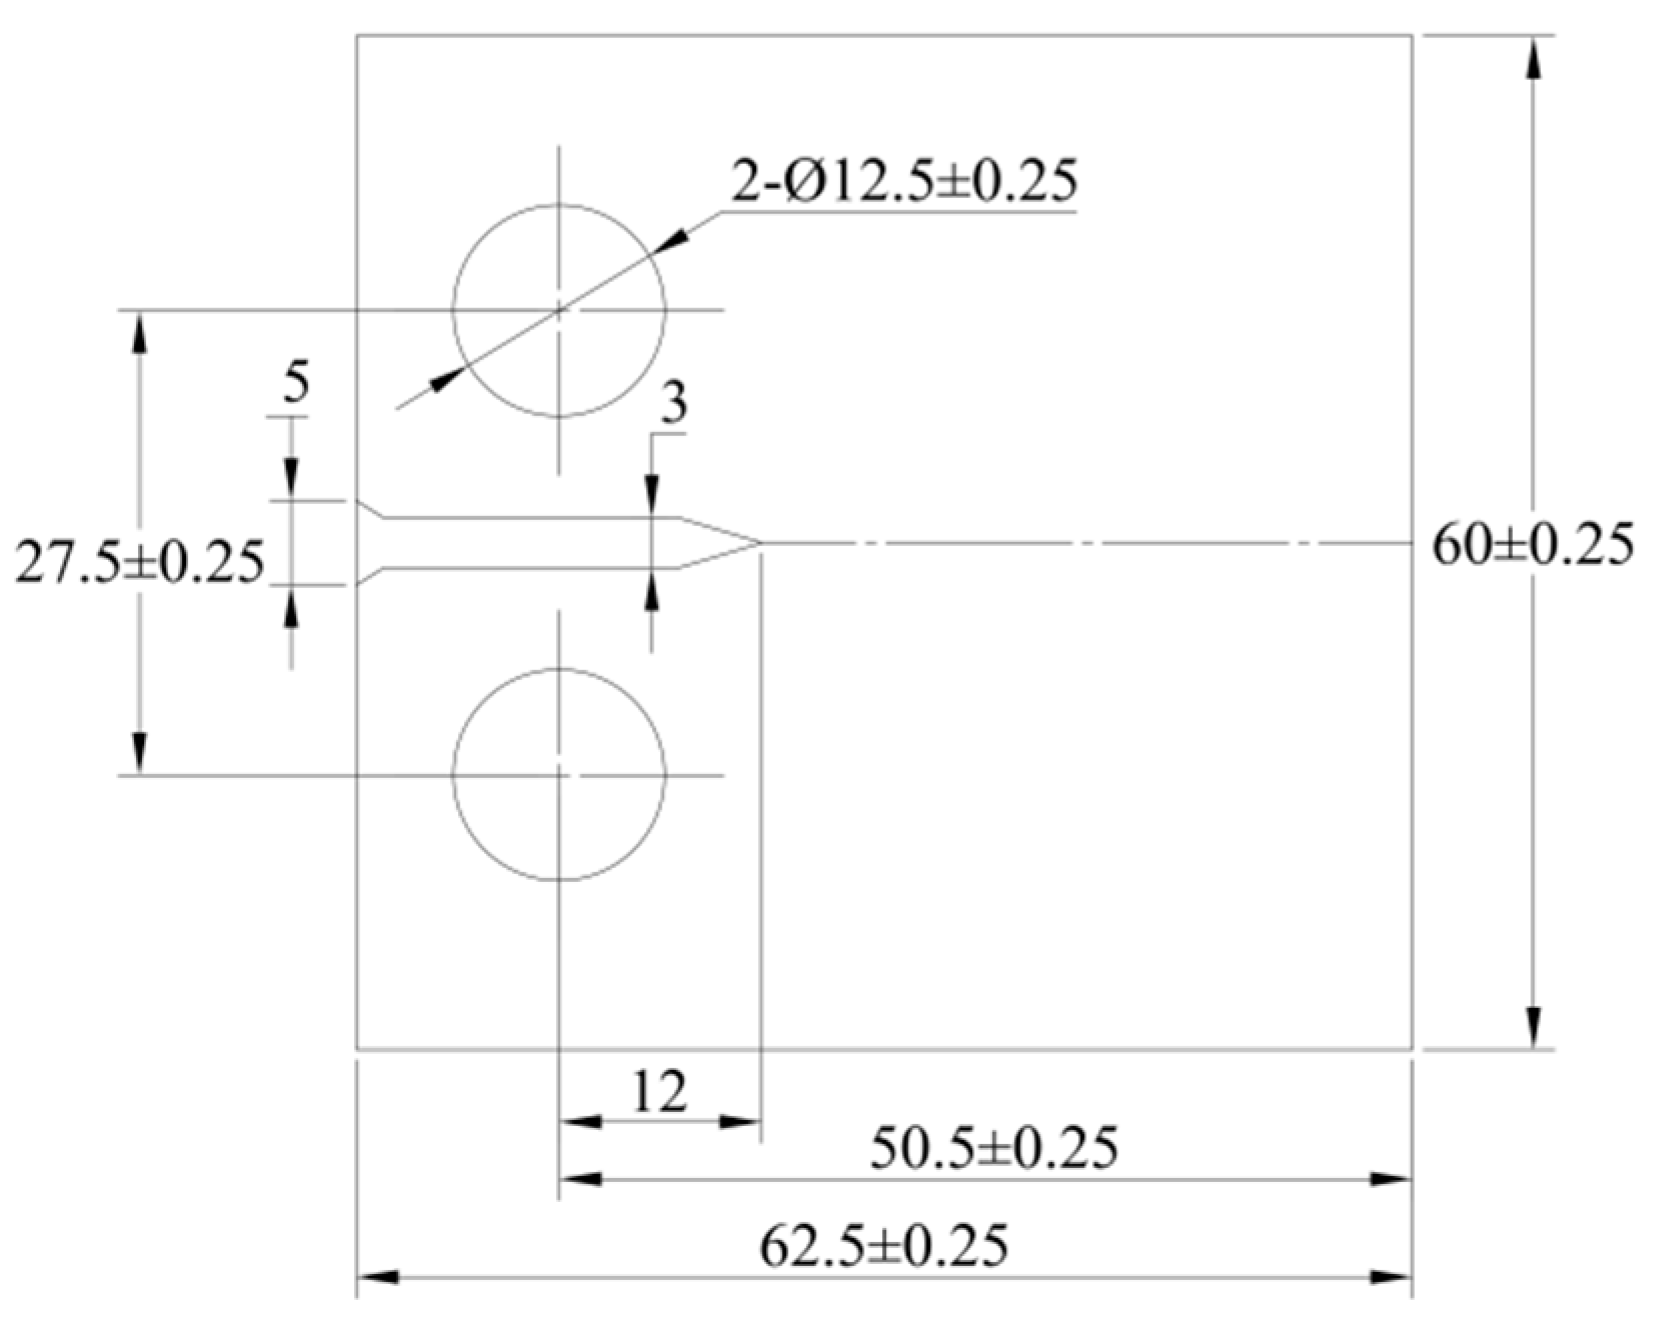
2.3. FCG Test
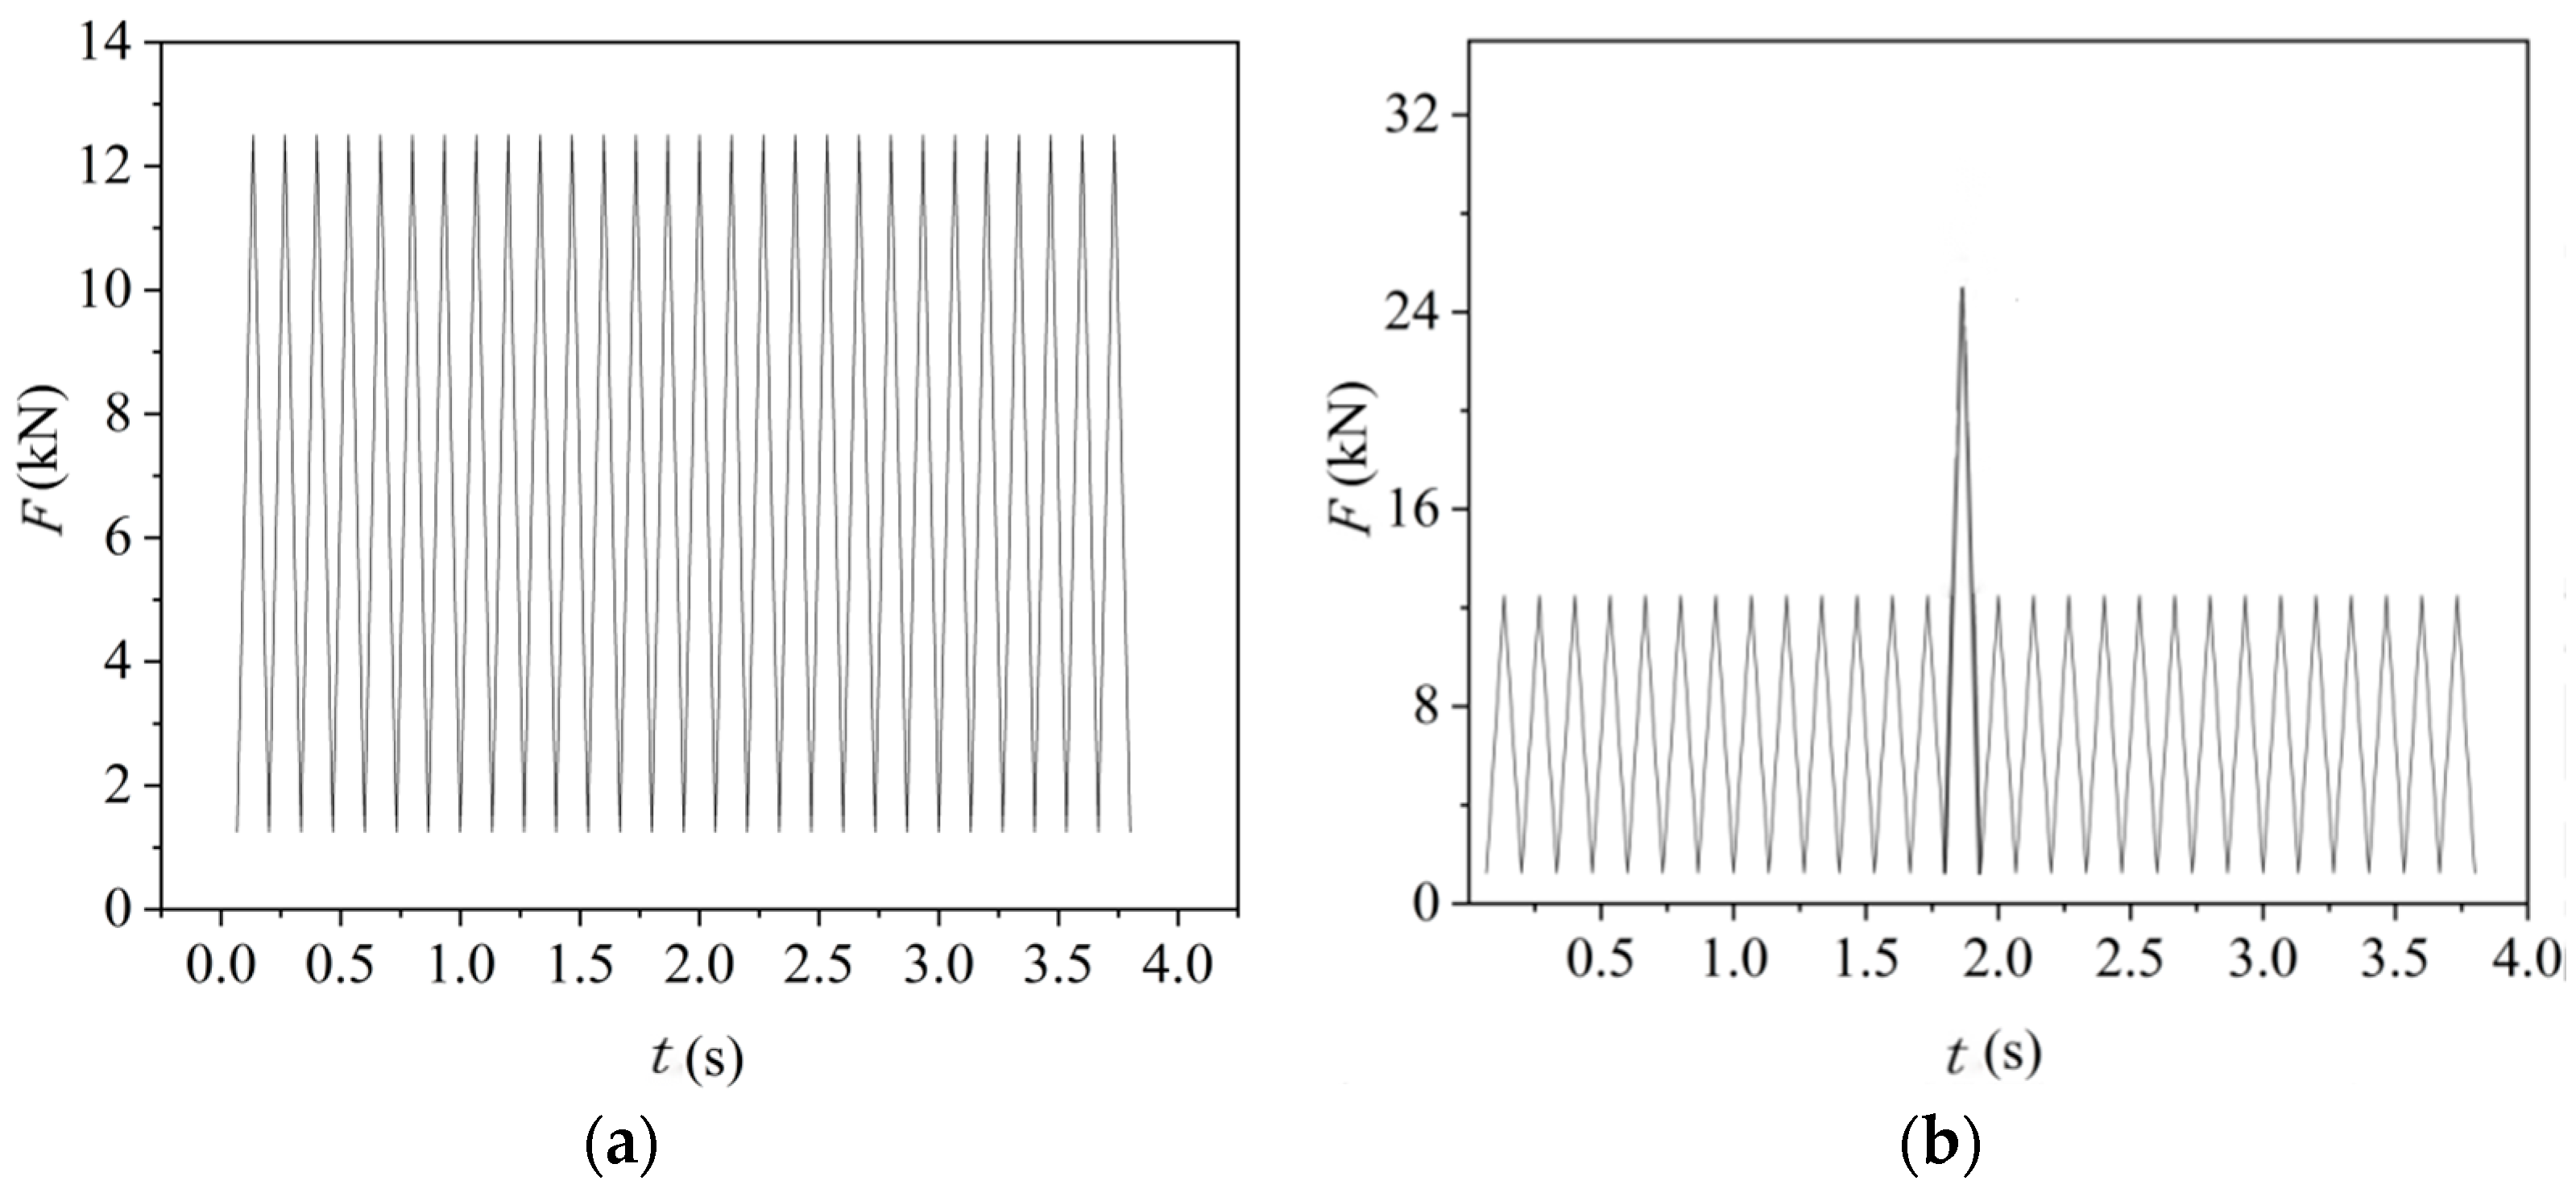
2.3.1. Test Parameters
2.3.2. Data Processing Methods
3. Test Results and Discussion
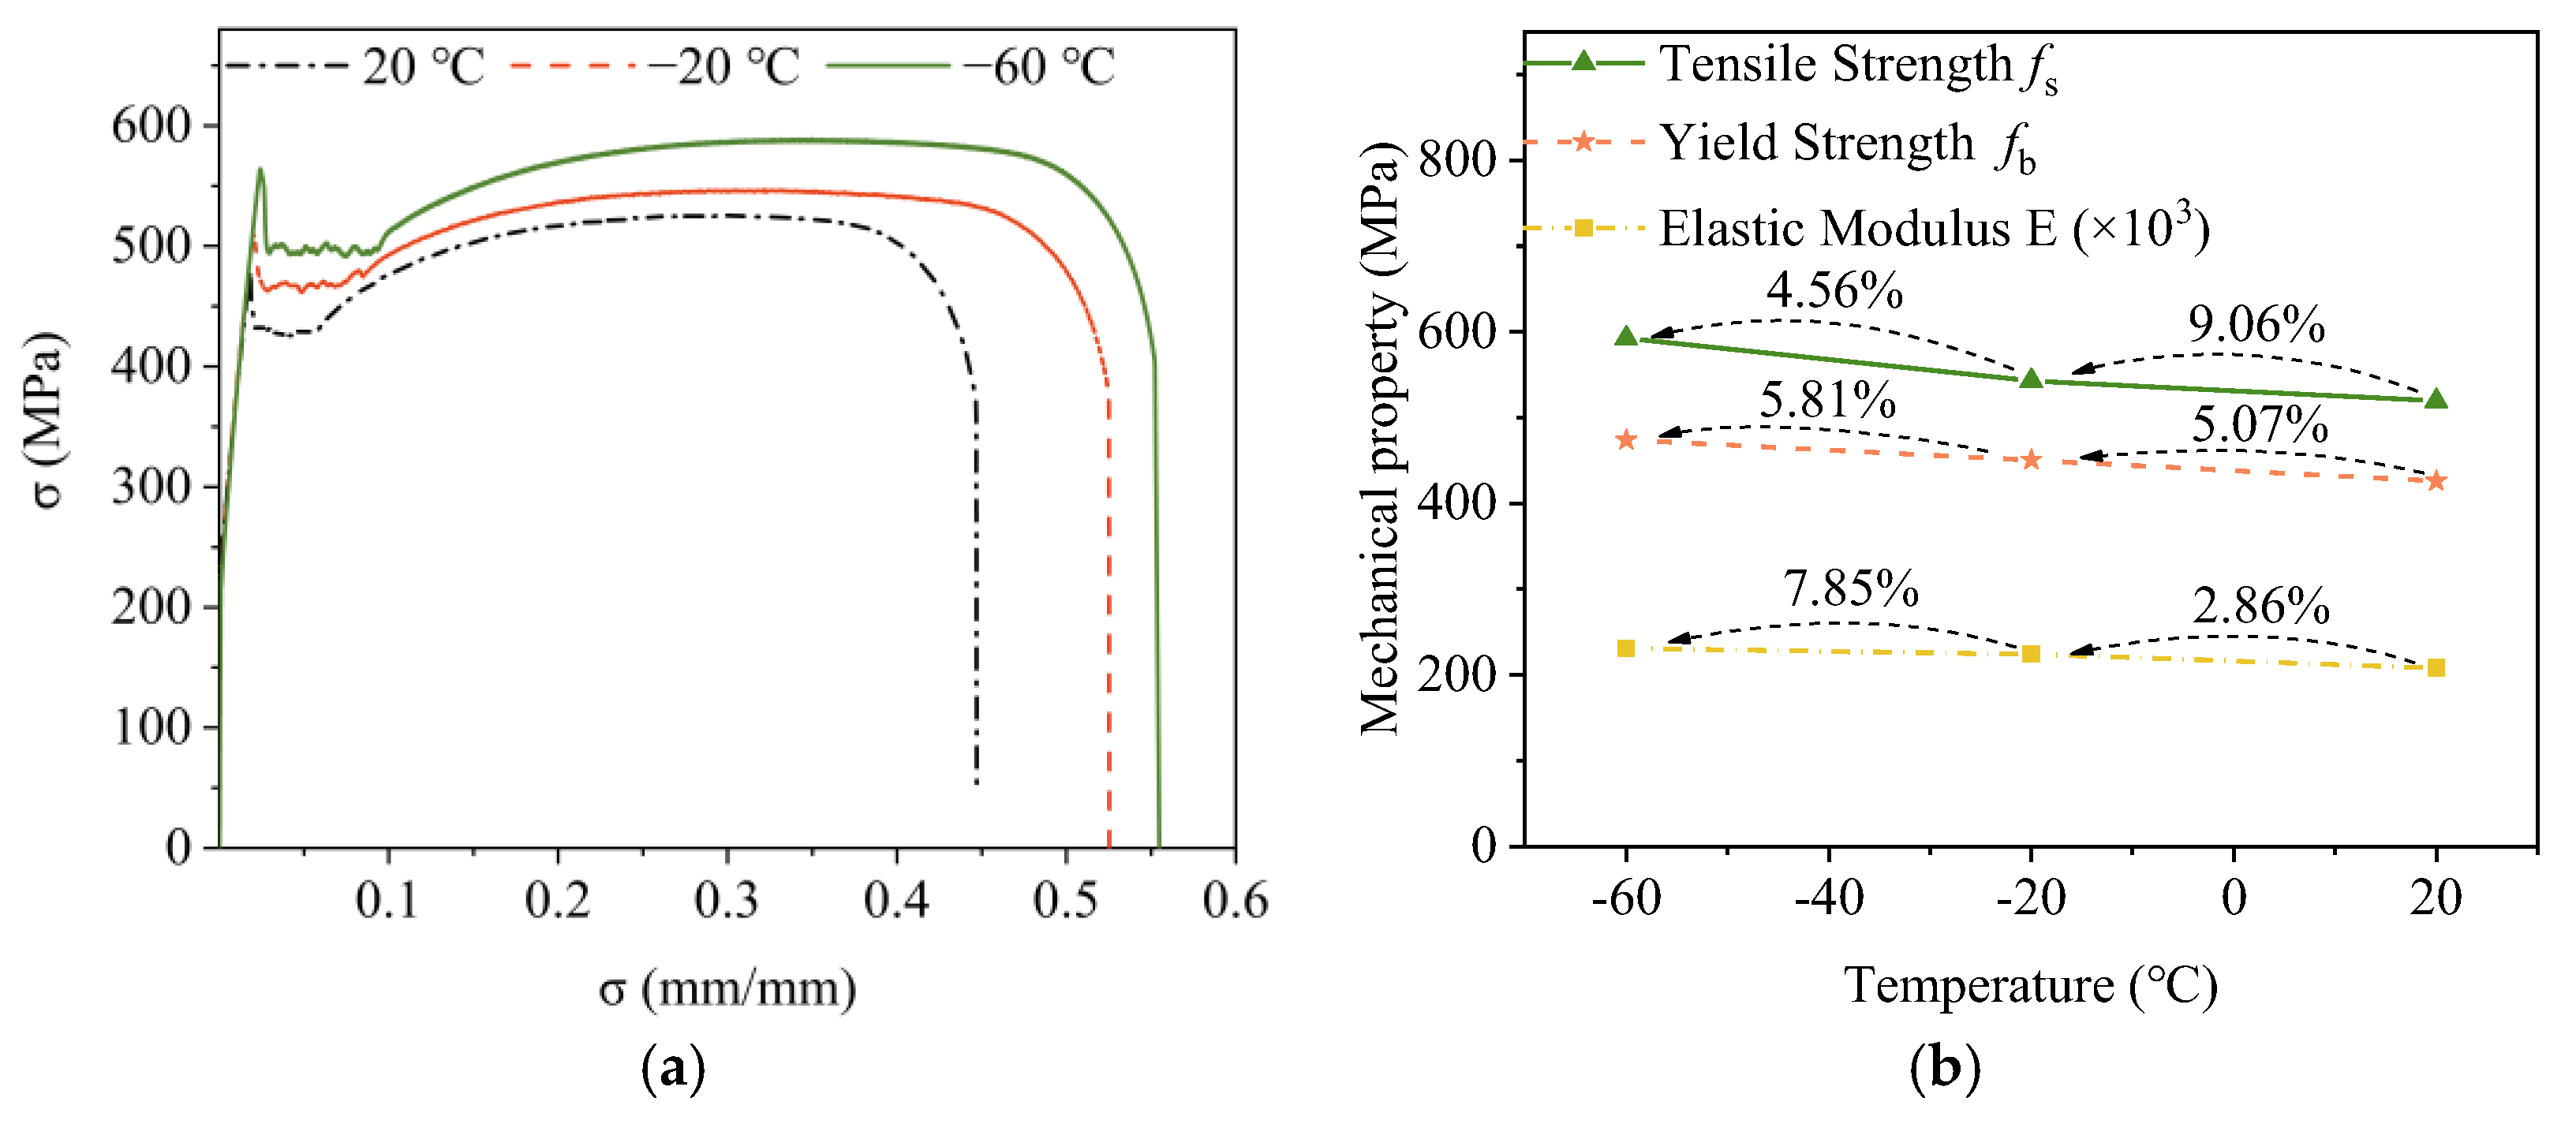
3.1. Mechanical Properties of DH36 Steel at Different Temperatures
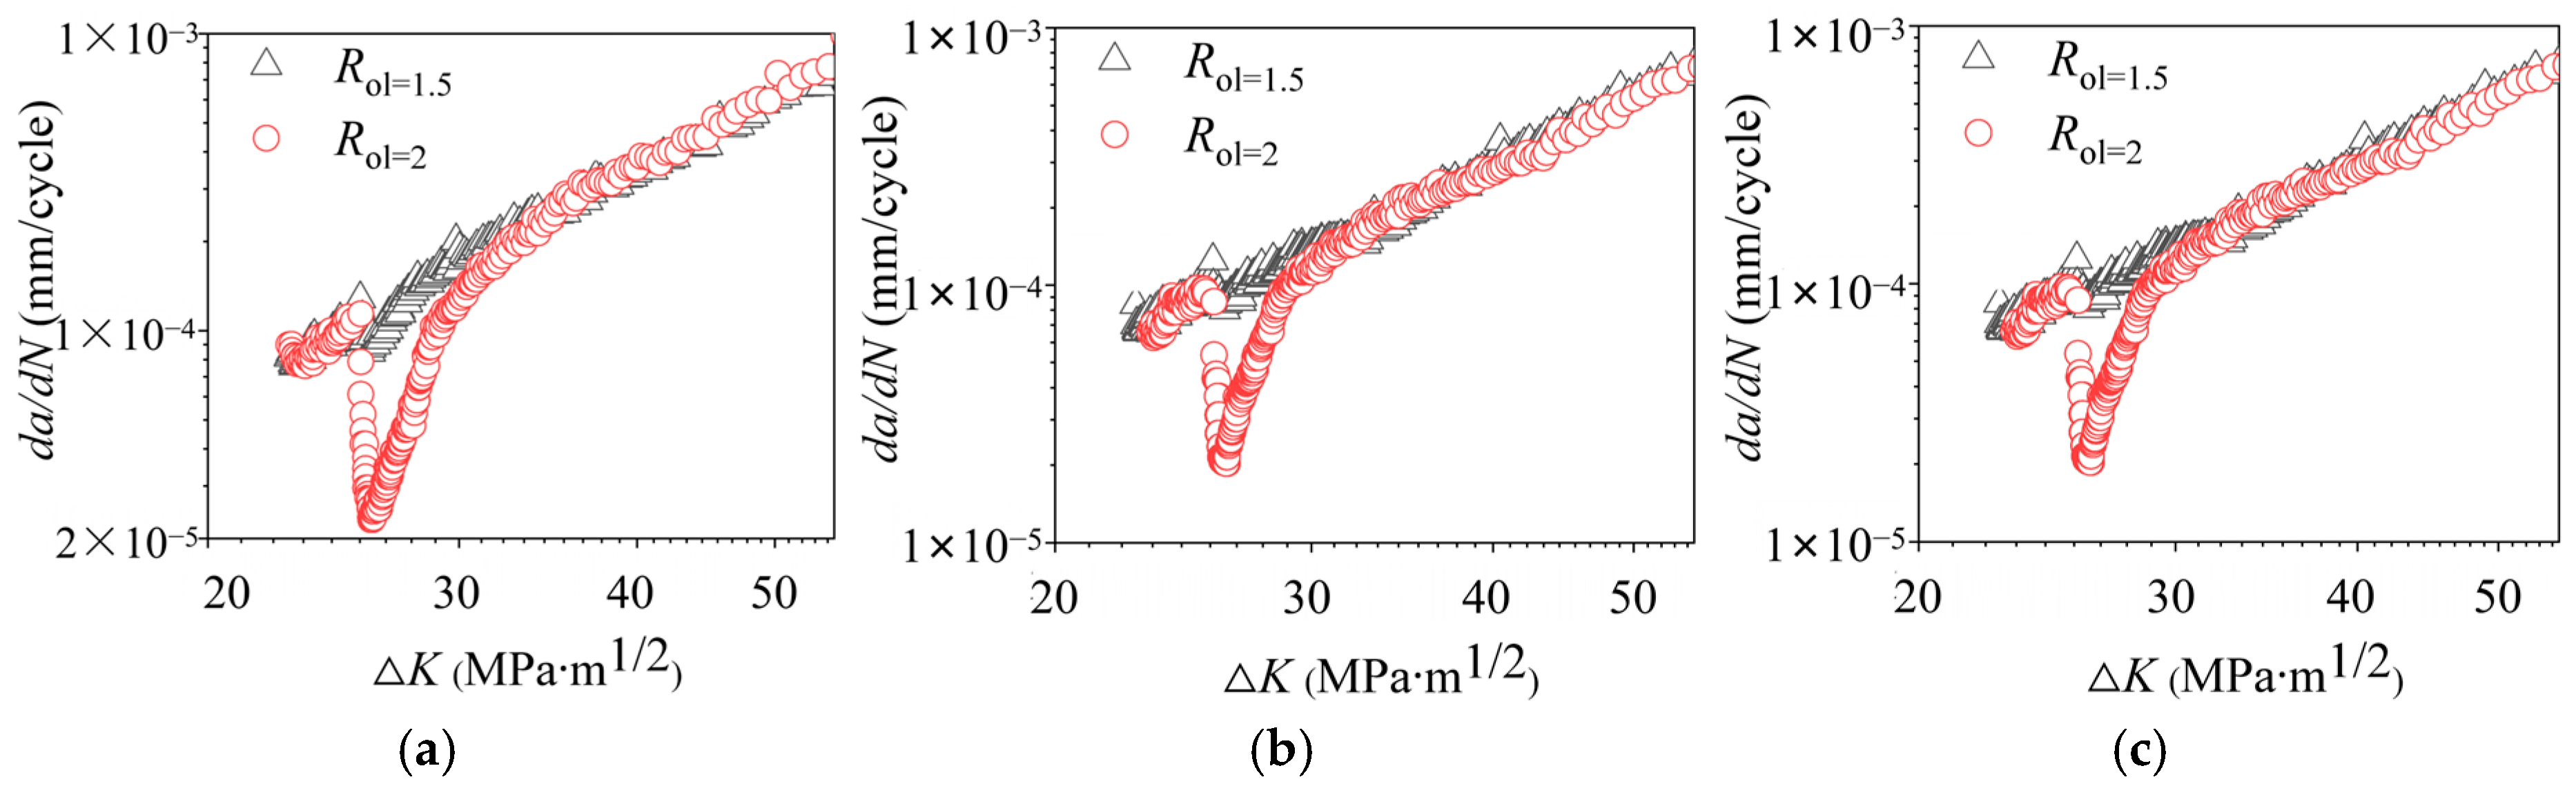
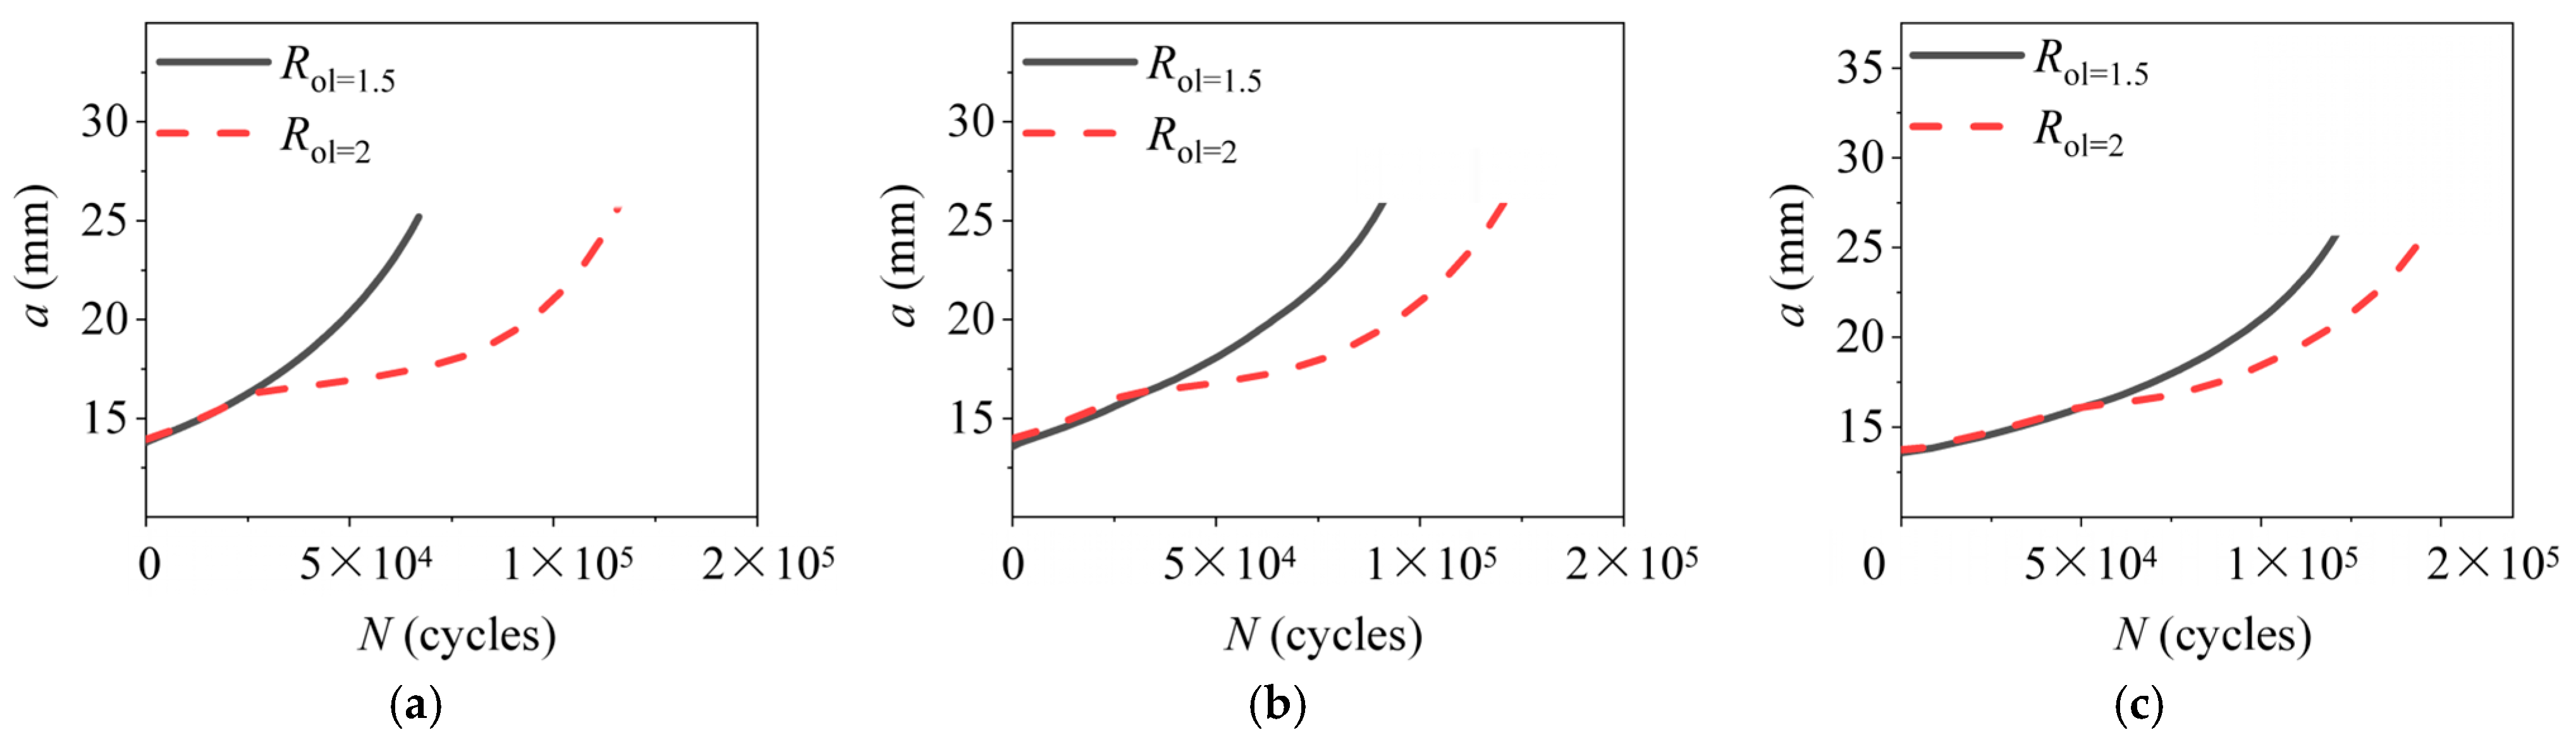
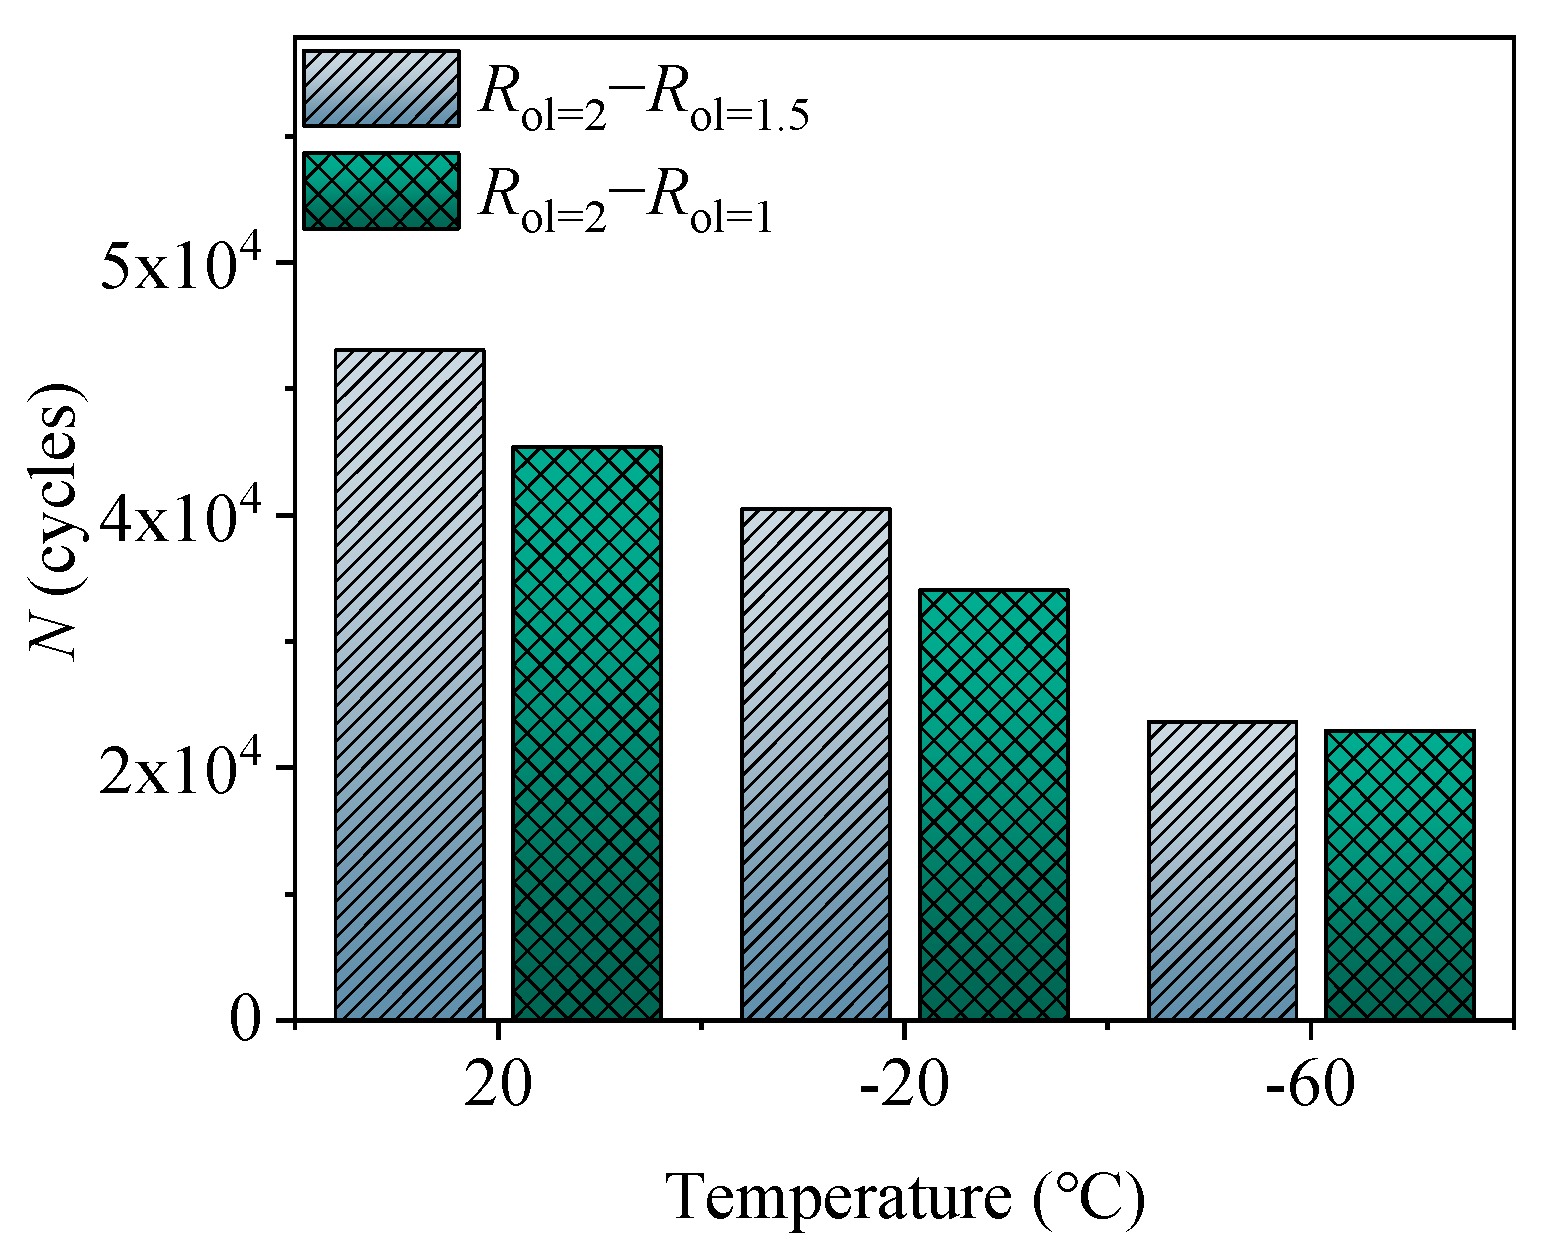
3.2. FCG Behavior of DH36 Steel Under the Combined Effect of Temperature and Rol
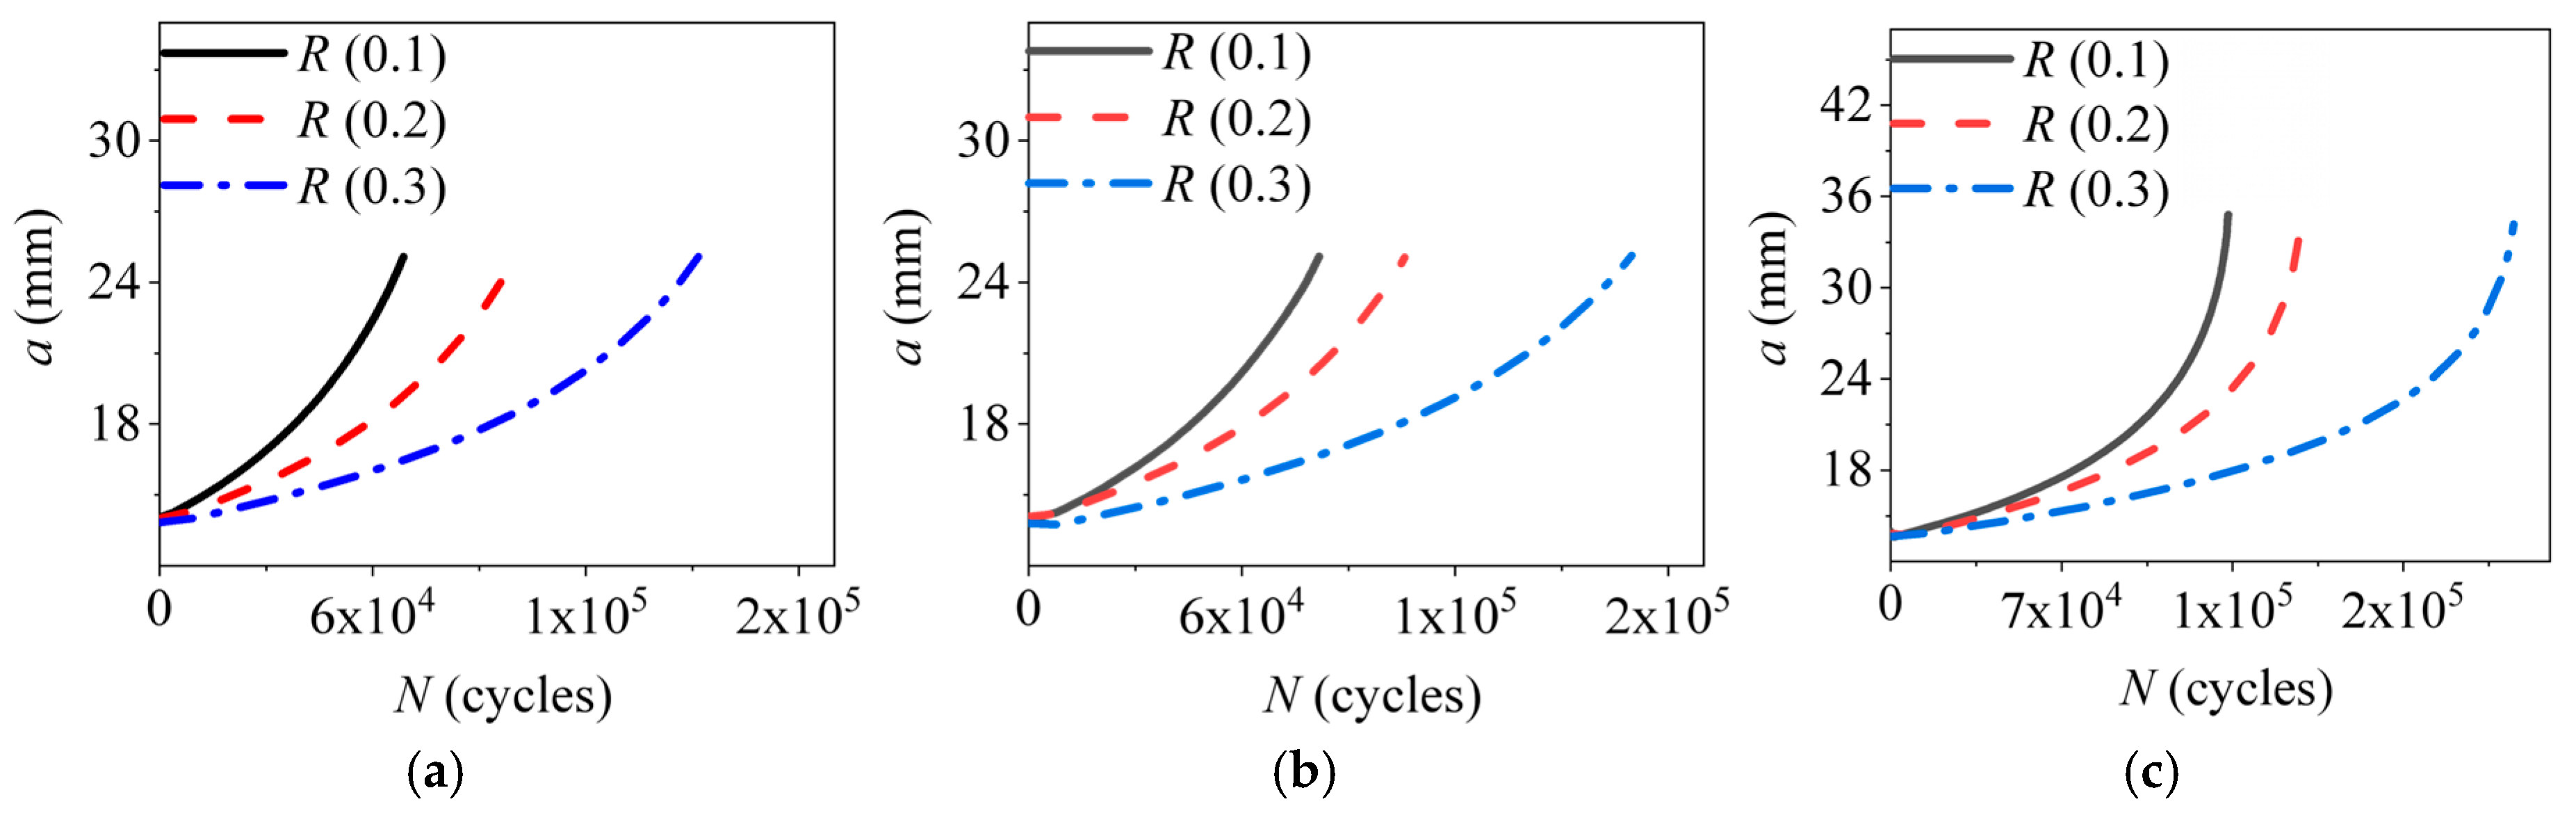
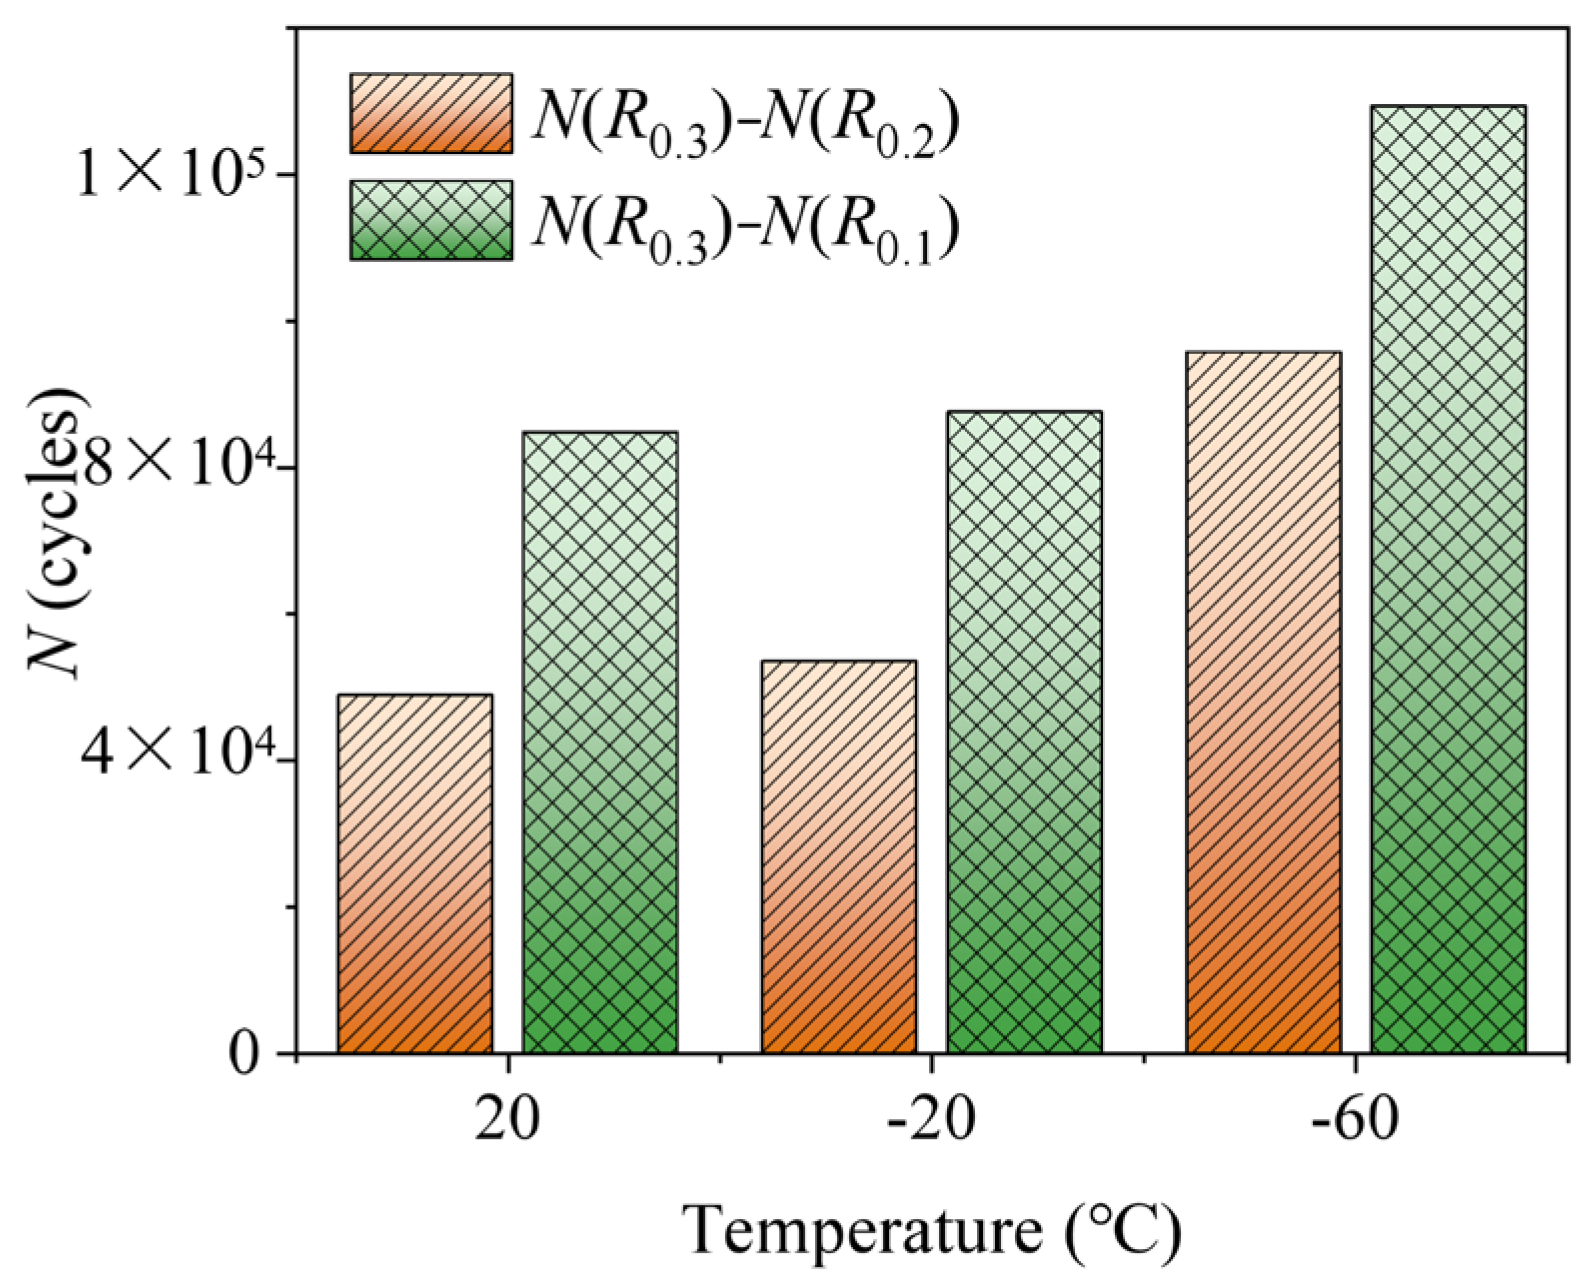
3.3. FCG Behavior of DH36 Steel Under the Combined Effect of Temperature and R
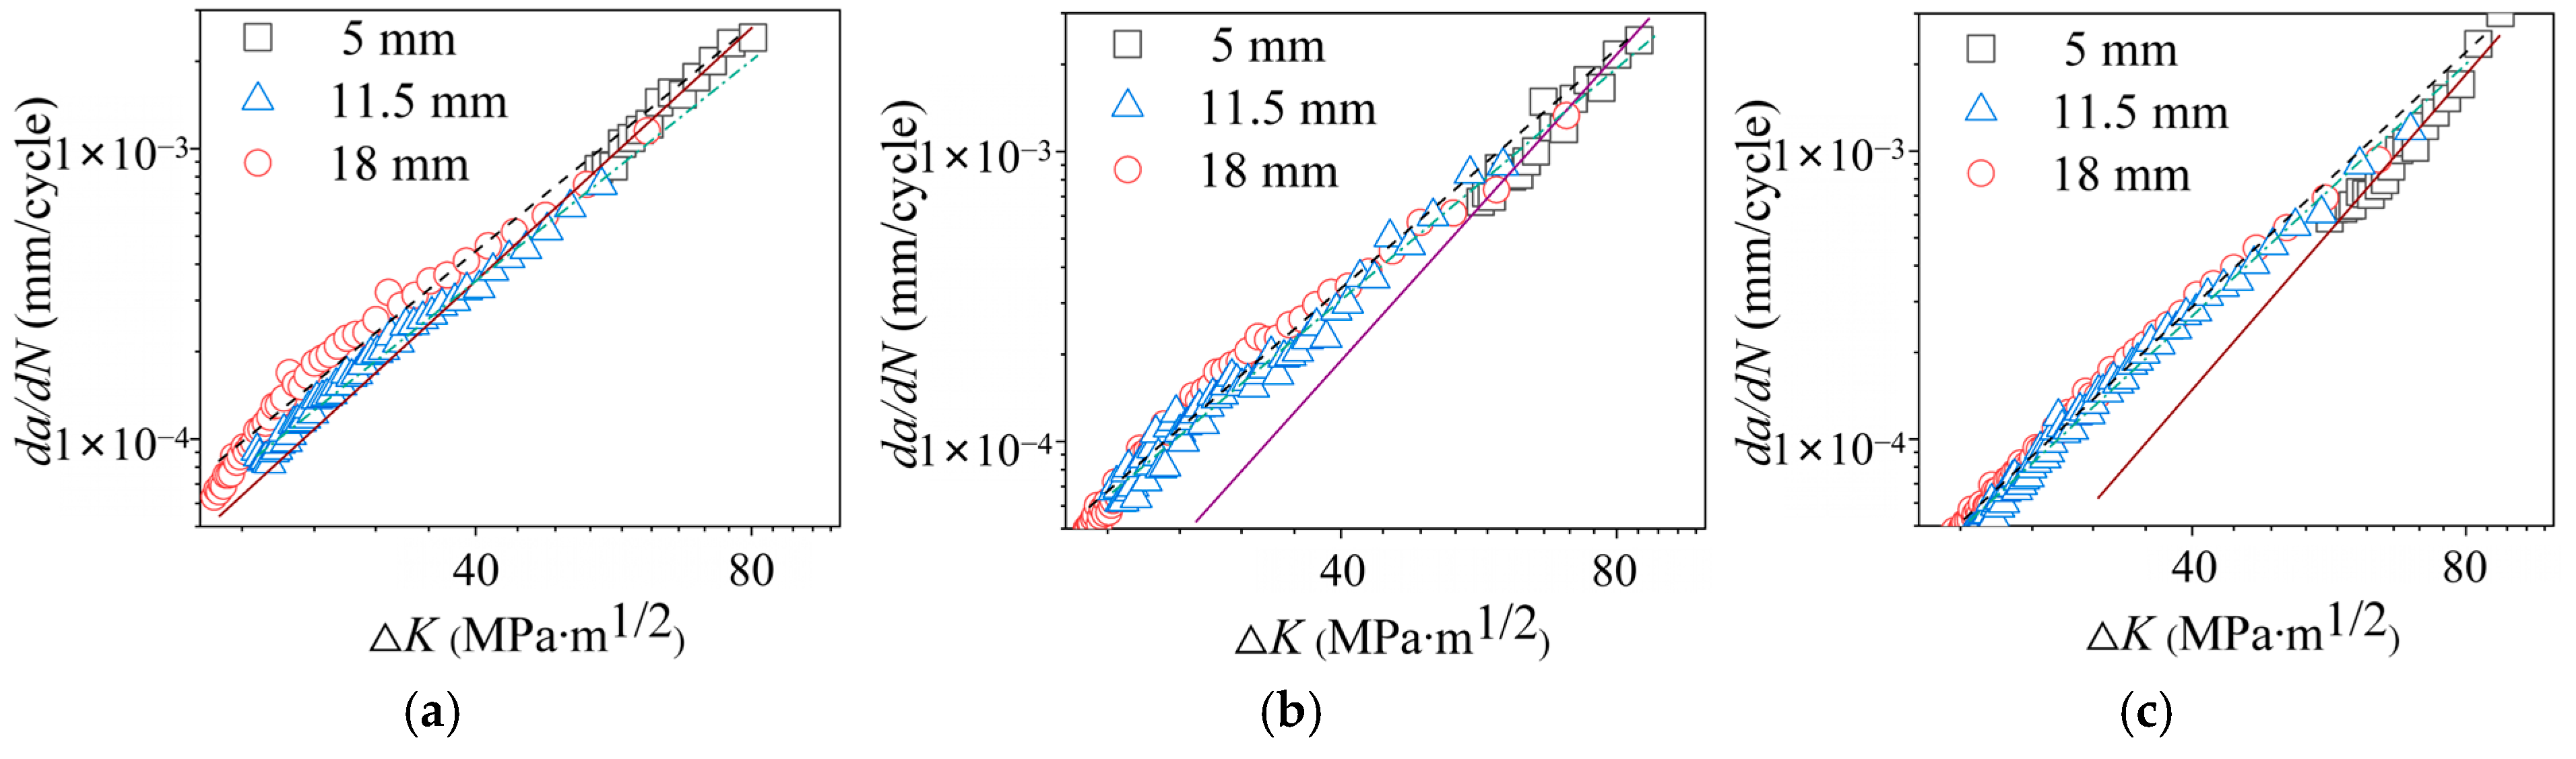
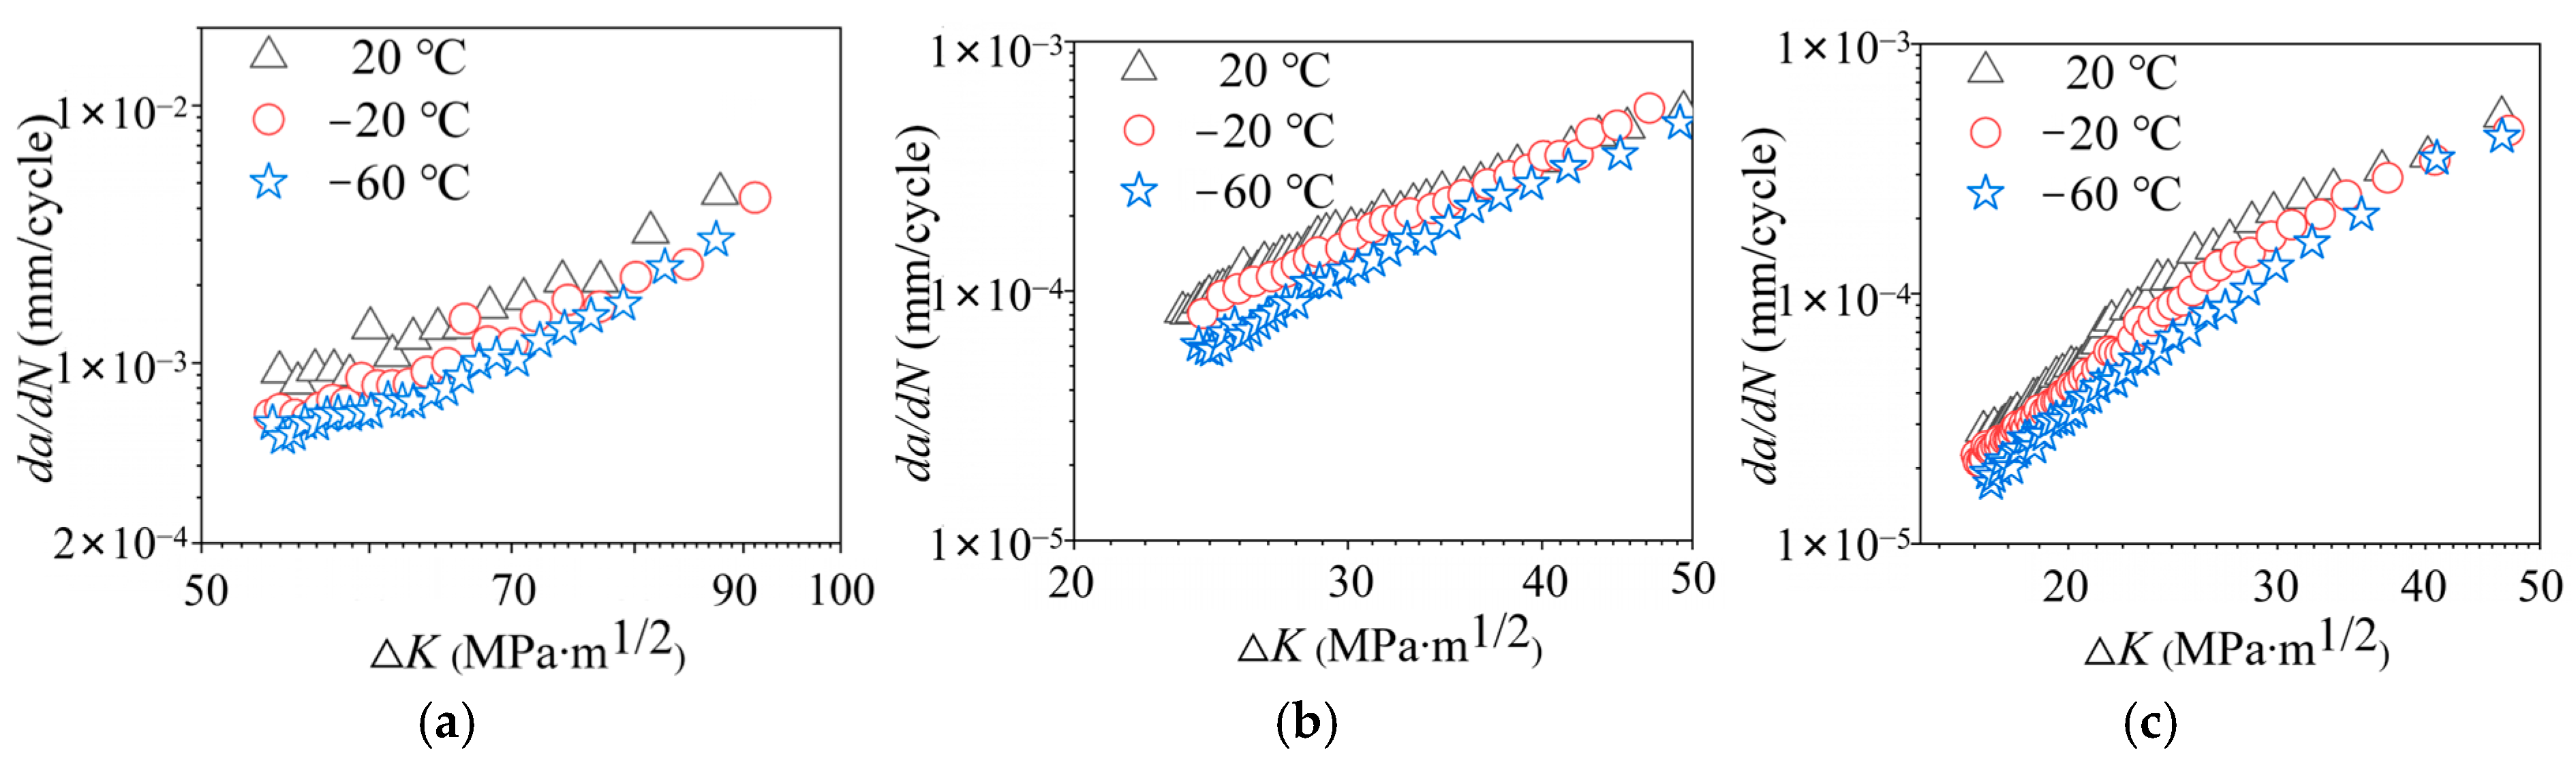
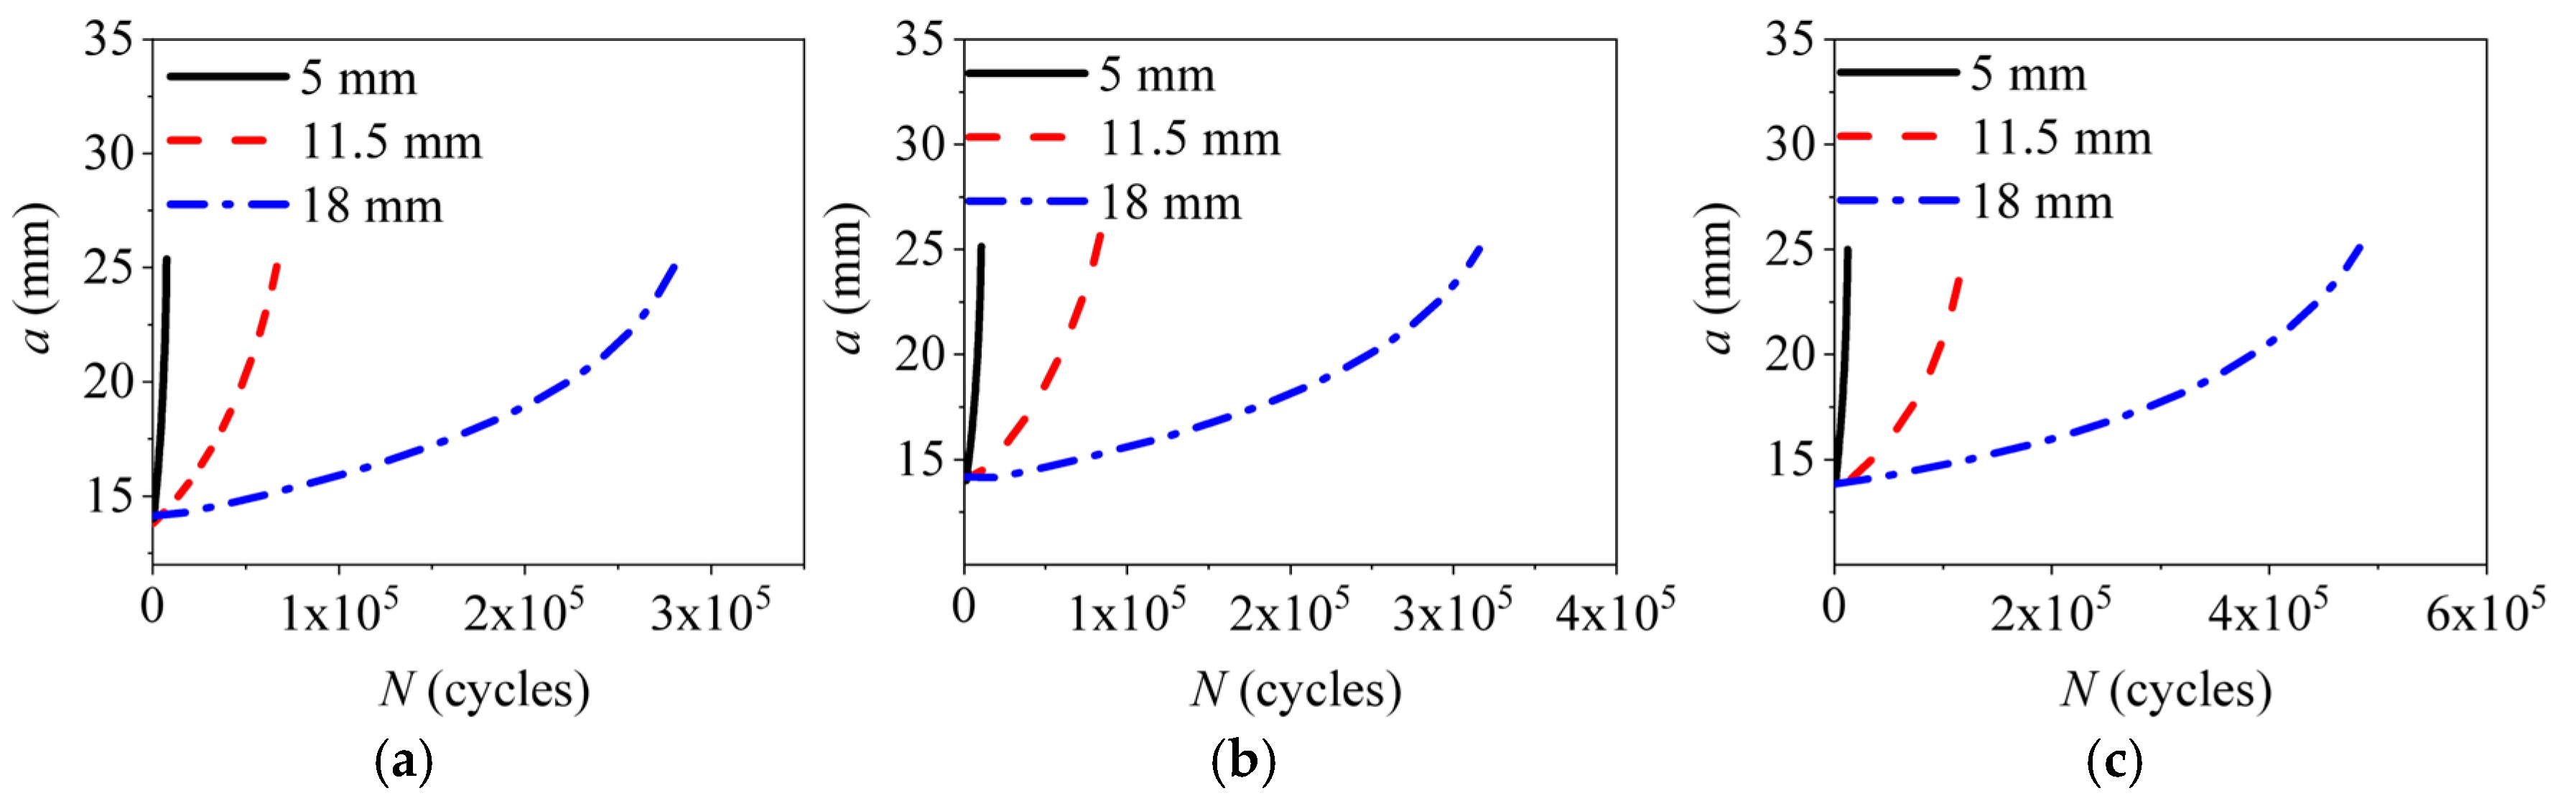
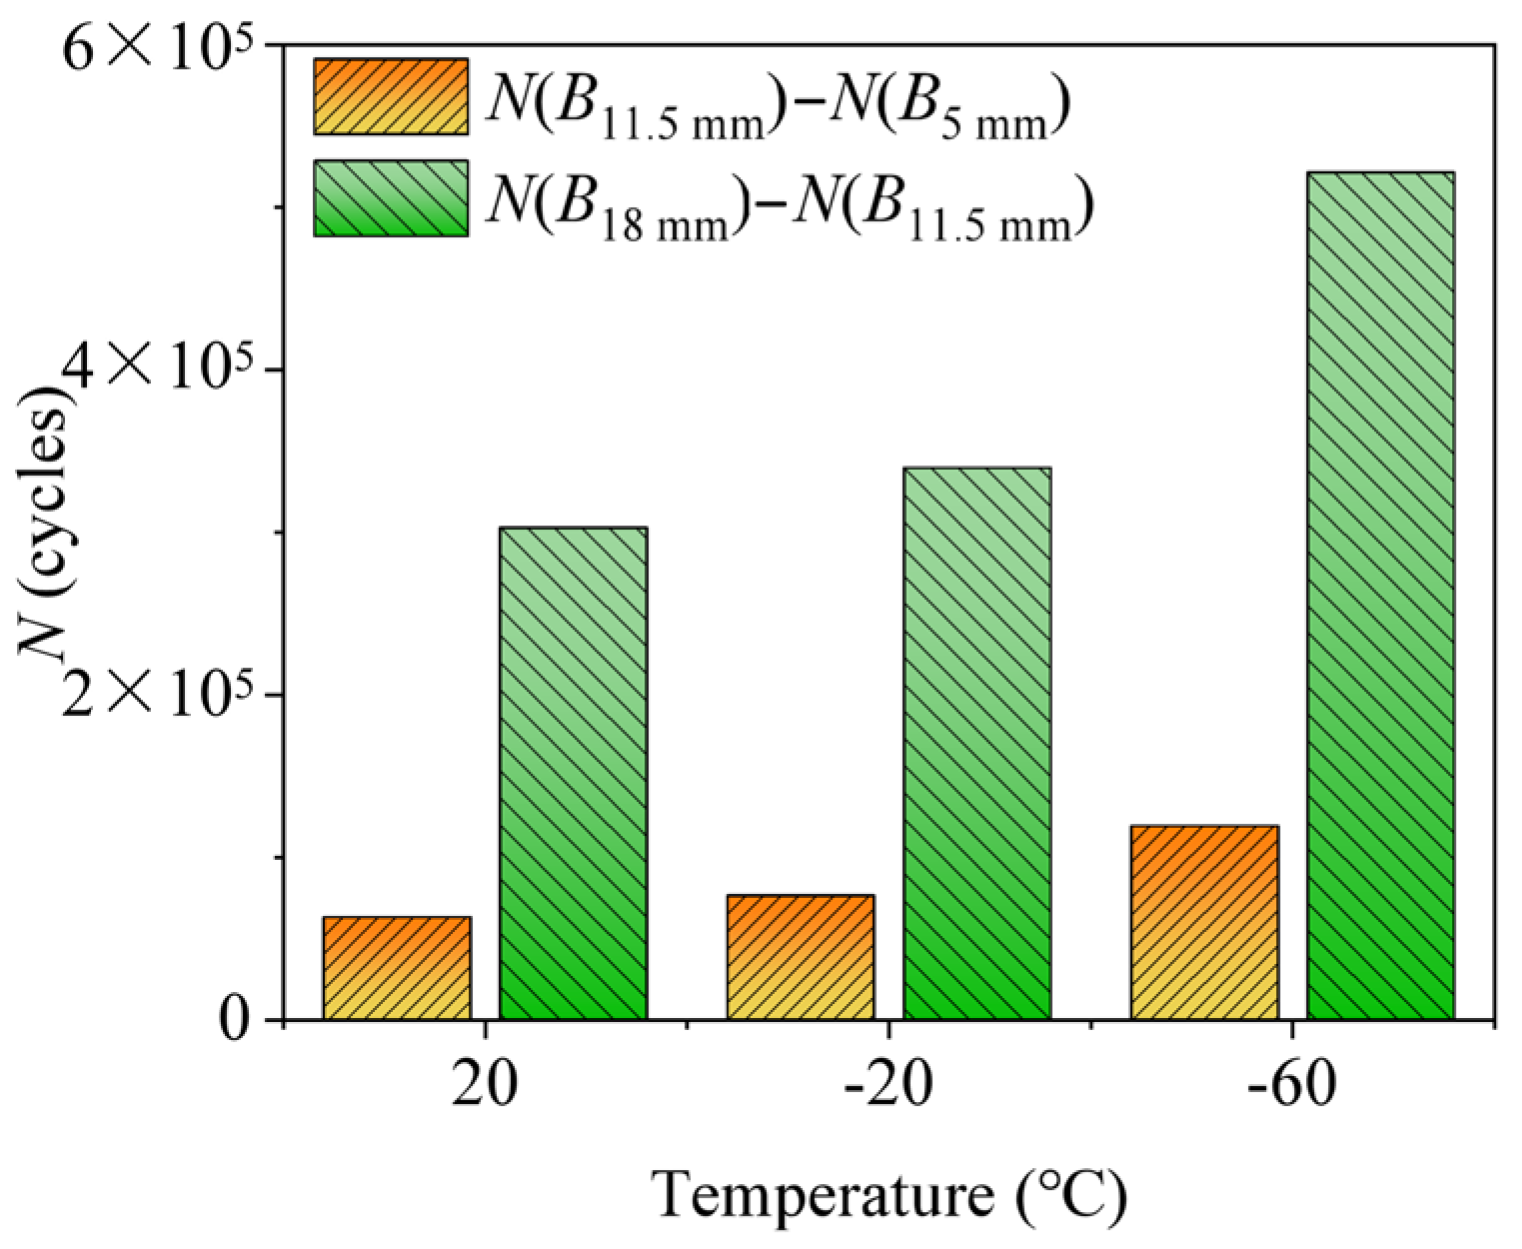
3.4. FCG Behavior of DH36 Steel Under the Combined Effect of Temperature and B
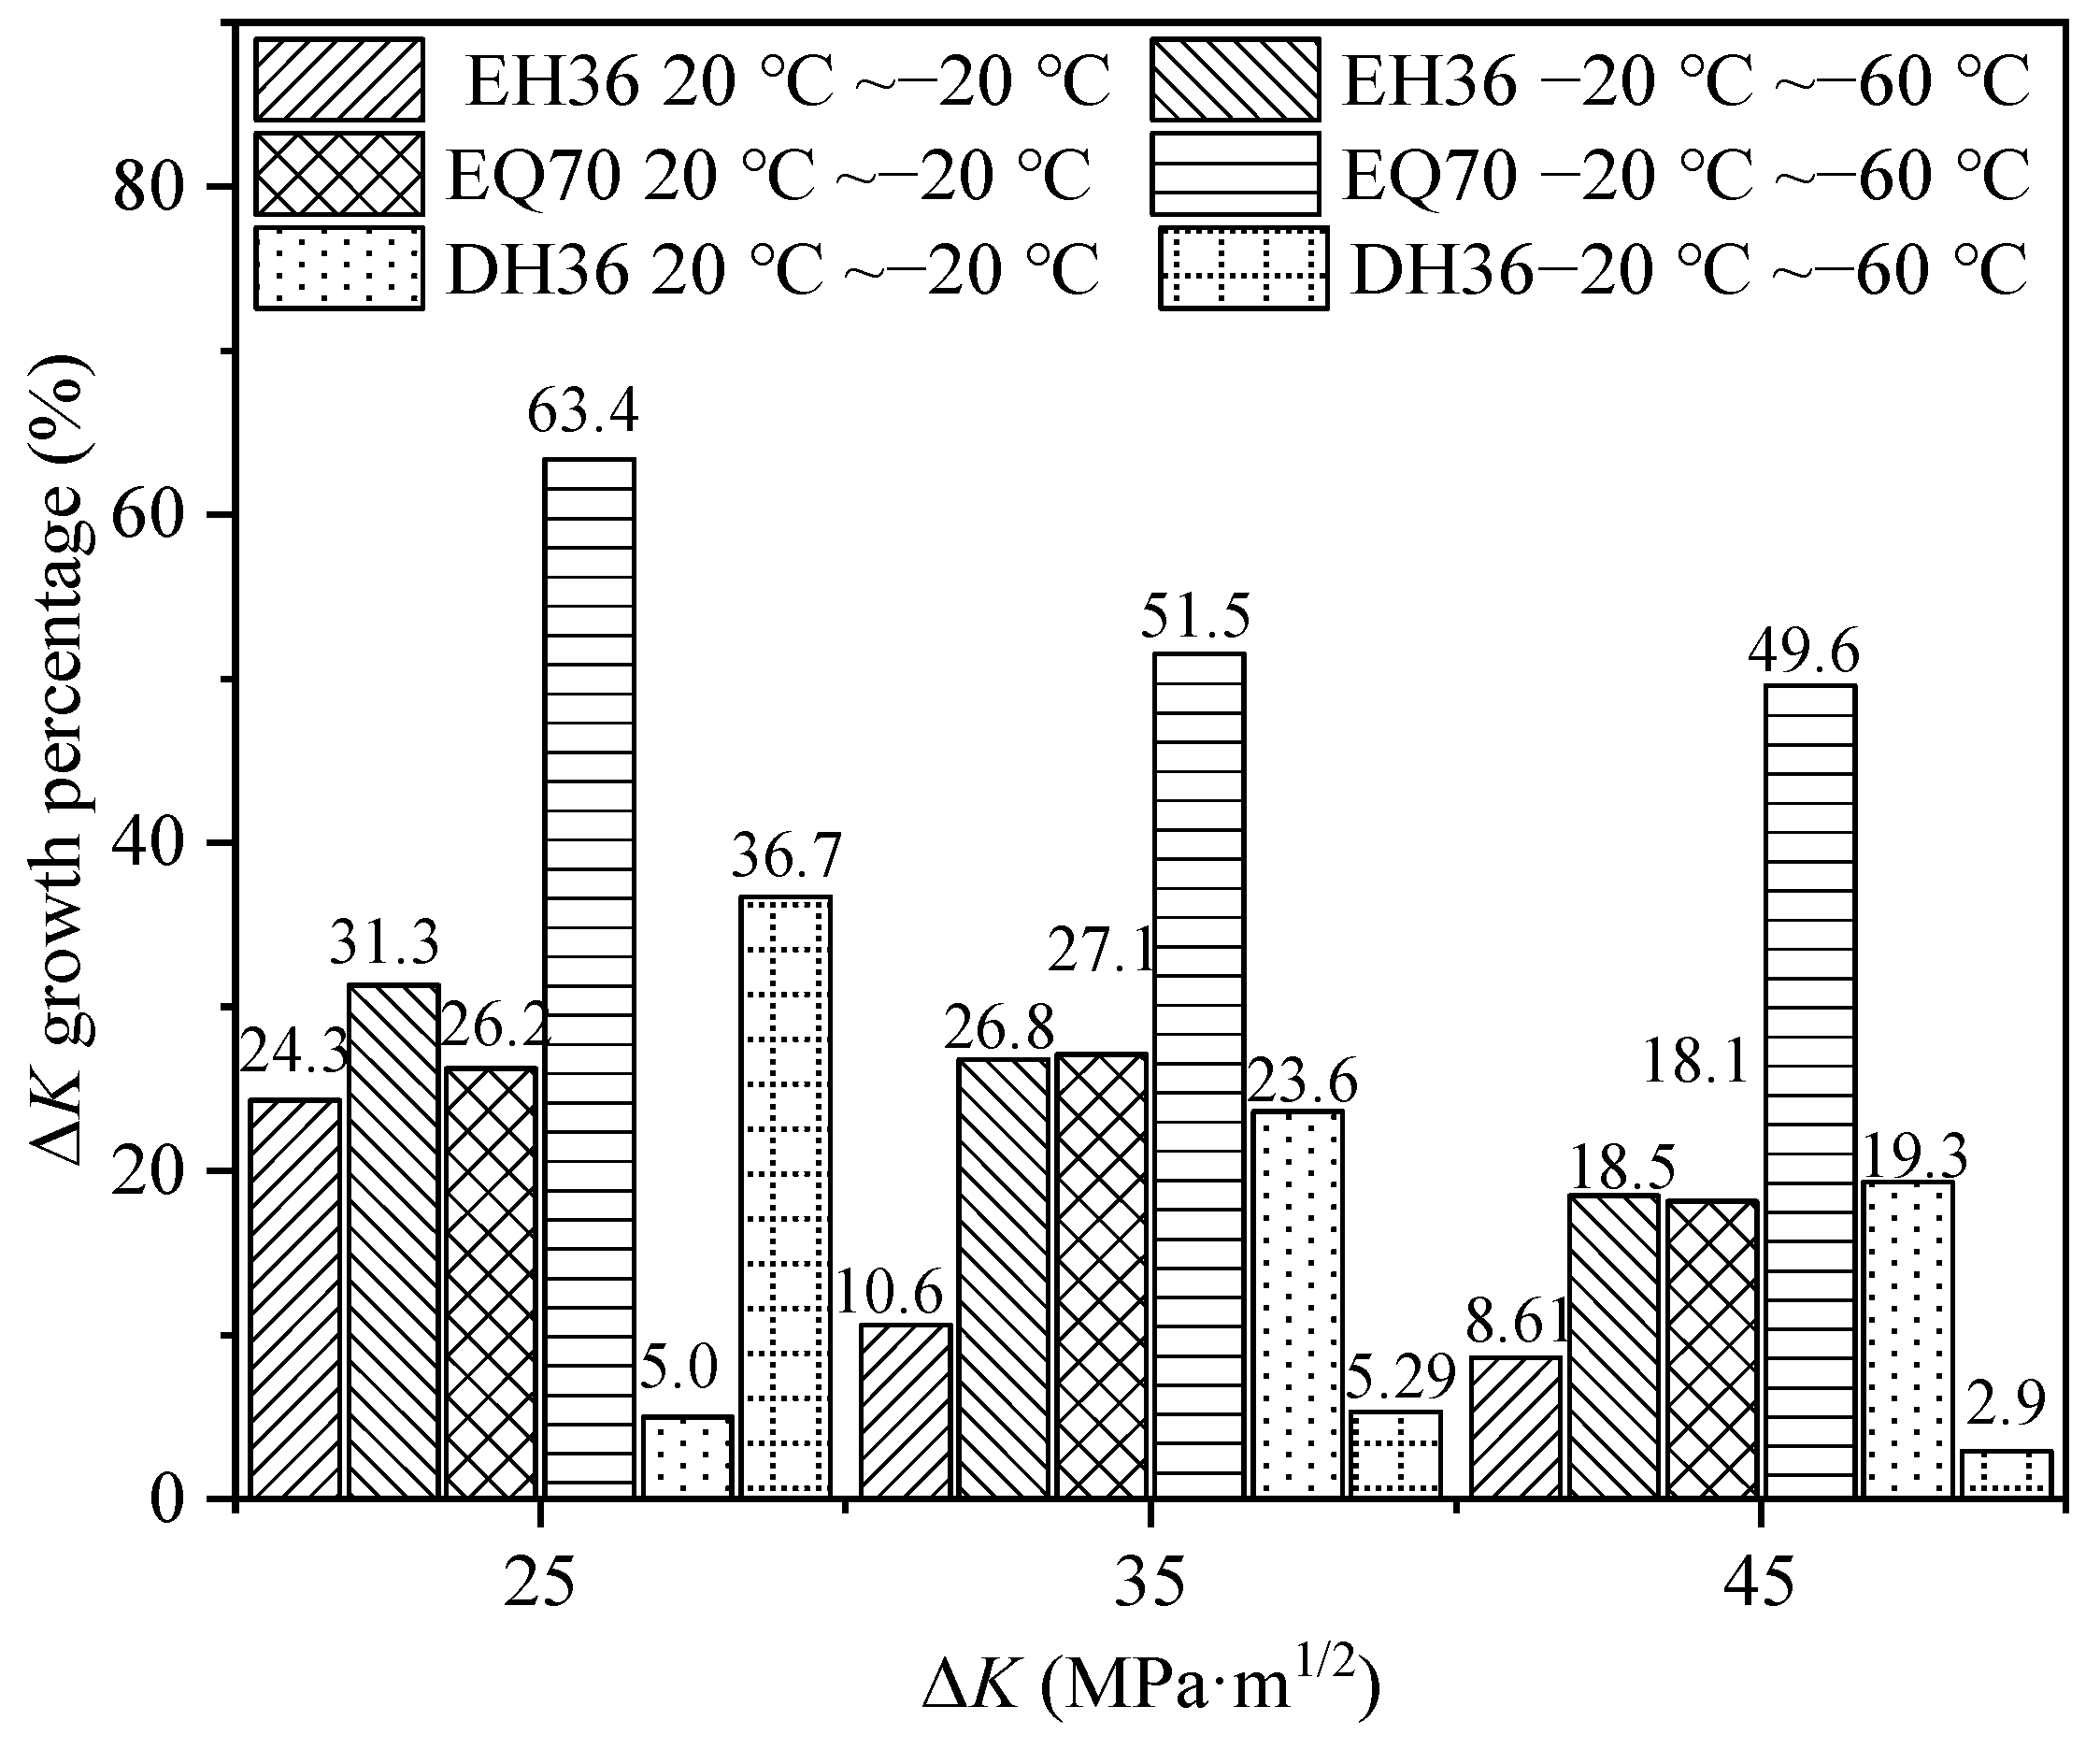
3.5. Comparison of FCG Rate of DH36 Steel and Other Marine Steels at Low Temperature
4. Conclusions
Author Contributions
Funding
Institutional Review Board Statement
Informed Consent Statement
Data Availability Statement
Acknowledgments
Conflicts of Interest
References
- Yang, X.; Lin, Z.Y.; Zhang, W.J.; Xu, S.; Zhang, M.Y.; Wu, Z.D.; Han, B. Review of risk assessment for navigational safety and supported decisions in arctic waters. Ocean Coast. Manag. 2024, 247, 106931. [Google Scholar] [CrossRef]
- Adumene, S.; Ikue-John, H. Offshore system safety and operational challenges in harsh Arctic operations. J. Saf. Sci. Resil. 2022, 3, 153–168. [Google Scholar] [CrossRef]
- Yan, X.; Huang, X.; Huang, Y.; Cui, W. Prediction of fatigue crack growth in a ship detail under wave-induced loading. Ocean Eng. 2016, 113, 246–254. [Google Scholar] [CrossRef]
- Braun, M.; Ehlers, S. Review of methods for the high-cycle fatigue strength assessment of steel structures subjected to sub-zero temperature. Mar. Struct. 2022, 82, 103153. [Google Scholar] [CrossRef]
- Xiao, Q.; Xie, Y.; Hu, F.; Hu, C. Current Status and Trends of Low-Temperature Steel Used in Polar Regions. Materials 2024, 17, 3117. [Google Scholar] [CrossRef]
- Dong, Y.; Garbatov, Y.; Soares, C.G. Review on uncertainties in fatigue loads and fatigue life of ships and offshore structures. Ocean Eng. 2022, 264, 112514. [Google Scholar] [CrossRef]
- Wang, Y.; Liu, J.; Hu, J.; Garbatov, Y.; Soares, C.G. Fatigue strength of EH36 steel welded joints and base material at low-temperature. Int. J. Fatigue 2021, 142, 105896. [Google Scholar] [CrossRef]
- Vecchiato, L.; Campagnolo, A.; Meneghetti, G. Numerical calibration and experimental validation of the direct current potential drop (DCPD) method for fracture mechanics fatigue testing of single-edge-crack round bars. Int. J. Fatigue 2021, 150, 106316. [Google Scholar] [CrossRef]
- Warren, M.F.; Ali-Lavroff, J.; Holloway, D.; Magoga, T. Comparing linear damage hypothesis to linear elastic fracture mechanics in the estimation of fatigue life in a high speed light craft. Ocean Eng. 2023, 290, 116338. [Google Scholar] [CrossRef]
- Kruke, B.I.; Auestad, A.C. Emergency preparedness and rescue in Arctic waters. Saf. Sci. 2021, 136, 105163. [Google Scholar] [CrossRef]
- Igwemezie, V.; Mehmanparast, A.; Brennan, F. The influence of microstructure on the fatigue crack growth rate in marine steels in the Paris Region. Fatigue Fract. Eng. Mater. Struct. 2020, 43, 2416–2440. [Google Scholar] [CrossRef]
- Shen, X.; Gao, X.; Shao, Y.; He, W.; Yu, Z. Investigation on the fatigue crack growth behavior of welded joints in EH690 high-strength marine steel. Int. J. Fatigue 2024, 189, 108572. [Google Scholar] [CrossRef]
- Wang, C.; Wang, S.; Xie, L.; Liu, Y.; Deng, J.; He, W. Fatigue crack growth behavior of marine steel under variable amplitude loading-combining DIC technique and SEM observation. Int. J. Fatigue 2023, 170, 107508. [Google Scholar] [CrossRef]
- Zhao, W.; Feng, G.; Ren, H.; Leira, B.J.; Zhang, M. Temperature-dependent characteristics of DH36 steel fatigue crack propagation. Fatigue Fract. Eng. Mater. Struct. 2020, 43, 617–627. [Google Scholar] [CrossRef]
- Tu, W.; Yue, J.; Xie, H.; Tang, W. Fatigue crack propagation behavior of high-strength steel under variable amplitude loading. Eng. Fract. Mech. 2021, 247, 107642. [Google Scholar] [CrossRef]
- Qin, D.; Xiayang, L.; Geng, X. Experimental study on low-cycle fatigue characteristics of marine structural steel. J. Mar. Sci. Eng. 2024, 12, 651. [Google Scholar] [CrossRef]
- Li, Y.; Guo, W.; Cao, C.; Li, M.; Wu, Z.; Wang, T.; Pan, X. Experimental Study on the Fatigue Crack Propagation Rate of 925A Steel for a Ship Rudder System. Materials 2024, 17, 1808. [Google Scholar] [CrossRef]
- Song, W.; Man, Z.; Xu, J.; Wang, X.; Liu, C.; Zhou, G.; Berto, F. Fatigue crack growth behavior of different zones in an overmatched welded joint made with D32 marine structural steel. Metals 2023, 13, 535. [Google Scholar] [CrossRef]
- Wang, K.; Wu, L.; Li, Y.Z.; Qin, C. Experimental study on low temperature fatigue performance of polar icebreaking ship steel. Ocean Eng. 2020, 216, 107789. [Google Scholar] [CrossRef]
- Buixadé Farré, A.; Stephenson, S.R.; Chen, L.; Czub, M.; Dai, Y.; Demchev, D.; Wighting, J. Commercial Arctic shipping through the Northeast Passage: Routes, resources, governance, technology, and infrastructure. Polar. Gogr. 2014, 37, 298–324. [Google Scholar] [CrossRef]
- Park, H.B.; Lee, B.W. Effect of specimen thickness on fatigue crack growth rate. Nucl. Eng. Des. 2000, 197, 197–203. [Google Scholar] [CrossRef]
- Sriharsha, H.K.; Pandey, R.K.; Chatterjee, S. Towards standardising a sub-size specimen for fatigue crack propagation behaviour of a nuclear pressure vessel steel. Eng. Fract. Mech. 1999, 64, 607–624. [Google Scholar] [CrossRef]
- Zhao, W.; Feng, G.; Zhang, M.; Ren, H.; Sinsabvarodom, C. Effect of low temperature on fatigue crack propagation rates of DH36 steel and its butt weld. Ocean Eng. 2020, 196, 106803. [Google Scholar] [CrossRef]
- Zhao, W.; Feng, G.; Liu, W.; Ren, H. Research on fatigue properties of typical welded joints of DH36 steel at −60 °C. Appl. Sci. 2020, 10, 3742. [Google Scholar] [CrossRef]
- Clayton, D.K.; Saleh, M.; Ferguson, T.M.; Ojeda, R. Effects of fatigue damage on the high strain-rate performance of DH36 steel. Ships Offshore Struct. 2022, 17, 646–660. [Google Scholar] [CrossRef]
- Zhang, T.; Chen, M.T.; Cai, A.; Cao, H.; Yun, X.; Zhao, H.; Zhang, Y. Behaviour of high strength steel butt joints exposed to arctic low temperatures. Thin-Walled Struct. 2023, 192, 111157. [Google Scholar] [CrossRef]
- Guo, W.; Yu, L.; Wu, Z.; Zhang, Y.; Cao, C.; Zeng, Y.; Huang, J. Effect of low temperature on the fatigue crack propagation behavior of underwater manned vehicle rudder materials in Arctic environments. ACS Omega 2024, 9, 38925–38935. [Google Scholar] [CrossRef]
- Motra, H.B.; Hildebrand, J.; Dimmig-Osburg, A. Influence of specimen dimensions and orientation on the tensile properties of structural steel. Mater. Test. 2014, 56, 929–936. [Google Scholar] [CrossRef]
- ASTM Standard E8/E8-22; Standard Test Methods for Tension Testing of Metallic Materials. ASTM International: West Conshohocken, PA, USA, 2022. Available online: http://www.astm.org (accessed on 2 January 2025).
- ASTM Standard E647-15; Standard Test Method for Measurement of Fatigue Crack Growth Rates. ASTM International: West Conshohocken, PA, USA, 2015. Available online: http://www.astm.org (accessed on 6 January 2025).
- Niendorf, T.; Rubitschek, F.; Maier, H.J.; Canadinc, D.; Karaman, I. On the fatigue crack growth–microstructure relationship in ultrafine-grained interstitial-free steel. J. Mater. Sci. 2010, 45, 4813–4821. [Google Scholar] [CrossRef]
- Wang, C.; Yang, B.; Zhu, T.; Zhou, S.; Xiao, S.; Yang, G. Effect of different regions on fatigue crack growth behavior of 6005-T6 aluminum alloy metal inert gas (MIG) butt welded joint: Experimental and numerical study. Weld. World 2024, 68, 2109–2123. [Google Scholar] [CrossRef]
- DNV GL. DNVGL-RP-C203: Fatigue Design of Offshore Steel Structures; Det Norske Veritas Germanischer Lloyd: Høvik, Norway, 2016; Available online: https://www.dnv.com (accessed on 3 January 2025).
- China Classification Society (CCS). Guidelines for Polar Class Ships; China Classification Society: Beijing, China, 2023; Available online: https://www.ccs.org.cn (accessed on 6 January 2025). (In Chinese)
- Dai-Heng, C.; Hironobu, N. Analysis of the delaying effects of overloads on fatigue crack propagation. Eng. Fract. Mech. 1991, 39, 287–298. [Google Scholar] [CrossRef]
- Bathias, C.; Vancon, M. Mechanisms of overload effect on fatigue crack propagation in aluminium alloys. Eng. Fract. Mech. 1978, 10, 409–424. [Google Scholar] [CrossRef]
- Datta, S.; Chattopadhyay, A.; Iyyer, N.; Phan, N. Fatigue crack propagation under biaxial fatigue loading with single overloads. Int. J. Fatigue 2018, 109, 103–113. [Google Scholar] [CrossRef]
- Ding, Z.; Wang, X.; Gao, Z.; Bao, S. An experimental investigation and prediction of fatigue crack growth under overload/underload in Q345R steel. Int. J. Fatigue 2017, 98, 155–166. [Google Scholar] [CrossRef]
- Lee, B.S.; Kim, J.M.; Kwon, J.Y.; Kim, J.M.; Kim, M.C. An innovative way to measure fatigue crack growth without COD gauge. Int. J. Fatigue 2024, 184, 108327. [Google Scholar] [CrossRef]
- GB/T 6398-2000; Standard Test Method for Fatigue Crack Growth Rates of Metallic Materials. China National Standardization Administration (SAC): Beijing, China, 2000. Available online: https://openstd.samr.gov.cn (accessed on 2 January 2025).
- Tong, L.; Niu, L.; Jing, S.; Ai, L.; Zhao, X.L. Low temperature impact toughness of high strength structural steel. Thin-Walled Struct. 2018, 132, 410–420. [Google Scholar] [CrossRef]
- Wang, S.; Yang, B.; Zhou, S.; Wang, Y.; Xiao, S. Effect of stress ratio and overload on mixed-mode crack propagation behaviour of EA4T steel. Eng. Fract. Mech. 2021, 306, 110210. [Google Scholar] [CrossRef]
- Wang, Y.Q.; Liu, X.Y.; Hu, Z.W.; Shi, Y.J. Experimental study on mechanical properties and fracture toughness of structural thick plate and its butt weld along thickness and at low temperatures. Fatigue Fract. Eng. Mater. Struct. 2013, 36, 1258–1273. [Google Scholar] [CrossRef]
- Kim, K.J.; Lee, J.H.; Park, D.K.; Jung, B.G.; Han, X.; Paik, J.K. An experimental and numerical study on nonlinear impact responses of steel-plated structures in an Arctic environment. Int. J. Impact Eng. 2016, 93, 99–115. [Google Scholar] [CrossRef]
- Qiao, K.; Liu, Z.; Sun, Z.; Wang, X. Effects of low temperature overload and cycling temperature on fatigue crack growth behavior of ship steels in Arctic environments. Ocean Eng. 2023, 288, 116090. [Google Scholar] [CrossRef]


| DH36 Steel | C | Si | Mn | P | S | Cr |
|---|---|---|---|---|---|---|
| Test value | 0.075 | 0.165 | 1.147 | 0.006 | 0.001 | 0.024 |
| CCS standard | ≤0.18 | 0.10–0.50 | 0.90–1.60 | ≤0.025 | ≤0.025 | ≤0.20 |
| ABS standard | ≤0.18 | 0.10–0.50 | 0.90–1.60 | ≤0.035 | ≤0.035 | ≤0.20 |
| Number of Test Groups | Temperature (°C) | R | Rol | B (mm) | Fmax (kN) | Fmin (kN) | f (Hz) |
|---|---|---|---|---|---|---|---|
| 1 | 20/−20/−60 | 0.1 | 1.0 | 11.5 | 12.5 | 1.25 | 20 |
| 2 | 0.2 | 2.0 | |||||
| 3 | 0.3 | 3.75 |
| Number of Test Groups | Temperature (°C) | R | Rol | B (mm) | Fmax (kN) | Fmin (kN) | f (Hz) |
|---|---|---|---|---|---|---|---|
| 1 | 20/−20/−60 | 0.1 | 1.0 | 11.5 | 12.5 | 1.25 | 20 |
| 2 | 1.5 | ||||||
| 3 | 2.0 |
| Number of Test Groups | Temperature (°C) | R | Rol | B (mm) | Fmax (kN) | Fmin (kN) | f (Hz) |
|---|---|---|---|---|---|---|---|
| 1 | 20/−20/−60 | 0.1 | 1.0 | 5.0 | 12.5 | 1.25 | 20 |
| 2 | 0.2 | 11.5 | |||||
| 3 | 0.3 | 18.0 |
| Temperature (°C) | E (GPa) | fs (MPa) | fb (MPa) |
|---|---|---|---|
| 20 | 207.81 | 426.05 | 519.41 |
| −20 | 224.13 | 450.80 | 543.10 |
| −60 | 230.55 | 473.64 | 592.33 |
| Temperature (°C) | Rol | Va | VL | Sa | FCG Life (N) |
|---|---|---|---|---|---|
| 20 | 1.5 2.0 | 1.15 × 10⁻⁴ 1.15 × 10⁻⁴ | 8.05 × 10⁻⁵ 2.26 × 10⁻⁵ | 3.10 × 10⁻⁵ 2.25 × 10⁻⁵ | 73,352 114,216 |
| −20 | 1.5 2.0 | 1.09 × 10⁻⁴ 9.97 × 10⁻⁵ | 7.86 × 10⁻⁵ 1.94 × 10⁻⁵ | 2.39 × 10⁻⁵ 1.29 × 10⁻⁴ | 87,240 117,876 |
| −60 | 1.5 2.0 | 9.66 × 10⁻⁵ 6.69 × 10⁻⁵ | 7.22 × 10⁻⁵ 1.53 × 10⁻⁵ | 6.32 × 10⁻⁶ 4.66 × 10⁻⁵ | 122,324 142,942 |
| Test Temperature (°C) | R | Rol | B (mm) | lgC | m | FCG Life (N) |
|---|---|---|---|---|---|---|
| 20 | 0.1 | 1.0 | 11.5 | −7.679 | 2.761 | 66,448 |
| −20 | −7.710 | 2.720 | 81,423 | |||
| −60 | −8.830 | 3.401 | 121,678 | |||
| 20 | 0.2 | 11.5 | −8.780 | 2.821 | 102,336 | |
| −20 | −7.761 | 2.748 | 115,485 | |||
| −60 | −8.145 | 2.908 | 155,214 | |||
| 20 | 0.3 | 11.5 | −8.723 | 3.770 | 151,265 | |
| −20 | −8.910 | 3.629 | 169,011 | |||
| −60 | −9.144 | 3.714 | 250,981 |
| Test Temperature (°C) | R | B | lgC | m | FCG Life (N) |
|---|---|---|---|---|---|
| 20 | 0.1 | 5.0 | −7.087 | 2.955 | 8140 |
| −20 | −7.057 | 3.210 | 10,485 | ||
| −60 | −7.069 | 3.085 | 12,285 | ||
| 20 | 0.1 | 11.5 | −7.679 | 2.761 | 66,448 |
| −20 | −7.710 | 2.720 | 81,423 | ||
| −60 | −8.830 | 3.401 | 121,678 | ||
| 20 | 0.1 | 18 | −8.396 | 3.195 | 279,892 |
| −20 | −8.050 | 3.724 | 315,738 | ||
| −60 | −9.744 | 3.284 | 482,169 |
| Material | Test Temperature (°C) | lgC | m | R | B (mm) |
|---|---|---|---|---|---|
| EH36 | 20/−20/−60 | −7.564/−8.299/−8.681 | 2.601/3.032/3.202 | 0.1 | 11.5 |
| EQ70 | 20/−20/−60 | −6.772/−6.939/−8.340 | 2.251/2.292/2.960 | 0.1 | 11.5 |
| DH36 | 20/−20/−60 | −7.679/−7.771/−8.830 | 2.761/2.72/3.401 | 0.1 | 11.5 |
Disclaimer/Publisher’s Note: The statements, opinions and data contained in all publications are solely those of the individual author(s) and contributor(s) and not of MDPI and/or the editor(s). MDPI and/or the editor(s) disclaim responsibility for any injury to people or property resulting from any ideas, methods, instructions or products referred to in the content. |
© 2025 by the authors. Licensee MDPI, Basel, Switzerland. This article is an open access article distributed under the terms and conditions of the Creative Commons Attribution (CC BY) license (https://creativecommons.org/licenses/by/4.0/).
Share and Cite
Qiao, K.; Liu, Z.; Sun, Z.; Guo, Q.; Wang, X. The Effect of Multiple Factors on the Fatigue Crack Growth Behavior of DH36 Steel in Arctic Environment. J. Mar. Sci. Eng. 2025, 13, 1118. https://doi.org/10.3390/jmse13061118
Qiao K, Liu Z, Sun Z, Guo Q, Wang X. The Effect of Multiple Factors on the Fatigue Crack Growth Behavior of DH36 Steel in Arctic Environment. Journal of Marine Science and Engineering. 2025; 13(6):1118. https://doi.org/10.3390/jmse13061118
Chicago/Turabian StyleQiao, Kaiqing, Zhijie Liu, Zhenyu Sun, Qiuyu Guo, and Xiaobang Wang. 2025. "The Effect of Multiple Factors on the Fatigue Crack Growth Behavior of DH36 Steel in Arctic Environment" Journal of Marine Science and Engineering 13, no. 6: 1118. https://doi.org/10.3390/jmse13061118
APA StyleQiao, K., Liu, Z., Sun, Z., Guo, Q., & Wang, X. (2025). The Effect of Multiple Factors on the Fatigue Crack Growth Behavior of DH36 Steel in Arctic Environment. Journal of Marine Science and Engineering, 13(6), 1118. https://doi.org/10.3390/jmse13061118