Article

Influence of Bragg Resonance on the Hydrodynamic Performance of a Fixed-Detached Asymmetric Oscillating Water Column Device

State Key Laboratory of Coastal and Offshore Engineering, Dalian University of Technology, Dalian 116024, China
*
Author to whom correspondence should be addressed.
J. Mar. Sci. Eng. 2025, 13(6), 1115; https://doi.org/10.3390/jmse13061115
Submission received: 28 April 2025 / Revised: 31 May 2025 / Accepted: 31 May 2025 / Published: 2 June 2025
(This article belongs to the Topic Marine Renewable Energy, 2nd Edition)

Abstract

The present study analyzes the hydrodynamic performance of an asymmetric offshore Oscillating Water Column device positioned in close proximity to multiple bottom standing and fully submerged breakwaters and trenches. The breakwaters and trenches are located on the leeward side of the Oscillating Water Column device. The structures are investigated in combination with a shore-fixed vertical wall. The analysis is carried out using the Boundary Element Method based on the linear potential flow theory. The results are compared with the existing analytical, numerical, and experiment results available in the literature. The effects of the various shape parameters of the submerged breakwaters/trenches and the shape parameters of the Oscillating Water Column device are investigated. The results show that the resonance effects on the efficiency performance increase as the number of breakwaters/trenches increases. The undulating bottom trench shape is effective in improving the efficiency of the Oscillating Water Column device compared to the breakwater. The efficiency bandwidth is greater in the case of a rectangular trench than in the case of a parabolic- or triangular-shaped trench. In addition, the first peak value in the efficiency curve for a lower frequency is higher in the case of a larger-draft Oscillating Water Column device front wall compared to that of the rear wall. This study demonstrates that in the long wave-length regime, a zero efficiency point is observed between two consecutive resonant peaks, whereas in the intermediate and short wave-length regimes, a trough and a zero efficiency point alternately occur between two consecutive resonance peaks. Various parameters relevant to the behavior of the Oscillating Water Column Wave Energy Converter, such as radiation susceptance, radiation conductance, hydrodynamic efficiency, and volume flux due to a scatter potential, are addressed.

1. Introduction

Ocean wave energy harvesting technology is one of the most promising renewable energy sectors due to a vast but untapped energy potential worldwide. China has approximately 249.7 Terawatt-hours per year (TWh/year) of extractable nearshore ocean wave energy resource, and ten provinces have an ocean wave energy potential greater than 850 Gigawatt-hours per year (GWh/year) (Xie and Zuo [1]). Many countries, such as China, Spain, Portugal, the United Kingdom, etc., developed many leading ocean wave energy technologies in the past century. With rational exploitation and effective utilization, wave energy could provide a reliable alternative renewable energy resource to mitigate concerns about environmental issues. Investigations on the extraction of wave power from water waves have been published since the 1970s. The intensification of the energy crisis in the previous decades has motivated many researchers (Evans and Porter [2]; Mustapa et al. [3]; Ning and Ding [4] etc.) to work toward the development of ocean wave energy harvesters. Various types of Wave Energy Converters (WECs) were patented, fabricated, and installed in appropriate locations to extract ocean wave energy. WECs can be classified into (i) Oscillating Water Columns (OWCs), (ii) over-topping devices, (iii) wave attenuators, and (iv) point absorbers. The operating principle of an OWC device is well-known, and the device provides many advantages over other ocean energy sources.The OWC-WEC consists of an air turbine that is attached to a semi-submerged chamber through an orifice on either the top side or the shore side of the device. The bottom side of the OWC chamber is open to the sea. By harnessing the rise and fall of the water column within the chamber driven by the incident wave action, the pneumatic air inside the chamber is cyclically compressed and decompressed to actuate an air-driven turbine and generate electricity. A comprehensive review of the OWC device was reported by Heath et al. [5].
In recent decades, the hydrodynamic performance of OWC devices has been extensively investigated by many researchers by means of theoretical analysis (Yang et al. [6], Ding et al. [7], Zhao et al. [8]) and experimentally (Boccotti [9], Altomare et al. [10], Zhao and Ning [11]). Evans [12] analytically studied the hydrodynamic efficiency of a two-dimensional OWC device with an internal water free surface in the frequency domain using the Galerkin approximation method. The propagation of water waves in the presence of bottom undulation is important in several circumstances, including wave transformations over continental shelves and wave scattering by submerged breakwaters and trenches of various designs. The bottom effects have a substantial influence on the incident wave energy. This is significant, as the waves propagate toward coastal locations. Many physical processes, such as wave breaking, refraction, and shoaling occur because of bottom friction effects. Therefore, the role of bottom undulations is an important characteristic for analyzing the hydrodynamic efficiency of an OWC device in coastal locations. The influence of stepped sea bottom topography on the efficiency of a nearshore OWC device was carried out using both theoretical and numerical approaches by Rezanejad et al. [13]. Deng et al. [14] reported a theoretical analysis of an asymmetric offshore stationary OWC device with a bottom plate by means of the Eigenfunction Expansion Method (EEM). They observed that the bottom plate can provide an additional resonance mechanism that can help to increase the OWC efficiency bandwidth.
The aforementioned studies predominantly employ a theoretical-based approach, and more recently, experimental as well as numerical research has been conducted by several investigators. Experimental and numerical investigations on the hydrodynamic performance of an OWC-WEC on a stepped bottom using a 2D model were reported by Rezanejad et al. [15]. Over the past few decades, numerical methods, such as the Boundary Element Method (BEM), have been developed and extensively used by many researchers. The advantages of the BEM can be attributed primarily to the fact that the boundary of the physical domain is discretized instead of the complete domain. Moreover, the method can handle physical problems of varied bed profiles, which include submerged structures, undulation in the bottom bed profile and trenches of varied configurations (Kar et al. [16,17]). The role of dual breakwaters and trenches on the efficiency of an OWC was studied by Naik et al. [18]. Furthermore, the study was extended to wave power extraction by a dual-chamber OWC in the presence of a bottom undulation by Naik et al. [19]. Recently, Naik et al. [20] investigated the impact of a sloping porous seabed on the efficiency of an OWC in oblique waves. Narendran and Vijay [21] studied the three different types of OWC lip walls to evaluate their effect on the performance of OWC using the Dual Boundary Element Method (DBEM) with CFD. A 3D BEM for analyzing the hydrodynamic performance of a land-fixed OWC device was investigated by Rodriguez et al. [22]. A hydrodynamic analysis of an OWC array in the presence of variable bathymetry was performed by Zhao et al. [23].
The performance of an OWC can be improved significantly by leveraging the phenomenon of fluid resonance. Larger-amplitude trapped waves can be controlled and manipulated with the introduction of Bragg resonance instigated by a designed bottom topography. Bragg reflection by multiple bottom standing breakwaters/trenches and seabed undulations causes significant changes in the wave scattering and can influence the OWC performance due to larger fluid oscillations. Gao et al. [24] investigated the effects of Bragg reflection on harbor oscillations. The study was further extended by Gao et al. [25] to understand the mitigation mechanism of harbor oscillations in the presence of arc-shaped sinusoidal bars. The study showed that under the non-resonance condition, the wave amplitude inside the harbor can be reduced up to 80–89% due to the presence of the sinusoidal bars. A similar phenomenon was observed by Gao et al. [26] while analyzing the gap resonance between closely spaced boxes in a numerical wave flume. Kar et al. [27] studied the influences of Bragg resonance due to the occurrence of fluid resonances on the hydrodynamic performance of a trapezoidal-shape fixed-detached OWC using the BEM. A theoretical study of the hydrodynamic performance of an asymmetric fixed-detached OWC device was conducted by Rodríguez et al. [28] by means of the Eigenfunction Expansion Method and BEM. Although there are some studies on the effects of breakwaters and trenches on the performance of an OWC, to the authors’ knowledge, there is an absence of research on the effects of breakwater/trench-induced Bragg resonance on a fixed-detached OWC.
The main objectives of the present study is to examine modifications in bandwidth and Bragg resonance in the presence of trenches/breakwaters on the efficiency curves and the shifting of the peak resonant frequency due to different rear and front wall drafts/widths, chamber breadths, and gap distances between the OWC chamber and the reflecting vertical wall. Section 2 defines the mathematical model of the physical problem corresponding to the water wave radiation and scattering by a fixed-detached OWC device, based on the linear potential flow theory in the presence of the trenches/breakwaters. In Section 3, the numerical methodology based on the Boundary Element Method (BEM) for solving the Boundary Value Problem is presented. Section 4 describes the procedure for obtaining the energy relations. In Section 5, convergence and truncation analyses are carried out, respectively, and a comparison is made with the analytic numerical results of [2,13,29]. Section 6 shows the results for various modeled cases. Finally, in Section 7, the main conclusions of this study are drawn.

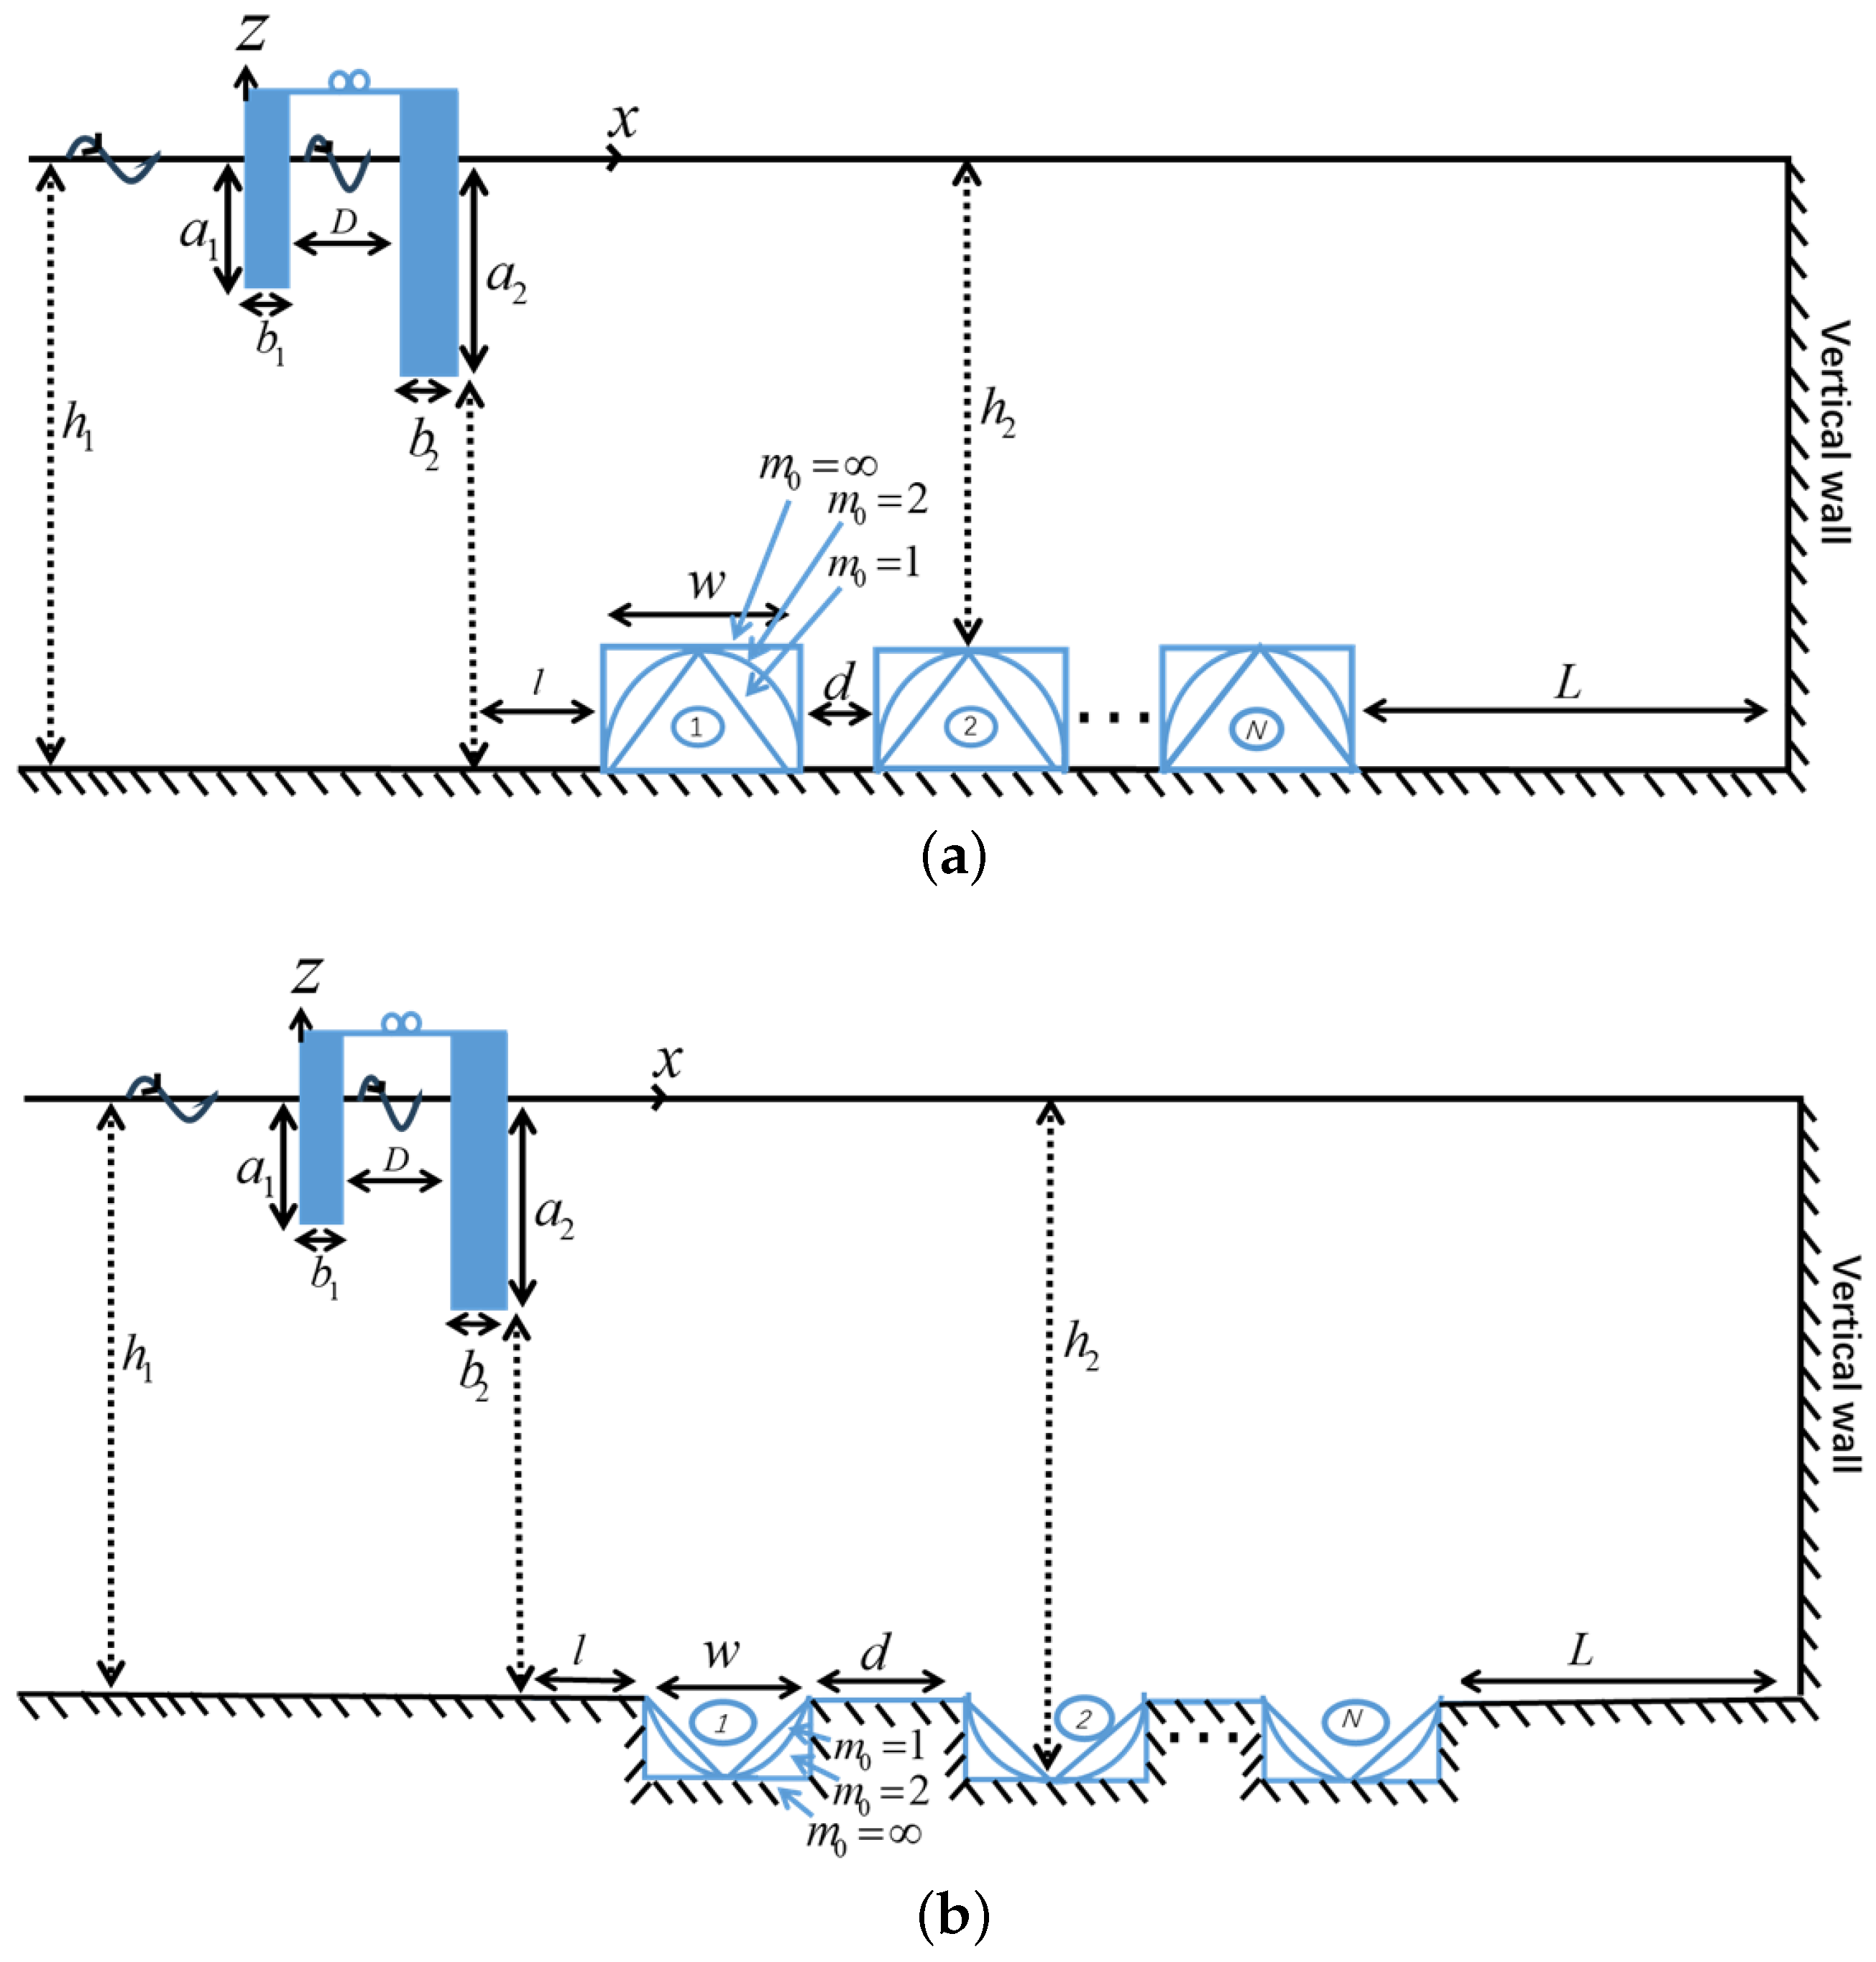
2. Mathematical Model

The present Boundary Value Problem (BVP) numerically analyzes the performance of an OWC with different bottom variations using the BEM under the assumptions that the fluid is inviscid and incompressible and that fluid motion is irrotational. The computational domain employs the Cartesian coordinate frame O-xz, with the x axis aligned in the direction of the incident wave and the z-axis oriented in the vertically upwards direction. h 1 represents the still water depth. As depicted in Figure 1, a 1 and a 2 denote the drafts of an OWC front wall and rear wall, respectively, whilst D signifies the breadth of an OWC chamber, and b 1 and b 2 correspond to the thickness of the front and rear walls of the OWC. The OWC is positioned towards the incident wave side, away from the multiple bottom standing breakwaters/trenches. The breakwater is submerged with a uniform depth h 2 and w corresponds to the width of the trench/breakwater, while d represents the gap distance between the two consecutive breakwaters/trenches. The gap distance between the OWC and the leftmost breakwater/trench corresponds to l, while L represents the gap distance between the rightmost breakwater/trench and the shore-fixed vertical wall, and N denotes the number of trenches/breakwaters.
The instantaneous pressure distribution within the chamber is given by P ( t ) = R p e i ω t , where p is the complex amplitude of the air pressure above the water within the chamber. Since the flow is irrotational, the velocity potential in the computational domain is given by Φ ( x , z , t ) = R ϕ ( x , z ) e i ω t ) , where ϕ satisfies the Laplace Equation as
2 ϕ x 2 + 2 ϕ z 2 = 0 , in   the   fluid   region .
The linearized boundary condition on the mean free surface is
ϕ z K ϕ = i ω p ρ g , inside   the   chamber , 0 , outside   the   chamber ,
where K = ω 2 / g and ω is the angular frequency ( ω = 2 π / T , T being the wave period). g is the gravity acceleration taken as 9.81 m/s2, and ρ is the water density taken as 10 3 kg/m3.
The potential ϕ decomposes into the radiation and scattering potential (for details, see Evans & Porter [2]) as
ϕ = ϕ S + i ω p ρ g ϕ R ,
where ϕ S , i ω p ρ g ϕ R represent the scattering and radiation potential, respectively.
Applying Equation (3) in Equation (2), the boundary condition on the mean free surface at z = 0 transforms into
ϕ S , R z K ϕ S , R = 0 , outside   the   chamber ,
ϕ R z K ϕ R = 1 , inside   the   chamber ,
ϕ S z K ϕ S = 0 , inside   the   chamber .
The no-flow condition is imposed on the impermeable bottom bed, z = h 1 h 2 , and on the vertical shore-fixed wall and on the surfaces of OWC front and rear walls, yielding
ϕ S , R n = 0 ,
where / n denotes the normal derivative.
The far-field boundary condition at the incident wave side is
ϕ S ( x , z ) = ψ 0 ( k 0 ; z ) e i k 0 x + A S ψ 0 ( k 0 ; z ) e i k 0 x , a s x ,
ϕ R ( x , z ) = A R ψ 0 ( k 0 ; z ) e i k 0 x , a s x ,
where A S , A R are the unknown complex coefficients related to amplitudes of the reflected and radiated waves where
ψ 0 ( k 0 ; z ) = cosh k 0 ( z + h 1 ) cosh k 0 h 1 ,
with k 0 being the real positive root of the dispersion relation ω 2 = g k tanh k h 1 .
The alternative form of the far-field boundary condition at the incident wave side as given in Equations (8) and (9) can be expressed as
( ϕ S ψ 0 ( k 0 ; z ) e i k 0 x ) x = i k 0 ( ϕ S ψ 0 ( k 0 ; z ) e i k 0 x ) as x ,
ϕ R x = i k 0 ϕ R as x .
The bottom profile h ( x ) as depicted in Figure 1 is taken to be
h ( x ) = h 1 for ( < x < s ˜ ) ( s ˜ + w < x < r ) , h 2 x + s ˜ w / 2 m 0 × ( h 1 h 2 ) for s ˜ < x < s ˜ + w / 2 , h 2 x s ˜ w / 2 m 0 × ( h 1 h 2 ) for s ˜ + w / 2 < x < s ˜ + w ,
where s ˜ = b 1 + D + b 2 + l , r = s ˜ + w + L .

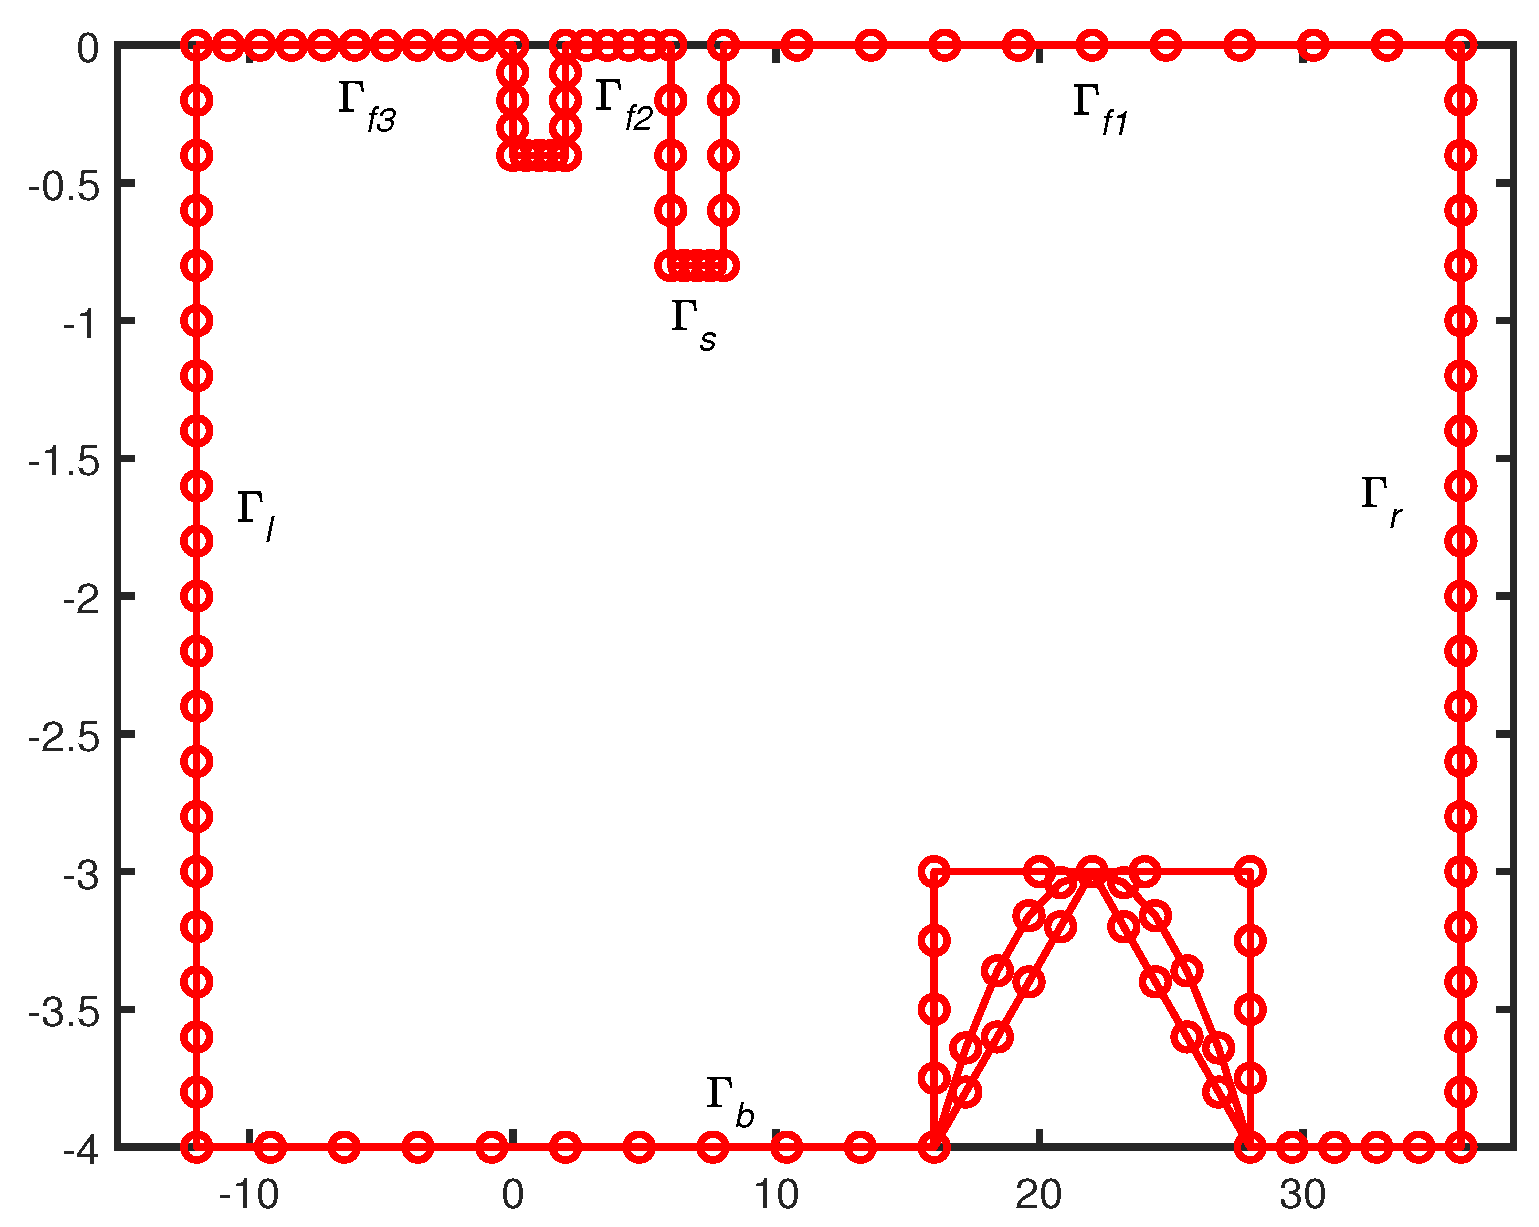
3. Solution Methodology: Boundary Elementary Method (BEM)

Here, the derivation of the solution procedure for the radiation problem is discussed using the constant BEM technique. The two-dimensional free-space Green function G ( x , z ; x 0 , z 0 ) is given as
G ( x , z ; x 0 , z 0 ) = 1 2 π l n ( r ) , r = ( x x 0 ) 2 + ( z z 0 ) 2 ,
where l n ( r ) is the logarithmic function and ( x , z ) , ( x 0 , z 0 ) are the field and source points in the computational domain, respectively. The following integral equation is obtained when Green’s integral theorem, Equation (1), and Green’s function G as defined in Equation (13) are applied:
Γ ϕ R x , z ) G ( x , z ; x 0 , z 0 ) n G ( x , z ; x 0 , z 0 ) ϕ R ( x , z ) n d Γ = ϕ R ( x , z ) 2 i f ( x , z ) Γ ϕ R ( x , z ) i f ( x , z ) Γ .
Substituting Equations (3)–(7) into the integral Equation (14),
c ϕ R + Γ f 1 G n K G ϕ R d Γ + Γ l G n i k 0 G ϕ R d Γ + Γ b G n ϕ R d Γ + Γ r G n ϕ R d Γ + Γ f 2 G n K G ϕ R d Γ + Γ s G n ϕ R d Γ + Γ f 3 G n K G ϕ R d Γ = 0 ,
and
c ϕ S + Γ f 1 G n K G ϕ S d Γ + Γ l G n i k 0 G ϕ S d Γ + Γ b G n ϕ S d Γ + Γ r G n ϕ S d Γ + Γ f 2 G n K G ϕ S d Γ + Γ s G n ϕ S d Γ + Γ f 3 G n K G ϕ S d Γ = 0 ,
where c = 1 / 2 .
ϕ R , ϕ S , ϕ R / n , ϕ S / n are assumed to be constant on each panel in the boundary of the domain Γ . Hence, using Equations (10) and (11), Equations (15) and (16) transform into
i ( H i , j K F i , j ) ϕ R | Γ f 1 + i ( H i , j i k 0 F i , j ) ϕ R | Γ l + i H i , j ϕ R | Γ b + i H i , j ϕ R | Γ r + i ( H i , j K F i , j ) ϕ R | Γ f 2 + i H i , j ϕ R | Γ s + i ( H i , j K F i , j ) ϕ R | Γ f 3 = i F i , j ,
and
i ( H i , j K F i , j ) ϕ S | Γ f 1 + i ( H i , j i k 0 F i , j ) ϕ S | Γ l + i H i , j ϕ S | Γ b + i H i , j ϕ S | Γ r + i ( H i , j K F i , j ) ϕ S | Γ f 2 + i H i , j ϕ S | Γ s + i ( H i , j K F i , j ) ϕ S | Γ f 3 = i F i , j ,
where the influence coefficients F i , j , H i , j are defined as follows:
F i , j = Γ j G d Γ , H i , j = δ i , j 2 + Γ j G n d Γ .
By solving Equations (17) and (18), a matrix equation is obtained, which is used to find the values of the unknown coefficients of interest. The BEM was studied previously for the scattering of surface gravity waves over an undulating bed by Kar et al. [16,17,31], Figure 2.

4. Power Takeoff (PTO) Model

Here, the expressions for the various physical parameters associated with the performance of an OWC device are provided. The time harmonic volume flow rate Q ( t ) = q e i ω t where
q = S i ϕ z d x = q S + i ω p ρ g q R ,
where q S = S i ϕ S z d x and q R = S i ϕ R z d x represent the volume flux rate across the chamber free surface of the scattering and radiation problem, respectively.
The radiation volume flux q R across the chamber free surface as defined in Equation (20) can be separated into real and imaginary parts as
i ω p ρ g q R = ( B ˜ i A ˜ ) p = Z p ,
where Z = B ˜ i A ˜ is the complex admittance, while A ˜ (transfer of energy) and B ˜ (uncaptured energy) are analogous to the coefficients of added mass and radiation-damping in rigid body systems. The parameters A ˜ and B ˜ in Equation (21), termed the radiation susceptance and conductance of an OWC, can be expressed as
A ˜ = ω ρ g q R , B ˜ = ω ρ g q R .
Using the far-field behavior (detailed derivation given in Koley and Trivedi [32]), the empirical relation for the radiation conductance parameter B ˜ can be expressed as
B ˜ = ω ρ g K k 0 | A R | 2 A ,
and a relation between the radiated amplitude and the induced volume flux due to a scattered potential yields
q S = 2 i K k 0 A R A .
A linear relation between the volume flux q through the turbine and the pressure drop p across the OWC chamber yields
q = Λ p ,
where Λ is a real control parameter associated with the linear turbine damping applied on the airflow.
After combing Equations (20), (21), and (25), the imposed internal pressure gives
p = q S Λ + Z .
The total rate of working pressure forces inside the OWC is Q ( t ) × P ( t ) . The mean rate of work performed by the pressure produced in the OWC for one wave period (see Rodriguez et al. [29]) is
W = 1 2 R e p ¯ q ,
where bar (−) denotes the complex conjugate. After inserting Equations (25) and (26) into Equation (27) and simplifying, we get
W = 1 2 R e p ¯ q S Z p = | q S | 2 8 B ˜ B ˜ 2 | p q S 2 B ˜ | 2 .
If B ˜ exists, from Equation (28), the maximum work W m a x yields
W m a x = | q S | 2 8 B ˜ , for p = q S 2 B ˜ ,
where Λ = Z ¯ for maximum power.
After inserting Equation (26) into Equation (28), we get
W = | q S | 2 8 B ˜ 1 | Λ Z | | Λ + Z | 2 f .
In order to optimize the power conversion efficiency, the last term in the square brackets must be minimized. Therefore,
d f d Λ = 0 .
After algebraic manipulation,
Λ = Λ o p t = A ˜ 2 + B ˜ 2 .
Using Equations (30) and (32), the maximum value of extracted power becomes
W o p t = | q S | 2 8 B ˜ 1 Λ o p t B ˜ Λ o p t + B ˜ .
Moreover, since A ˜ ( ω ) and B ˜ ( ω ) , then Λ ( ω ) , which means that for each wave frequency, the turbine parameter must be altered appropriately to satisfy Equation (32). Therefore, the method is an optimization for all frequencies.
Hence, the maximum hydrodynamic efficiency of this power extraction is given as
η m a x = W o p t W m a x = 2 B ˜ Λ o p t + B ˜ .
The dimensionless form of the radiation susceptance A ˜ and conductance B ˜ of an OWC as defined in Equation (22) can be expressed as
μ = ρ g ω D A ˜ , ν = ρ g ω D B ˜ .
Using Equation (35), the maximum hydrodynamic efficiency of the OWC device η m a x as defined in Equation (34) can be expressed in non-dimensional form as (see Evans and Porter [2])
η m a x = 2 1 + 1 + μ ν 2 .
Moreover, it is noted that the absolute value of the dimensionless volume flux due to scattered potential is represented as | q S / q I | , where q I is the incident volume flux as
| q I | = k 0 D tanh k 0 h 1 .

5. Numerical Convergence and Model Validation

5.1. Convergence of Solution: Panel Size

The convergence of the numerical solution depends on the panel size p s used to discretize the physical boundaries. The number of panels n p s are
n p s = computational domain boundary length p s ,
where is the floor function.
In Table 1, the truncation analysis is carried out to nullify the effect of local disturbance of the far-field boundary in the case of a single rectangular breakwater. It can be seen that at a distance of 4 times the water depth between the left face of the OWC and the left far-field boundary, the results converge up to four decimal places. Table 2, Table 3 and Table 4 show the convergence of the solution in the case of a single trench with three different shapes positioned near the fixed-detached OWC. Table 2, Table 3 and Table 4 show that the values of the radiation conductance, radiation susceptance, and hydrodynamic efficiency converge up to two decimal places for p s 0.05. Therefore, p s = 0.05 is assumed in subsequent computations.

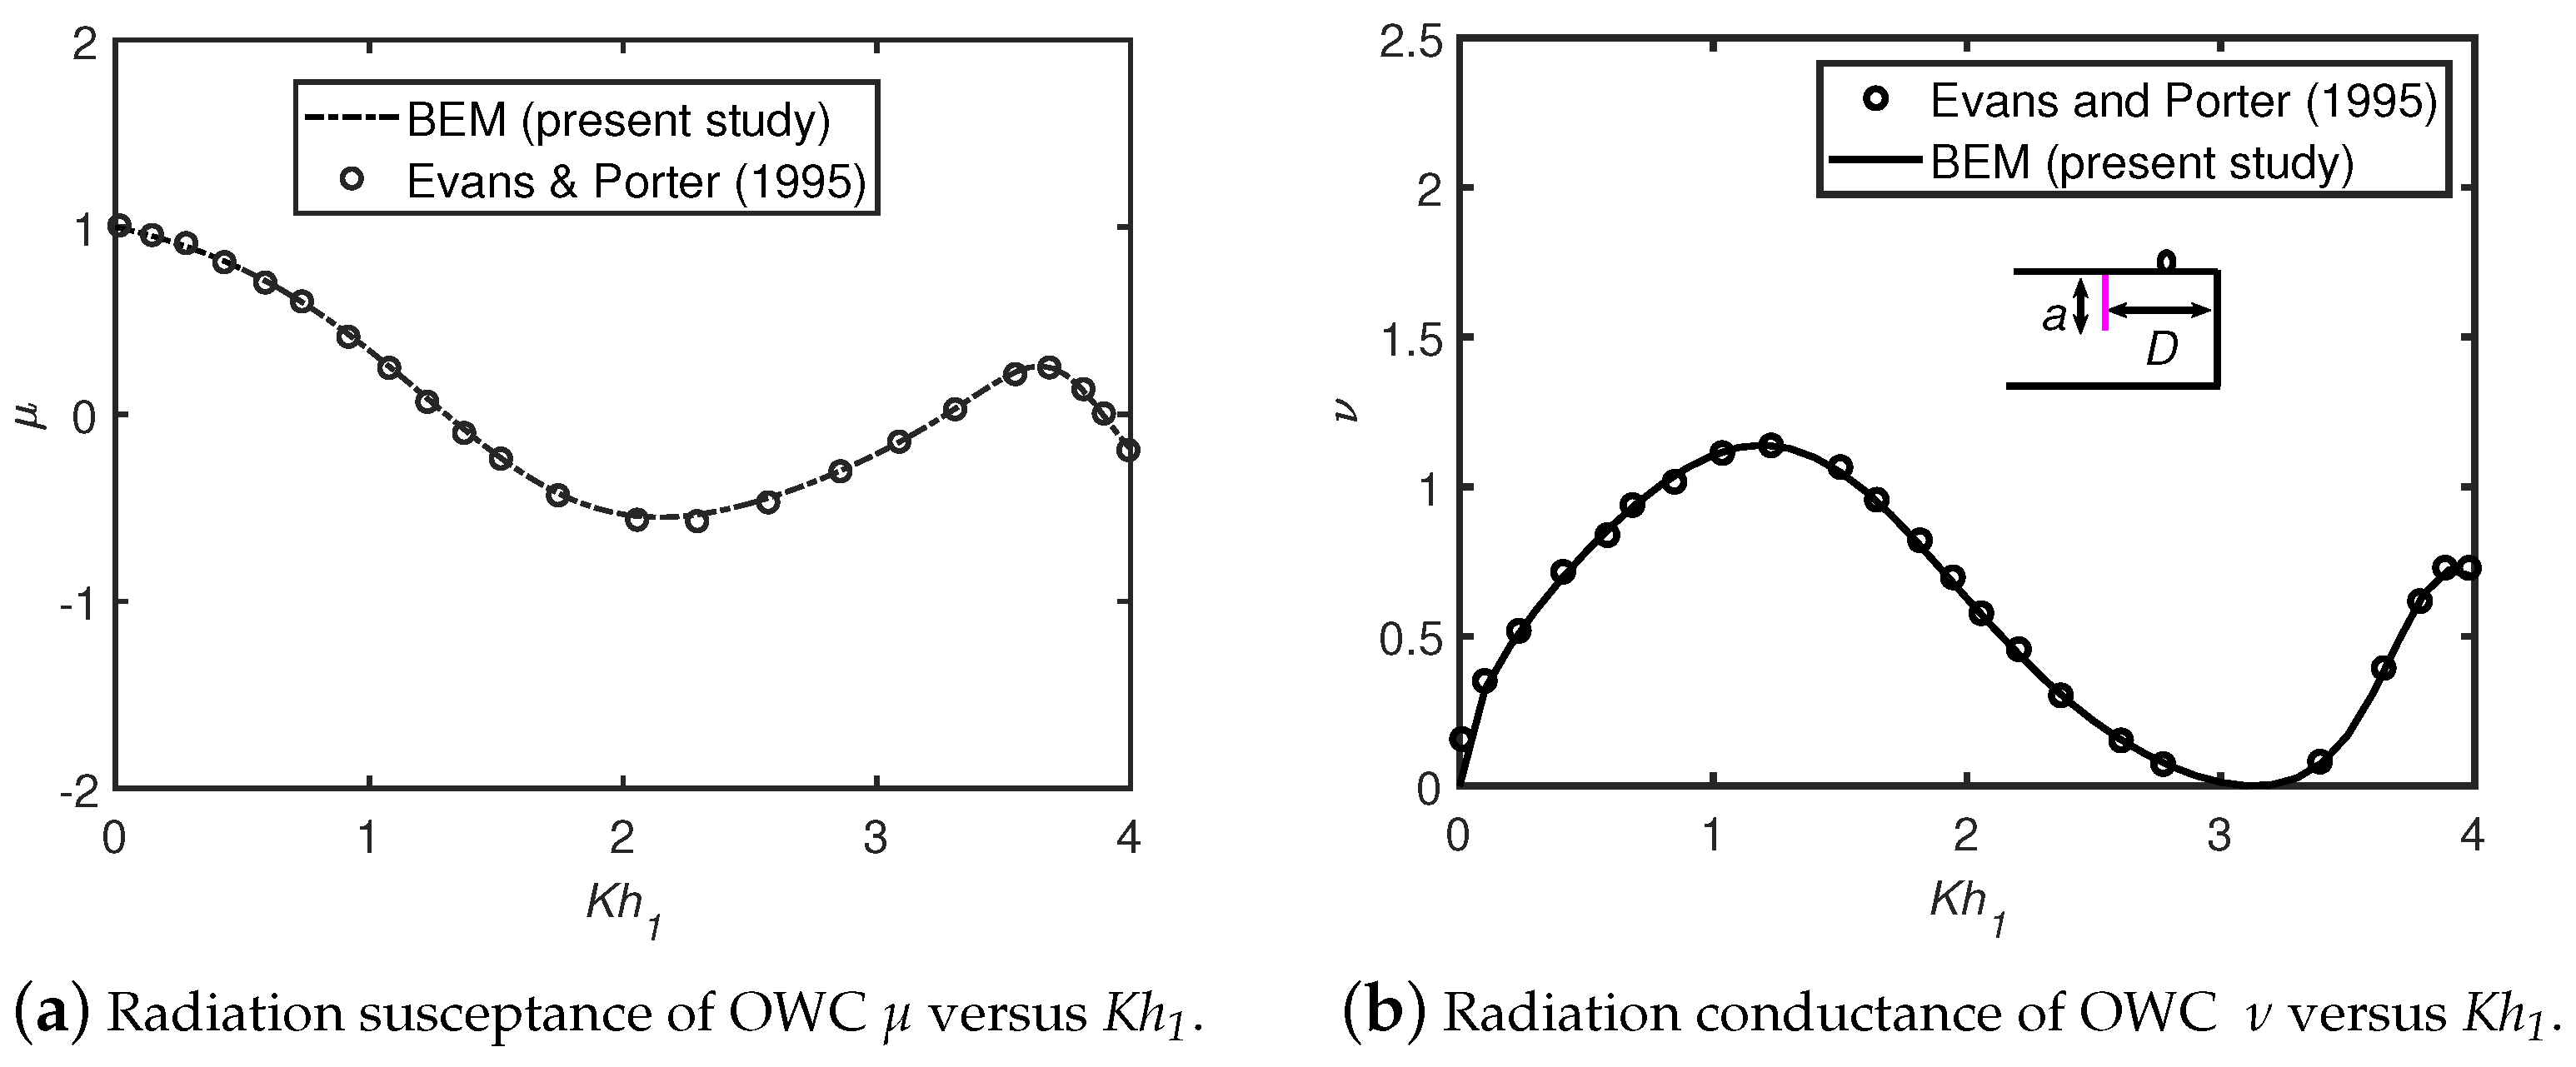
5.2. Comparison with Existing Analytical Results of an OWC Positioned on a Flat Bottom Topography (Evans & Porter [2])

In Figure 3, the radiation susceptance μ , radiation conductance ν , and hydrodynamic efficiency η m a x as defined in Equations (35) and (36) and the magnitude of the induced volume flux due to the scattering potential | q S | / | q I | are plotted against non-dimensional wave frequency K h 1 . The results from the current method are compared with those from the earlier study of Evans & Porter [2]. Figure 3 shows the verification of the numerical method in the case of a shore-fixed OWC device with a flat rigid bottom. The parameters, such as OWC front wall draft a 1 / h = 0.125 , OWC chamber breadth D / h = 1 , and still water depth h ( = h 1 ) , are the same as those of Evans & Porter [2]. The results from the present study and the previous studies are in very good agreement.

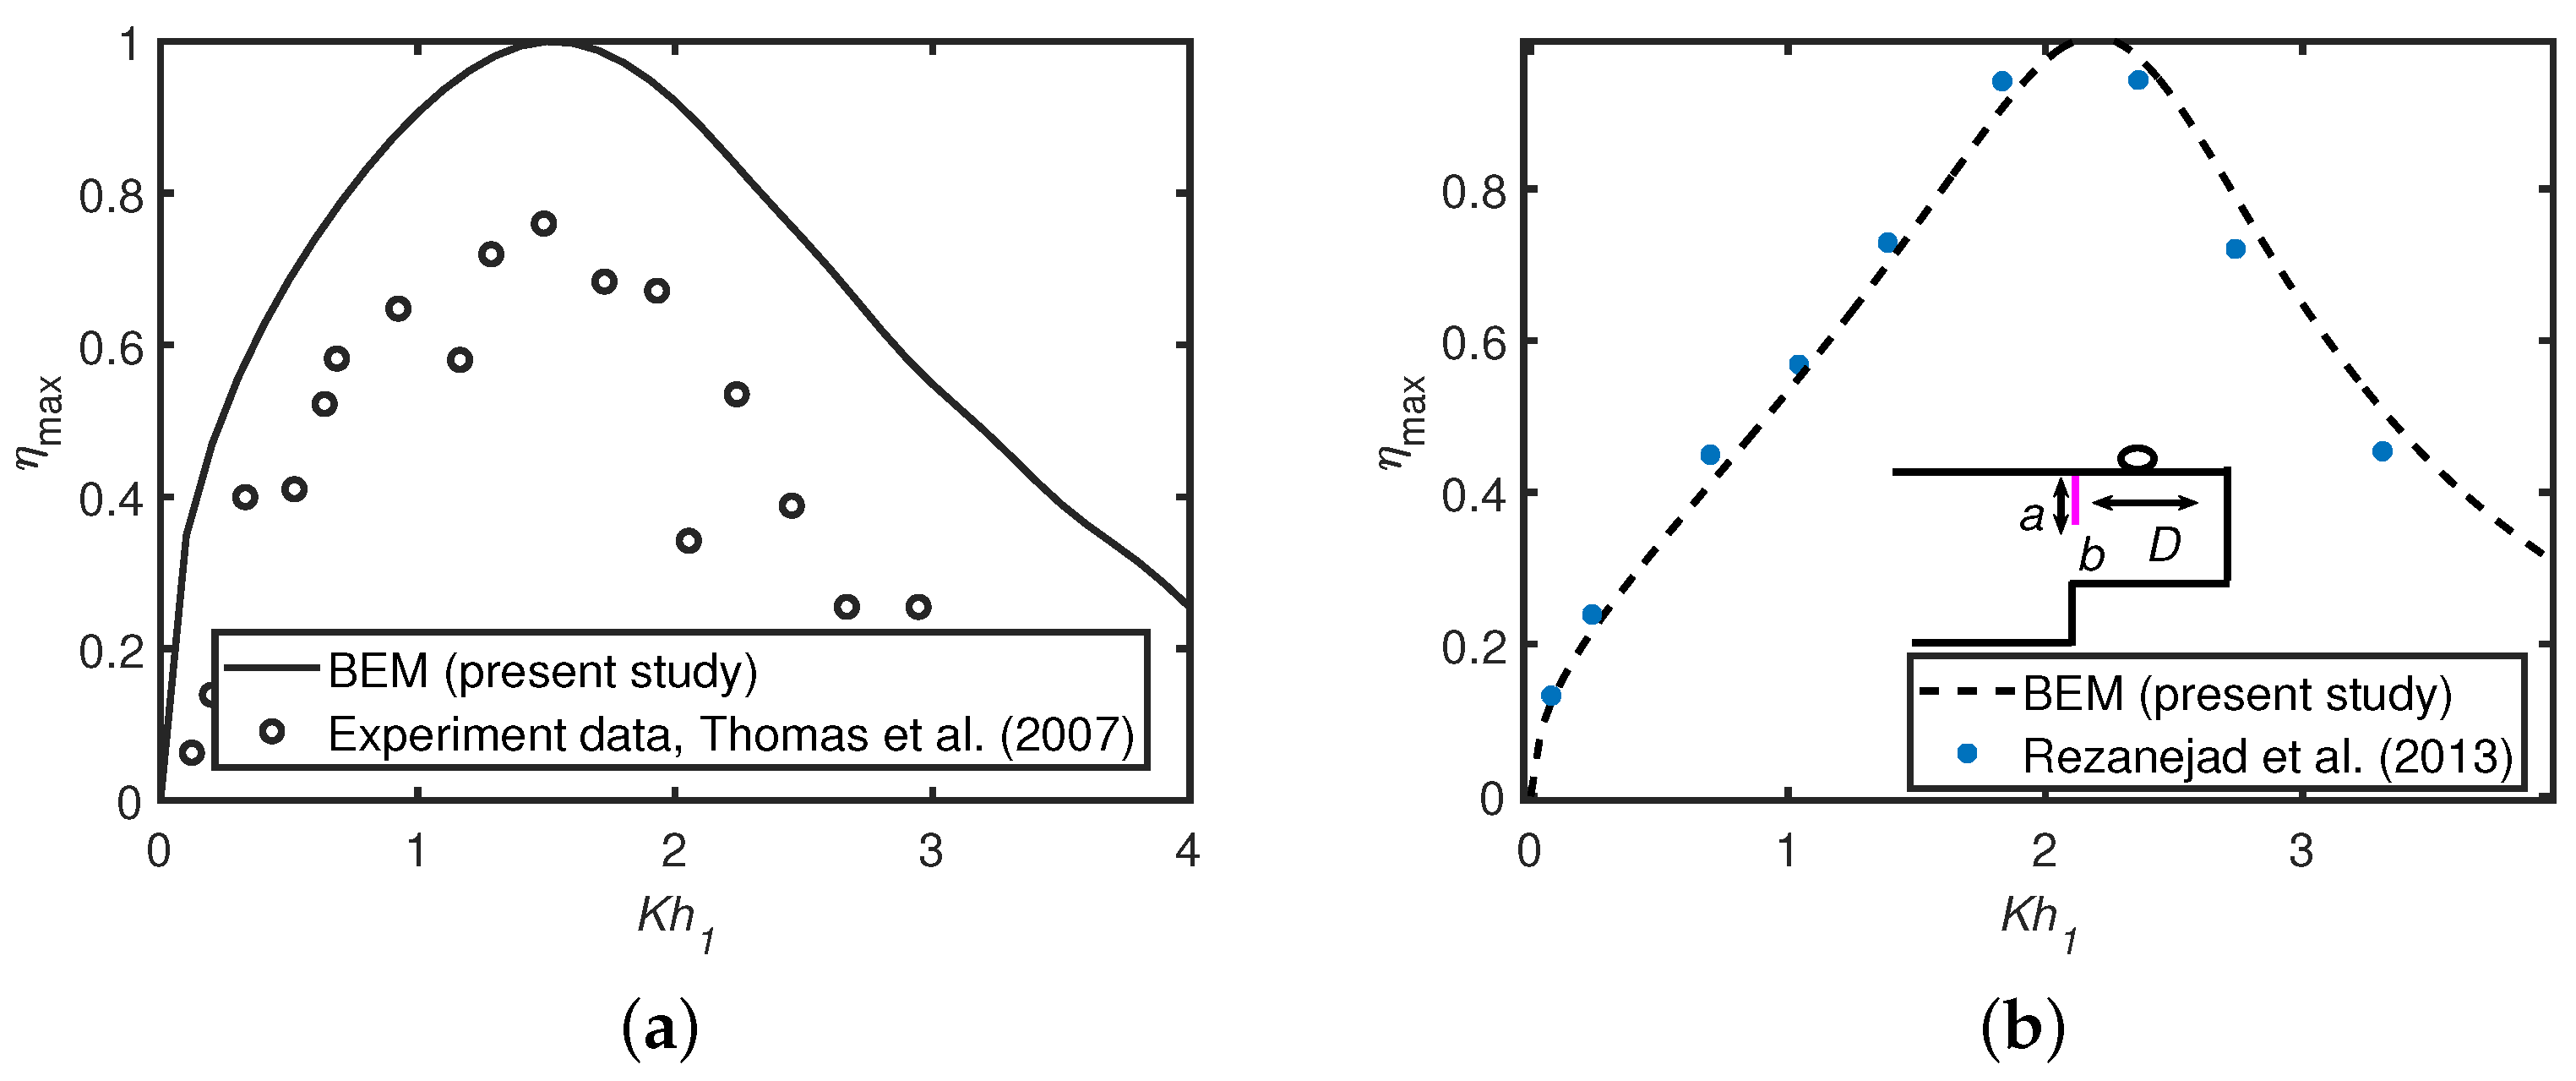
5.3. Comparison with Existing Experimental Result (Thomas et al. [33]) and Analytic Result (Rezanejad et al. [13])

Figure 4 shows the variation in hydrodynamic efficiency η m a x of a shore-fixed OWC in the presence of (a) flat bottom and (b) over a stepped bottom. Figure 4a shows a comparison between the present numerical result with the experimental data of Thomas et al. [33]. The similar trends between the present numerical result and experimental result are observed. Moreover, a small deviation between two results is due to the assumption that the fluid is inviscid in the present linearized model. In Figure 4b, the hydrodynamic efficiency matches well with the existing analytical result of Rezanejad et al. [13] in the case of a stepped seabed.

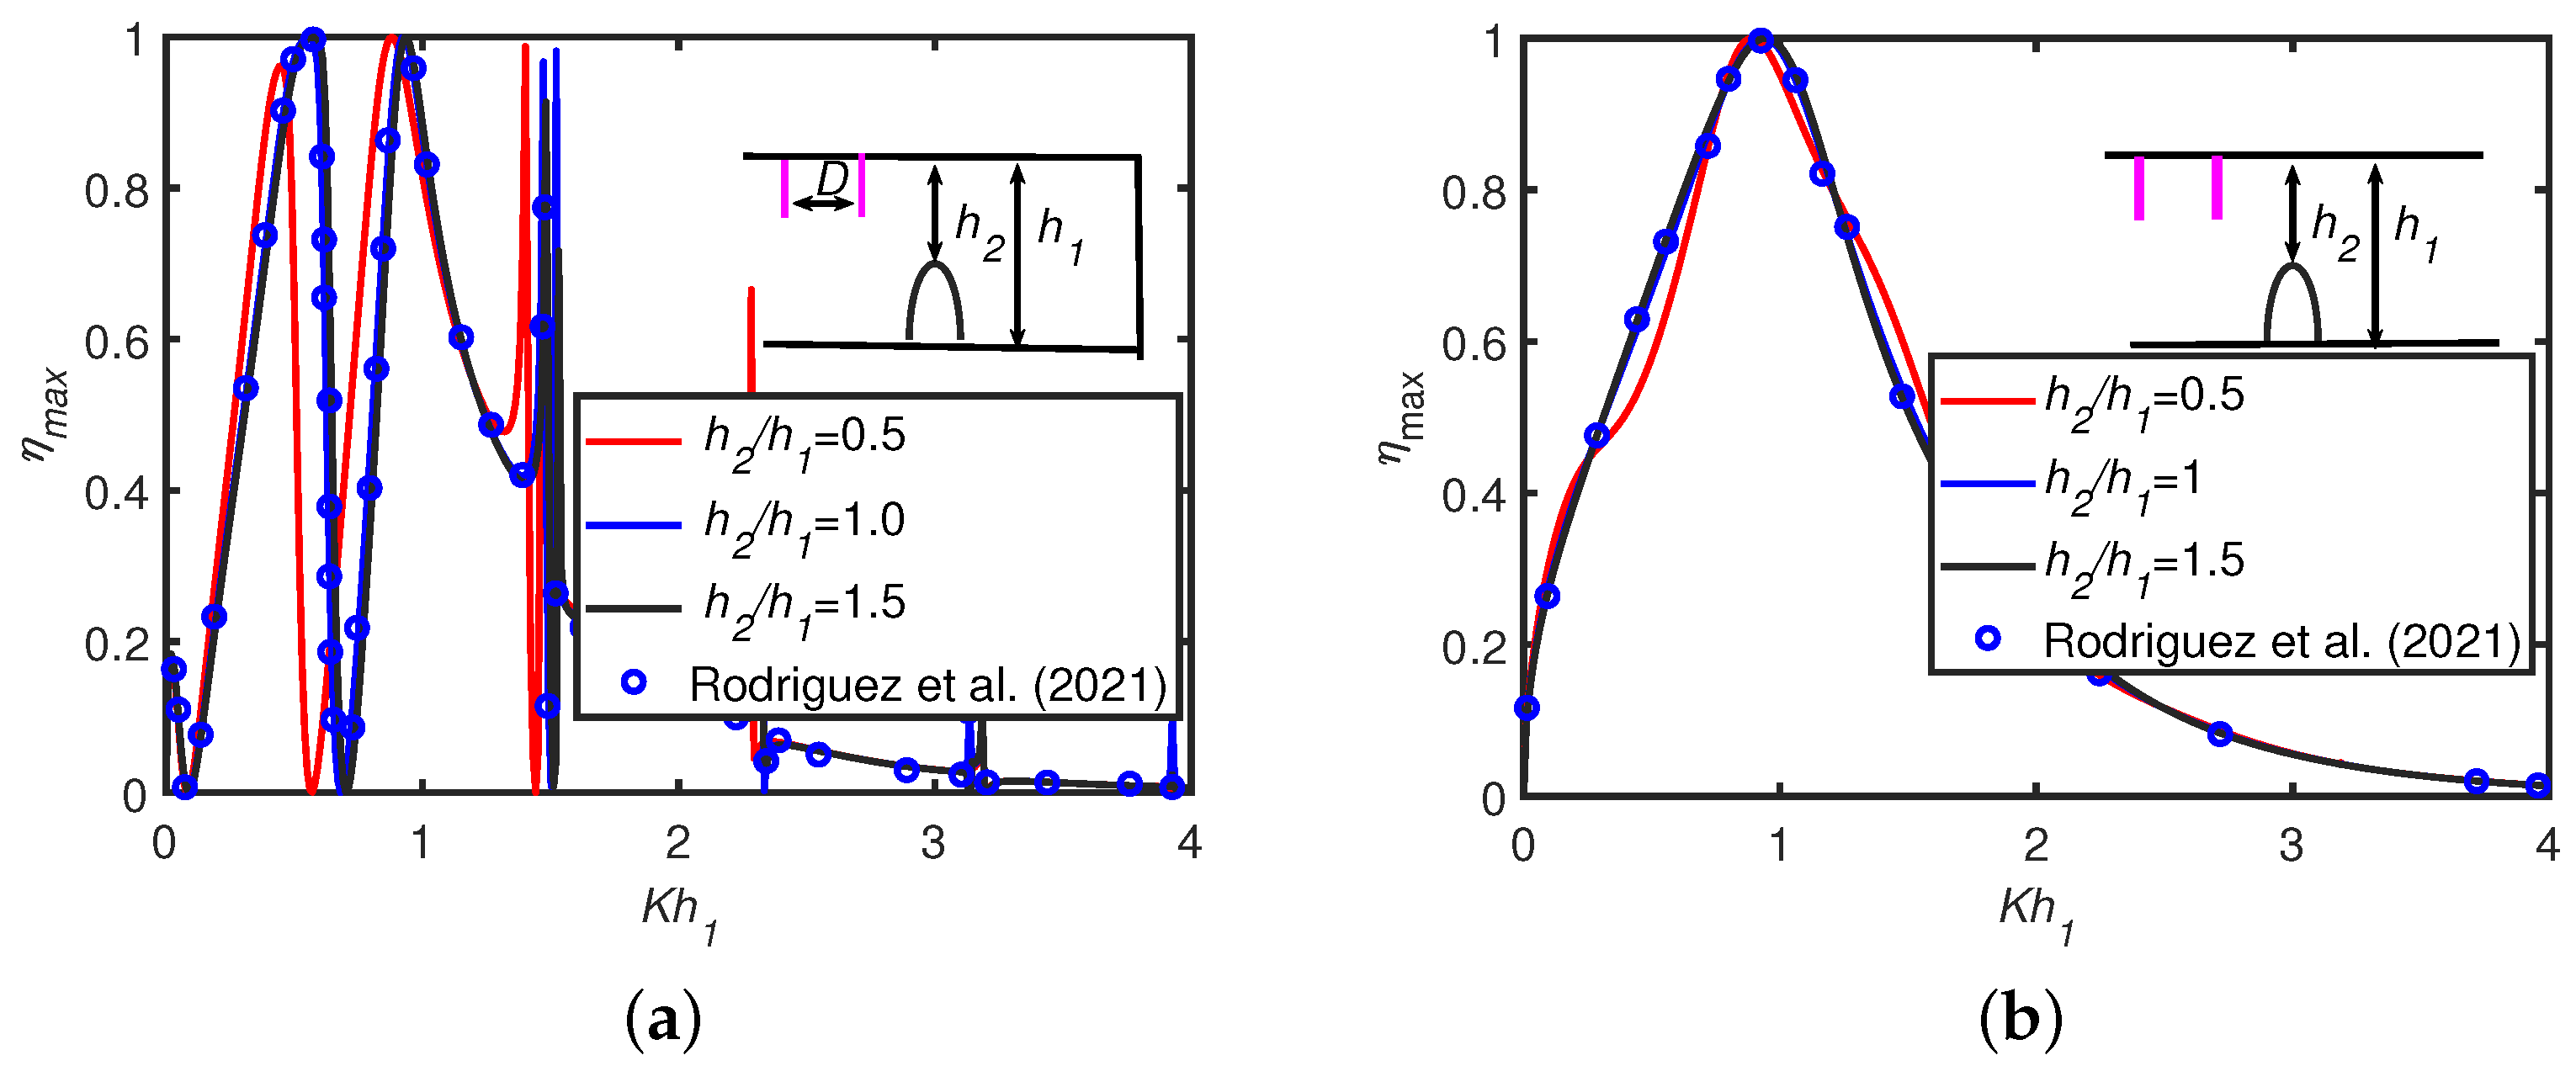
5.4. Comparison with Existing Results of a Fixed-Detached OWC Device in the Presence and Absence of a Vertical Wall (Rodríguez et al. [28])

Figure 5 illustrates the effect of seabed undulation on hydrodynamic efficiency η m a x in the case of a fixed-detached OWC with (Figure 5a) and without (Figure 5b) a shore-fixed reflecting wall with D / h 1 = 1 , a 1 / h 1 ( = a 2 / h 1 ) = 1 / 2 , b 1 / h 1 ( = b 2 / h 1 ) = 1 / 8 , l / h 1 = 2 , w / h 1 = 1 , L / h 1 = 1 . Figure 5a reveals that when the distance between the top of a parabolic breakwater/trench and the mean free surface h 2 / h 1 decreases, the peak efficiency value shifts to the lower frequencies and the efficiency bandwidth is reduced. The result in the case of a flat seabed agrees well with the numerical result of Rodriguez et al. [28] with h 2 / h 1 = 1 . In Figure 5b, the hydrodynamic efficiency matches well with the existing analytical result of Rodriguez et al. [28] in the absence of a reflecting wall with h 2 / h 1 = 1 . A comparison between Figure 5a,b shows that resonance in the efficiency curves occurs in the presence of a reflecting wall. Hence, the validations as shown in Figure 3, Figure 4 and Figure 5 confirm the accuracy of the present numerical model.

6. Results and Discussion

In order to analyze the effects of different wave and structural parameters on the hydrodynamic performance of an OWC in the presence of different seabed configurations, numerical codes are written using MATLAB R2023a software. Various non-dimensional structural parameters associated with OWC and breakwaters/trenches are summarized in Table 5 and Table 6. The values of the selected parameters listed in Table 5 and Table 6 are kept fixed unless it is highlighted in the appropriate figure’s caption. The OWC chamber walls are considered to have constant thickness, i.e., b / h 1 ( = b 1 / h 1 = b 2 / h 1 ) , unless otherwise mentioned.

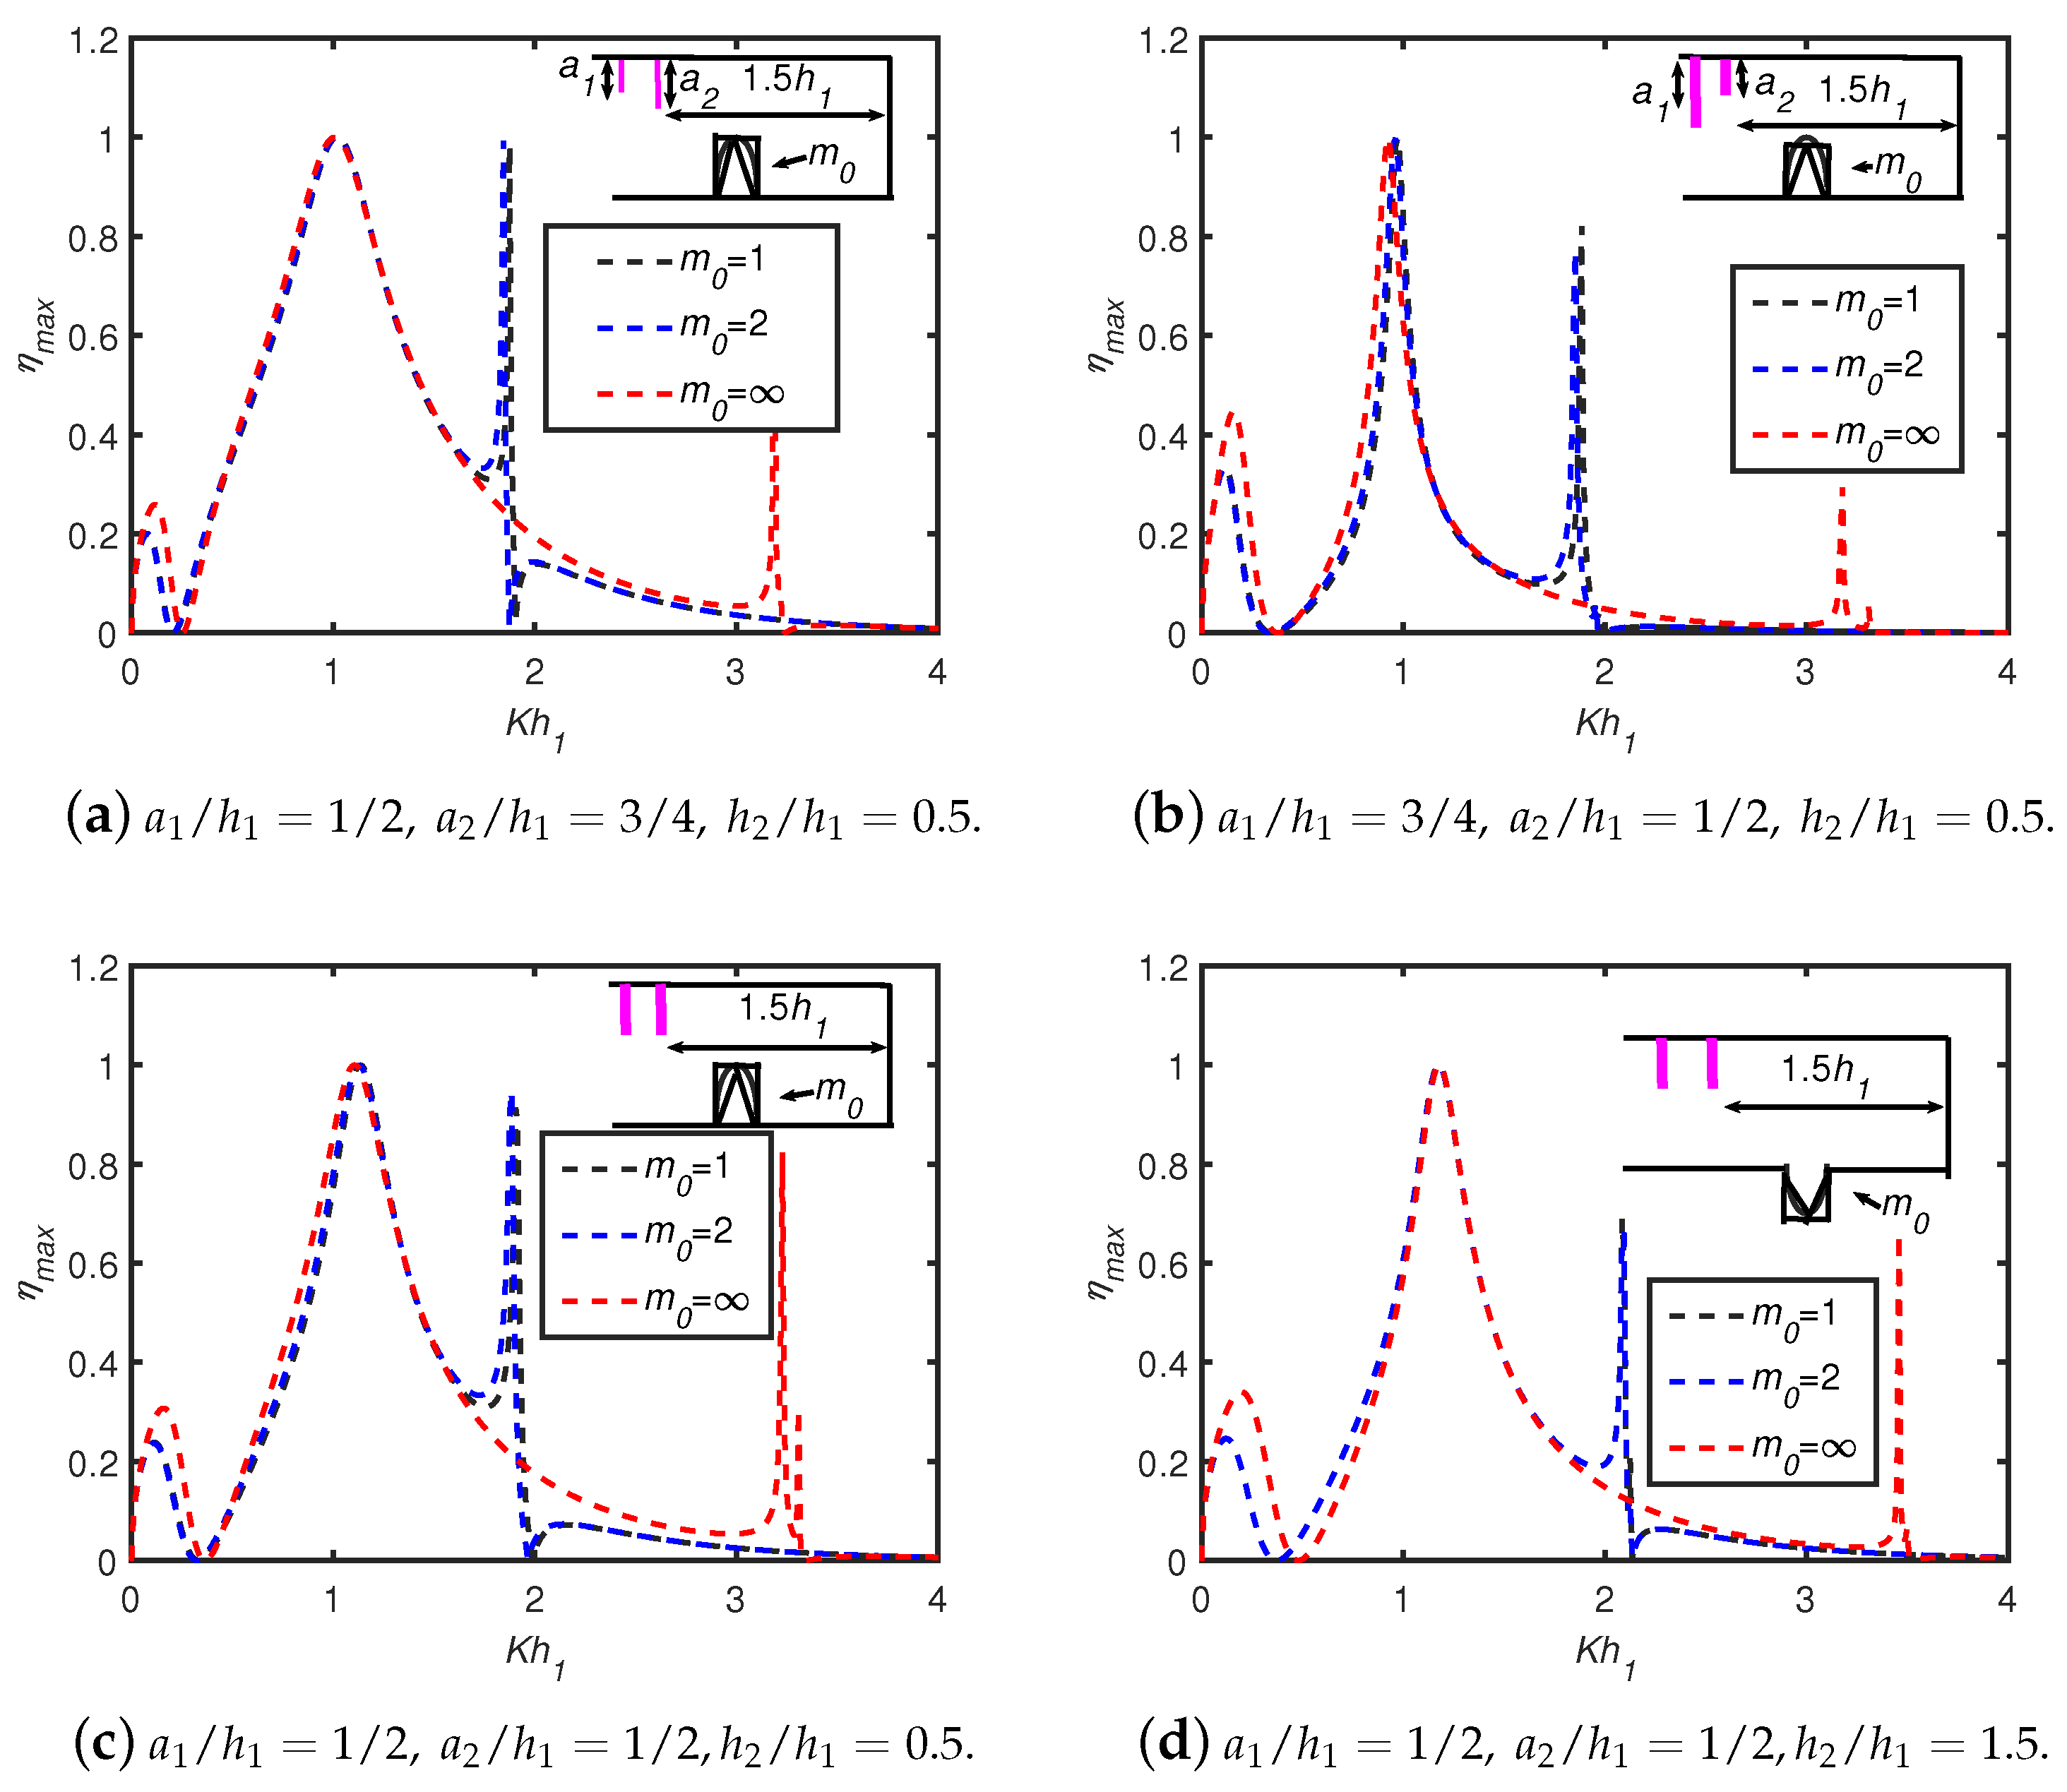
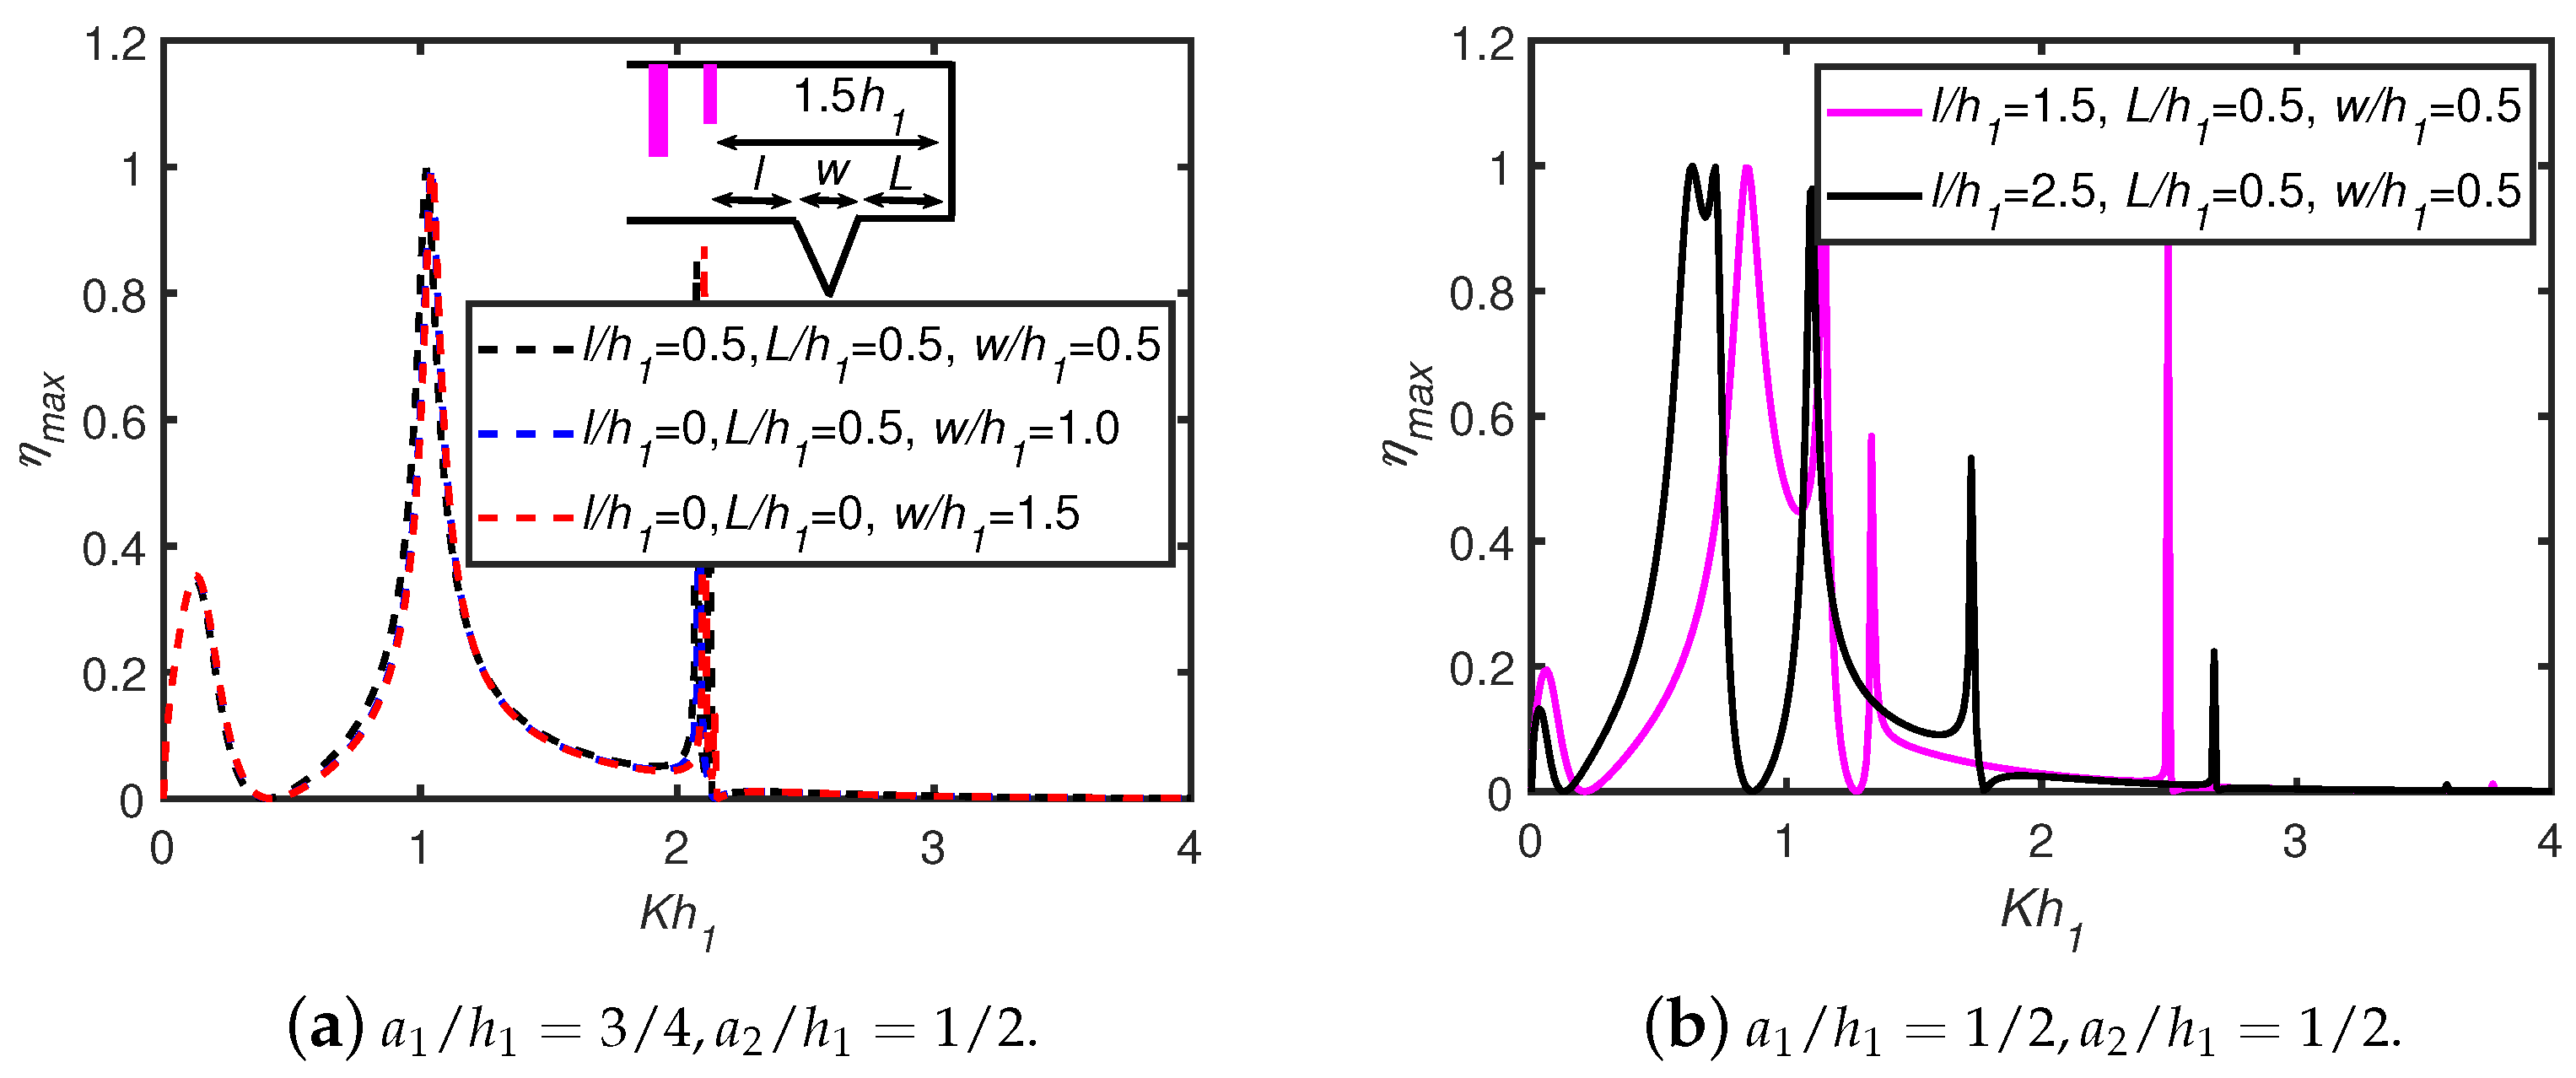
6.1. Effects of a Single Breakwater/Trench: Shapes, Depth, and Width

Figure 6 demonstrates the influence of different distances from the top of the breakwater to the mean free surface h 2 / h 1 on (a) radiation susceptance μ , and (b) radiation conductance ν in the case of a single parabolic breakwater/trench with a 1 / h 1 = a 2 / h 1 = 1 / 2 , b 1 / h 1 = b 2 / h 1 = 1 / 8 , D / h 1 = 1 , l / h 1 = 2 , w / h 1 = 1 , L / h 1 = 1 . The results in Figure 6 in the case of a flat bottom agree well with the existing result of Rodriguez et al. [29]. Figure 6b shows that the area under the curves decreases as h 2 / h 1 decreases, which is similar to the trend observed in efficiency η m a x in Figure 5a. A comparison between Figure 6a and Figure 5a reveals that the minimal values in radiation susceptance μ correspond to the higher values in the efficiency η m a x in the case of a single parabolic breakwater/trench, which is obvious as it follows from Equation (36).
Figure 7 demonstrates the variation in hydrodynamic efficiency of an OWC against non-dimensional frequency K h 1 for three different bottom configurations, namely, triangular, parabolic, and rectangular, in the case of unequal (Figure 7a,b) and equal (Figure 7c,d) front walls drafts of an OWC. Figure 7 shows that the first peak efficiency value that occurs at lower frequencies is greater in the case of a larger front wall draft compared to a larger rear wall draft. Figure 7a,b reveal that the first hydrodynamic peak efficiency value that occurs for a lower frequency, particularly K h 1 < 0.5 , is higher in the case of a rectangular ( m 0 = ) configuration compared to that of a triangular ( m 0 = 1 ) and a parabolic ( m 0 = 2 ) bottom shape. Figure 7a,b show that the second bandwidth in the case of a rectangular breakwater ( 0.2 < K h 1 < 3.2 ) is larger compared to that of a parabolic and a triangular shaped breakwater ( 0.2 < K h 1 < 1.8 ). The area under the largest resonance peak efficiency is reduced in the case of a smaller front wall draft compared to a large front wall draft, as shown in Figure 7a,b. This scenario occurs because more wave energy is captured in the case of a smaller draft front wall OWC in the presence of the breakwater. The reflected wave energy is greater in the case of a smaller draft OWC front wall. In Figure 7c,d, it is observed that the first peak efficiency value is higher in the case of a trench compared to a breakwater. It may be noted that the theoretical value of η m a x = 1 means that the OWC device successfully captures the entirety of the wave energy.
The variation in hydrodynamic efficiency η m a x versus K h 1 is plotted for different (a) submerged depths of the front and rear walls, (b) submerged depths of the front wall, and (c) submerged depths of the rear wall in the case of a single triangular trench as shown in Figure 8. Figure 8a reveals that the maximum peak efficiency value that occurs for K h 1 < 2 shifts to lower frequencies with an increase in the front and rear wall drafts. In Figure 8b,c, it is observed that when the submergence of one of the walls increases, the values of the frequency at which the maximum resonance efficiency η m a x = 1 occurs decrease. Figure 8b reveals that with an increase in draft of the OWC front wall, the efficiency bandwidth is reduced. The peaks at low-frequency ( K h 1 0.2 ) decrease with an increase in the front wall draft of an OWC. For the smaller frequencies, particularly K h 1 < 0.5 in terms of the peak efficiency value, Figure 8c shows an opposite trend to that observed in Figure 8b.
Figure 9 shows the variation in hydrodynamic efficiency η m a x plotted against non-dimensional frequency K h 1 for equal (Figure 9a) and unequal (Figure 9b,c) thicknesses of the front and rear walls in the case of a single triangular trench. The bandwidth of maximum-height peak efficiency decrease with an increase in the wall thickness of the OWC. The frequency at which maximum efficiency occurs decreases with an increase in wall thickness of an OWC. Figure 9 reveals that when the thicknesses of the front and rear walls increase, the peak efficiency value at K h 1 0.2 increases. Figure 9a,b show that the zero efficiency point shifts toward the lower frequencies with an increase in wall thickness. A comparison of Figure 9c with Figure 9a,b shows that the first peak efficiency value is greater when the thickness of an OWC front wall increases. The bandwidth of the efficiency curves is significantly decreased when the front wall thickness increases as shown in Figure 9c. The zero efficiency occurs at a similar frequency irrespective of the change in front wall thickness of an OWC.
In Figure 10, the results of hydrodynamic efficiency η m a x are plotted against non-dimensional frequency K h 1 for different values of the chamber length-to-water depth ratio D / h 1 = 1 / 4 , 1 / 2 , 3 / 4 , 1 in the presence of a single triangular trench. Figure 10 reveals that the first peak efficiency value increases with increasing OWC chamber length D / h 1 irrespective of the different values of the front and rear wall drafts of an OWC. Moreover, the frequency at which maximum-height peak value occurs is shifted towards the lower frequencies when the chamber length D / h 1 increases. The first peak efficiency value at K h 1 0.2 is greater in the case of a larger front wall draft as shown in Figure 10a compared to Figure 10c,b as the chamber length D / h 1 increases. Figure 10c demonstrates the maximum-height peak efficiency bandwidth increases with an increase in the chamber length of an OWC. It is seen that the bandwidth for maximum-height peak efficiency is highly reduced in the case of a larger front wall draft of an OWC. Figure 10 reveals that the variation in frequency points at which the maximum-height peak efficiency occurs is more compared with Figure 9. Moreover, in Figure 10 for K h 1 0.5 , all the efficiency curves coincide irrespective of the chamber length D / h 1 . The reason may be the occurrence of destructive interference.
Figure 11 shows the variation in hydrodynamic efficiency η m a x versus K h 1 for different values of (a) trench width w / h 1 , and (b) gap length between the trench and OWC l / h 1 (maintaining a fixed gap length between the OWC and vertical wall) in the case of a single triangular trench. Figure 11a reveals that the first peak efficiency value remains unchanged with an increase in the trench width w / h 1 . The bandwidth of peak efficiency at K h 1 = 1 changes slightly, while for a larger trench width, the bandwidth decreases. In Figure 11b, a variation in the efficiency curves is observed with an increase in the gap distance between the trench and the OWC. A greater number of resonance peaks are observed compared with Figure 11a. Figure 11b reveals that when the gap distance increases, the first peak efficiency value occurs for the lower frequency; particularly, K h 1 < 0.5 decreases. Troughs between two consecutive resonance peaks are observed in the case of short and intermediate wave-length regimes. The efficiency bandwidth at the lower frequency decreases with an increase in the gap distance between the trench and OWC as shown in Figure 11b. The peak frequency value is shifted to the lower frequencies. This is because increasing the gap distance increases the horizontal distance a fluid particle must travel during a period of motion, resulting in a reduction in the value at which the resonance occurs.
Figure 12 demonstrates the variation in hydrodynamic efficiency η m a x against dimensionless wave frequency K h 1 for different values of (a) the distance from the top of the breakwater to the mean free surface h 2 / h 1 , (b) the width of a breakwater w / h 1 with OWC front wall draft a 1 / h 1 = 2 / 10 , and OWC rear wall draft a 2 / h 1 = 1 / 10 , chamber length D / h 1 = 1 / 2 , and thickness of OWC wall b 1 / h 1 = b 2 / h 1 = 1 / 10 . Figure 12a shows that in the case of the short wave-length regime, there is minimal variation in the efficiency curves with an increase in distance from the top of a breakwater to the mean free surface h 2 / h 1 . Figure 12a shows that the variation in the OWC efficiency in the case of a flat bottom h 2 / h 1 = 1 agrees very well in the case of the breakwater ( h 2 < h 1 ). The variation in efficiency improves in the case of the trench ( h 2 > h 1 ) compared to the breakwater ( h 2 < h 1 ) in the long wave-length regime. This phenomenon is due to the occurrence of additional trapped wave energy in the case of trench-type bottom undulation compared to a breakwater undulation. In short and intermediate wave-length regimes, an efficiency phase shift is observed with an increase in wave frequency K h 1 . Figure 12b demonstrates the variation in efficiency η m a x against dimensionless wave frequency K h 1 with a change in trench width w / h 1 in the case of a single triangular shape trench ( m 0 = 1 ). Figure 12b reveals that the efficiency increases with an increase in K h 1 in the case of long and intermediate wave-length regimes, while it decreases in the short wave-length regime. Furthermore, the amplitude of the resonance efficiency peaks decreases with an increasing width of the trench. The occurrence of resonance peaks and the number of zero efficiency points increases as the width of the trench increases, which is due to the formation of nodes and anti-nodes inside the trench and gap region.

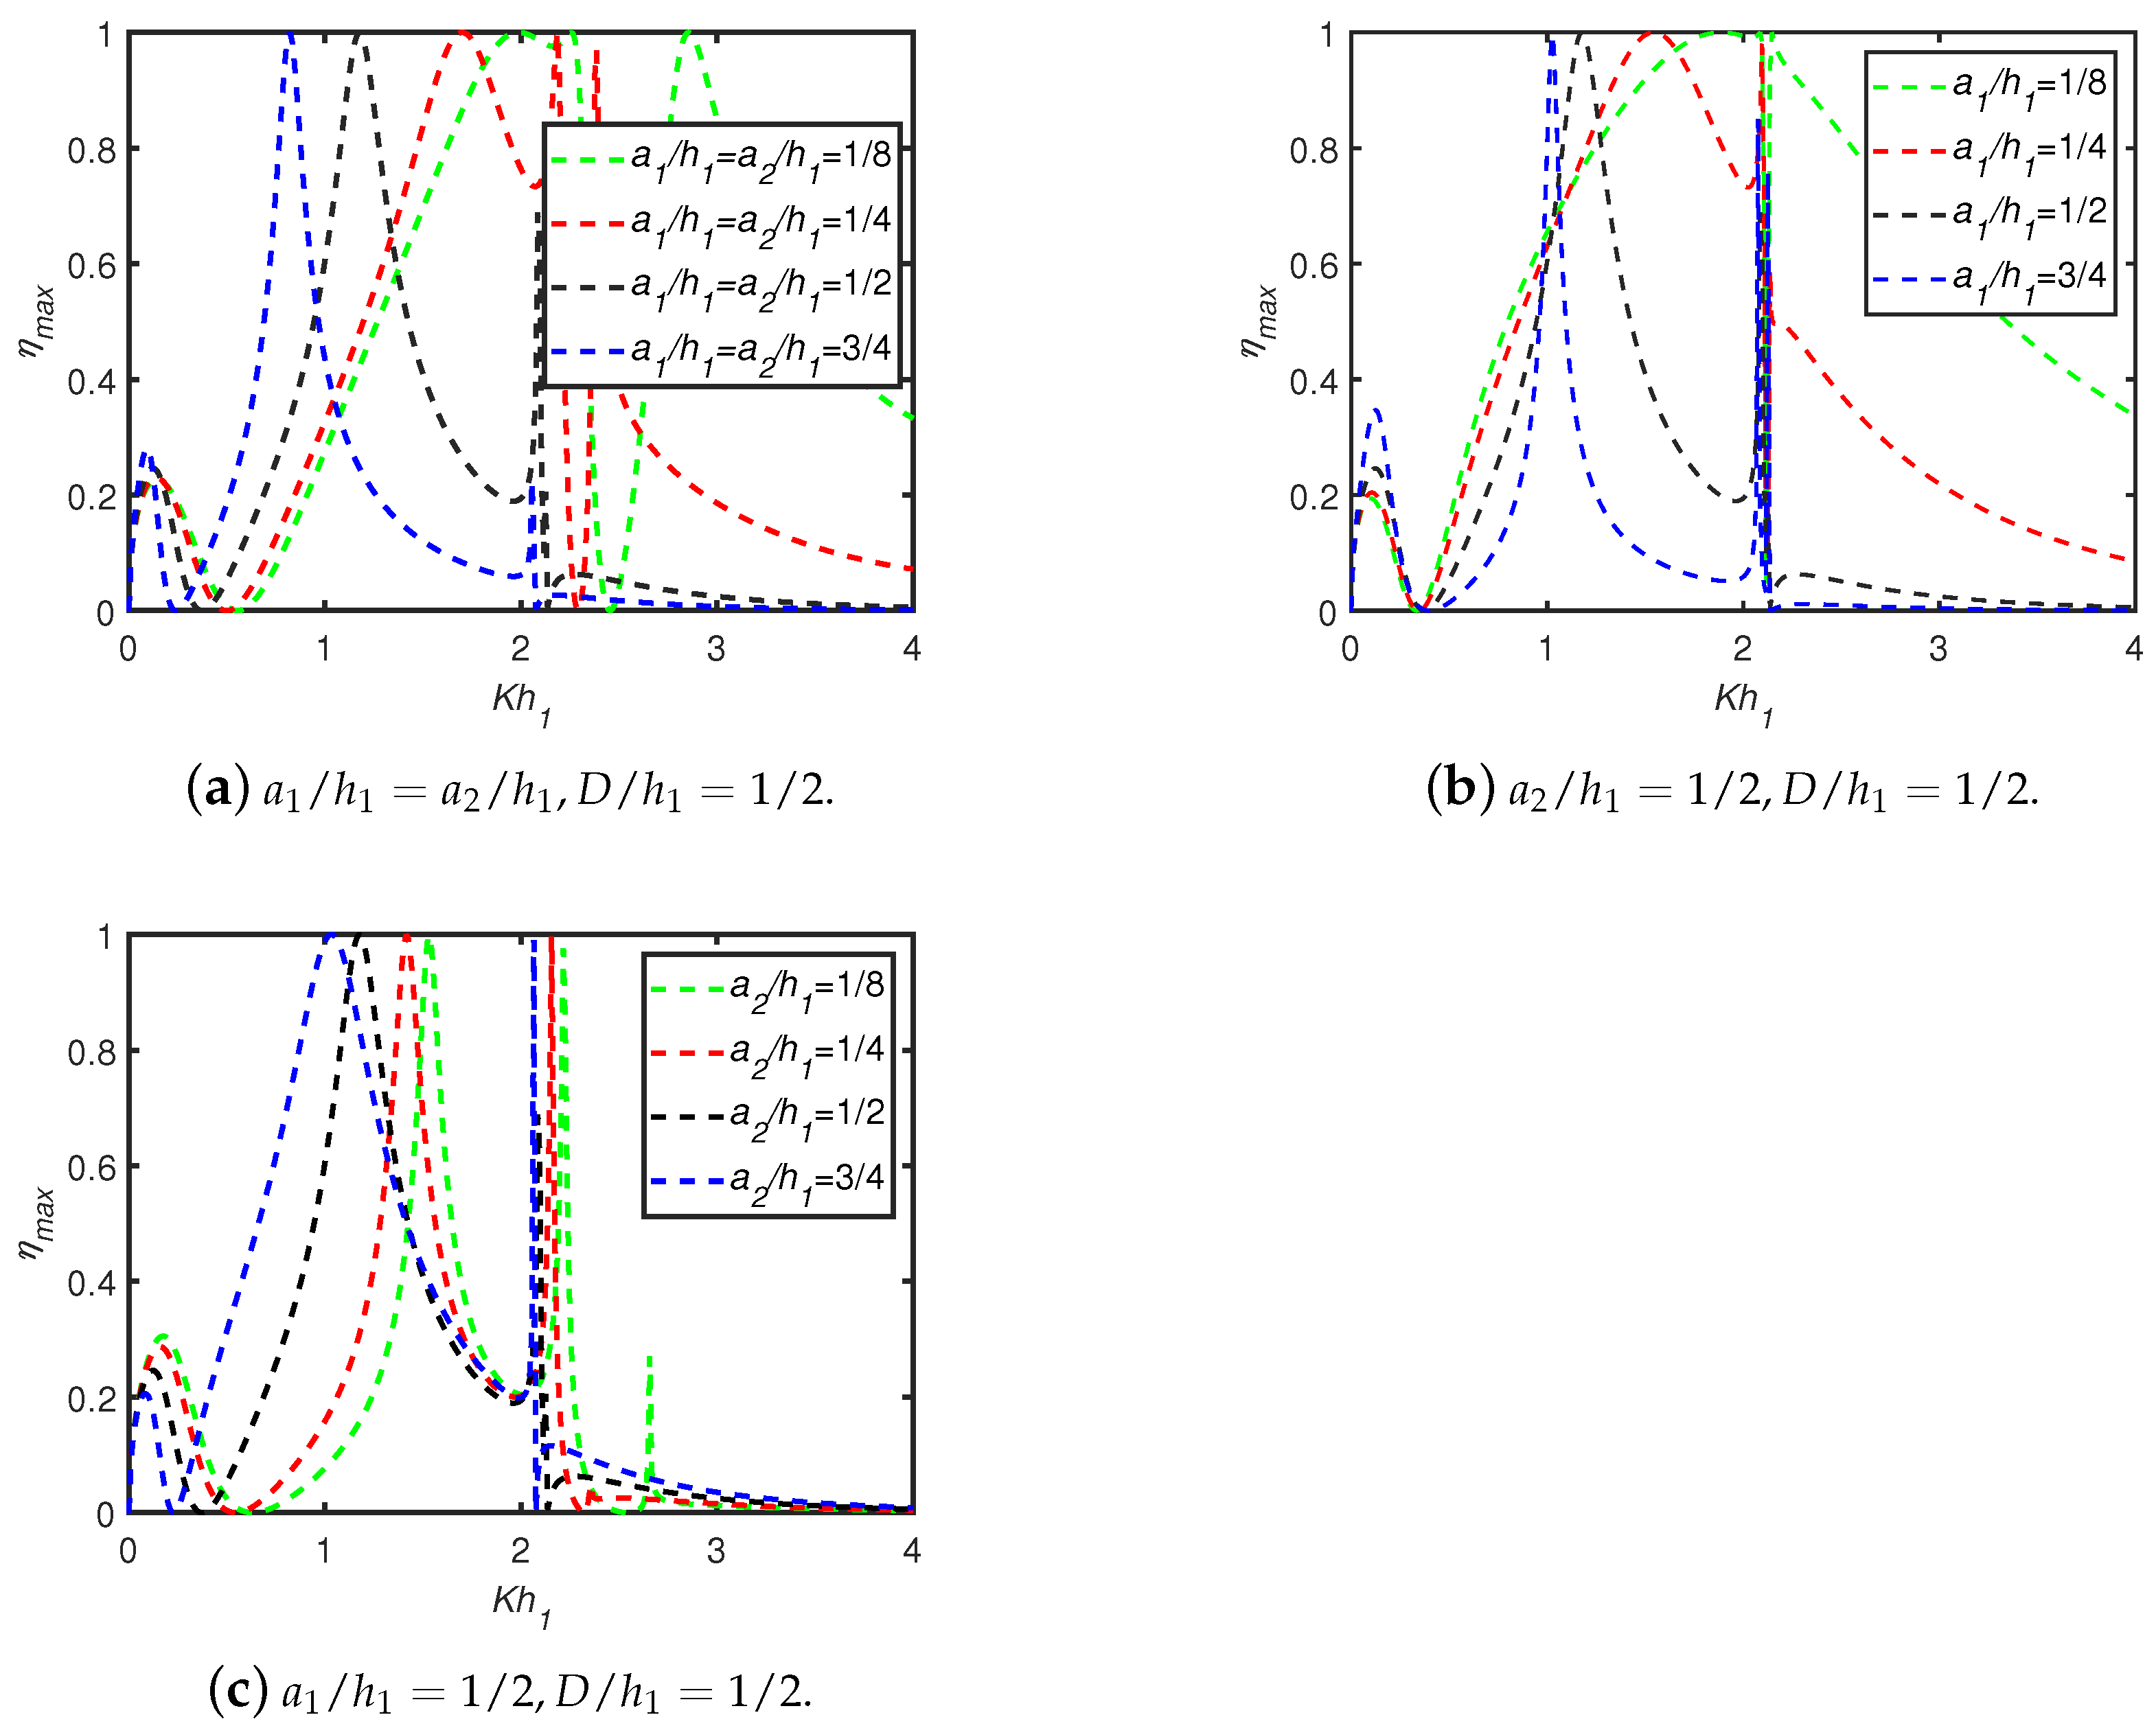
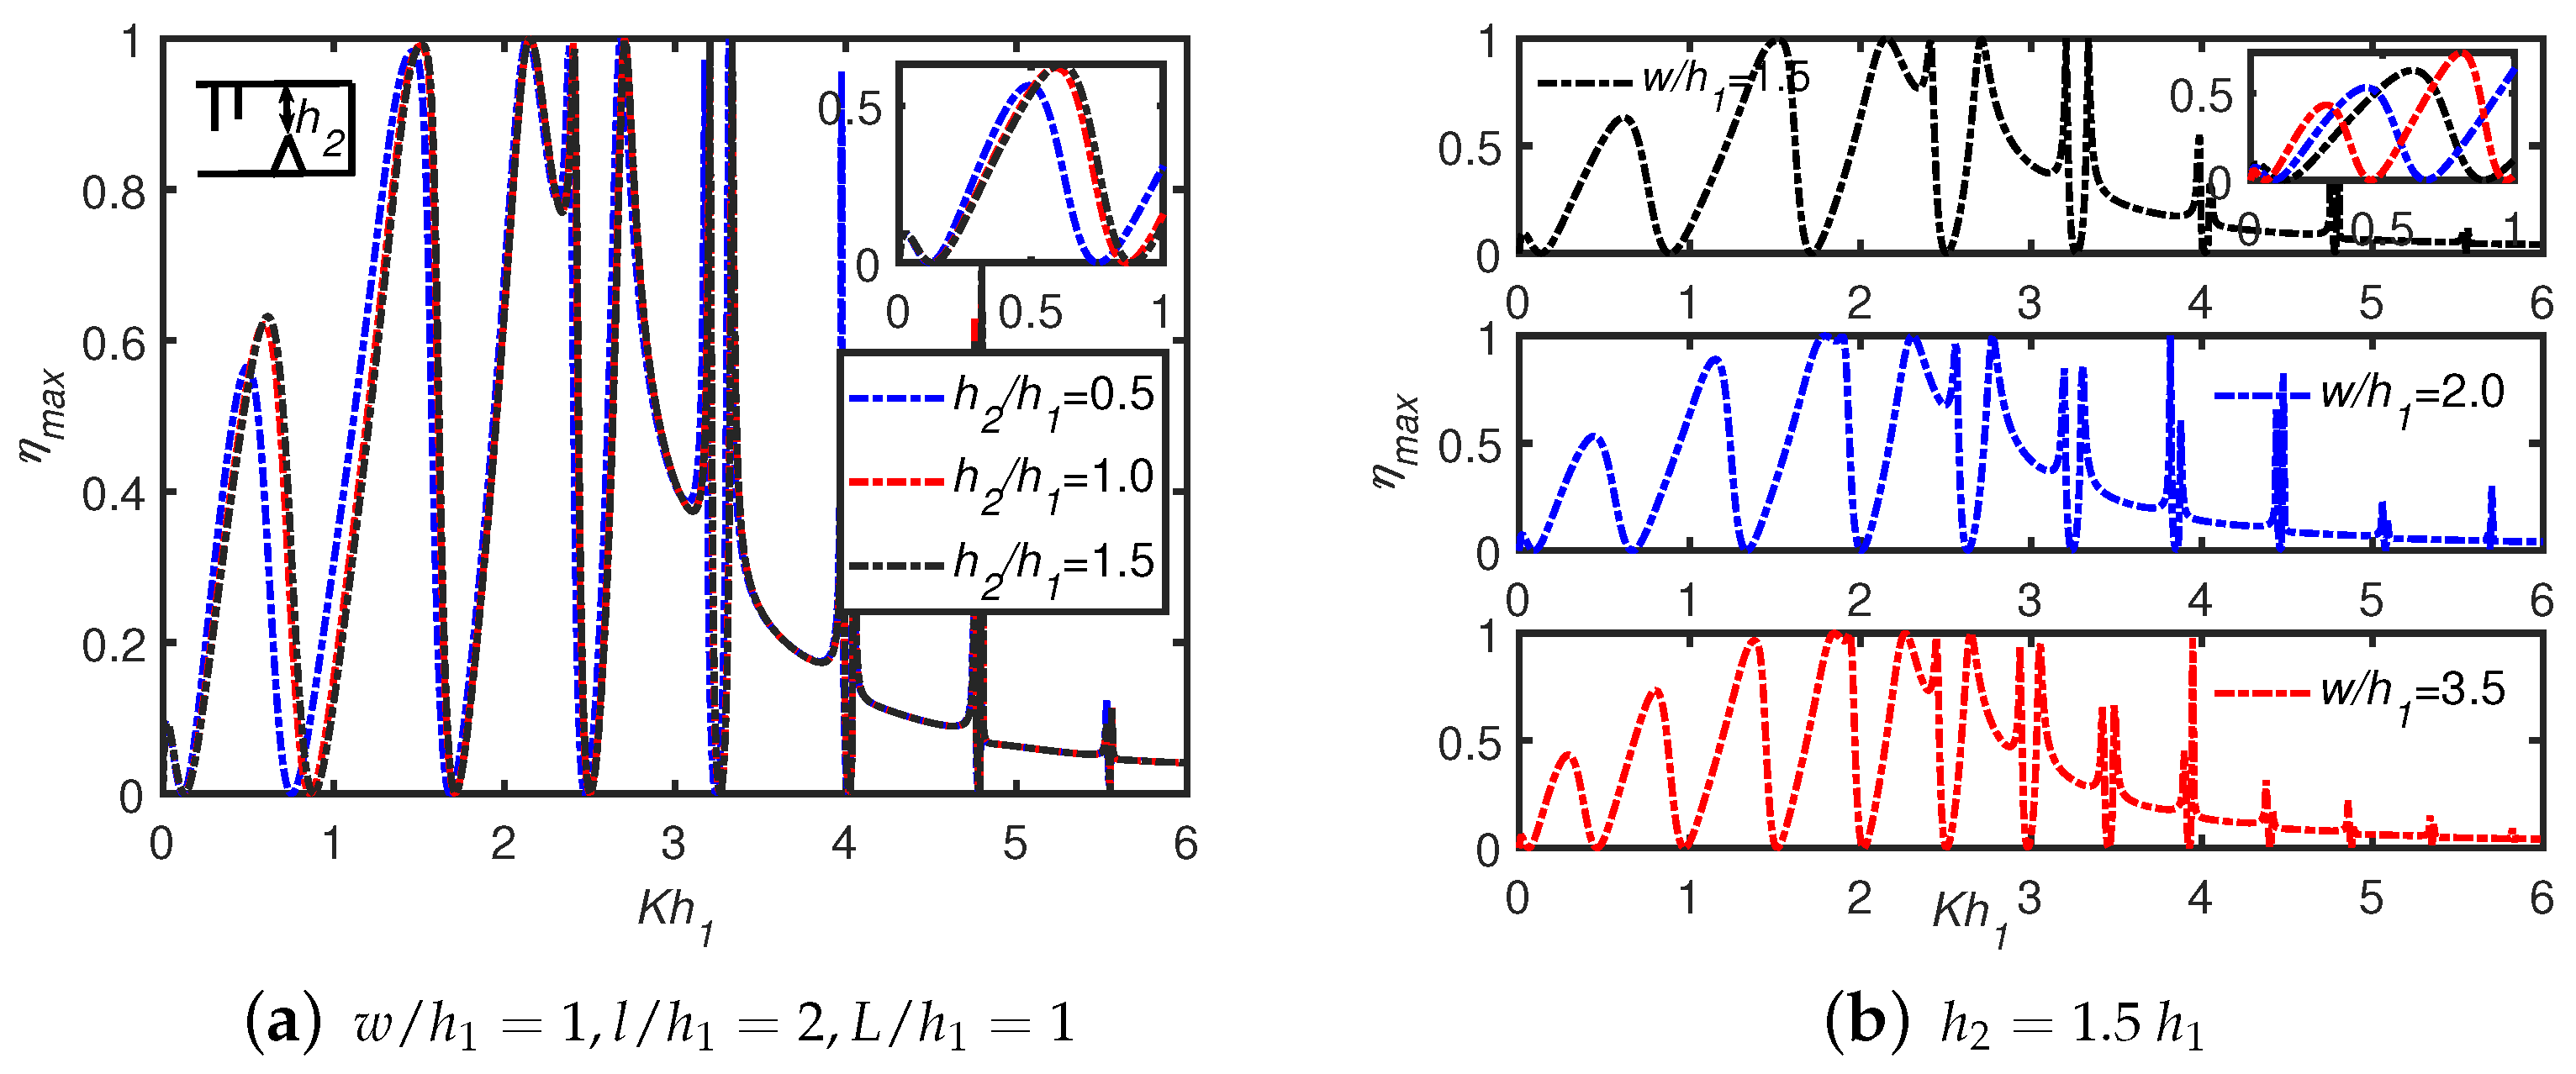
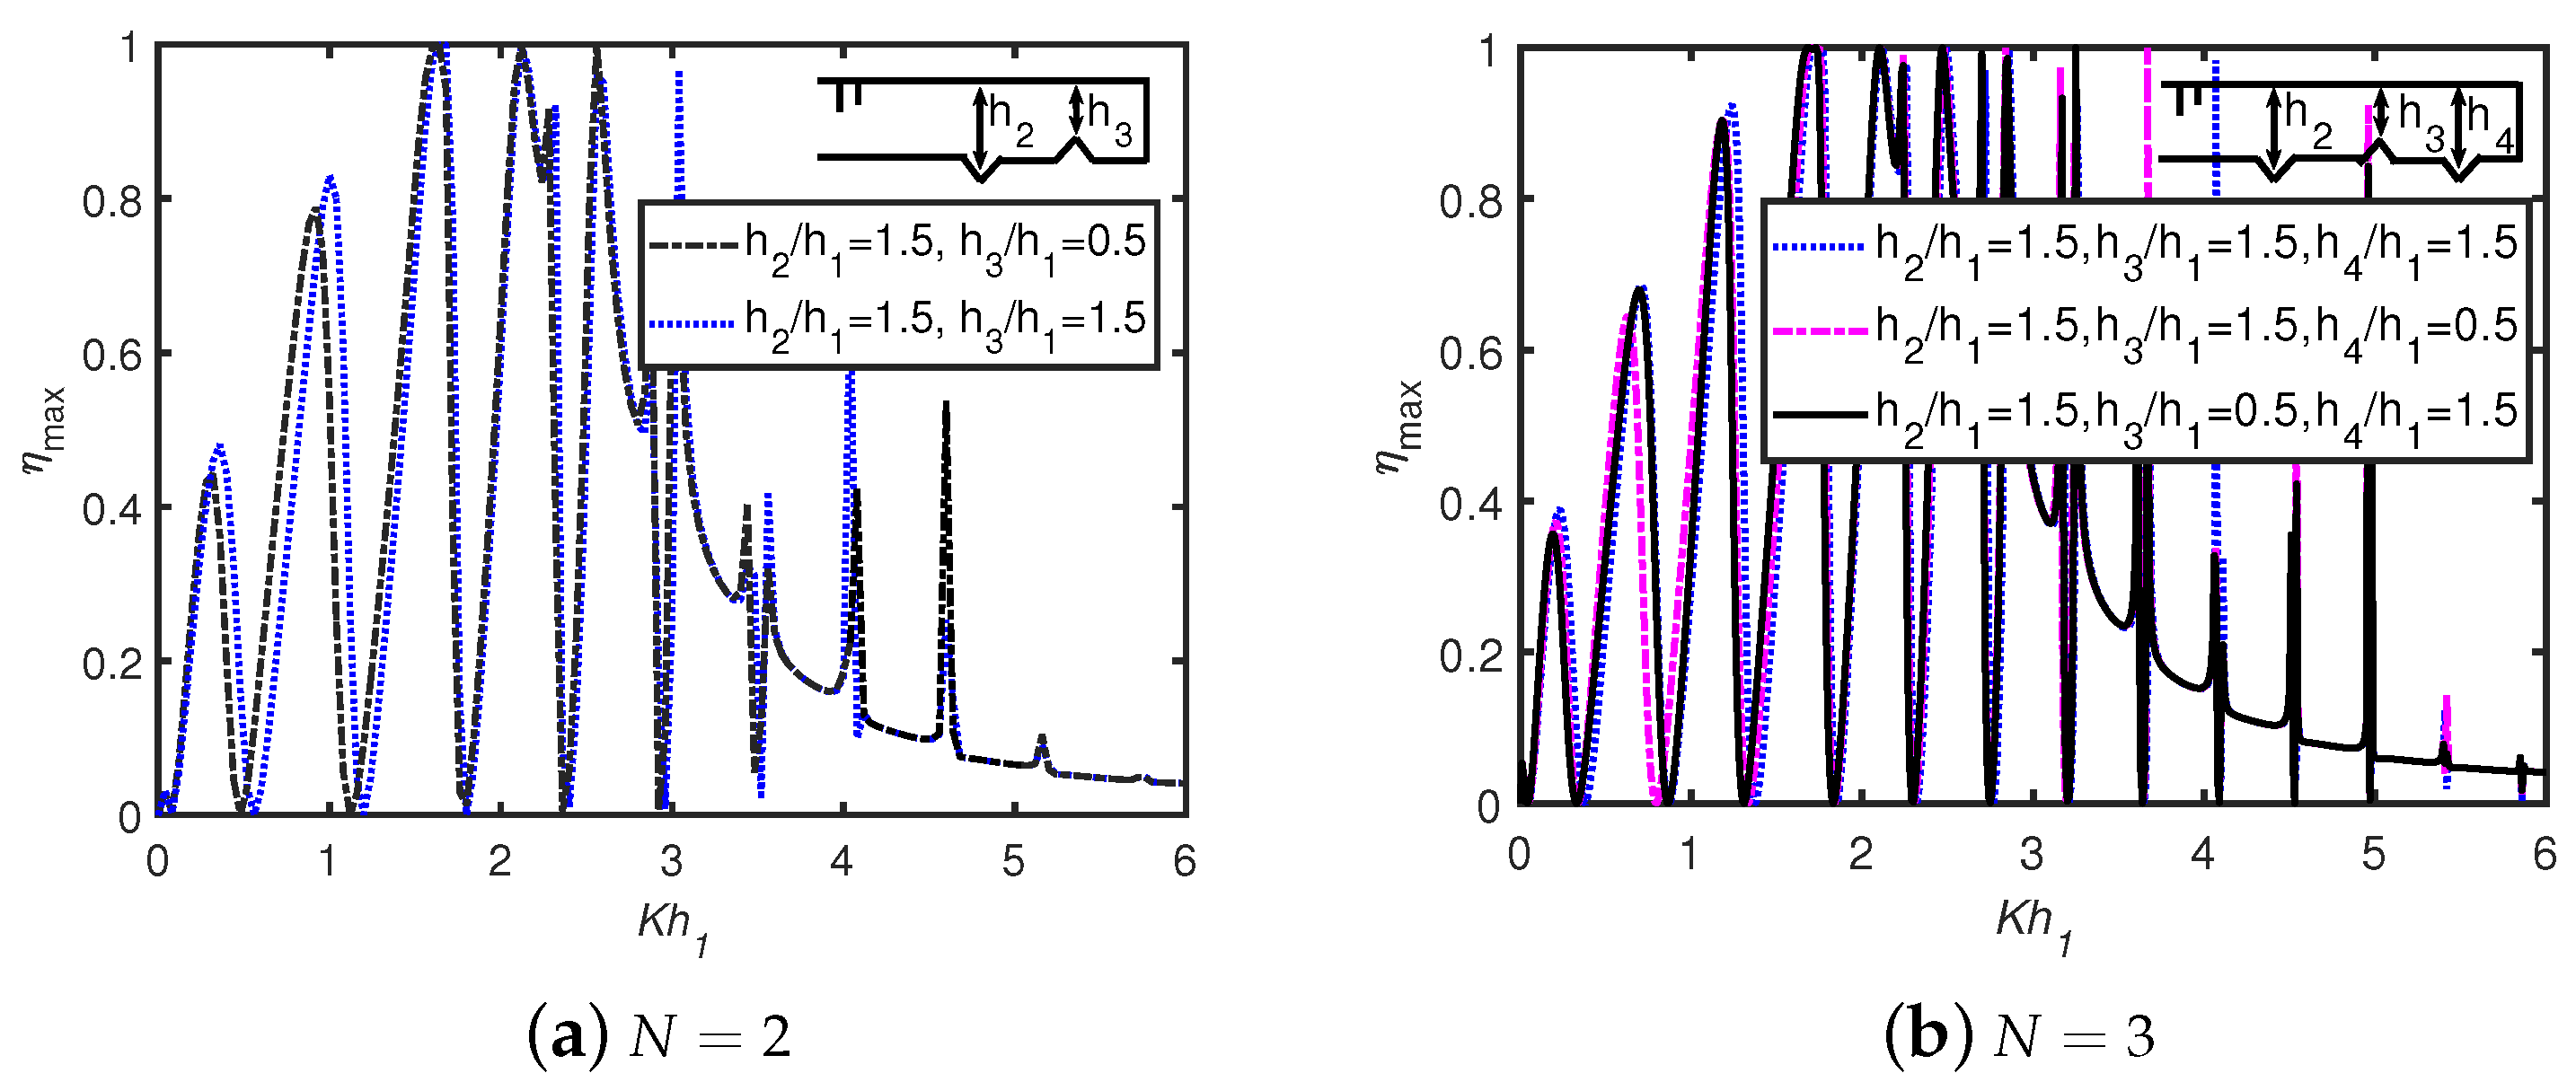
6.2. Effects of Multiple Trenches/Breakwaters

Figure 13 demonstrates the variation in the hydrodynamic efficiency η m a x against dimensionless wave frequency K h 1 in the case of (a) double and (b) triple triangular breakwaters–trenches in combination. Figure 13a reveals that the efficiency is higher in the case of multiple trenches as compared to the trench–breakwater combination. A similar scenario is observed in the case of a single trench as shown in Figure 12a. The amplitude of the resonance peaks increases with an increase in K h 1 for the long wave-length regime, whilst efficiency decreases for intermediate and short wave-length regimes. A comparison between Figure 13a and Figure 7a reveals that the number of resonance peaks for the long wave-length regime is greater as the number of breakwaters/trenches increases. The total number of peaks is equal to N + 2 for N number of breakwaters/trenches in the long wave-length regime. The number of resonance peaks and troughs increases with an increase in the number of breakwaters. Figure 13b illustrates that there is a shift in the resonant efficiency peak positions with a change in depth h 3 / h 1 where h 3 is the gap distance between the mean free surface to the top of the second breakwater. A similar phenomenon is observed in Figure 13a. Moreover, the occurrence of a shift in resonance peak points happens due to the alternating depth from the top of the breakwater to the mean free surface. In Figure 13b, an increase in the number of resonance peaks and troughs is observed, which is due to additional trapped wave energy.
Figure 14 demonstrates the variation in the hydrodynamic efficiency η m a x against the dimensionless wave frequency K h 1 for different values of trench width, (a) w / h 1 = 1.5 , (b) w / h 1 = 2.5 , in the case of triple trenches. Figure 14a shows that the peak amplitude in efficiency η m a x increases with an increase in K h 1 for K h 1 < 2 , whilst the reverse trend is observed for K h 1 > 2 . Therefore, 0 < K h 1 < 6 can be defined as one full cycle resonance bandwidth in terms of the efficiency. Two consecutive resonant peaks are separated by a zero minimum for K h 1 < 2 . However, for K h 1 > 2 , a trough and a zero minimum point alternately occur between two successive peaks. Figure 14a demonstrates that the number of resonance peaks and troughs between two consecutive resonance peaks increases with an increase in wave frequency K h 1 in the case of multiple trenches as compared to a single trench. The peaks occur due to the formation of anti-nodes in the standing wave pattern, and the minimum values occur due to nodes over the trenches and gap distance between the trenches. A similar result was demonstrated by Kar et al. [31]. A comparison between Figure 14a,b reveals that the amplitude of the resonance peaks decreases for a larger trench width due to resonance.

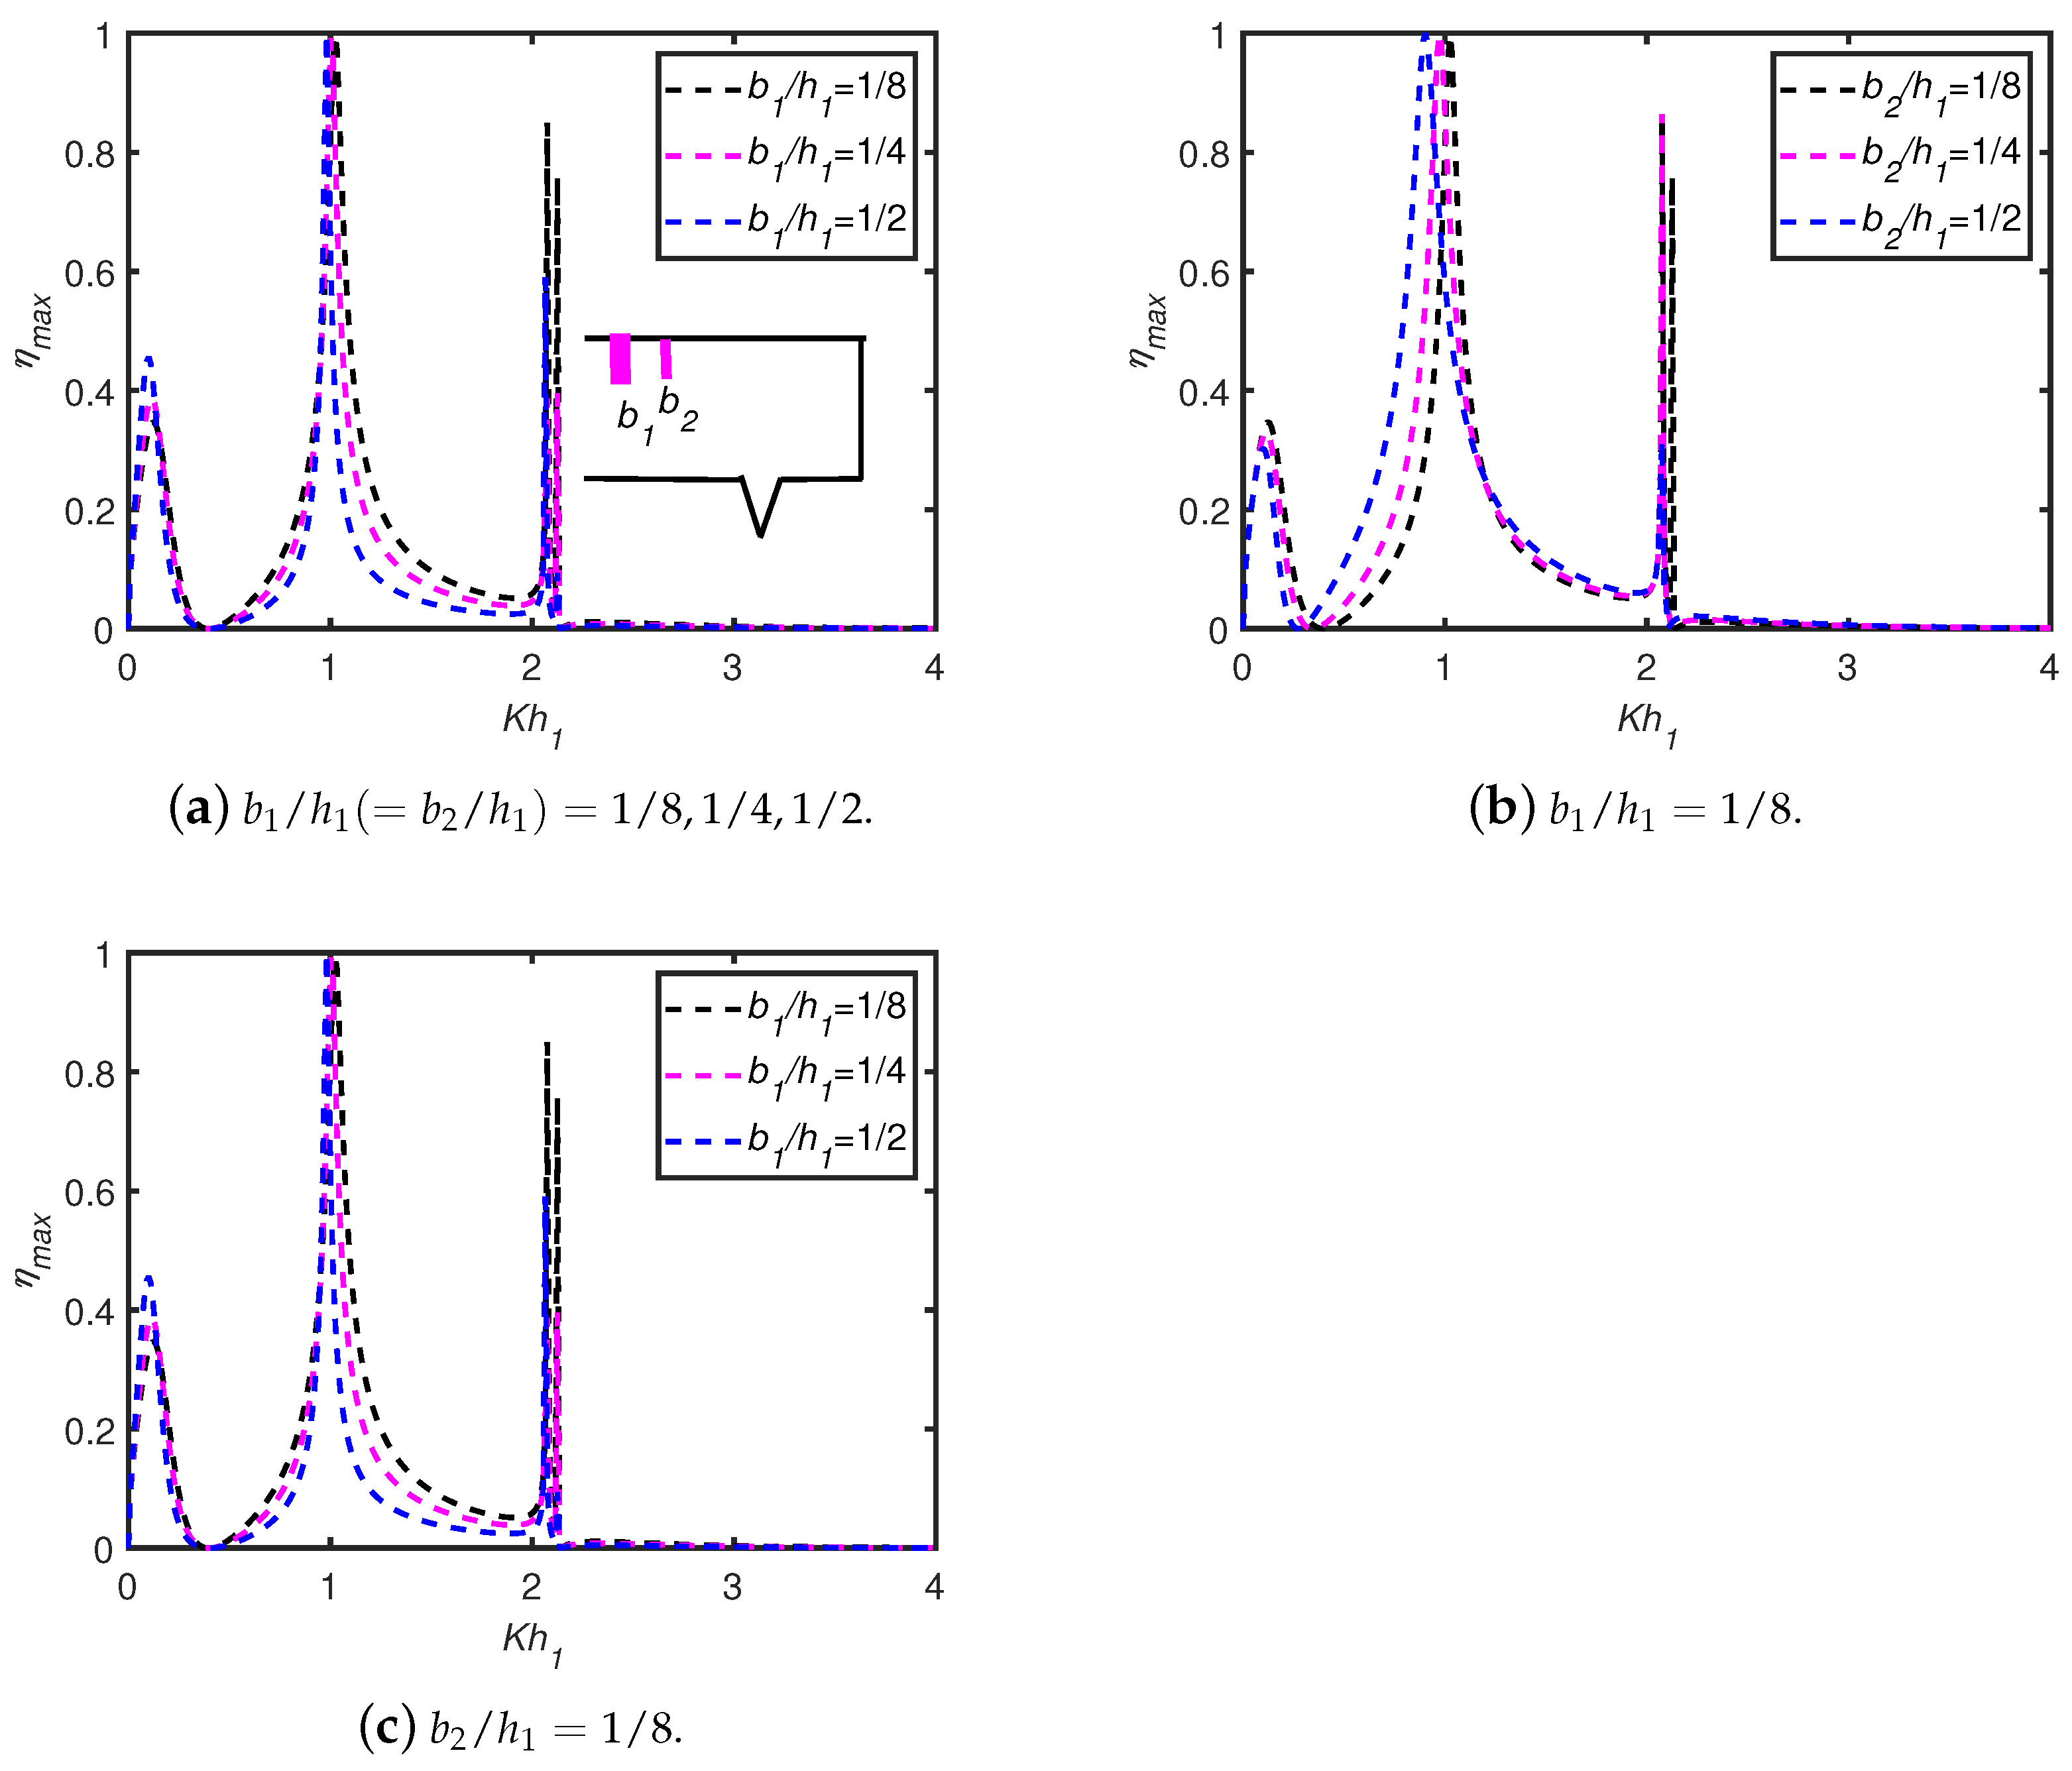
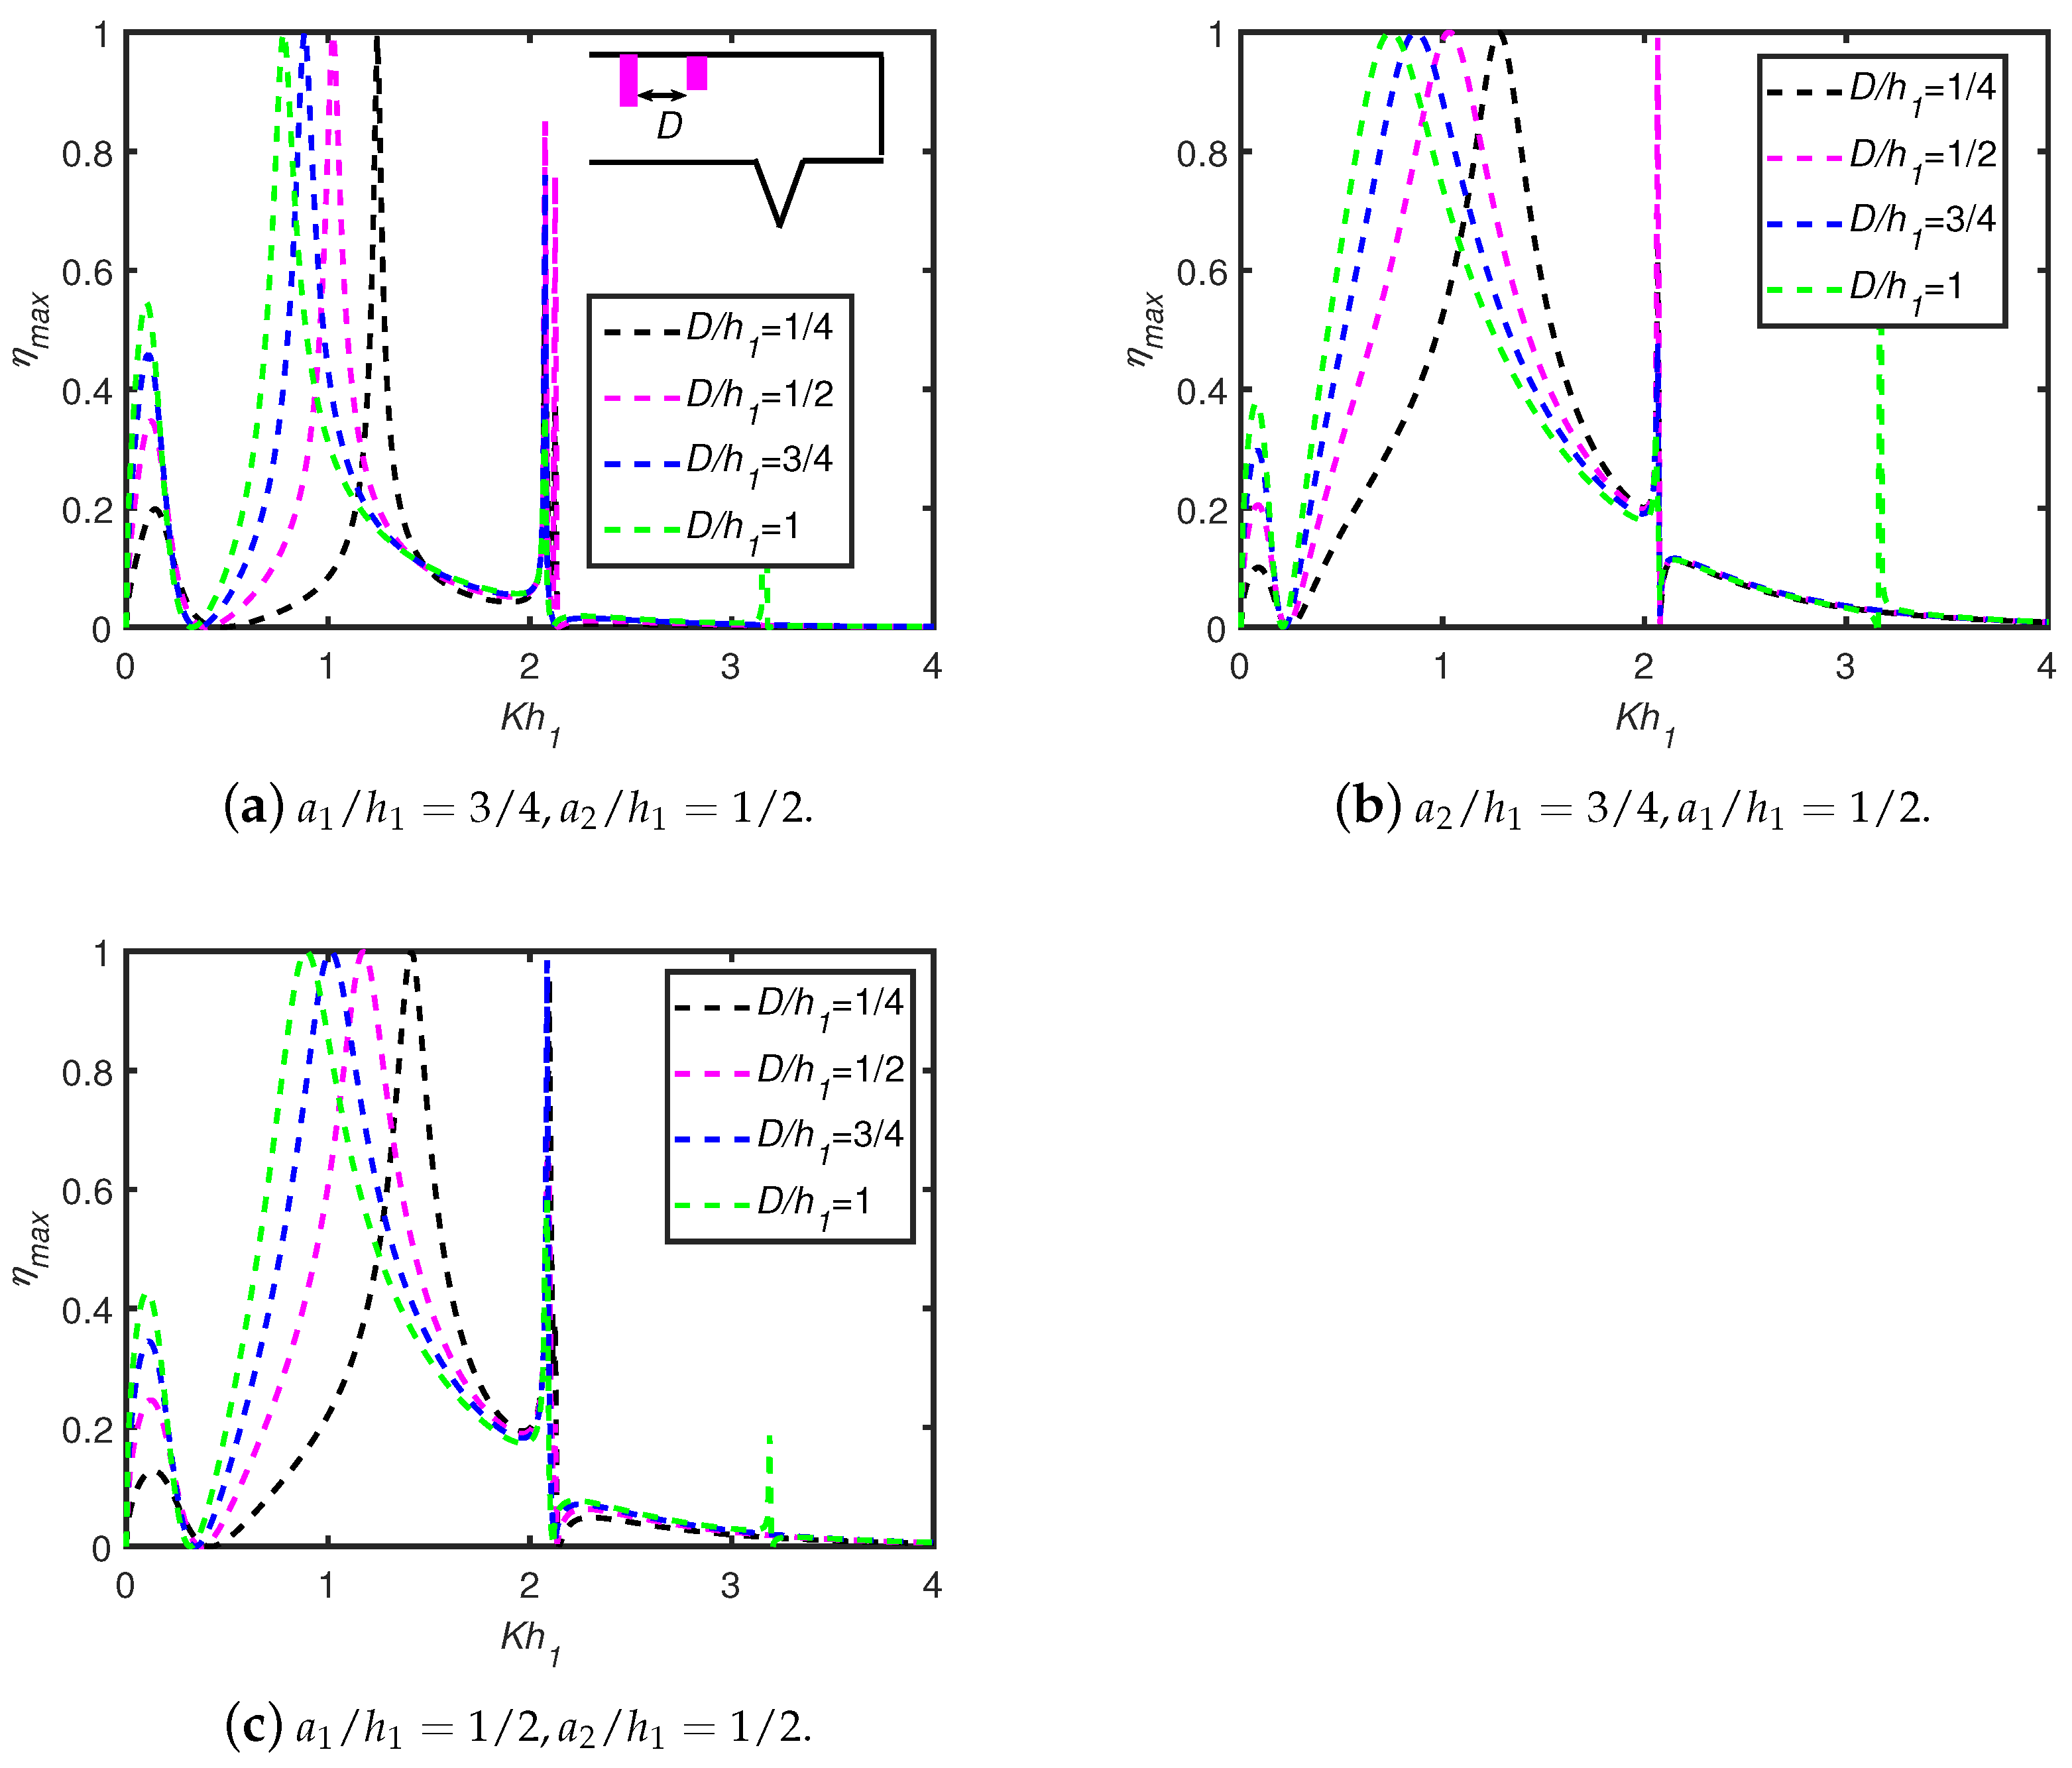
6.3. Effects of OWC Parameters: Front Wall Draft, Chamber Breadth, Wall Thickness

Figure 15 shows the variation in efficiency η m a x against the dimensionless wave frequency K h 1 for different values of (a) OWC front wall drafts a 1 / h 1 , and (b) chamber breadths D / h 1 in the case of triple trenches. The number of resonance peaks is higher in the presence of triple trenches compared to single and double trenches as observed in Figure 12a and Figure 13a. Figure 15a shows that the amplitude of the resonance peak efficiency η m a x increases with an increase in wave frequency K h 1 for K h 1 < 1 in the case of a 1 / h 1 = 0.8 , while it decreases and tends to zero for higher values of K h 1 , i.e., K h 1 > 3 in the case of a 1 / h 1 = 0.4 , 0.6 , respectively. Figure 15a shows that zero efficiency is observed for the higher wave frequencies K h 1 , i.e., K h 1 > 2 in the case of a 1 / h 1 = 0.8 . The bandwidth of a complete cycle decreases with an increase in the OWC front wall draft a 1 / h 1 . Figure 15a shows that the number of resonance peaks decreases with an increase in wave frequency K h 1 for K h 1 < 2 with the deeper OWC front wall draft a 1 / h 1 . Troughs occur between the consecutive resonance peaks, which is a similar observation as seen in Figure 14. The number of troughs decreases with an increase in the OWC front wall draft a 1 / h 1 . Figure 15b reveals that the peak amplitude efficiency and bandwidth for K h 1 < 1 increase when chamber length D / h 1 increases. A similar observation is seen in Figure 10 in the case of a single trench. Therefore, this study shows that suitable values of an OWC wall draft are important to achieve a higher efficiency from the OWC.
Figure 16 reveals the variation in hydrodynamic efficiency η m a x versus K h 1 in the case of different values of OWC wall thickness (in Figure 16a,b, the front and back walls have equal thickness, and in Figure 16c,d the front and back wall thicknesses are unequal) in the case of triple triangular trenches. Figure 16a,b reveal that in the case of the long wave-length regime, particularly for K h 1 < 0.5 , the peak amplitude value in efficiency η m a x increases with an increase in the OWC wall thickness b / h 1 and zero efficiency occurs between two consecutive resonance peaks. A similar observation was discussed in Rodriguez et al. [29]. Moreover, it is observed that the pattern of the trough region in the efficiency curve between two consecutive resonance peaks for 3 < K h 1 < 4 follows a reverse trend as that seen for 1 < K h 1 < 3 . This phenomenon occurs because of the change in phase of wave motion inside the chamber. Figure 16a,b also show that the trough amplitude between two consecutive resonance peaks decreases with an increase in OWC wall thickness b / h 1 . Additionally, the number of zero efficiency points in Figure 16a,b is the same irrespective of different values of wall thickness b / h 1 . Figure 16c shows that resonance peak efficiency amplitude increases with an increase in front wall thickness in the long wave-length region, whilst the trough between two consecutive resonance peaks decreases in magnitude and tends to zero for intermediate and short wave-length regimes. In Figure 16d, the variation in efficiency is negligible in the case of a smaller wave frequency for change in OWC rear wall thickness compared to a change in thickness of OWC front wall. Figure 15 and Figure 16 show that chamber breadth D / h 1 and OWC wall thickness b / h 1 play an important role in enhancing the efficiency of the OWC.
Figure 17 demonstrates the variation in hydrodynamic efficiency η m a x versus non-dimensional frequency K h 1 in the case of different values of unequal OWC wall thickness in the case of triple triangular trenches with OWC chamber breadth D / h 1 = 1 / 2 . Figure 17a reveals that the peak amplitude efficiency for smaller frequencies increases with an increase in the front wall thickness, while the trough between consecutive resonance peaks decreases, which is similar to the trend observed in Figure 16c. Figure 17b shows the minimal variation in efficiency when the OWC rear wall thickness increases. Figure 17 shows that the number of zero efficiency points is the same irrespective of the change in the front or rear wall thickness. A comparison between Figure 16c,d and Figure 17 shows that with an increase in OWC chamber breadth, the resonance peak amplitude increases in the long wave-length regime. Moreover the troughs between two consecutive resonance peaks decreases uniformly, whilst in Figure 16c,d, the change in pattern of trough is observed in the case of intermediate and short wave-length regimes. This happens due to wave resonance, which is increased in the case of a larger chamber breadth.
The radiation susceptance μ (Figure 18), radiation conductance ν (Figure 19), and volume flux due to a scattered potential | q S | / | q I | (Figure 20) versus non-dimensional wave frequency K h 1 are plotted for different numbers of trenches N and different values of the chamber breadths of an OWC D / h 1 with a 1 / h 1 = 0.2 , a 2 / h 1 = 0.1 , b 1 / h 1 = b 2 / h 1 = 0.1 , l / h 1 = 2 , w / h 1 = 0.5 , d / h 1 = 0.5 , L / h 1 = 1 . Figure 18a shows the radiation susceptance μ decreases with an increase in chamber breadth D / h 1 . The phase shift occurs with an increase in K h 1 for a change in different values of D / h 1 . In Figure 18b, the number of resonance peaks in the radiation susceptance increases with an increase in the number of trenches N, which is a similar observation to that of Figure 13. Figure 19 shows that the peak amplitude is greater in the long and intermediate wave-length regimes, while the peak amplitude in efficiency equals zero in the short wave-length regime. In Figure 19b, a common maximum occurs for K h 1 = 2.2 , while a common zero minimum is observed for K h 1 = 1.9 irrespective of the even and odd number of trenches. Figure 20a demonstrates the peak amplitude of volume flux due to a scattered potential | q S | / | q I | increases with an increase in chamber breadth for long wave-length regimes whilst peak amplitude decreases with an increase in chamber breadth in the case of intermediate and short wave-length regimes. Figure 20b shows that the occurrence of resonance peaks increases with an increase in the number of trenches. Moreover, the common minima and maxima occur around K h 1 = 2 , which is a similar observation as that seen in Figure 19b. The occurrence of maximum and minimum values is due to the occurrence of nodes and anti-nodes inside the chamber. Therefore, a comparison between Figure 19 and Figure 20b shows that the common maxima and minima in the radiation conductance of an OWC correspond to the common maxima and minima of the volume flux | q S | / | q I | . The reason for this follows from Equations (23) and (24).

7. Conclusions

In the present study, the influence of submerged bottom standing trenches/breakwaters on the hydrodynamic performance of an OWC is investigated numerically using the BEM, based on the principles of linear potential flow theory. Moreover, fluid is considered as inviscid and incompressible, and the fluid motion is irrotational. The experimental comparison suggests that the results may not necessarily behave the same way in reality, where viscous effects could play a significant role. Various important physical parameters, such as radiation conductance, radiation susceptance, volume flux due to scatter potential, and hydrodynamic efficiency of an OWC are plotted and analyzed for different values of wave length and OWC chamber structural parameters. The following conclusions can be made:
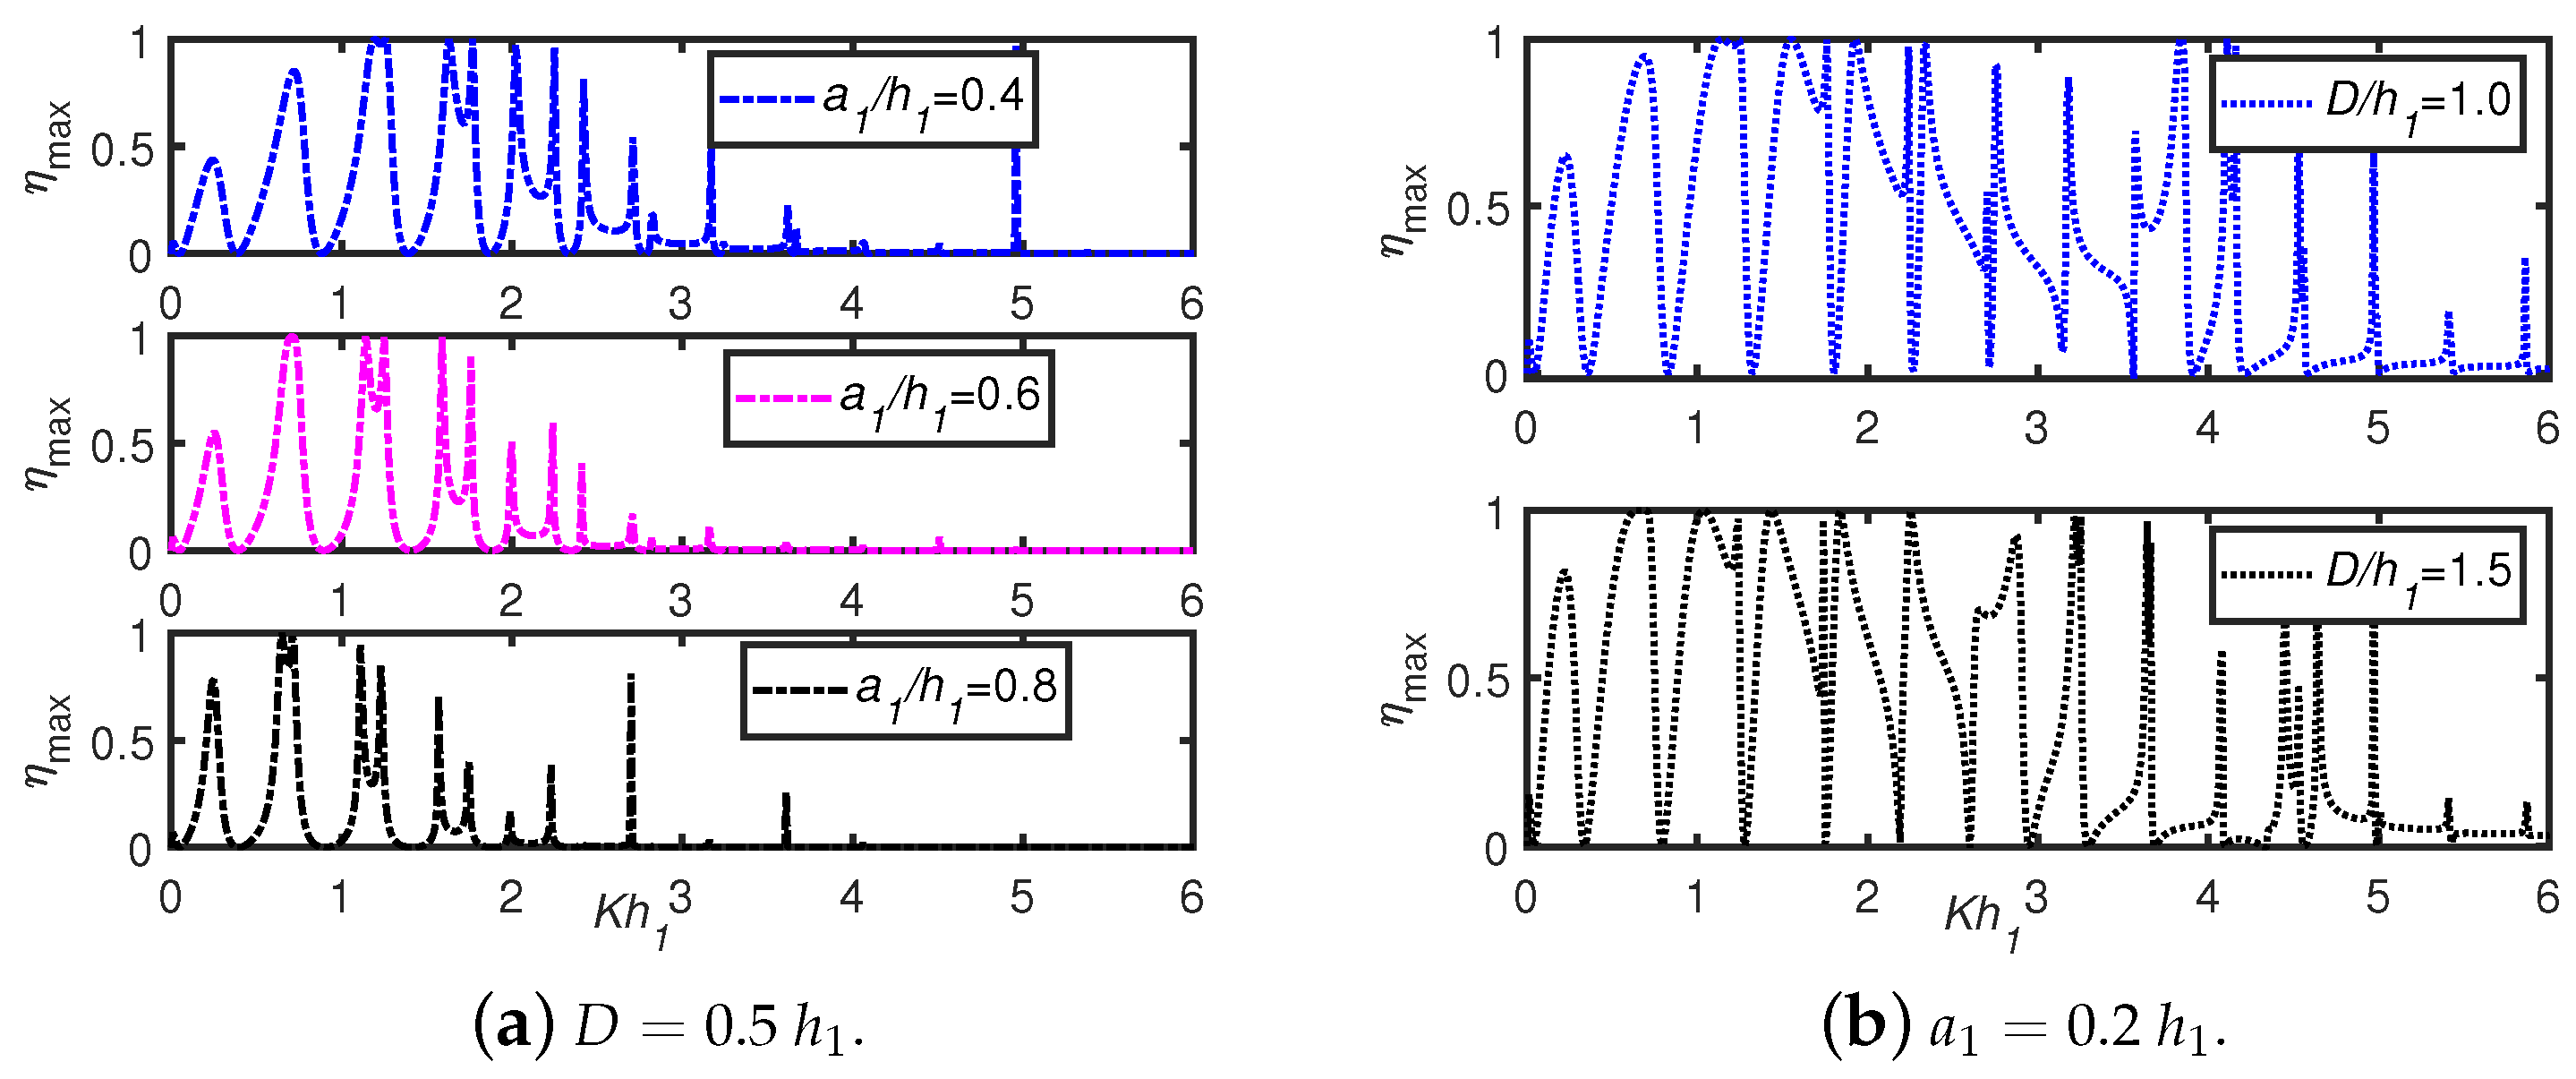
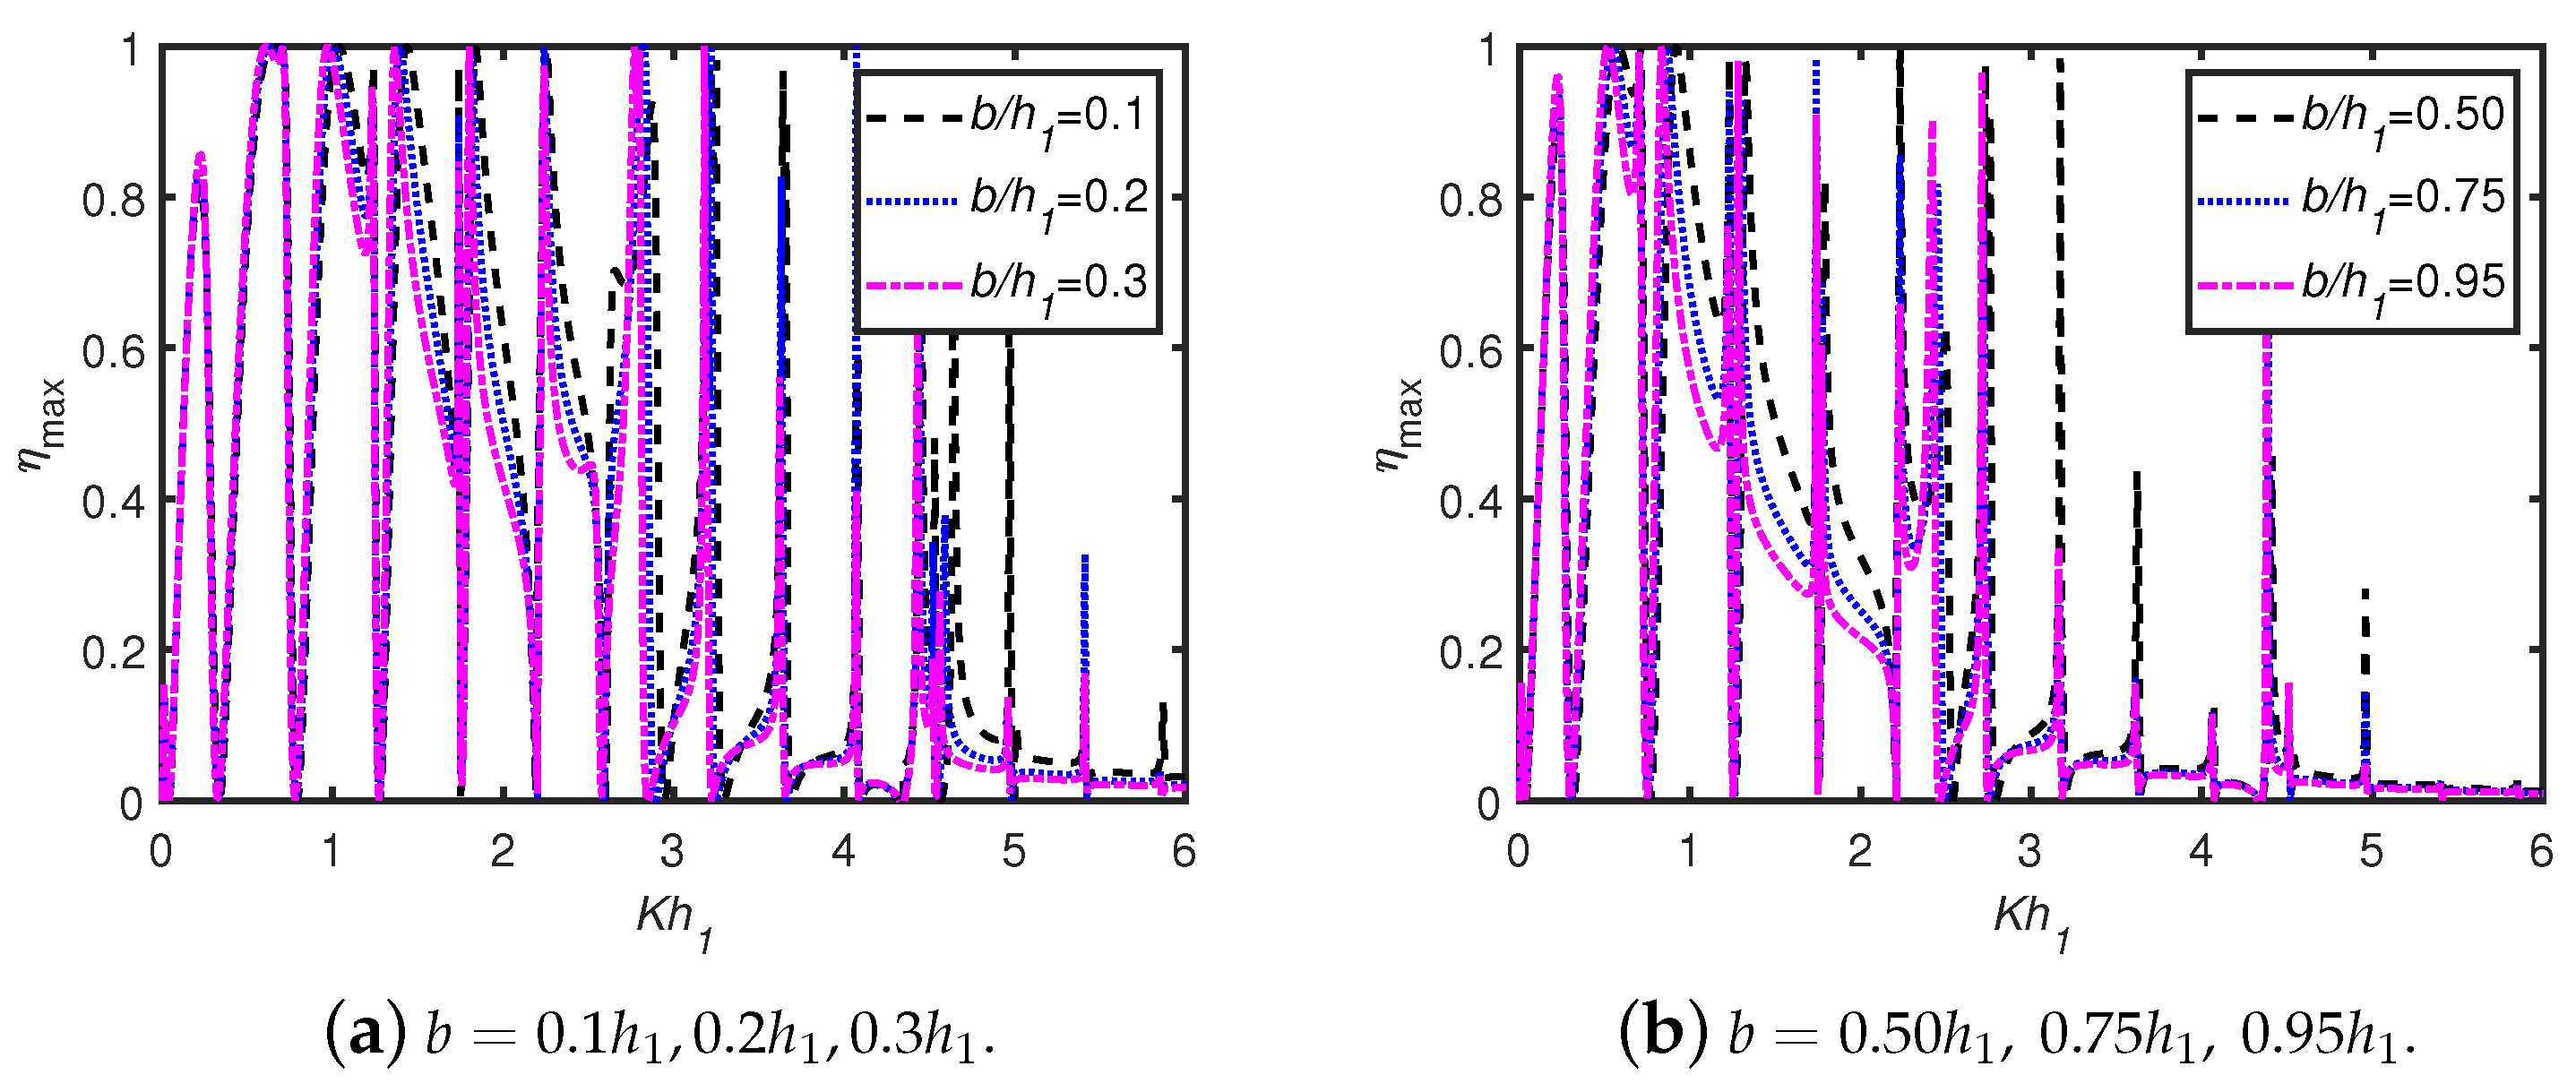
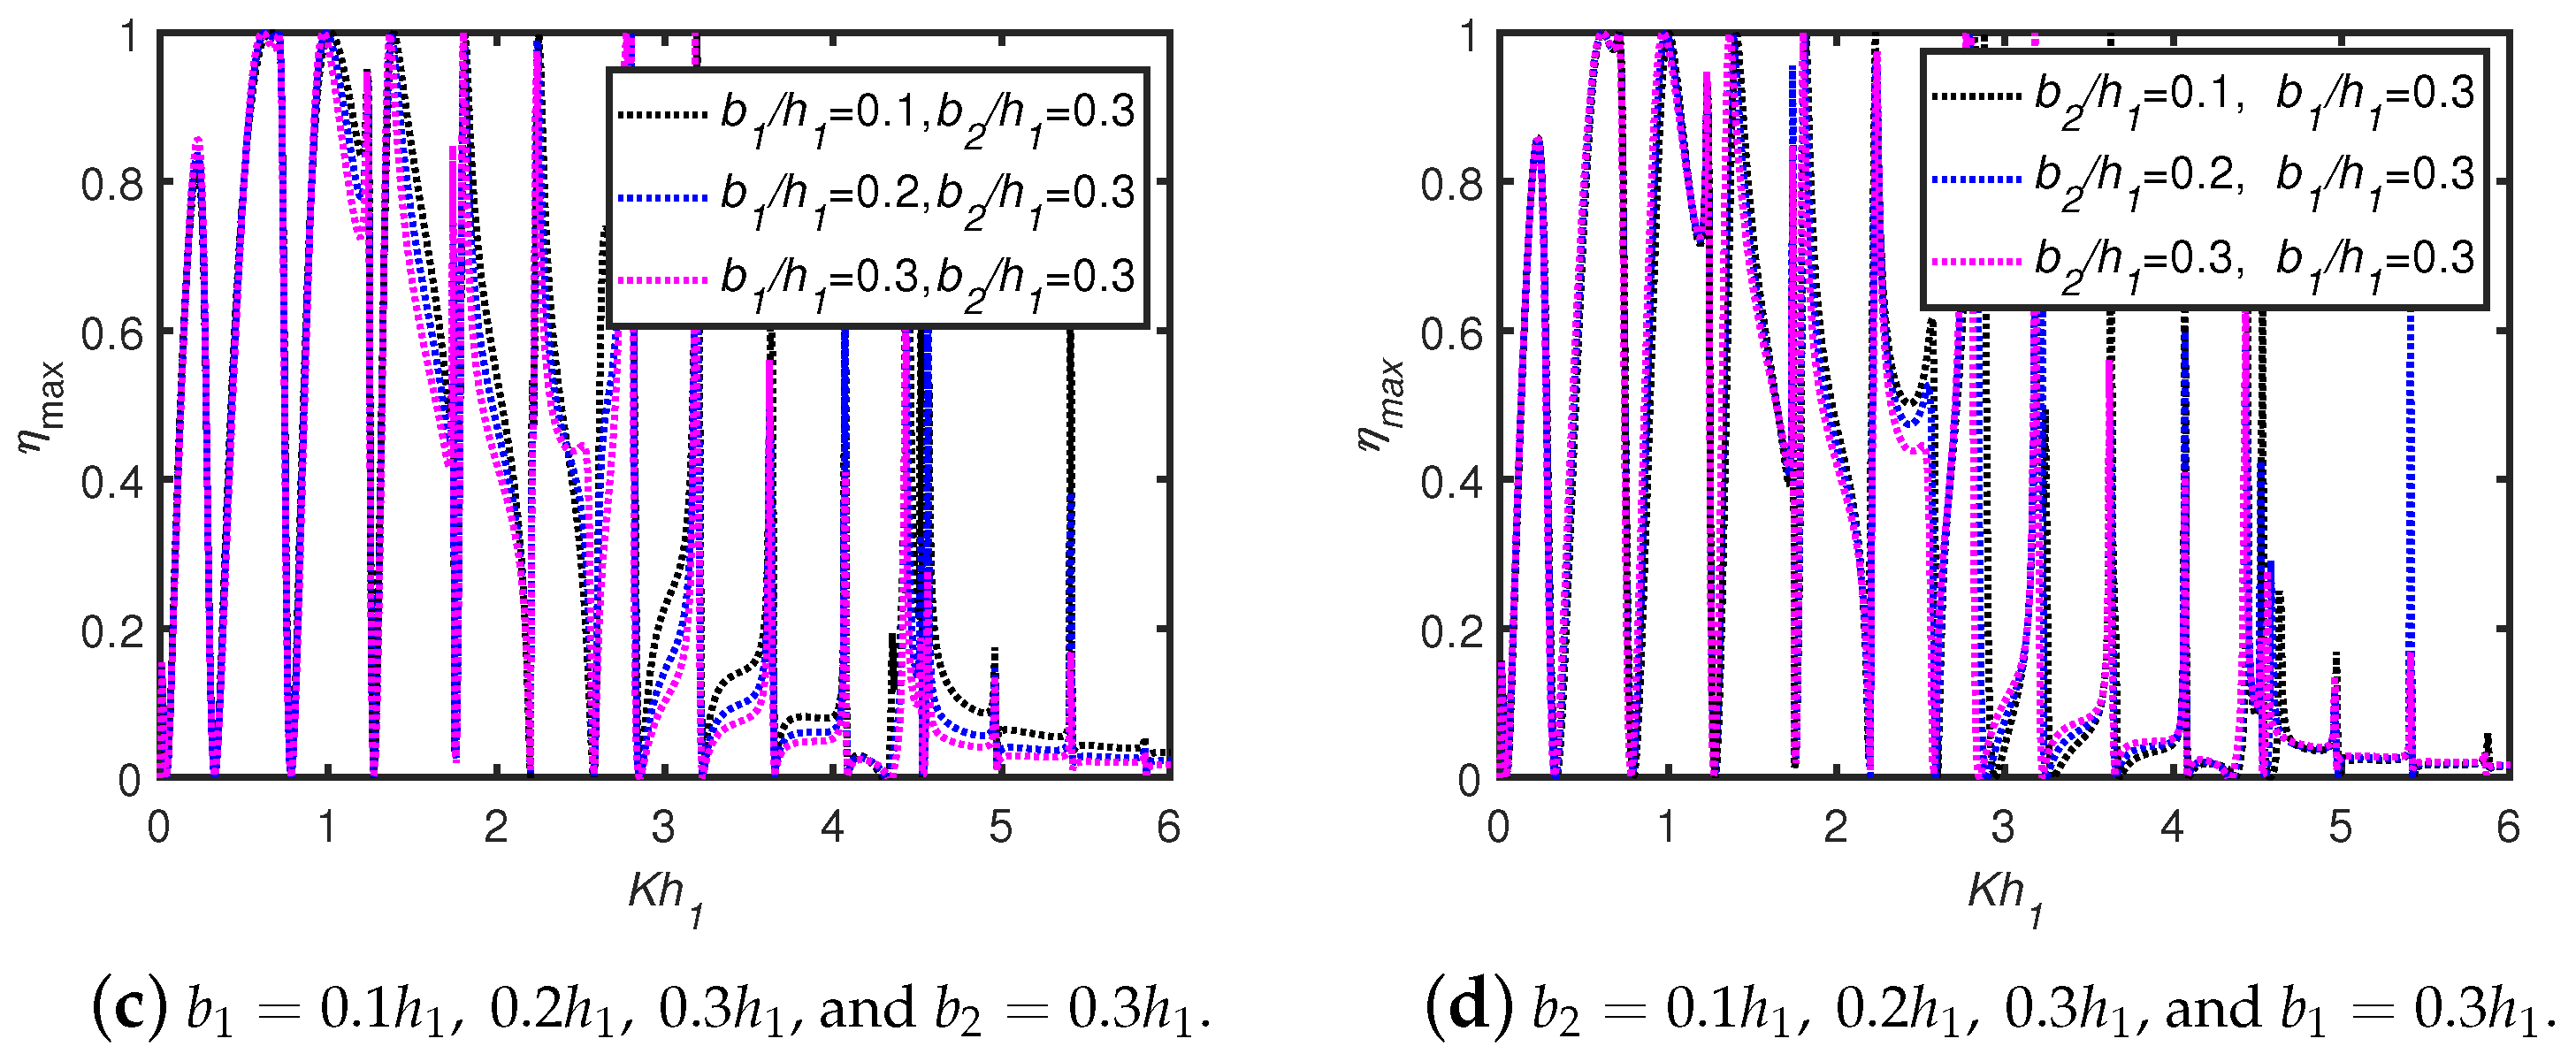
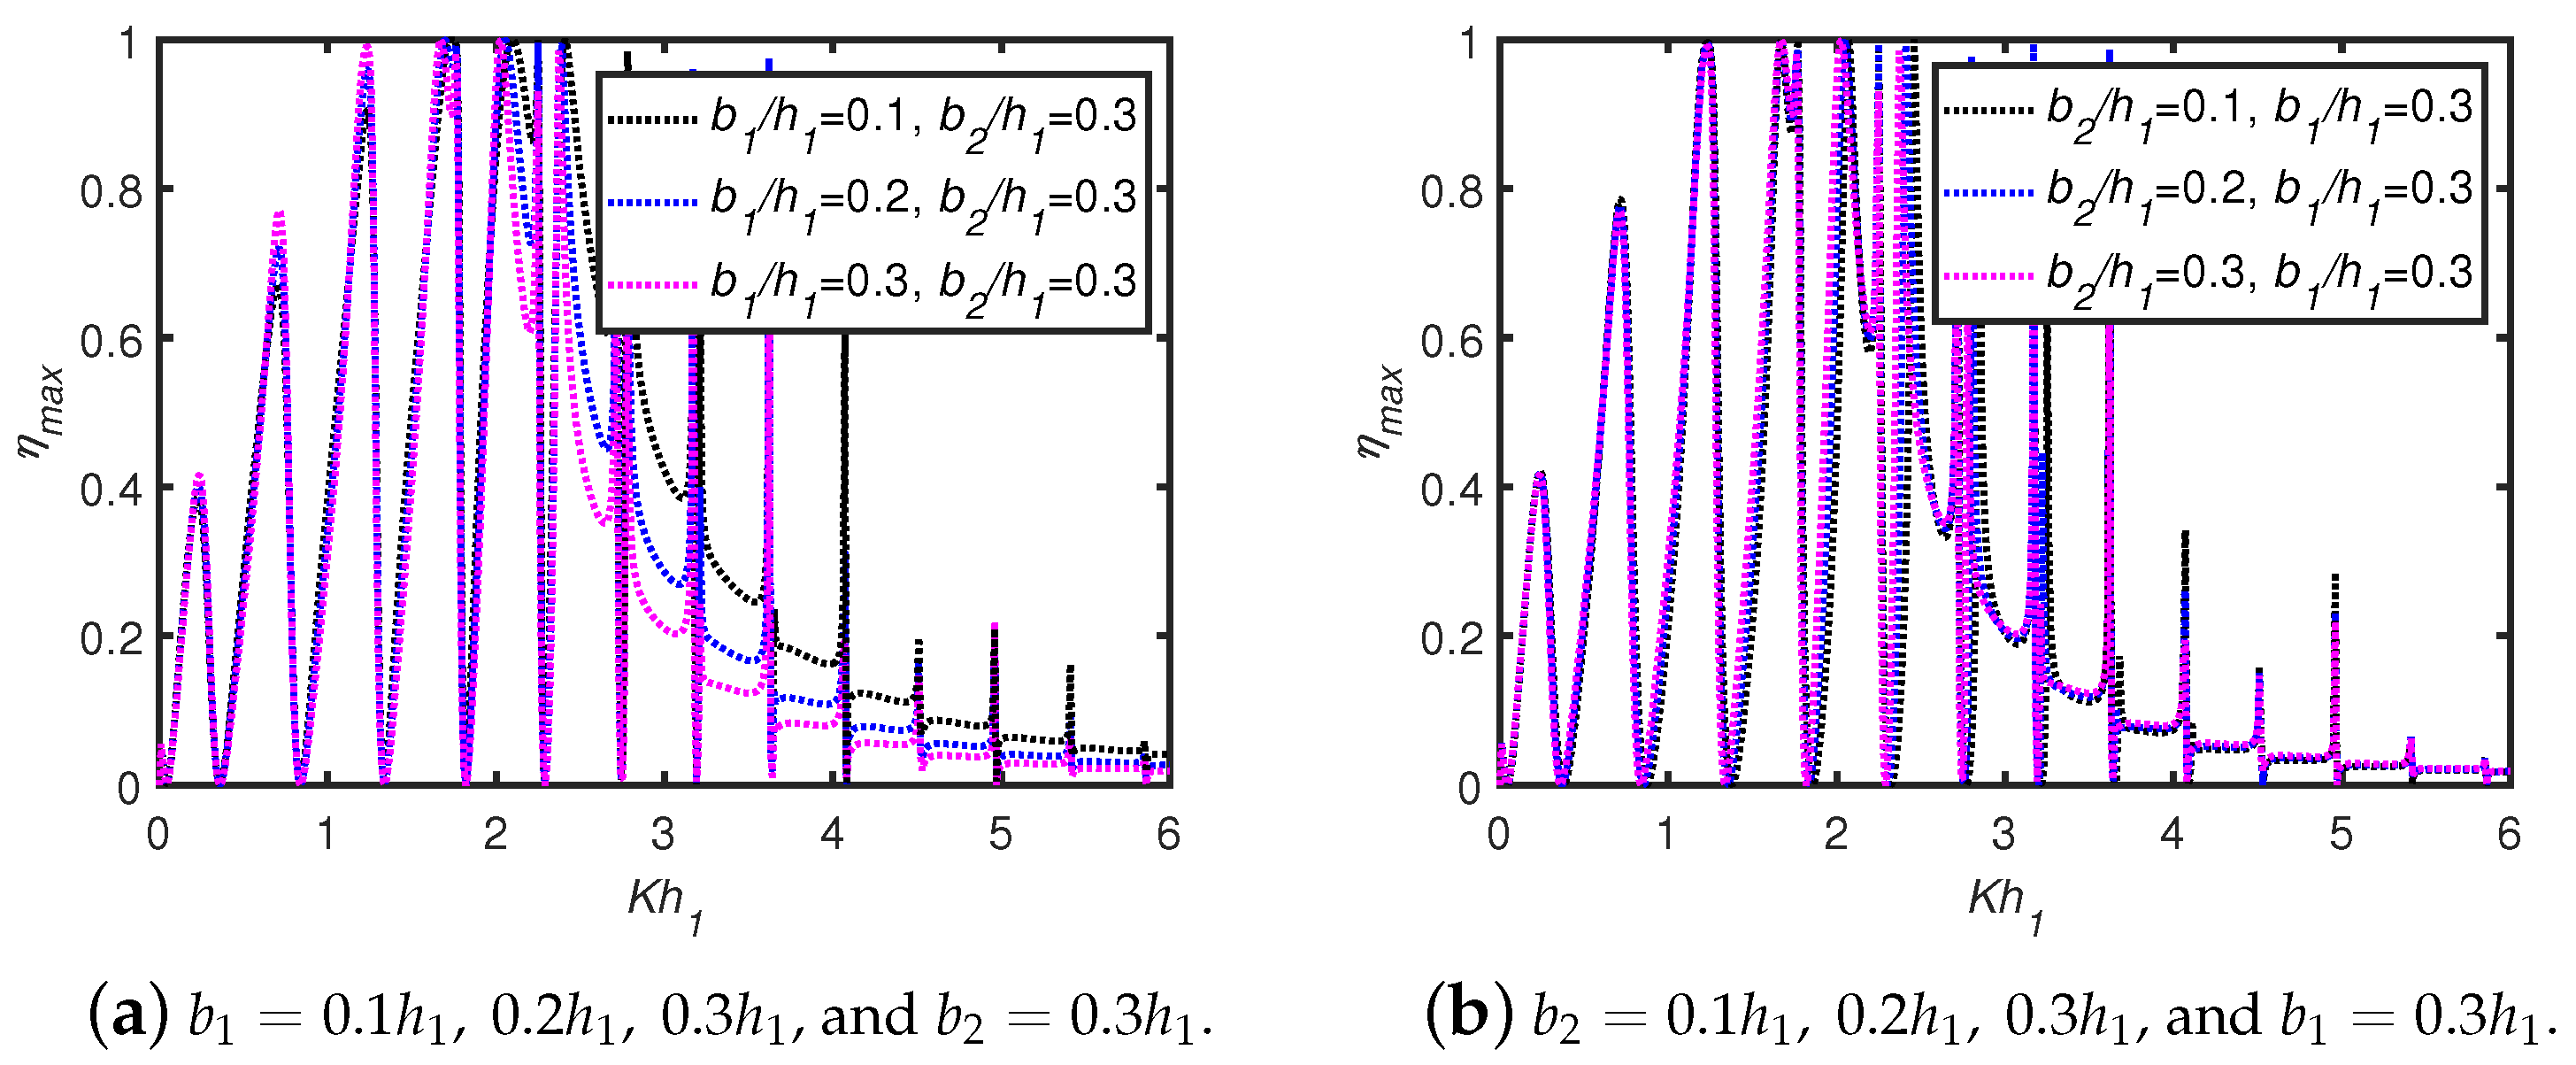
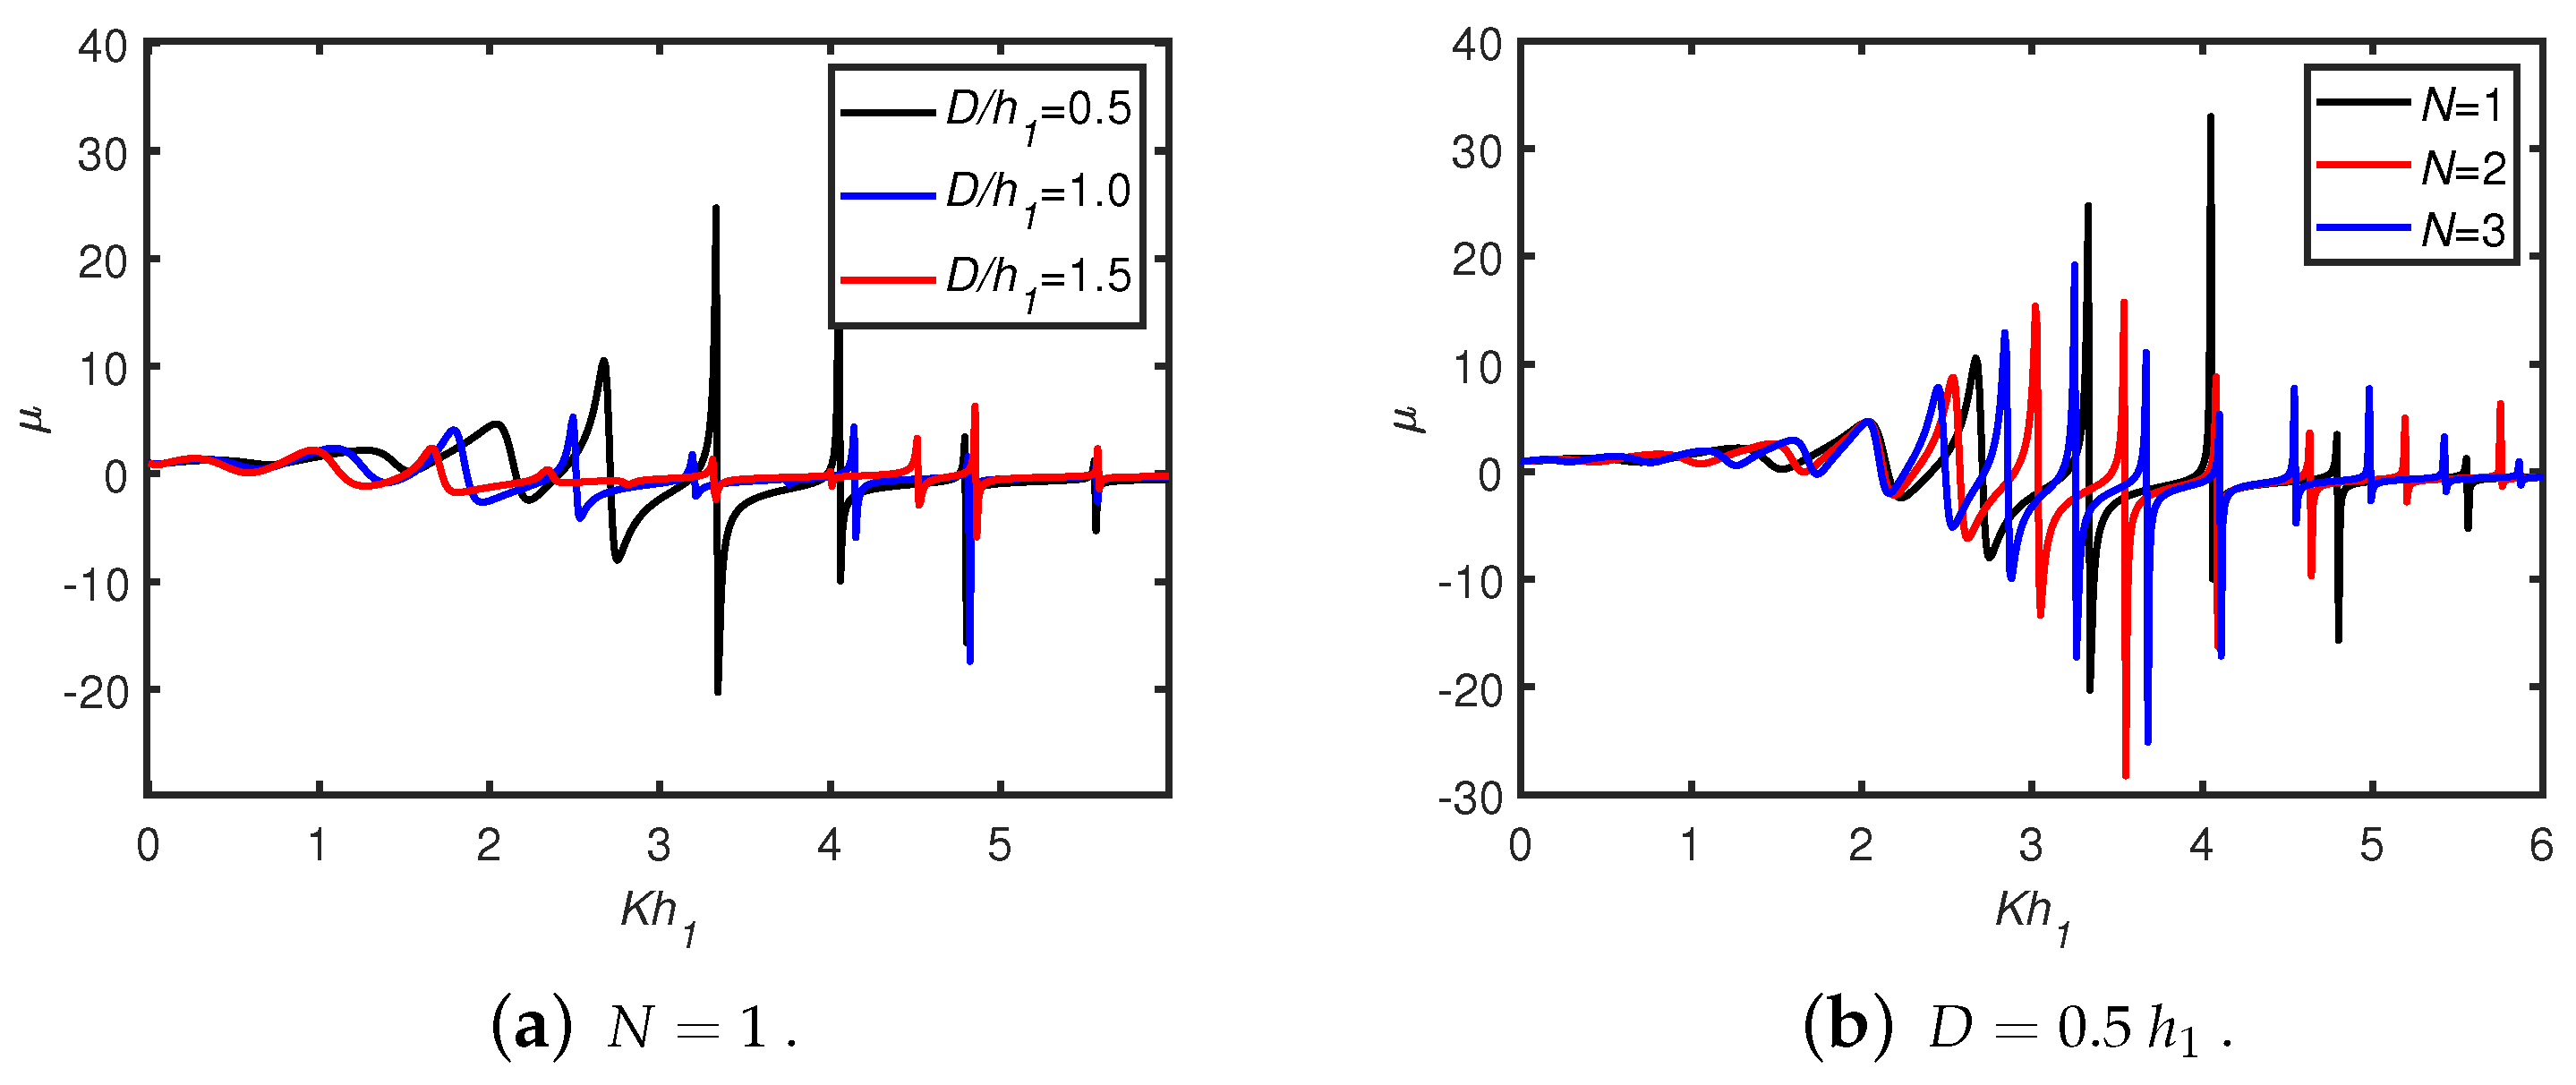
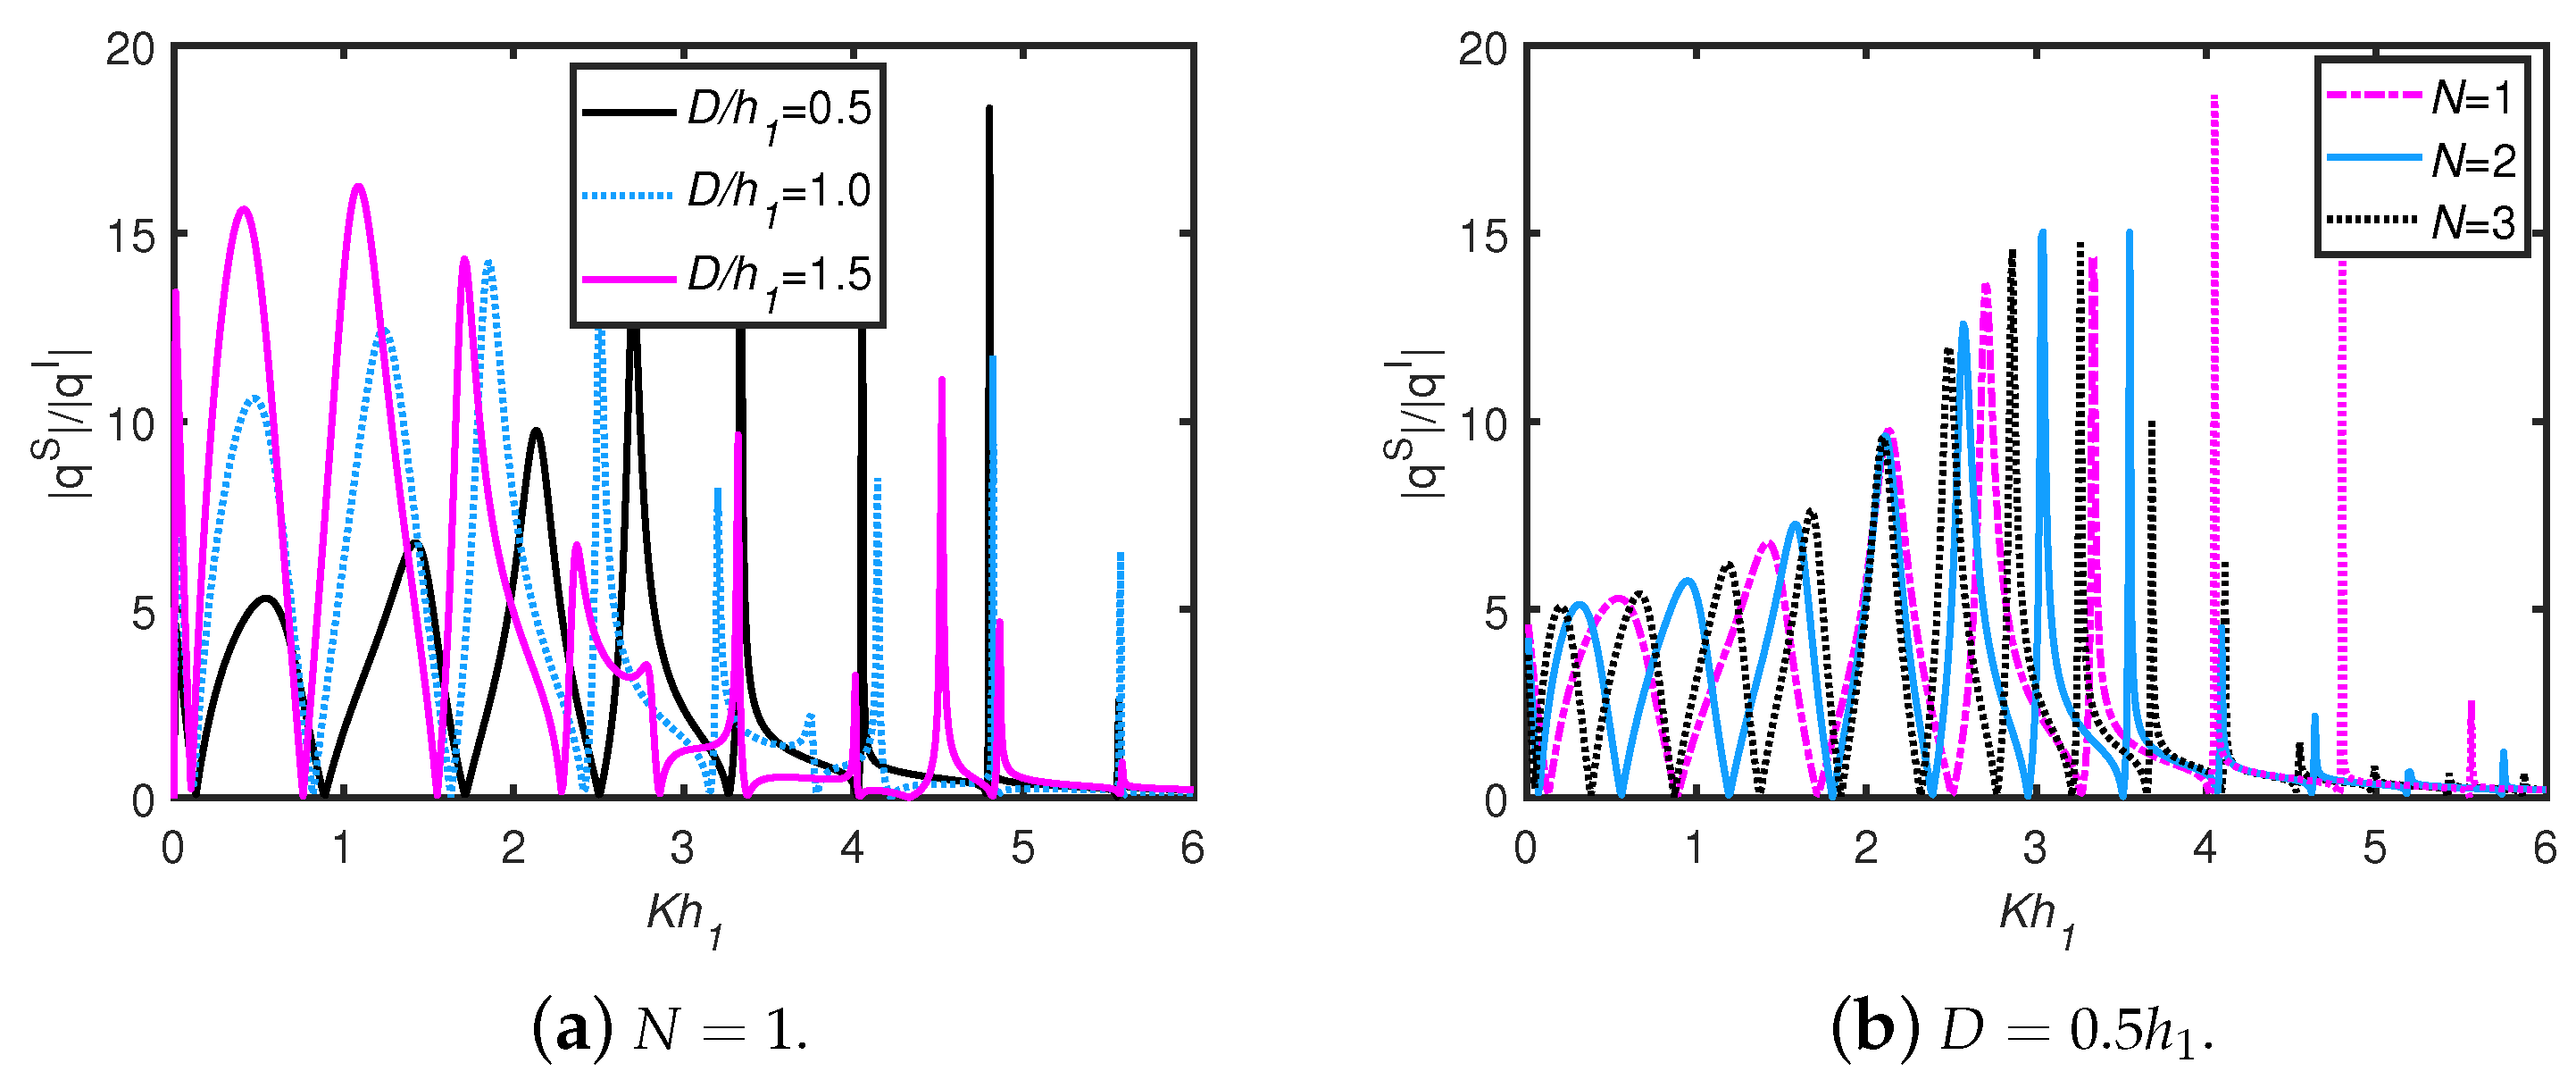
  • The waves scattered from the trenches/breakwaters and the OWC device undergo periodic oscillations resulting in multiple sharp peaks and dips in the efficiency curves. As the number of breakwaters as well as width of breakwaters/trenches increases, the number of resonant efficiency peaks increases, whilst the peak amplitudes decrease in the case of a long wave-length regime.
  • For an OWC device, the wall draft and chamber length are the two critical geometrical factors that improve wave energy absorption.
  • The peak efficiency value for lower-frequency wave conditions is observed in the efficiency curves due to trapped waves between the OWC and the vertical wall. When the width of multiple trenches increases, then the number of peak resonance values in the efficiency curves for lower frequencies increases. The total number of peaks is equal to N + 2 for N number of breakwaters/trenches in the long wave-length regime. In higher-frequency wave conditions, when the gap between the OWC and vertical wall is increased, the occurrence of number of troughs increases.
  • Trenches are effective in increasing the efficiency of an OWC compared to breakwaters. In addition, the efficiency bandwidth is greater in the case of rectangular trenches compared to the trenches of parabolic and triangular shapes.
  • For multiple resonances, two consecutive resonant peaks are separated by a zero minimum for smaller frequencies, particularly K h 1 < 2 . However, for K h 1 > 2 , a trough and a zero minimum point alternately occur between two successive peaks.
The present study is based on linear wave–structure interaction theory without considering non-linear effects, which could be included in future works.

Author Contributions

Validation, P.K.; Software, P.K.; Methodology, P.K., R.M. and D.N.; Writing—Original Draft Preparation, P.K.; Writing—review & editing, P.K., R.M. and D.N.; Investigation, P.K., R.M. and D.N.; Formal Analysis, P.K., R.M. and D.N.; Funding acquisition, R.M. and D.N. All authors have read and agreed to the published version of the manuscript.

Funding

This research received no external funding. P. Kar and D. Ning acknowledge the National Natural Science Foundation of China for their support through Grant No. U22A20242, and R. Mayon thanks the National Natural Science Foundation of China for the support through Grant No. 52250410362.

Data Availability Statement

The data that support the findings of this study are available upon reasonable request.

Conflicts of Interest

The authors declare no conflicts of interest.

References

  1. Xie, J.; Zuo, L. Dynamics and control of ocean Wave Energy Converters. Int. J. Dyn. Control. 2013, 1, 262–276. [Google Scholar] [CrossRef]
  2. Evans, D.V.; Porter, R. Hydrodynamic characteristics of an Oscillating Water Column device. Appl. Ocean Res. 1995, 17, 155–164. [Google Scholar] [CrossRef]
  3. Mustapa, M.A.; Yaakob, O.B.; Ahmed, Y.M.; Rheem, C.K.; Koh, K.K.; Adnan, F.A. Wave energy device and breakwater integration: A review. Renew. Sustain. Energy Rev. 2017, 77, 43–58. [Google Scholar] [CrossRef]
  4. Ning, D.; Boyin, D. Modelling and Optimization of Wave Energy Converters; CRC Press: Boca Raton, FL, USA, 2022. [Google Scholar]
  5. Heath, T.V. A review of Oscillating Water Columns. Philos. Trans. Royal Soc. A 1959, 370, 235–245. [Google Scholar] [CrossRef]
  6. Li, Y.; Sun, L.; Geng, J.; Zhao, X. Semi-analytical investigation on hydrodynamic efficiency and loading of perforated breakwater-integrated OWCs. Ocean Eng. 2024, 309, 118460. [Google Scholar] [CrossRef]
  7. Ding, H.; Zang, J.; Jin, P.; Ning, D.; Zhao, X.; Liu, Y.; Blenkinsopp, C.; Chen, Q. Optimization of the hydrodynamic performance of a Wave Energy Converter in an integrated cylindrical Wave Energy Converter-type breakwater system. J. Offshore Mech. Arct. Eng. 2023, 145, 054501. [Google Scholar] [CrossRef]
  8. Zhao, X.; Li, F.; Zhou, J.; Geng, J.; Zou, Q.; Qin, D. Theoretical investigation of hydrodynamic performance of multi-resonant OWC breakwater array. Appl. Ocean Res. 2023, 141, 103756. [Google Scholar] [CrossRef]
  9. Boccotti, P. Design of breakwater for conversion of wave energy into electrical energy. Ocean Eng. 2012, 51, 106–118. [Google Scholar] [CrossRef]
  10. Altomare, C.; Gironella, X. An experimental study on scale effects in wave reflection of low-reflective quay walls with internal rubble mound for regular and random waves. Coast. Eng. 2014, 90, 51–63. [Google Scholar] [CrossRef]
  11. Zhao, M.; Ning, D. A review of numerical methods for studying hydrodynamic performance of Oscillating Water Column (OWC) devices. Renew. Energy 2024, 11, 121177. [Google Scholar] [CrossRef]
  12. Evans, D.V. The Oscillating Water Column wave-energy device. IMA J. Appl. Math. 1978, 4, 423–433. [Google Scholar] [CrossRef]
  13. Rezanejad, K.; Bhattacharjee, J.; Soares, C.G. Stepped sea bottom effects on the efficiency of nearshore Oscillating Water Column device. Ocean Eng. 2013, 70, 25–38. [Google Scholar] [CrossRef]
  14. Deng, Z.; Ou, Z.; Ren, X.; Zhang, D.; Si, Y. Theoretical Analysis of an Asymmetric Offshore-Stationary Oscillating Water Column Device with Bottom Plate. J. Water. Port Coast. Ocean Eng. 2020, 146, 04020013. [Google Scholar] [CrossRef]
  15. Rezanejad, K.; Soares, C.G.; López, I.; Carballo, R. Experimental and numerical investigation of the hydrodynamic performance of an Oscillating water Column Wave Energy Converter. Renew. Energy 2017, 106, 1–16. [Google Scholar] [CrossRef]
  16. Kar, P.; Koley, S.; Sahoo, T. Scattering of surface gravity waves over a pair of trenches. Appl. Math. Model. 2018, 62, 303–320. [Google Scholar] [CrossRef]
  17. Kar, P.; Sahoo, T.; Behera, H. Effect of Bragg scattering due to bottom undulation on a floating dock. Wave Motion. 2019, 90, 121–138. [Google Scholar] [CrossRef]
  18. Naik, N.; Zheng, S.; Behera, H. Role of dual breakwaters and trenches on efficiency of an Oscillating Water Column. Phys. Fluids 2023, 35, 047115. [Google Scholar] [CrossRef]
  19. Naik, N.; Gayathri, R.; Behera, H.; Tsai, C.C. Wave power extraction by a dual OWC chambers over an undulated bottom. Renew. Energy 2023, 216, 119026. [Google Scholar] [CrossRef]
  20. Naik, N.; Kushwaha, A.K.; Behera, H.; Tsai, C.C. Wave energy extraction by an OWC device in the presence of a porous bottom. Energy Rep. 2024, 11, 5602–5618. [Google Scholar] [CrossRef]
  21. Narendran, K.; Vijay, K.G. Lipwall Effects on a Shore-Front Oscillating Water Column Based on DBEM and Computational Fluid Dynamic Approaches. J. Offshore Mech. Arct. Eng. 2025, 147, 011201. [Google Scholar] [CrossRef]
  22. Rodríguez, A.A.M.; Casarín, R.S.; Ilzarbe, J.M.B. A 3D boundary element method for analysing the hydrodynamic performance of a land-fixed Oscillating Water Column device. Eng. Anal. Bound. Elem. 2022, 10, 407–422. [Google Scholar] [CrossRef]
  23. Zhao, X.; Zhou, J.; Geng, J. Hydrodynamic analysis of an Oscillating Water Column array in presence of variable bathymetry. Phys. Fluids 2024, 36, 097168. [Google Scholar] [CrossRef]
  24. Gao, J.; Ma, X.; Dong, G.; Chen, H.; Liu, Q.; Zang, J. Investigation on the effects of Bragg reflection on harbor oscillations. Coast. Eng. 2021, 170, 103977. [Google Scholar] [CrossRef]
  25. Gao, J.; Shi, H.; Zang, J.; Liu, Y. Mechanism analysis on the mitigation of harbor resonance by periodic undulating topography. Ocean Eng. 2023, 281, 114923. [Google Scholar] [CrossRef]
  26. Gao, J.; Mi, C.; Song, Z.; Liu, Y. Transient gap resonance between two closely-spaced boxes triggered by nonlinear focused wave groups. Ocean Eng. 2024, 305, 117938. [Google Scholar] [CrossRef]
  27. Kar, P.; Mayon, R.; Ning, D. Hydrodynamic Performance of a Trapezoidal-Shaped Oscillating Water Column Wave Energy Device. In ISOPE Pacific/Asia Offshore Mechanics Symposium; ISOPE: Mountain View, CA, USA, 2024. [Google Scholar]
  28. Rodríguez, A.A.M.; Silva Casarín, R.; Blanco Ilzarbe, J.M. A theoretical study of the hydrodynamic performance of an asymmetric fixed-detached OWC device. Water 2021, 13, 2637. [Google Scholar] [CrossRef]
  29. Rodríguez, A.A.M.; Flores, A.M.; Ilzarbe, J.M.B.; Casarín, R.S. Interaction of oblique waves with an Oscillating Water Column device. Ocean Eng. 2021, 228, 108931. [Google Scholar] [CrossRef]
  30. Xie, J.-J.; Liu, H.-W. An exact analytic solution to the modified mild-slope equation for waves propagating over a trench with various shapes. Ocean Eng. 2012, 50, 72–82. [Google Scholar] [CrossRef]
  31. Kar, P.; Koley, S.; Sahoo, T. Bragg scattering of long waves by an array of trenches. Ocean Eng. 2020, 198, 107004. [Google Scholar] [CrossRef]
  32. Koley, S.; Trivedi, K. Mathematical modeling of Oscillating Water Column Wave Energy Converter devices over the undulated sea bed. Eng. Anal. Bound. Elem. 2020, 117, 26–40. [Google Scholar] [CrossRef]
  33. Thomas, M.T.; Irvin, R.J.; Thiagarajan, K.P. An Investigation into the Hydrodynamic Efficiency of an Oscillating Water Column. J. Offshore Mech. Arct. Eng. 2007, 129, 273–278. [Google Scholar] [CrossRef]
Figure 1. Schematic of a fixed-detached OWC and undulating bottom of (a) breakwater and (b) trench types with shape parameter m 0 where m 0 = 1 , 2 correspond to the triangular and parabolic shapes, respectively, whilst m 0 = corresponds to the rectangular shape. The bottom profile is similar to that considered in Kar et al. [16] and Xie et al. [30].
Jmse 13 01115 g001
Figure 2. BEM computational domain.
Jmse 13 01115 g002
Figure 3. The variation in (a) radiation susceptance μ , (b) radiation conductance ν , (c) the magnitude of the induced volume flux due to the scattering potential | q S | / | q I | , and (d) hydrodynamic efficiency of an OWC η m a x versus K h 1 in the case of a flat sea bed. Evans & Porter [2].
Jmse 13 01115 g003aJmse 13 01115 g003b
Figure 4. The variation in hydrodynamic efficiency η m a x versus K h 1 for a shore-fixed OWC (a) in the presence of a flat bottom, and (b) over a stepped bottom bed with a thick OWC front wall. Rezanejad et al. [13] and Thomas et al. [33].
Jmse 13 01115 g004
Figure 5. The variation in hydrodynamic efficiency η m a x versus K h 1 for a fixed-detached OWC in the presence of a parabolic bottom (a) with a vertical reflecting wall and (b) without a vertical reflecting wall. Rodriguez et al. [28].
Jmse 13 01115 g005
Figure 6. The influence of water depth h 2 / h 1 on (a) radiation susceptance μ , and (b) radiation conductance ν in the case of a single parabolic breakwater/trench. Rodriguez et al. [29].
Jmse 13 01115 g006
Figure 7. Hydrodynamic efficiency η m a x versus K h 1 for different shapes of a breakwater/trench in the case of (a,b) unequal and (c,d) equal front wall drafts of an OWC.
Jmse 13 01115 g007
Figure 8. Hydrodynamic efficiency η m a x versus K h 1 for different (a) submerged depths of front and rear walls, (b) submerged depths of front wall, and (c) submerged depths of rear wall in the case of a single triangular trench.
Jmse 13 01115 g008
Figure 9. Hydrodynamic efficiency η m a x versus K h 1 for different (a) thicknesses of front and rear walls, (b) thicknesses of rear wall, and (c) thicknesses of front wall in the case of a single triangular trench.
Jmse 13 01115 g009
Figure 10. Hydrodynamic efficiency η m a x versus K h 1 for different chamber lengths of an OWC in the case of (a,b) unequal front walls drafts, and (c) equal draft front wall in the case of a single triangular trench.
Jmse 13 01115 g010
Figure 11. Hydrodynamic efficiency η m a x versus K h 1 for different values of (a) trench width, and (b) gap length between a single trench and an OWC.
Jmse 13 01115 g011
Figure 12. Hydrodynamic efficiency η m a x versus K h 1 for different values of (a) distance from top of the breakwater to the mean free surface h 2 / h 1 , and (b) width w / h 1 with h 1 = 4 m.
Jmse 13 01115 g012
Figure 13. Hydrodynamic efficiency η m a x versus K h 1 for the case of (a) double ( N = 2 ) and (b) triple ( N = 3 ) breakwaters/trenches in combination.
Jmse 13 01115 g013
Figure 14. Hydrodynamic efficiency η m a x versus K h 1 for different values of trench width: (a) w / h 1 = 1.5 and (b) w / h 1 = 2.5 .
Jmse 13 01115 g014
Figure 15. Hydrodynamic efficiency η m a x versus K h 1 for different values of (a) front wall draft, (b) a chamber breadth.
Jmse 13 01115 g015
Figure 16. Hydrodynamic efficiency η m a x versus K h 1 in the case of different values of (a,b) equal OWC wall thickness and (c,d) unequal OWC wall thickness with OWC chamber breadth D = 1.5 h 1 .
Jmse 13 01115 g016aJmse 13 01115 g016b
Figure 17. Hydrodynamic efficiency η m a x versus K h 1 in the case of different values of (a,b) unequal OWC wall thickness in the case of triple triangular trenches with OWC chamber breadth D = 0.5 h 1 .
Jmse 13 01115 g017
Figure 18. Radiation susceptance of an OWC against K h 1 for different values of (a) chamber breadth, and (b) the number of trenches.
Jmse 13 01115 g018
Figure 19. Radiation conductance of an OWC against K h 1 for different values of (a) chamber breadth, and (b) the number of trenches.
Jmse 13 01115 g019
Figure 20. The volume flux due to a scattered potential | q S | / | q I | against K h 1 for different values of (a) chamber breadth, and (b) the number of trenches.
Jmse 13 01115 g020
Table 1. The values of μ , ν , η m a x for different distances (dist.) at which the left far-field boundary is truncated in the case of a single rectangular breakwater with a 1 / h 1 = 3 / 4 , a 2 / h 1 = 1 / 2 , b 1 / h 1 = b 2 / h 1 = 1 / 8 , D / h 1 = 1 / 2 , L / h 1 = 1 / 2 , l / h 1 = 1 / 2 , w / h 1 = 1 / 2 .
K h 1 = 0.5 K h 1 = 1.5 K h 1 = 2.5
Dist. μ ν η m a x μ ν η m a x μ ν η m a x
2 h 1 1.72390.03800.0432−1.20600.07770.1208−0.36490.00400.0219
3 h 1 1.72390.03800.0432−1.20600.07770.1208−0.36490.00400.0218
4 h 1 1.72390.03800.0432−1.20600.07770.1208−0.36490.00400.0218
5 h 1 1.72390.03800.0432−1.20600.07770.1208−0.36490.00400.0218
Table 2. The values of μ , ν , η m a x for different values of p s for a single triangular trench with a 1 / h 1 = a 2 / h 1 = 1 / 2 , b 1 / h 1 = b 2 / h 1 = 1 / 8 , D / h 1 = 1 , l / h 1 = 2 , w / h 1 = 1 , L / h 1 = 1 .
K h 1 = 0.5 K h 1 = 1.5 K h 1 = 2.5
p s μ ν η m a x μ ν η m a x μ ν η m a x
0.1 0.77841.81160.95760.63270.04960.1451−0.43440.01410.0631
0.05 0.77491.85400.95970.63680.05030.1462−0.47280.01420.0585
0.01 0.77481.85440.95840.63470.05110.1487−0.47360.01430.0555
Table 3. The values of μ , ν , η m a x for different values of p s for a single parabolic trench with a 1 / h 1 = a 2 / h 1 = 1 / 2 , b 1 / h 1 = b 2 / h 1 = 1 / 8 , D / h 1 = 1 , l / h 1 = 2 , w / h 1 = 1 , L / h 1 = 1 .
K h 1 = 0.5 K h 1 = 1.5 K h 1 = 2.5
p s μ ν η m a x μ ν η m a x μ ν η m a x
0.1 0.80251.82420.95570.55810.05430.1766−0.43440.01410.0630
0.05 0.80011.86720.95780.55740.05530.1797−0.47290.01420.0585
0.01 0.80371.86600.95950.55230.05620.1781−0.47360.01430.0555
Table 4. The values of μ , ν , η m a x for different values of p s for a single rectangular trench with a 1 / h 1 = a 2 / h 1 = 1 / 2 , b 1 / h 1 = b 2 / h 1 = 1 / 8 , D / h 1 = 1 , l / h 1 = 2 , w / h 1 = 1 , L / h 1 = 1 .
K h 1 = 0.5 K h 1 = 1.5 K h 1 = 2.5
p s μ ν η m a x μ ν η m a x μ ν η m a x
0.1 0.82871.83700.95370.48230.05920.2174−0.43450.01410.0630
0.05 0.82701.88020.95580.47890.06040.2224−0.47290.01420.0585
0.01 0.82511.88530.95640.47200.06150.2288−0.47370.01430.0555
Table 5. Numerical data employed for computation in the case of a single trench/breakwater.
ParametersValuesParametersValues
h 1  water depth4m D / h 1  OWC chamber length1/2
a 1 / h 1  OWC front wall draft3/4 w / h 1  trench/breakwater width1/2
a 2 / h 1  OWC rear wall draft1/2 l / h 1   gap distance between trench and OWC1/2
b 1 / h 1  OWC front wall thickness1/8 L / h 1   gap distance between trench and vertical wall1/2
b 2 / h 1  OWC rear wall thickness1/8
Table 6. Numerical data employed for computation in the case of multiple trenches/breakwaters.
ParametersValuesParametersValues
h 1  water depth4 m D / h 1  OWC chamber length1/2
a 1 / h 1  OWC front wall draft2/10 w / h 1  trench/breakwater width1
a 2 / h 1  OWC rear wall draft1/10 l / h 1   gap distance between trench and OWC2
b 1 / h 1  OWC front wall thickness1/10 L / h 1   gap distance between trench and vertical wall1
b 2 / h 1  OWC rear wall thickness1/10 d / h 1   gap distance between two consecutive trenches/breakwaters1/2
Disclaimer/Publisher’s Note: The statements, opinions and data contained in all publications are solely those of the individual author(s) and contributor(s) and not of MDPI and/or the editor(s). MDPI and/or the editor(s) disclaim responsibility for any injury to people or property resulting from any ideas, methods, instructions or products referred to in the content.

