Article

Scour Depth Around Cylinders Under Combined Effects of River Flow and Tidal Currents

1
Ocean College, Zhejiang University, Zhoushan 316021, China
2
Key Laboratory of Offshore Geotechnical and Material Engineering of Zhejiang Province, Hangzhou 310058, China
*
Author to whom correspondence should be addressed.
J. Mar. Sci. Eng. 2025, 13(6), 1114; https://doi.org/10.3390/jmse13061114
Submission received: 22 April 2025 / Revised: 28 May 2025 / Accepted: 29 May 2025 / Published: 2 June 2025
(This article belongs to the Section Coastal Engineering)

Abstract

:
The safety of coastal structures is a growing global concern due to the combined effects of strong tides and river flow. In this study, the local scour around cylinders under the influence of tides combined with river flows was investigated numerically. When only tidal current is considered, the distribution of vorticity and excess shear stress on the bed varies periodically with the inflow velocity. The scour depth gradually increased. When coupling the river flow and tidal current, the scour depth on the river side is 1.3 times deeper than that on the tide side; the relative scour depth (the ratio of scour depth to pile diameter, S/D) deepened linearly with the increase of river flow intensity. In the river–tide-coupled condition, the impact of river flow on scour is greater under fixed-bed conditions than under movable-bed conditions. Under fixed-bed conditions, the maximum scour depth in the river–tide-coupled case is 3.94 times larger than that in the tide case. The relative scour depth gradually decreased with the increase in the relative diameter of the cylinder. The scour hole becomes more asymmetric with the increased cylinder diameter. The scour process became slower and the scour rate was smaller when tidal periods increased. The findings supplement the mechanism of local scour under river–tide coupling and provide guiding significance for pile foundation protection in an estuary.

1. Introductions

Much attention has been paid to the characteristics and mechanisms of local scour around coastal structures. For example, research has been conducted on the local scour characteristics of unidirectional flow (e.g., Melville and Chiew, 1999 [1]; Sheppard et al., 2004 [2]; Link et al., 2017 [3]; Guan et al., 2019 [4]; Wang et al., 2020 [5]; Wang et al., 2022 [6]), tidal current (e.g., Han and Chen, 2004 [7]; Schendel et al., 2018 [8]; Yang et al., 2021 [9]), and wave–current coupling (e.g., Sumer et al., 1992 [10]; Sumer et al., 2001 [11]; Stahlmann, 2013 [12]; Guan et al., 2024 [13]) on scour around cylinders. For the mechanism of tidal current scour, some scholars believe that the scour process of tidal currents is similar to unidirectional flow. When the peak flow velocity of a tidal current is equal to the unidirectional flow velocity, the maximum scour depth around the structure under the action of the two is the same (Richardson et al., 2012 [14]; Peng et al., 2012 [15]). Meanwhile, some scholars believe that the reverse flow of the tidal current brings sediment backfill to the scour hole so that the maximum scour depth of the scour hole is smaller than that under the action of unidirectional flow (Nakagqwa and Suzuki, 1976 [16]; Li, 2012 [17]). Tidal current scour is difficult to reach equilibrium under fixed-bed conditions, and the scour process is asymmetric due to tidal asymmetry (Porter et al., 2014 [18]). The scour process of a reciprocating tidal current is obviously slower than that of unidirectional flow (Yao et al., 2016 [19]). The evolution process of the scour depth is significantly different between the sine and square tidal currents, and an empirical formula for simplifying the equivalent velocity expression and the scour depth reduction coefficient of the tidal current hydrograph is put out (Wang et al., 2024 [20]).
Different methods have been developed to well predict the maximum scour depth. For example, Jones et al. (2000) [21] proposed the maximum scour depth prediction formula (J&S formula) for the scour of pile foundations under the action of tidal currents, which is mainly applicable to the scour of bed sand with fine particles and a small diameter. Han (2006) [22] conducted an experimental study on the scour depth of several cross-sea bridges in Hangzhou Bay, and the results show that the maximum scour depth of current scour is 89%~95% of unidirectional current scour. Through dimensional analysis and using a multiple regression method, Han (2006) [22] also established a formula for the local scour of bridge piers under the action of reciprocating flow. Lu et al. (2011) [23] believe that the maximum scour depth around a pier under the action of tidal currents is about 75%~88% of that under the action of unidirectional flow, as the reverse flow brings sediment back to the scour hole and backfill occurs.
Researchers also examine the scour of different structures due to tidal currents. For example, Keshtpoor et al. (2015) [24] numerically investigated the influence of cofferdams on turbulent kinetic energy and sediment transport in tidal estuaries. Xu et al. (2017) [25] numerically examined the influence of the submarine pipeline on muddy seabed scour due to currents. The scour hole around the submarine pipeline due to tidal currents is symmetrical, and the position of the maximum scour depth fluctuates with the direction and magnitude of the incoming flow velocity. Ma (2018) [26] compared the differences of scour in pile groups between unidirectional flow and reciprocating tidal currents.
At present, there are some studies on the flow field characteristics, scour characteristics, and scour formulas of reciprocating flow, but the research on the mechanism is not detailed enough, and the scour formulas (e.g., Han formula) still need to be modified. This study aims to investigate the characteristics and mechanism of scour near cylinders under the coupling effects of river flow and tidal currents using numerical modeling. Secondly, the characteristics of scour are illustrated and analyzed using the model results. Thirdly, the influence of river flow strengths, peak tidal currents, cylinder diameters, and tidal periods on scour characteristics are investigated.

2. Methodology

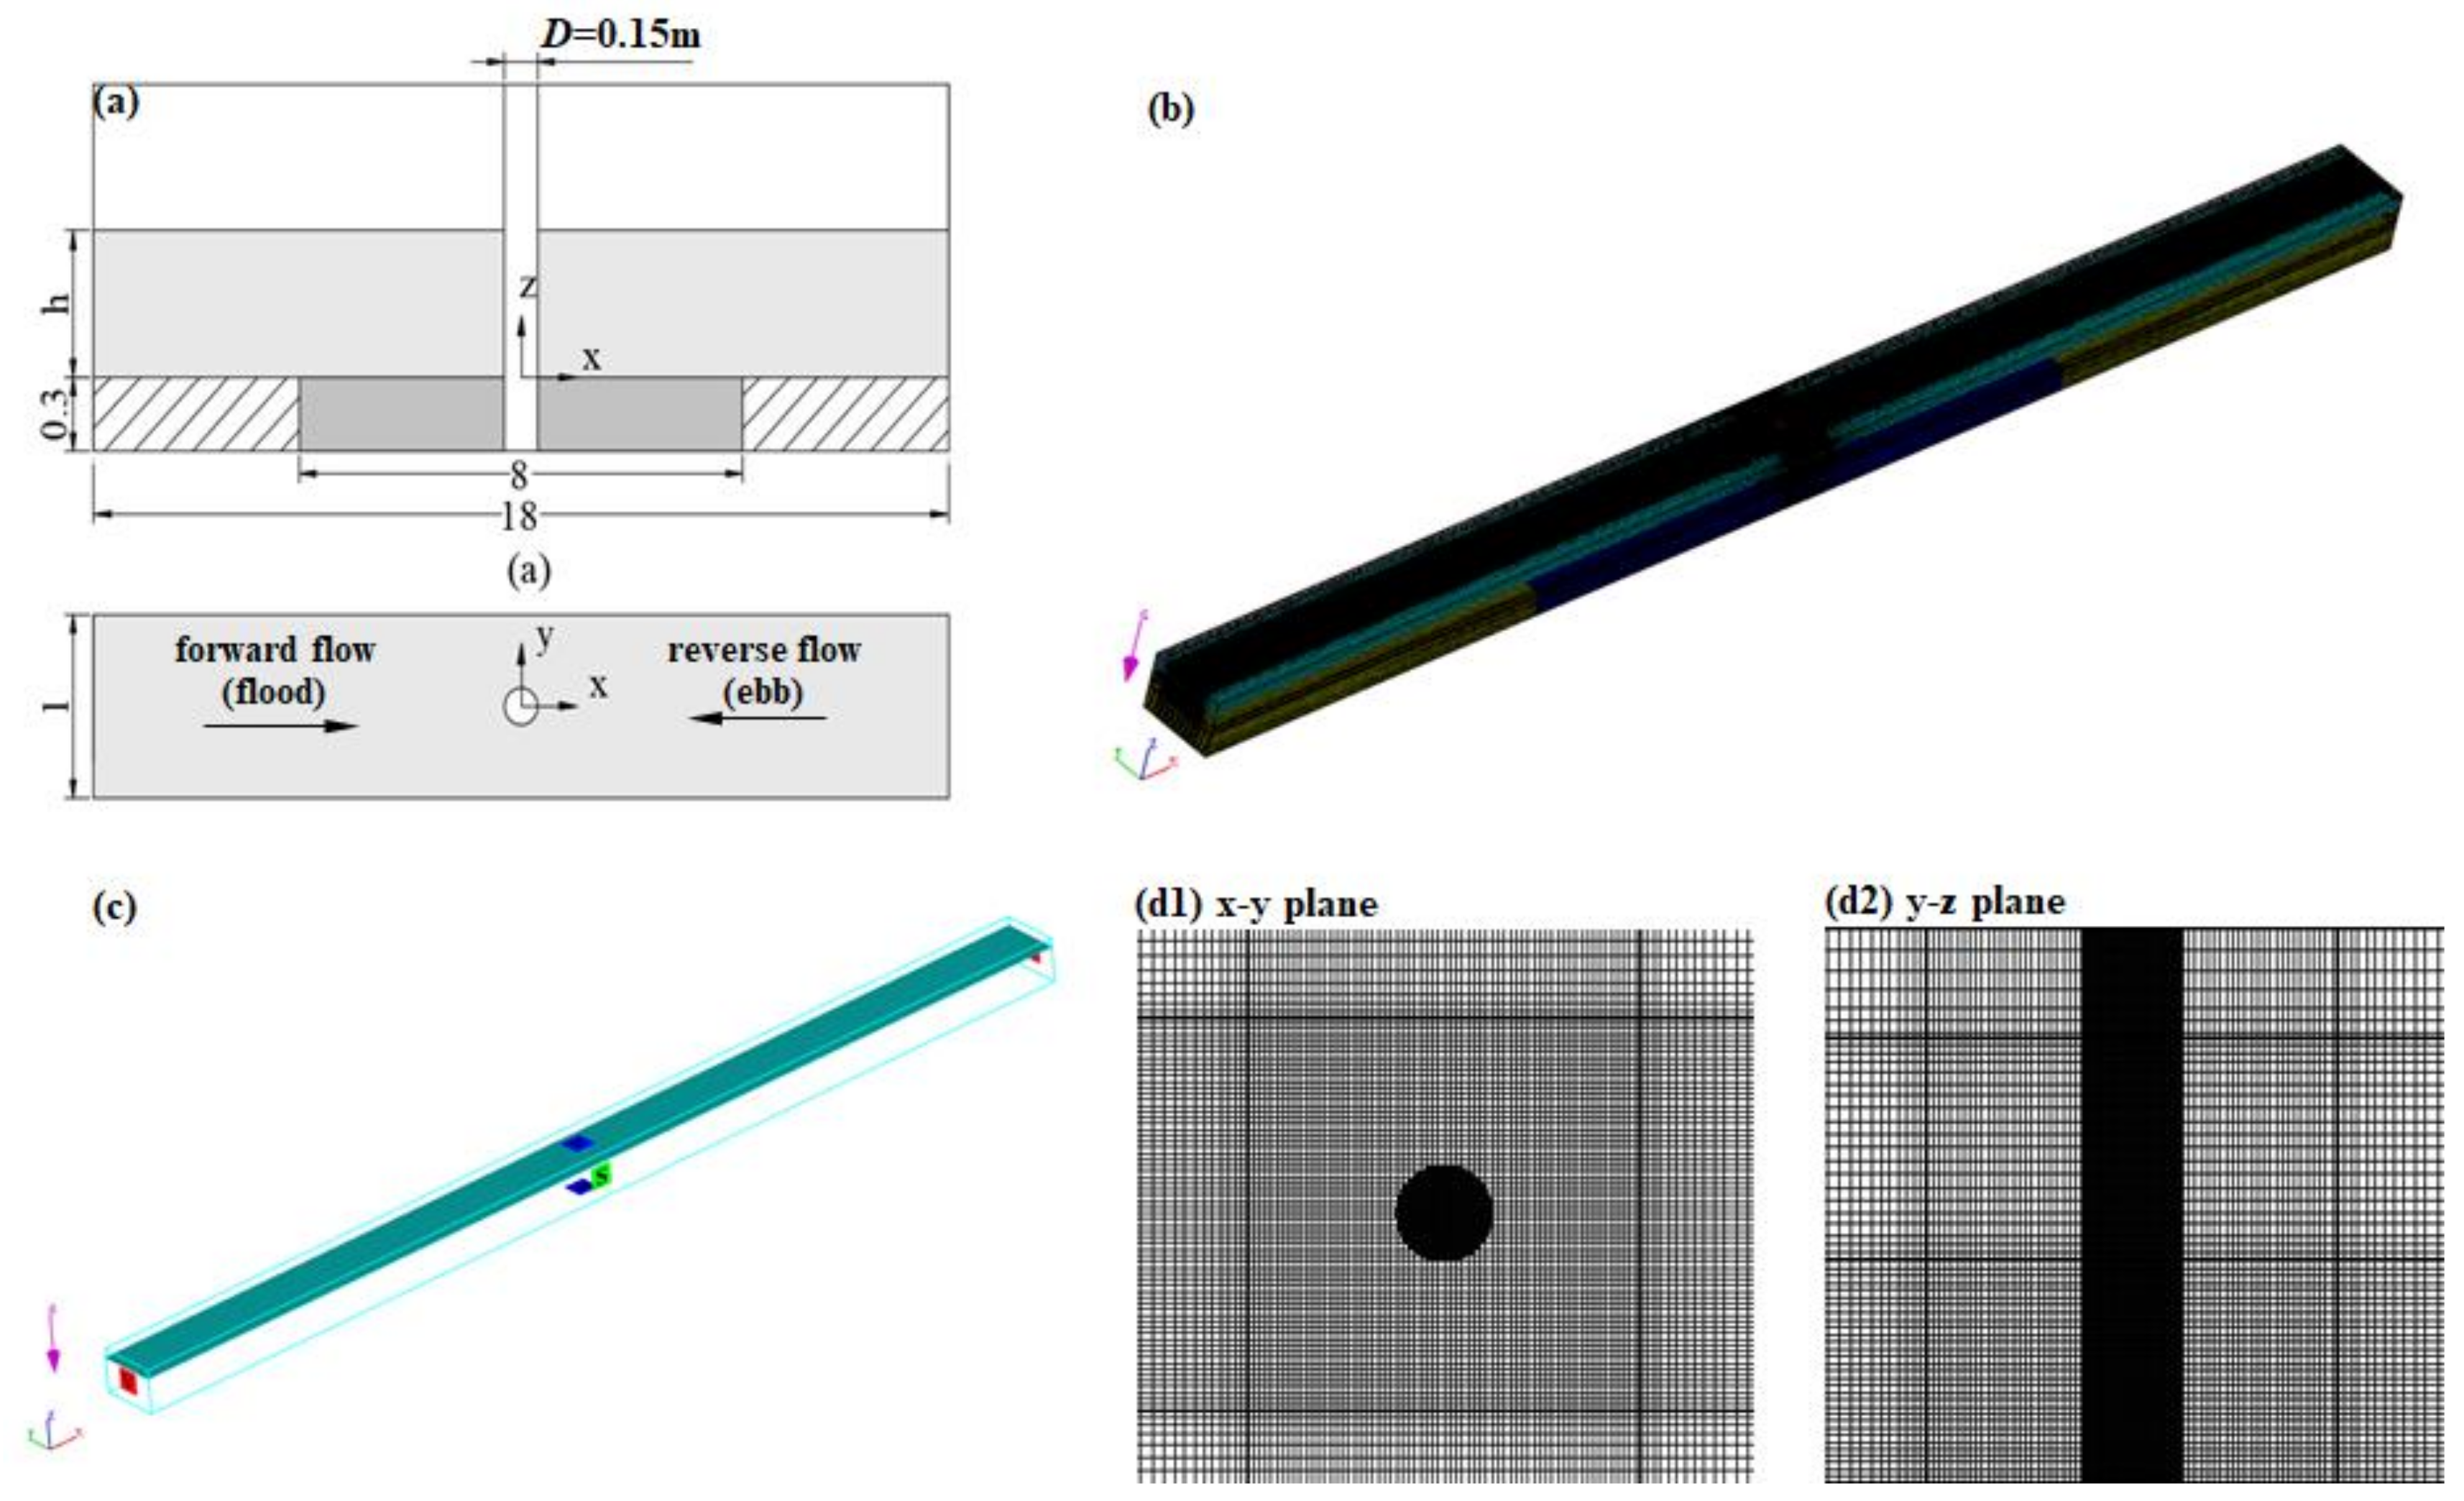
2.1. Model Description

2.1.1. Governing Equations of the Flow

Consider the flow of incompressible viscous fluids around a cylinder, whose fluid dynamics are solved by the RANS (Reynolds-averaged Navier–Stokes) equations:
u i x i = 0
u i t + u j u i x j = 1 ρ p x i + v 2 u i x i 2 + τ i j x j
where xi (i = 1, 2, and 3) denotes the Cartesian coordinate component, ui denotes the velocity component in the xi direction, p denotes the pressure, ν denotes the kinematic viscosity, t denotes the time, ρ denotes the fluid density, and τij denotes the Reynolds stress component, defined as follows:
τ i j = v t u i x j + u j x i 2 3 δ i j k
k = 0.5 ( u 2 + ν 2 + w 2 )
in which k is the turbulent energy, i represents the acting surface, and j represents the acting direction. u 2 , ν 2 , and w 2 represent the horizontal, transverse, and vertical pulsation velocity near the bed surface, respectively. νt is the turbulent viscosity, and δij is the Kronecker delta.
Sediment transport simulation is sensitive to turbulence models (Zhang et al., 2017 [27]), as the near-bed stress differs significantly among different turbulence models. The RNG k-ε model has been quite successful in simulating low-turbulence-intensity flows in strong shear regions (Bradbrook et al., 2001 [28]; Salaheldin et al., 2004 [29]), so this model is adopted in this study. The governing equations of the RNG k-ε turbulence model are:
k t + u j k x i = x j ( v + v t σ k ) k x j + τ i j u i x j ε
ε t + u j ε x i = x j ( v + v t σ ε ) ε x j + C 1 ε ε k τ i j u i x j C 2 ε ρ ε 2 k
in which ε is the dissipation of turbulent energy, and Cμ, C1ε, C2ε, σk, and σε are model coefficients whose values are usually set to 0.085, 1.42, 1.68, 0.7179, and 0.7179, respectively.

2.1.2. Sediment Model

In the sediment model, scour occurs when the shear stress is larger than the critical shear stress:
θ = τ g d 50 ( ρ s ρ ) , θ θ c
θ c = 0.3 1 + 1.2 d * + 0.055 [ 1 e 0.02 d * ] ,   d * = d 50 [ ρ ( ρ ρ s ) g μ 2 ] 1 / 3
where θ is the dimensionless shear force τ, g is the gravitational acceleration, d50 is the median particle size of the sediment, ρs is the density of the sediment, and ρ is the density of water. The critical Shields number θc can be calculated by the formula proposed by Soulsby (1998) [30]. d* is the non-dimensional sediment particle size. μ is hydrodynamic viscosity.
Sediment scour rate and deposition rate can be calculated by the following formula (Soulsby, 1998 [30]; Dick et al., 2003 [31]):
{ u l i f t = a n s d * 0.3 ( θ θ c ) 1.5 g d ρ s / ρ 1 u s e t t l i n g = g g μ ρ d [ 10.36 2 + 1.049 d * 3 ) 0.5 10.36
where αn is the entrainment coefficient and nb is the outer normal direction of the bed surface.
Suspended mass transport is calculated by solving the suspended mass concentration (SMC) diffusion equation:
C s t + · ( u s C s ) = · ( D C s ) ,   u s = u + u s e t t l i n g C s ρ s
where Cs is the SMC, determined by the mass concentration of sediment particles in the water–sand mixture per unit volume, D is the dissipation rate, and us is the motion velocity of suspended mass. Ignoring the interaction between suspended mass, the difference between the water–sand mixture and suspended mass is mainly the deposition velocity of sediment particles, where u ¯ is the velocity of the water–sand mixture.
When the shear stress of the sediment particles is greater than the critical shear stress τc, the sediment particles are washed, and the lifting force of the sediment is greater than the force that prevents it from rising. The critical shear stress of sediment particles can be calculated from the critical Shields number θc:
τ c = θ c d 50 g ( ρ s ρ )
The turbulent energy method is used to calculate the instantaneous shear stress, and the calculation expression is as follows:
τ = cρk
where c is a constant (c = 0.19).
To simplify, the concept of shear stress excess (SSE) τe is introduced:
τe = ττc
where τ is instantaneous shear stress. When τe > 0, the bed surface is washed; when the scour hole continues to expand, the shear force of the bed surface decreases; when τe < 0, the bed sediment is no longer washed.

2.2. Boundary Conditions

The proper boundary condition is important to obtain accurate results for numerical simulation. The upper boundary represents atmospheric pressure. A free-surface model is employed for the upper boundary. The bottom boundary is modeled with a wall boundary condition, where both the normal velocity and the pressure gradient are set to zero, satisfying the no-slip condition. The numerical flume uses a symmetry lateral boundary condition, where the gradients of all physical quantities are zero, the normal velocity is also zero, and there are no shear forces at the boundary. Under the tidal current conditions, the inlet boundary is specified as a velocity boundary, where the inlet flow velocity is determined by a given sinusoidal tidal current function. A fixed water depth is specified. A sufficiently long computational domain is set in front of the cylinder to ensure the full development of water flow, its flow rate is vertically logarithmically distributed, and the setup is similar to previous studies (Zhang Q et al., 2017 [27]). The outlet boundary is set as a pressure boundary. A fixed water depth is specified at the boundary, which is consistent with the inlet water depth. The pressure above the water surface is set to zero, while the pressure below the water surface follows a hydrostatic pressure distribution.

2.3. Model Configurations

2.3.1. Model Validation

The numerical experiments conducted by Schendel et al. (2018) [8] were selected to verify the model. The flume was set with a length of 18 m, a width of 1 m, and a water depth of h = 0.5 m. The inlet flow rate was given with the peak flow rate of Umax = 0.457 m/s and a period of about T = 120 min. The cylinder was in the center of the flume with coordinates of (0,0) and a diameter of D = 0.15 m. The median sediment particle size is d50 = 0.19 mm, the density is ρ = 2650 kg/m3, and the sediment thickness is 0.7 m.
The numerical simulation results and test data are well verified (Figure 1a–e). Because the numerical simulation cannot completely simulate the starting process of sediment under the action of water flow, the final numerical results are slightly smaller than the experimental results. The numerical model well reproduces the experimental results, with a 6.7% average error (0.3%~11.5%), which falls within the acceptable range.
The sediment layer is 8 m long with a sediment thickness of Hs = 0.3 m, and the water depth is set to 0.45 m with a median grain diameter of d50 = 0.75 mm and a density of ρ = 2650 kg/m3. The inlet velocity for the tidal current is set to a sine distribution: U = Umaxsin((2π/T)*t), where Umax is the peak velocity, Umax = 2Uc (Uc is the sediment starting velocity), and t is time. The tidal period is T = 360 s, and each simulation runs for four periods, totaling 1440 s (Tide01).
The inlet velocity after the coupling of a river flow and tidal current is set as a sine function distribution: U = Umaxsin((2π/T)*t) − Uuni, where Uuni is the river flow velocity. Test Tide01 is used as the control run, and the ratio of river flow velocity to peak tidal velocity (Uuni/Umax) is used to represent the intensity of river flow. Considering the calculation efficiency and limits of the computer resources, 1440 s was chosen in this present study, and the detail of these parameters is summarized in Table 1. The scour reached quasi-equilibrium after 1440 s, as confirmed by stable depth trends.

2.3.2. Model Grids

The maximum grid of the computing domain away from the cylinder is 0.04 m, and the minimum grid is 0.009 m. The grids around the cylinder, near the bed, and near the water surface are refined. Three different grids are used based on Tide02 to test the grid sensitivity. Test a has 1.17 × 10⁶ grids, with a minimum mesh size of 0.08D m. Test b has 1.83 × 10⁶ grids, with a minimum mesh size of 0.06D m. Test c has 2.43 × 10⁶ grids, with a minimum mesh size of 0.05D m.
The results of the medium grid (b) and fine grid (c) are close (Figure 1f), and they perform better than the coarse grid (a). Since the middle grid (b) (minimum mesh size 0.06D) satisfies the calculation requirements, it is used for calculation.
In the x direction and y direction, with the cylinder as the center, the tide side 0.5 m to the river side is refined, in the z direction, all sand holes 0.3 m below the bed surface are refined, and the area from 0.05 m above the water surface to 0.05 m below the water surface is refined. There are 426 × 86 × 50 = 1,831,800 grids in the x, y, and z directions (Figure 2(d1,d2)). Under different water depth conditions, the mesh size of grids in the z direction remains the same. At the initial stage of the simulation, significant numerical changes may occur at the edges of the grid-refined areas, but they have little impact on the results. As time passes, this phenomenon will gradually disappear.

2.4. Numerical Cases

Numerical cases are designed to case the mechanism of scour (Table 2).
Case group 1: Explore the influence of reciprocating tidal currents on local scour (Tide01). Conduct an analysis through tidal current velocity, bottom shear stress, bottom vorticity, and scour depth.
Case group 2: Test the coupling influence of river flow and tidal currents on bed scour. Based on the tide condition (Tide01), the impact of river flow intensity (Uuni/Umax) on the scour around the cylinder is studied by changing the river flow intensity (River flow01–08 compared with Tide01). The river flow and tidal currents are linearly added to form the coupling conditions.
Case group 3: Test the influence of peak flow velocities on bed scour. Under fixed-bed (Tide02) and movable-bed (Tide03) conditions, the peak flow velocity of the tidal current is changed (Cases Runoff04, Runoff15, and Runoff16 compared with Tide01, Tide02, and Tide03) and coupled with river flow to analyze the influence of peak velocity on the coupling scour of river flow and reciprocating tidal current.
Case group 4: Test the influence of cylinder diameter on bed scour. The cylinder diameter is changed (Runoff12–14 compared with Runoff04) to explore the influence of cylinder size on the coupling of river flow and reciprocating flow.
Case group 5: Test the influence of tidal periods on bed scour. The reciprocating tidal current is simplified using a sine function, and the tidal period is changed (Test Runoff09–11, compared with Runoff04) and coupled with river flow to study the influence of tidal period on the coupling scour of river flow and reciprocating tidal currents.

3. Results

3.1. Flow Characteristics

3.1.1. Tidal Currents

The tidal current is characterized by forward flow (U > 0, flooding tide) and reverse flow (U < 0, ebbing tide). The flow velocity is generally symmetrical along the flow direction (Figure 3(a1–a4)), with large/small values on both sides/in front of the cylinder. As the forward flow velocity increases, the velocity around the cylinder reaches a peak value of about 0.6 m/s at t = T/4 and then decreases gradually. When t = 5T/8, the flow is reversed; the flow rate is about −0.3 m/s in the entire field and close to zero near the bed. This is due to the inertia of the incoming flow being hindered by the reverse flow. The flow velocity after reversal continues to increase. Because the bed surface near the cylinder has been partially scoured by the flow, the peak reverse flow velocity is only −0.5 m/s (Table 3), smaller than the peak forward flow velocity around the cylinder.

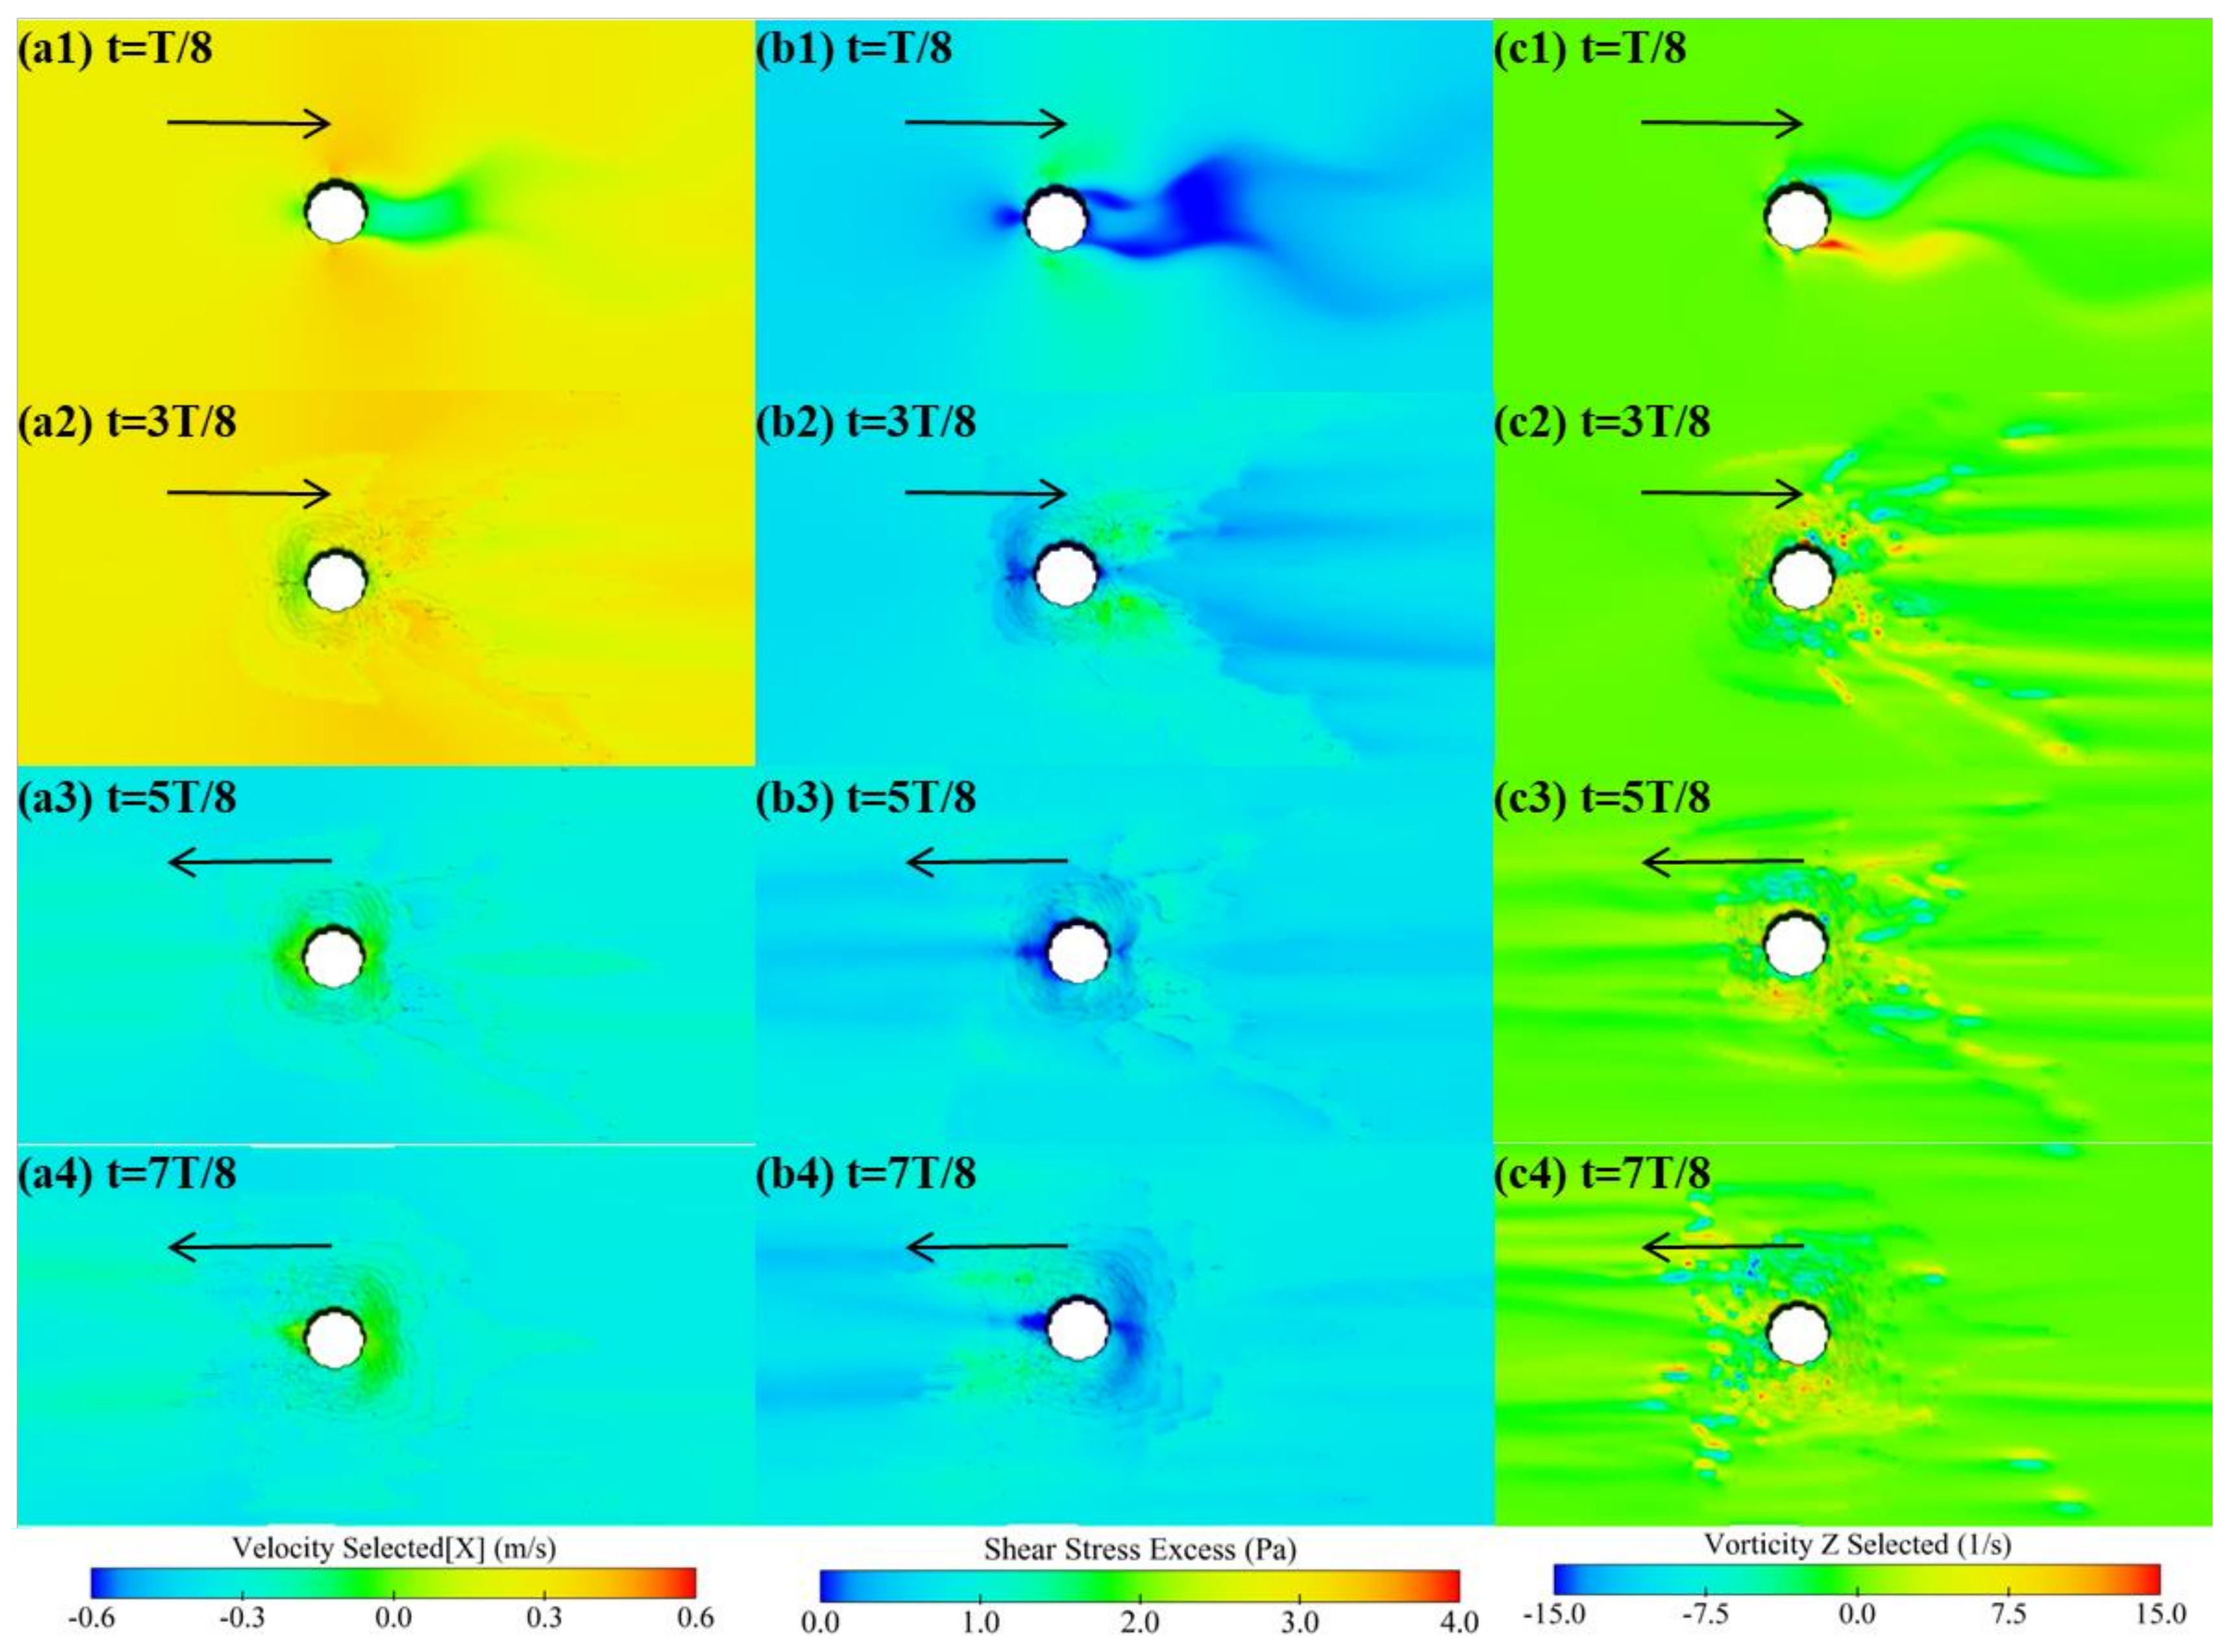
3.1.2. Bottom Shear Stress

The distribution of SSE is similar to that of the flow velocity (Figure 3(b1–b4)). The SSE field is symmetric around the cylinder with respect to the flow direction, and increases with the flow velocity. When the flow velocity reaches its peak (t = T/4), the SSE reaches its maximum value of 3.5 Pa. As the flow velocity decreases (t = 3T/8), the SSE decreases accordingly. After the flow reverses, the shear stress around the cylinder remains relatively small before the peak reverse velocity (t = 5T/8). Upon the reversal of flow, the SSE increases again when the peak reverse velocity is reached (t = 3T/4). When the reverse flow velocity equals the forward flow velocity (t = 3T/8 and t = 5T/8), the SSE (Figure 3(b2)) around the cylinder is near zero, which is significantly lower than that in Figure 3(b3). This is consistent with the flow velocity, indicating that there is a lag phase after the flow reverses. During this phase, the horizontal velocity and SSE around the cylinder approach zero, resulting in a stagnation in scour. This represents a plateau period (scour depth remains unchanged for a while) in the scour process.
The maximum SSE around the cylinder occurs during the first period. When both forward and reverse flow velocities reach their peak values (t = T/4 and t = 3T/4), the SSE around the cylinder reaches 3.5 Pa (Table 3). In the second period, at peak forward flow velocity (t = 5T/4 and t = 7T/4), the SSE around the cylinder decreases to less than 3 Pa. In the fourth period, at the peak forward flow velocity, the SSE around the cylinder drops below 2 Pa (Figure 4). This reduction is due to the continuous scour deformation of the bed surface, leading to the deepening and widening of the scour hole.

3.1.3. Bottom Vorticity

The trend of vorticity changes around the cylinder is consistent with that of the horizontal velocity and SSE. The distribution of vorticity around the cylinder is symmetrical in the flow direction and exhibits periodic variations with flow velocity (Figure 3(c1–c3)). The vorticity is maximized at the peak forward flow (t = T/4). A clear vorticity shedding phenomenon is observed during the initial scour stage (t = T/8). Scour begins to occur around the cylinder as the forward flow velocity increases (t = T/4), and the vorticity shedding phenomenon near the bed becomes less pronounced. The vorticity, like the horizontal velocity and SSE, enters a lag phase (t = 5T/8) after the flow reverses, with lower vorticity being distributed around the cylinder. The morphology of the scour hole changes the flow field structure and weakens the intensity of periodic vorticity shedding.

3.2. Scour Characteristics

3.2.1. Scour Hole Morphology

The range and depth of the scour hole increase periodically until scour equilibrium (Figure 5(a1–a4)). During the forward flow, scour occurs at the tide side and on both sides of the cylinder, with the two sides being scoured first. The scour hole is symmetrical around the flow direction, and sediment accumulates at the river side. This process is similar to that of the unidirectional flow. During the reverse flow, the river side is scoured, and the sediment carried by the reverse flow backfills the tide side scour hole, reducing its depth. After one tidal period, the scour hole expands in scope. The scour depth is greater at the river-side end. After the first tidal period, scour is predominantly concentrated on the river side. By the second tidal period, scour becomes more uniform between the tide side and river-side areas. The contour lines of the scour hole are closed elliptical rings, with a larger range in the direction perpendicular to the flow. After four tidal periods, the maximum scour depth reaches approximately 0.15 m. The scour hole range along the flow direction expands, and its aspect ratio approaches 1, with the shape becoming more circular.

3.2.2. Scour Profiles

At the initial stage (t = T/4, Figure 5(b1,b2)), the tide side of the cylinder initiates the scour process. At t = T/2, the scour on the tide side persists, while sediment deposition gradually emerges on the river side. After the flow reverses (t = 3T/4), the river side starts to be scoured, the previously deposited part disappears, and the scour depth on the tide side remains stable. After one tidal period, the scour on the river side continues, but the scour depth on the tide side decreases. This is due to the backfill effect. After the first tidal period, the longitudinal section of the scour hole shows a symmetrical pattern along the flow direction, which is consistent with the intensity distribution of the horizontal flow velocity, SSE, and vorticity.
After two tidal current periods (Figure 5(b3,b4)), the transverse and longitudinal sections of the scour hole are symmetrically distributed with respect to the y-axis and x-axis, respectively, and the scour depth of the longitudinal section exceeds that of the transverse section. The horseshoe vorticity is mainly concentrated on the left and right sides of the cylinder and thus causes a stronger scour effect there. The scour hole deepens longitudinally and expands horizontally. The scour rate in the first tidal period is the most prominent, and the change rate of the scour hole in subsequent periods gradually slows down. This is attributed to the attenuation of the shear stress caused by the expansion of the scour hole range, which weakens the sediment transport and scour efficiency.

3.2.3. The Maximum Scour Depth

The scour process of tidal currents is periodic, and the scour depth continues to accumulate (Figure 5(c1)). During the first tidal period, the scour depth reaches its maximum, accounting for 73.8% of the total scour depth in four tidal periods. This is consistent with the development trend of the SSE field on the bed surface. When the forward flow peaks at Umax = 0.732 m/s (t = T/4), the scour rate (Figure 5(c2)) peaks at 1.2 mm/s accordingly. After the second period, the scour rate decreases with an absolute value mostly below 0.5 mm/s. The scour rate decreases once the flow velocity reaches its peak value. As a result, the depth of the scour hole remains almost constant after the peak velocity. This scour characteristic is consistent with the experimental results of Chang et al. (2004) [32] and Link et al. (2017) [3] on unsteady unidirectional flows. The forward flow drives the scour/deposition on the tide side/river side area of the cylinder. The reverse flow promotes the backfilling of the deposited sediment on the river-side area into the tide side scour hole, resulting in a reduced scour depth and a negative scour rate (Figure 5(c1,c2)).
Eight measuring points are set clockwise around the cylinder (Figure 5(c3)). Sediment deposition appears near 90° of the cylinder in the first forward flow (S > 0). The maximum scour depth points alternately appear near 45°, 135°, 225°, and 315°, which is consistent with the locations of the maximum values of SSE and vorticity. The minimum scour depth points are stably located near 90° and 270°. After four periods, the maximum scour depth point is located near 45°, and the minimum points are still located near 90° and 270° (Table 4). The changes in the maximum scour depth shift with flow directions. In the forward flow direction, the maximum scour depth point is located at 315° or 225°. After the flow reverses, it migrates to 45° or 135°.

4. Discussions

To investigate the scour mechanism under the coupling effects of river floods and tidal currents, the influences of river flow, peak tidal currents, cylinder diameters, and tidal periods on the scour characteristics are discussed.

4.1. Influence of River Flow

The results of test group 2 are used to examine the influence of river floods on sour characteristics (Section 2.4, Table 1).
(1)
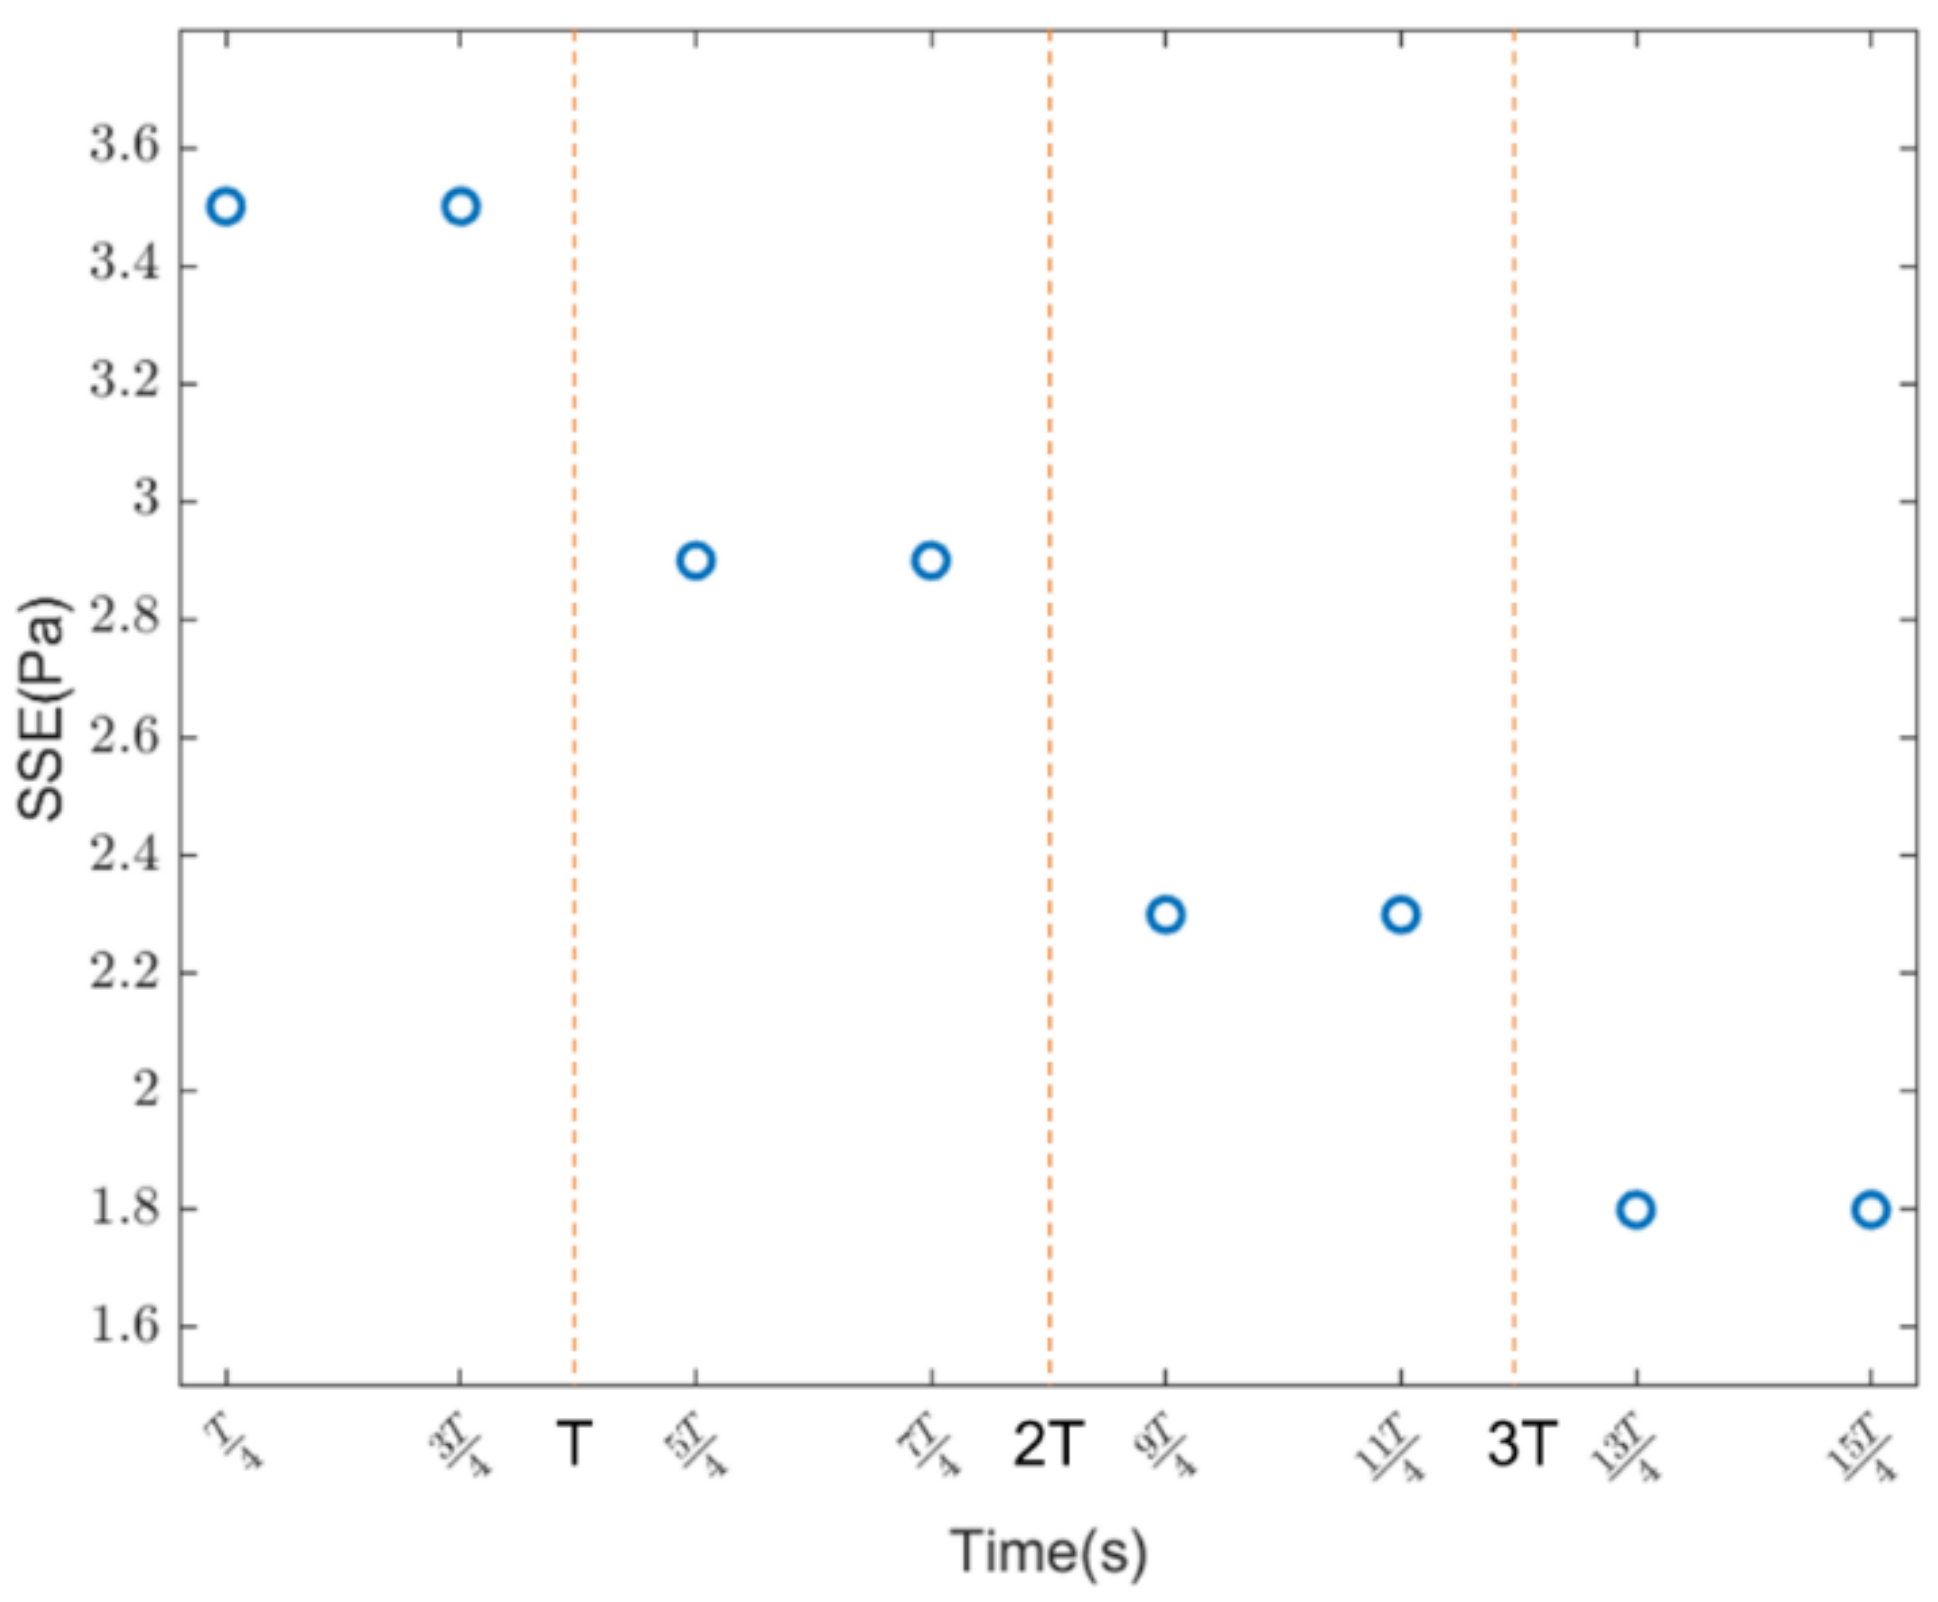
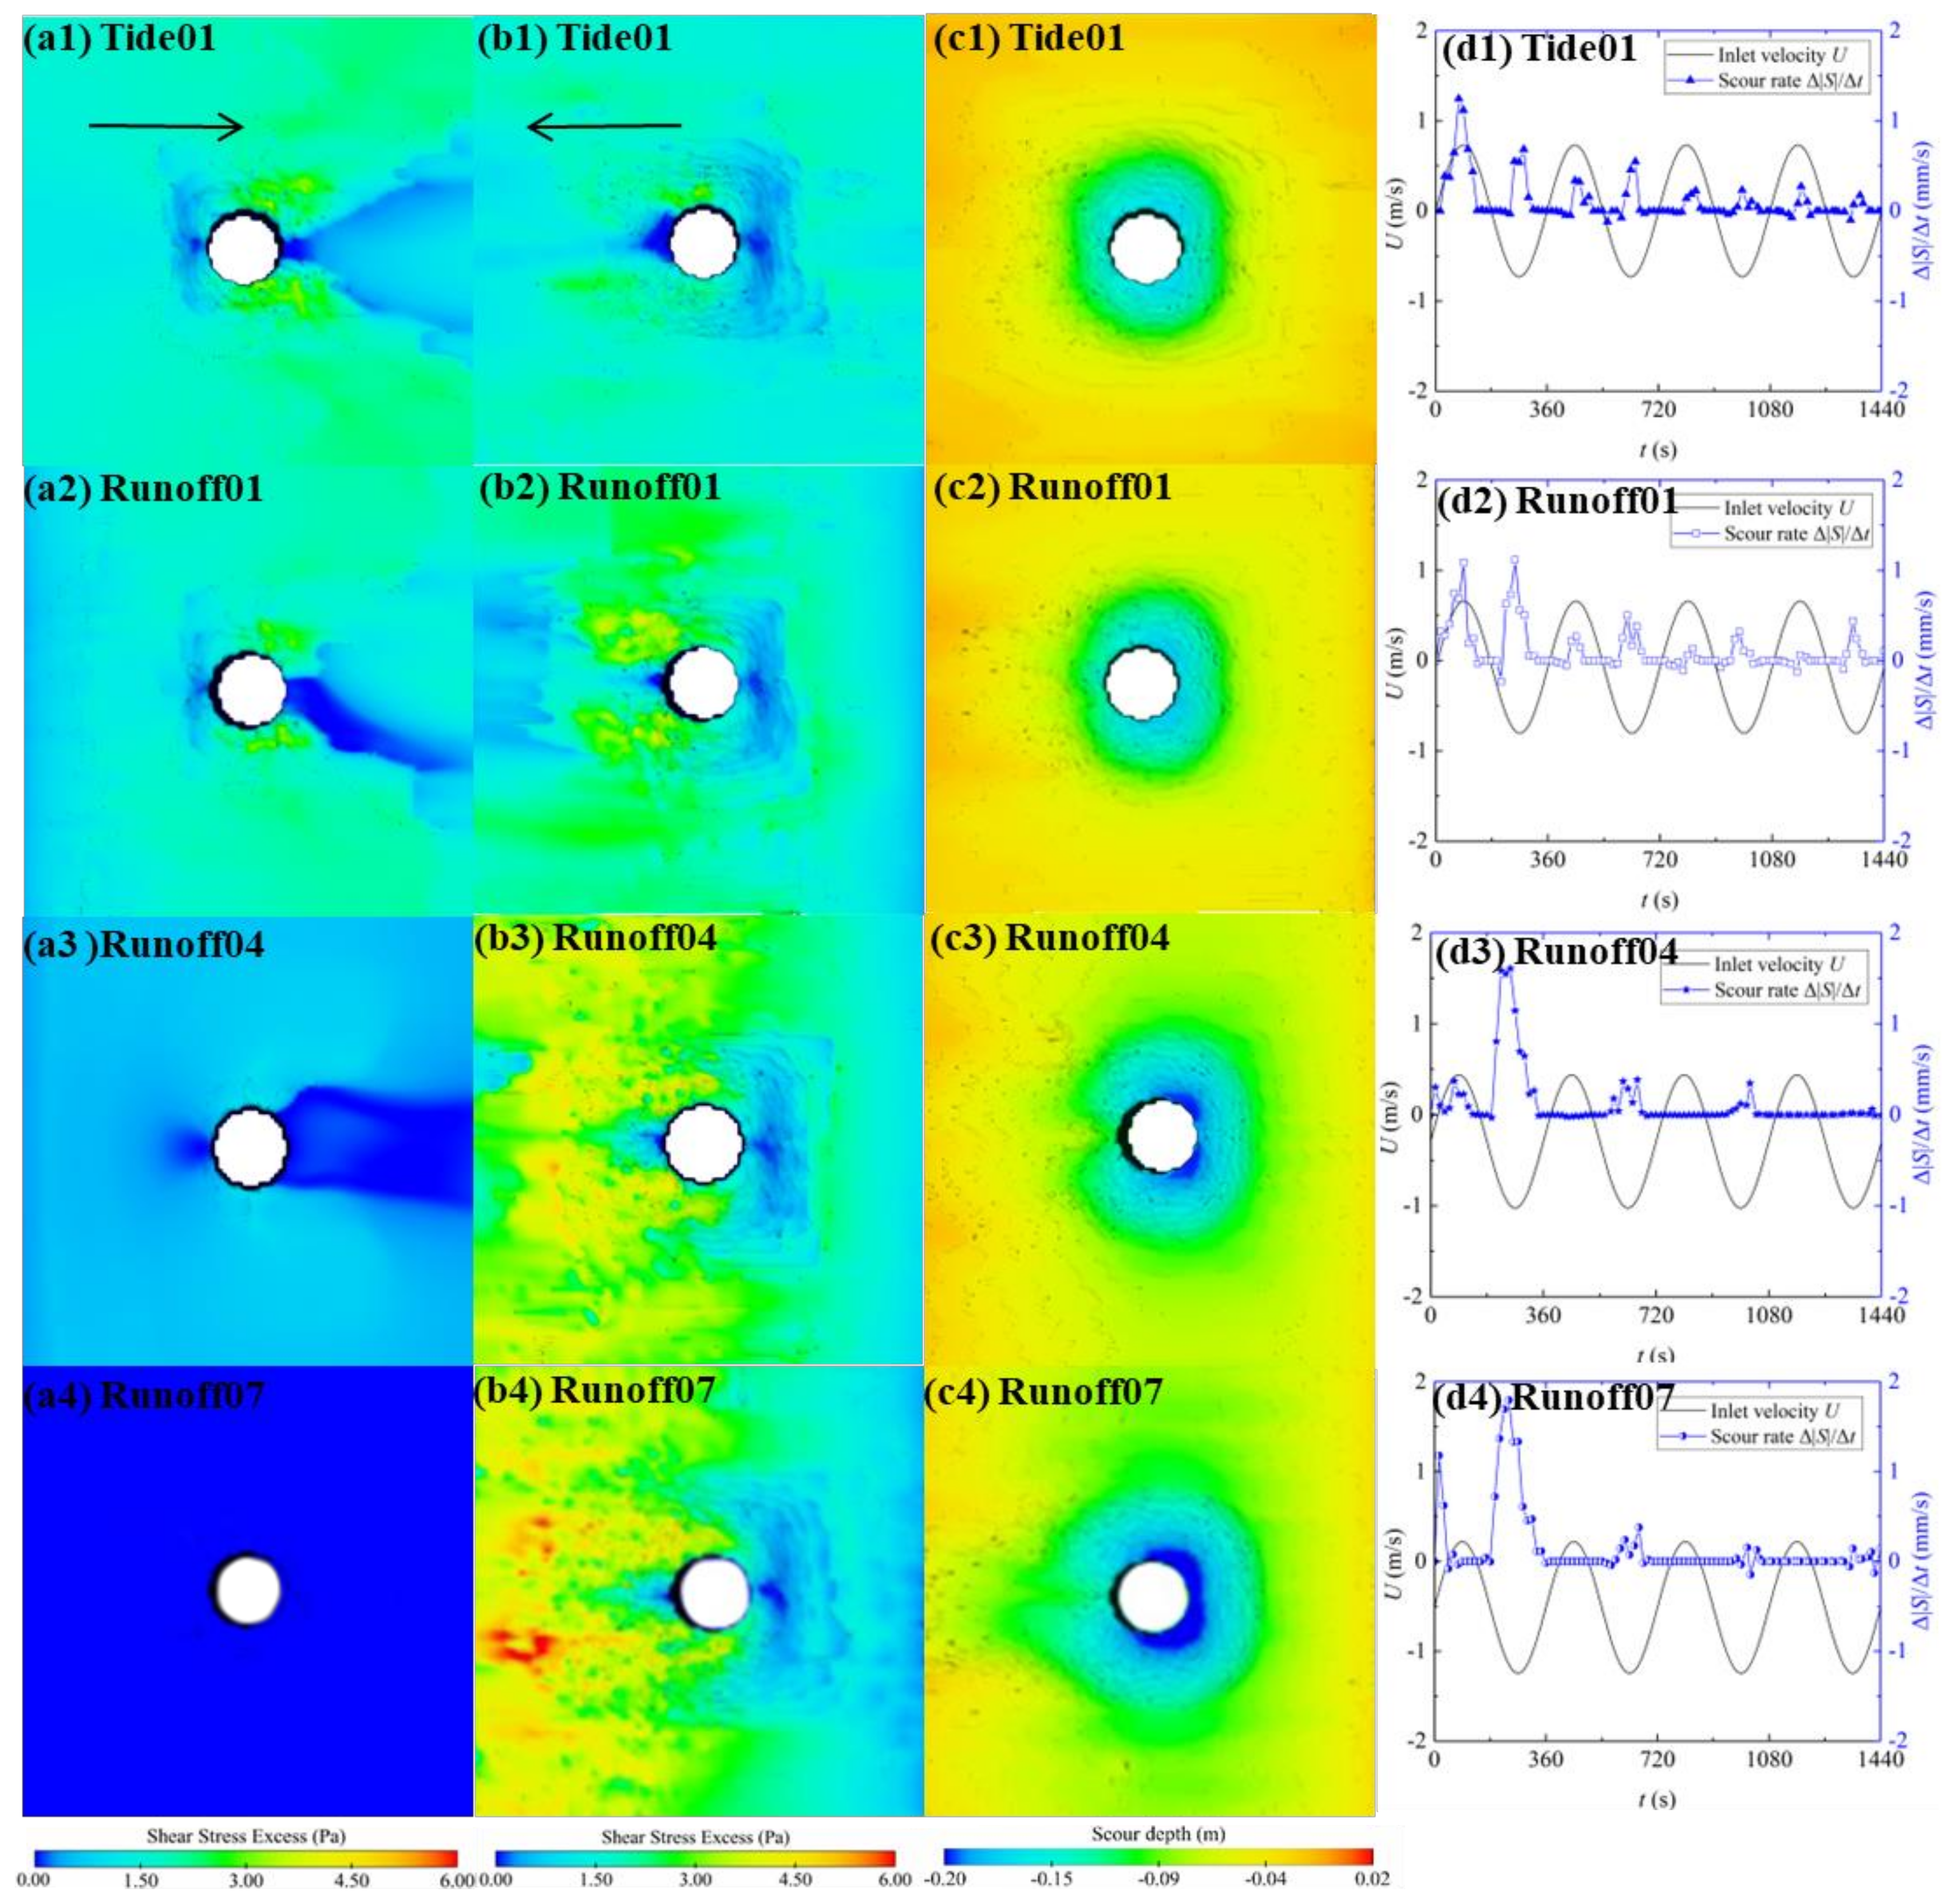
SSE. The SSE is determined by the coupling velocity of river flows and tides (Figure 6(a1–a4,b1–b4)). At the peak forward velocity, the SSE near the cylinder gradually decreases with the increase of river flow intensity, and the SSE changes are consistent with the forward flow (Figure 6(a1–a4)). If neglecting river flow (Tide01), the mean bottom SSE is about 3 Pa. If the flow intensity satisfies Uuni/Umax ≥ 0.6, the SSE near the cylinder is negative (Runoff06, Runoff07, Runoff08) and no scour occurs. The forward flow velocity is affected by river flow, and the flow velocity is less than half of the critical starting flow velocity of sediment (Umax/Uc < 0.5), so the SSE is negative.
When the flow is reversed (t = 3T/4), the bottom SSE increases with the increased river flow intensity, which is opposite to the growth trend of the forward flow (Figure 6(b1–b4)). The SSE in Tide01 (Uuni/Umax = 0) is similar to that of the forward flow, with an average value of about 3 Pa. When the flow intensity is in the range of Uuni/Umax ≥ 0.6, the maximum bottom SSE exceeds 6 Pa. Thus, throughout the entire scour process, the scour depth is entirely controlled by the reverse flow.
(2)
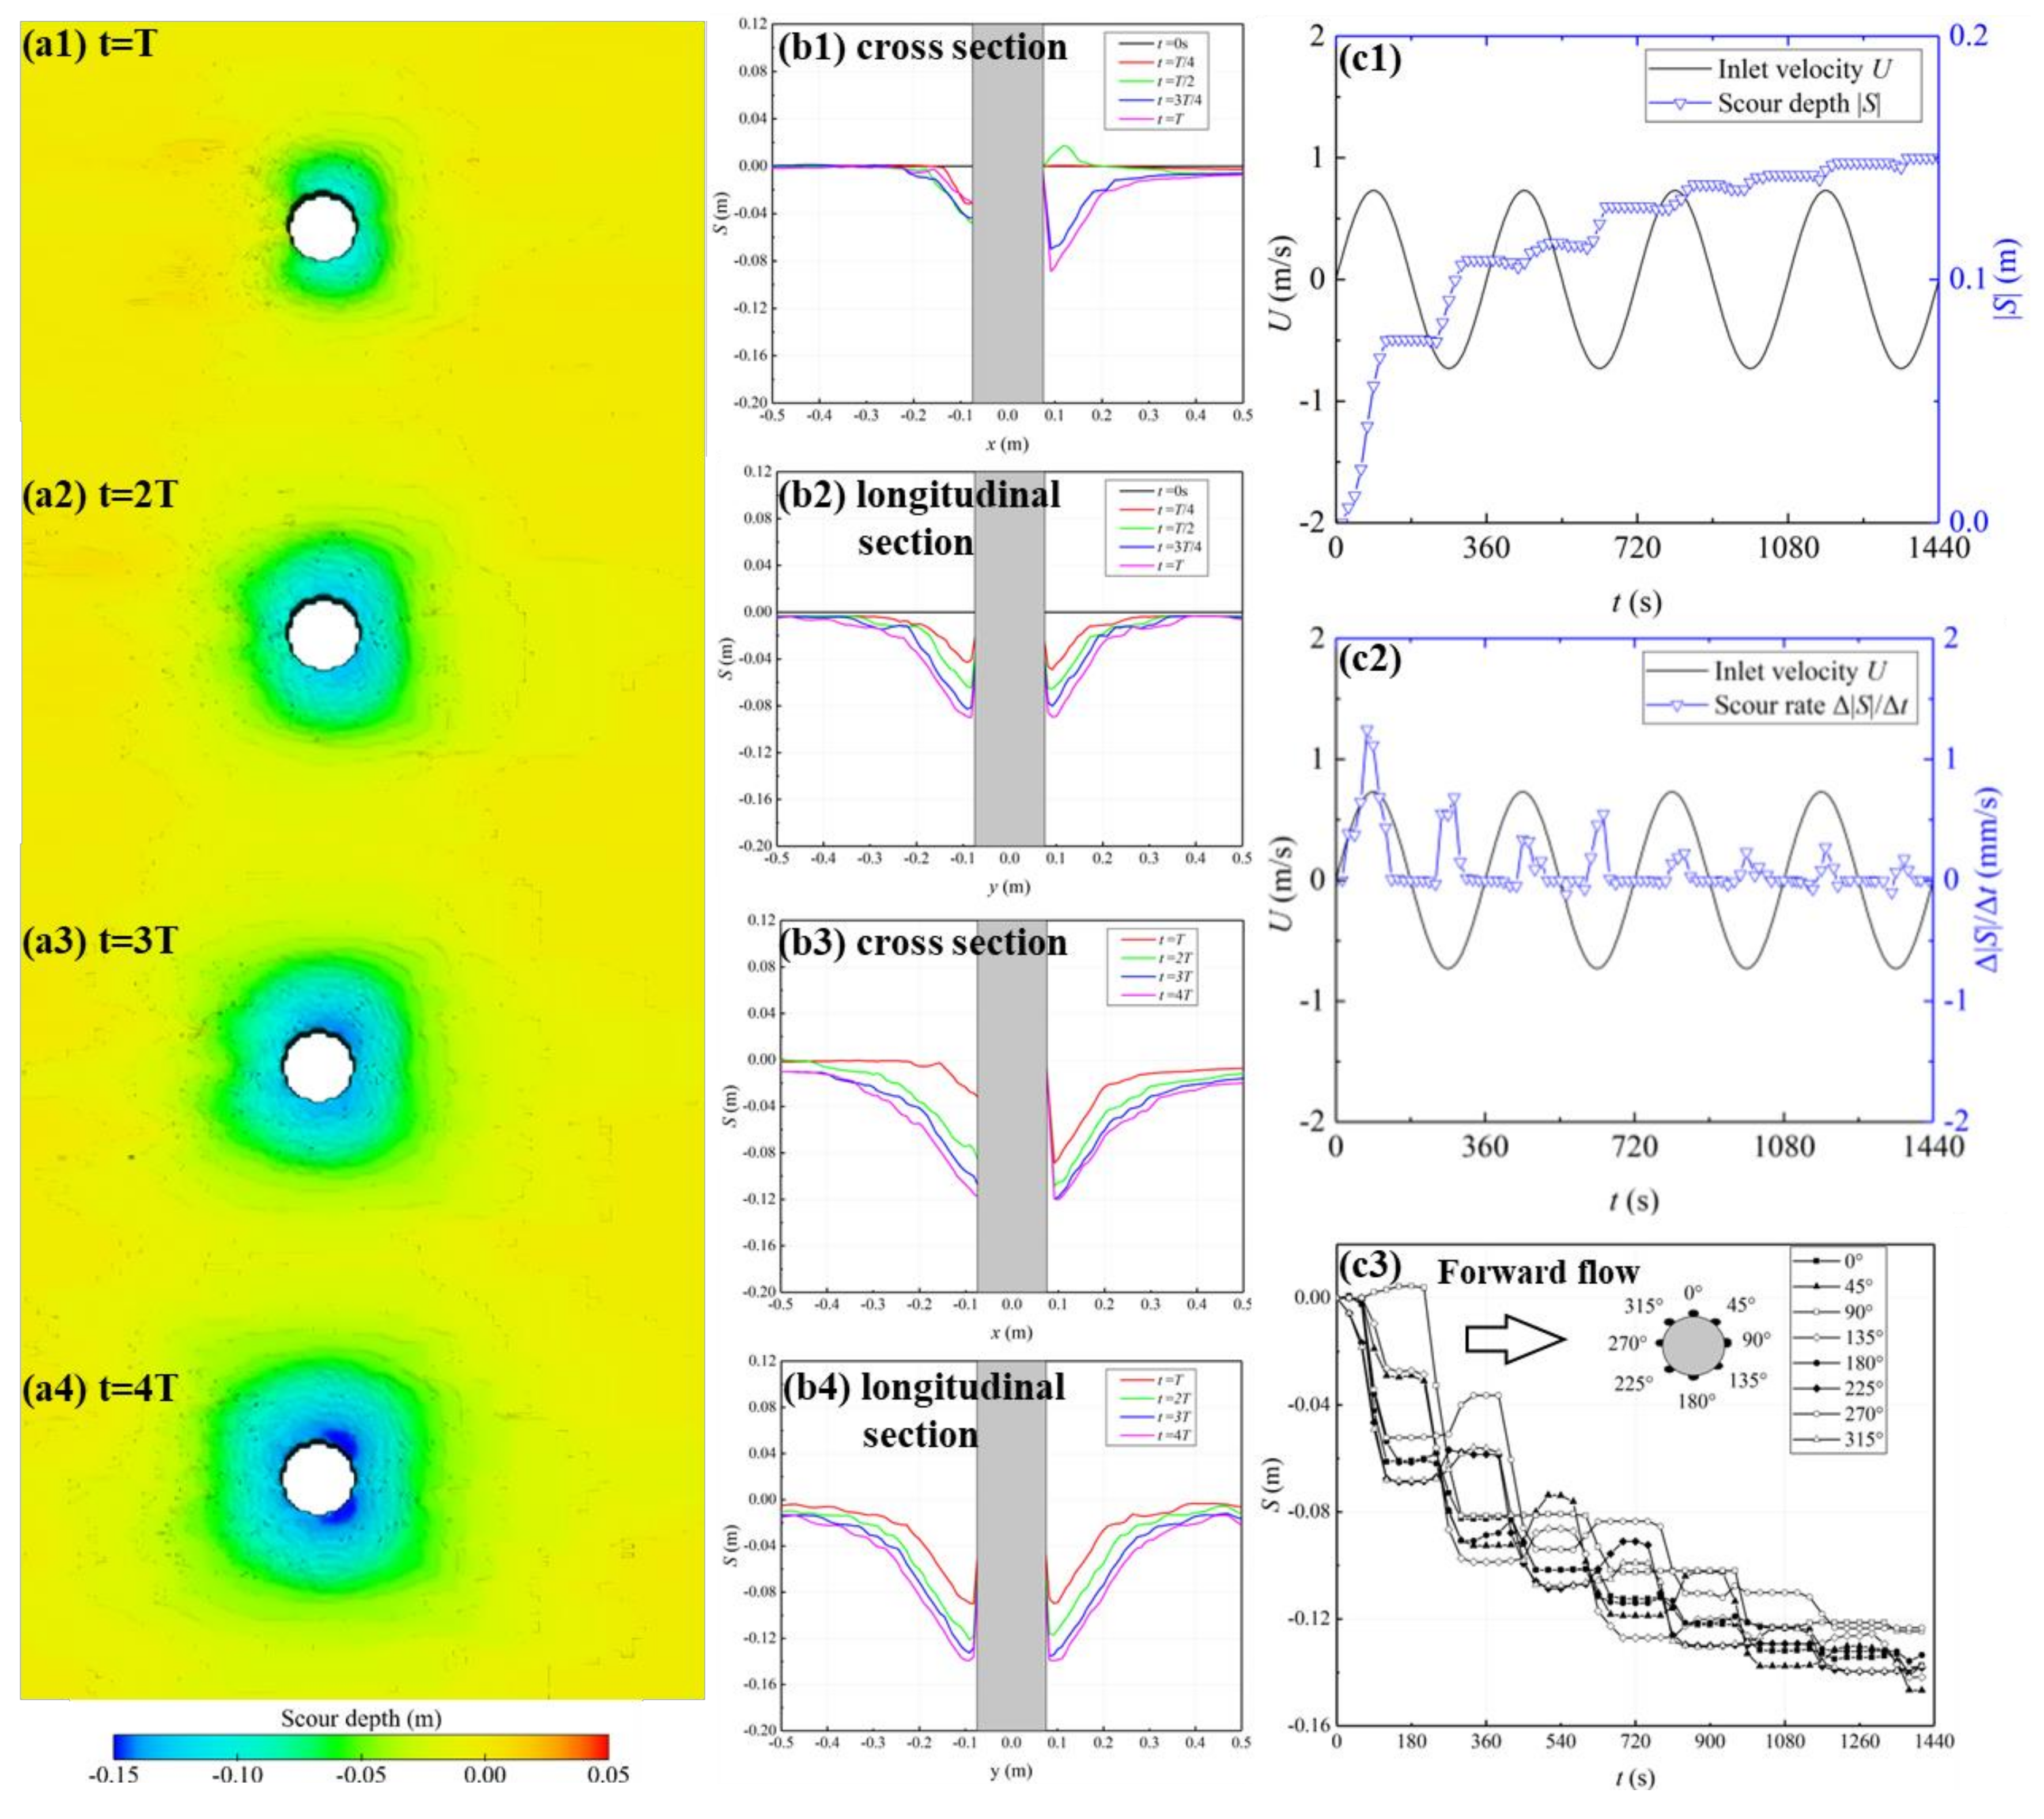
Scour hole morphology. The 3D morphology of scour holes differs with river flow intensities. The scour hole in Tide01 is mostly symmetric. The scour hole around the cylinder varies in depth and range with increased flow intensity (Figure 6(c1–c4)). With the increase of flow intensity, the river-side scour depth is deepened slowly; the scour hole gradually extends on the tide side and expands continuously along the flow direction. The scour depth on the river side of the cylinder is larger after four tidal periods, and the bottom SSE is gradually decreased, so the tide side scour hole no longer develops.
The development of the scour hole is closely related to the scour rate. When the flow intensity is small (Uuni/Umax < 0.5), the scour in the first half of the period is mainly due to the forward flow, and the tide side of the cylinder starts to be washed first (Figure 6(d1–d4)). When the flow intensity is large (Uuni/Umax > 0.5), the reverse flow reaches the starting velocity of sediment scour, so scour occurs on the river side of the cylinder. With the increase of flow intensity, the scour rate in the first half period decreases first and then increases. In the second half period, all tests (Tide01, Runoff01–08) are dominated by the reverse flow, and when the reverse flow is at the peak velocity, the scour rate is at the maximum of the four periods, indicating a larger scour intensity. Starting from the second period, the scour rate of each test decreases with time. The scour rate in Tide01 decreases slowly, and the maximum scour depth in the first period is 68% of the total scour depth in the four periods. Meanwhile, the scour rate of Runoff08 decreases the fastest, and its maximum scour depth in the first period is 90% of the total scour depth in the four periods. The maximum scour rate reaches 1.76 mm/s in the first period and then decreases rapidly to a minimum of 0.3 mm/s as the deep scour hole reduces the SSE. The scour reaches the equilibrium state more easily after coupled river flow.
(3)
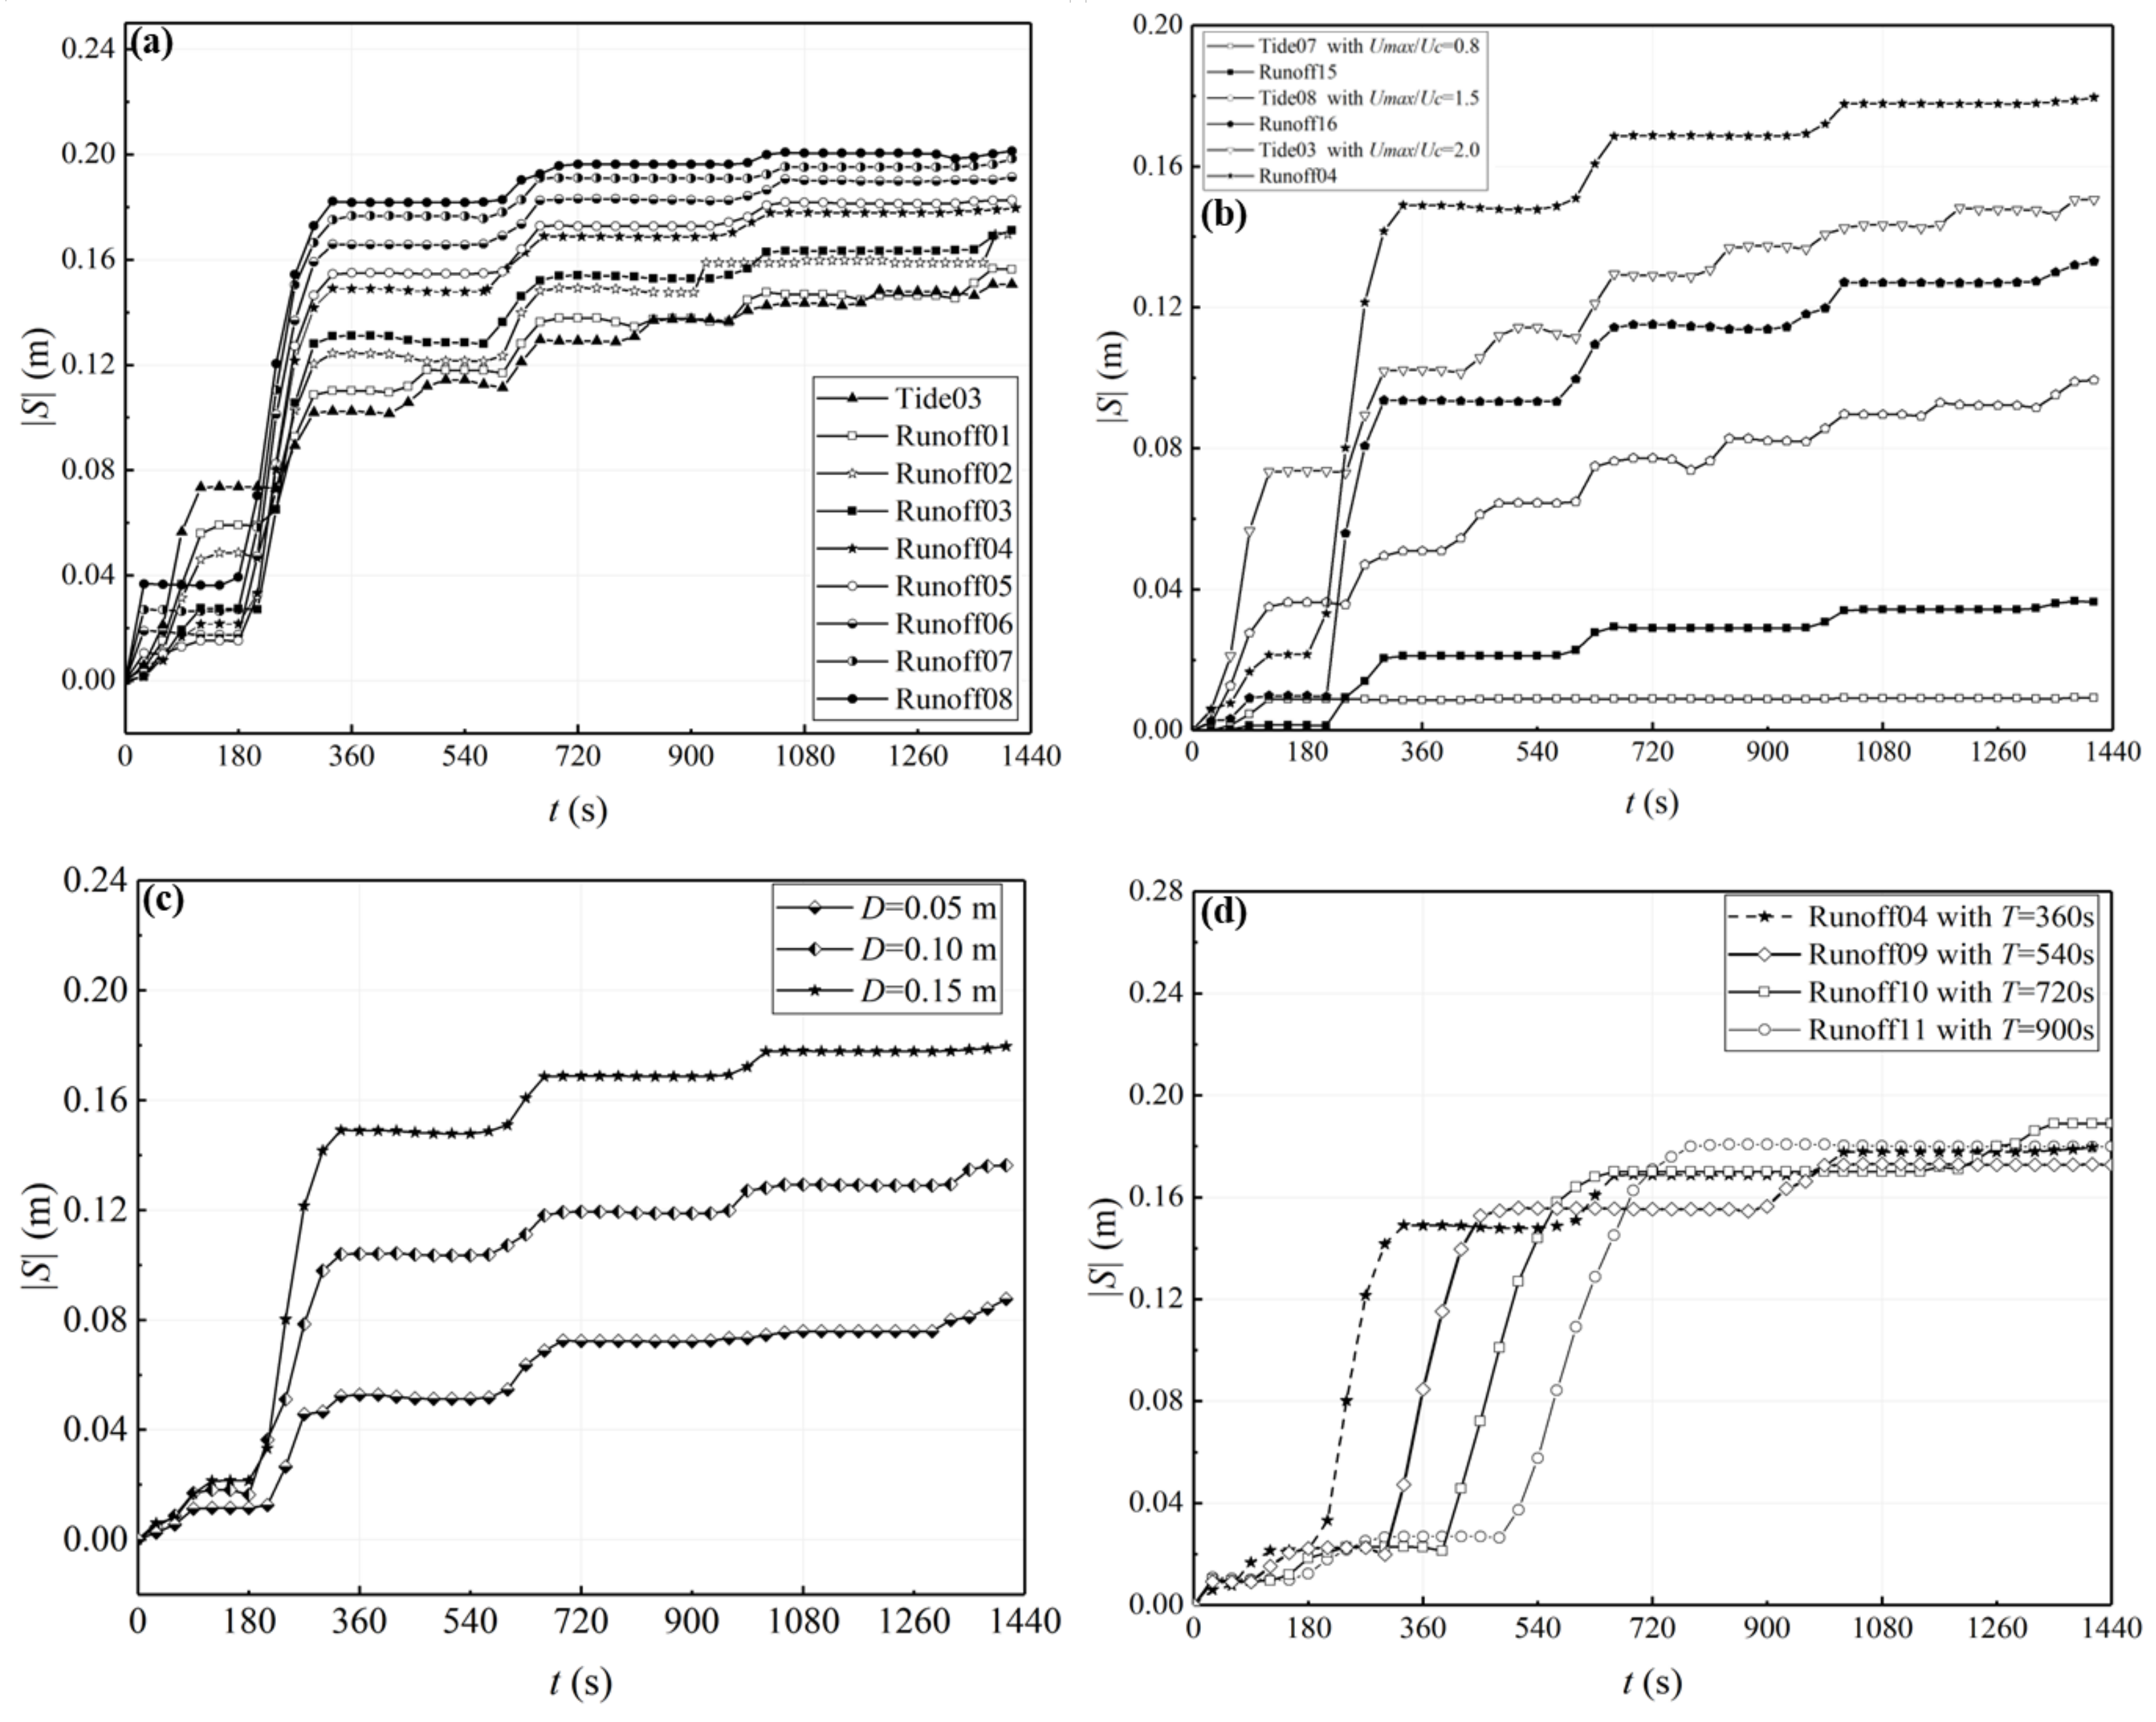
Maximum scour depth. The maximum scour depth varies in the first period and mainly increases with river flow intensities (Figure 7a). After the first half of the period (Figure 7a), the maximum scour depth of tidal current Tide01 is the maximum in all tests (Tide01, Runoff01–08), and the forward flow in Tide01 lasts the longest. When coupling with river flow, the duration of the forward flow is continuously reduced, and the effective scour time is also gradually reduced. From the second half of the period onwards, with the prolongation of the reverse duration of the coupling condition, the reverse flow velocity keeps increasing, the scour depth gradually exceeds that in Tide01 (tide condition), and the scour depth of Runoff01 to Runoff08 steadily increases. The inflection point of the scour depth duration line is at the beginning of the second half of the period after the flow reverses. Starting from the second period, when the river flow intensity is greater than 0.4, the negative scour rate caused by backfill basically disappears. This is because with the increase of river flow intensity, the forward flow velocity decreases and the forward duration shortens. Therefore, river-side sedimentation is reduced, resulting in the backfill effect caused by reverse flow decreases. Meanwhile, the scour process enters the plateau period. After four periods, the maximum scour depth of Runoff08 is the largest, and the maximum scour depth in Tide01 is the smallest. The maximum scour depth deepens with the increase of river flow intensity, and its variation trend is consistent with the inflow velocity and SSE.
(4)
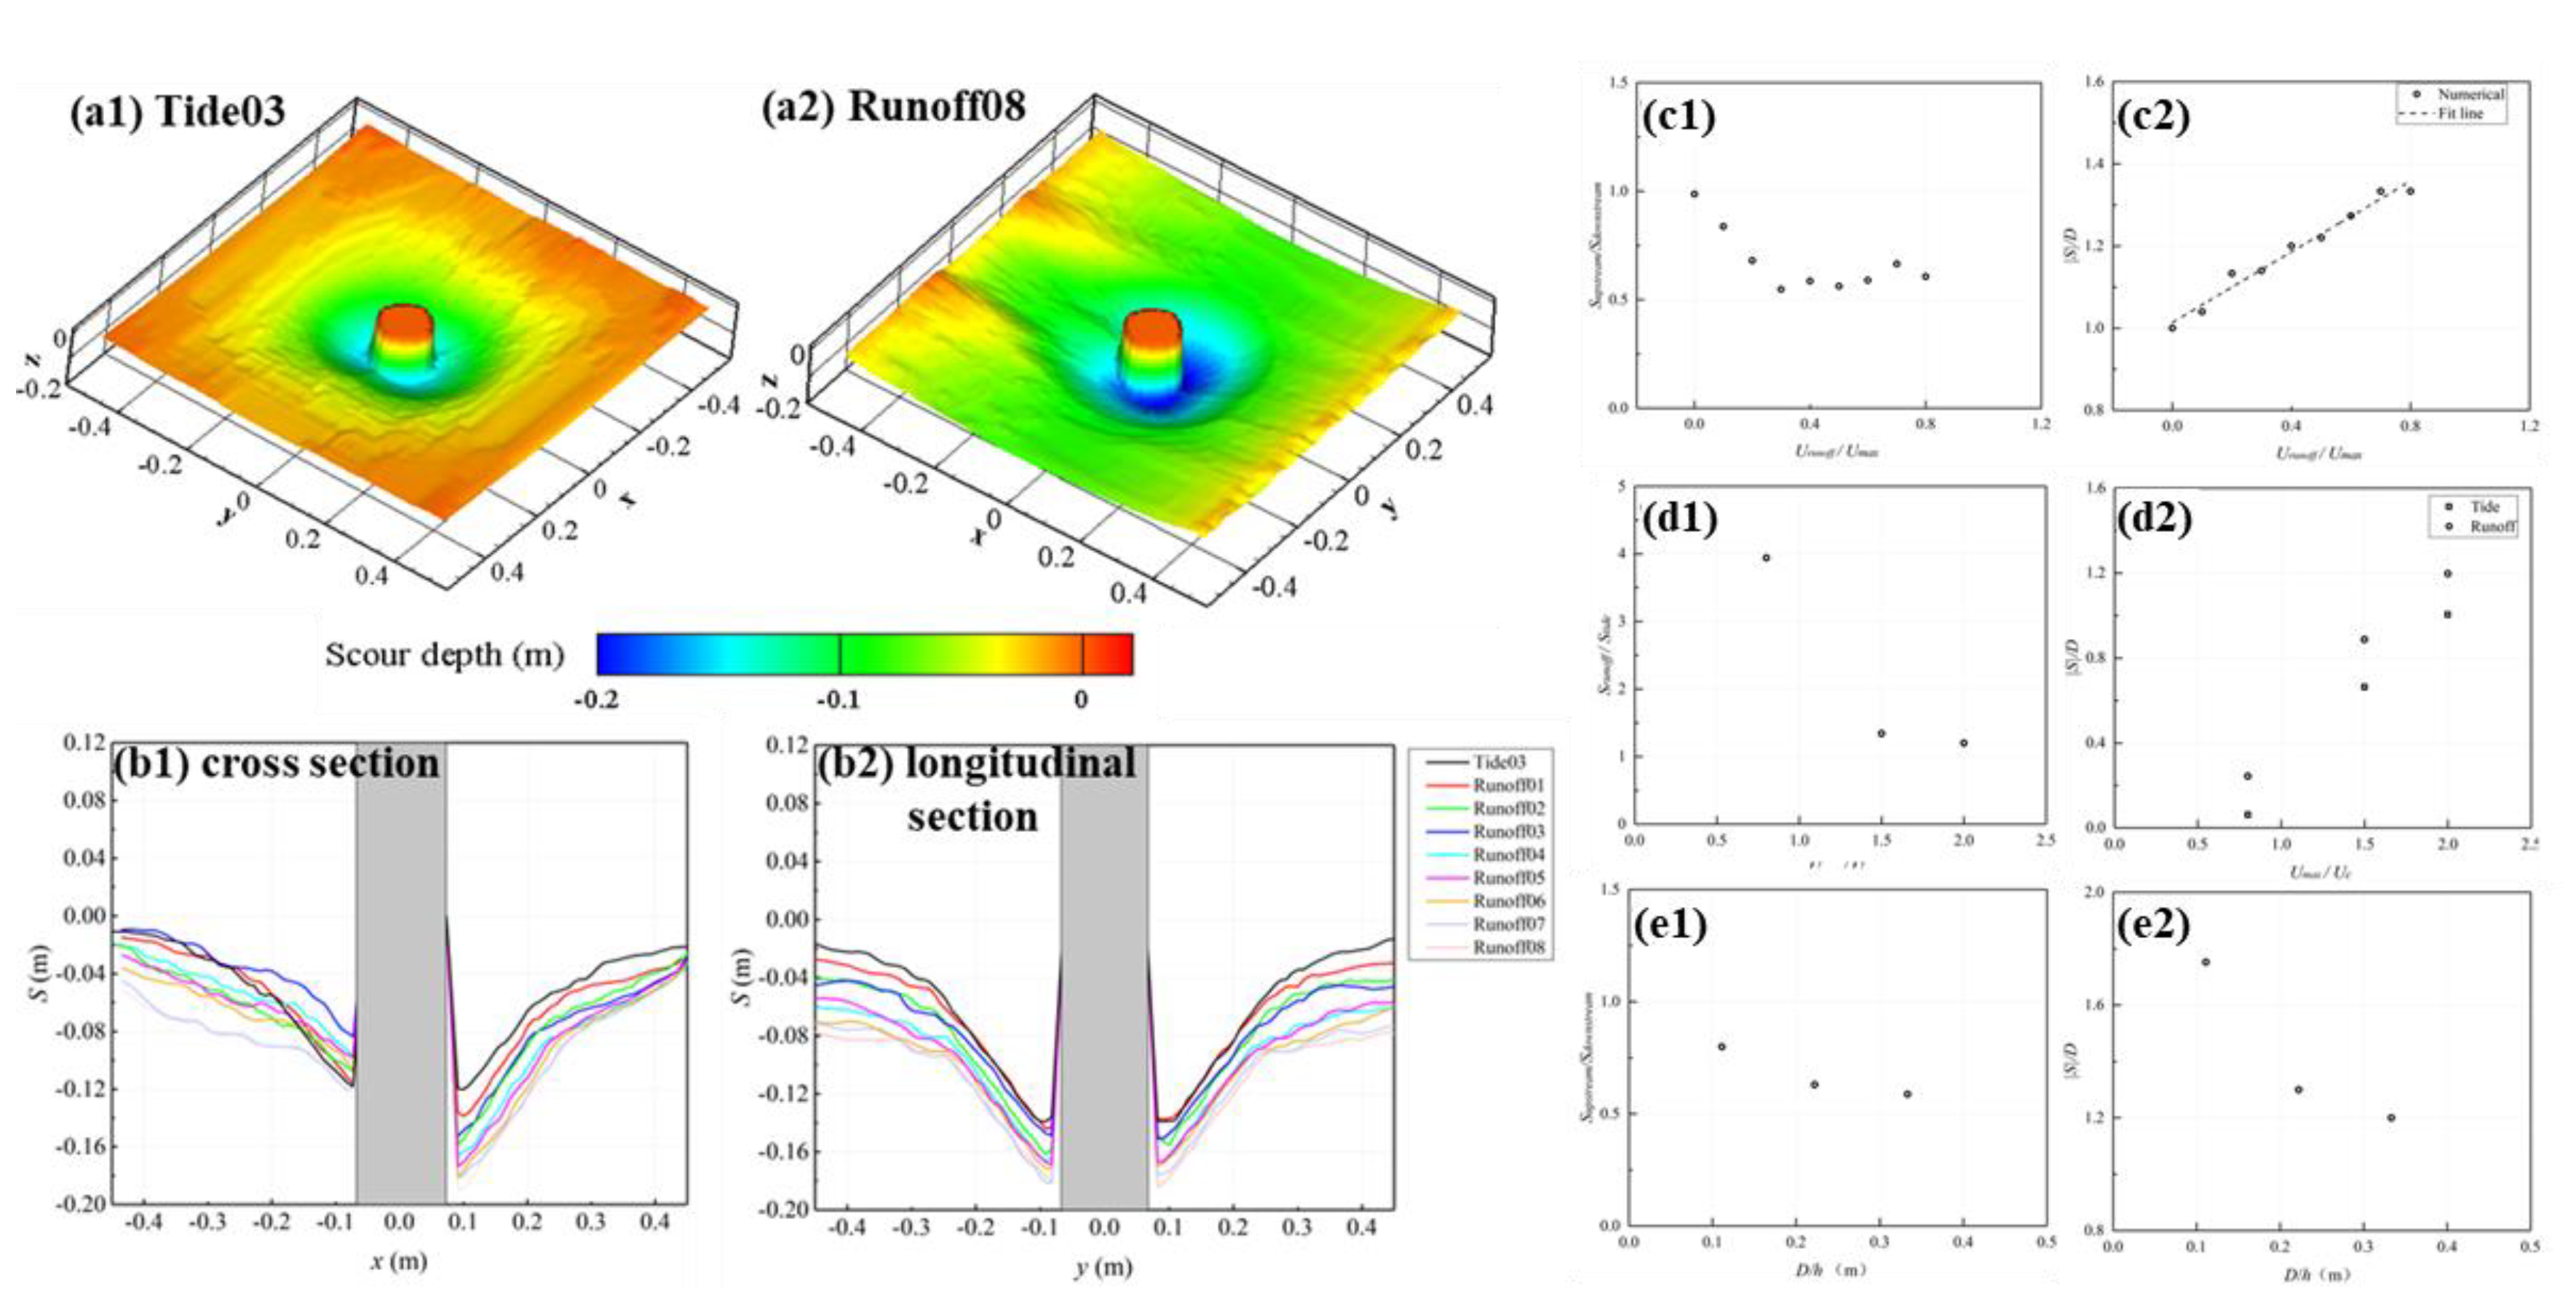
Scour profile. When the river flow intensity Uuni/Umax reaches 0.8 (Runoff08), the longitudinal reverse flow deepens the depth of the river side of the cylinder, while the cross section of scour hole expands to the tide side. The scour hole is symmetrical around the flow direction, and the depth of the scour hole is larger than that in Tide01. The maximum scour depth is 1.3 times that in Tide01 (tide condition).
The scour profiles illustrate the detailed differences in scour hole morphology due to river flow intensities (Figure 8(b1,b2)). In the tide–river-coupled condition, the duration of the reverse flow is prolonged and the ratio of the forward and reverse duration is reduced, leading to a reverse-flow-dominant scour. The characteristics of the tidal flow decreases, the river-side scour depth increases, and the tide-side scour depth decreases. The cross and longitudinal sections in Tide01 are mostly symmetric, and the ratio of the scour depth between the tide side and the river side Stideside/Sriverside is 0.99 after four periods. With the increase of river flow intensity, the symmetry of cross sections decreases gradually while the longitudinal sections remain symmetric. The Stideside/Sriverside of Runoff08 is 0.6. The scour depth in the tide side/river side is shallower/deeper than that in Tide01, while the scour depth of the left and right sides of the cylinder is smaller. The coupling of river flows and tidal currents changes the scour hole symmetry along the flow direction, while the scour hole is still symmetric in the cross-flow direction.
The scour hole asymmetry varies with river flow intensities (Figure 8(c1)). If only tide is considered (Tide01, Uuni/Umax = 0), the cross section is almost symmetric, with a ratio of scour depth on the tide and river sides of 0.998. When the river flow intensity is 0 < Uuni/Umax ≤ 0.3, the Stideside/Sriverside gradually decreases with the increase of river flow intensity, and the symmetry of the scour hole gradually decreases. When the river flow intensity is 0.3 < Uuni/Umax < 1, the Stideside/Sriverside remains at about 0.6. The symmetry of the tide side and river side of the scour hole is gradually stable and is no longer affected by the intensity of river flow. Therefore, in regions where the river flow intensity (Uuni/Umax) exceeds 0.3, it is necessary to give priority to strengthening the protection on the river side of the pile foundation.
The relative scour depth increases with the increase of river flow intensity (Figure 8(c2)). The relationship between the relative scour depth and river flow intensity under the movable-bed condition (Umax/Uc > 1) is as follows:
|S|/D = 0.4306(Uuni/Umax) + 1.0137 (0 < Uuni/Umax < 1)
where |S| is the absolute value of the maximum scour depth, D is the diameter of the cylinder, Uuni is the river flow velocity, and Umax is the peak forward flow velocity of the tidal currents. The coefficient is R2 = 0.98, indicating a high correlation between the relative scour depth and the river flow intensity. When the river flow intensity is less than 1, the relative scour depth increases linearly with the increase of river flow intensity.

4.2. Influence of Peak Tidal Currents

Test group 3 is used to test the influence of peak flow velocities on bed scour (Section 2.4, Table 2).
(1)
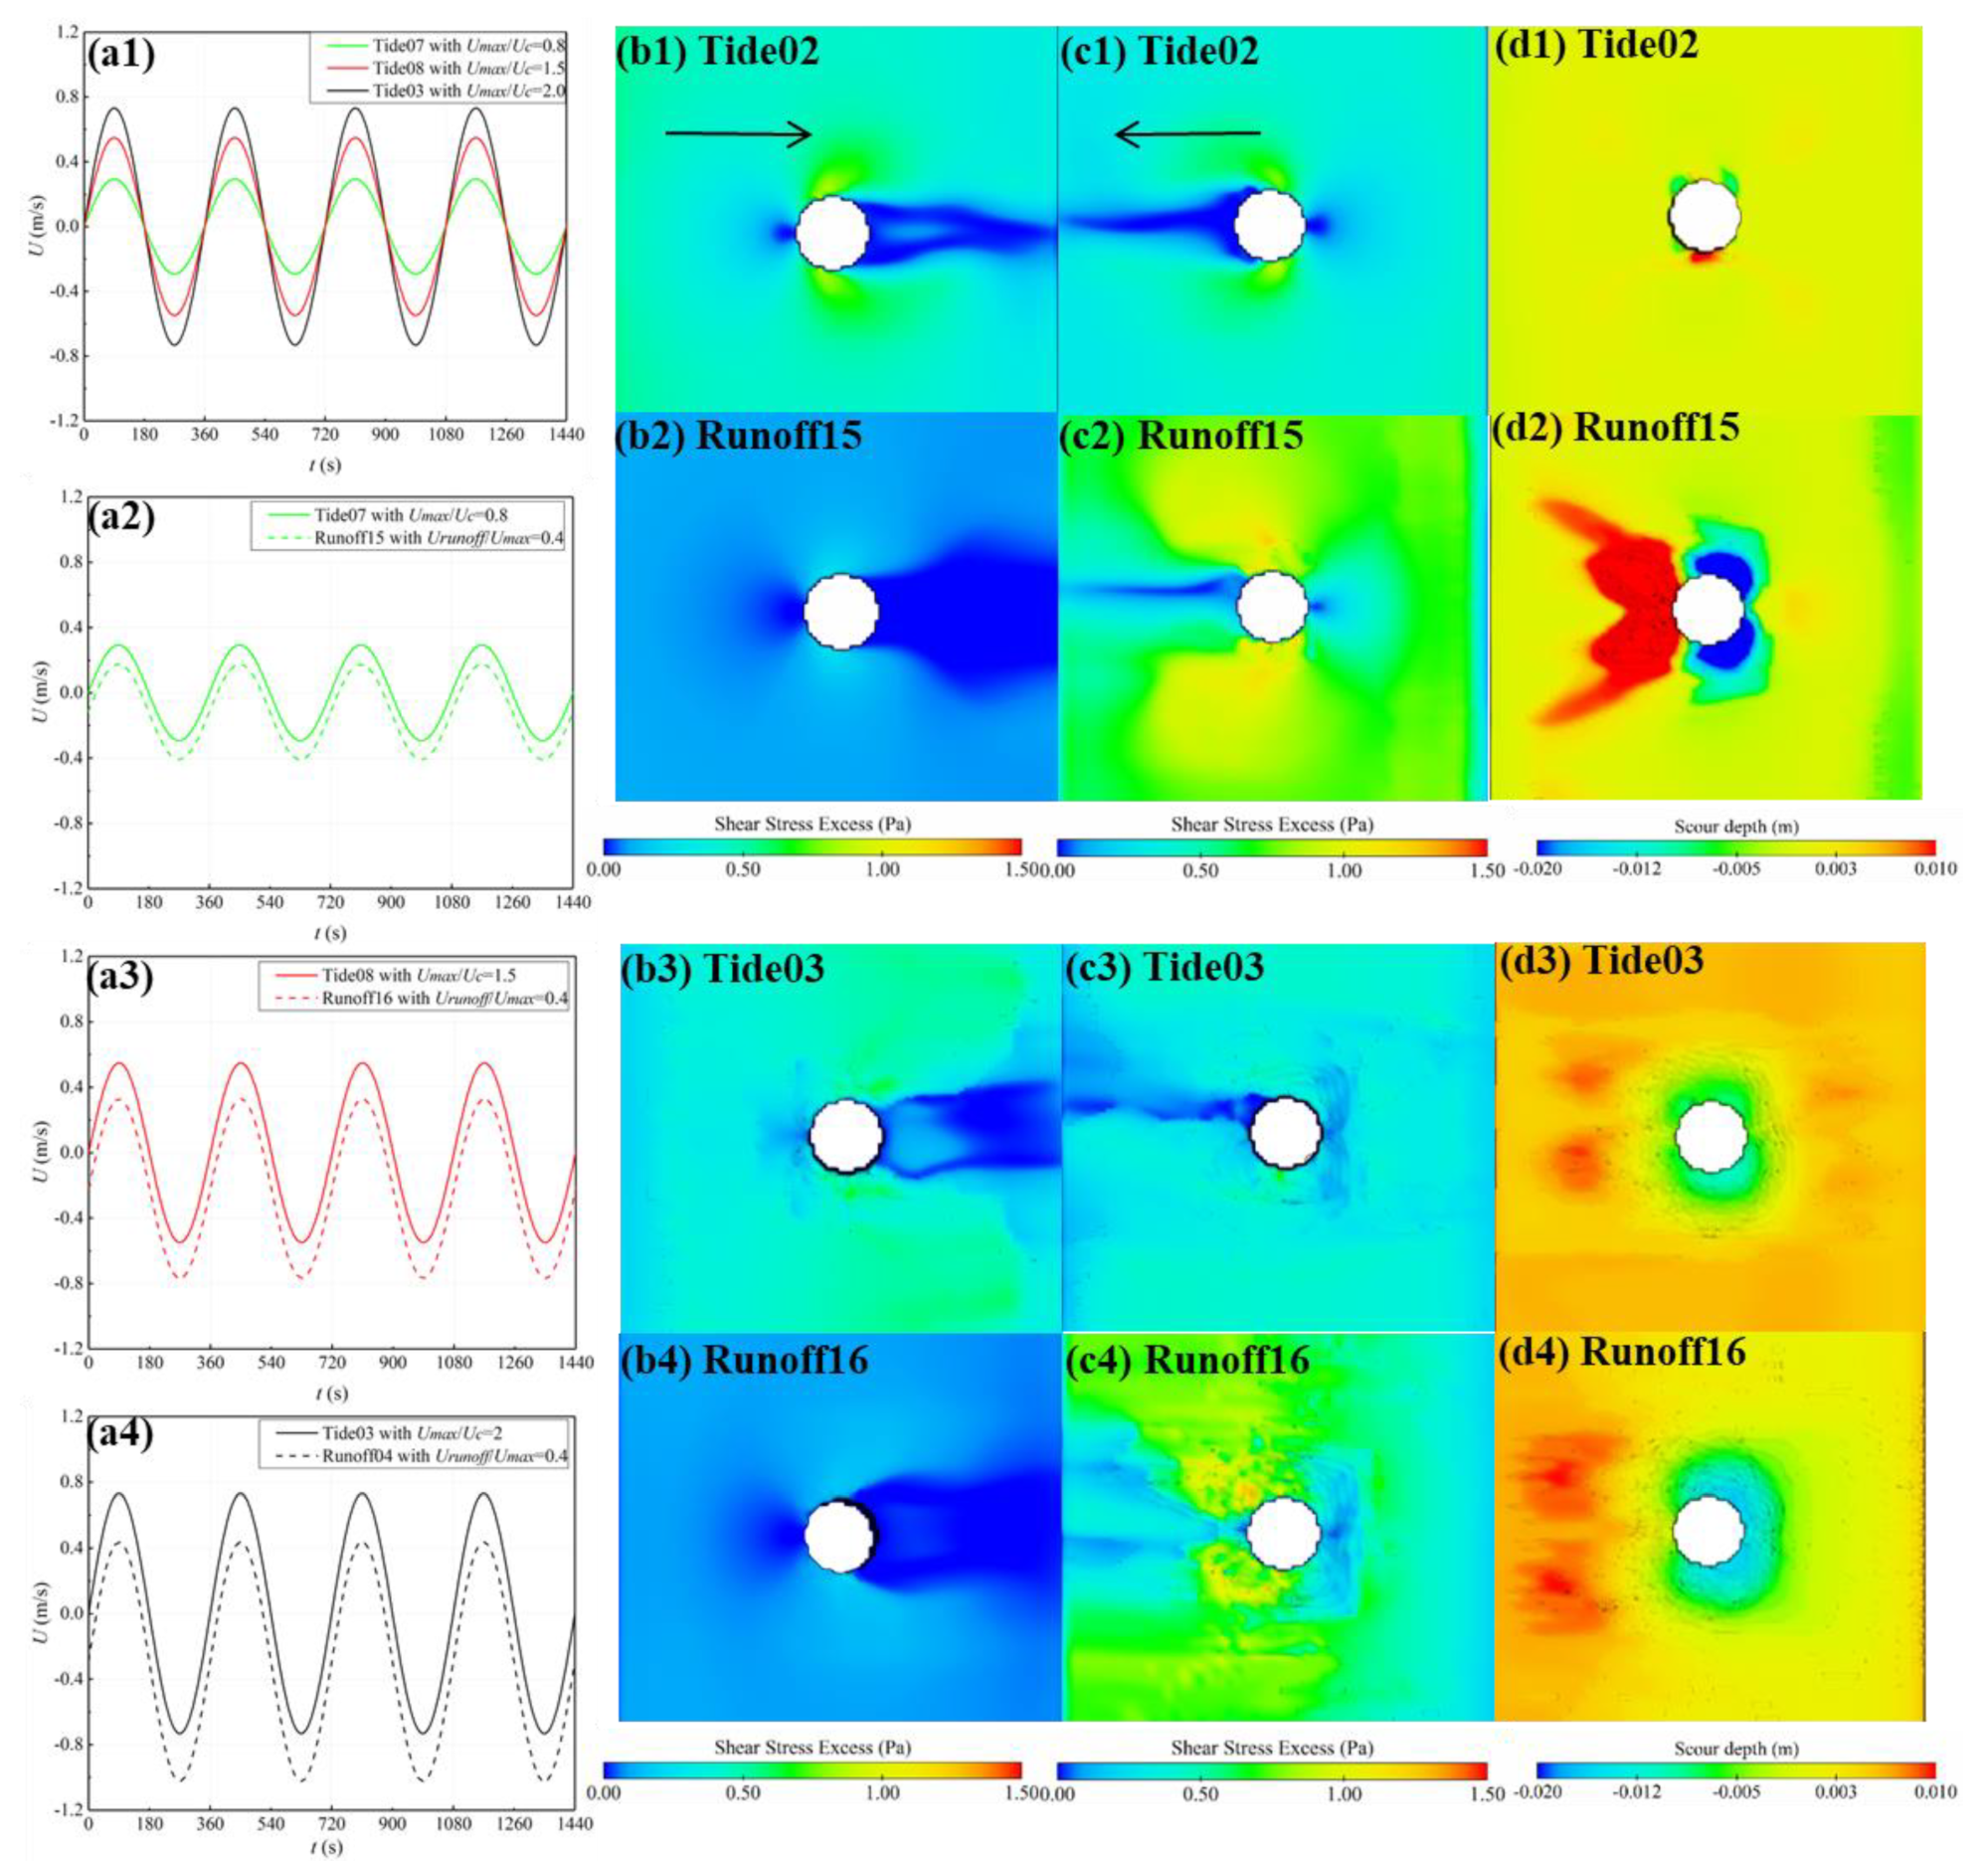
SSE. The SSE under the movable-bed condition (Tide03) is consistent with that under the fixed-bed condition (Tide02) (Figure 9(b1–b4)). At t = T/4, each test (Tide02, Runoff15, Tide03, Runoff16) is at peak flow velocity. The mean SSE near the Tide02 cylinder is about 0.75 Pa, but after coupled river flow, the forward flow velocity decreases, the SSE in Runoff15 is close to zero, and the maximum value is only 0.25 Pa. With the increase of peak flow velocity, the SSE near the cylinder increases; the SSE in Tide03 is largely greater than that in Tide02. The maximum SSE in Tide03 is 3 Pa and the maximum SSE in Runoff16 is 1.5 Pa.
After the flow reverses (ebb tide), the SSE in the tide–river-coupled condition exceeds that in the tide condition (Figure 9(c1–c4)). The maximum SSE in Runoff15 is about 1.25 Pa, which is nearly three times that in Tide02. The sediment carrying capacity in Runoff15 is much greater than that in Tide02, subsequently. Similarly, in movable-bed conditions, the SSE under the coupling condition also increases with the increased reverse flow velocity, and the mean SSE in Runoff16 is about twice that in Tide03. The increased range of SSE in the fixed-bed condition is greater than that in the movable-bed condition.
(2)
Scour hole morphology. After four periods, the scour depth and range in Runoff15 are both larger than those in Tide02, which is consistent with the distribution trend of SSE around the cylinder. The main reason is that under the original forward flow, the scour effect in Tide02 on the tide side of the cylinder is relatively weak. After coupling with river flow, the forward flow decreases again, further reducing the scour effect on the tide side, making the scour effect negligible. As a result, the scour process is predominantly controlled by the reverse flow, which causes concentrated scour on the river side of the cylinder. In this case, the scour pattern in Runoff15 is characterized by tide-side deposition and river-side scour, and the symmetry between the tide-side and river-side scour holes is lost due to the reversal of flow. In contrast, under the movable-bed condition, the symmetry of the Tide03 scour hole remains intact. However, after coupling with river flow, the symmetry of the scour hole of the Runoff16 cylinder decreases, showing that the scour is shallower on the tide side and deeper on the river side. This behavior is consistent with the scour pattern observed under the coupled condition described above.
(3)
Maximum sour depth. Scour depth increases with the peak flow velocity (Figure 9(d1–d4)). Different scour depths and processes occur under fixed-bed and movable-bed conditions (Figure 7b). Due to the relatively short effective scour time in Tide02, the maximum scour depth in Tide03 (movable-bed) is 10.8 times greater than that in Tide02 (fixed-bed). In the same movable-bed condition, the scour effects in Tide01 and Tide03 are similar, with the maximum scour depth in Tide01 (Umax/Uc = 2) being 1.5 times that in Tide03. The scour depth after the first period in Tide02 (fixed-bed) reaches 90% of its maximum value in the four periods. From the second period onwards, the scour process gradually stabilizes, with a slow increase in scour depth. The scour depth in Tide03 (movable-bed) after the first period is only 51.2% of its maximum value, and the scour depth continues to increase during the subsequent three periods.
In Tide02 under movable-bed scour conditions (Runoff15), after coupled river flow, the scour depth increases greatly, and the maximum scour depth in Runoff15 is 3.94 times that in Tide02 (Figure 7b). For Tide01 and Tide03 under movable-bed conditions, the scour growth rate of reciprocating tidal current coupled with river flow is much smaller than that under fixed-bed conditions. The maximum scour depth in Runoff16 is 1.34 times that in Tide03, and the maximum scour depth in Runoff04 is 1.2 times that in Tide01.
The scour depth of tidal current alone (Tide02, Tide03, Tide01) is smaller than that of tidal current coupled with river flow (Runoff15, Runoff16, Runoff04) (Figure 8(d1)). The scour depth of both increases linearly with the increase of peak velocity, and the growth gradient is basically equal. The growth rate of the relative scour depth is greater than that of peak velocity. The ordinate is the ratio of the scour depth under the coupling condition to the scour depth in Test01 (tide condition) (Figure 8(d2)). Under the fixed-bed condition, the effect of river flow on the scour of the tidal current is more obvious, and the scour depth of the coupled flow increases more than that of the tidal current alone. With the increase of the peak flow velocity, when the movable-bed condition is reached, the promoting effect gradually decreases, and the scour depth of the two gradually approaches, indicating that the effect of river flow on the scour of the tidal current gradually decreases with the increase of the peak flow velocity.

4.3. Influence of Cylinder Diameters

(1)
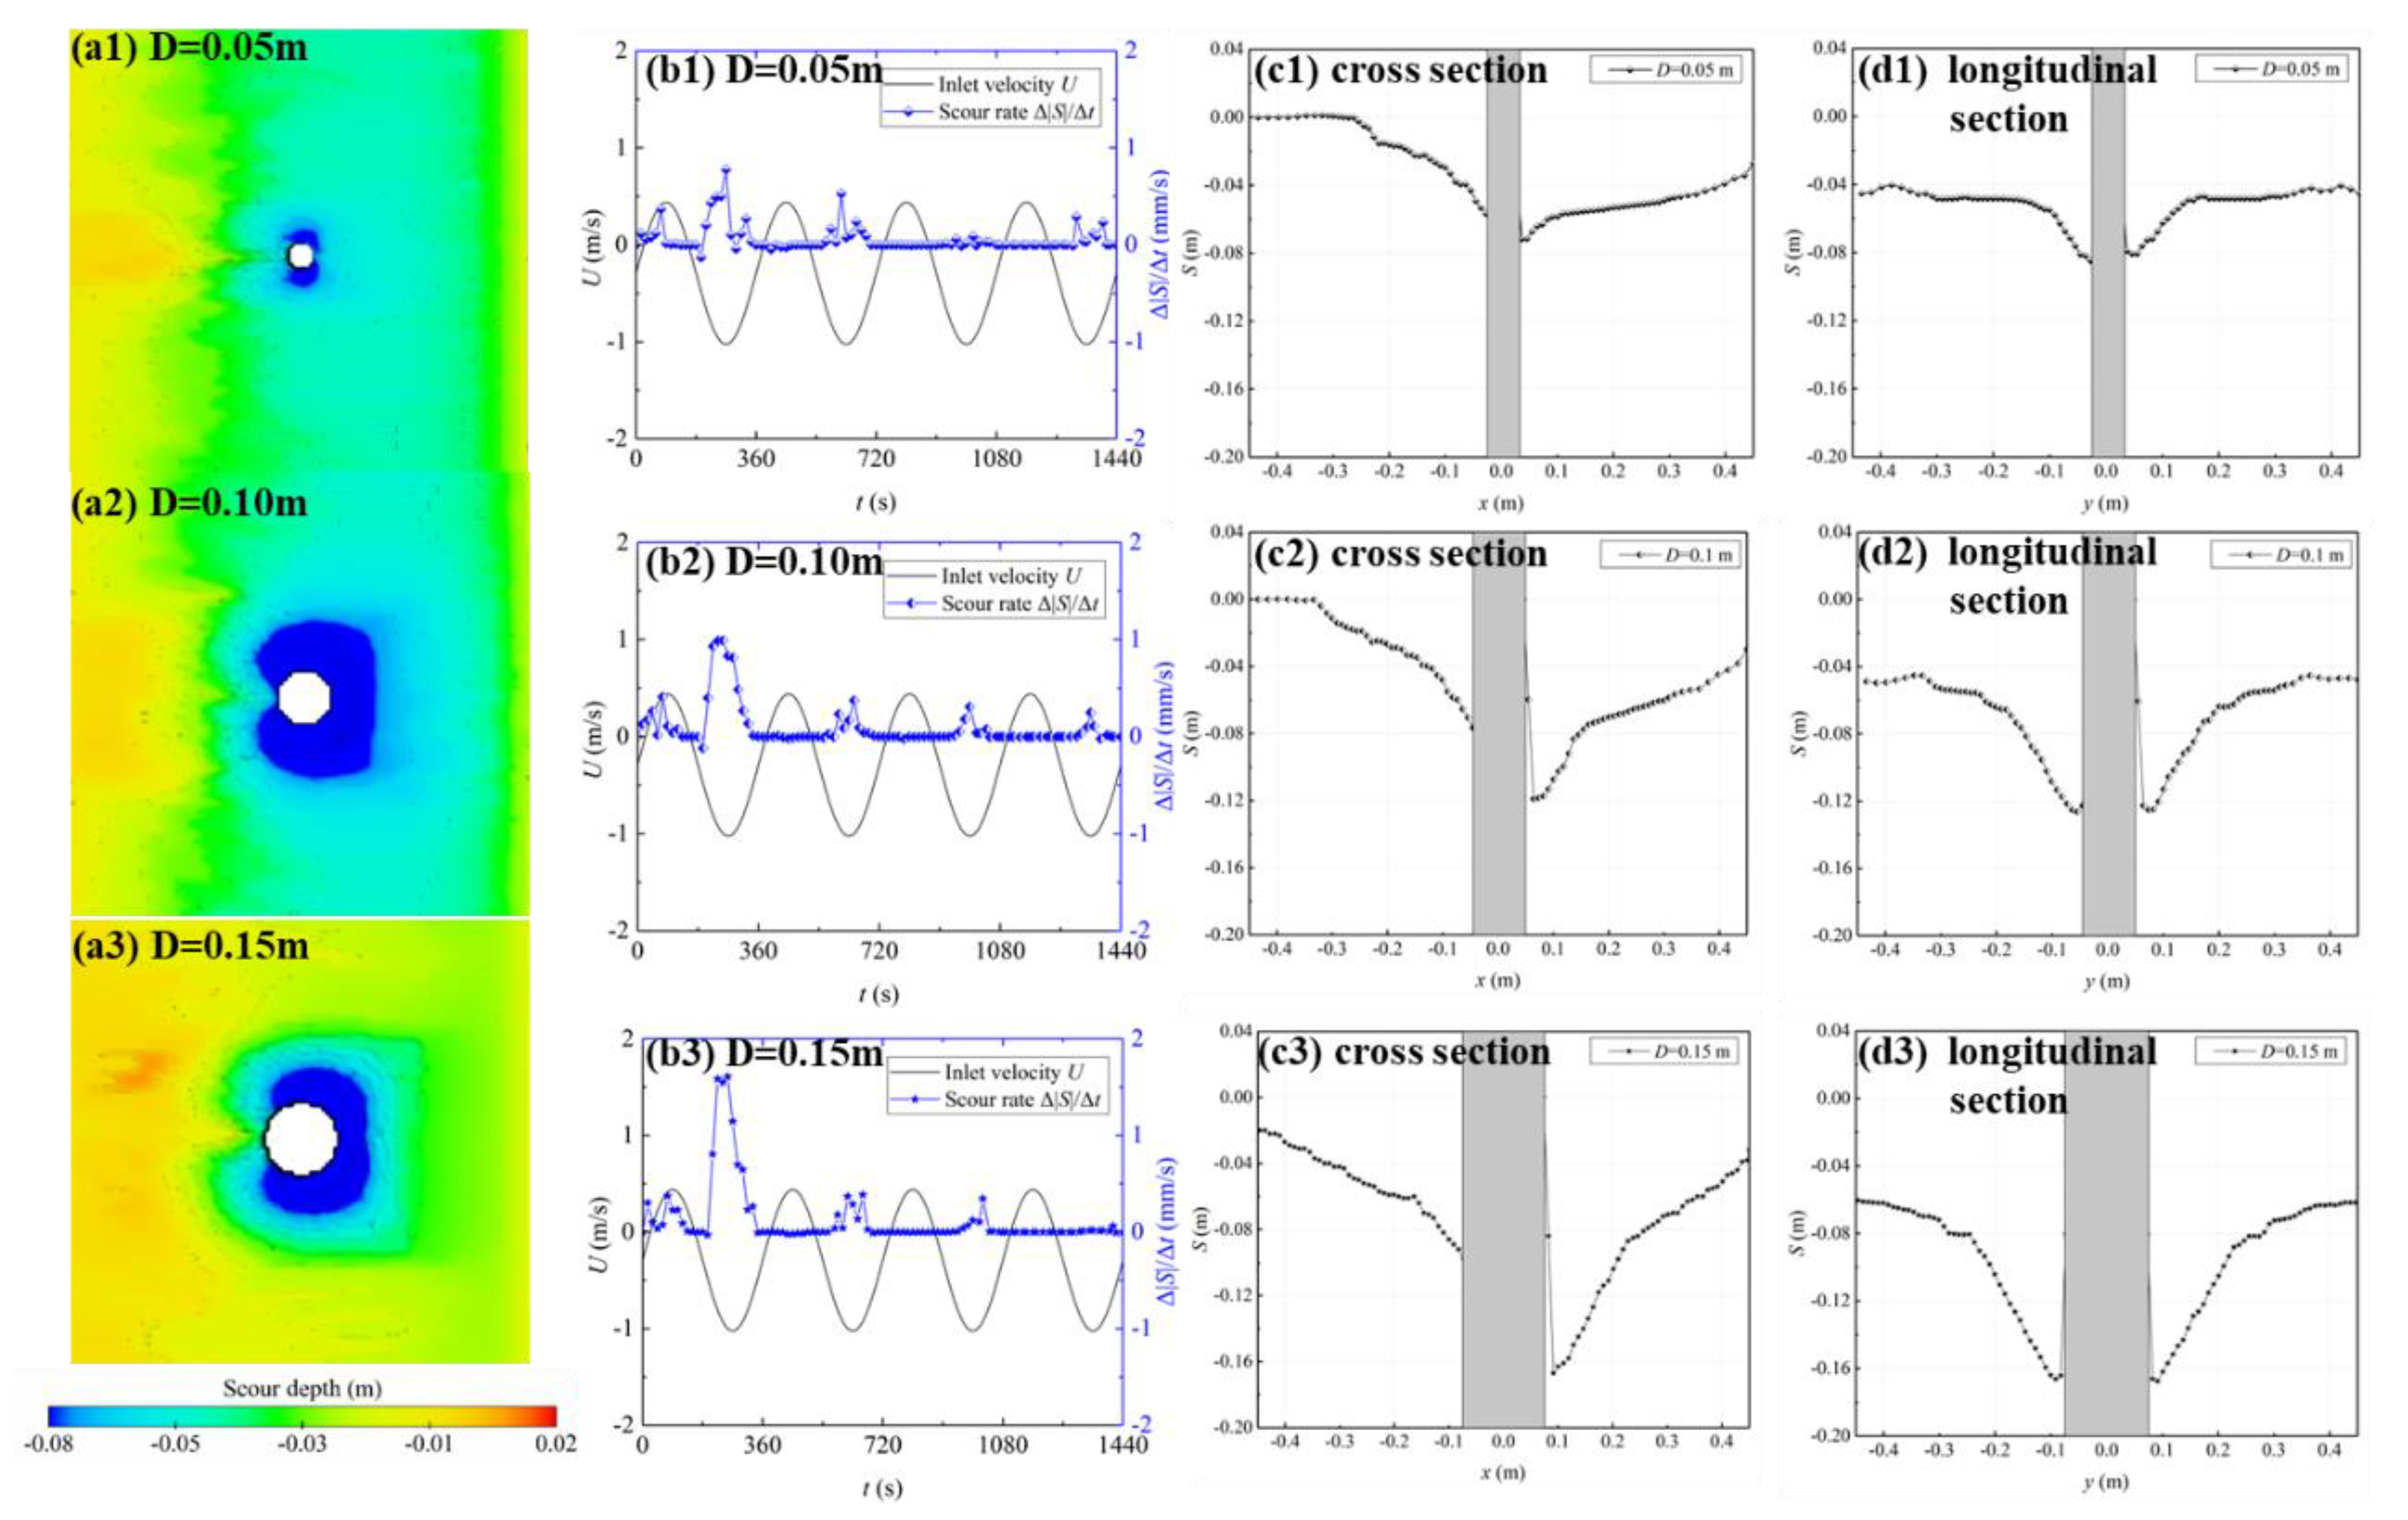
Scour hole morphology. Previous studies have shown that the small diameter cylinder is more likely to produce vorticity than the large diameter cylinder, the vorticity is larger, and the sediment carrying capacity of the flow is improved. Under the coupling effect of river flow and tidal current, cylindrical scour holes with different diameters form a symmetrical pattern with respect to the flow direction (Figure 10(a1–a3)). When the diameter is small (D = 0.05 m), the scour is concentrated on the left and right sides of the cylinder, and the scour depth on the tide side and river sides of the cylinder is small. As the diameter of the cylinder increases, scour is gradually concentrated on the river side of the cylinder. The scour process trend of the three diameters is basically the same, the time at the plateau period is the same, and the inflection point of the scour depth duration line after the flow reverses is the same. Additionally, the maximum scour depth and scour rate increase with the increase in the cylinder diameter (Figure 7c). The scour rate of the first half of the period is relatively small, and the scour rate increases abruptly after the flow reverses; the maximum scour rate of the second half of the period is the maximum of the four periods; and the scour rate gradually decreases after the first period, and the negative scour rate only exists in the first period (Figure 10(b1–b3)), indicating that the backfill in the last three periods is relatively weak. The main reason is that the superposition effect of reverse river flow is more prominent.
(2)
Scour profile. The longitudinal section of the scour hole is basically symmetrical in the x-axis, while the cross section shows an asymmetric distribution of the shallow tide side and deep river side, which is consistent with the results above (Figure 10(c1–c3,d1–d3)). The Stideside/Sriverside decreases as the diameter of the river side cylinder increases (Figure 8(e1)), indicating that under the condition of the same river flow intensity, the scour depth of tide-side and river-side scour holes with larger diameters are more asymmetric. The large-diameter cylinder is more sensitive to the coupling effect of river flow and tidal current. It shows that the scour pattern is greatly affected by the cylinder size. The relative scour depth decreases with the increase in the diameter of the cylinder (Figure 8(e2)). This trend is consistent with the research results of Ettma (2006) [33] on unidirectional flow scour; that is, when the incoming flow conditions are the same, the relative scour depth becomes shallow with the increase in the diameter. Therefore, the influence of the cylinder size on the scour depth coupled with reciprocating tidal current and river flow is consistent with the trend of unidirectional flow. For practical engineering applications such as bridge piers and wind turbines, the pile diameter should be designed as small as possible under the premise of ensuring the strength of the pile foundation.

4.4. Influence of Tidal Periods

Four tests in group 5 are used to test the influence of tidal periods on scour characteristics (Section 2.4, Table 2, Figure 11(c1)). With the extension of the period, the change rate of flow velocity gradually decreases (Figure 11(c2)). The scour hole morphology and scour range are similar in the four numerical tests (Runoff04, 360 s; Runoff09, 540 s; Runoff10, 720 s; Runoff11, 960 s; Figure 11(a1–a4)). The tidal period has little influence on the scour pattern.
(1)
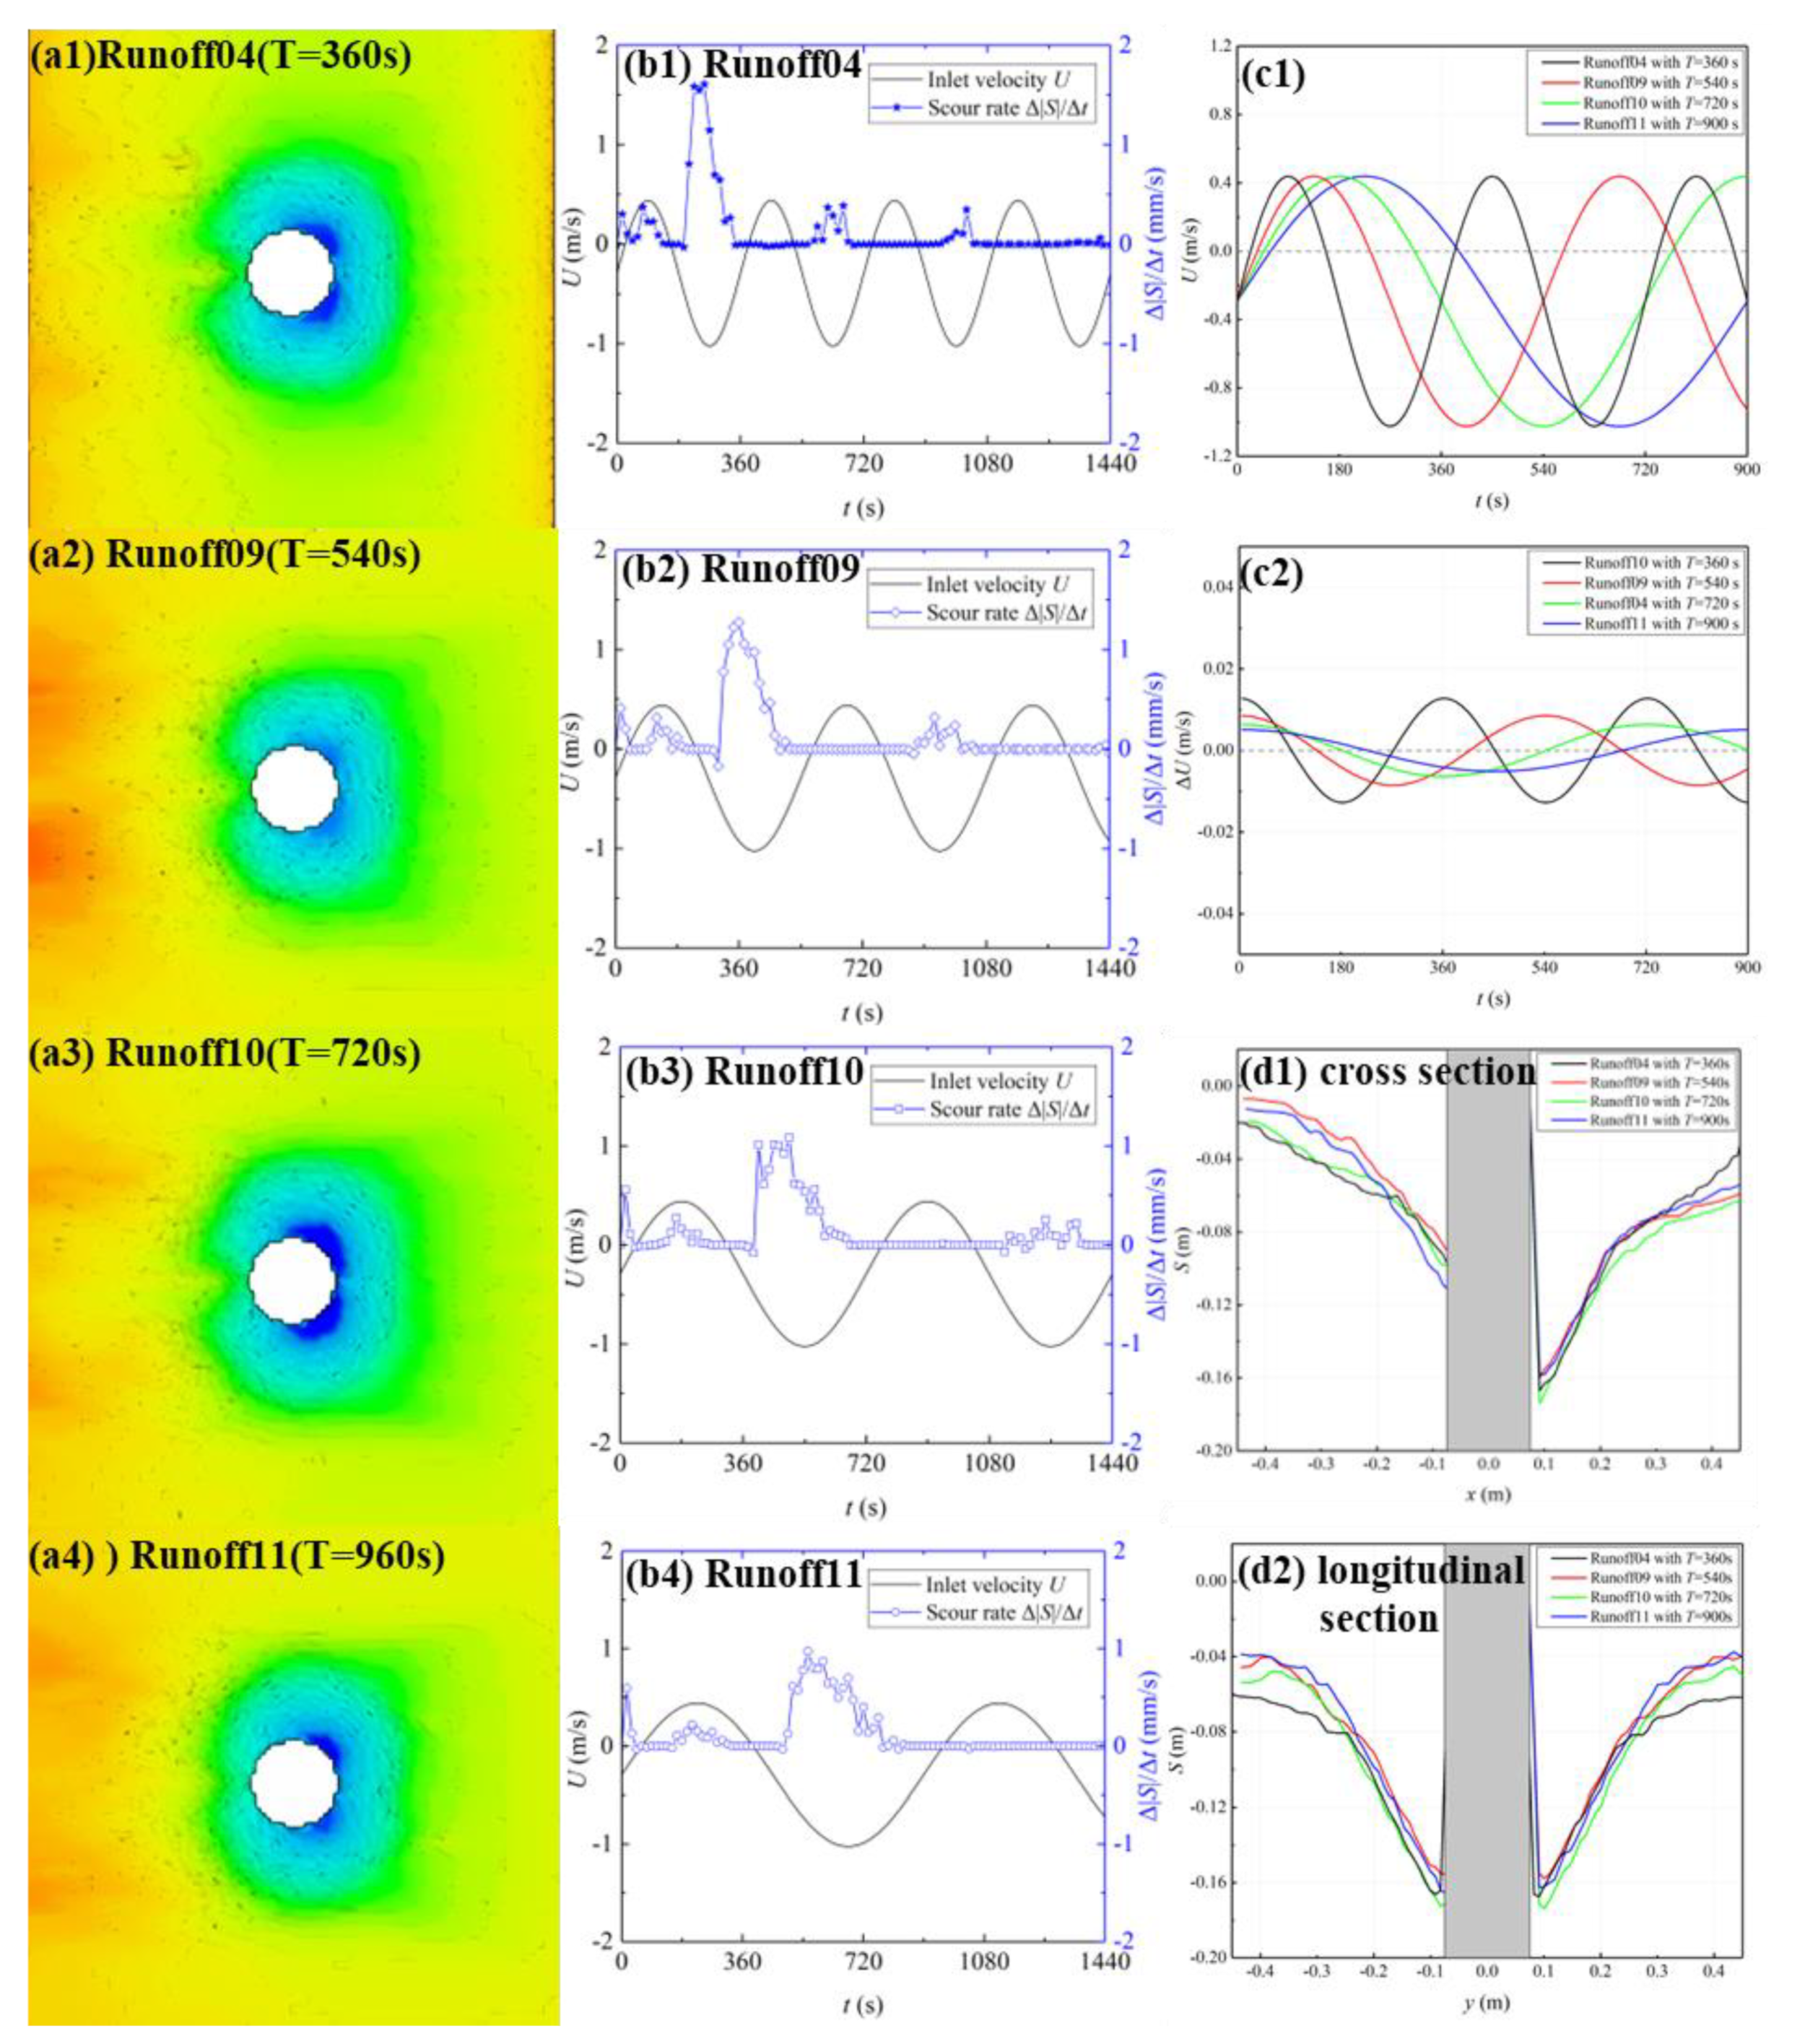
Scour hole morphology. Under the four different tidal period conditions, the morphology and scope of the scour holes are quite similar (Figure 11(a1–a4)). The scour depth on the river side is relatively large, while that in the tide side is relatively small. The longitudinal section is basically symmetrical in the x-axis (Figure 11(d1–d2)). Due to the coupling with river flow, the cross section shows an asymmetric shape with a shallower tide side and a deeper river side. Overall, the tidal period has little influence on the scour morphology under the coupling condition.
(2)
Maximum scour depth. The locations of the inflection points are in ascending order with the increased tidal periods (Runoff04, Runoff09, Runoff10, and Runoff11). The tidal periods mainly influence the scour process; the longer the tidal period, the slower the scour develops and the longer the scour plateau period forms after the flow reverses. After 1440 s (four tidal periods), the scour depths of the four tests are similar. Among them, the scour depth in Runoff10 is the largest, while that in Runoff09 is the smallest. The scour depth in Runoff09 is 9.25% lower than that in Runoff10. This indicates that the tidal period has little influence on the scour depth on the river–tide-coupled condition.
The scour rate reaches the maximum value after 0.5 tidal periods during the entire scouring process (each test), which is consistent with the variation trend of the maximum scour depth shown in Figure 7d (Figure 11(b1–b4)). The change rate of scour depth in Runoff04 is the highest (Figure 11(b1)). This is mainly because its flow velocity change rate is the highest. As the tidal period extends, the flow velocity change rate gradually decreases. While the flow velocity change rate decreases, the scour rate also drops. Among all the tests, the scour rate in Runoff11 is the minimum.

4.5. Limitations of Numerical Simulation

The hydrodynamic model in this study was simplified. The model uses a sine function to simulate tidal currents, ignoring the asymmetry of actual tides (such as differences between semi-diurnal and diurnal tides), which may lead to deviations in the prediction of scour periods. Additionally, the layered sediment characteristics of natural riverbeds were neglected, and field survey data should be incorporated for correction in practical applications.
The numerical model in this study has an average error of 6.7% compared with the experimental data of Schendel et al. (2018) [8]. The main sources of differences include the following:
Limitations of the turbulence model: The RNG k-ε model has lower simulation accuracy for near-wall vortices than Large Eddy Simulation (LES), potentially underestimating the shear stress in high-velocity gradient regions (such as the stagnation point at the front of the cylinder). In addition, the horseshoe vorticity at the leading edge of the pile foundation facing the flow is difficult to capture in numerical simulations, resulting in the simulated scour pit morphology tending to be butterfly-shaped, while the experimental one tends to be circular.
Simplification of sediment transport formulas: the model uses the Soulsby (1998) [30] formula to calculate the scour rate, ignoring inter-particle cohesion (such as in cohesive soils), which leads to deeper simulation results for sandy sediments.
Differences in boundary conditions: friction on the flume walls in experiments may cause velocity decay, while the numerical model uses a symmetry lateral boundary, overestimating the near-wall flow velocity.

5. Conclusions

A 3D numerical flow-sediment scour model was established using Flow-3D and well calibrated using the experimental results. The scour characteristics and mechanism of a cylinder under the influence of river flows and tidal currents were theoretically analyzed using numerical experiments. The conclusions are as follows:
(1)
In the tide conditions, the scour process around the cylinder shows periodic patterns driven by tidal flow. When only tidal currents are considered, the bed SSE and vorticity around the cylinder change with the forward flow velocity. They show periodic variations. As the flow velocity rises, both the shear stress and vorticity increase. After the flow reverses, the stress and vorticity fields reverse too, but with a time lag. Tidal currents cause a periodic scour. The scour hole deepens during periods of scour and deposition. The maximum scour depth moves around 45° on the tide and river sides of the cylinder, following the tidal flow.
(2)
The tide–river-coupling condition alters the scour pattern around the cylinder, with river flow intensity playing a crucial role in determining scour depth and distribution. In the tide–river-coupling condition, the forward flow velocity decreases, the reverse flow velocity increases, and the flood–ebb duration ratio decreases. Subsequently, more intense scour occurs on the river side of the cylinder compared with that on the tide side. When the river flow intensity satisfies 0 < Uuni/Umax ≤ 0.3, with the increase of the river flow intensity, the ratio of the scour depth on the tide side and river side of the circular cylinder (Stideside/Sriverside) gradually decreases. When the river flow intensity is in the range of 0.3 < Uuni/Umax < 1, the value of Stideside/Sriver side remains around 0.6. The scour depth around the cylinder increases with the river flow intensity. When the river flow intensity is in the range of 0.6 < Uuni/Umax < 1, the scour is completely dominated by the river flow. Under the movable-bed condition, the relationship between the relative scour depth and the river flow intensity is:
|S|/D = 0.4306(Uuni/Umax) + 1.0137 (0.6 < Uuni/Umax < 1).
(3)
In the tide–river-coupling scenario, river flow, peak tidal velocity, and cylinder diameter play larger roles in scour depth, while the tidal period has a smaller influence on scour depth. The relative scour depth has a positive linear correlation with the relative peak velocity. In the tide–river-coupling condition, the river flow has a greater influence on the fixed-bed scour than on the movable-bed scour. Under the fixed-bed condition, the ratio of the maximum scour depth between the tide–river-coupling condition and the tide-only condition reaches 3.94. In the coupling condition, the morphology of the scour hole varies with the cylinder diameter. The smaller the cylinder diameter, the closer the scour depths on the tide side and the river side are, the better the symmetry of the scour profiles is, and vice versa. As the relative diameter increases, the relative scour depth under the coupling condition gradually decreases. In addition, an increase in the tidal periods slows down the scour process and reduces the scour rate, but has little influence on scour depth.
(4)
The model does not account for wave action. In open coastal environments, wave–current coupling may increase the scour depth. Wave factors will be added in follow-up research. Furthermore, the Han Haiqian formula is widely used in engineering under pure tidal current scenarios, but in estuaries, it does not consider the factor of river flow. This study provides ideas and possibilities for the modification of the formula.

Author Contributions

Methodology, Y.X.; Validation, S.Y.; Formal analysis, S.W.; Writing—original draft, J.L.; Writing—review & editing, Y.X. and L.L. All authors have read and agreed to the published version of the manuscript.

Funding

This research was supported by the National Key Research and Development Program of China (2023YFC3008100, 2019FY202105), the National Natural Science Foundation of China (42476154), the Science and Technology Bureau of Zhoushan (2023C81006, 2023C03003), and the International Space Science Institute (ISSI) in Bern through ISSI International Team project #23-598, Coastal Resilience using satellites: CRESTE.

Data Availability Statement

Data are contained within the article.

Conflicts of Interest

The authors declare no conflict of interest.

References

  1. Melville, B.W.; Chiew, Y.M. Time scale for local scour at bridge piers. J. Hydraul. Eng. 1999, 125, 59–65. [Google Scholar] [CrossRef]
  2. Sheppard, D.M.; Odeh, M.; Glasser, T. Large Scale Clear-Water Local Pier Scour Experiments. J. Hydraul. Eng. 2004, 130, 957–963. [Google Scholar] [CrossRef]
  3. Link, O.; Castillo, C.; Pizarro, A.; Rojas, A.; Ettmer, B.; Escauriaza, C.; Manfreda, S. A model of bridge pier scour during flood waves. J. Hydraul. Res. 2017, 55, 310–323. [Google Scholar] [CrossRef]
  4. Guan, D.; Chiew, Y.-M.; Melville, B.W.; Zheng, J. Current-induced scour at monopile foundations subjected to lateral vibrations. Coast. Eng. 2019, 144, 15–21. [Google Scholar] [CrossRef]
  5. Wang, S.; Yang, S.; He, Z.; Li, L.; Xia, Y. Effect of inclination angles on the local scour around a submerged cylinder. Water 2020, 12, 2687. [Google Scholar] [CrossRef]
  6. Wang, C.; Yuan, Y.; Liang, F.; Tao, J. Experimental investigation of local scour around cylindrical pile foundations in a double-layered sediment under current flow. Ocean Eng. 2022, 251, 111084. [Google Scholar] [CrossRef]
  7. Han, Y.; Chen, Z. Experimental study on local scouring around bridge piers in tidal current. Ocean Eng. 2004, 18, 669–676. [Google Scholar]
  8. Schendel, A.; Hildebrandt, A.; Goseberg, N.; Schlurmann, T. Processes and evolution of scour around a monopile induced by tidal currents. Coast. Eng. 2018, 139, 65–84. [Google Scholar] [CrossRef]
  9. Shi-Yang, Y.; Xia, Y.Z.; Wang, S.H. Local scour around a monopile in reciprocating tidal current considering the effect of water depth. J. Phys. Conf. Ser. 2021, 1834, 012019. [Google Scholar] [CrossRef]
  10. Sumer, B.M.; Christiansen, N.; Fredsoe, J. Time scale of scour around a vertical pile. In Proceedings of the ISOPE International Ocean and Polar Engineering Conference, ISOPE 1992, San Francisco, CA, USA, 14–19 June 1992. ISOPE-I-92-259. [Google Scholar]
  11. Sumer, B.M.; Fredsøe, J. Scour around pile in combined waves and current. J. Hydraul. Eng. 2001, 127, 403–411. [Google Scholar] [CrossRef]
  12. Stahlmann, A. Numerical and experimental modeling of scour at foundation structures for offshore wind turbines. In Proceedings of the ISOPE International Ocean and Polar Engineering Conference, ISOPE, Anchorage, AL, USA, 30 June–5 July 2013. ISOPE-I-13-031. [Google Scholar]
  13. Guan, D.W.; Xie, Y.X.; Chiew, Y.M.; Ding, F.; Ferradosa, T.F.; Hong, J. Estimation of local scour around monopile foundations for offshore structures using machine learning model. Ocean Eng. 2024, 296, 116951. [Google Scholar] [CrossRef]
  14. Richardson, E.V.; Davis, S.R. Evaluating Scour at Bridges, 5th ed.; Hydraulic Engineering Circular No.18. Publication No. Fhwa-Hif-12-003; Federal Highway Administration (U.S. Department of Transportation): Washington, DC, USA, 2012. [Google Scholar]
  15. Peng, K.; Wen, Z. Research on local initialized test of pile groups under the action of tidal current. Chin. J. Railw. Sci. Eng. 2012, 9, 105–109. [Google Scholar]
  16. Nakagqwa, H.; Suzuki, K. Local scour around bridge pier in tidal current. Coast. Eng. Jpn. 1976, 19, 125–129. [Google Scholar]
  17. Li, M. Research on Local Initialization of Bridge Piers Under the Action of Tidal Current. Master’s Thesis, Tianjin University, Tianjin, China, 2012. [Google Scholar]
  18. Porter, K.E.; Simons, R.R.; Harris, J.M. Laboratory investigation of scour development through a spring-neap tidal cycle. In Proceedings of the 7th International Conference on Scour and Erosion, Perth, Australia, 2–4 December 2014. [Google Scholar]
  19. Yao, W.; An, H.; Draper, S.; Cheng, L.; Zhao, M.; Jesudoss, J.S.; Tang, G. Experimental study of local scour around piles in tidal current. In Proceedings of the 20th Australasian Fluid Mechanics Conference, Perth, Australia, 5–8 December 2016. [Google Scholar]
  20. Wang, S.-Y.; Qi, W.-G.; Li, B.; Wang, C.; Gao, F.-P. Tidal currents-induced scour development around pile foundations: Effects of flow velocity hydrograph. Coast. Eng. 2024, 191, 104533. [Google Scholar] [CrossRef]
  21. Jones, J.S.; Sheppard, D.M. Scour at wide bridge piers. In Building Partnerships; American Society of Civil Engineers: Reston, VA, USA, 2000; pp. 1–10. [Google Scholar]
  22. Han, H. Research on Local Initialization of Bridge Piers Under the Action of Tidal Current. Master’s Thesis, Zhejiang University, Hangzhou, China, 2006. [Google Scholar]
  23. Lu, Z.; Gao, Z.; Huang, J.; Han, X.; Liu, J. Local scour of pier foundation of Sutong Yangtze River Highway Bridge. In Proceedings of the 15th China Ocean (Coastal) Engineering Academic Symposium (Part 2), Taiyuan, China, 3–6 August 2011. [Google Scholar]
  24. Keshtpoor, M.; Puleo, J.A.; Shi, F.; Ma, G. 3D numerical simulation of turbulence and sediment transport within a tidal inlet. Coast. Eng. 2015, 96, 13–26. [Google Scholar] [CrossRef]
  25. Xu, W.; Wang, F.; Jia, H.; Yang, Y. Simulation of submarine pipeline initialization under reciprocating flow. Sediment Res. 2017, 42, 36–41. [Google Scholar]
  26. Ma, L. Experimental Study on Local Initialized Evolution Characteristics of Pile Foundations for Cross-Sea Bridges. Ph.D. Thesis, Zhejiang University, Hangzhou, China, 2018. [Google Scholar]
  27. Zhang, Q.; Zhou, X.L.; Wang, J.H. Numerical investigation of local scour around three adjacent piles with different arrangements under current. Ocean Eng. 2017, 142, 625–638. [Google Scholar] [CrossRef]
  28. Bradbrook, K.F.; Lane, S.N.; Richards, K.S.; Biron, P.M.; Roy, A.G. Role of bed discordance at asymmetrical river confluences. J. Hydraul. Eng. 2001, 127, 351–368. [Google Scholar] [CrossRef]
  29. Salaheldin, T.M.; Imran, J.; Chaudhry, M.H. Numerical modeling of three-dimensional flow field around circular piers. J. Hydraul. Eng. 2004, 130, 91–100. [Google Scholar] [CrossRef]
  30. Soulsby, R. Dynamics of Marine Sands; Thomas Telford Publications: London, UK, 1998. [Google Scholar]
  31. Mastbergen, D.R.; Van Den Berg, J.H. Breaching in fine sands and the generation of sustained turbidity currents in submarine canyons. Sedimentology 2003, 50, 625–637. [Google Scholar] [CrossRef]
  32. Chang, W.Y.; Lai, J.S.; Yen, C.L. Evolution of Scour Depth at Circular Bridge Piers. J. Hydraul. Eng. 2004, 130, 905–913. [Google Scholar] [CrossRef]
  33. Ettema, R.; Kirkil, G.; Muste, M. Similitude of large-scale turbulence in experiments on local scour at cylinders. J. Hydraul. Eng. 2006, 132, 33–40. [Google Scholar] [CrossRef]
Figure 1. Comparison of (ad) velocity, (e) maximum scour depth, and (f) scour depths with different grids.
Jmse 13 01114 g001
Figure 2. Model setup diagram (Unit: m): (a) Numerical flume. (b) Compute domain grids. (c) Boundary conditions. (d1,d2) Local grids.
Jmse 13 01114 g002
Figure 3. Near bed (a1a4) velocity in x direction, (b1b4) SSE in x direction, and (c1c4) vorticity in the z direction around the cylinder (Tide01).
Jmse 13 01114 g003
Figure 4. Peak values of SSE around a cylinder in each period.
Jmse 13 01114 g004
Figure 5. (a1a4) Scour around the cylinder, (b1b4) scour hole profile, (c1,c2) maximum scour depth and scour rate, and (c3) scour curve at different positions in Tide01.
Jmse 13 01114 g005
Figure 6. (a1a4) Bottom SSE at t = T/4; (b1b4) bottom SSE at t = 3T/4; (c1c4) scour depth at t = 4T; (d1d4) scour rate.
Jmse 13 01114 g006
Figure 7. Influence of (a) river flow strength, (b) peak tidal currents, (c) cylinder diameters, and (d) tidal periods on the maximum scour depth.
Jmse 13 01114 g007
Figure 8. (a1,a2) Three-dimensional scour hole morphology at t = 4T; (b1,b2) scour hole profile at t = 4T; variation of the (c1) ratio of tide-side and river-side scour depth and (c2) the relative scour depth with the river flow intensity; variation of (d1) relative scour depth and (d2) river flow scour with peak velocity; variation of (e1) asymmetry coefficient and (e2) relative scour depth with cylindrical diameter.
Jmse 13 01114 g008
Figure 9. (a1a4) Velocity curve, (b1b4) bottom SSE (t = T/4), (c1c4) bottom SSE (t = 3T/4), and (d1d4) scour depth (t = 4T).
Jmse 13 01114 g009
Figure 10. (a1a3) Scour hole, (b1b3) scour rate, (c1c3) cross section of scour hole, and (d1d3) longitudinal scour hole.
Jmse 13 01114 g010
Figure 11. (a1a4) Scour hole, (b1b4) scour rate, (c1,c2) inlet velocity and velocity change rate, and (d1,d2) scour hole profile.
Jmse 13 01114 g011
Table 1. Model parameters.
Uc (m/s)h (m)Hs (m)D (m) d50 (mm)ρ (kg/m3)
0.3660.450.30.150.752650
Table 2. Numerical cases.
Group 1: Tests for the local scour effect of reciprocating flow on a cylinder
Test namesD(m)h(m)U(m/s)Umax/UcDescriptions
Tide010.150.450.732sin(2πt/T)2Influence of reciprocating flow
on local scour
Group 2–5: Tests for the local scour effect of a cylinder in different hydrodynamic conditions
Test namesD (m)T (s)Umax (m/s)Uuni (m/s)Uuni/UmaxUmax/UcD/hReDescriptions
Tide01(ibid)0.153600.7320.0000.02.00.33103,585Influence of river flow strength (compared with Tide01)
Influence of peak tidal currents (Runoff04 compared with Tide01)
Runoff010.153600.732−0.0730.12.00.33113,915
Runoff020.153600.732−0.1460.22.00.33124,245
Runoff030.153600.732−0.2200.32.00.33134,717
Runoff040.153600.732−0.2930.42.00.33145,047
Runoff050.153600.732−0.3660.52.00.33155,377
Runoff060.153600.732−0.4390.62.00.33165,708
Runoff070.153600.732−0.5120.72.00.33176,038
Runoff080.153600.732−0.5860.82.00.33186,509
Runoff090.155400.732−0.2930.42.00.33145,019Influence of tidal periods (compared with Runoff04)
Runoff100.157200.732−0.2930.42.00.33145,019
Runoff110.159000.732−0.2930.42.00.33145,019
Runoff120.053600.732−0.2930.42.00.1148,340Influence of cylinder diameters (compared with Runoff04)
Runoff130.103600.732−0.2930.42.00.2296,679
Runoff140.203600.732−0.2930.42.00.44193,358
Tide020.153600.2930.0000.00.80.3341,462
Tide030.153600.5490.0000.01.50.3377,689
Runoff150.153600.293−0.1170.40.80.3358,047Influence of peak tidal currents (compared with Tide02)
Runoff160.153600.549−0.2200.41.50.33108,764Influence of peak tidal currents (compared with Tide03)
Table 3. Velocity and shear stress peaks in tidal periods.
TimeVelocity (m/s)SSE (Pa)
t = T/40.63.5
t = 3T/4−0.53.5
Table 4. Scour monitoring points after four periods.
Maximum Scour Depth PointMinimum Scour Depth Point
Forward flow225° or 315°90° or 270°
Reversed flow45° or 135°90° or 270°
Disclaimer/Publisher’s Note: The statements, opinions and data contained in all publications are solely those of the individual author(s) and contributor(s) and not of MDPI and/or the editor(s). MDPI and/or the editor(s) disclaim responsibility for any injury to people or property resulting from any ideas, methods, instructions or products referred to in the content.

