Article

Characterization and Numerical Modeling of Shallow Marine Turbidite Depositional Systems: A Case Study from the Second Member of the Yinggehai Formation, X Gas Field, Yinggehai Basin

1
School of Earth Sciences and Engineering, Xi’an Shiyou University, Xi’an 710065, China
2
Shaanxi Key Laboratory of Petroleum Accumulation Geology, Xi’an 710065, China
3
CNOOC Limited Hainan Branch, Haikou 570300, China
4
Sinopec Geophysical Corporation Research and Development Center, Nanjing 210000, China
*
Author to whom correspondence should be addressed.
J. Mar. Sci. Eng. 2025, 13(6), 1107; https://doi.org/10.3390/jmse13061107
Submission received: 29 April 2025 / Revised: 21 May 2025 / Accepted: 22 May 2025 / Published: 31 May 2025
(This article belongs to the Section Geological Oceanography)

Abstract

Objective: The research on turbid current deposition in shallow Marine shelf environments is relatively weak. Method: Based on three-dimensional seismic, drilling and logging data, etc., the spatio-temporal characterization of the shallow sea turbidity current sedimentary system was carried out by using seismic geomorphology and sedimentary numerical simulation techniques. Results and Conclusions: (1) A set of standards for identifying sedimentary units in the X Gas Field was established, identifying four sedimentary units: channel, mound body, channel-side accumulation body, and shelf mud; (2) The vertical evolution and planar distribution of the sedimentary units in the painting were precisely engraved. Along with the weakly–strongly–weak succession of turbidity current energy, the lithological combination of argillaceous siltstone–siltstone–mudstone developed vertically. On the plane, the clusters showed an evolution of isolation–connection–superposition. The scale of the river channel continued to expand, and the phenomena of oscillation and lateral accumulation occurred. (3) Three factors were analyzed: sea level, material sources, and sedimentary substrates (paleo landforms), and a shallow Marine turbidity current sedimentary system was established in the Honghe area in the northwest direction under the background of Marine receding, which is controlled by sedimentary slope folds and blocked by the high part of the diapause during the downward accumulation process of material sources along the shelf. (4) The numerical simulation results reconstructed the process of lateral migration of waterways, evolution of branch waterways into clusters, expansion of the scale of isolated clusters, and connection and superposition to form cluster complexes on a three-dimensional scale. The simulation results are in high agreement with the actual geological data.

1. Introduction

Turbidity currents are a type of gravity flow characterized by turbulent flow, typically developed in deep-water areas along continental shelf slope breaks in the down-dip direction [1]. The large water depth is a necessary condition for the preservation of turbidity current deposits without erosion [2]. Turbidity current deposition also occurs in shallow marine environments along the upper part of the shelf slope break. Shiki et al. studied the shallow Marine turbidity current deposition of the Niigata Neogene Arc Basin in Japan in 1996 and concluded that atypical turbidity current deposits in shallow marine settings are often constrained by specific paleogeographic and paleotectonic conditions, leading to limited development [3]. In 2018, Hampson et al. identified the shallow turbid sand body of the Late Cretaceous in northern Utah, USA, using natural outings and exploration well data [4]. In 2005, Pattison proposed that the instability of the delta leading edge sediments caused by sudden events such as floods, earthquakes, and typhoons was an important reason for the formation of this turbid sand body [5]. The Baoma sequence is a typical sedimentary feature of turbidity current deposition. In 2016, Huang Yintao et al. conducted research on the Huangliu Formation in the Yinggehai Basin and believed that turbidity current deposition in a shallow sea background also has the sedimentary characteristics of the Baoma sequence, but it can be modified by various factors such as waves and tides [6,7].
With advances in technology, there has been progress in high-resolution seabed turbidite sand body identification, real-time monitoring of turbidity currents, and physical and numerical sedimentary simulations of shallow marine turbidity currents. However, related research is often limited to the recognition of turbidity current deposit characteristics and the discussion of their formation mechanisms. There is still a lack of understanding regarding the depositional background, controlling factors, and sedimentary models of shallow marine turbidity currents compared to deep-water turbidity currents [8,9,10,11,12,13,14]. Moreover, new directions in turbidity current research, such as the interaction between complex seabed topography and turbidity current deposition scale and structure, and the coupling of sea level fluctuations, sediment supply, and turbidity current evolution, are even less explored in shallow marine settings [15,16,17].
In the Yinggehai Basin, the X Gas Field’s Yinggehai Formation (Ying’er Member) develops a shallow marine turbidity current deposition system. Previous research has addressed sedimentary environments, provenance, sand body types, and cap seal integrity, but these studies do not meet the current production and development needs, and understanding of turbidity channel characterization and sedimentary system evolution remains weak [18,19,20,21,22,23,24,25]. Therefore, based on previous research, this study integrates core, grain size, drilling, seismic, and other data, coupled with sedimentary numerical simulation techniques, to comprehensively investigate the geological sedimentary units controlled by the shallow marine turbidity current system and analyze its sedimentary evolution process.

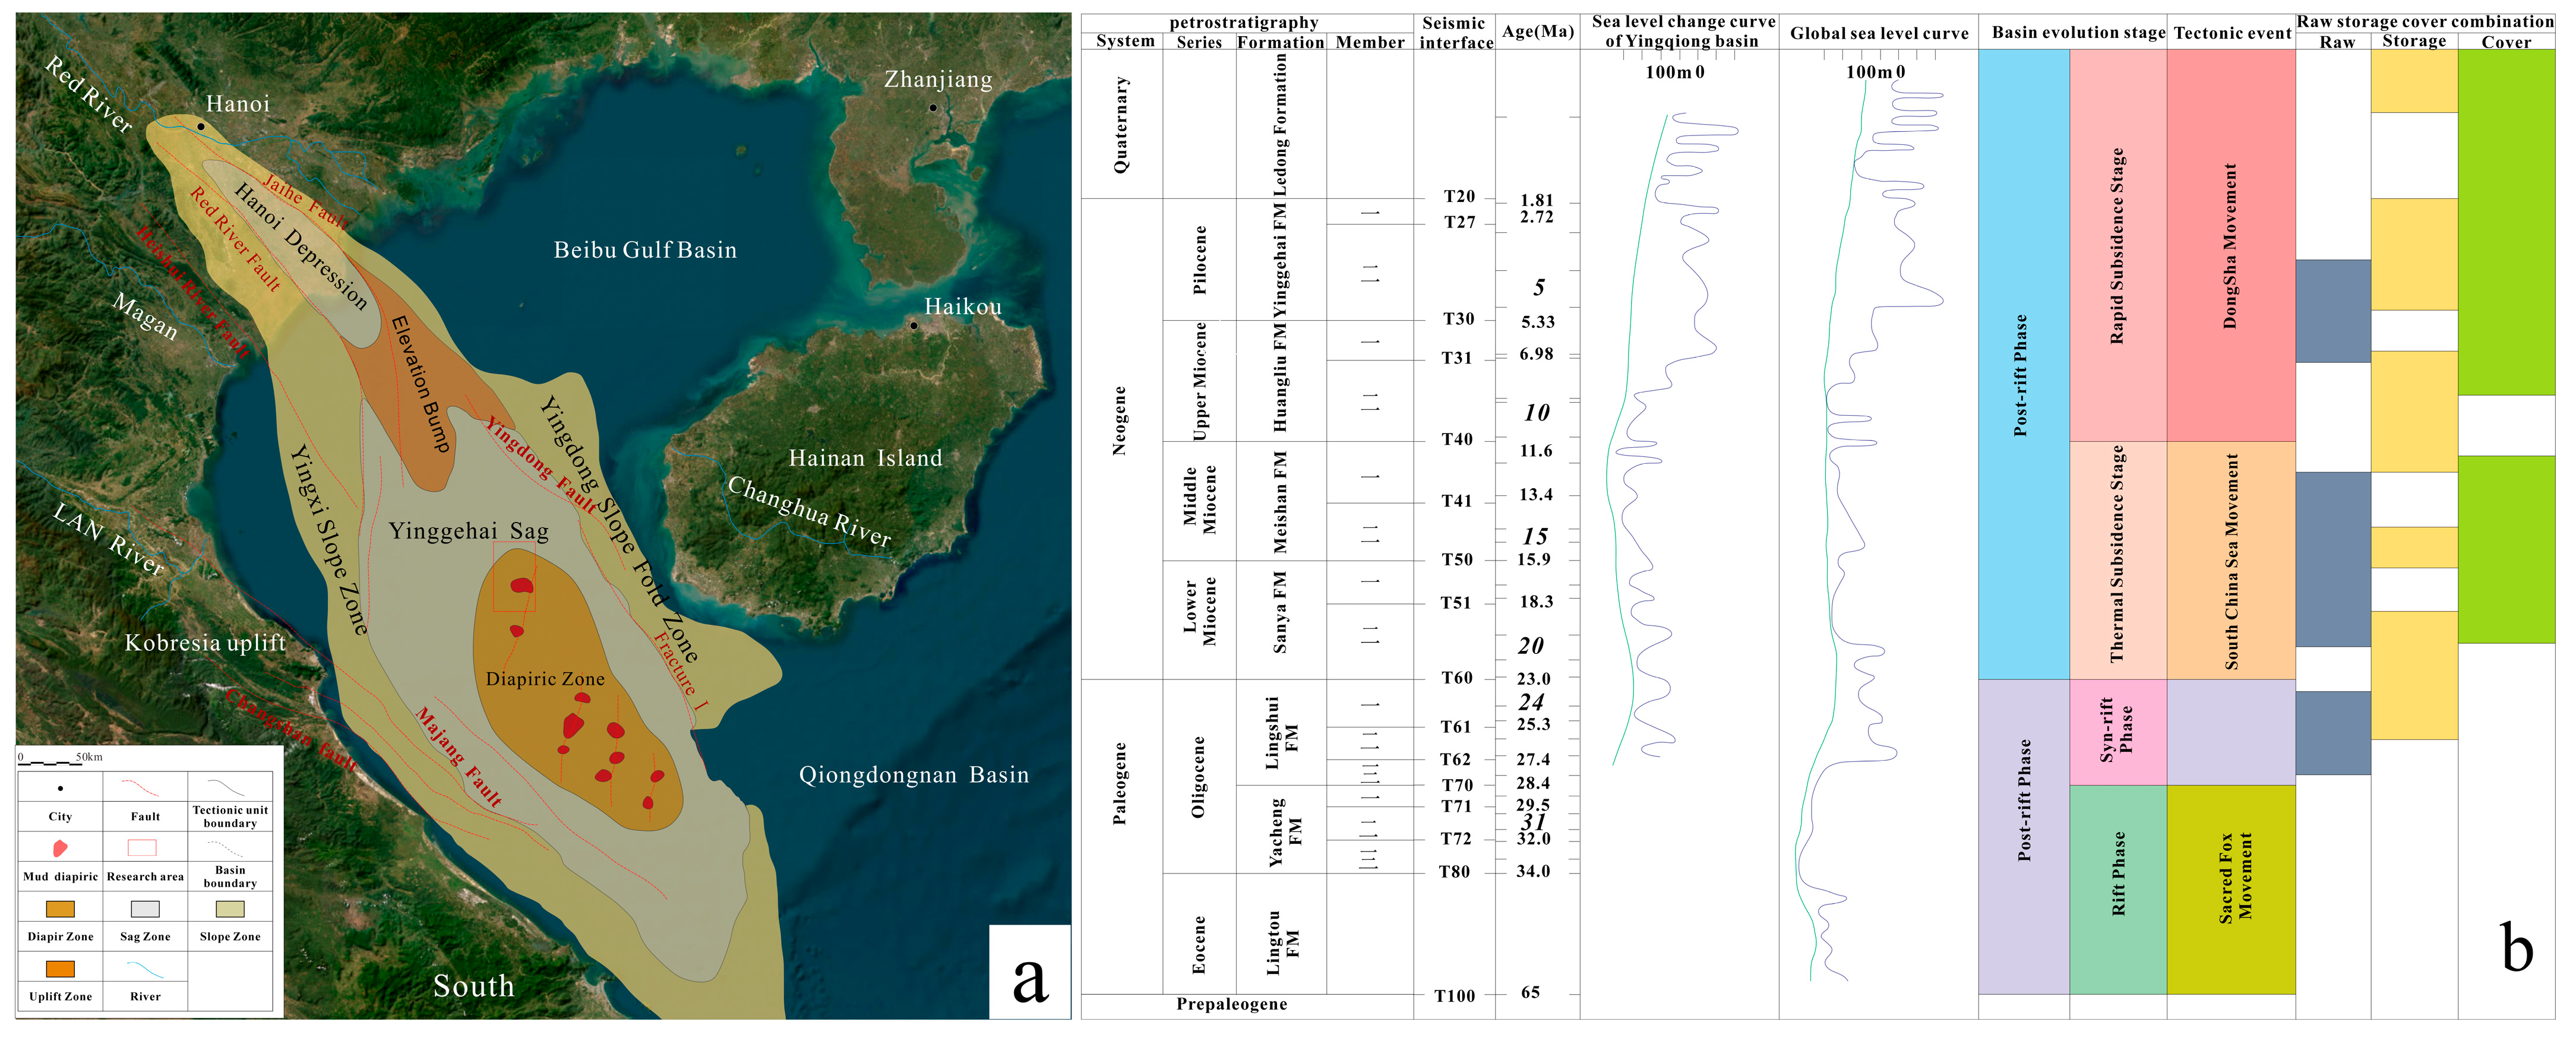
2. Regional Geological Background

The Yinggehai Basin is located between Hainan Island and Vietnam, with a roughly rhomboid shape, extending mainly in a NW-SE direction, covering an area of approximately 12.7 × 10⁴ km2. It consists of three primary structural units: the Yingxi Slope, the Yingdong Slope, and the Central Depression. To the east, it is bounded by the No. 1 Fault Zone, which separates it from the Qiongdongnan Basin. To the northeast, it borders the Beibu Gulf Basin, and to the west, it connects with the Red River Fault Zone and the Kunmong Uplift (Figure 1a). The Yinggehai Basin is a Cenozoic oil and gas basin formed by a combination of rifting, extension, and strike–slip extension processes. Its tectonic evolution is controlled by a dual mechanism of mantle uplift and rifting along the Red River Fault, undergoing four tectonic phases: faulted depression, faulted sag, post-rift thermal subsidence, and post-rift accelerated subsidence [26,27].
The basin features eight stratigraphic units, from bottom to top: the Lingtou Formation, Yacheng Formation, Lingshui Formation, Sanya Formation, Meishan Formation, Huangliu Formation, Yinggehai Formation, and Ledong Formation (Figure 1b). The X Gas Field is located in the north of the Central Depression’s muddy basement structural belt in the northwest of the Yinggehai Basin, with an ancient water depth ranging from 51 to 153 m [28]. The focus of this study is the Ying’er Member of the Yinggehai Formation, which developed under a regressive background and consists mainly of shallow marine and semi-deep marine deposits, characterized by sandstone and muddy sandstone.
Figure 1. Location map (a) and stratigraphic and tectonic evolution map (b) of the X Gas Field (modified from the literature [29,30,31]).
Jmse 13 01107 g001

3. Materials and Methods

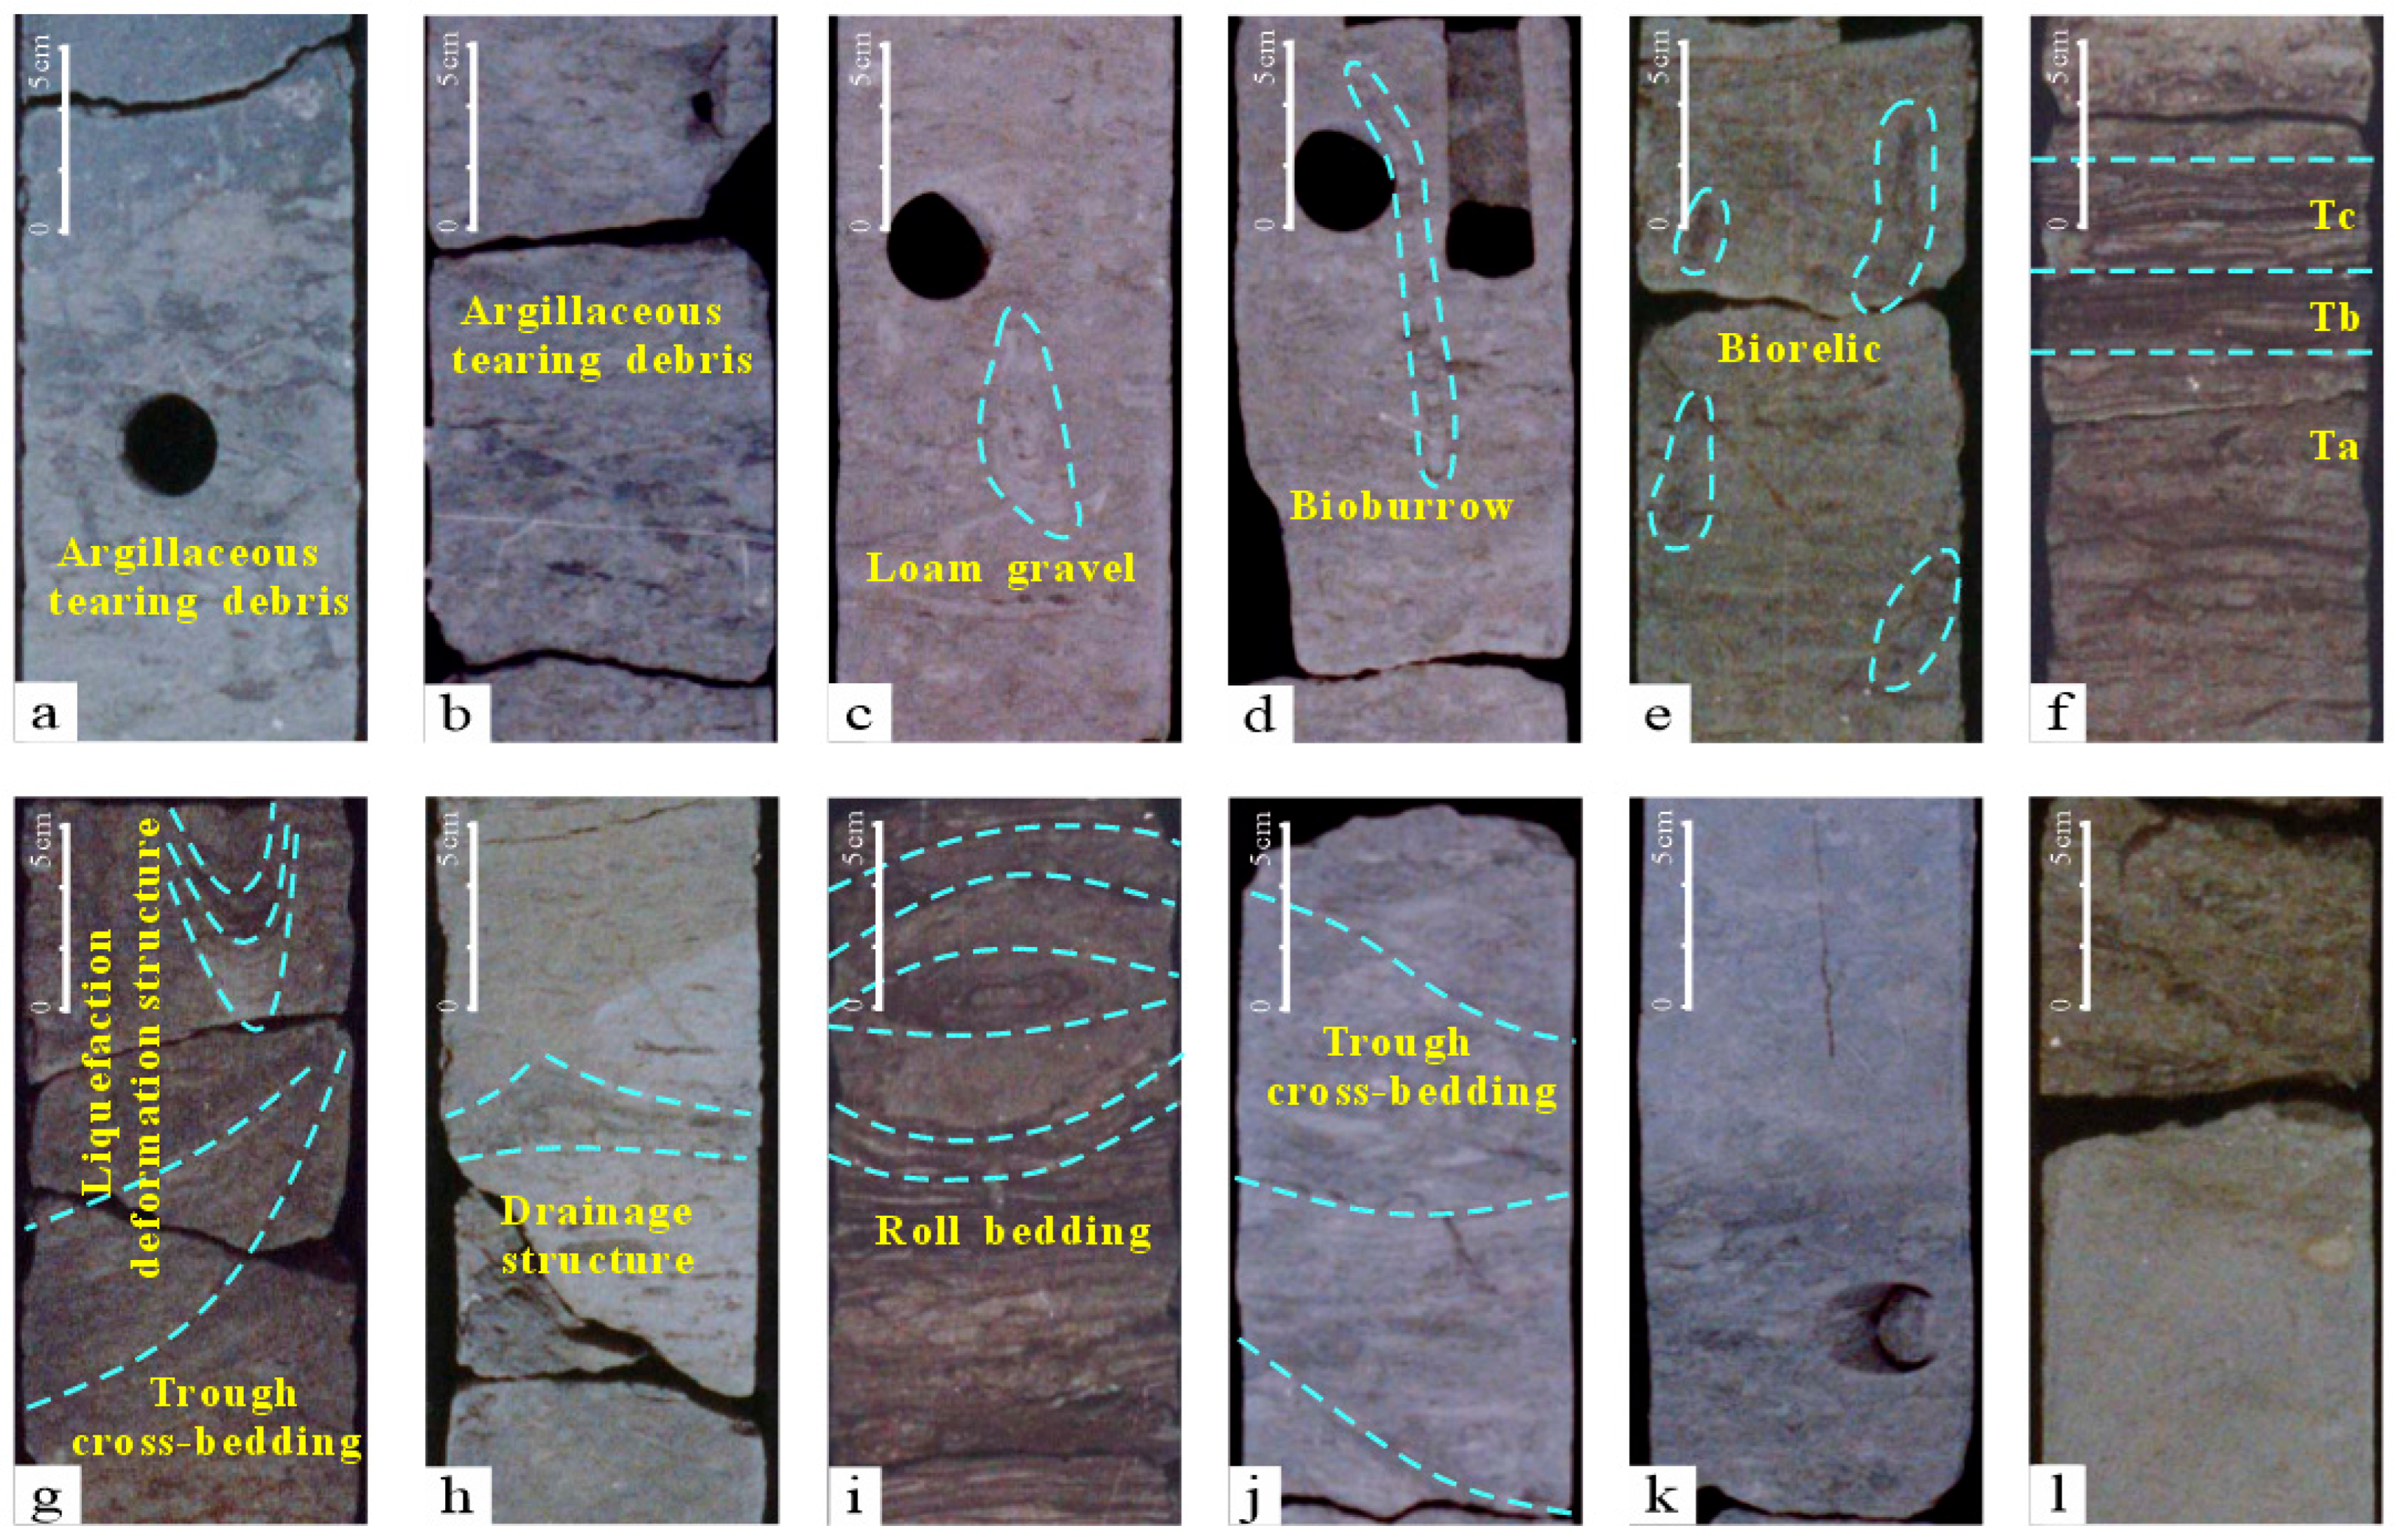
3.1. Core and Grain Size Characterization Analysis

Core samples provide the most direct representation of stratigraphic information and reflect the regional sedimentary evolution process. Through core analysis and testing, the main lithologies in the Yinggehai Formation Ying’er Member of the X Gas Field were identified as sandstone and muddy sandstone. The rock composition is primarily quartz sandstone, with iron-rich quartz sandstone being the most common, followed by feldspathic lithic quartz sandstone. The structural maturity is relatively high, with moderate sorting and roundness, and the compositional maturity is also moderate.
Some core samples exhibit massive bedding, with muddy clasts identified as mudstone fragments resulting from high-energy turbidity currents that eroded and captured earlier mud deposits (Figure 2a,b). Additionally, “mud-clast gravel” phenomena, indicating the erosion and modification of soft sediments at the bottom by sandy debris flows, were also identified (Figure 2c). Furthermore, massive bedding also reveals abundant biogenic traces, characteristic of shallow marine depositional environments (Figure 2d,e), indicating intense biological activity and suggesting a shallow Marine environment.
In core samples from well X-1-A3, the Bauma sequence is affected by post-depositional erosion. The top section shows missing parallel bedding and mudstone layers (Figure 2f), indicating that the environment at that time was a turbid current environment. During rapid turbidity current deposition, soft sediment liquefaction often occurs, resulting in deformational features such as dewatering structures (Figure 2h) and convolute bedding (Figure 2i), which can also be identified in the target layer cores.
In core samples from well X-1-A2, one of the typical channel facies structures, cross-bedded troughs, was observed (Figure 2j). However, due to the limited scale of core observation, only local identification of the cross-bedded troughs was possible.

3.2. Well Log Facies and Seismic Facies Analysis

On the basis of establishing the relationship between well log curves and formation lithology through core samples, the morphological analysis of well log curves is used to identify sedimentary characteristics in uncored wells. This technique is commonly used in modern well log sedimentary facies research. The X Gas Field is offshore, with high drilling costs and a sparse well network, limiting the control range. Seismic data cover a relatively large area, but its multi-interpretability restricts its application in sedimentary interpretation. Therefore, a combined well-seismic study is necessary.
Therefore, it is necessary to study the combination of well and earthquake, analyze the physical properties of rocks, and enhance the accuracy of the interpretation of seismic reflection characteristics, which is conducive to the comprehensive research of distinguishing turbidity of current sedimentary units [32]. Starting from core observations, and combining grain size analysis data, well log curve morphology and amplitude changes, as well as typical seismic reflection configurations, a set of criteria for identifying typical sedimentary units in the Yinggehai Formation Ying’er Member of the X Gas Field is established (Figure 3).
Based on previous studies and analysis of available geological data, the target layer in the X Gas Field primarily develops four typical sedimentary units: channel, channel-side accumulation, mound body, and shelf mud.
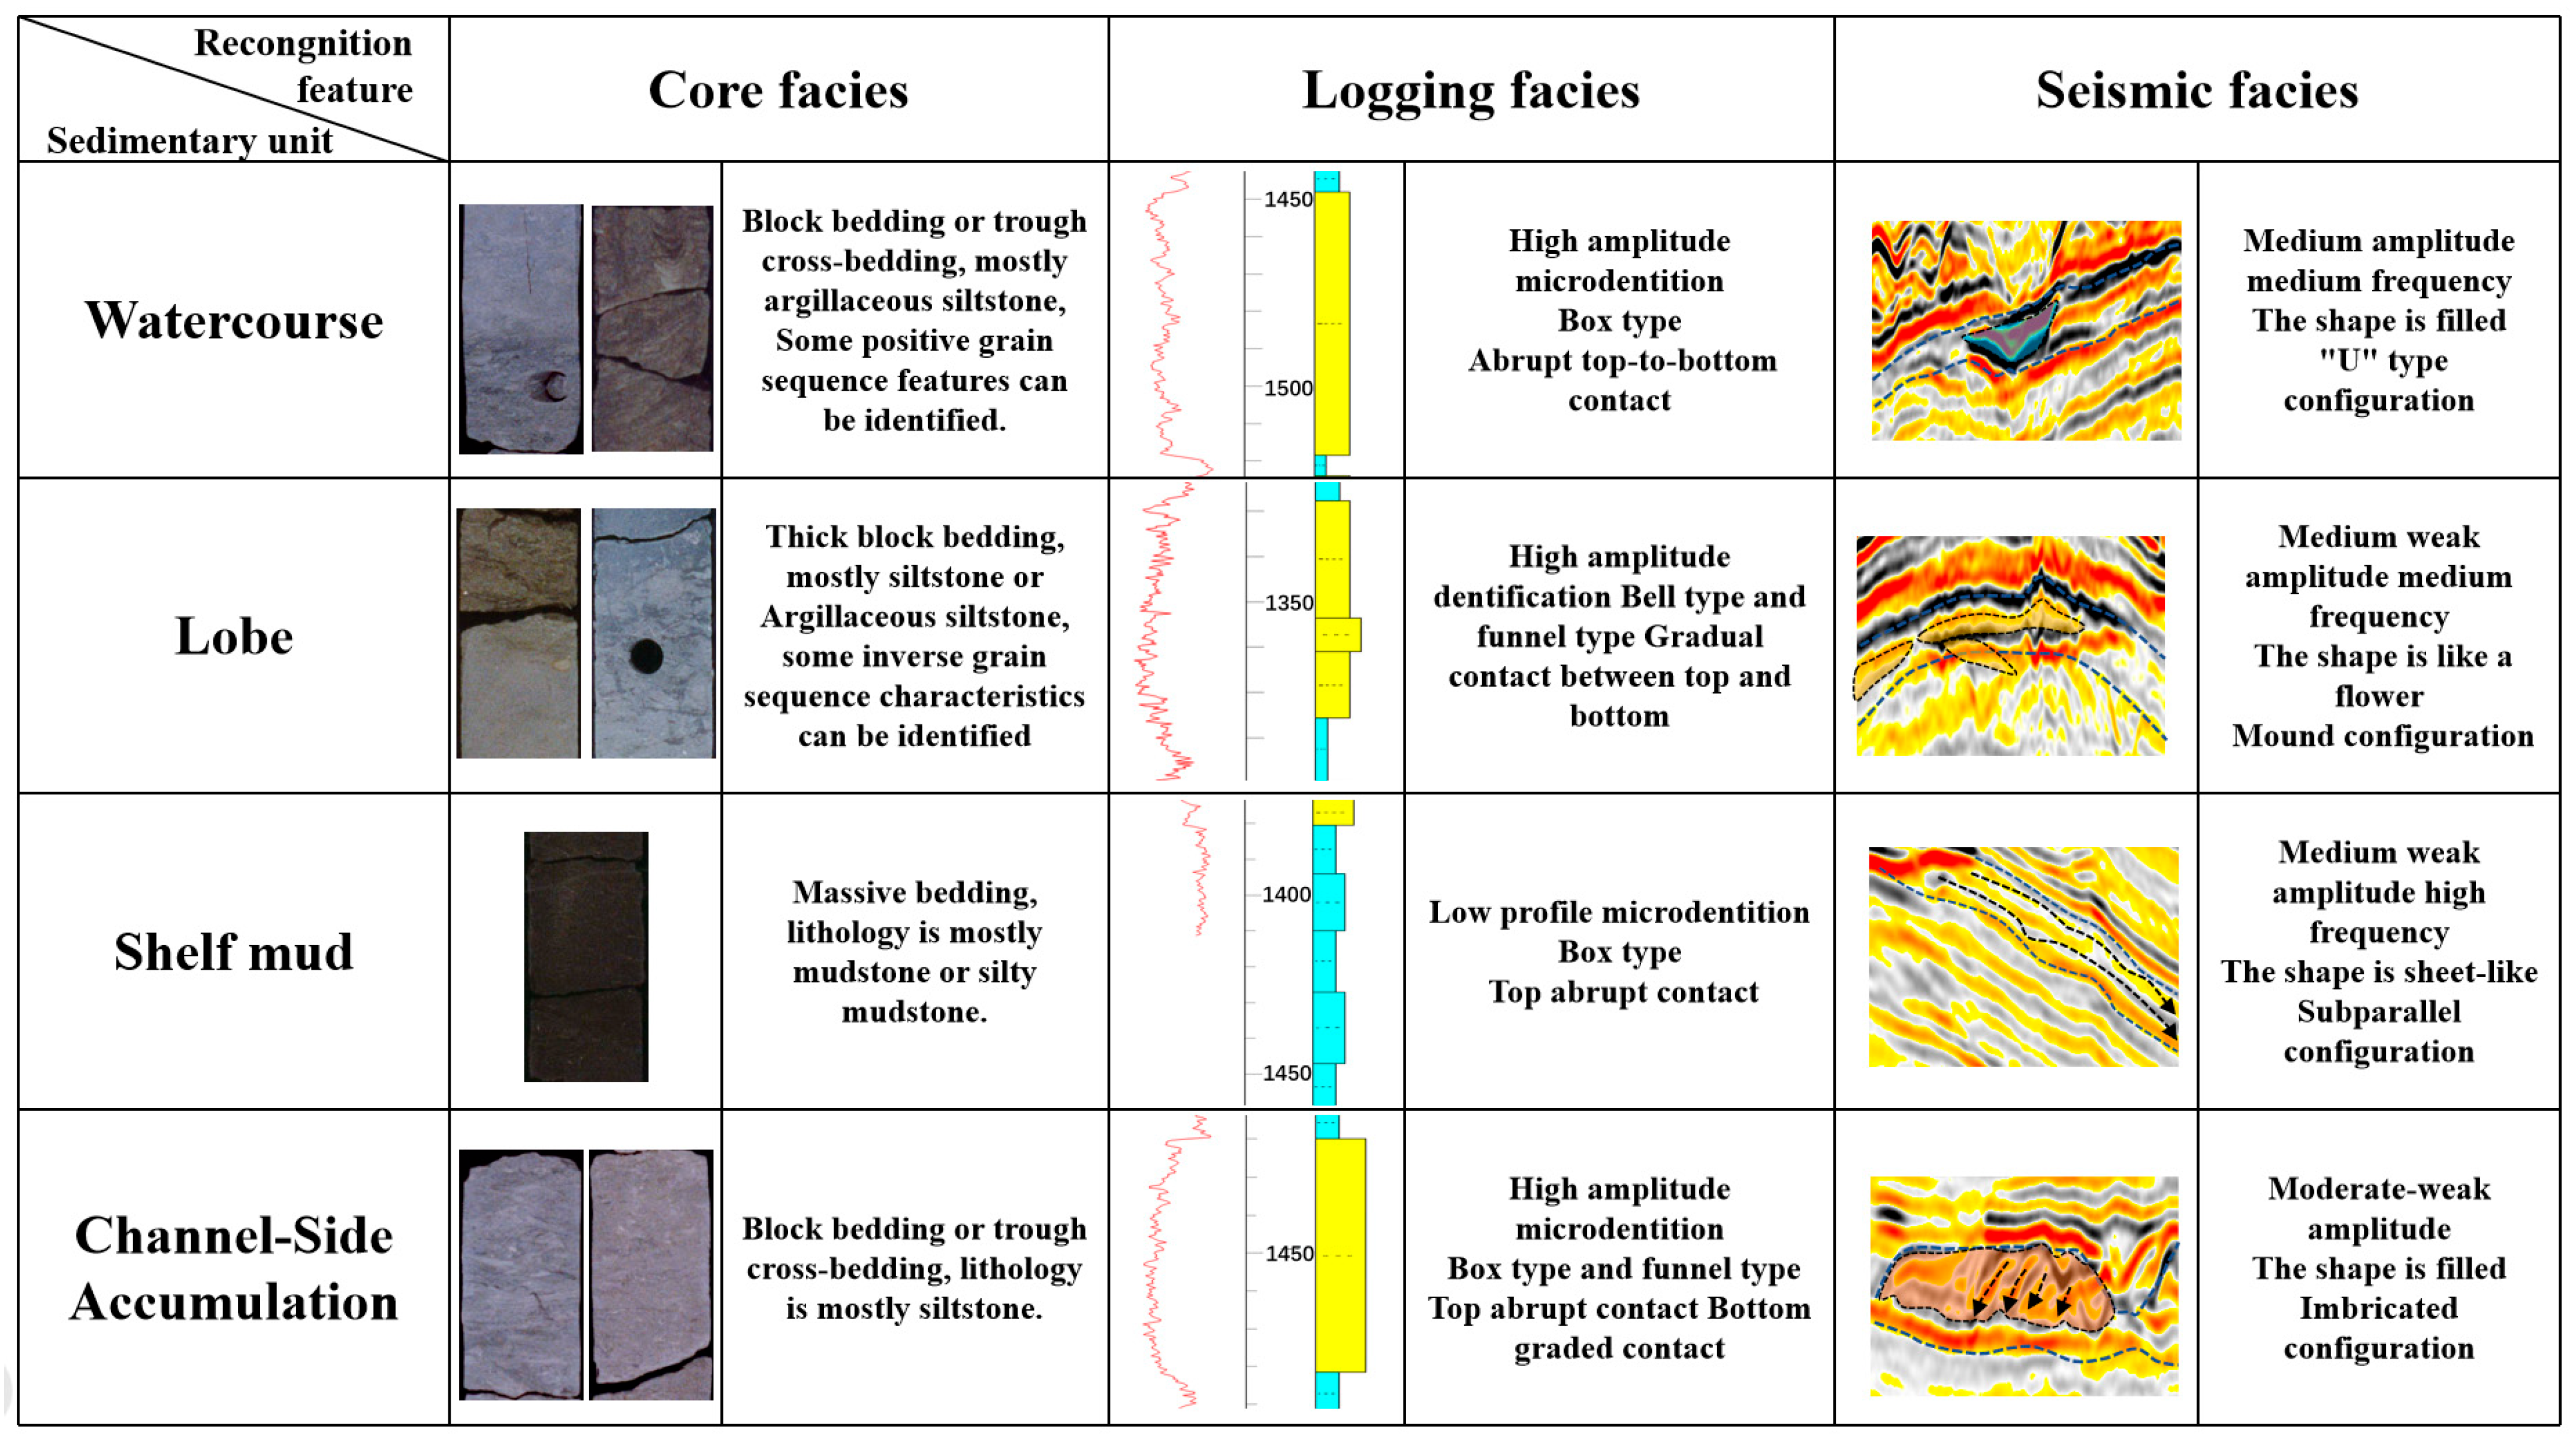
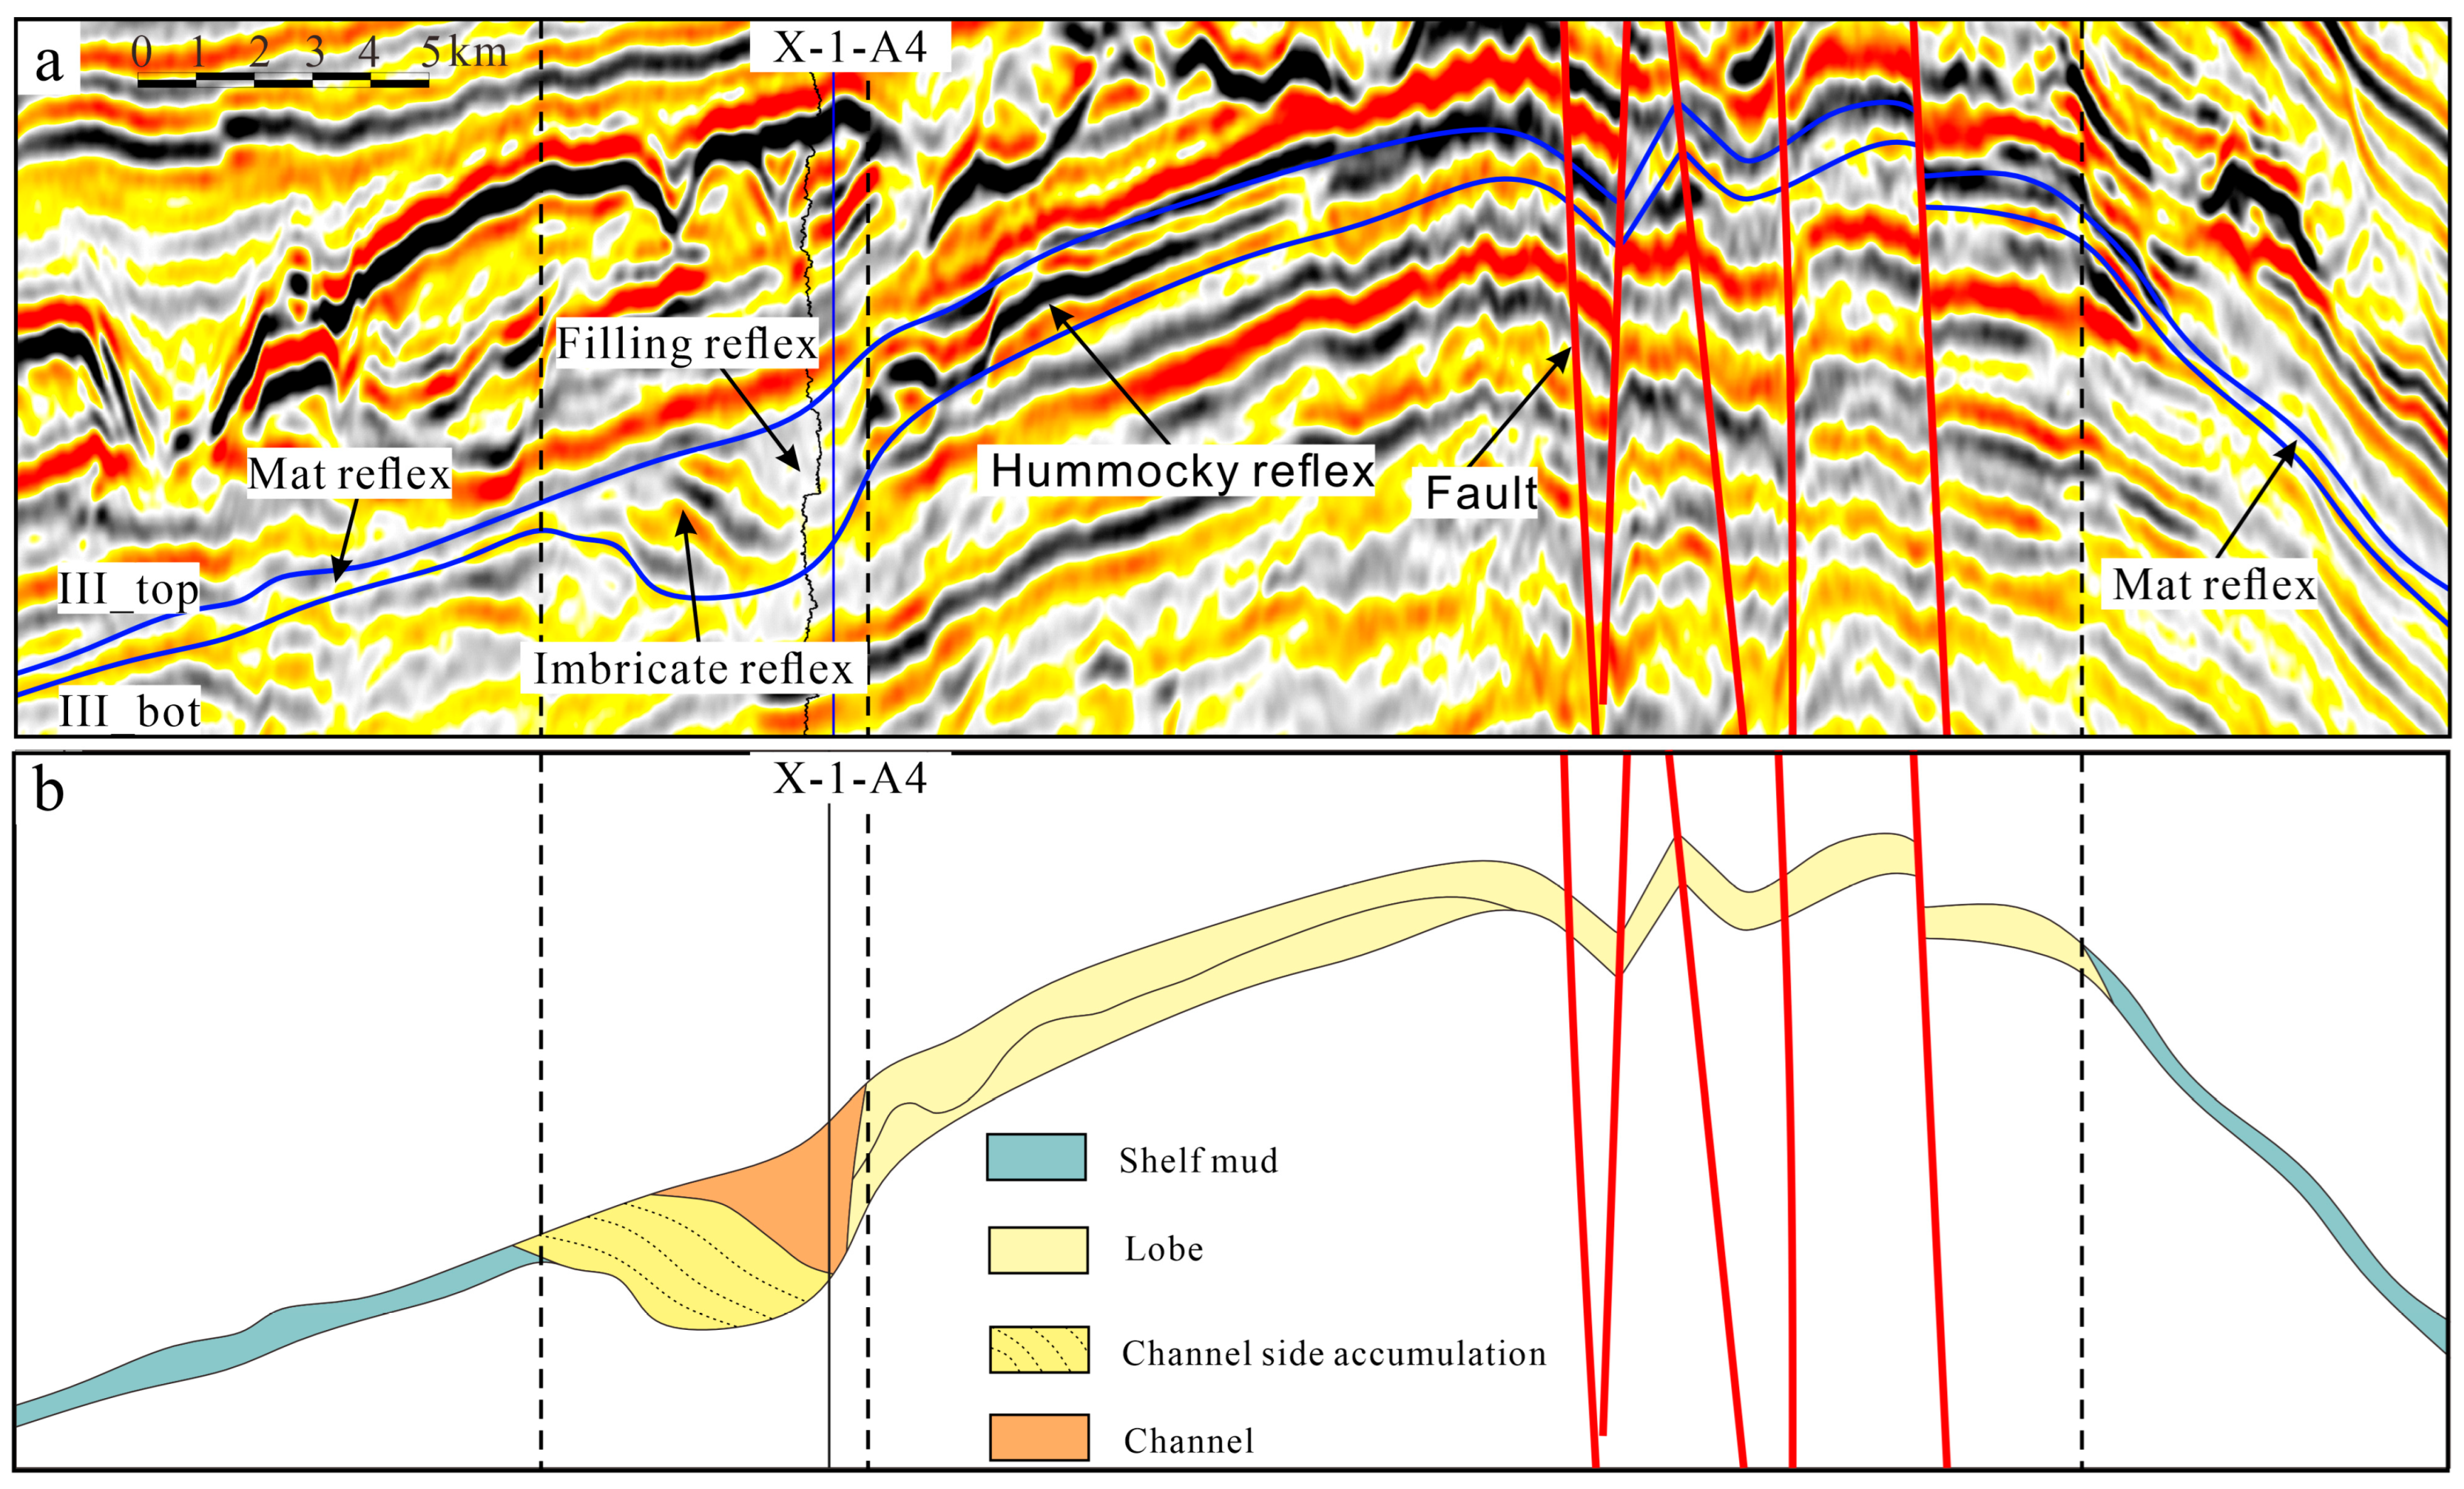
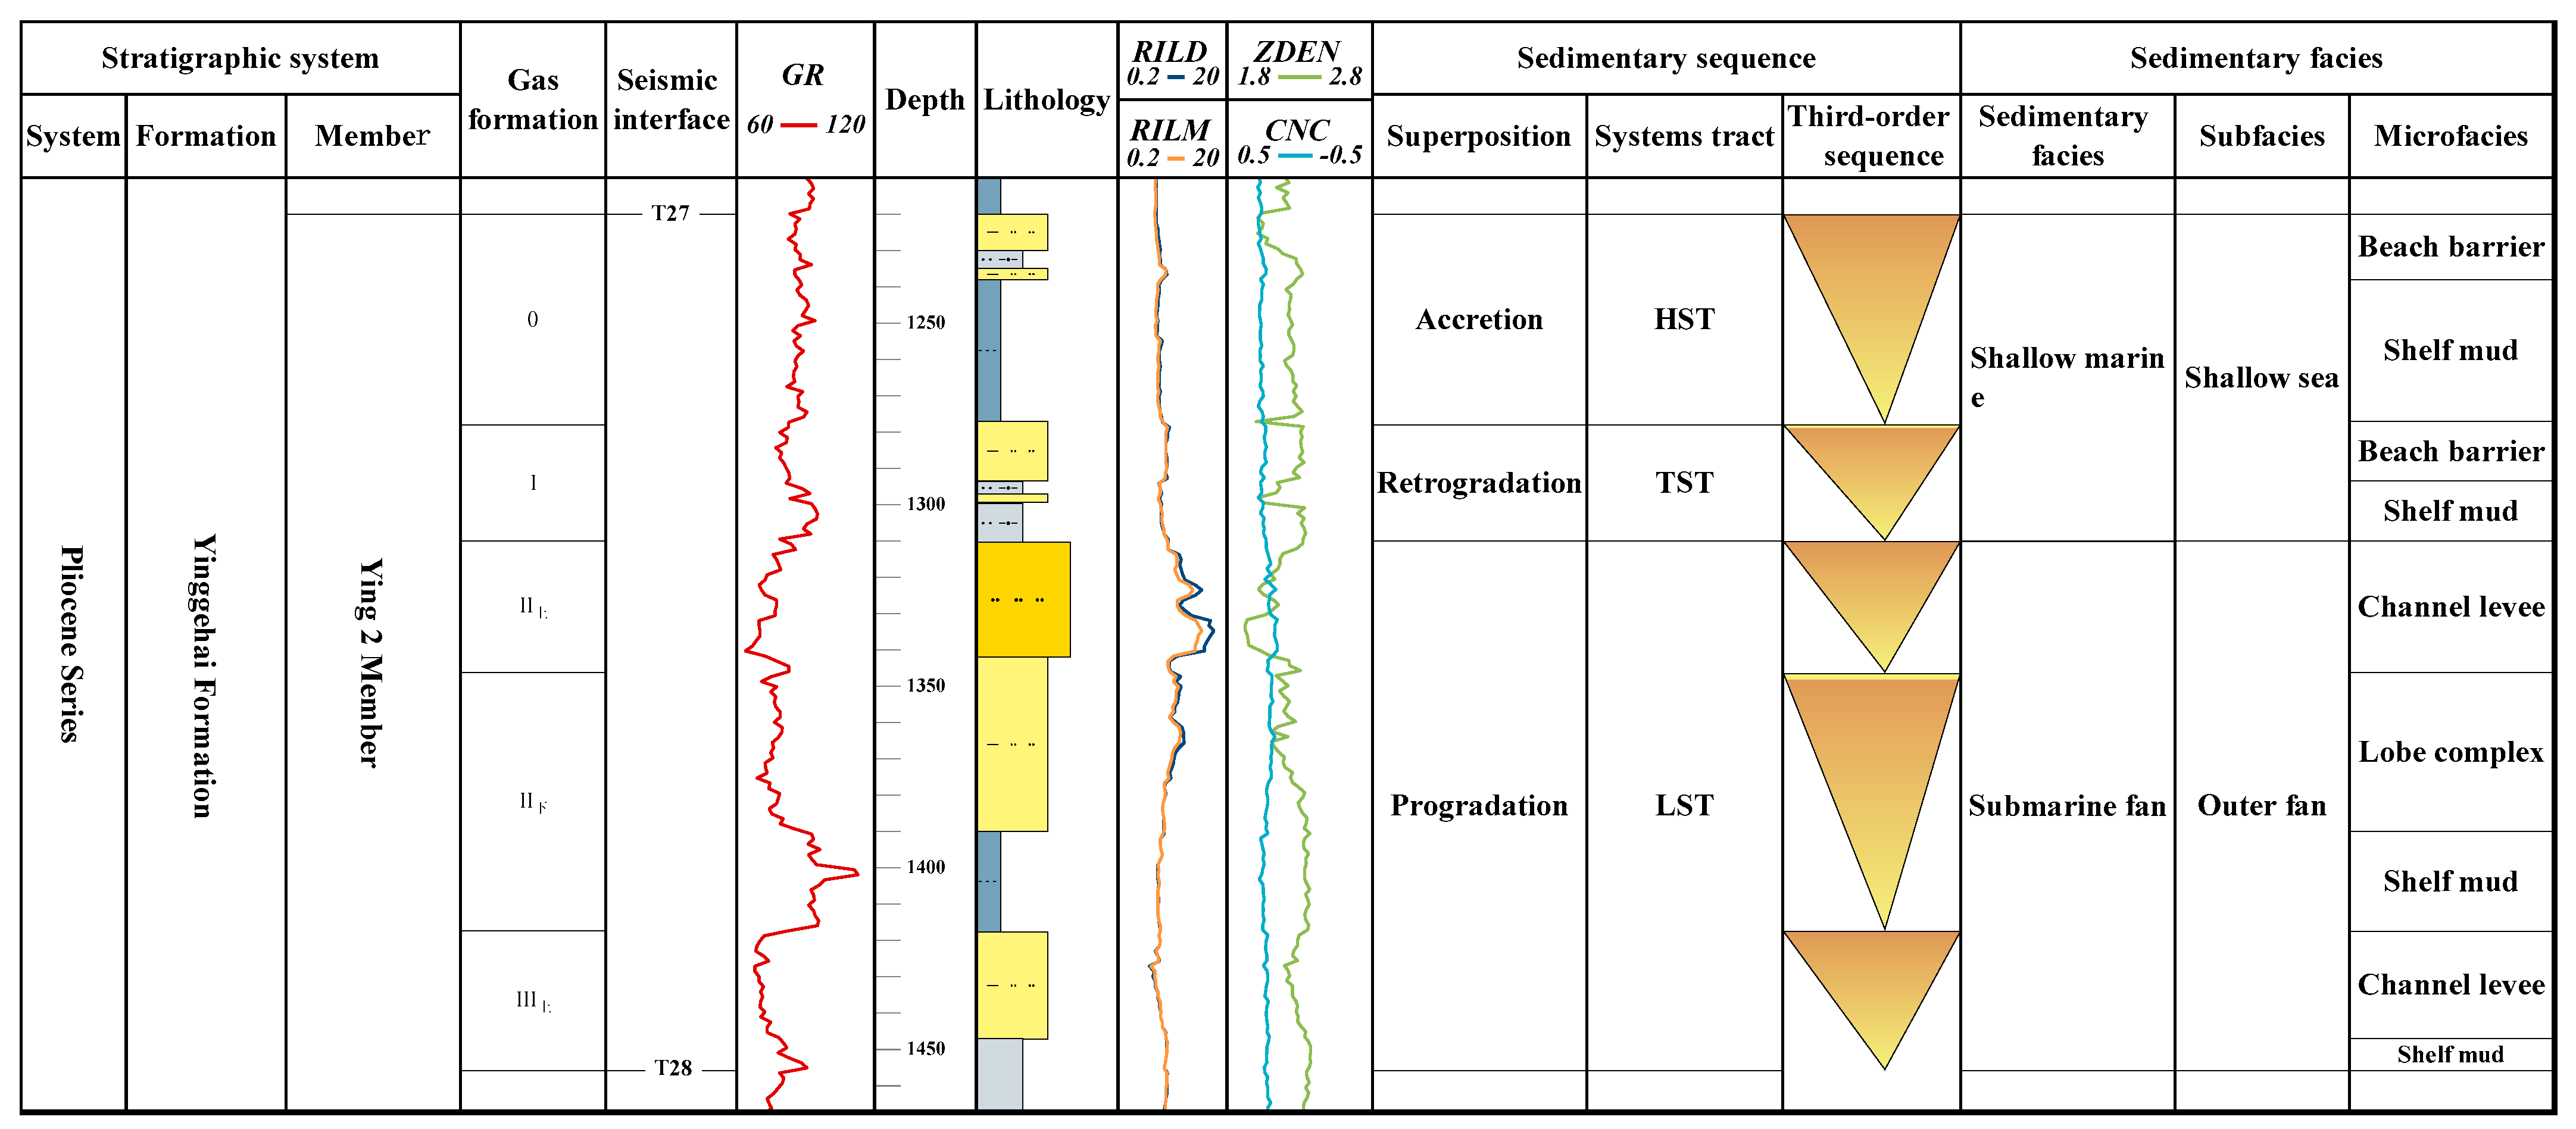
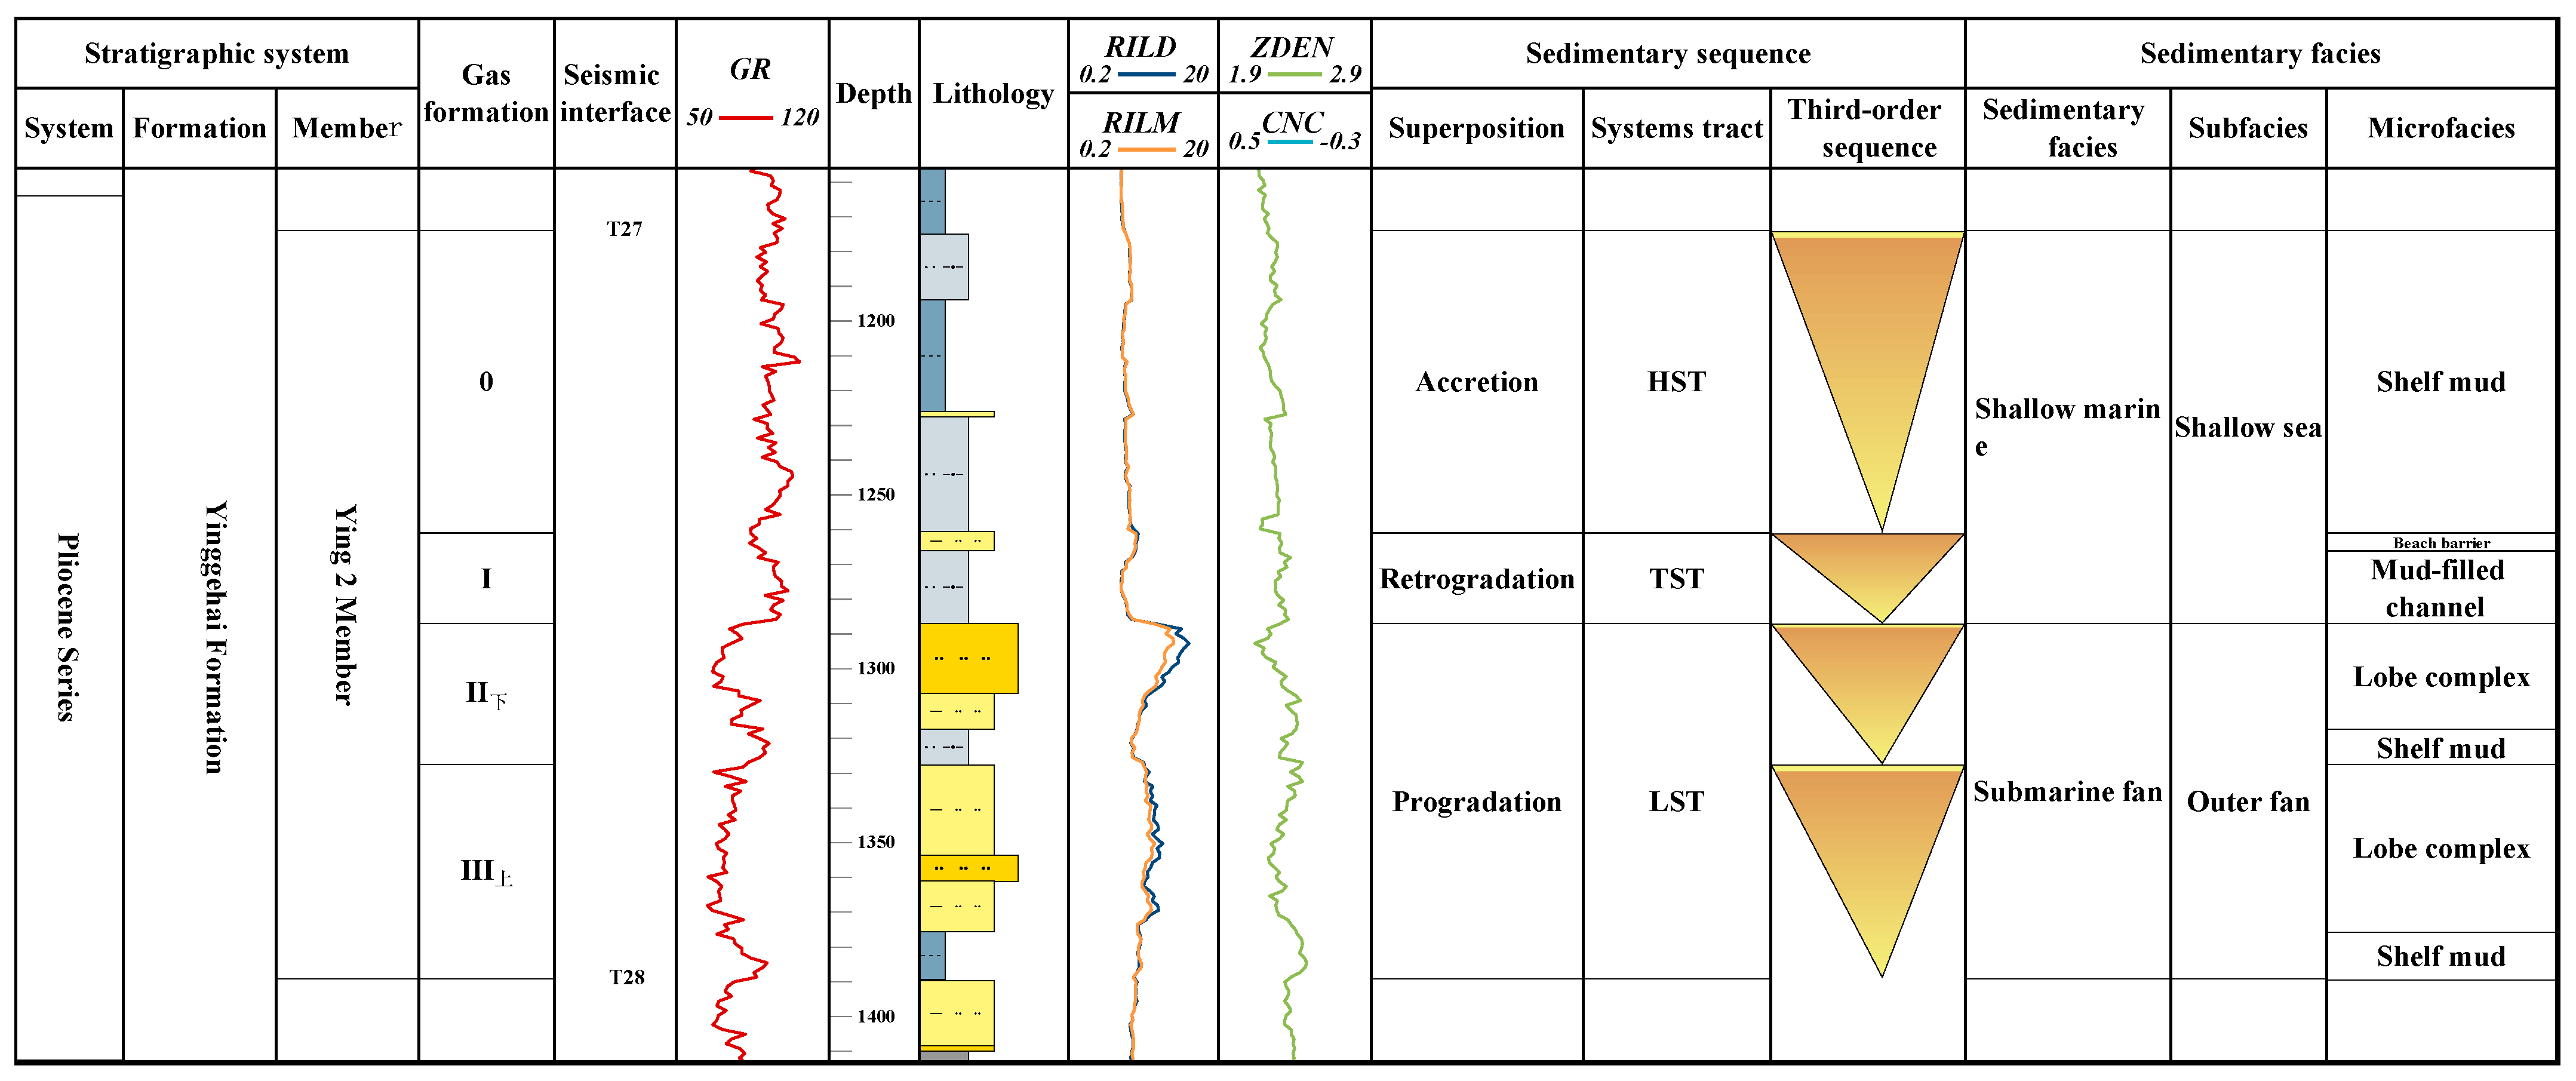
  • Channel: Formed under strong hydrodynamic conditions, the channel is the result of erosion by turbidity currents, creating a negative topography that is later filled with clastic material. The lithology is relatively homogeneous. In the natural gamma log, it exhibits high-amplitude, micro-toothed box-shaped curves, with sharp contact at both the top and bottom. On seismic data, it appears as a medium to strong amplitude, mid-frequency reflection (Figure 4), with the profile displaying a “U” shape, and internal reflections showing a filling characteristic (Figure 4).
  • Mound body: During turbidity current transport, the hydrodynamic conditions gradually weaken, and the channel scale decreases. The sediment at the channel’s end continues to spill out, forming mound-shaped sand bodies [33]. On the natural gamma curve, this shows a high-amplitude, toothed + funnel-shaped combination, with gradual contact at both the top and bottom. On seismic data, it appears as medium to weak amplitude, mid-frequency reflections (Figure 3), with the profile displaying a “flat base and convex top” hill-like shape. On the plane, it appears mound-shaped. Single mound bodies are difficult to identify in the study area, and more commonly, multi-phase mound bodies are laterally connected and vertically superimposed to form mound body complexes, which are reflected in seismic profiles as large-scale, relatively thick sheet-like structures that extend from the center to the ends and gradually taper off (Figure 4).
  • Shelf mud: Formed under relatively weak hydrodynamic conditions, fine-grained suspended material slowly settles and forms mud deposits. The natural gamma curve shows low-amplitude, micro-toothed box-shaped patterns, with sharp contact at both the top and bottom. Seismically, it exhibits medium to weak amplitude, high-frequency, sub-parallel reflection characteristics (Figure 3), with a sheet-like shape. However, the seismic reflection of shelf mud differs noticeably from the mound body complex in terms of amplitude and frequency, especially when mound bodies stack to form sheet-like reflections (Figure 4).
  • Channel-side accumulation: During lateral migration of the channel, hydrodynamic conditions change, with the channel-side accumulation developing at the concave bank of the channel where hydrodynamics gradually weaken. The natural gamma curve shows a combination of high-amplitude, toothed box-shaped patterns + funnel-shaped features, with sharp contact at the top and gradual contact at the bottom. Seismically, it appears as medium to weak amplitude (Figure 3), with a filling shape and a shingled configuration (Figure 4).

3.3. Establishment of Sedimentary Numerical Simulation Model

The main principle of Dionisos is to simulate the evolution of the stratigraphic pattern of the basin over time by using the sedimentary transport equations over a long time span (from tens of thousands to hundreds of millions of years) and on a large scale (from tens of kilometers to hundreds of kilometers). The software adopts the linear empirical formula (Qs = K·S) under slope control to simulate the long-term low-energy deposition and transportation process. By integrating the coupled contributions of gravity (Kg), river hydrodynamic force (Kwater qw), and wave energy (Kwave e) through the comprehensive transportation coefficient K, the traditional hydrodynamic model’s reliance on microscopic parameters is replaced by macroscopic parameters with kilometer-level grids and ten-thousand-year time steps (such as the empirical coefficient A = 0.1). Through the core control of slope gradient S and the empirical laws of the global sedimentary system, the unified quantitative expression of sediment transport capacity in different environments such as rivers, floodplains, and coastal zones is achieved. Taking into account the nature of low-energy transport dominated by gravity (Qs∝S) and the synergistic effect of multiple dynamics, it ultimately supports the efficient simulation of the evolution of sedimentary systems on a million-year scale. A rectangular simulation area of 22 km × 38 km was established based on the study area, with a grid spacing of 0.2 km. The sedimentary simulation time was set from 3.2 to 2.4 Ma, with a total duration of 0.8 Ma, and the time step was set to 0.01 Ma. The initial basement was assumed to be a homogeneous lithology composed of sand, silt, and mud.
The accommodation space for sediments mainly depends on the variation of the sedimentary basement (paleogeomorphology) and changes in sea level. The accommodation space in the study area can be determined by the overall subsidence of the regional basement and the development area of the sedimentary units, the supply direction of sediments in the turbid current system provides the basis for parameter input [34,35]. Using Formula (1), the total accommodation space for the study area is estimated to be approximately 13.6 km3.
In this case, the formula for calculating accommodation space (AT) is
AT = TS × SA/1000
where
  • SA is the area (in km2),
  • TS is the subsidence of the basement (in meters),
  • AT is the accommodation space (in km3).
This formula provides the total accommodation space available for sediment deposition in the study area.
During the development period of the Yinggehai Formation Ying’er Member, the Yinggehai Basin was in a phase of rapid subsidence. There was no significant change in the structural stress regime within the basin, and the evolution of the sedimentary basement (paleogeomorphology) and ancient water depths showed clear inheritance [31]. By analyzing the lithologic changes from multiple exploration wells and seismic profile characteristics in the study area, a model for the initial water depth and sea level fluctuation curve (Figure 5a) was established, incorporating the Pliocene paleo-sea depth data (Figure 1a) [30].
Based on the previous discussion on provenance, and combining the analysis and testing data from multiple exploration wells, a NW-SE trending provenance source was set on the western side of the geological model and labeled as ① three N-S trending provenance sources were set to the north, labeled as ②, ③, and ④ (Figure 5b).
Two phases of provenance supply were defined:
Phase 1 (3.2–3.0 Ma): The supply amount was 1.4 km3, about 10% of the total, sourced only from ① and ③, with muddy sandstone being the dominant lithology. Sandstone and mudstone together accounted for 20%, corresponding to the initial stage of small-scale turbidity current development.
Phase 2 (3.0–2.4 Ma): The supply amount was 12.2 km3, about 90% of the total, sourced from all four provenance locations. The proportion of muddy sandstone decreased slightly, but it remained the dominant lithology. Mudstone content decreased, and sandstone content increased, with the combined proportion of both being 32.5%, corresponding to the mid-stage of relatively larger-scale turbidity current development (Figure 5c).
Based on the analysis of core and grain size characteristics in the study area, the provenance lithology characteristics and grain size parameters were set. Using the software’s internal algorithms, sediment transport velocity was automatically estimated, and the transport method was defined. Parameters were adjusted multiple times, incorporating controlling factors and sedimentary facies distribution features, to complete the model setup (Table 1).
The Dionisos model exhibits inherent limitations arising from its simplified assumptions: The use of a linear empirical formula (Qs = K·S) to correlate sediment flux with slope gradient neglects small-scale hydrodynamic details (e.g., turbulence, critical entrainment thresholds) and nonlinear effects. Dependency on macro-scale parameters (e.g., empirical coefficient K) as substitutes for field-measured data may introduce uncertainties in flux quantification. Kilometer-scale grids and 10,000-year time steps preclude the resolution of channel migration dynamics, grain sorting processes, and short-term episodic events (e.g., floods, turbidity currents) due to the default steady-state transport assumption. Wave influences are indirectly parameterized through gravitational proxies, neglecting realistic littoral processes. While suitable for basin-scale long-term evolution simulations, the model faces constraints in high-resolution applications and complex hydrodynamic scenarios.

3.4. Sedimentary Model Establishment

The shallow marine turbidity current sedimentary model of the X Gas Field differs from the idealized turbidity current deposition model in certain aspects. The idealized turbidity current sedimentation model typically includes three regions:
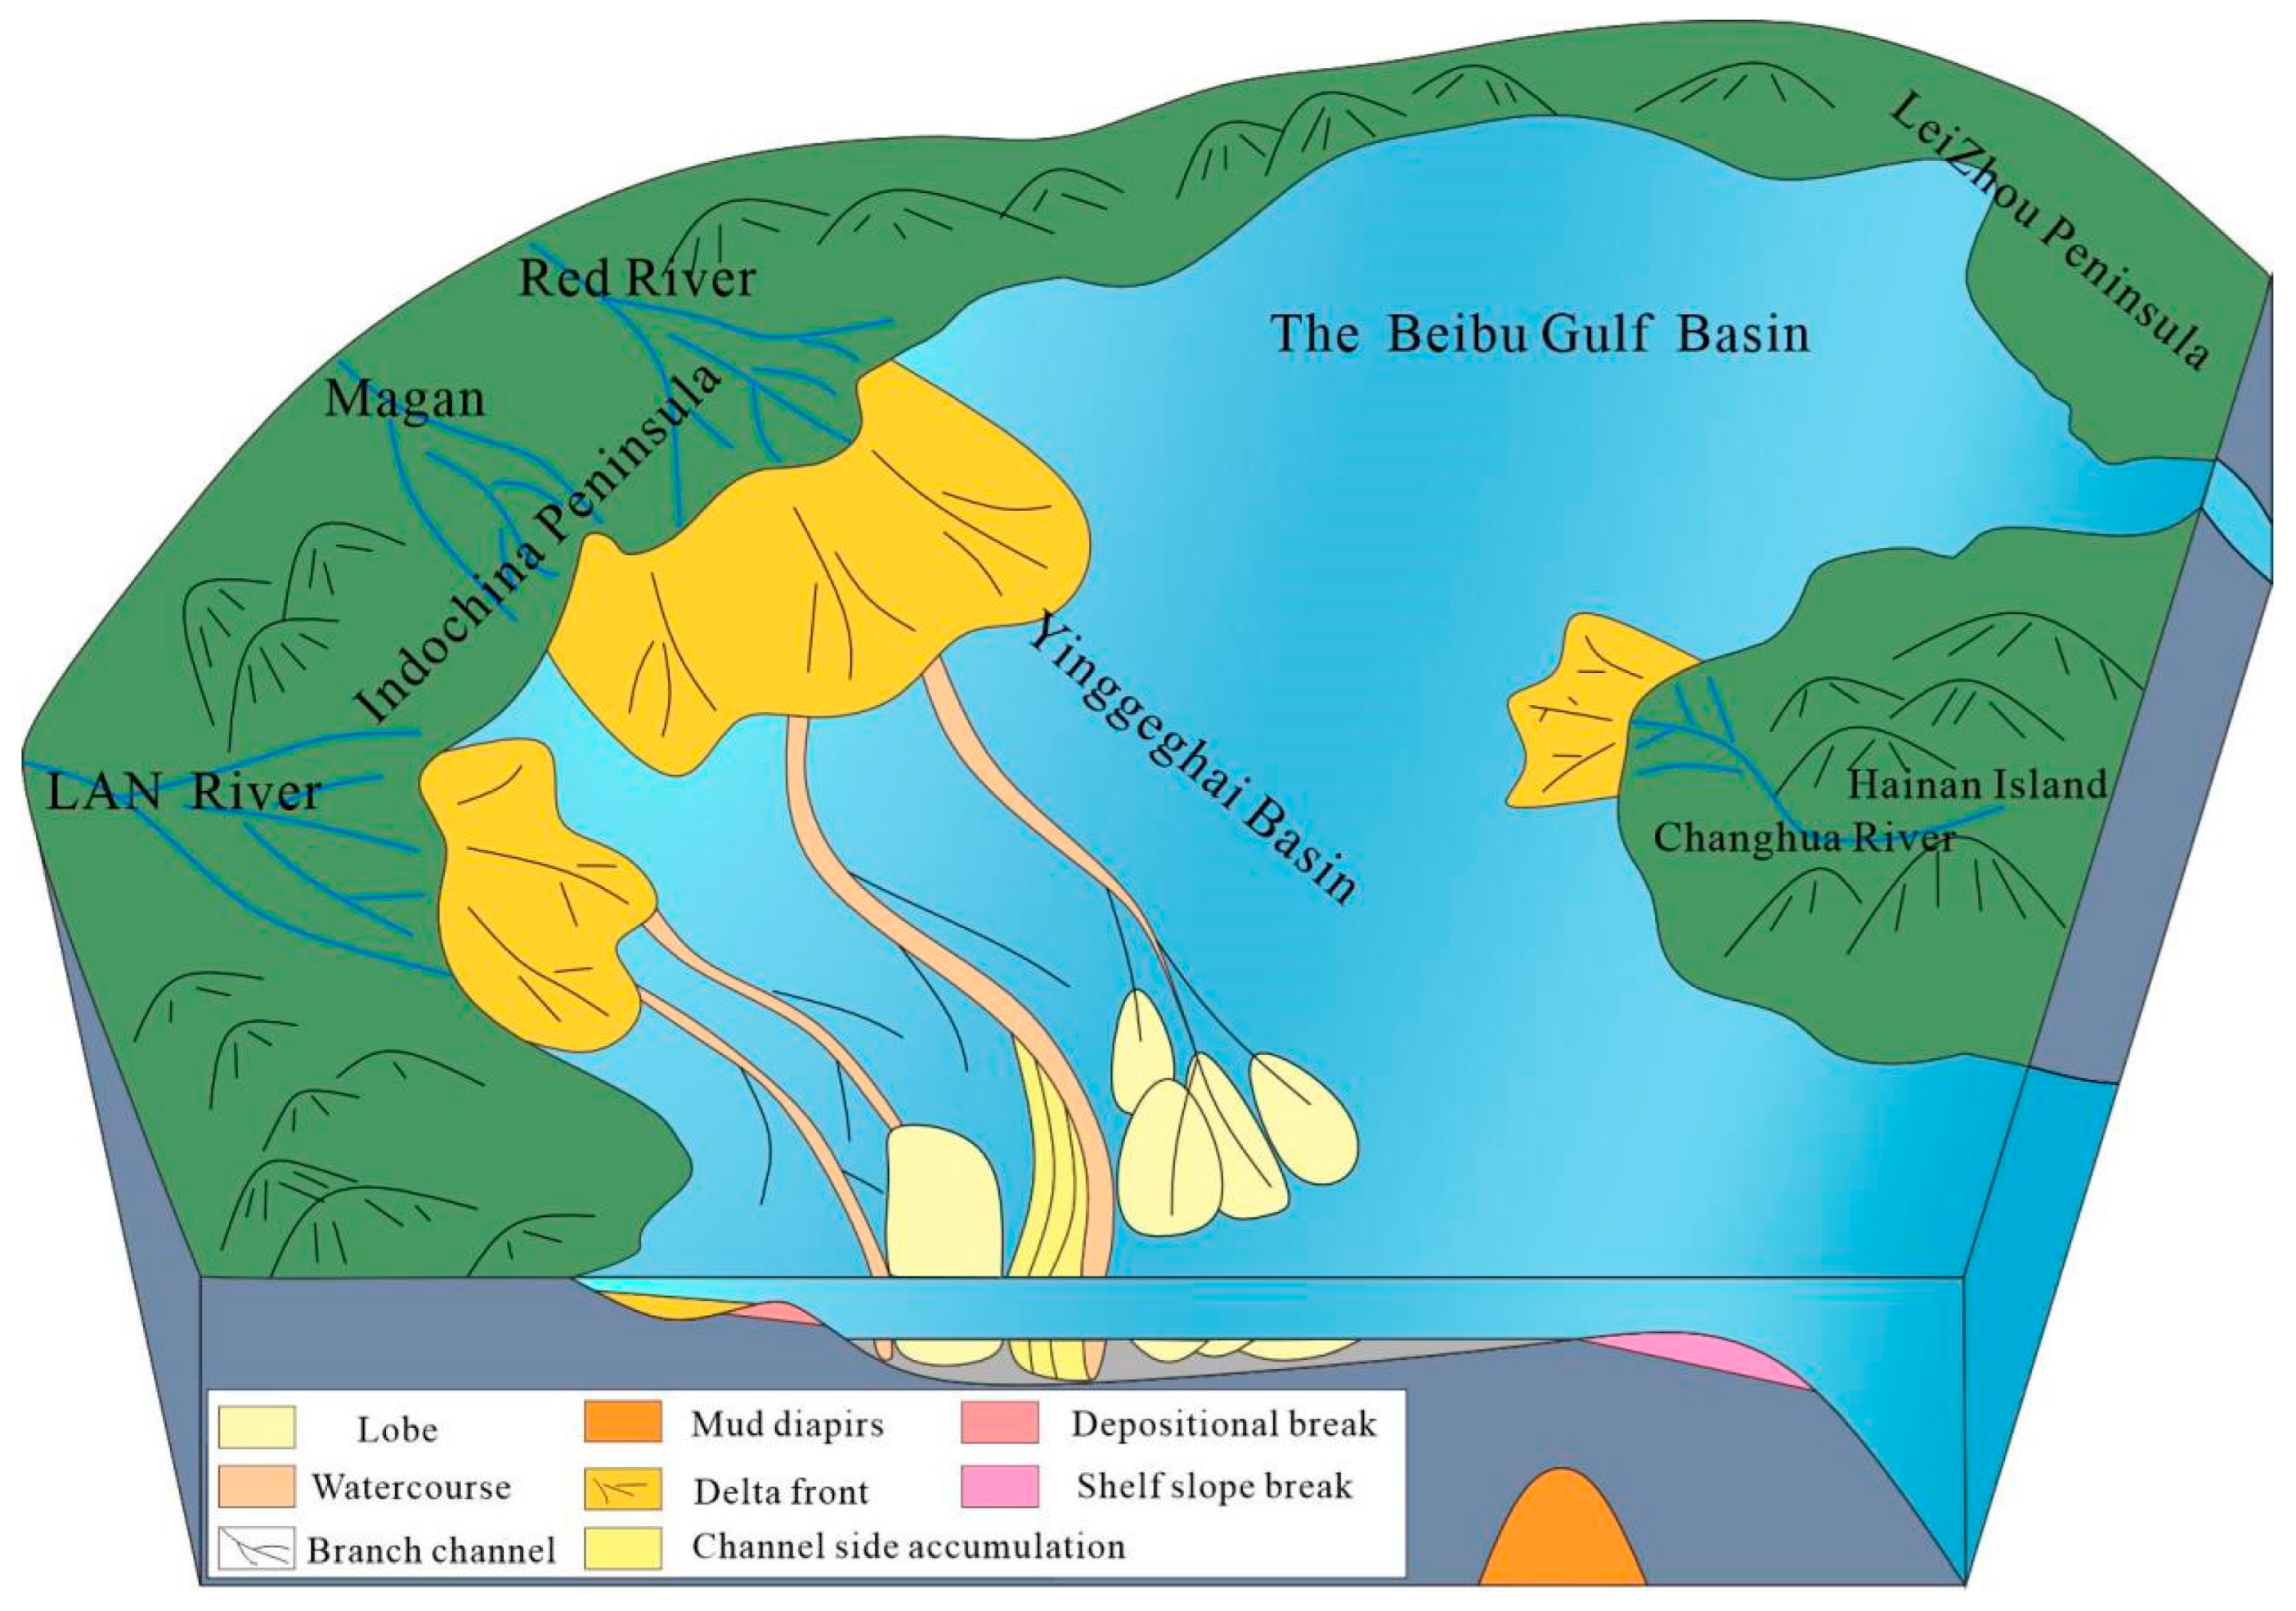
  • Provenance Accumulation Zone: Sediment from the nearshore source is continually deposited along the shelf edge, forming a provenance accumulation zone.
  • Turbidite Channel Zone: In this zone, the sediments become unstable under certain triggers and slide down the slope, forming block flow deposits. If these block deposits are transformed into turbidity currents, the resulting channel is referred to as a turbidite channel [36,37,38,39,40,41]. Turbidite channels are key geomorphic units connecting the shelf, slope, and deep-sea basin, serving as crucial sites for transporting and depositing terrestrial clastic sediments into the deep sea [42]. The region dominated by these channels is called the transition zone.
  • Distal Mound Zone: The channel typically extends to the basin floor, where the turbidity current energy diminishes, flow velocity decreases, and mound-like deposits form at the distal end. These three regions exhibit distinct geological features, which are crucial for the identification of turbidity current systems and the exploration and development of oil and gas resources [38].
Based on the comprehensive analysis of core, grain size, drilling, seismic, and other geological data, along with literature research and existing geological understanding, a shallow marine turbidity current sedimentary model for the Yinggehai Formation Ying’er Member of the X Gas Field was established (Figure 6). The primary difference between this model and the idealized turbidity current model is that the turbidity current deposits in the X Gas Field are developed on the shelf slope break zone.
In this area, the following occurs:
  • The provenance from the northwest Red River region is obstructed by the sedimentary slope break, forming an accumulation zone.
  • Sediments become unstable and slide down the continental slope, forming turbidite channels.
  • Due to high areas formed by the basement uplift in the southern part of the study area, turbidity current velocity slows down, and mound-like deposits (mounds) form.
  • High-energy turbidity currents bypass the basement high areas, laterally migrating to form channel-side accumulation bodies, and continue to move downward.
This model reflects the unique geological setting of the X Gas Field and the development of turbidity current systems in response to regional tectonic and sedimentary conditions.

4. Results

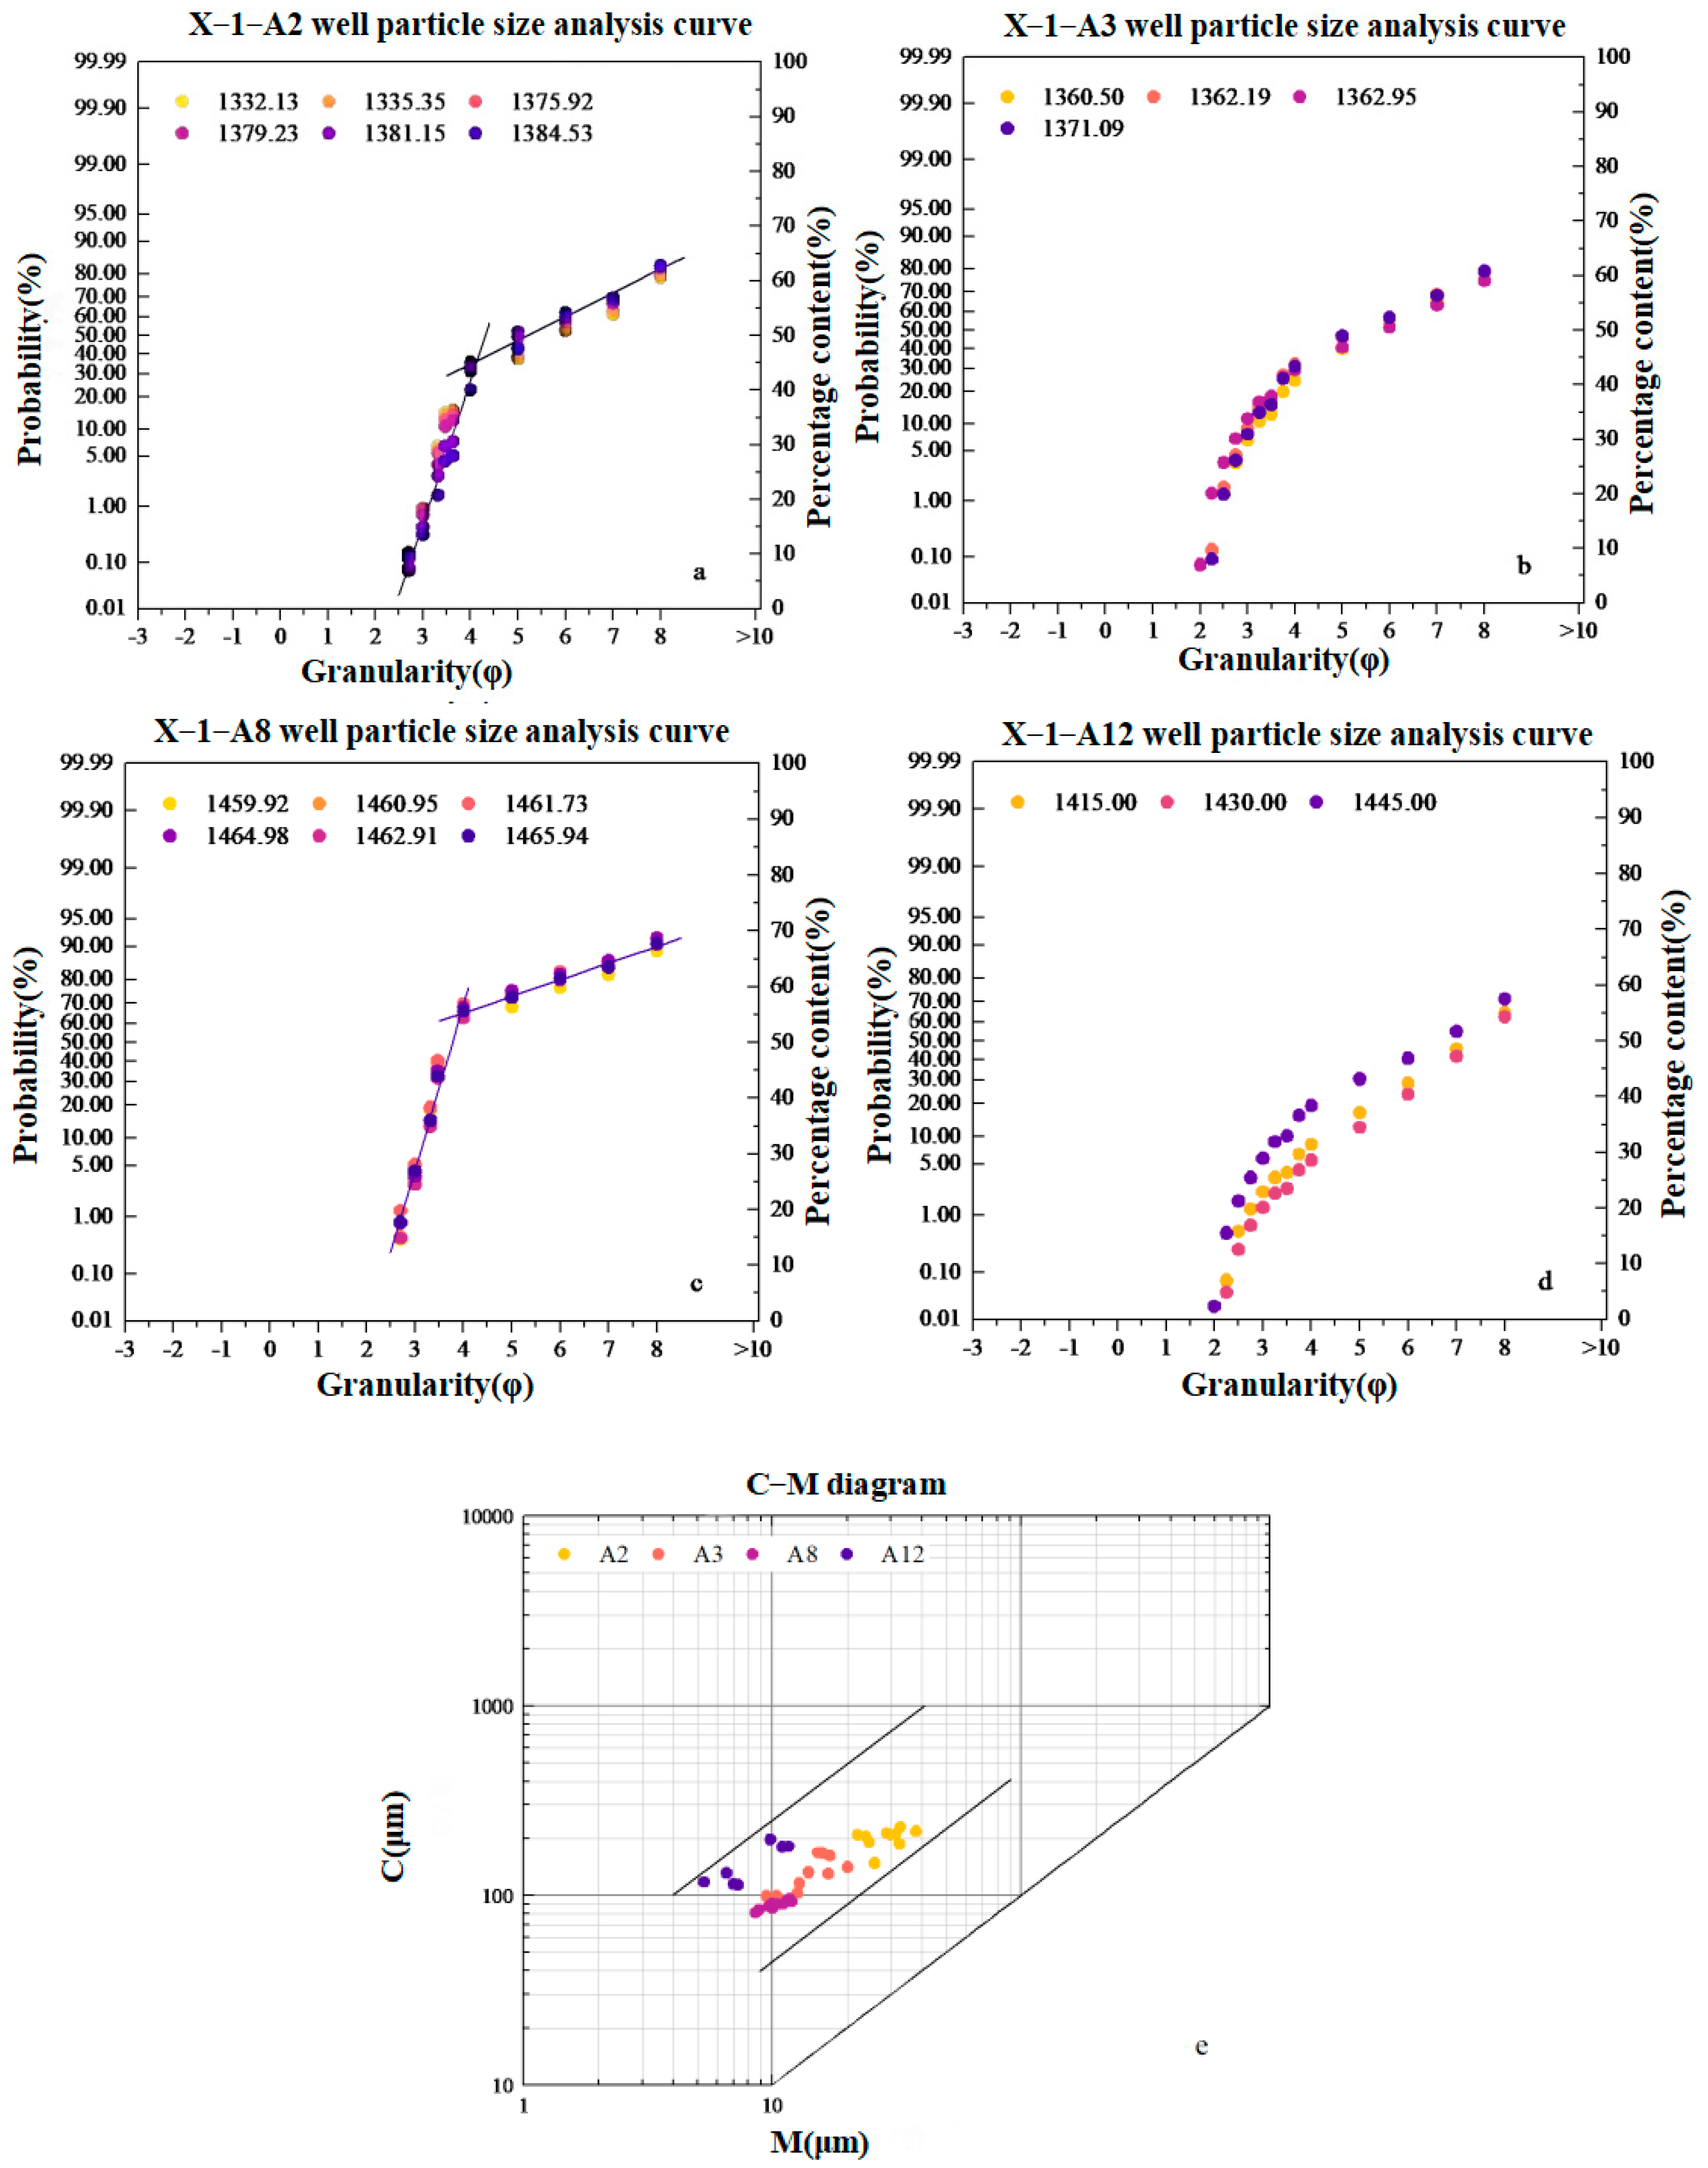
4.1. Petrological Characteristics

The core samples from the X Gas Field show distinct turbidity current sedimentary characteristics. The combination of biogenic traces and foraminiferal data analysis identified a shallow marine shelf environment [43], with some atypical features. Under relatively shallow water depths, there is a possibility of underflow transformation and destruction of the top sediment [23].
Grain size is the most important structural characteristic of clastic rocks, and the grain size directly determines the rock type and properties. The grain size distribution and sorting of clastic rocks can quantify the energy of the transporting medium and are important indicators for determining the depositional period, depositional environment, fluid properties, and hydrodynamic conditions [44].
Based on detailed observation and description of the target layer core, the grain size probability curves of the study area were divided into two basic types: jump-suspension two-segment type and wide, gentle arch type, using interval distribution, component content percentage, linear slope, and intersection points from the grain size probability plot. These characteristics, combined with macroscopic core features and bedding changes, were analyzed.
  • Jump-Suspension Two-Segment Type:
This type is typified by wells X-1-A2 and X-1-A8 (Figure 7a,c). The curve consists of two segments: a high-slope jump segment and a low-slope suspension segment, with their intersection point around 4φ. The sorting is relatively good, and the core mostly consists of light gray sandstone, exhibiting normal grading bedding (Figure 2k), which indicates a channel deposition environment under strong hydrodynamic conditions. The grain size in X-1-A8 is coarser, with a jump component content of 68%, significantly higher than X-1-A2’s 38%, and a higher slope and better sorting, reflecting stronger sedimentary dynamics in X-1-A8 compared to X-1-A2. It is speculated that X-1-A8 is located in the main channel development zone, while X-1-A2 is in a branch channel zone with relatively weaker hydrodynamic conditions.
2.
Wide, Gentle Arch Type:
Wells X-1-A3 and X-1-A12 exhibit typical wide, gentle arch characteristics in their cumulative grain size probability curves (Figure 7b,d). These curves lack rolling components and develop suspension and jump sub-populations. The transition between the suspension and jump sub-populations is relatively smooth. The sorting is poorer, and the core is mainly gray muddy sandstone with inverse grading bedding (Figure 2l), indicating deposition of mound bodies at the distal end of the channel under relatively weak hydrodynamic conditions. X-1-A3 exhibits coarser grain size, with a lower content of suspension components compared to X-1-A12, suggesting that X-1-A3 is in a mound body zone closer to the provenance, while X-1-A12 is located further away from the provenance.
In the C-M plot (Figure 7e), the 38 sample data points form a linear relationship parallel to the C=M line, which characterizes the turbidity current sedimentary features of the region.

4.2. Shallow Marine Turbidity Current Sedimentary Evolution Process

From the longitudinal evolutionary process, the deposition period of the Yinggehai Formation Ying’er Member, particularly the III gas group, occurred during the early lowstand phase. During this phase, turbidity currents were transitioning from weak to gradually stronger energy. The sediment grain size was relatively fine, with muddy sandstone being the dominant lithology. In the II gas group period, turbidity current energy reached its peak, and the sediment developed coarser grain sizes, primarily consisting of sandstone. After this peak, the turbidity current energy gradually weakened, and the mud content of the sediments increased. This led to the development of large mudstone deposits (Figure 8 and Figure 9).
From a lateral evolutionary perspective, the sedimentation of the Yinggehai Formation Ying’er Member began in the early lowstand phase. Although there were fluctuations at sea level, the overall trend was a decline, with turbidity current energy gradually increasing. In the early stages, the provenance from the northwest Red River region supplied sediment, which traveled southward along the main channel, passing through the study area. The scale of the sedimentary system expanded to the south, where it began to experience lateral migration and oscillation, forming channel-side accumulation deposits (Figure 10a).
Branch channels mainly developed in the northeastern part of the study area. In the central part, where basement uplift created relatively high areas, the turbidity current velocity decreased. Sediments began to spill over the channel walls and accumulated to form mound bodies (Figure 10b).
In the later stages, with the continued decline in sea level, turbidity current energy progressively increased, and the scale of deposition expanded. Channels gradually widened, and the scale of channel-side accumulation deposits in the south also grew as the channels migrated. The smaller mound bodies that had formed in the central region during the early stages started to connect laterally and stack vertically, gradually evolving into large mound body complexes (Figure 10c).
Overall, the turbidity current energy was stronger in the northern part of the study area and weaker in the southern part, leading to relatively straight channels in the north and more curved channels in the south. As turbidity current energy continued to increase, supported by a stable and ongoing supply of sediment, the turbidity current sedimentation progressively advanced southward, with the overall scale of the sedimentary system continuously expanding (Figure 10a,b).

4.3. Shallow Marine Turbidity Current Sedimentary Model

4.3.1. Control Factor Analysis

Relative sea level changes exert profound control on the provenance input pathways and depositional dynamics of shallow marine turbidite systems (e.g., accommodation space variations and sediment supply rate fluctuations) by regulating terrigenous clastic influx and basin paleogeomorphic configurations [45]. During the regressive phase of the Second Member of the Yinggehai Formation deposition, which predominantly occurred in a lowstand systems tract [23], falling sea levels triggered shelf exposure and enhanced fluvial incision, promoting the southeastward progradation of erosional materials from the northwestern provenance via extended channel networks. As accommodation space decreased, turbidity current energy progressively accumulated during basinward migration, amplifying erosional-transport capacity to reshape paleotopography (e.g., incised valleys, step-like slopes) and drive depositional expansion into southern low-lying areas. Frequent sea level fluctuations resulted in vertical stacking of multistage turbidite events, forming thick, laterally continuous composite sand bodies. Vertical grain-size trends and depositional cyclicity reflect dynamic responses to turbidity current energy attenuation and depocenter migration, ultimately shaping the spatial distribution of multiphase turbidite reservoir units in the X Gas Field.
The spatial distribution, supply rates, and compositional characteristics of sediment provenance critically influence the formation, development, and evolution of shallow marine turbidite systems. The Yinggehai Basin comprises three potential provenance regions: the northwestern Red River provenance, the western Central Vietnam provenance, and the eastern Hainan Island provenance [24]. The ZTR index (zircon–tourmaline–rutile heavy mineral assemblage ratio), serving as a provenance maturity indicator, reflects proximal rapid deposition at low values and distal high-maturity clastics at elevated values. During the deposition of the Second Member of the Yinggehai Formation, sea level fall facilitated bidirectional sediment supply from the Red River and Vietnam provenances, evidenced by moderate ZTR indices (55–65%) and elevated leucoxene content (>15%). The presence of 2000–3500 Ma zircon U-Pb age populations in detrital spectra confirms dominant control by the northwestern Red River (Proterozoic basement-derived) and western Vietnam (Indonesian metamorphic rock-derived) provenances, with limited influence from the eastern Hainan Island provenance on the target reservoirs of the X Gas Field [46]. By the late depositional stage of the Second Member, tectonic activity and sea level fluctuations triggered a provenance shift, initiating input of low-maturity proximal clastics from the eastern Hainan Island source (ZTR index decreased to 45%, lithic fragment content increased to 30%) [23]. The spatio-temporal coupling of multiple provenances, through depositional flux modulation, governed reservoir heterogeneity and paleogeomorphic evolution, providing critical geological constraints for turbidite sandbody exploration in the X Gas Field.
The depositional substrate (paleotopography) governs the migration pathways and spatial architecture of shallow marine turbidite deposits [18], controlling the spatial distribution and external geometry of sand bodies [47]. In the Second Member of the Yinggehai Formation within the X Gas Field, the interplay of depositional slope breaks and mud–diapir activity shaped a northwest-to-southeast tilted paleotopography across the study area. This paleogeomorphic configuration critically regulates sediment provenance by modulating erosional efficiency and transport conduits: during lowstand periods, enhanced shelf exposure, and fluvial incision in the northwestern Red River provenance facilitated the delivery of high-maturity quartz clasts through paleo-channel systems toward the basin center, while the uplifted diapiric structures in the southeastern sector acted as a natural barrier, restricting the westward dispersal of coarse-grained proximal detritus from the eastern Hainan Island source and forcing sediment partitioning into distinct geomorphic domains. Turbidity currents originating from the north were obstructed by diapir-induced topographic highs, leading to diminished hydraulic energy and transport capacity, which promoted the accumulation of extensive lobe complexes in the central study area. Subsequent turbidity currents partially reworked pre-existing lobes, bypassing the modified high-relief zones and laterally migrating into low-lying areas, resulting in channel widening and lateral accretion features.

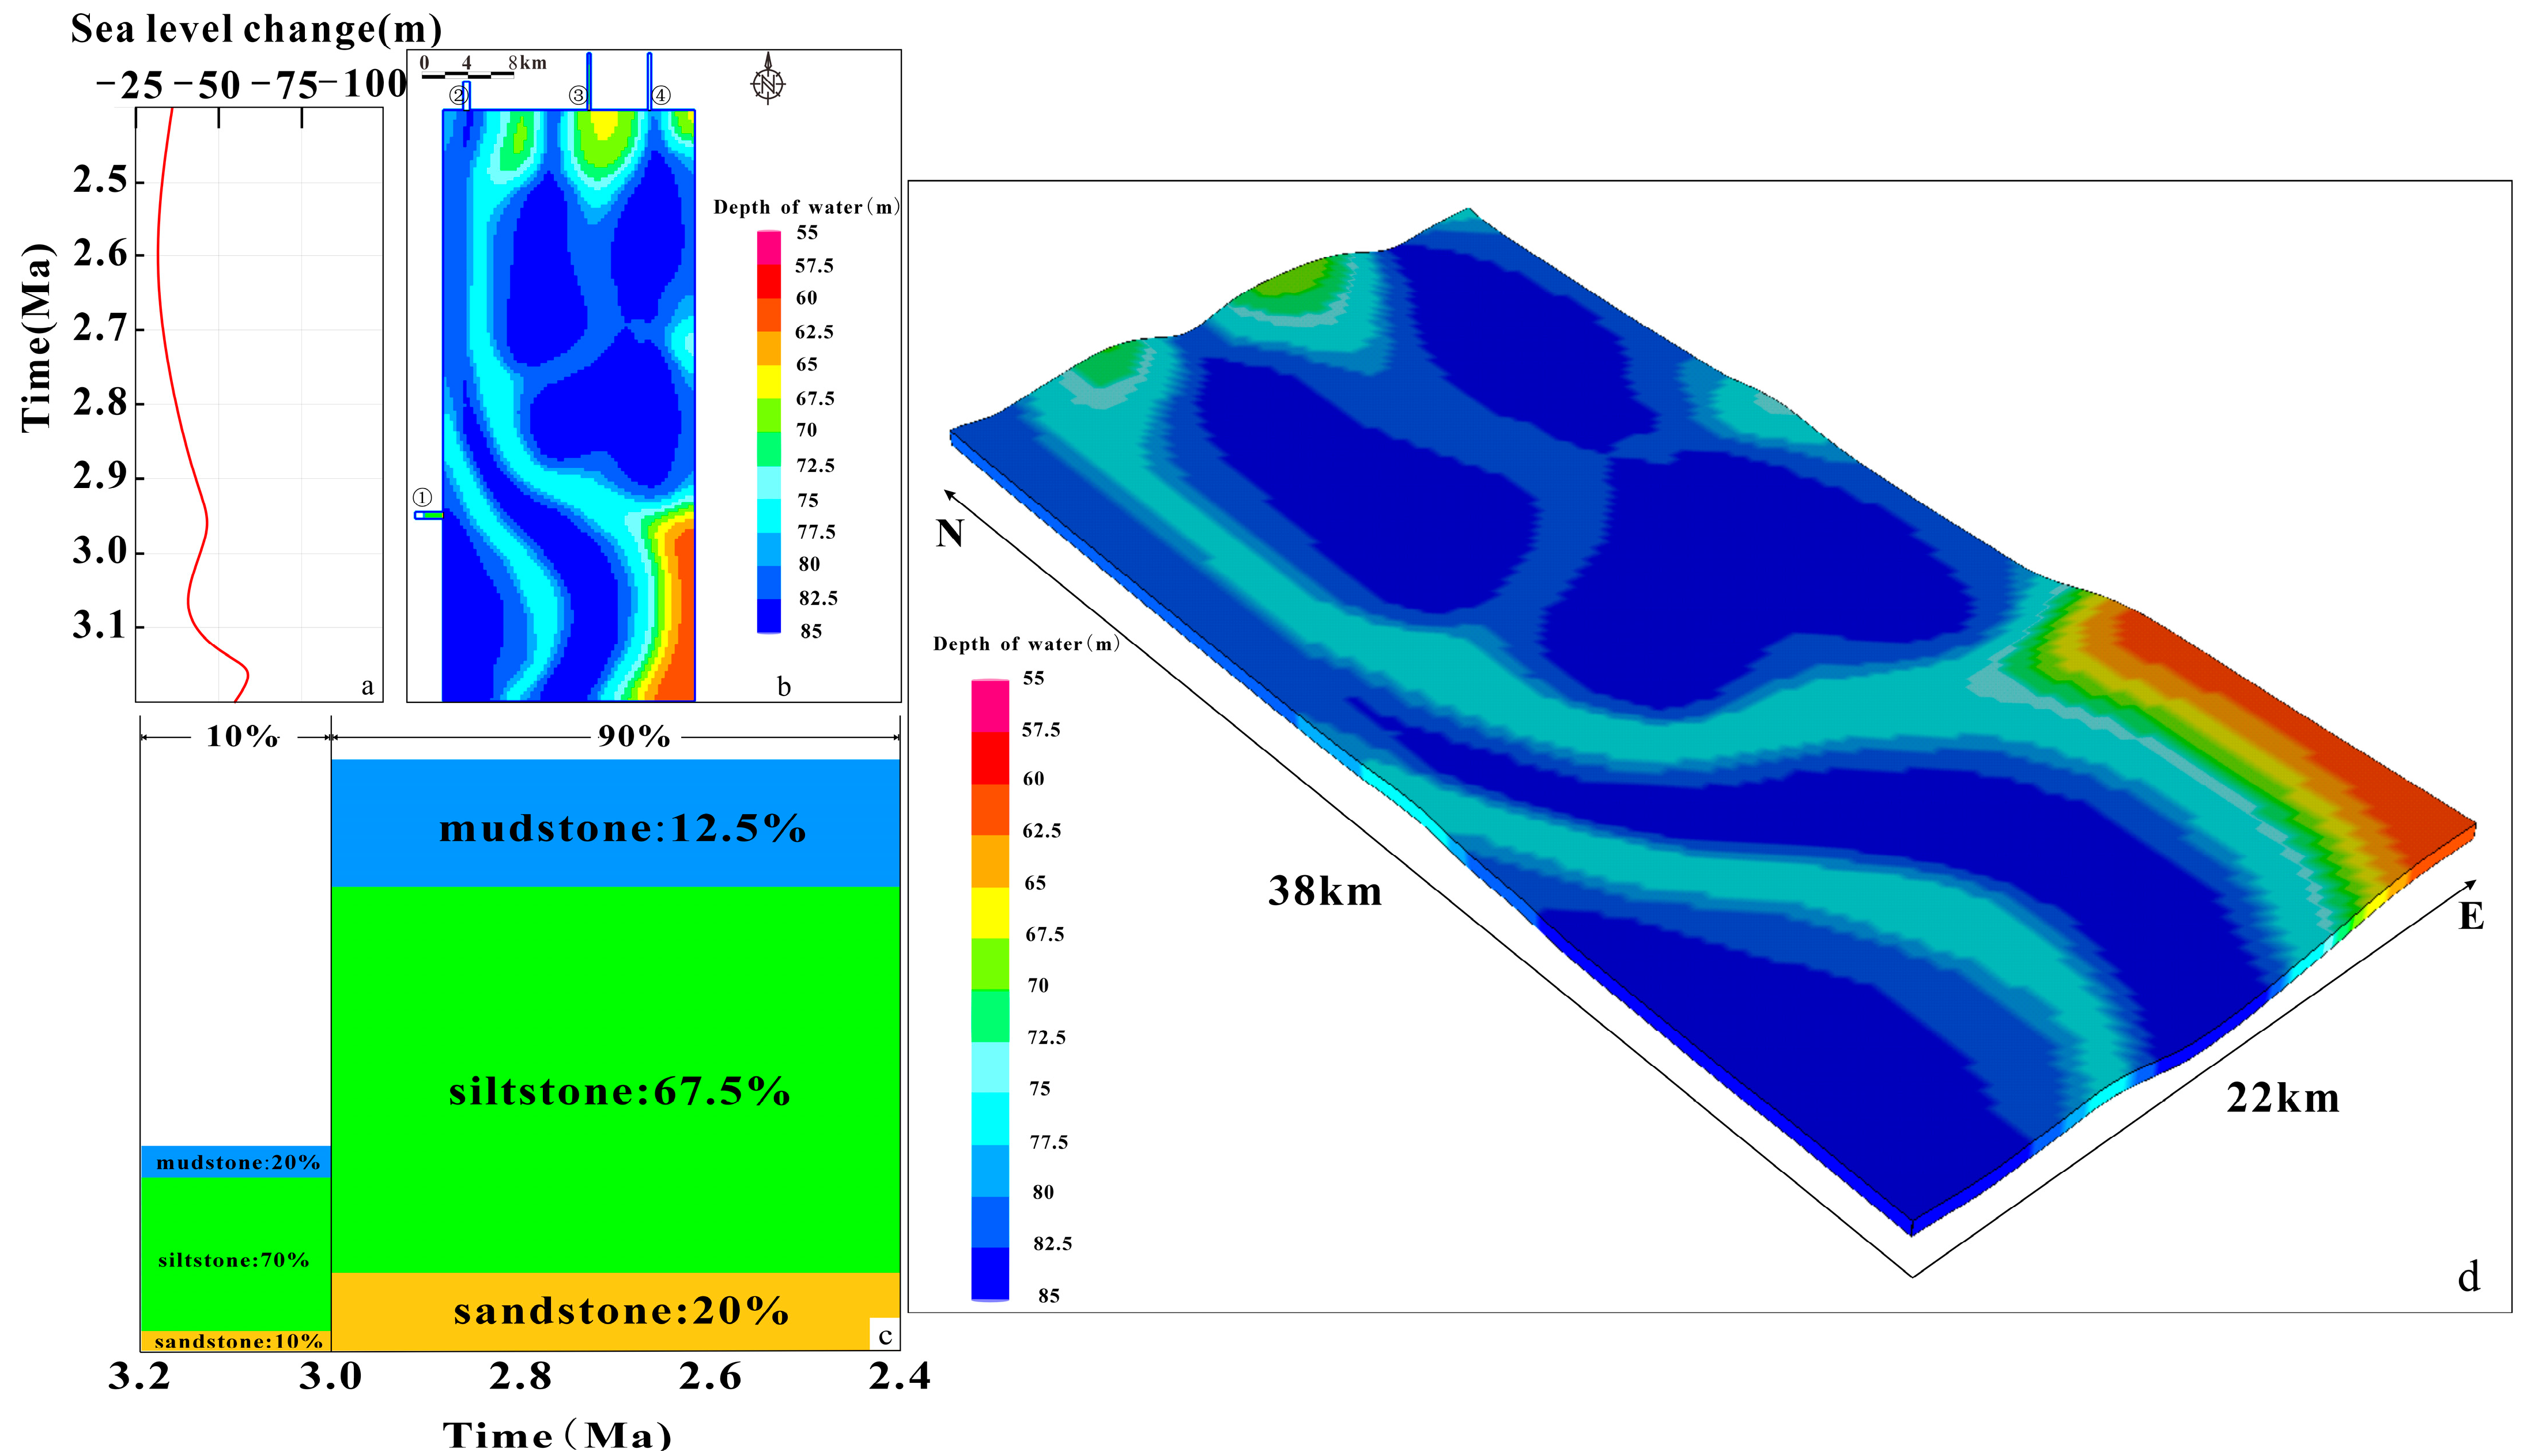
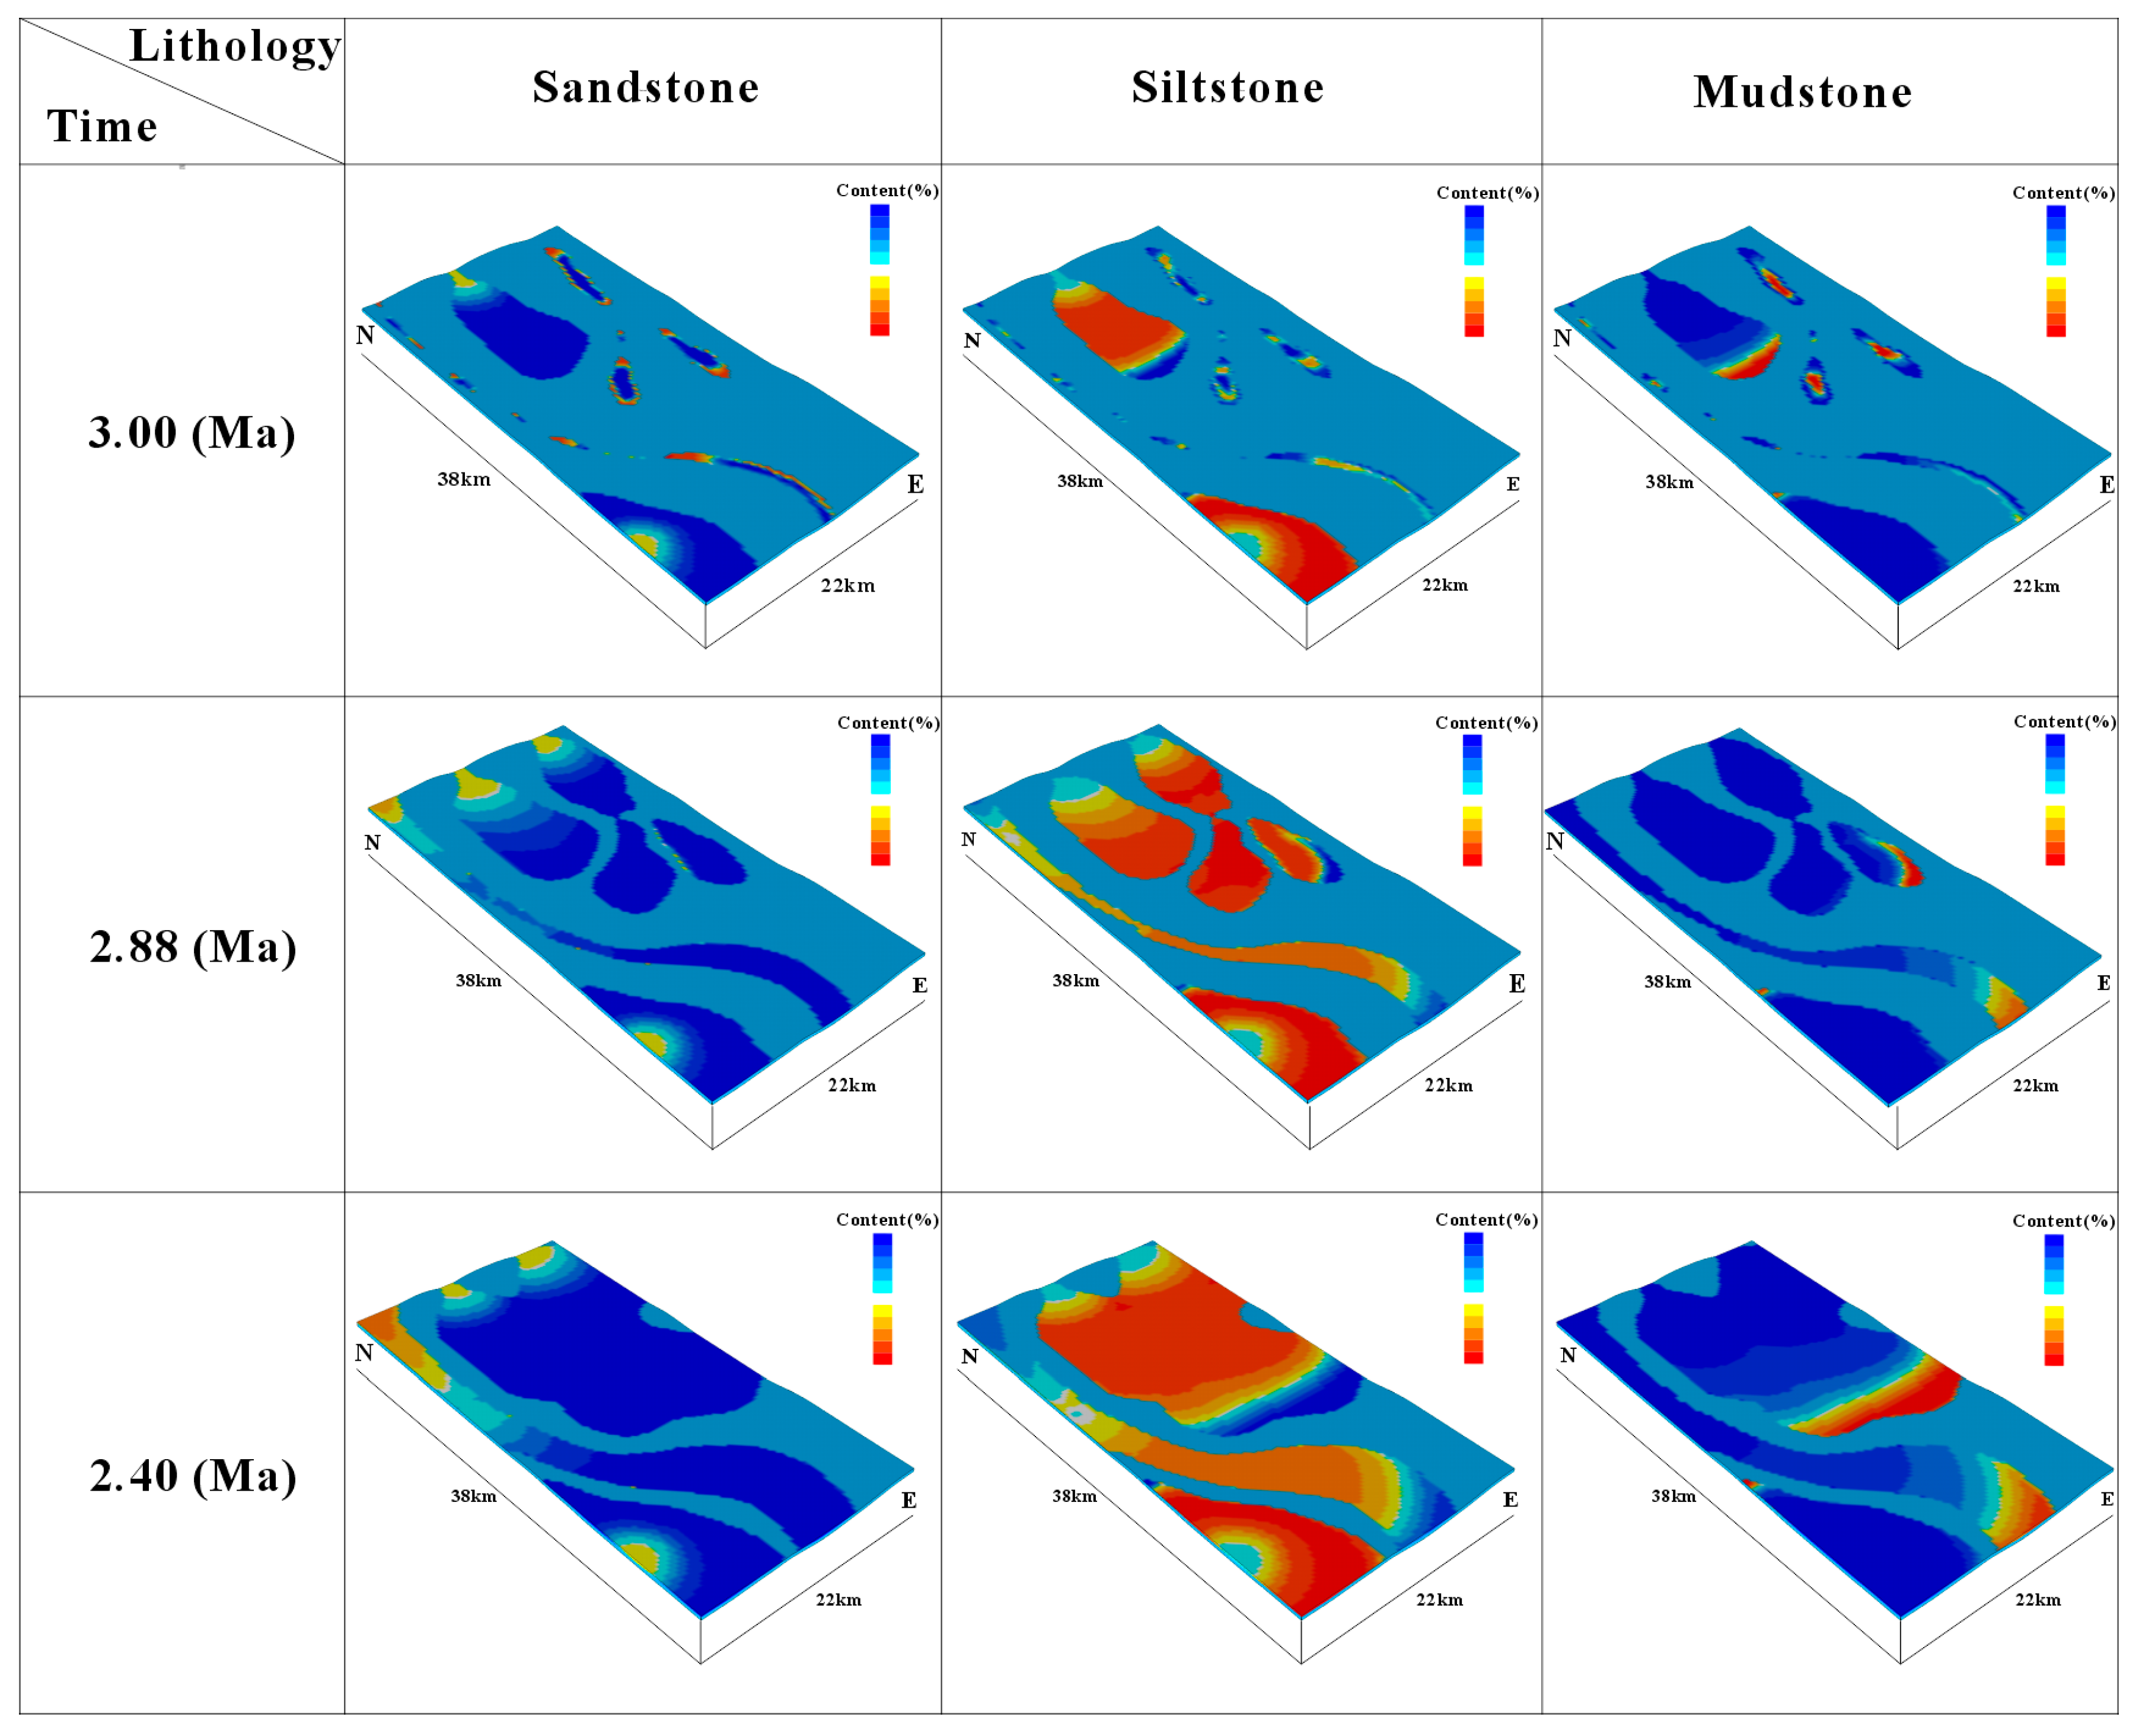
4.3.2. Sedimentary Numerical Simulation Results Analysis

The results of the sedimentary numerical simulation successfully reproduced the evolution of the shallow marine turbidity current deposition system in the study area on a three-dimensional scale. The simulation depicted the distribution range of sand and mud during different sedimentary periods, and showed the complex relationship between mound body formation and lateral migration of channels (Figure 5), which aligns well with the existing geological understanding.
Simulation Results(Figure 11):
A.
2.40–3.00 Ma: During this period, early mound bodies formed in the central and northern parts of the study area, as well as in the southwest, but they were isolated with considerable distance between them. The channels had developed to some extent, but deposition was not significant, and no lateral migration was observed. The turbidity currents bypassed the mound bodies, leading to the formation of elevated areas, resulting in bending. The sand bodies were concentrated at the base and middle parts of the mound bodies, while the front end was rich in mud.
B.
3.00–2.88 Ma: With an increase in sediment supply, sediment overflow occurred in some branch channels, leading to the formation of late-stage mound bodies. The areas of the early mound bodies continued to grow, and the distance between them decreased, though they were still isolated. The main channel deposition became more prominent, and lateral migration began to appear in the southern part. The sand body area expanded, while the ends of both the channels and mound bodies became increasingly rich in mud.
C.
2.88–2.40 Ma: The extent of the mound bodies continued to expand, with lateral connections and vertical superimposition occurring between the mound bodies. This meant that isolated mound bodies connected laterally, and late-stage mound bodies covered earlier mound bodies. In the central part of the study area, a large mound body complex was formed, presenting a sheet-like shape, thinning gradually in the direction of the short axis of the model. The channel system widened overall, and the southern lateral migration ceased to increase significantly, with channel-side accumulation phenomena becoming more pronounced.
These results indicate a clear evolutionary process of turbidity current deposition in the study area, from isolated mound bodies to large-scale mound body complexes, as well as the progressive widening and migration of channels, with significant lateral accumulation occurring towards the southern part of the study area. The sedimentary patterns observed in the simulation correspond well with the real geological data, providing insight into the dynamic changes in sedimentary environments over time.

5. Conclusions

(1)
The shallow marine turbidity current sedimentary system of the Yinggehai Formation Ying’er Member in the X Gas Field develops four sedimentary units: channel, channel-side accumulation, mound body, and shelf mud. These units show distinct differences in core characteristics, grain size features, well log facies, and seismic facies.
(2)
The turbidity current energy evolved from weak to strong and then back to weak over time. In the X Gas Field, this resulted in a vertical lithologic sequence of mudstone, sandstone, and mudstone. Laterally, in the early stage, isolated mound bodies were deposited in the central and southwestern parts of the study area. Channels developed along the long axis direction, with relatively small scale and no lateral migration. In the middle to late stages, branch channels in the northwest evolved into mound bodies, with isolated mound bodies starting to connect laterally and stack vertically. A larger mound body complex developed in the central part of the study area, the main channel scale expanded, and lateral migration occurred in the southern part, forming channel-side accumulation bodies.
(3)
The shallow marine turbidity current sedimentary model in the X Gas Field is mainly controlled by relative sea level fluctuations, changes in sediment supply, and the evolution of the sedimentary basement (paleogeomorphology). During the deposition of the Ying’er Member, the sea level exhibited an overall fluctuating downward trend. The continuously increasing turbidity current carried terrestrial clastic material from the northwest Red River provenance zone down the continental slope, where sedimentation was controlled by the slope break and blocked by high areas formed by basement uplift. This process resulted in the formation of turbidity current sedimentary systems on the upper shelf.
(4)
Using sedimentary numerical simulation techniques, and by controlling the sea level, sediment supply, and sedimentary basement (paleogeomorphology), the evolution of the shallow marine turbidity current system in the X Gas Field was reconstructed. The simulation results show a high degree of correlation with the actual geological data and are consistent with existing geological understanding.

Author Contributions

Conceptualization, J.W. and L.L.; methodology, Y.X.; software, J.W.; validation, J.W., L.L. and Y.X.; formal analysis, J.W.; investigation, Y.X.; resources, G.X. and Z.Z.; data curation, G.Z.; writing—original draft preparation, J.W. and L.L.; writing—review and editing, J.W., L.L. and Y.X.; visualization, J.W. and Y.X.; supervision, L.L., G.X. and Z.Z.; project administration, L.L.; funding acquisition, L.L. All authors have read and agreed to the published version of the manuscript.

Funding

This study was supported by the following projects: Subproject 6 of the National Science and Technology Major Project for New Oil & Gas Exploration and Development (No. 2024ZD1402700, “Hydrocarbon Accumulation Mechanisms and Key Exploration & Development Technologies in the South China Sea”): “Research on Key Technologies for Development Geology and Reservoir Engineering in Ultra-Deepwater Ultra-Shallow Gas Fields” and Xi’an Shiyou University Graduate Student Innovation and Practical Ability Training Program (YCX2513099).

Data Availability Statement

The data in this study can be obtained at the request of the corresponding author because the data involve confidentiality.

Conflicts of Interest

Author Guoqing Xue is employed by the company Hainan Branch of CNOOC (China) Co., Ltd. and author Zhongpo Zhang is employed by the company Science and Technology Research and Development Center of Sinopec Geophysical Company. The remaining authors declare that the research was conducted in the absence of any commercial or financial relationships that could be construed as a potential conflict of interest.

References

  1. Galloway, W.E.; Hobday, D.K. Terrigenous Clastic Depositional Systems; Springer: Berlin/Heidelberg, Germany, 1996. [Google Scholar]
  2. Zhao, C.; Zhu, X. Sedimentary Petrology, 3rd ed.; Petroleum Industry Press: Beijing, China, 2001; p. 407. [Google Scholar]
  3. Tokuhashi, S. Shallow-marine turbiditic sandstones juxtaposed with deep-marine ones at the eastern margin of the Niigata Neogene backarc basin, central Japan. Sediment. Geol. 1996, 104, 99–116. [Google Scholar] [CrossRef]
  4. Hampson, G.J.; Procter, E.J.; Kelly, C. Controls On Isolated Shallow-Marine Sandstone Deposition and Shelf Construction: Late Cretaceous Western Interior Seaway, Northern Utah and Colorado, U.S.A. 2008. Available online: https://pubs.geoscienceworld.org/sepm/books/edited-volume/1383/chapter-abstract/10815784/Controls-on-Isolated-Shallow-Marine-Sandstone?redirectedFrom=fulltext (accessed on 28 April 2025).
  5. Pattison, S.A.J. Storm-influenced prodelta turbidite complex in the lower Kenilworth Member at Hatch Mesa, Book Cliffs, Utah, U.S.A.; implications for shallow marine facies models. J. Sediment. Res. 2005, 75, 420–439. [Google Scholar] [CrossRef]
  6. Huang, Y.; Tan, X.; Liu, E.; Wang, J.; Wang, J. Sedimentary processes of shallow-marine turbidite fans: An example from the Huangliu Formation in the Yinggehai Basin, South China Sea. Mar. Pet. Geol. 2021, 132, 105191. [Google Scholar] [CrossRef]
  7. Huang, Y.; Yao, G.; Zhou, F. Provenance Analysis of Shallow Marine Gravity Flow Sand Bodies in the Huangliu Formation of the Yinggehai Basin and Its Petroleum Geological Significance. Earth Sci. 2016, 41, 1526–1538. [Google Scholar]
  8. Wang, H.; Chen, S.; Jiang, S. Can large gravity flow deposits accumulate and develop in a shallow sea background? Earth Sci. 2022, 47, 3867–3868. [Google Scholar]
  9. Põldsaar, K.; Ainsaar, L.; Nemliher, R.; Tinn, O.; Stinkulis, G. A siliciclastic shallow-marine turbidite on the carbonate shelf of the Ordovician Baltoscandian palaeobasin. Est. J. Earth Sci. 2019, 68, 1–14. [Google Scholar]
  10. Fenton, M.W.; Wilson, C.J.L. Shallow-water turbidites: An example from the Mallacoota Beds, Australia. Sediment. Geol. 1985, 45, 231–260. [Google Scholar] [CrossRef]
  11. Nelson, C.H. Modern Shallow-water Graded Sand Layers from Storm Surges, Bering Shelf: A Mimic of Bouma Sequences and Turbidite Systems. J. Sediment. Res. 1982, 52, 537–545. [Google Scholar]
  12. Winn, R.D.; Bishop, M.; Gardner, P.S. Lewis Shale, South-Central Wyoming: Shelf, Delta Front, and Turbidite Sedimentation; Wyoming Geological Association: Casper, WY, USA, 1985. [Google Scholar]
  13. Went, D.J. Alluvial fan, braided river and shallow-marine turbidity current deposits in the Port Lazo and Roche Jagu formations, Northern Brittany: Relationships to andesite emplacements and implications for age of the Plourivo-Plouézec Group. Geol. Mag. 2017, 154, 1037–1060. [Google Scholar] [CrossRef]
  14. Okay, S. Morphological and stratigraphic investigation of the holocene subaqueous shelf fan, north of istanbul strait in the black sea. Turk. J. Earth Sci. 2011, 20, 287–305. [Google Scholar]
  15. Ge, Z.; Xu, H. Hydrodynamic and sedimentary responses of turbidity currents to complex tectonic landforms. J. Palaeogeogr. 2023, 25, 1090–1117. [Google Scholar]
  16. Yu, J.; Yang, T.; Tian, J.; Cai, L.; Ren, Q.; Guo, W. Several basic sedimentological problems and research prospects in deep water gravity flow sedimentary oil and gas exploration. J. Palaeogeogr. 2023, 25, 1299–1314. [Google Scholar]
  17. Wu, J.; Wang, Y.; Wang, H.; Li, H.; Peng, X.; Qiu, Y.; Li, D. Research progress on the interaction between gravity flow and underflow in deep water. Geol. Rev. 2012, 58, 1110–1120. [Google Scholar]
  18. Wang, H.; Chen, S.; Liu, E.; He, J.; Gan, H.; Meng, F.; Nian, W. Sedimentary characteristics and provenance system of typical gravity flow in Yingqiong Basin, northern South China Sea. Bull. Geol. Sci. Technol. 2022, 41, 5–18. [Google Scholar]
  19. Zhou, W.; Zhang, H.; Yang, Z.; Wang, Y.; Hu, W.; Mo, F.; Wang, Y. Sedimentary facies of sandy clastic flow in Dongfang Gas Field, Yinggehai Basin. Sci. Technol. Eng. 2022, 22, 15062–15073. [Google Scholar]
  20. Hui, Z. Study on Reservoir Configuration of High Curvature Gravity Flow Channel in the Second Member of Yinggehai Formation, Dongfang Gas Field. Master’s Thesis, Northwest University, Xi’an, China, 2021. [Google Scholar]
  21. Zhou, W.; Zhang, L.; Ma, Y.; Yang, K.; Guan, L.; Gao, Y.; Chen, S. Study on source-channel-sink of the second Member of the Upper Holocene Ying Formation in Dongfang 1-1 Gas field, Yinggehai Basin. J. Northwest Univ. (Nat. Sci. Ed.) 2021, 51, 459–469. [Google Scholar]
  22. Chen, S. Study on Sedimentary Facies Types and Development Laws of the Second Member of Yinghe Formation, Dongfang Gas Field, Yinggehai Basin. Master’s Thesis, Northwest University, Xi’an, China, 2020. [Google Scholar]
  23. Yue, S.-F.; Zhang, H.; Wang, Q.-S.; Cheng, T.; Li, J.; Chen, X.-W.; Qin, S. New sedimentary understanding of the second member of Yinggehai Formation, Dongfang A Gas field, Yinggehai Basin: Submarine fan turbidite sheet sand. Mar. Pet. Geol. 2017, 22, 11–18. [Google Scholar]
  24. Wang, C.; Liang, X.; Fu, J.; Jiang, Y.; Dong, C.; Yu, S.; Xiang, J.; Zhou, Y.; Wen, S. U-Pb dating of detrital zircon from the second member of Yinggehai Formation, Yinggehai Basin and its provenance significance. Geol. Rev. 2015, 61, 716–717. [Google Scholar]
  25. Feng, C.; Huang, Z.; Tong, C.; Zhu, J.; Fan, H.; Liu, J. Comprehensive evaluation of mudstone cap closure in the second member of Yinggehai Formation, Yinggehai Basin. J. Earth Sci. Environ. 2011, 33, 373–377. [Google Scholar]
  26. Ren, J.; Lei, C. Tectono-stratigraphic framework of Yinggehai-Qiongdongnan Basin and dynamic deformation zoning of the South China Sea. Chin. J. Geophys. 2011, 54, 3303–3314. [Google Scholar]
  27. Sun, X.; Ren, J. The dynamic mechanism of formation and evolution of Yinggehai Basin. Mar. Geol. Quat. Geol. 2003, 45–50. [Google Scholar] [CrossRef]
  28. Yue, S.; Zhang, H.; Yang, Z.; Zhou, W.; Tan, L.; Xue, G. Genetic mechanism analysis of “lateral accumulation” complex of Yinggehai Formation under shallow sea background of Dongfang A gas field. Pet. Geol. Recovery Effic. 2018, 25, 32–37. [Google Scholar]
  29. Li, L.; Zhang, P.; Zou, Y.; Ping, T.; Zhuang, Y.; Wang, X. Shallow sea seismic sedimentary facies in Dongfang X area, Yinggehai Basin. Mar. Geol. Front. 2019, 35, 31–39. [Google Scholar]
  30. Xie, J.; Zhu, Y.; Li, X.; Mai, W.; Zhao, P. Cenozoic sea level change in Yingqiong Basin, northern continental shelf, South China Sea. Mar. Orig. Pet. Geol. 2012, 17, 49–58. [Google Scholar]
  31. Xiao, K.; Tong, H.-M.; Yang, D.-H.; Li, X.; Fan, C.; Zhang, H.; Huang, L. Restoration of paleotectonic landform since Neogene in Yinggehai Basin. Pet. Geol. Exp. 2020, 42, 215–222. [Google Scholar]
  32. Farouk, S.; Saada, S.A.; Fagelnour, M.S.; Arafat, M. Petrophysical and gas chromatographic analysis integration for hydrocarbon identifications in Cretaceous reservoirs, Azhar Field, Beni Suef Basin, Egypt. Egypt. J. Pet. 2024, 33, 7. [Google Scholar] [CrossRef]
  33. Mulder, T.; Etienne, S.; Mulder, T. Lobes in deep-sea turbidite systems; state of the art. Sediment. Geol. 2010, 229, 75–80. [Google Scholar] [CrossRef]
  34. Farouk, S.; Ahmed Saada, S.; Arafat, M.; Al-Kahtany, K.; Gentzis, T.; Zaky, A.S.; Jovane, L. Thermal maturity and gas generation in Upper Cretaceous formations of the Beni Suef Basin, Egypt: Insights from stable carbon isotopes and geochemical analysis of the Azhar-E1X well. Front. Earth Sci. 2025, 13, 1552662. [Google Scholar] [CrossRef]
  35. Farouk, S.; Saada, S.A.; Fagelnour, M.; Tawfik, A.Y.; Arafat, M.; El-Kahtany, K. Geochemical evaluation and basin modelling of the Cretaceous succession in the Azhar Oil Field, West Beni Suef Basin, Egypt. Geol. J. 2024, 59, 1949–1967. [Google Scholar] [CrossRef]
  36. Rao, M.; Zhong, J.; Zhao, Z. Review and Prospect of Turbidity Current Sedimentation Research. Coal Geol. Explor. 2004, 32, 1–5. [Google Scholar]
  37. Posamentier, H.W.; Kolla, V.; Liu, H.Q. Review of Deep-Water Turbidity Current Sedimentation. Acta Sedimentol. Sin. 2019, 37, 879–903. [Google Scholar]
  38. Lowe, D.R. Sediment gravity flows; II, Depositional models with special reference to the deposits of high-density turbidity currents. J. Sediment. Petrol. 1982, 52, 279–297. [Google Scholar]
  39. Lowe, D.R.; Doyle, L.J.; Pilkey, O.H. Sediment gravity flows; their classification and some problems of application to natural flows and deposits. Spec. Publ.-Soc. Econ. Paleontol. Mineral. 1979, 75–82. [Google Scholar] [CrossRef]
  40. Stetson, H.C. The Sediments of the Continental Shelf off the Eastern Coast of the United States. 1938. Available online: https://darchive.mblwhoilibrary.org/handle/1912/1091 (accessed on 19 May 2025).
  41. Wang, P. Deep sea sediments and Earth system. Mar. Geol. Quat. Geol. 2009, 29, 1–11. [Google Scholar]
  42. Nagel, S.; Granjeon, D.; Willett, S.; Lin, A.; Castelltort, S. Stratigraphic modeling of the Western Taiwan foreland basin: Sediment flux from a growing mountain range and tectonic implications. Mar. Pet. Geol. 2018, 96, 331–347. [Google Scholar] [CrossRef]
  43. He, W.-J.; Xie, J.-Y.; Liu, X.-Y.; Li, S. Study on foraminifera biostratigraphy and sedimentary environment in well DF1-1-11, Yinggehai Basin. J. Stratigr. 2011, 35, 81–87. [Google Scholar]
  44. Jiang, Z. Sedimentology, 2nd ed.; Petroleum Industry Press: Beijing, China, 2010; p. 424. [Google Scholar]
  45. Muto, T.; Steel, R.J. Principles of regression and transgression; the nature of the interplay between accommodation and sediment supply. J. Sediment. Res. 1997, 67, 994–1000. [Google Scholar] [CrossRef]
  46. Cao, L.; Jiang, T.; Shao, L.; Sun, H. Middle Mioene-Pliocene Provenance Evolution in Yinggehai Basin, Northwest South China Sea. In Proceedings of the 13th National Conference on Paleogeography and Sedimentology; Thirteenth National Organizing Committee on Paleogeography and Sedimentology: Beijing, China, 2014. [Google Scholar]
  47. Farouk, S.; Fagelnour, M.; Zaky, A.S.; Arafat, M.; Salama, A.; Al-Kahtany, K.; Gentzis, T.; Jovane, L. Petroleum system evaluation: Hydrocarbon potential and basin dynamics in Abu Darag Sub-Basin, Northern Gulf of Suez (Egypt). Minerals 2024, 14, 1154. [Google Scholar] [CrossRef]
Figure 2. Typical core phases of the X Gas Field. (a) X-1-A3 well, 1387.64–1387.84 m: the top section consists of gray mudstone, while the middle and lower parts feature light gray massive muddy sandstone, with abundant muddy clasts identified; (b) X-1-A3 well, 1362.28–1362.48 m: gray sandstone with massive bedding, containing developed muddy clasts; (c) X-1-A2 well, 1348.07–1348.27 m: light gray sandstone with massive bedding, where the “mud-clast gravel” phenomenon is visible; (d) X-1-A2 well, 1346.57–1346.77 m: light gray sandstone with massive bedding, featuring biogenic burrows; (e) X-1-A3 well, 1335.70–1335.90 m: gray muddy sandstone with massive bedding, rich in biogenic traces; (f) X-1-A3 well, 1367.29–1367.49 m: dark gray and gray muddy sandstone, identifiable Bouma sequence Ta (massive bedding), Tb (lower parallel bedding), and Tc (wavy bedding); (g) X-1-A3 well, 1348.08–1348.28 m: dark gray muddy sandstone, developing large trough cross-bedding, with local visibility and liquefaction deformation features at the top; (h) X-1-A3 well, 1334.17–1334.37 m: light gray muddy sandstone with massive bedding, developing dewatering structures; (i) X-1-A3 well, 1370.65–1370.85 m: dark gray muddy sandstone, exhibiting convolute bedding; (j) X-1-A2 well, 1353.59–1353.79 m: light gray massive sandstone, with large-scale trough cross-bedding visible in some areas; (k) X-1-A2 well, 1360.58–1360.78 m: light gray sandstone with normal grading bedding; (l) X-1-A3 well, 1371.17–1371.37 m: gray muddy sandstone, showing inverse grading bedding.
Jmse 13 01107 g002
Figure 3. Criteria for discriminating typical sedimentary units of the X Gas Field. Note: The red curve in the logging phase is the natural gamma curve; Color-filled areas represent variations in seismic attribute intensity, black arrows indicate sedimentary transport directions, and solid lines delineate seismic facies boundaries.
Jmse 13 01107 g003
Figure 4. Typical seismic profile (a) and depositional model (b) of the X Gas Field. (a) The location of typical seismic profiles is shown in Figure 10c.
Jmse 13 01107 g004
Figure 5. Geological model for sedimentary numerical simulation. (a) Sea level change has been revised from the literature [35]; (b) source supply location; (c) provenance and nature; (d) initial water depth of sedimentary forward model.
Jmse 13 01107 g005
Figure 6. Sedimentation pattern of Yinggehai Formation II in the X Gas Field.
Jmse 13 01107 g006
Figure 7. Typical grain size probability cumulative curve (ad) with C-M plot (e) for the X Gas Field.
Jmse 13 01107 g007
Figure 8. Comprehensive histogram of well X-1-A4 in the X Gas Field.
Jmse 13 01107 g008
Figure 9. Comprehensive histogram of well X-1-A3 in the X Gas Field.
Jmse 13 01107 g009
Figure 10. Sedimentary evolution of section II of Yinggehai Formation in the X Gas Field. (a) Early-stage lobe; (b) Mid-stage lobe; (c) Late-stage lobe. Note: X-1-A serves as the prefix for different well designations in the X Gas Field.
Jmse 13 01107 g010
Figure 11. Sedimentary numerical simulation results.
Jmse 13 01107 g011
Table 1. Key parameters for sedimentary numerical modeling.
LithologySandstoneSiltstoneMudstone
Granularity (mm)0.1380.0120.002
Handling speed (km/ka)0.270.784.7
Note: The rock grain size parameters were obtained from laboratory core analysis using a Malvern Mastersizer 3000 laser particle size analyzer (Malvern Panalytical Ltd., Malvern, UK); the transport velocity is evaluated and adjusted based on simulations using the Dionisos Software (Version 2022; IFP Energies nouvelles, Paris, France).
Disclaimer/Publisher’s Note: The statements, opinions and data contained in all publications are solely those of the individual author(s) and contributor(s) and not of MDPI and/or the editor(s). MDPI and/or the editor(s) disclaim responsibility for any injury to people or property resulting from any ideas, methods, instructions or products referred to in the content.

