Abstract
Subsea tunnels cross complex geological structures, such as weathered troughs with fractured rock masses and high permeability, and are prone to water and mud inrush. To minimize the risk of subsea tunnelling, a novel method consisting of a multi-index evaluation system and a computational model using the interval number TOPSIS method was established. The multi-index evaluation system was formed by eight evaluation indices that can potentially affect water and mud inrush: sea depth, subsea tunnel burial depth, scale of weathering trough, interface angle, strength of surrounding rock, permeability of weathering trough, cyclical footage, and grouting reinforced region. The risk levels of water and mud inrush were divided into four grades. Considering the uncertainty of the evaluation indices, an evaluation vector of interval numbers was adopted. The triangular fuzzy number membership function was used to determine the membership degree, and the 1–9 scales method was used to construct the judgment matrices, which can obtain the weight of evaluation indices. Furthermore, the weight values of the evaluation indices combined with the membership degree were used to obtain the result vector, which can be analyzed using the interval number TOPSIS method. This novel assessment method was applied to the FWK15+350 of the Haicang tunnel successfully. The risk level fell into IV, which represents a high-risk section. The results showed a high degree of congruence with the prevailing circumstances, thereby validating the credibility of the proposed methodology.
1. Introduction
With the continuous expansion of transportation infrastructure construction into the sea field, the scale of subsea tunnel construction is becoming larger and larger. The construction of subsea tunnels faces many complex and severe challenges. Compared with land tunnels, subsea tunnels need to cross complex geological structures such as weathered troughs with fractured rock masses and high permeability [1,2,3]. It is prone to water and mud inrush. Therefore, it is crucial to assess the risk of water and mud inrush in subsea tunnels crossing weathered troughs, in order to provide technical support for tunnel safety construction [4].
A combined experimental–numerical methodology was applied to investigate hydrogeological instability mechanisms, focusing on geoengineering conditions and external perturbation effects. For the weathered trough, Sun et al. [5] constructed a kinematic model to reveal hydraulic pathway genesis. Zhang et al. [6] introduced an analytical framework rooted in the superposition theorem to quantify water inrush. A dynamic coupling framework was developed by Zhang et al. [7] to study the relationship between critical water pressure, in situ stress, and blasting disturbance load. A numerical framework integrating seepage–erosion interactions was presented by Liu et al. [8], which simultaneously predicts water inrush magnitude, quantifies HGE variations, and resolves non-linear percolation patterns with particle detachment modeling. Xie et al. [9] constructed a three-dimensional framework to simulate hydro-mechanical intrusion dynamics and monitor particulate transport within geological discontinuity zones. Jiang et al. [10] proposed an elastoplastic damage constitutive model based on Hoek Brown to study the displacement and damage evolution in a subsea tunnel. Integrating limit equilibrium theory with stress slice analysis and continuum mechanics principles, Zhang et al. [11] systematically studied the hydrogeological instability triggering process at tunneling fronts encountering geological discontinuities. Addressing transient fluid–solid interactions in geologic discontinuities, the numerical scheme developed by Xin et al. [12] integrates dual-scale porosity characteristics to capture the multi-parameter progression during interfacial shear zone penetration. Zeng et al. [13] engineered a controlled hydro-mechanical loading apparatus to investigate fracture initiation characteristics, failure progression, and dynamic crack extension patterns under synchronized hydraulic-pressure and geostatic stress interactions.
In recent years, experts have proposed various assessment methods for the risk of subsea tunnel water inrush. A catastrophe theory-based analytical framework was devised by Xue et al. [14] to quantify fluid transport potentials in extensional, strike-slip, and compressional fault architectures, enabling probabilistic prediction of seawater intrusion hazards in a subsea tunnel. Peng et al. [15] implemented a hybrid decision-making framework combining AHP with cloud entropy theory, establishing probabilistic risk quantification criteria for hydraulic fracturing-induced tunnel water inrush. Liu et al. [16] developed a hybrid methodology combining the grey wolf optimization algorithm with support vector regression to predict water inrush. Qiu et al. [17] introduced a hybrid approach integrating an optimal combination weighting strategy with improved grey relational analysis to assess water inrush in subsea tunnels. Wu et al. [18] devised a computational framework utilizing Darcy–Brinkman flow equations to characterize nonlinear hydro-mechanical interactions during water inrush in faults. Wang et al. [19] used the cross-hole resistivity method and ground penetrating radar method to predict the moisture content in front of the subsea tunnel. Li et al. [20] established a support vector machine model to predict the limit support pressure of an underwater tunnel. The above study used nonlinear evaluation methods that combine AHP, cloud theory, grey relational analysis, and other methods to assess water and mud inrush in subsea tunnels. It analyzed the weight of factors affecting water and mud inrush and established a comprehensive evaluation model for the weight of influencing factors. However, these methods rely on a single data metric and cannot fully quantify the uncertainty of risk.
The TOPSIS method is widely used in multi-attribute decision-making of tunnel risk. Peng et al. [21] constructed a hazard assessment framework leveraging AHP and TOPSIS. Li et al. [22] built a novel model based on principal component analysis, criteria importance through inter-criteria correlation, and TOPSIS to evaluate the water inrush risk index. Yang et al. [23] established a multivariate assessment framework integrating drilling and blasting method parameters to systematically quantify construction efficiency in tunnel excavation processes. Gogate et al. [24] formulated an integrative fuzzy-based multi-criteria decision-making methodology that systematically prioritizes geotechnical hazard elements in India’s underground megaprojects through hybridized compromise solutions. Yang et al. [25] devised an enhanced technique for order preference by similarity to the ideal solution framework to quantitatively assess anisotropic influence indices among geohazard determinants. Fu et al. [26] designed a workflow optimization framework integrating TOPSIS methodology and parameter sensitivity profiling to identify optimal configurations in complex geological conditions. Kong and Zhang [27] developed an innovative risk assessment method based on AHP-TOPSIS to study the risk analysis of water inrush in the Shijingshan Tunnel. Zhang et al. [28] constructed an analytical framework integrating combined weighting with TOPSIS to quantify water inrush hazards. Zhang et al. [29] formulated a hybrid weighting-TOPSIS methodology grounded in seven principal hydraulic conductivity determinants to evaluate groundwater hazards. From the above research, it was found that the TOPSIS method has a clear and simple decision-making process. It enables complex decision data to be transformed through models, breaking away from abstract algebraic models and obtaining clear prioritization of decision objects. Compared to other decision-making methods, it is more aligned with logical judgment and suitable for solving multi-attribute decision-making problems. However, the original data used by traditional TOPSIS comes from the decision indicators themselves. Although the data has strong objectivity, it cannot guarantee the accuracy and comprehensiveness of the final decision results. Therefore, it is necessary to improve the traditional TOPSIS method.
During the risk assessment process of water and mud inrush in subsea tunnels, a single value is difficult to fully reflect the indicator system of subsea tunnel water inrush, and it often falls within a range. When dealing with this type of problem, probabilistic methods typically require a large amount of historical data or explicit probability distribution assumptions, such as normal distribution, Poisson distribution, etc. If data is scarce or the distribution is unknown, it is difficult to accurately model. However, interval numbers can directly provide the possible range of variables, which is convenient for engineering risk assessment. In addition, interval numbers also support multiple interval comparisons and decision-making. By using interval sorting methods to directly compare the advantages and disadvantages of solutions, there is no need for complex utility functions or weight settings. Therefore, based on interval number theory, analytic hierarchy process, and TOPSIS method, a hybrid intelligent model for assessing the risk of subsea tunnel water inrush was established, aiming to unify the evaluation system of subsea tunnel water inrush in interval form and provide a more practical solution for predicting the risk of subsea tunnel water inrush.
2. Interval Number TOPSIS Method
Water inrush is a hazardous geological phenomenon during subsea tunnel excavation, arising from synergistic interactions among numerous risk variables. These multifaceted parameters exhibit intricate nonlinear interdependencies across multiple dimensions. Notably, conventional deterministic quantification inadequately captures inherent uncertainties within evaluation parameters, typically necessitating interval-valued metric representations. This study accordingly develops an interval risk quantification framework synergistically combining IAHP with TOPSIS based on interval number theory.
2.1. IAHP Theory
As a subset of subjective weighting methodologies, IAHP demonstrates enhanced metric precision through interval-valued judgment matrices and eigenvalue-derived weight coefficients compared with standard AHP implementations. Following conventional AHP protocol, IAHP implementation initiates through hierarchical decomposition of evaluation parameters across three strata: objective layer, criteria layer, and indicator layer. The procedural workflow subsequently involves: formulating interval-type pairwise comparison matrices, conducting consistency validation, and establishing resultant weight vectors through eigenvector computations.
The interval number matrix can be expressed as Equation (1)
where , , , and .
If and are the maximum eigenvalues of the digital matrices and , respectively, then is the interval eigenvalue of A, and is the entire eigenvector of A corresponding to λ. Where and are, respectively, and correspond to any positive eigenvector of , , and k and m are all positive real numbers satisfying .
is the consistency interval judgment matrix; , , , . Then, the weight vector of A is . The necessary and sufficient condition for satisfying is presented in Equation (2)
where and are, respectively, and , corresponding to the maximum eigenvalue of , of normalized eigenvectors with positive 1-norm.
Considering the specific expression of k/m and the symmetry of the left and right endpoints of the weight vector, the values of k and m are as shown in Equation (3).
Then, .
2.2. Fuzzy Comprehensive Evaluation
Fuzzy mathematics serves essentially as an instrument for depicting and resolving problems with uncertainty while having a solid mathematical foundation. It has the ability to construct a model for the uncertainty in tunnel water inrush, presenting an intuitive means to illustrate the connections between diverse risk factors. In this research, a fuzzy comprehensive assessment model is formulated by leveraging a multi-index evaluation system and the theory of fuzzy sets. The resultant vectors are capable of being represented as interval numbers. Moreover, the fuzzy evaluation function is computed by applying Equations (4)–(8)
where A is the result vector of the destination layer; W is the weight vectors of the influence factor layer; Bi is the result vector of the influence factor layer; Wi is the weight vectors of the indicator layer; Zi is the evaluation layer; and zijk is the membership degree for the evaluation index zi of influential factor bj belonging to risk grade k.
Determining membership functions is the basis of solving practical problems. Common forms of the membership function include the normal type, triangular fuzzy numbers, and the parabolic membership function, among others. Membership functions possess differing morphological characteristics, yet through rigorous computational processes, they systematically arrive at congruent analytical findings [30]. In this study, a triangular fuzzy number membership function was chosen.
2.3. Theory of Interval Number Improvement TOPSIS Method
The traditional TOPSIS method can only use specific numerical values for evaluation. In some cases, it is difficult to obtain accurate values due to incomplete and uncertain data. Introducing interval numbers to improve the TOPSIS method can increase evaluation accuracy and practicality.
This study used the improved interval number TOPSIS method to evaluate the risk of water inrush and determined the risk level based on relative proximity. Interval number theory is the foundation of the improved method. In this study, the interval number assumes that the interval endpoints of the lower bound and upper bound are precisely known, and the true value of the variable must be within this interval. The number of intervals is defined as follows: .
Firstly, an evaluation matrix is constructed as Equation (10), consisting of n evaluation schemes corresponding to m evaluation indicators, respectively.
Then, the matrix is normalized based on the different factor attributes. There are the following two methods for normalization: one with advantageous factors and the other has disadvantage factors, as shown in Equation (11)
where is the jth evaluation of the normalized ith evaluation scheme price indicators.
Then, the maximum risk plan is determined, , and the minimum risk plan, .
Then, the distance to the minimum or maximum risky solution is calculated using Equation (14)
where is the distance between the evaluation plan and maximum risk, and is the distance between the evaluation plan and minimum risk.
Finally, relative proximity is calculated using Equation (15).
3. Risk Assessment Process and Indicator System for Water Inrush in Subsea Tunnels
3.1. Risk Assessment Process
The risk assessment process is mainly divided into three stages, each stage applying a different method. Firstly, the weight of the risk factors is determined using IAHP based on expert opinions and relevant information. Secondly, the weight values of the evaluation indices combined with the triangular fuzzy number membership function were used to obtain the result vector. Finally, the TOPSIS method is used to calculate the E+ of typical samples, and non-equal risk grading criteria based on relative proximity are determined. For specific engineering projects, the improved TOPSIS method uses interval numbers to determine the relative proximity, E+, of the project, and then the risk level is determined based on the risk classification criteria (Figure 1).
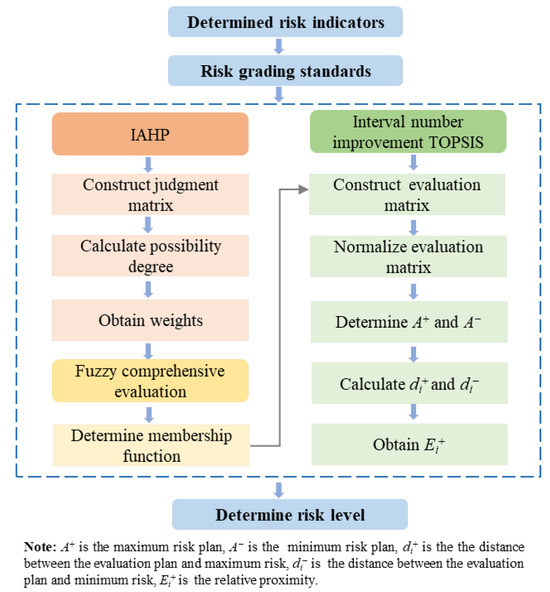
Figure 1.
Risk assessment process.
3.2. Risk Assessment Index System
The water and mud inrush process of subsea tunnels is highly intricate, and it is the consequence of multiple factors, which can be categorized into engineering geological conditions and construction conditions. Once tunnel excavation causes unfavorable geological conditions to form water inrush channels, seawater serves as the water inrush source, significantly increasing the possibility of water and mud inrush.
- (1)
- Engineering geological conditions (B1)
Sea depth (C1)
Seawater depth exerts a significant influence on the hydrostatic head pressure within subsea tunnels. As seawater depth increases, the hydrostatic loading imposed on underwater tunnel structures becomes more pronounced. Concurrently, this leads to a corresponding increase in both water pressure and surrounding rock pressure acting on the tunnel lining structure.
Subsea tunnel burial depth (C2)
As the burial depth decreases, the tunnel will lose a certain range of relatively stable natural arches. If the burial depth of the tunnel is relatively small, the influence of excavation will reach the surface, and the surrounding rock will lose its self-stabilization ability.
Scale of weathering trough (C3)
The amount of water in the weathering trough is mainly the replenished water volume. The larger the scale of the weathering trough, the wider its width will be, which means that the range affected by water will be larger. When the subsea tunnel is constructed through the weathering trough, the rock mass within the influence zone of the weathering trough has low strength, large deformation, and strong water permeability. Its physical and mechanical properties are significantly different from those of the normal surrounding rock. The larger the scale of the influence zone of the weathering trough, the higher the risk of water and mud inrush in the subsea tunnel.
Interface angle (C4)
When a subsea tunnel passes through the weathering trough, the dip angle of the weathering trough interface exerts a critical influence on water and mud inrush risks. A steeper dip angle tends to alter the seawater runoff pathway significantly, enhancing the connectivity of water-rich structural zones. This hydraulic connectivity facilitates seawater migration along fractured zones toward the tunnel, thereby escalating the likelihood of water and mud inrush incidents.
Strength of surrounding rock (C5)
Rock strength is intertwined with the integrity of rock, the presence of groundwater, and the distribution of structural planes within the surrounding rock matrix. The fundamental mechanical properties of the rock mass directly influence its stability. Notably, lower rock strength correlates with a higher degree of elastoplastic deformation, thereby reducing the self-stabilizing capacity of the rock mass.
Permeability of weathering trough (C6)
The permeability of filling materials within the weathered trough is a critical factor influencing water and mud inrush. The permeability coefficient serves as a comprehensive indicator of the weathered trough’s hydraulic conductivity. A higher permeability coefficient signifies lower compaction of filling materials in the weathered trough, more fragmented rock structure, and enhanced permeability. Conversely, poorer filling degrees within the weathered trough correlate with more developed fractures and superior hydraulic connectivity, further exacerbating permeability.
- (2)
- Construction conditions (B2)
Cyclical footage (C7)
Tunnel excavation constitutes a dynamic process in which the stress and deformation of the surrounding rock mass undergo repeated transfer and redistribution. Consequently, an extended length of each excavation cycle leads to greater unloading stress, which significantly influences the stability of the excavation face. This scenario can exacerbate the development of fluid flow pathways within the rock matrix, thereby escalating the risk of water and mud inrush.
Grouting reinforced region (C8)
Grouting reinforcement involves injecting grout into the surrounding rock by drilling holes. Under the action of grouting pressure, the grout spreads into the cracks of the surrounding rock, creating a reinforced zone. As the area of the grouting reinforced region expands, the surrounding rock exhibits enhanced bearing capacity and higher stability. This process also reduces pore water pressure on the lining and water inflow.
As shown in Table 1, these evaluation indices are quantitatively classified into four grades.

Table 1.
Evaluation indices and grading standards of water and mud inrush.
4. Engineering Application
4.1. Engineering Background
The bedrock of the Haicang subsea tunnel (Figure 2) consists of granite and leptynite, and diabase dikes are intruding into it. Affected by tectonic activities and weathering, the full to strong weathering layers are well-developed, with a thickness generally ranging from 6.7 to 34 m. The bonding degree of the structural planes in the rock mass is mostly moderate, and partly poor. The permeability of the rock is mostly weak, and locally it may be moderate. The moderately weathered rock mostly presents a cataclastic structure, with the rock being fragmented and the rock material being hard. The slightly weathered rock mass mostly shows a block and fragment mosaic cataclastic structure. The distribution of soft rock and hard rock is uneven, and the integrity of the rock is relatively good. In the sections where leptynite is developed, the rock mostly presents a cataclastic structure, and the joints and fractures are extremely well-developed. In the tunnel through the weathering trough, the weathering trough contains a relatively large amount of quartz sand grains and other minerals, mainly kaolinite, showing poor water stability.
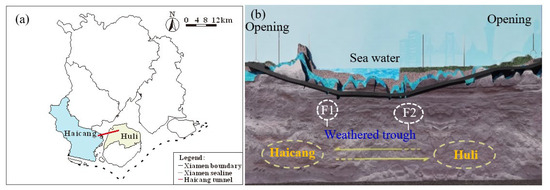
Figure 2.
Geographic sketch maps of the Haicang tunnel. (a) Geographical location of the tunnel; (b) engineering geological conditions of the tunnel.
4.2. Weight Analysis
The seawater depth, the scale of weathering troughs, etc., have significant impacts on water and mud inrush in a subsea tunnel. Various factors exert distinct influences on the water and mud inrush of seaside subsea tunnels. By applying the principle of comparison among different indicators, the relative significance of each factor has been determined. Utilizing the theory of the IAHP, the weights of multiple evaluation indices related to water and mud inrush have been computed. Taking into account the engineering geological conditions and construction conditions, the comparison matrices for the criterion layer (B) and the indicator layer (C) were constructed using the 1–9 scale method, as illustrated in Equations (16)–(18). The weight vector of the judgment matrix was calculated using Equations (1)–(8), and the results are presented in Table 2. It is worth noting that experts may have subjectivity in the scoring process.
Table 2.
The weight vector of comparison matrix.
4.3. Risk Assessment
The membership function of the indicator layer can be determined according to the classification of factors affecting water and mud inrush in the weathered trough of subsea tunnels.
The membership function of the sea depth can be represented by Equation (19).
The membership function of the subsea tunnel burial depth can be represented by Equation (20).
The membership function of the scale of the weathering trough can be represented by Equation (21).
The membership function of the interface angle can be represented by Equation (22).
The membership function of the strength of surrounding rock can be represented by Equation (23).
The membership function of the permeability of weathering trough can be represented by Equation (24).
The membership function of the cyclical footage can be represented by Equation (25).
The membership function of the cyclical footage can be represented by Equation (26).
By comprehensively analyzing the weathering trough of the Haicang subsea tunnel, the interval fuzzy comprehensive evaluation index values of the impact of the weathering trough on water and mud inrush in the subsea tunnel were obtained, as shown in Table 3. In addition, the interval membership degrees of different influencing factors were calculated using Equations (19)–(26), as shown in Table 4.
Table 3.
The index parameters of the weathering trough of Haicang subsea tunnel.
Table 4.
The membership degree of index parameters of the Haicang subsea tunnel.
By combining the evaluation indices for engineering geological conditions and construction conditions, the data of C1–C8 in Table 4, and the weight vectors Wi, the final interval number result vector can be determined in Table 5.
Table 5.
The membership degree of index parameters of the Haicang subsea tunnel after weighting.
Subsequently, the normalized data for evaluation indices and grading standards of water and mud inrush were calculated using Equation (11), and the results are shown in Table 6.
Table 6.
Evaluation indices and grading standards of normalization after weighting.
Based on the normalized data after weighting, the interval type positive ideal point and the interval type negative ideal point were determined using Equations (12) and (13).
Finally, the relative nearness degree of each risk level was calculated, as shown in Table 7.
Table 7.
The relative nearness degree of each risk level.
Thus, the final risk level is IV, which represents a high-risk section.
4.4. Tunnel Excavation Verification
The Haicang subsea tunnel was excavated to FWK15+350, where water and mud occurred in the upper part of the tunnel face (Figure 3). The subsea tunnel face is mainly composed of fully weathered rocks, which are mostly weathered into cohesive soil mixed with gravel, with a loose structure. It is prone to softening when exposed to water. The on-site situation is consistent with the risk assessment results, verifying the effectiveness of the assessment method.
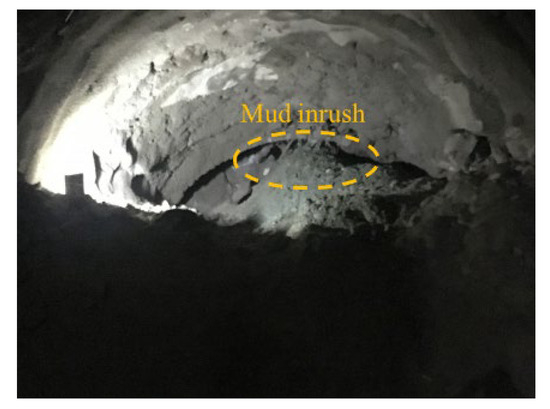
Figure 3.
Site conditions of Haicang subsea tunnel excavation.
5. Discussion
The emergency strategy for water and mud risk was implemented from FWK15+350 to FWK15+335 following risk evaluation. Firstly, the plan involved drilling 121 grouting holes aggregating 2043 linear meters. The injectate grouting comprised 75% standard formulation supplemented by 25% micronized cement suspension. Utilizing dedicated integral piping systems with single-hole injection methodology, the process maintained sustained 2.5 MPa of grouting pressure with the following bidirectional symmetrical construction sequencing: initiating from peripheral to interior rings, progressing vertically bottom-up. This intervention demonstrated effective geological control, offering valuable empirical protocols for analogous subsea tunnel engineering.
The mechanism of water and mud inrush in subsea tunnels crossing a weathered trough is complex. This study, combined with the subsea tunnel engineering geological conditions and construction conditions, investigates the risk of water and mud inrush. However, the understanding of weathered troughs is still in a vague state, and there is no systematic theory on their formation and evolution at present. There is a lack of research on the engineering properties of weathering troughs, and further systematic studies are needed to investigate the influence of microstructures on water and mud inrush, analyze the seepage evolution law of weathering trough under dynamic action, and elaborate on the development law of internal cracks in weathered troughs. It can provide a theoretical basis for the risk assessment of water and mud inrush in weathered troughs.
The calculation of interval numbers involves using the left and right endpoints of the interval, as well as assuming that the values on the default interval follow a uniform distribution. However, the distribution of the attributes for water and mud inrush within the interval range may be different. In the future, it is necessary to explore the measurement of interval number differences and consider the situation where intervals under different attributes follow other distributions, in order to further enrich and improve the theoretical research on multi-attribute group decision-making problems with distributed interval types.
6. Conclusions
In this study, a novel method using the interval number TOPSIS method to assess the risk of water inrush from a weathered trough in a subsea tunnel was established. Eight evaluation indices that can potentially affect water and mud inrush, including sea depth, subsea tunnel burial depth, scale of weathering trough, interface angle, strength of surrounding rock, permeability of weathering trough, cyclical footage, and grouting reinforced region, were analyzed. This multi-index system reflected the information for subsea tunnel water and inrush, and the quantitative standards were proposed. The weights of the influencing factors were calculated using the IAHP method, which are [0.0896, 0.0994], [0.0404, 0.0454], [0.1569, 0.1825], [0.2073, 0.2381], [0.0742, 0.0812], [0.3409, 0.3765], [0.3781, 0.4474], and [0.5347, 0.6327], respectively.
The interval number TOPSIS method for water and inrush of subsea tunnels crossing weathered troughs was developed using the IAHP method, fuzzy comprehensive evaluation, and the TOPSIS method. The novel assessment method was applied to the FWK15+350 of the Haicang tunnel, successfully. The relative nearness degrees of each risk level were calculated to be 0.17, 0.20, 0.34, and 0.46, respectively. The risk level fell into IV, which represents a high-risk section. The results were in good agreement with the site situation, which verified the reliability of the proposed approach. The result showed a high degree of congruence with the prevailing circumstances, thereby validating the credibility of the proposed methodology.
Due to differences in geological conditions, burial depth, and construction techniques, the focus of risk assessment in tunnel engineering varies significantly. The core advantage of the interval number TOPSIS method lies in the rapid reconstruction of the indicator system, which only requires adjusting the evaluation parameters for tunnel types and retaining the core logic of ideal solution sorting. Therefore, it can reorganize the evaluation index system to assess the risk level of water and mud inrush based on different tunnel engineering backgrounds.
Author Contributions
Conceptualization, B.Z. and Z.W.; methodology, Y.H.; software, S.W.; formal analysis, B.Y.; investigation, J.C. and C.G.; data curation, B.Z.; writing—original draft preparation, B.Z. and C.D.; writing—review and editing, Z.W. All authors have read and agreed to the published version of the manuscript.
Funding
This research was funded by the Open Fund of the Key Laboratory of Geological Safety of Coastal Urban Underground Space, Ministry of Natural Resources (Grant No. BHKF2022Y01); the Open Foundation of the Key Laboratory of Coupling Process and Effect of Natural Resources Elements (Grant No. 2024KFKT017); the Open Foundation of Key Laboratory of Geological Disaster Risk Prevention and Control of Shandong Provincial Emergency Management Department (Grant No. 801KF2024-DZ07); and the Youth Innovation Team of Shandong Higher Education Institutions (Grant No. 2024KJH100).
Data Availability Statement
The original contributions presented in this study are included in the article material. Further inquiries can be directed to the corresponding author.
Conflicts of Interest
The authors declare no conflicts of interest.
Abbreviations
The following abbreviations are used in this manuscript:
| TOPSIS | Technique for Order Preference by Similarity to an Ideal Solution |
| IAHP | Interval Analytic Hierarchy Process |
References
- Nilsen, B. Analysis of potential cave-in from fault zones in hard rock subsea tunnels. Rock Mech. Rock Eng. 1993, 27, 63–75. [Google Scholar] [CrossRef]
- Hong, K. Typical underwater tunnels in the mainland of China and related tunneling technologies. Engineering 2017, 3, 871–879. [Google Scholar] [CrossRef]
- Yu, P.; Liu, H.; Wang, Z.; Fu, J.; Zhang, H.; Wang, J.; Yang, Q. Development of Urban Underground Space in Coastal Cities in China: A Review. Deep Undergr. Sci. Eng. 2023, 2, 148–172. [Google Scholar] [CrossRef]
- Xue, Y.; Kong, F.; Li, S.; Qiu, D.; Su, M.; Li, Z.; Zhou, B. Water and mud inrush hazard in underground engineering: Genesis, evolution and prevention. Tunn. Undergr. Space Technol. 2021, 114, 103987. [Google Scholar] [CrossRef]
- Sun, F.; Fang, Q.; Li, P.; Pan, R.; Zhu, X. Research on the Water Inrush Mechanism and Grouting Reinforcement of a Weathered Trough in a Submarine Tunnel. Buildings 2024, 14, 2432. [Google Scholar] [CrossRef]
- Zhang, L.; Zhao, D.; Wu, J.; Yang, W.; Wang, W.; Xin, D. Prediction of water inflow in Tsingtao subsea tunnel based on the superposition principle. Tunn. Undergr. Space Technol. 2020, 97, 103243. [Google Scholar] [CrossRef]
- Zhang, Q.; Wang, J.; Feng, L. Mechanical Mechanism of Hydraulic Fracturing Effect Caused by Water Inrush in Tunnel Excavation by Blasting. Math. Probl. Eng. 2021, 2021, 9919260. [Google Scholar] [CrossRef]
- Liu, J.; Sun, Y.; Li, C.; Yuan, H.; Chen, W.; Liu, X.; Zhou, X. Field monitoring and numerical analysis of tunnel water inrush and the environmental changes. Tunn. Undergr. Space Technol. 2022, 122, 104360. [Google Scholar] [CrossRef]
- Xie, Q.; Cao, Z.; Sun, W.; Fumagalli, A.; Fu, X.; Wu, Z.; Wu, K. Numerical simulation of the fluid-solid coupling mechanism of water and mud inrush in a water-rich fault tunnel. Tunn. Undergr. Space Technol. 2022, 131, 104796. [Google Scholar] [CrossRef]
- Jiang, H.; Xu, M.; Jiang, A. Hoek Brown Elastoplastic Damage Model Considering Pore Water Pressure and Its Application to Subsea Tunnel Engineering. KSCE J. Civ. Eng. 2022, 26, 4526–4541. [Google Scholar] [CrossRef]
- Zhang, L.; Wu, J.; Zhang, X. Mechanism of water inrush from the tunnel face induced by fault and its application. J. Cent. South Univ. 2023, 30, 934–946. [Google Scholar] [CrossRef]
- Xin, G.; Wang, B.; Zheng, H.; Zeng, L.; Yang, X. Study on Water Inrush Characteristics of Hard Rock Tunnel Crossing Heterogeneous Faults. Appl. Sci. 2024, 14, 2536. [Google Scholar] [CrossRef]
- Zeng, J.; Pu, C.; Wang, Q.; Shen, Q.; Zeng, Q.; Yang, Z. Tunnel and underground engineering rock mass water inrush damage and acoustic emission characteristics. PLoS ONE 2023, 19, e0307700. [Google Scholar] [CrossRef] [PubMed]
- Xue, Y.; Wang, D.; Li, S.; Qiu, D.; Li, Z.; Zhu, J. A risk prediction method for water or mud inrush from water-bearing faults in subsea tunnel based on cusp catastrophe model. KSCE J. Civ. Eng. 2017, 21, 2607–2614. [Google Scholar] [CrossRef]
- Peng, Y.; Wu, L.; Zuo, Q.; Chen, C.; Hao, Y. Risk assessment of water inrush in tunnel through water-rich fault based on AHP-Cloud model. Geomat. Nat. Hazards Risk 2020, 11, 301–317. [Google Scholar] [CrossRef]
- Liu, D.; Xu, Q.; Tang, Y.; Jian, Y. Prediction of Water Inrush in Long-Lasting Shutdown Karst Tunnels Based on the HGWO-SVR Model. IEEE Access 2021, 9, 6368–6378. [Google Scholar] [CrossRef]
- Qiu, D.; Chen, Q.; Xue, Y.; Su, M.; Liu, Y.; Cui, J.; Zhou, B. A new method for risk assessment of water inrush in a subsea tunnel crossing faults. Mar. Georesources Geotechnol. 2022, 40, 679–689. [Google Scholar] [CrossRef]
- Wu, J.; Wang, X.; Wu, L.; Lu, Y.; Han, Y. Parametric Study of Water Inrush in a Tunnel Crossing a Fault Based on the “Three Zones” Fault Structure. KSCE J. Civ. Eng. 2022, 26, 3600–3619. [Google Scholar] [CrossRef]
- Wang, C.; Liu, Z.; Dong, Z.; Zhang, F.; Ma, C.; Xu, X.; Guo, Q. Comprehensive Application of Borehole Fine Detection Methods: A Case Study in Shantou Bay Subsea Tunnel. Geofluids 2024, 2024, 5546191. [Google Scholar] [CrossRef]
- Li, X.; Xue, Y.; Li, Z.; Kong, F.; Li, G.; Zhou, B. Numerical investigation and prediction of the excavation face stability for river-crossing shield tunneling: An intelligent prediction model for limit support pressure. Comput. Geotech. 2023, 160, 105493. [Google Scholar] [CrossRef]
- Peng, Y.; Wu, L.; Su, Y.; Zhou, R. Risk Prediction of Tunnel Water or Mud Inrush Based on Disaster Forewarning Grading. Geotech. Geol. Eng. 2016, 34, 1923–1932. [Google Scholar] [CrossRef]
- Li, Q.; Lu, C.; Zhao, H. Risk assessment of floor water inrush based on TOPSIS combined weighting model: A case study in a coal mine, China. Earth Sci. Inform. 2023, 16, 565–578. [Google Scholar] [CrossRef]
- Yang, C.; Zhang, R.; Liu, D.; Tang, Y.; Huang, R.; Qiu, W. Evaluation of Excavation Ergonomics of Drill and Blast Method Based on Game Theory G2-EW-TOPSIS Model. Appl. Sci. 2023, 13, 7205. [Google Scholar] [CrossRef]
- Gogate, N.; Shelake, A.; Band, P. Selection of most significant risk factors for Indian tunnel projects: An integrated fuzzy-based MCDM approach. Int. J. Constr. Manag. 2023, 24, 161–176. [Google Scholar] [CrossRef]
- Yang, Y.; Zhang, Q.; Xu, F.; Du, M.; Hou, L.; Hou, L. Service Performance Evaluation of Operating Loess Railway Tunnel Based on Bayesian Network. Electronics 2023, 12, 958. [Google Scholar] [CrossRef]
- Fu, X.; Wu, M.; Tiong, R.; Zhang, L. Data-driven joint multi-objective prediction and optimization for advanced control during tunnel construction. Expert Syst. Appl. 2024, 238, 122118. [Google Scholar] [CrossRef]
- Kong, H.; Zhang, N. Risk assessment of water inrush accident during tunnel construction based on FAHP-I-TOPSIS. J. Clean. Prod. 2024, 449, 141744. [Google Scholar] [CrossRef]
- Zhang, X.; Lin, Y.; Pan, Z.; Jiang, X. Risk assessment of water inrush in deep-buried karst tunnel with rich water based on combined weighting method. Earth Sci. Inform. 2025, 18, 28. [Google Scholar] [CrossRef]
- Zhang, X.; Wang, S.; Chen, H.; Liang, J.; Zhang, X. Risk Assessment of Karst Tunnel Water Inrush Based on Combined Weighting Method. Teh. Vjesn. 2025, 32, 157–164. [Google Scholar]
- Wang, Y.; Yang, W.; Li, M.; Liu, X. Risk assessment of floor water inrush in coal mines based on secondary fuzzy comprehensive evaluation. Int. J. Rock Mech. Min. Sci. 2012, 52, 50–55. [Google Scholar] [CrossRef]
Disclaimer/Publisher’s Note: The statements, opinions and data contained in all publications are solely those of the individual author(s) and contributor(s) and not of MDPI and/or the editor(s). MDPI and/or the editor(s) disclaim responsibility for any injury to people or property resulting from any ideas, methods, instructions or products referred to in the content. |
© 2025 by the authors. Licensee MDPI, Basel, Switzerland. This article is an open access article distributed under the terms and conditions of the Creative Commons Attribution (CC BY) license (https://creativecommons.org/licenses/by/4.0/).