
Analyzing the Causation of Collision Accidents Between Merchant and Fishing Vessels in China’s Coastal Waters by Integrating Association Rules and Complex Networks


Abstract
1. Introduction
2. Data and Methodology
2.1. Data Collection
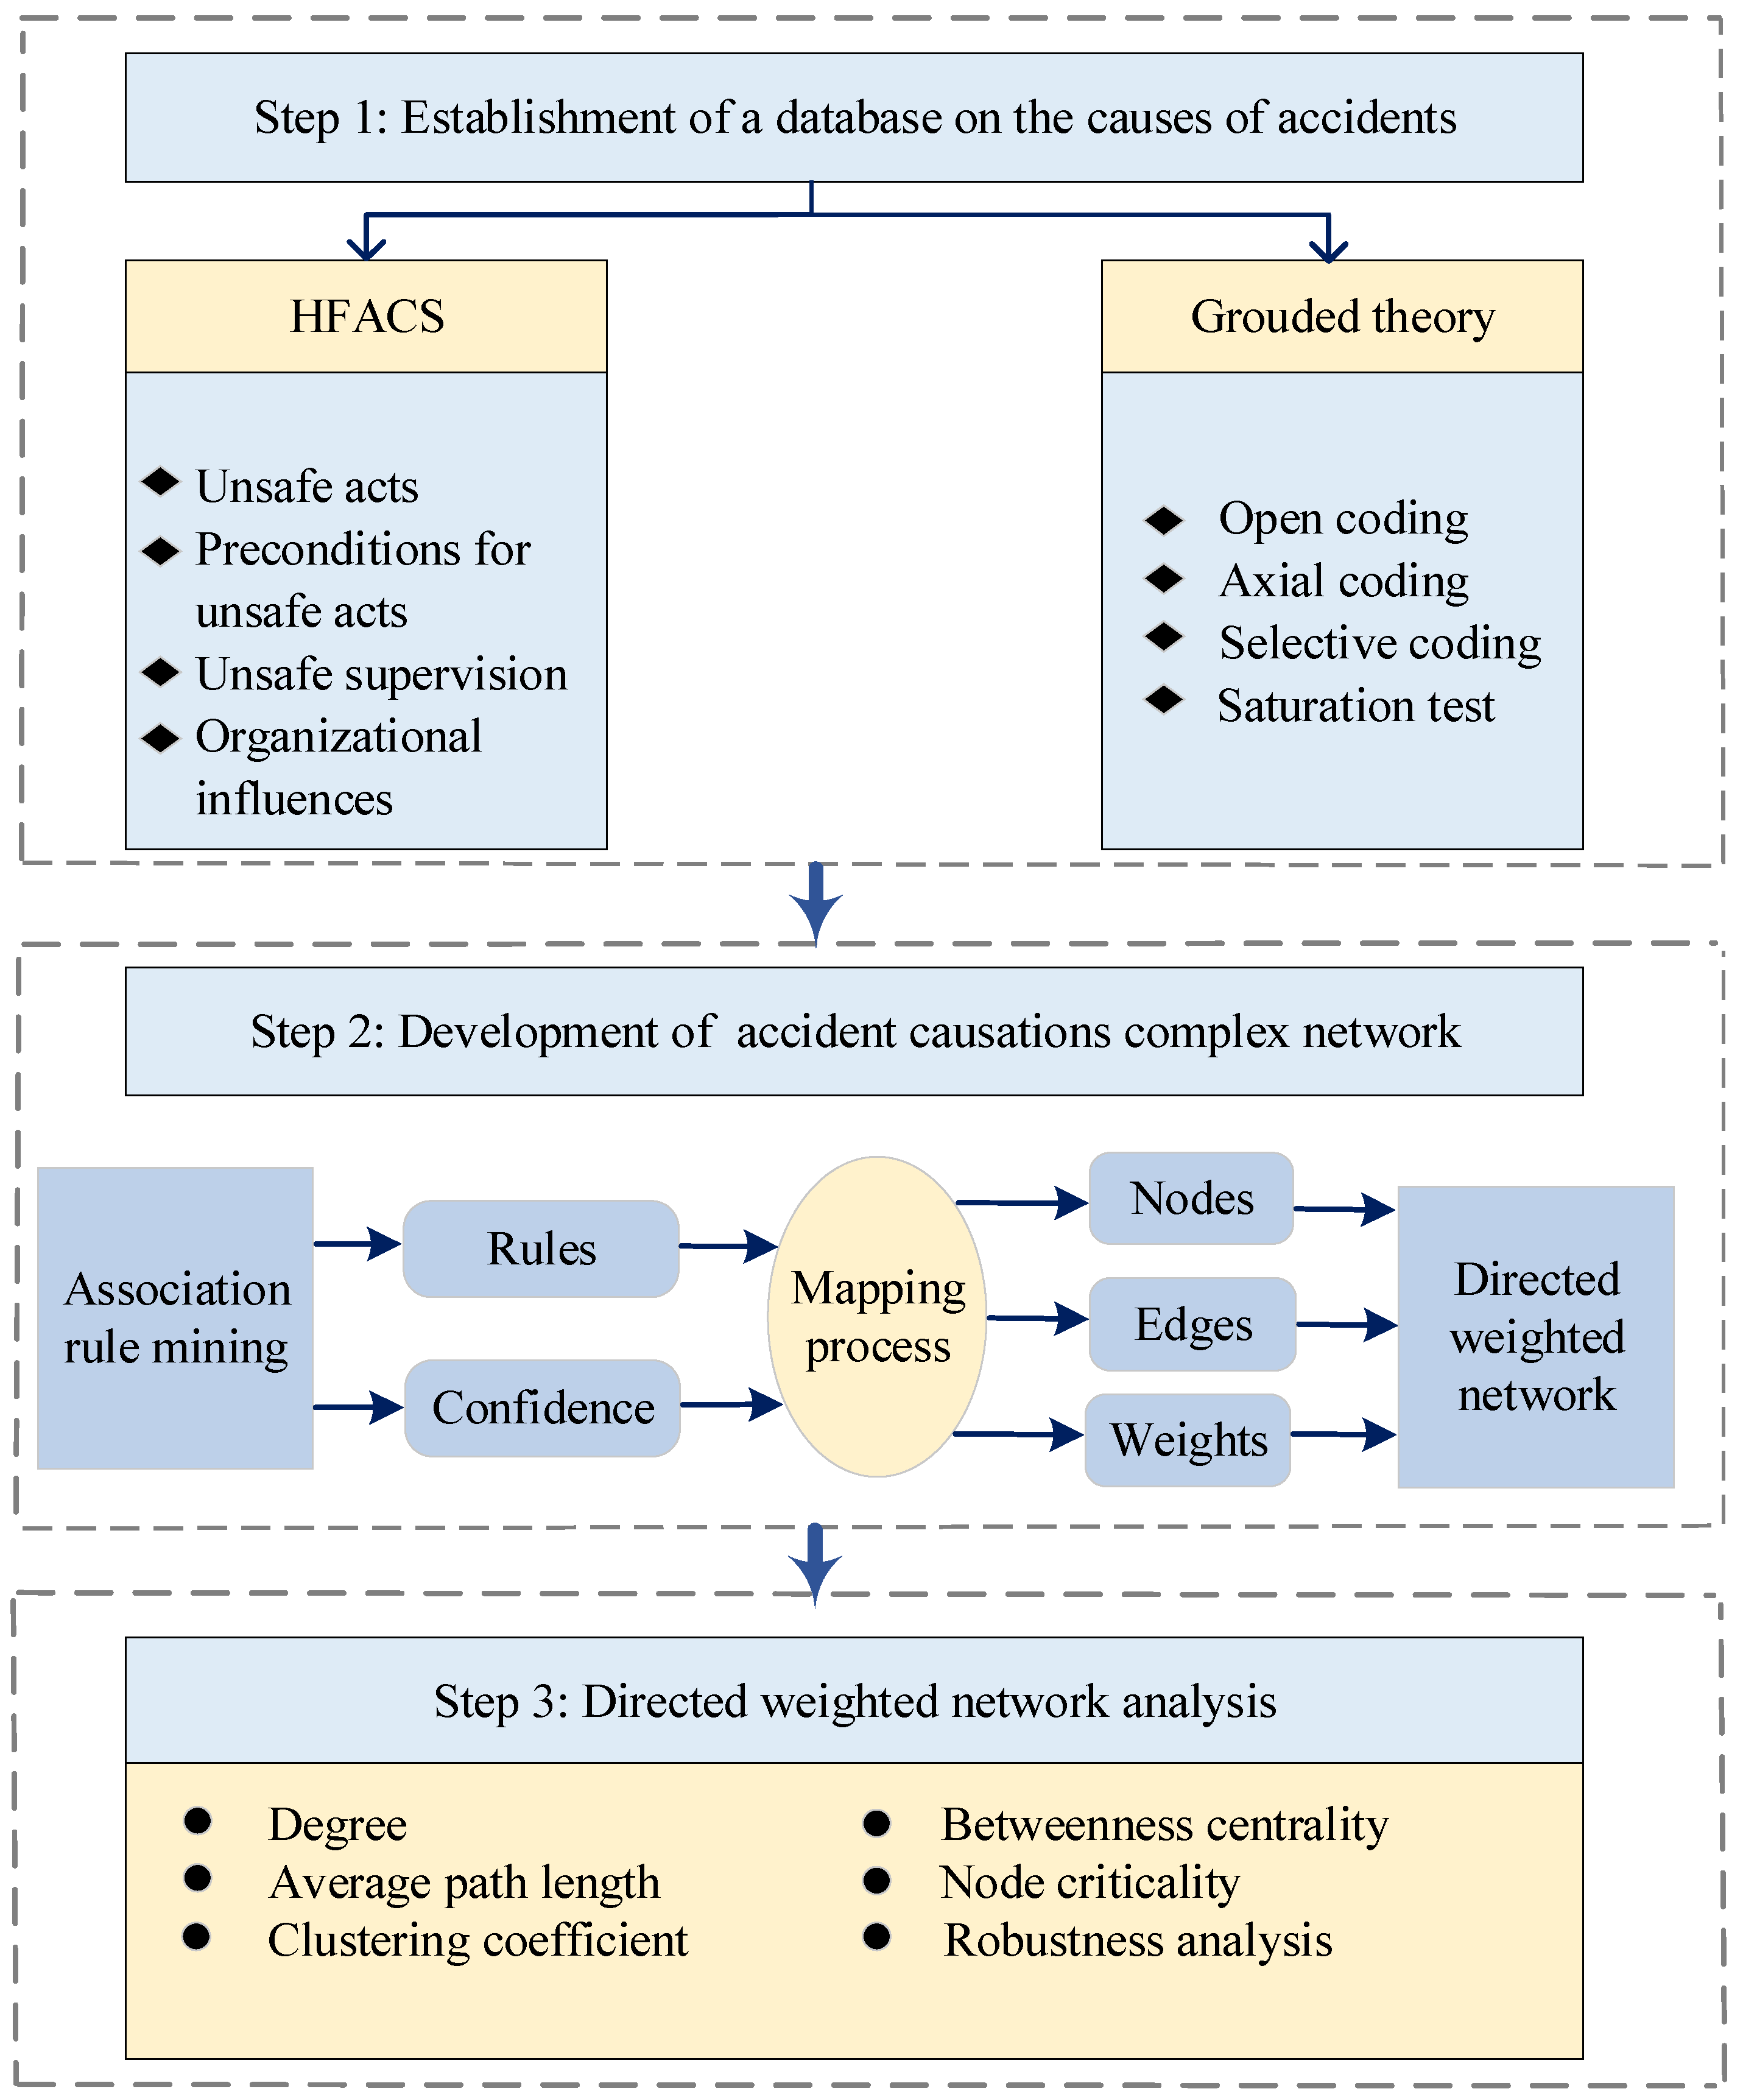
2.2. Methodology Overview
2.2.1. Grounded Theory and HFACS
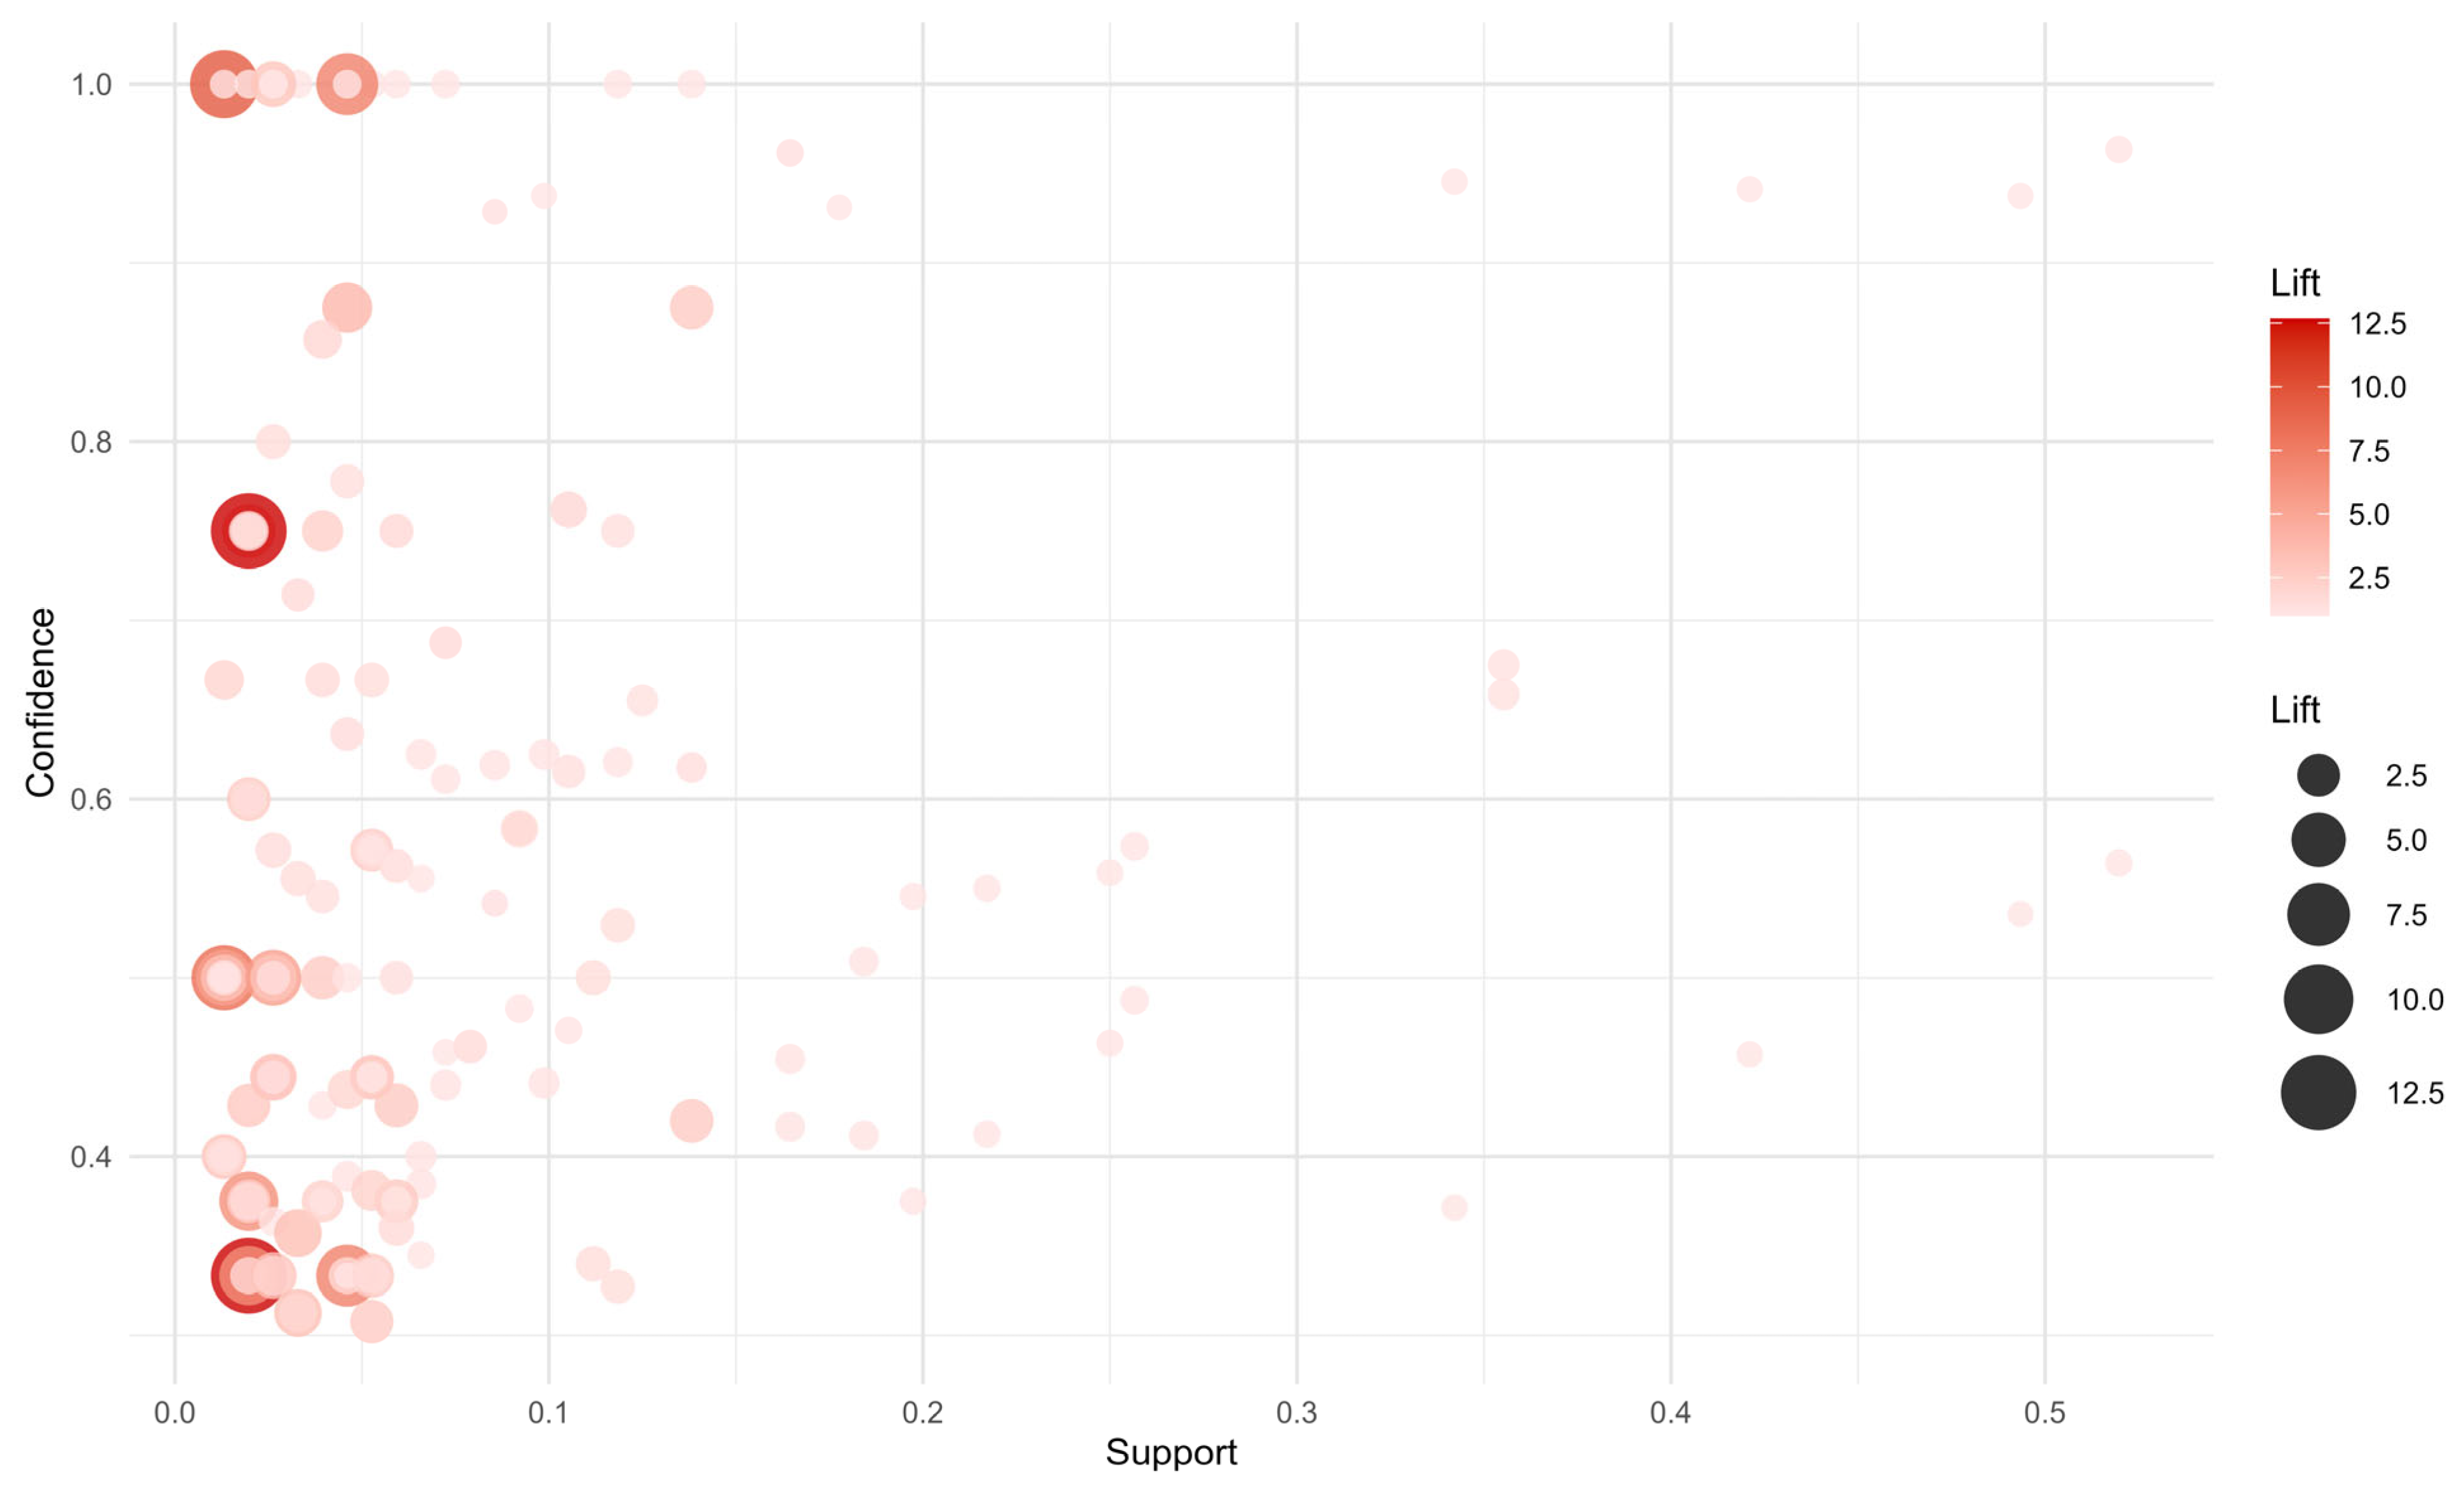
2.2.2. Association Rules
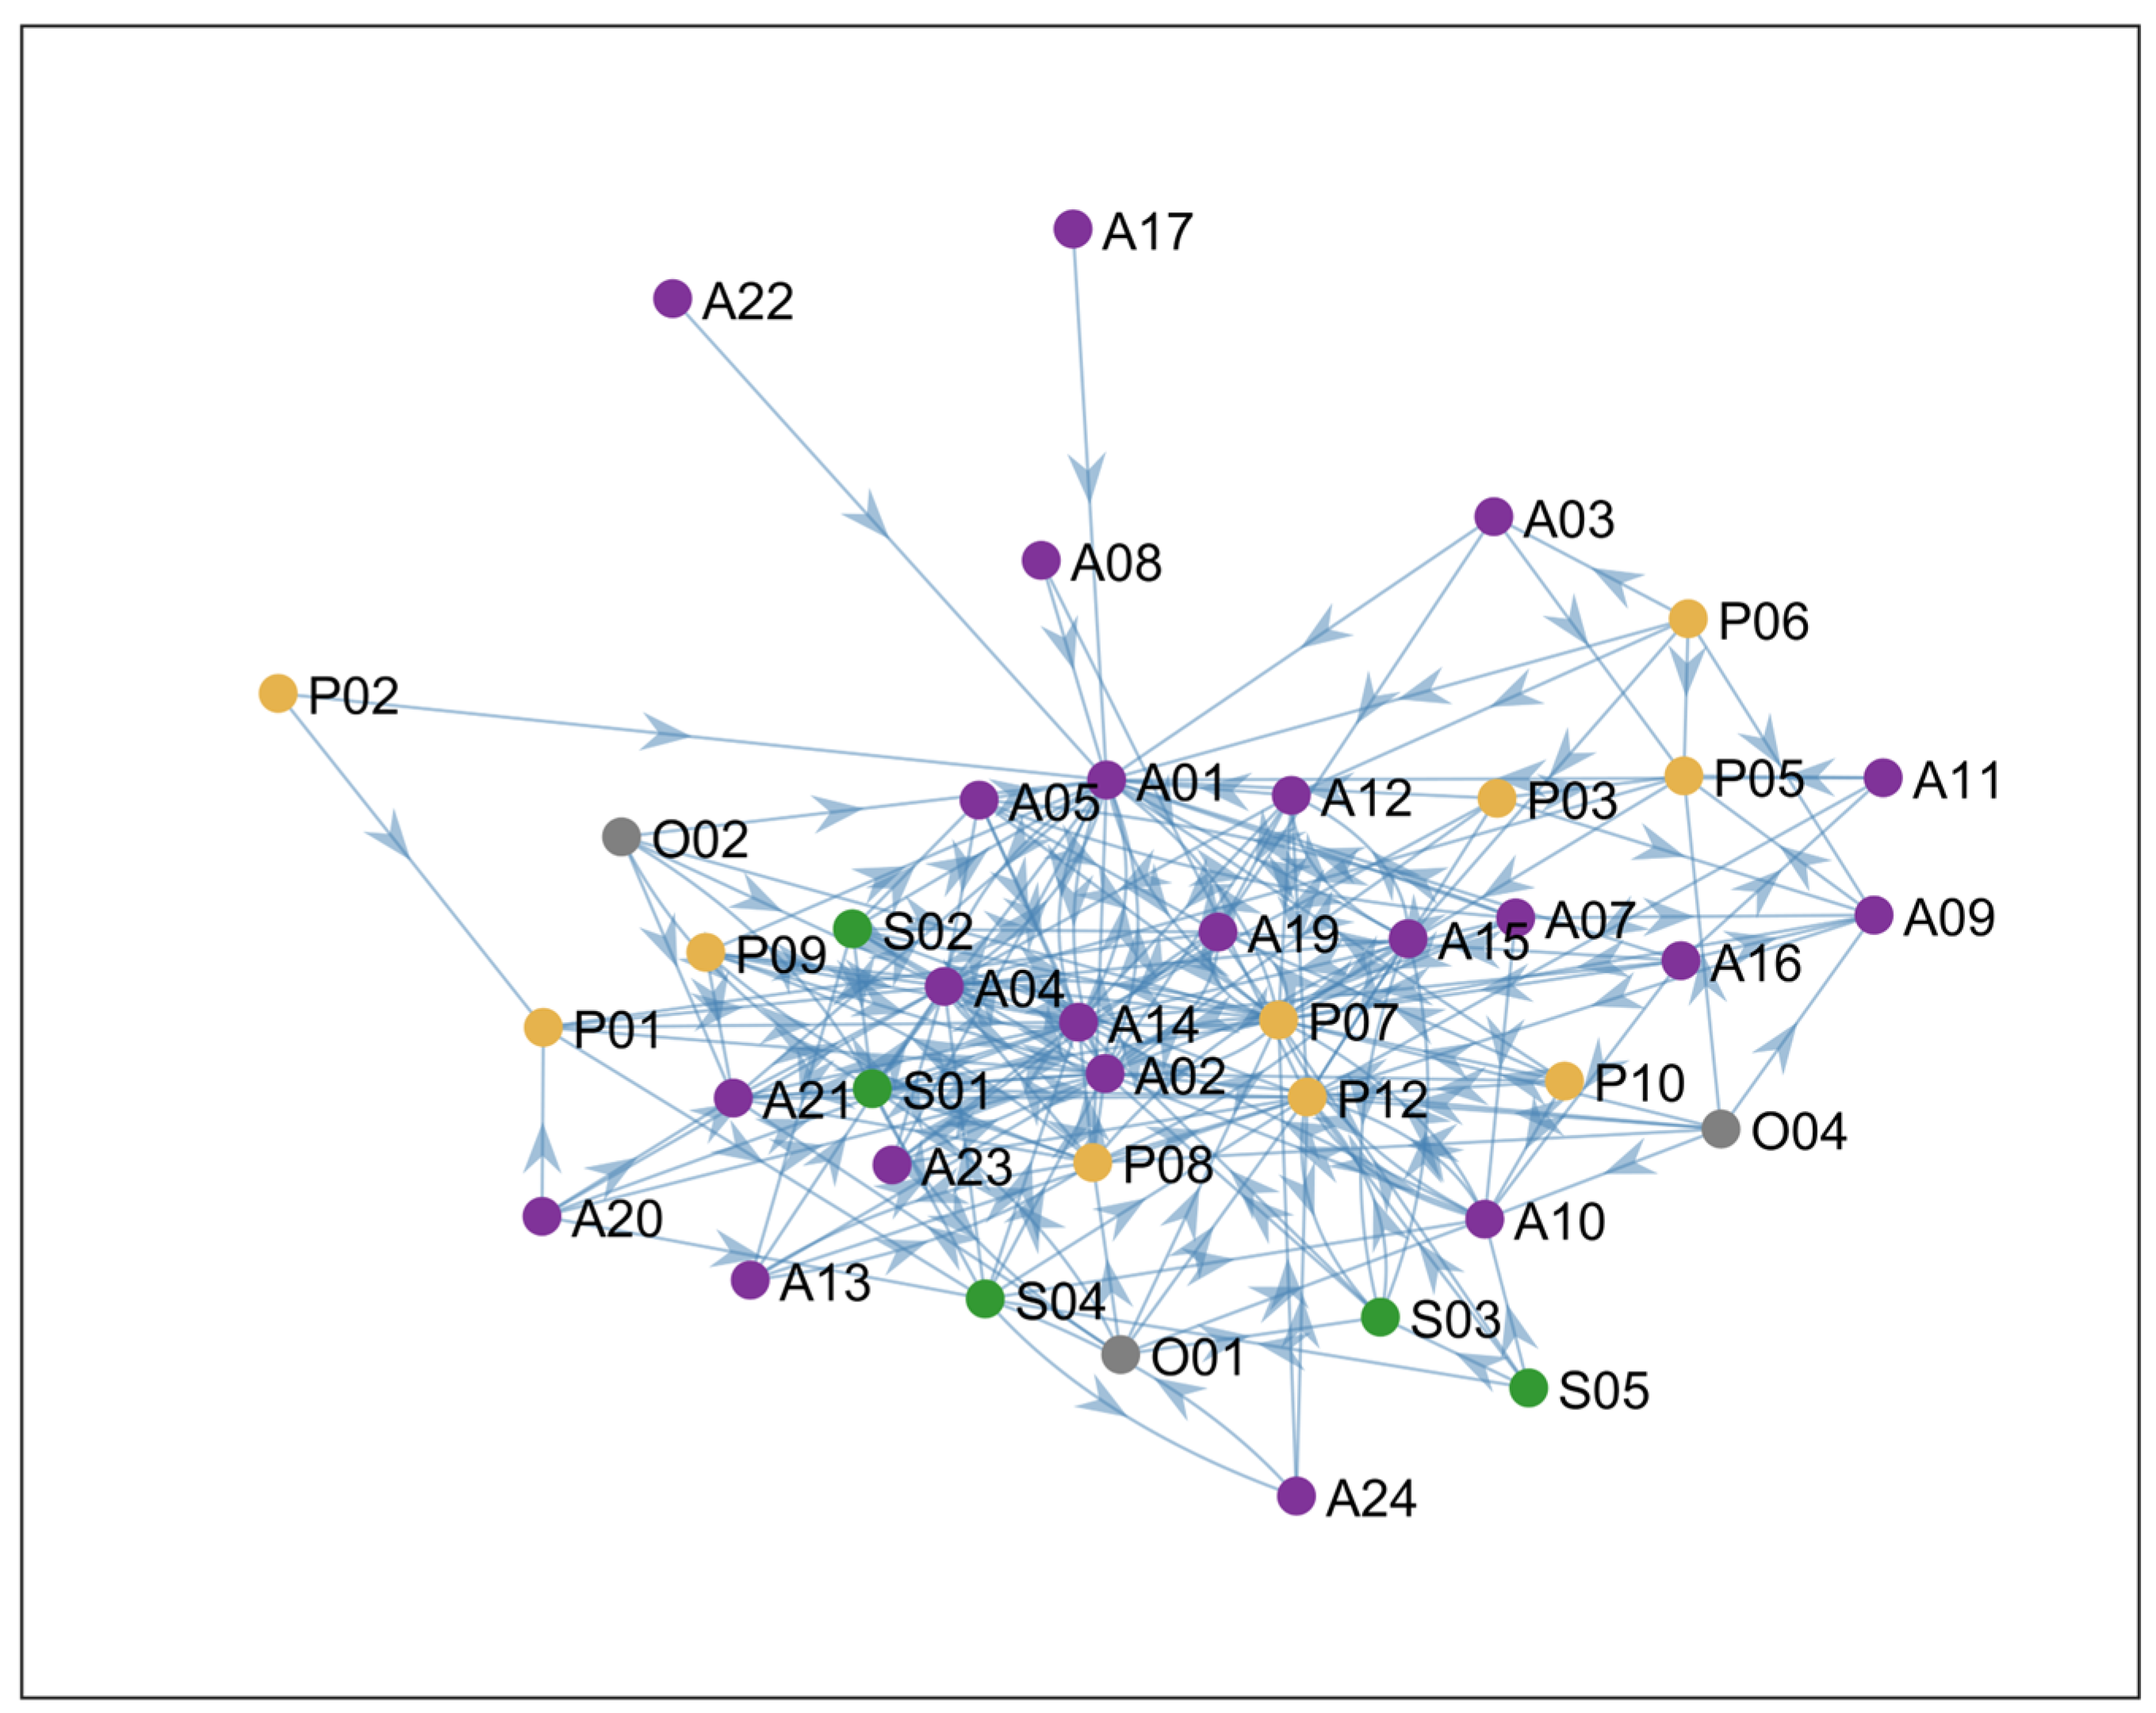
2.2.3. Complex Network
- (1)
- Degree
- (2)
- Average path length
- (3)
- Clustering coefficient
- (4)
- Betweenness centrality
- (5)
- Node criticality
- (6)
- Robustness analysis
3. Results and Discussion
3.1. Identification of Causal Factors by Combining HFACS and Grounded Theory
3.2. Association Rules Results
3.3. Development of a Complex Network of Causal Factors
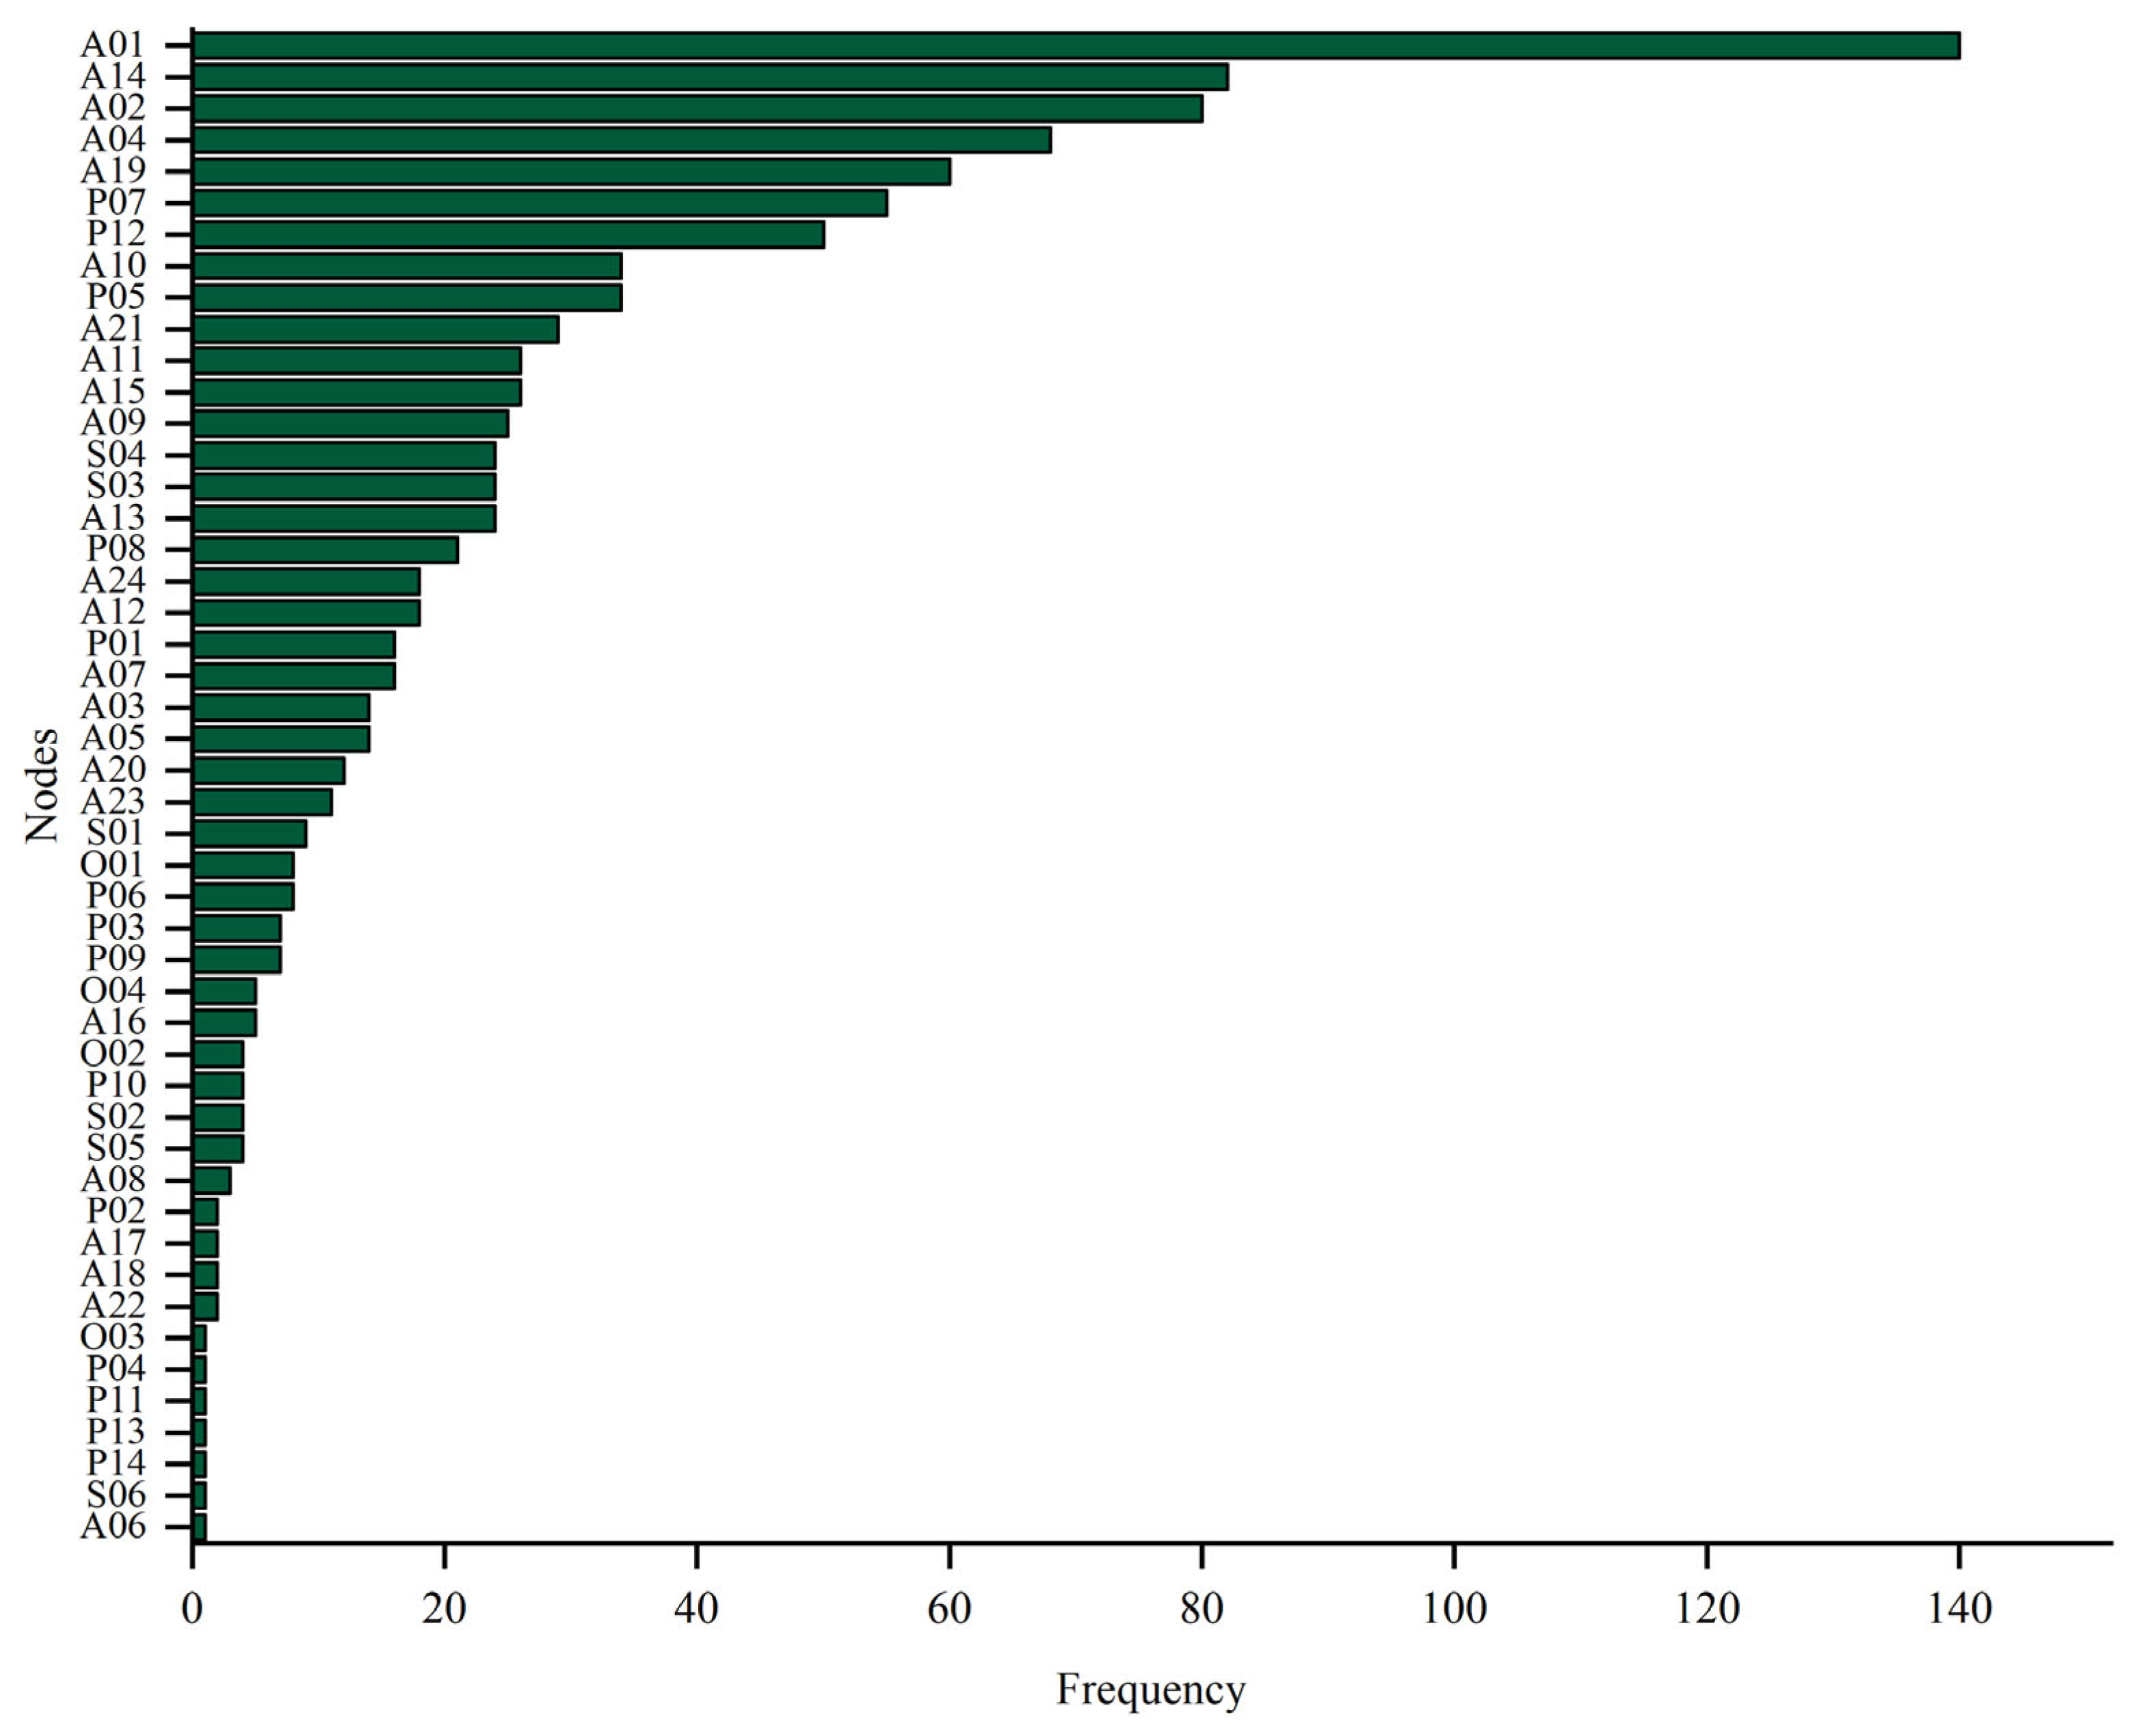
3.4. Network Topological Characterization
- (1)
- Degree
- (2)
- Average path length
- (3)
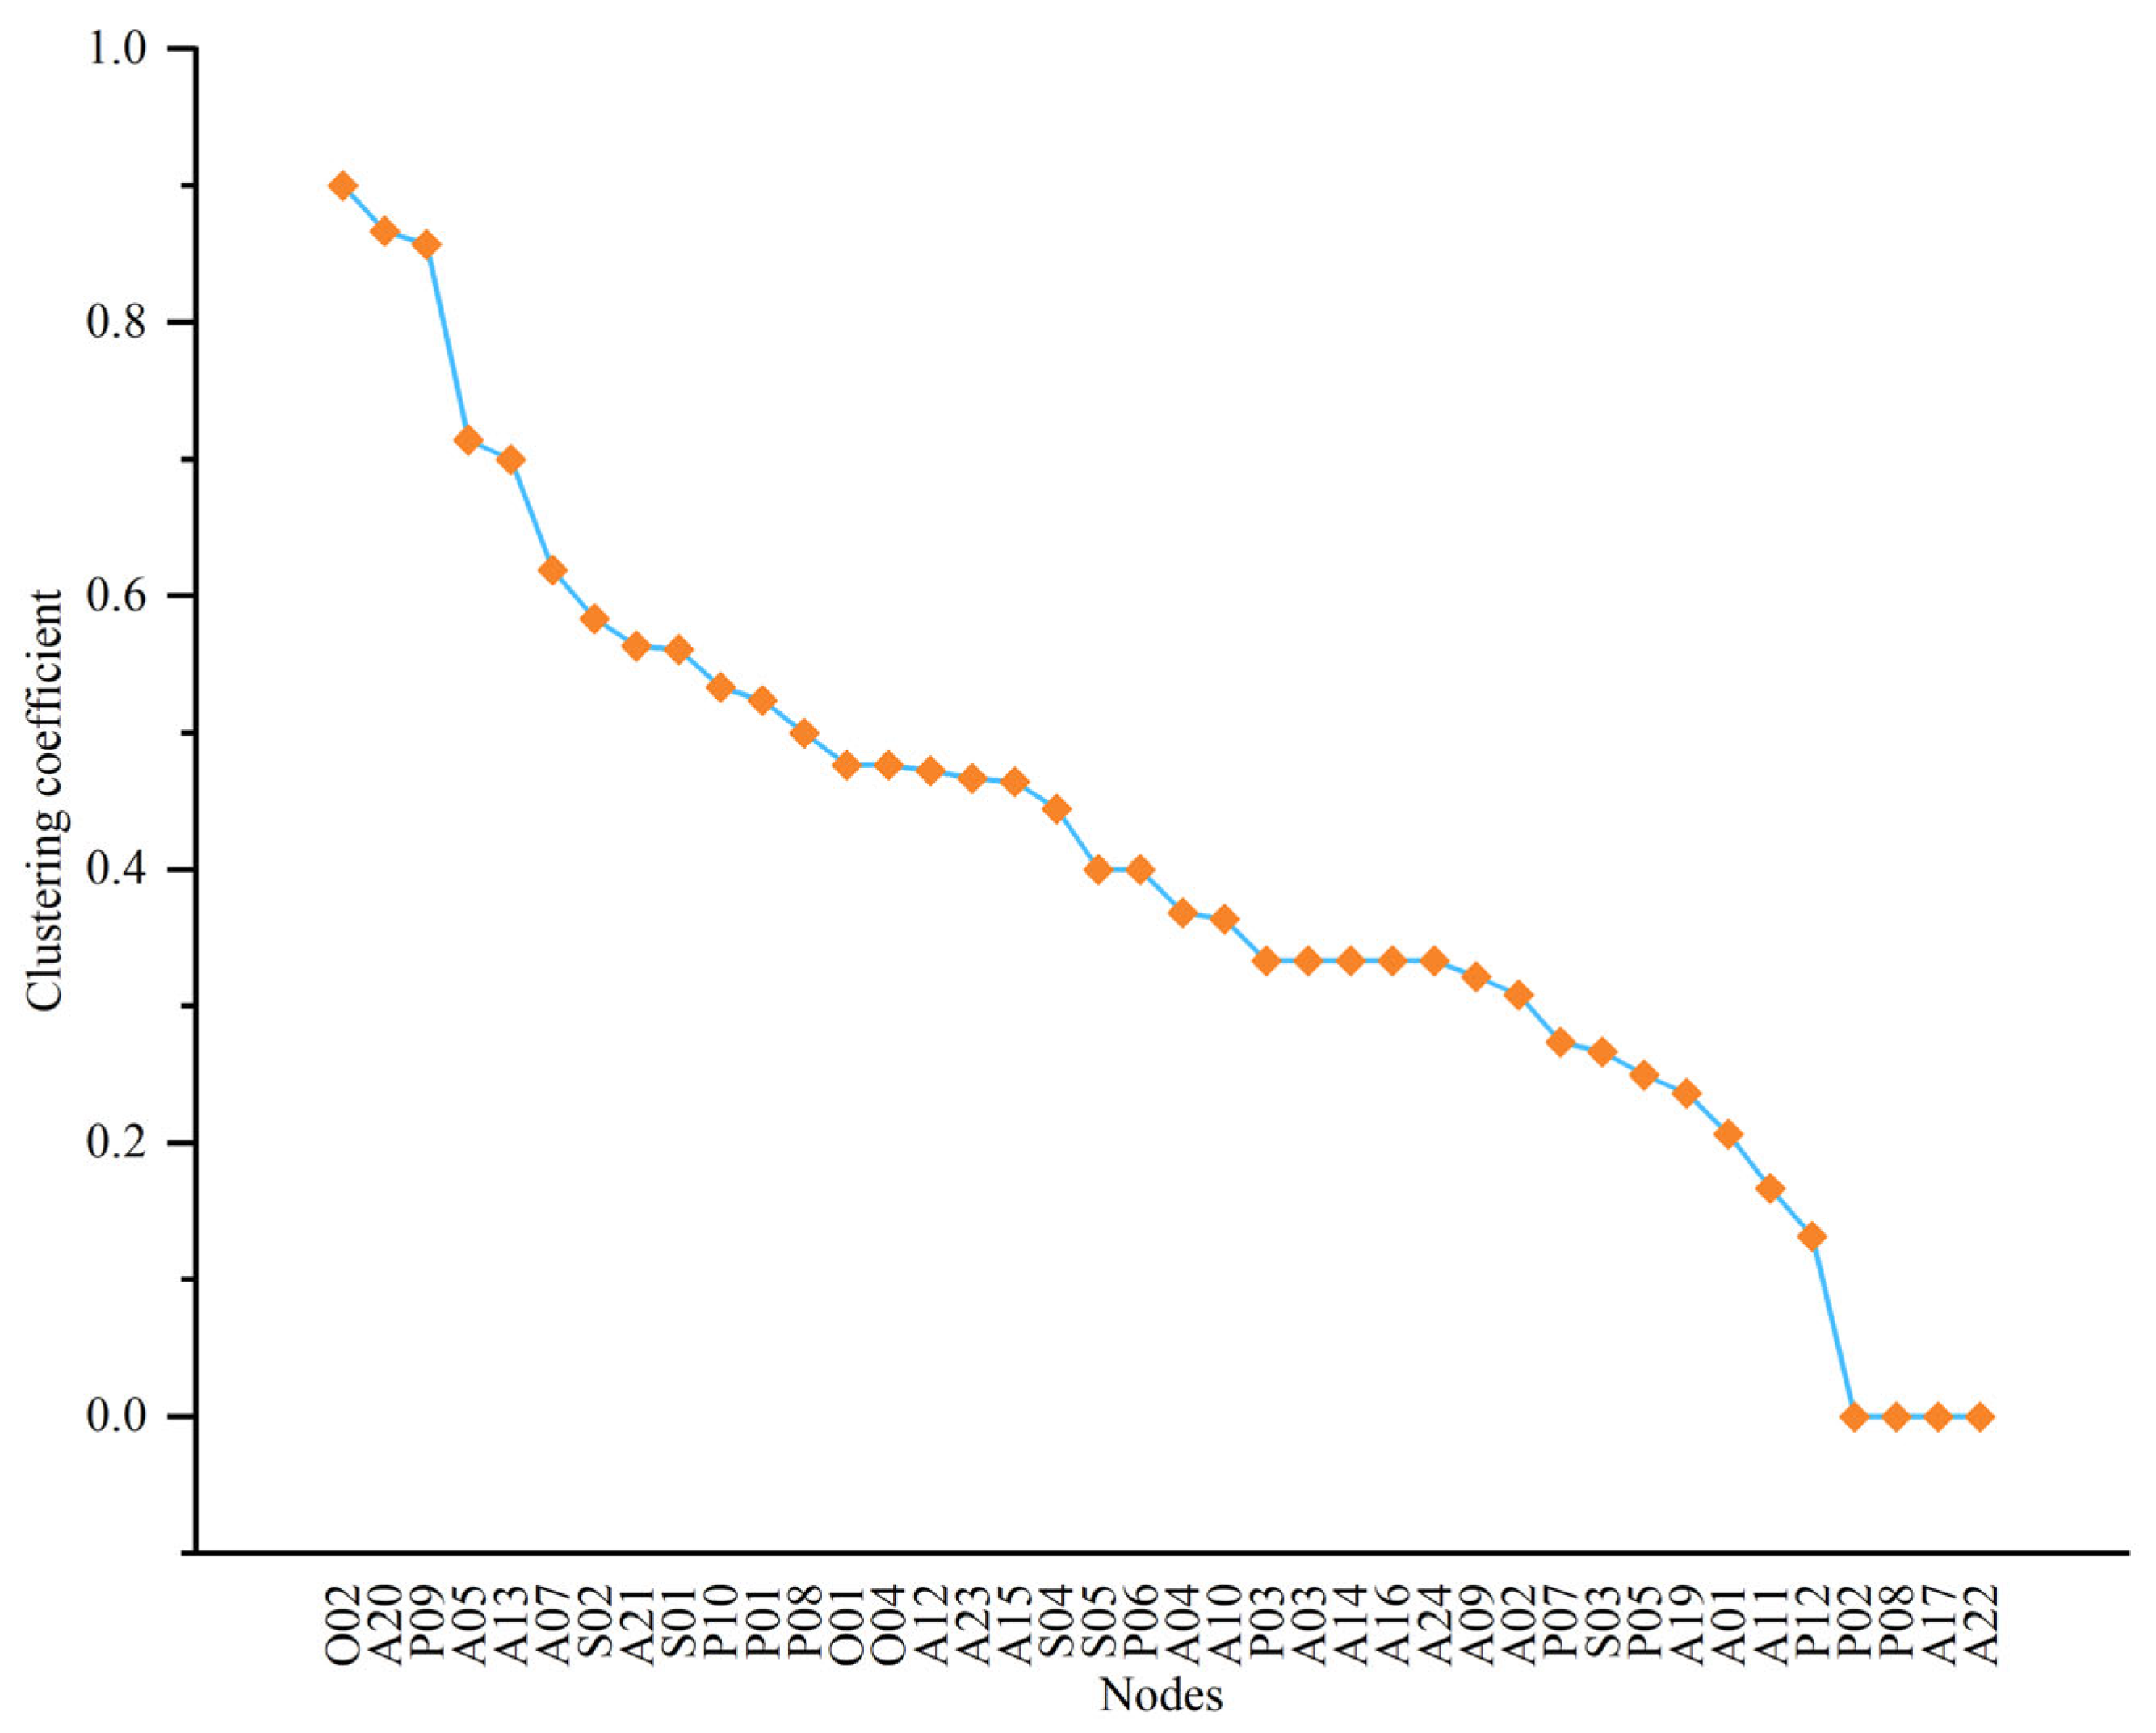
- Clustering coefficient
- (4)
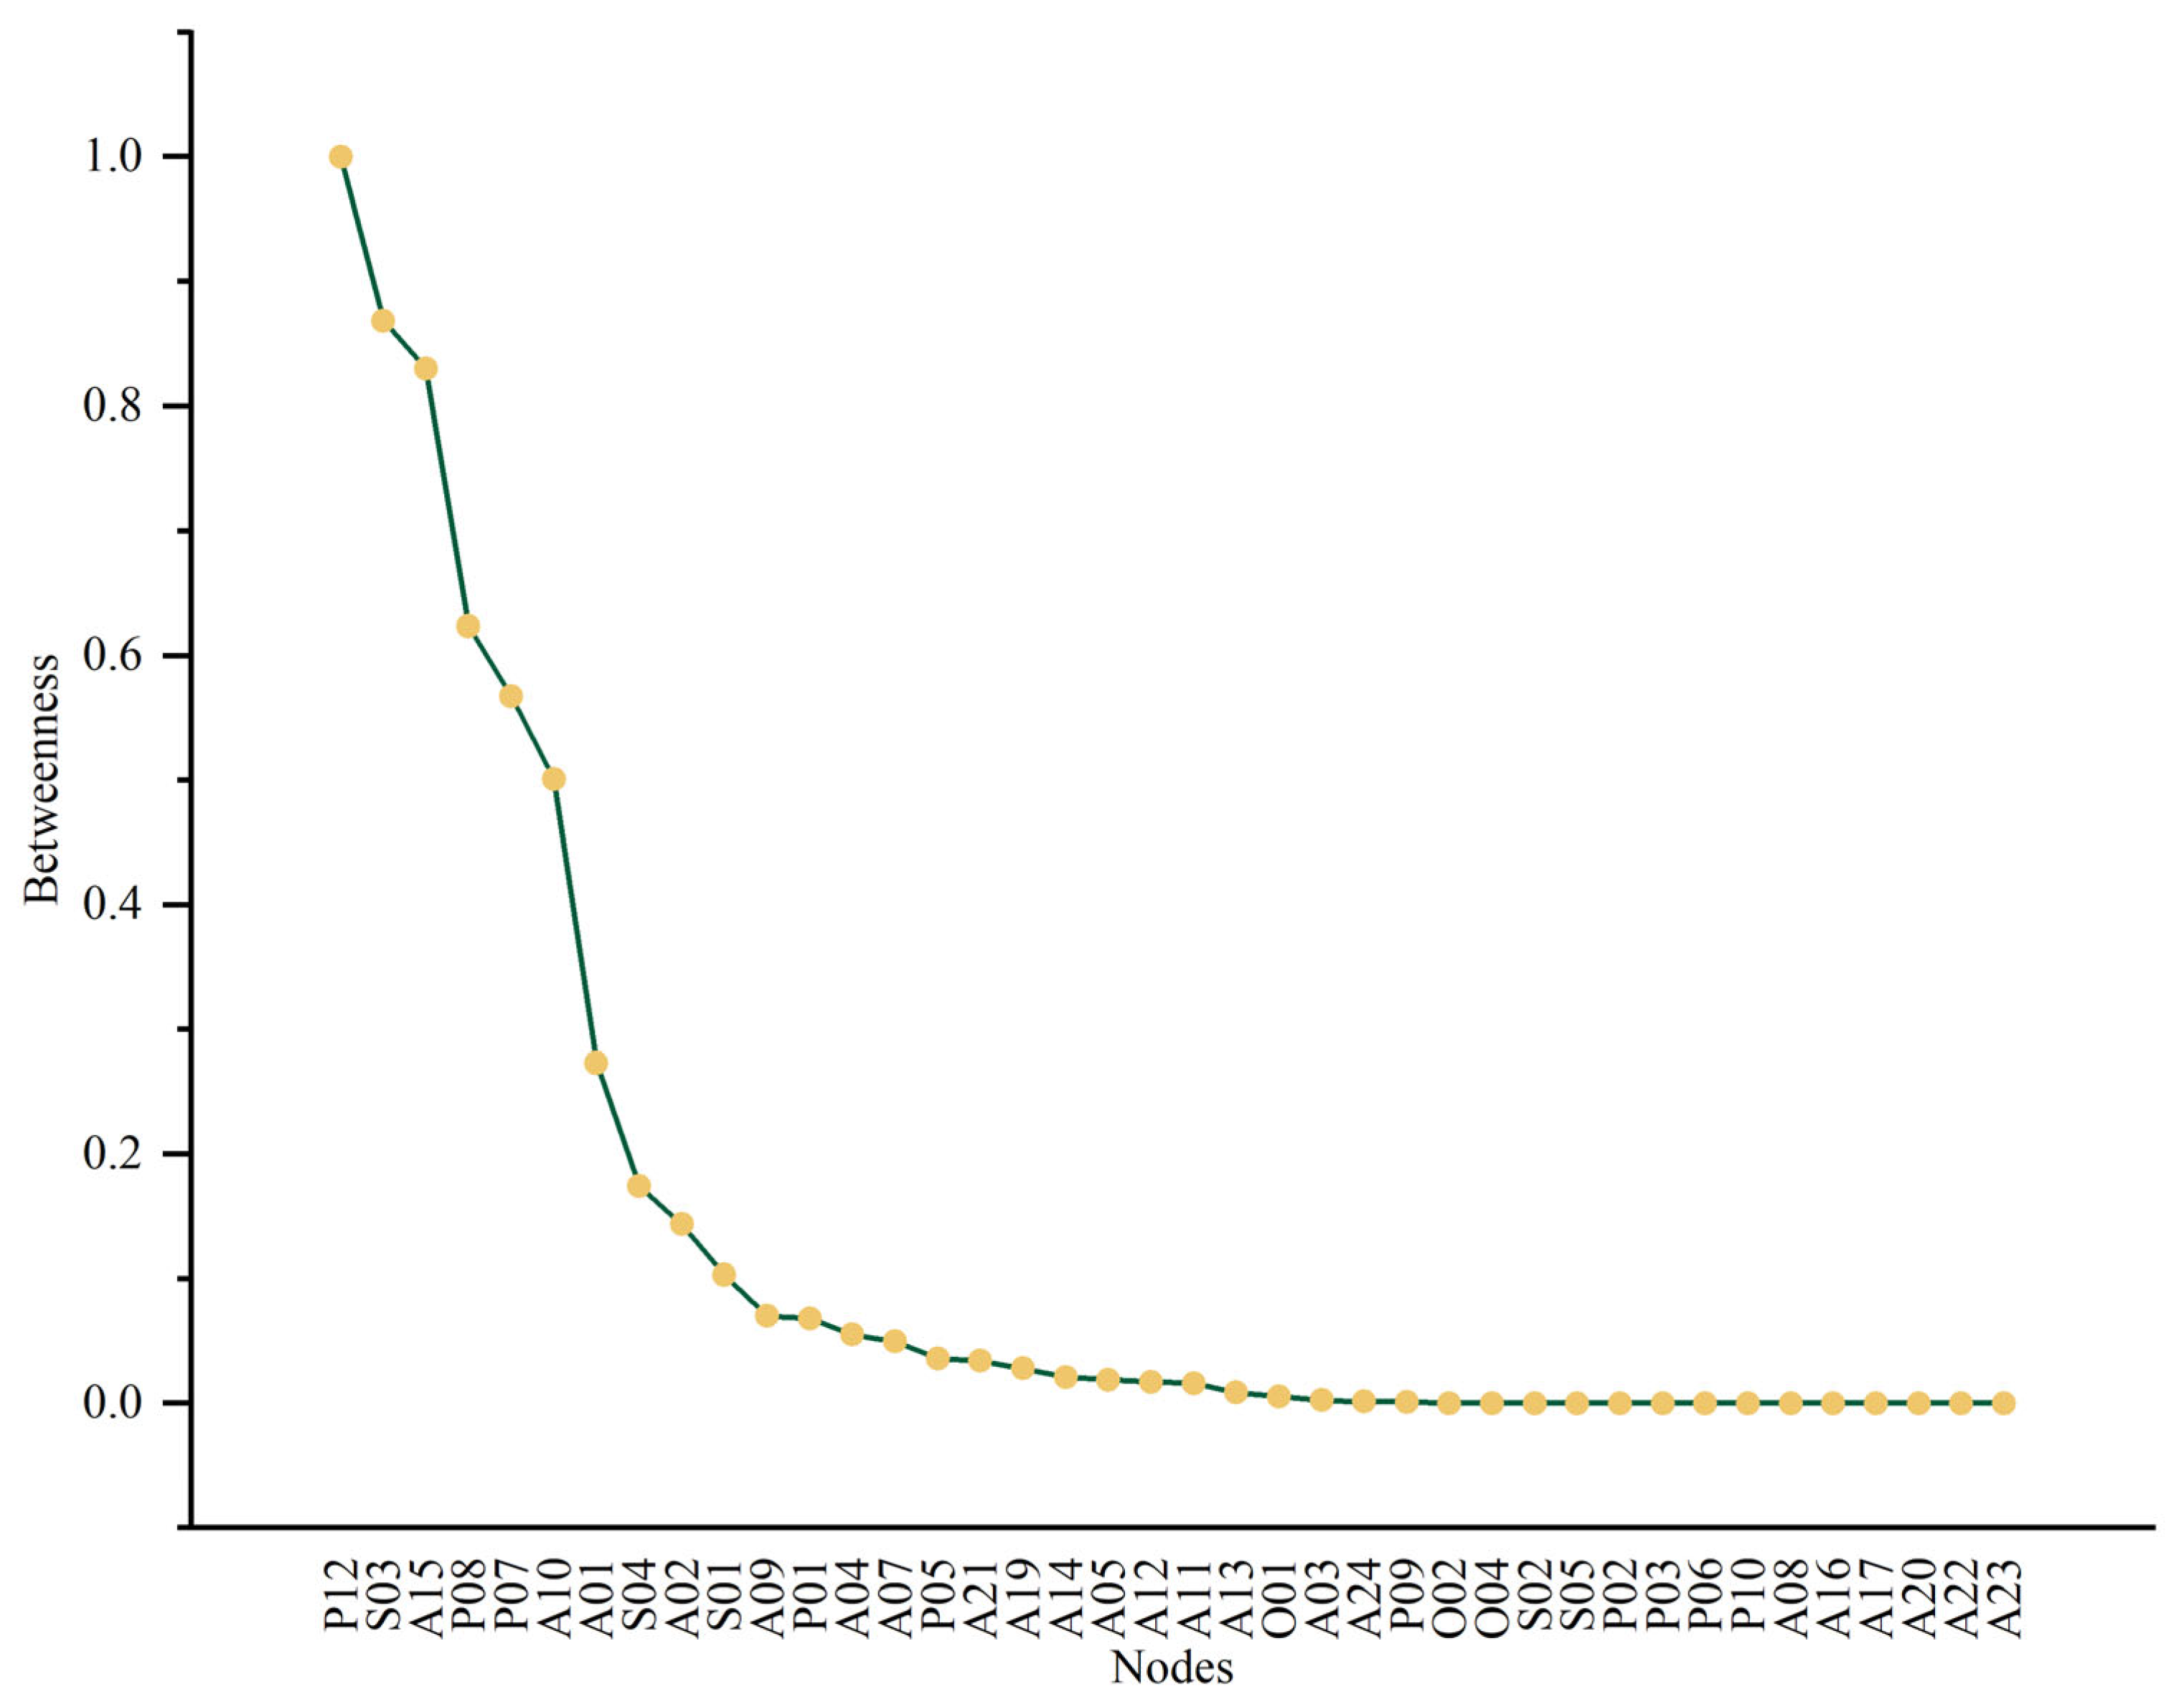
- Betweenness centrality
- (5)
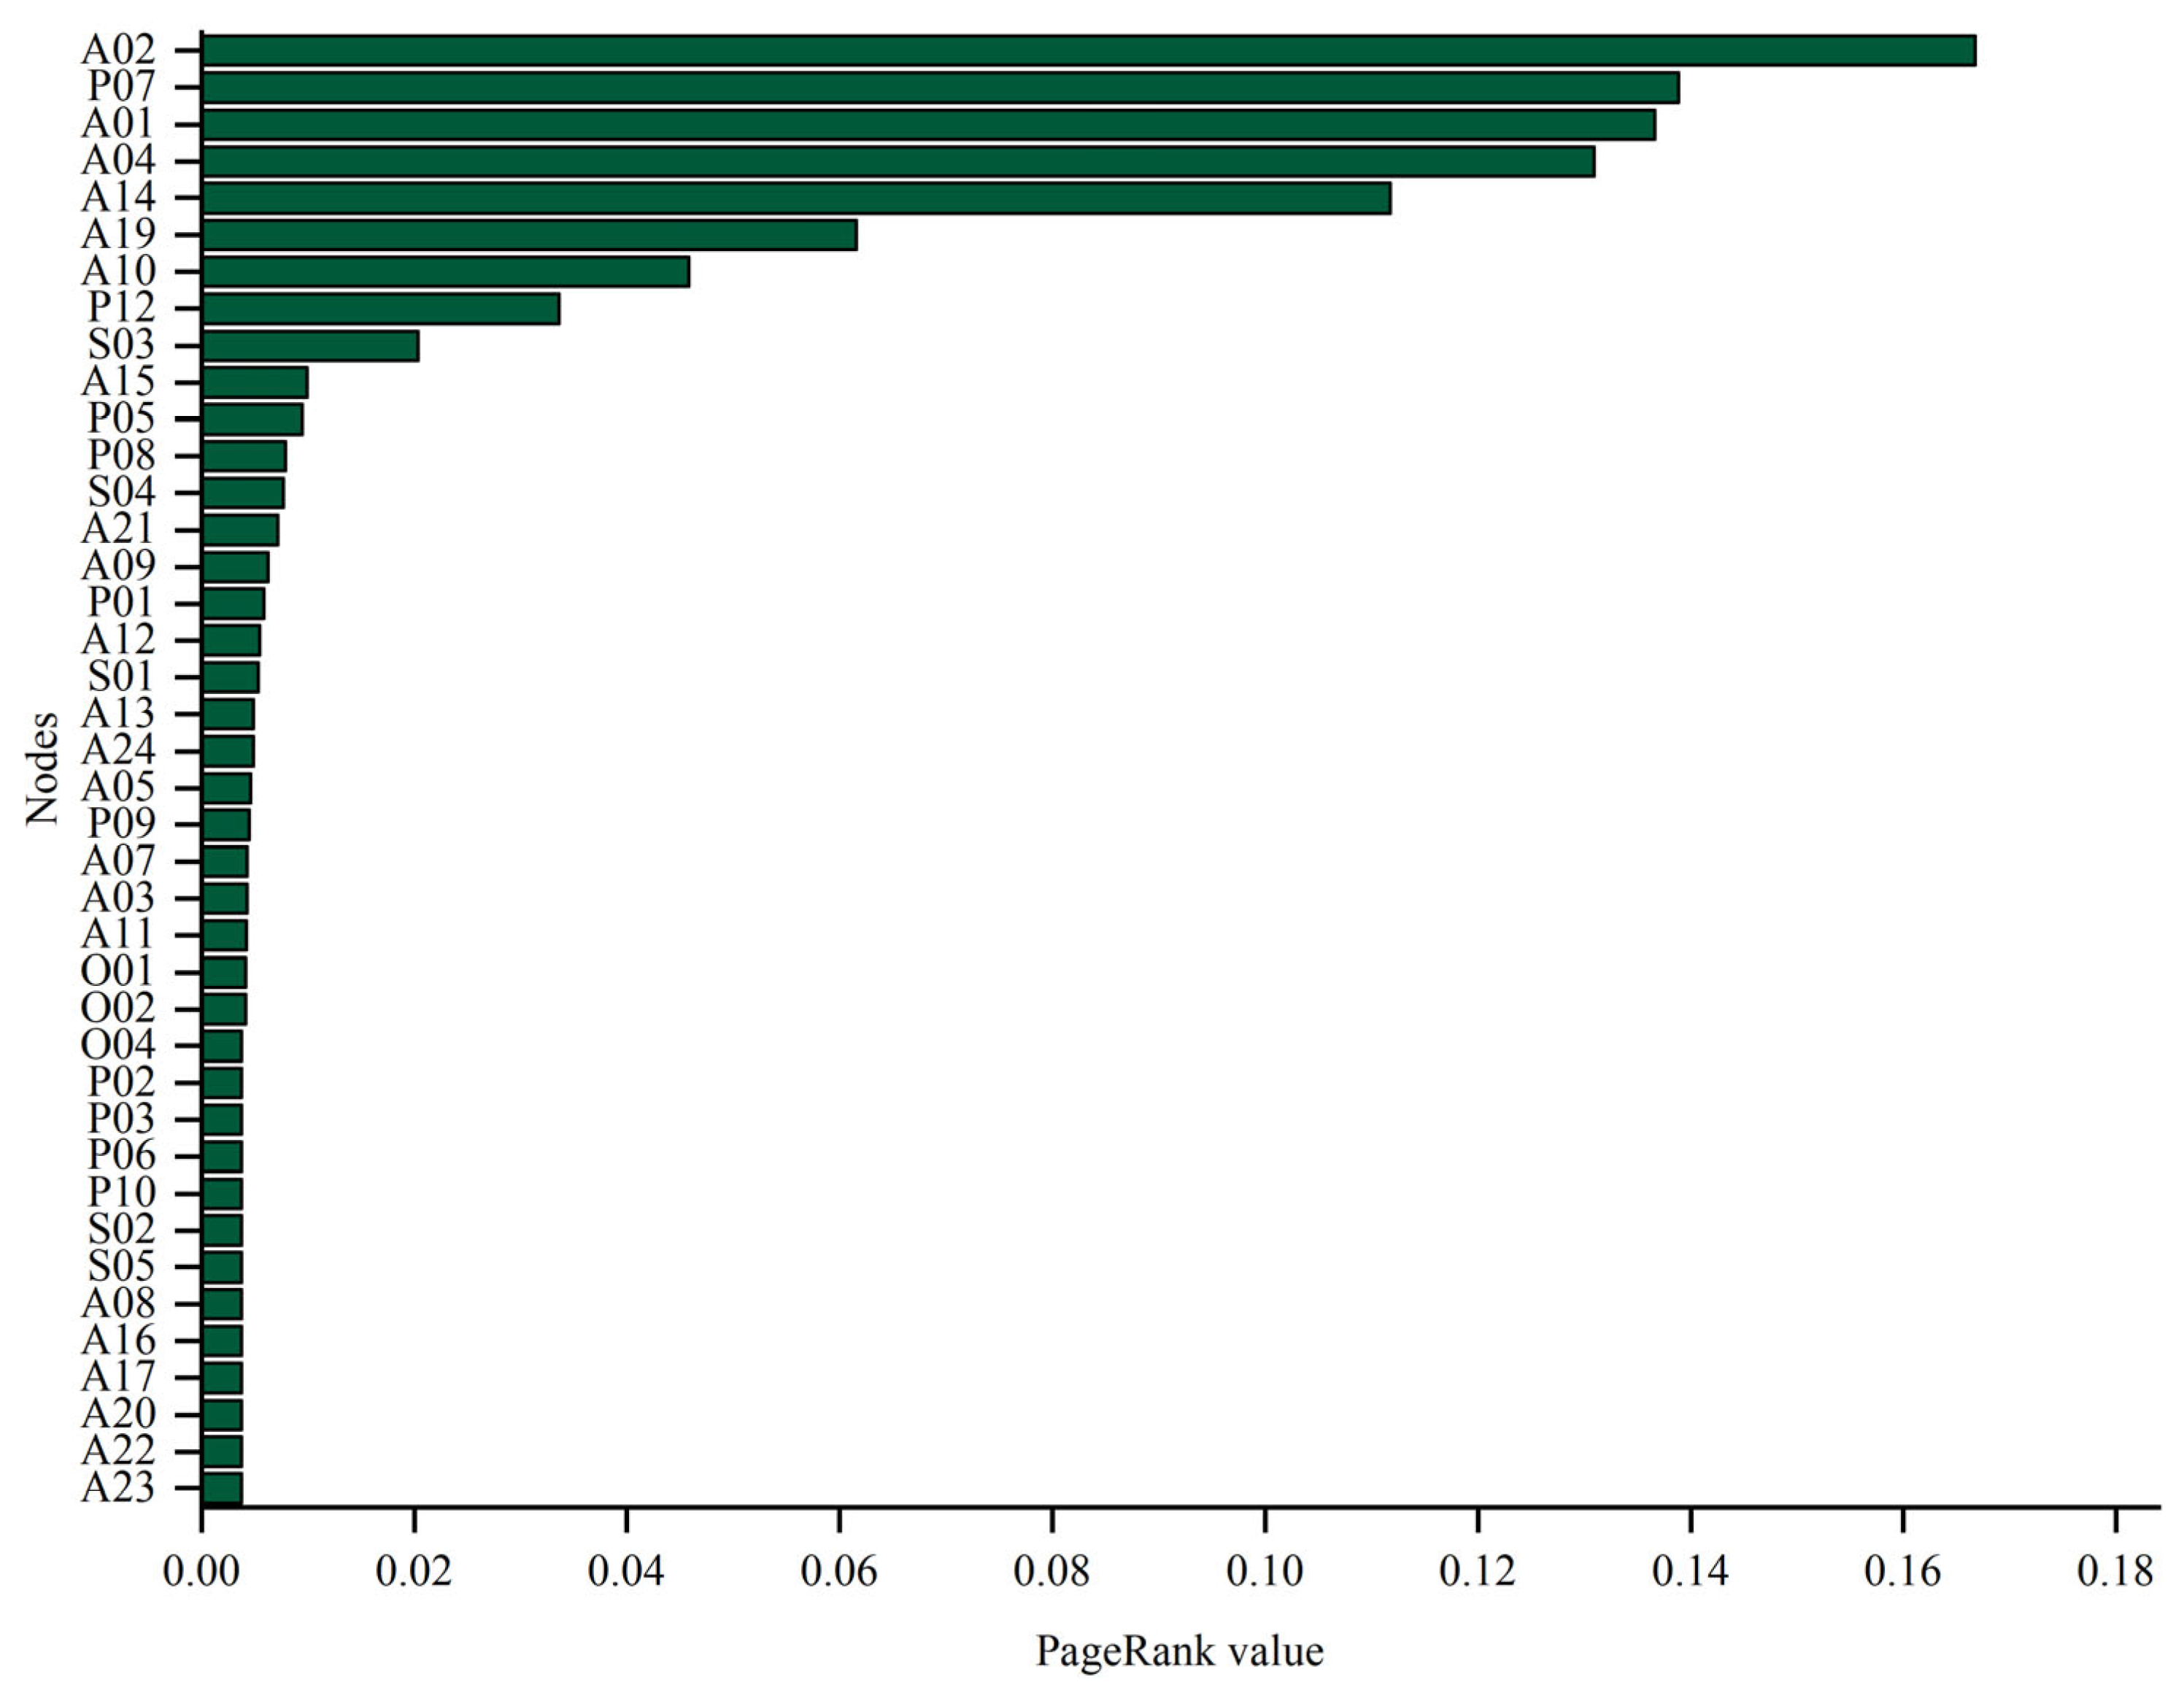
- Node Criticality Analysis
- (6)
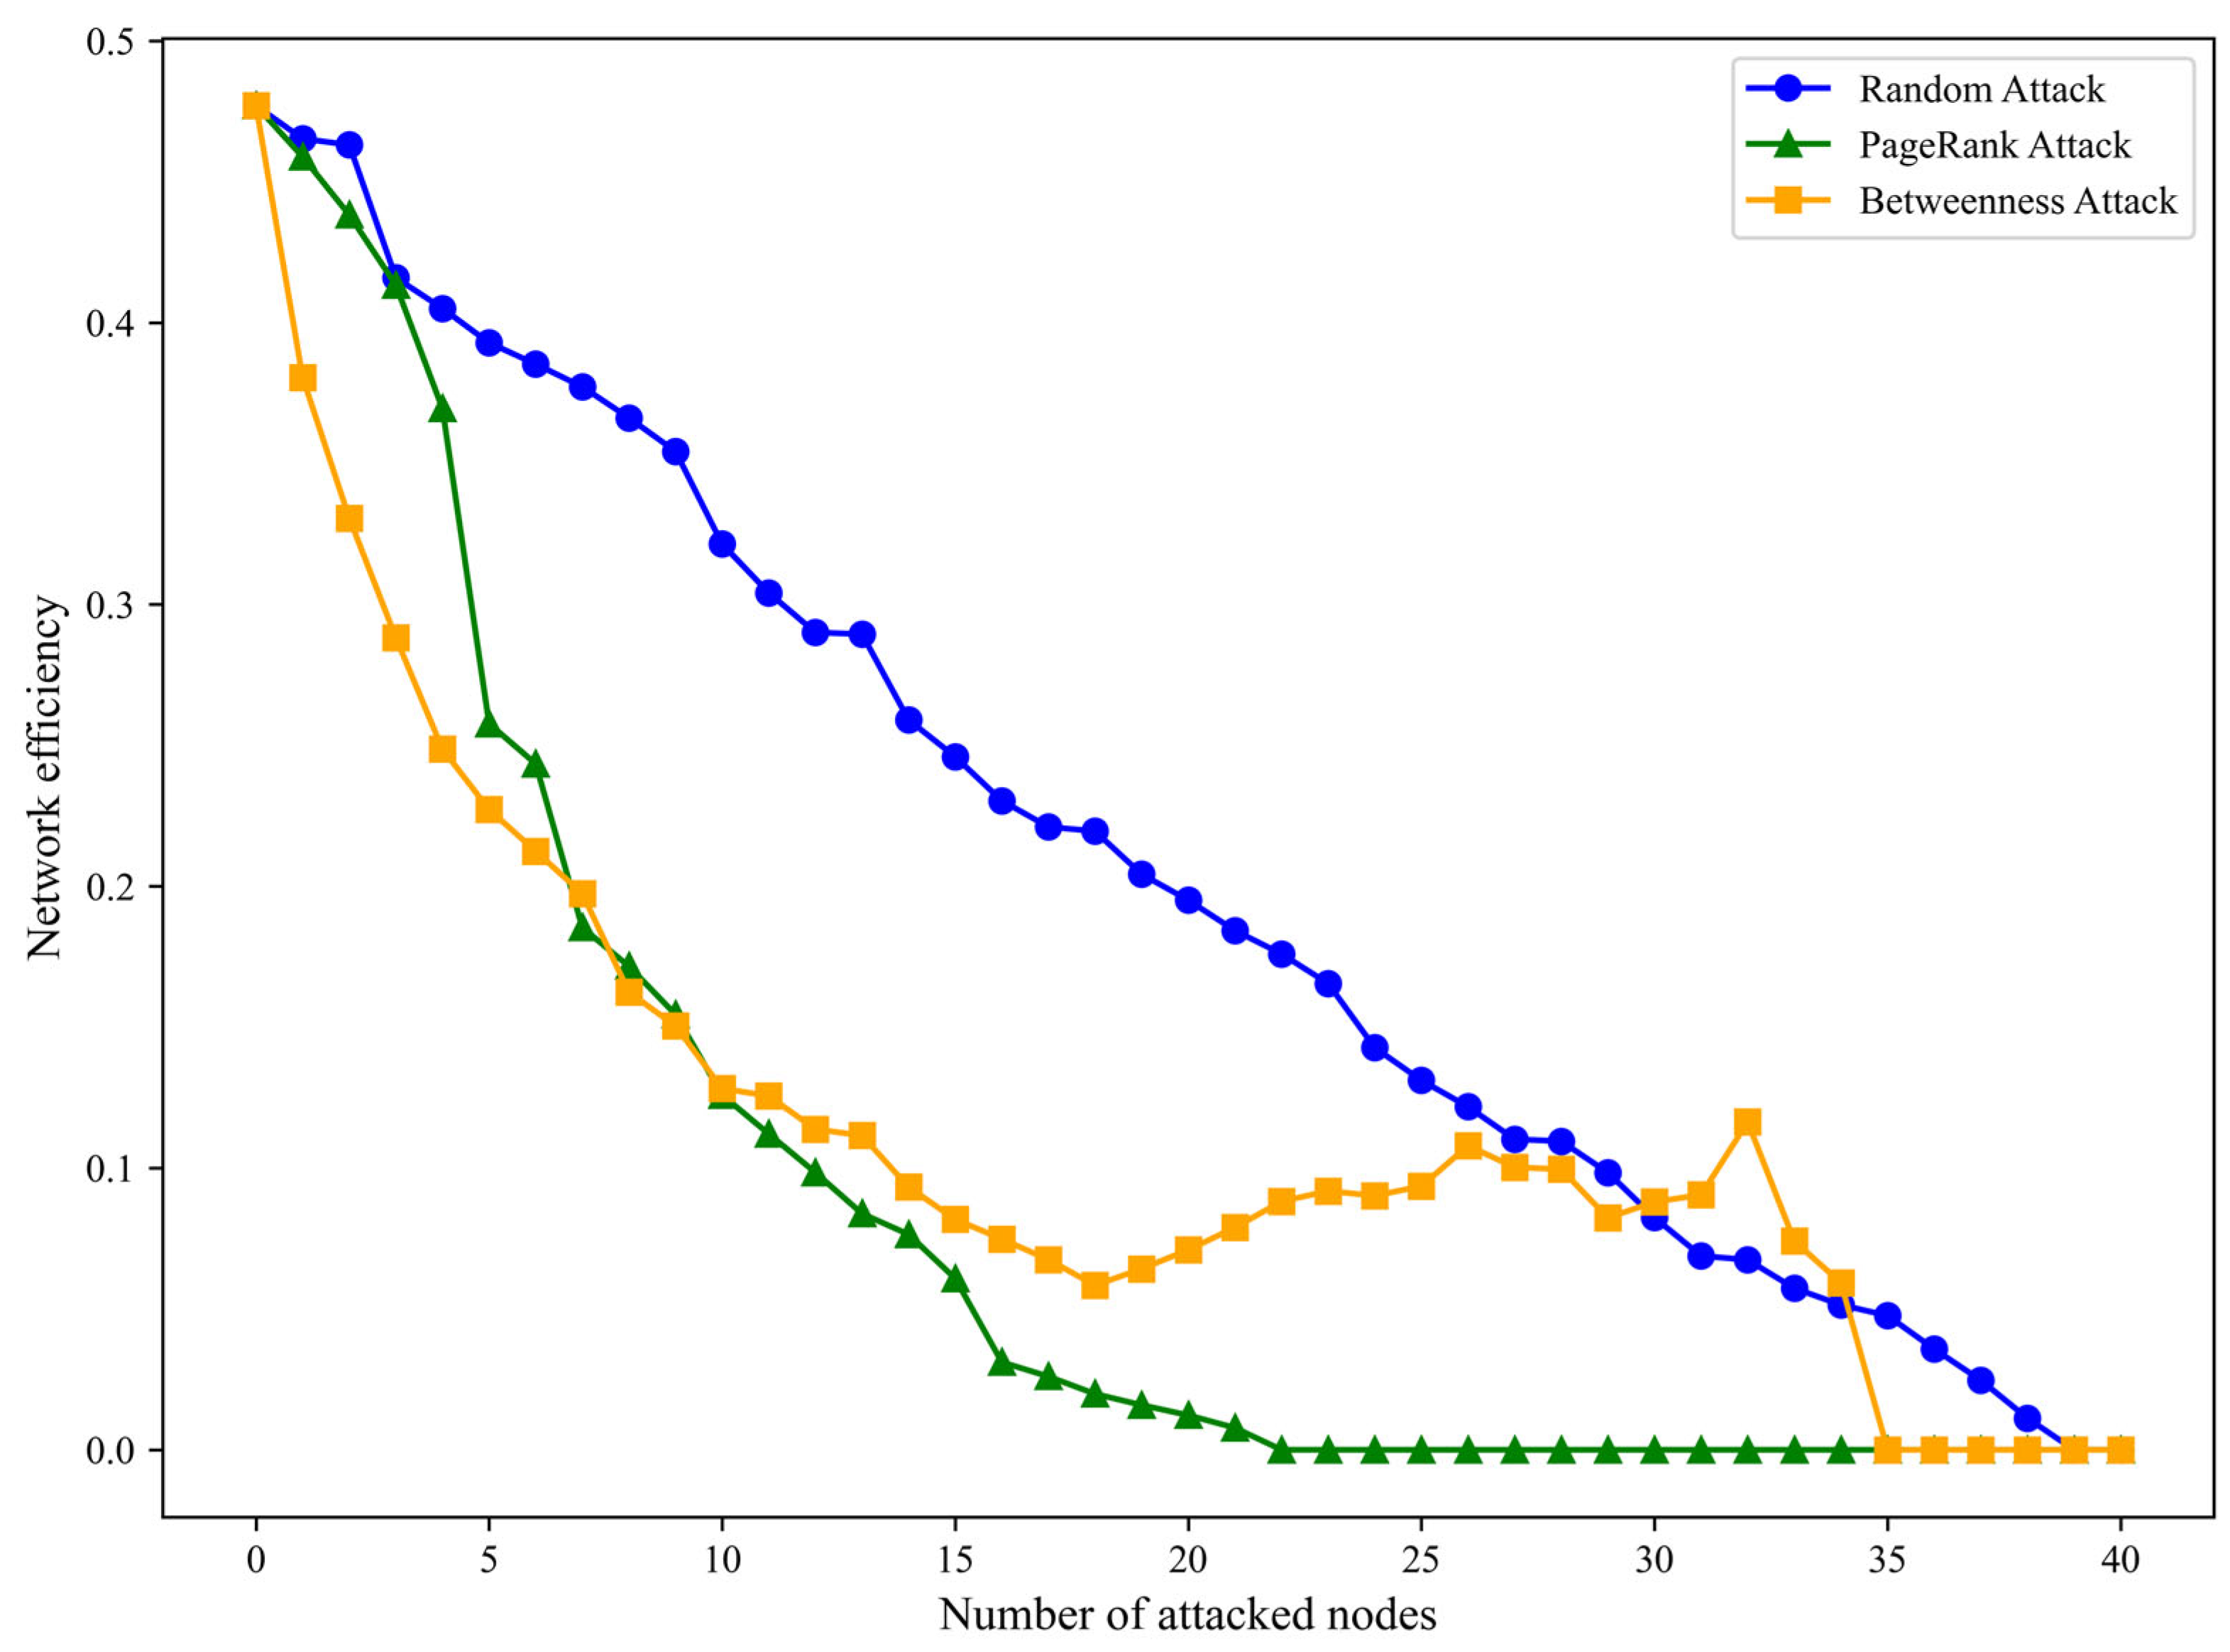
- Robustness analysis
3.5. Practical and Statistical Implications of High-Ranking Factors
4. Conclusions
Author Contributions
Funding
Data Availability Statement
Conflicts of Interest
References
- Zhao, J.S.; Yan, Z.W.; Zhou, Z.Z.; Chen, X.Q.; Wu, B.; Wang, S.Z. A ship trajectory prediction method based on GAT and LSTM. Ocean Eng. 2023, 289, 116159. [Google Scholar] [CrossRef]
- Wang, H.X.; Liu, Z.J.; Wang, X.J.; Graham, T.; Wang, J. An analysis of factors affecting the severity of marine accidents. Reliab. Eng. Syst. Saf. 2021, 210, 107513. [Google Scholar] [CrossRef]
- Lan, H.; Ma, X.X.; Qiao, W.L.; Deng, W.Y. Determining the critical risk factors for predicting the severity of ship collision accidents using a data-driven approach. Reliab. Eng. Syst. Saf. 2023, 230, 108934. [Google Scholar] [CrossRef]
- Zhang, M.Y.; Conti, F.; Le Sourne, H.; Vassalos, D.; Kujala, P.; Lindroth, D.; Hirdaris, S. A method for the direct assessment of ship collision damage and flooding risk in real conditions. Ocean Eng. 2021, 237, 109605. [Google Scholar] [CrossRef]
- Wang, J.H.; Zhou, Y.; Zhuang, L.; Shi, L.; Zhang, S.G. A model of maritime accidents prediction based on multi-factor time series analysis. J. Mar. Eng. Technol. 2023, 22, 153–165. [Google Scholar] [CrossRef]
- Wang, H.; Chen, N.; Wu, B.; Soares, C.G. Human and organizational factors analysis of collision accidents between merchant ships and fishing vessels based on HFACS-BN model. Reliab. Eng. Syst. Saf. 2024, 249, 110201. [Google Scholar] [CrossRef]
- Zhu, C.G.; Lei, J.Y.; Wang, Z.Y.; Zheng, D.C.; Yu, C.Q.; Chen, M.Z.; He, W. Risk Analysis and Visualization of Merchant and Fishing Vessel Collisions in Coastal Waters: A Case Study of Fujian Coastal Area. Mar. Sci. Eng. 2024, 12, 681. [Google Scholar] [CrossRef]
- Yang, J.X.; Sun, Y.; Song, Q.Y.; Ma, L.Q. Laws and preventive methods of collision accidents between merchant and fishing vessels in coastal area of China. Ocean Coast. Manag. 2023, 231, 106404. [Google Scholar] [CrossRef]
- Oh, J.H.; Kim, K.; Jeong, J.S. A Study on the Risk Analysis based on the Trajectory of Fishing Vessels in the VTS Area. Int. J. E-Navig. Marit. Econ. 2015, 2, 38–46. [Google Scholar] [CrossRef]
- Zhang, H.X.; Chen, B.X.; Zhao, Q.; Yu, J.Y.; Fang, Z.Y. Identification of risk key factors and prevention strategies for collision accidents between merchant and fishing vessels in China waters based on complex network. Ocean Eng. 2024, 307, 118148. [Google Scholar] [CrossRef]
- Gai, X.D.; Zhang, Q.; Hu, Y.C.; Wang, G. A Fuzzy Fusion Method for Multi-Ship Collision Avoidance Decision-Making with Merchant and Fishing Vessels. Mar. Sci. Eng. 2024, 12, 1822. [Google Scholar] [CrossRef]
- Przywarty, M.; Jarzabek, D.; Gucma, L. Model of navigational safety of vessels in Polish EEZ. Annu. Navig. 2014, 21, 133–142. [Google Scholar] [CrossRef]
- Jung, C.H. A Study on the Requirement to the Fishing Vessel for Reducing the Collision Accidents. J. Korean Soc. Mar. Environ. Saf. 2014, 20, 18–25. [Google Scholar] [CrossRef]
- Wang, X.K.; Zhou, Z.X.; Liu, Y.; Wang, X.K.; Song, H.R. Discussions about the Best Methods of Collision between Merchant Ships and Fishing Boats during Fishing Seasons Near Chinese Coast. In Proceedings of the International Conference on Computer Information Systems and Industrial Applications (CISIA 2015), Bangkok, Thailand, 28–29 June 2015; pp. 758–761. [Google Scholar]
- Yu, Y.; Chen, L.M.; Shu, Y.Q.; Zhu, W.Y. Evaluation model and management strategy for reducing pollution caused by ship collision in coastal waters. Ocean Coast. Manag. 2021, 203, 105446. [Google Scholar] [CrossRef]
- Shinoda, T.; Shimogawa, K.; Tamura, Y. Applied bayesian network risk assessment for collision accidents between fishing vessels and cargo vessels. J. Inst. Navig. 2012, 127, 165–174. [Google Scholar] [CrossRef]
- Ugurlu, F.; Yildiz, S.; Boran, M.; Ugurlu, O. Analysis of fishing vessel accidents with Bayesian network and Chi-square methods. Ocean Eng. 2020, 198, 106956. [Google Scholar] [CrossRef]
- Liu, K.Z.; Yu, Q.; Yuan, Z.T.; Yang, Z.S.; Shu, Y.Q. A systematic analysis for maritime accidents causation in Chinese coastal waters using machine learning approaches. Ocean Coast. Manag. 2021, 213, 105859. [Google Scholar] [CrossRef]
- Fan, S.Q.; Blanco-Davis, E.; Yang, Z.L.; Zhang, J.F.; Yan, X.P. Incorporation of human factors into maritime accident analysis using a data-driven Bayesian network. Reliab. Eng. Syst. Saf. 2020, 203, 107070. [Google Scholar] [CrossRef]
- Sur, J.M.; Kim, D.J. Comprehensive risk estimation of maritime accident using fuzzy evaluation method–Focusing on fishing vessel accident in Korean waters. Asian J. Shipp. Logist. 2020, 36, 127–135. [Google Scholar] [CrossRef]
- Silveira, P.; Teixeira, A.P.; Figueira, J.R.; Soares, C.G. A multicriteria outranking approach for ship collision risk assessment. Reliab. Eng. Syst. Saf. 2021, 214, 107789. [Google Scholar] [CrossRef]
- Ugurlu, H.; Cicek, I. Analysis and assessment of ship collision accidents using Fault Tree and Multiple Correspondence Analysis. Ocean Eng. 2022, 245, 110514. [Google Scholar] [CrossRef]
- Yildirim, U.; Basar, E.; Ugurlu, O. Assessment of collisions and grounding accidents with human factors analysis and classification system (HFACS) and statistical methods. Saf. Sci. 2019, 119, 412–425. [Google Scholar] [CrossRef]
- Gil, M.; Wrobel, K.; Montewka, J. Toward a method evaluating control actions in STPA-based model of ship-ship collision avoidance process. J. Offshore Mech. Arct. Eng. 2019, 141, 051105. [Google Scholar] [CrossRef]
- Dong, C.M.; Guo, X.T.; Gong, Y.J. Research on Coupling Mechanisms of Risk Factors for Collision Accidents Between Merchant Ships and Fishing Vessels Based on the N-K Model. J. Mar. Sci. Eng. 2025, 13, 466. [Google Scholar] [CrossRef]
- Yang, K.W.; Li, J.C.; Liu, M.D.; Lei, T.Y.; Xu, X.M.; Wu, H.Q.; Cao, J.P.; Qi, G.X. Complex systems and network science: A survey. J. Syst. Eng. Electron. 2023, 34, 543–573. [Google Scholar] [CrossRef]
- Huang, C.H.; Hu, S.P. Factors correlation mining on maritime accidents database using association rule learning algorithm. Clust. Comput.-J. Netw. Softw. Tools Appl. 2019, 22, 4551–4559. [Google Scholar] [CrossRef]
- IMO. Convention on the International Regulations for Preventing Collisions at Sea. Available online: https://www.imo.org/en/OurWork/Safety/Pages/Preventing-Collisions.aspx (accessed on 20 November 2024).
- IMO. International Convention on Standards of Training, Certification and Watchkeeping for Seafarers. Available online: https://www.imo.org/en/OurWork/HumanElement/Pages/STCW-Convention.aspx (accessed on 20 November 2024).
- IMO. International Safety Management Code. Available online: https://www.imo.org/en/OurWork/HumanElement/Pages/ISMCode.aspx (accessed on 20 November 2024).
- Lan, H.; Ma, X.X.; Qiao, W.L.; Ma, L.H. On the causation of seafarers’ unsafe acts using grounded theory and association rule. Reliab. Eng. Syst. Saf. 2022, 223, 108498. [Google Scholar] [CrossRef]
- Ma, L.H.; Ma, X.X.; Wang, T.; Chen, L.G.; Lan, H. On the development and measurement of human factors complex network for maritime accidents: A case of ship groundings. Ocean Coast. Manag. 2024, 248, 106954. [Google Scholar] [CrossRef]
- Wiegmann, D.A.; Shappell, S.A. Human error analysis of commercial aviation accidents: Application of the human factors analysis and classification system (HFACS). Aviat. Space Environ. Med. 2001, 72, 1006–1016. [Google Scholar]
- Shappell, S.; Detwiler, C.; Holcomb, K.; Hackworth, C.; Boquet, A.; Wiegmann, D.A. Human error and commercial aviation accidents: An analysis using the human factors analysis and classification system. Hum. Factors 2007, 49, 227–242. [Google Scholar] [CrossRef]
- Liu, R.L.; Cheng, W.M.; Yu, Y.B.; Xu, Q.F. Human factors analysis of major coal mine accidents in China based on the HFACS-CM model and AHP method. Int. J. Ind. Ergon. 2018, 68, 270–279. [Google Scholar] [CrossRef]
- Xia, N.N.; Zou, P.X.W.; Liu, X.; Wang, X.Q.; Zhu, R.H. A hybrid BN-HFACS model for predicting safety performance in construction projects. Saf. Sci. 2017, 101, 332–343. [Google Scholar] [CrossRef]
- Zhan, Q.J.; Zheng, W.; Zhao, B.B. A hybrid human and organizational analysis method for railway accidents based on HFACS-Railway Accidents (HFACS-RAs). Saf. Sci. 2017, 91, 232–250. [Google Scholar] [CrossRef]
- Chen, S.T.; Wall, A.; Davies, P.; Yang, Z.L.; Wang, J.; Chou, Y.H. A Human and Organizational Factors (HOFs) analysis method for marine casualties using HFACS-Maritime Accidents (HFACS-MA). Saf. Sci. 2013, 60, 105–114. [Google Scholar] [CrossRef]
- Xu, R.H.; Luo, F.; Chen, G.M.; Zhou, F.H.; Abdulahi, E.W. Application of HFACS and grounded theory for identifying risk factors of air traffic controllers’ unsafe acts. Int. J. Ind. Ergon. 2021, 86, 103228. [Google Scholar] [CrossRef]
- Xu, C.C.; Bao, J.; Wang, C.; Liu, P. Association rule analysis of factors contributing to extraordinarily severe traffic crashes in China. J. Saf. Res. 2018, 67, 65–75. [Google Scholar] [CrossRef]
- Cakir, E.; Fiskin, R.; Sevgili, C. Investigation of tugboat accidents severity: An application of association rule mining algorithms. Reliab. Eng. Syst. Saf. 2021, 209, 107470. [Google Scholar] [CrossRef]
- Jia, X.H.; Zhang, D.H. Prediction of maritime logistics service risks applying soft set based association rule: An early warning model. Reliab. Eng. Syst. Saf. 2021, 207, 107339. [Google Scholar] [CrossRef]
- Qiao, W.G.; Liu, Q.L.; Li, X.C.; Luo, X.X.; Wan, Y.L. Using data mining techniques to analyze the influencing factor of un-safe behaviors in Chinese underground coal mines. Resour. Policy 2018, 59, 210–216. [Google Scholar] [CrossRef]
- Hong, J.; Tamakloe, R.; Park, D. Application of association rules mining algorithm for hazardous materials transportation crashes on expressway. Accid. Anal. Prev. 2020, 142, 105497. [Google Scholar] [CrossRef]
- Agrawal, R.; Imielinski, T.; Swami, A. Mining association rules between sets of items in large databases. ACM SIGMOD Rec. 1993, 22, 207–216. [Google Scholar] [CrossRef]
- Li, K.P.; Pan, Y. An effective method for identifying the key factors of railway accidents based on the network model. Int. J. Mod. Phys. B 2020, 34, 2050192. [Google Scholar] [CrossRef]
- Wang, Y.D.; Zhai, H.N.; Cao, X.H.; Geng, X. Cause Analysis and Accident Classification of Road Traffic Accidents Based on Complex Networks. Appl. Sci. 2023, 13, 12963. [Google Scholar] [CrossRef]
- Chen, F.Y.; Yao, S.Y.; Wei, Y.C. Risk analysis of construction accidents with a weighted network model considering accident level. Qual. Reliab. Eng. Int. 2022, 39, 3230–3251. [Google Scholar] [CrossRef]
- Luo, S.Q.; Wu, X.W.; Kao, B. Distributed PageRank computation with improved round complexities. Inf. Sci. 2022, 607, 109–125. [Google Scholar] [CrossRef]
- Shi, J.H.; Liu, Z.J.; Feng, Y.W.; Wang, X.J.; Zhu, H.W.; Yang, Z.L.; Wang, J.; Wang, H.X. Evolutionary model and risk analysis of ship collision accidents based on complex networks and DEMATEL. Ocean Eng. 2024, 305, 117965. [Google Scholar] [CrossRef]


| Original Content | Conceptualization | Category | Main Category | Core Category |
|---|---|---|---|---|
| Negligent lookout and failure to adequately assess the situation and the risk of collision. | Failure to maintain proper lookout | Failure to maintain proper lookout | Error | Unsafe acts |
| Variables | Causal Factors |
|---|---|
| O01 | Inadequate security management of the company |
| O02 | Inadequate education and training |
| O03 | Inadequate content of safety management system documents |
| O04 | Poor safety awareness |
| P01 | Poor communication |
| P02 | Failure to formulate relevant work plans before the vessel departs, or the work plan contains risks |
| P03 | Failure to comply with regulations in certain ship structures |
| P04 | Drinking/Alcoholism |
| P05 | Illegal operations and unlawful business practices of fishing vessels |
| P06 | Illegal installation of fisheries production facilities and fish rafts |
| P07 | Complex navigation environment |
| P08 | Poor visibility |
| P09 | Inadequate caution in unfamiliar waters |
| P10 | Failure to repair mechanical issues on the vessel in a timely manner, or mechanical equipment failure |
| P11 | Overloaded vessel, or suspected overload |
| P12 | Unqualified crew |
| P13 | Crew fatigue |
| P14 | Engine or electrical failure, or loss of power |
| S01 | Failure to strictly implement daily management regulations by the captain |
| S02 | Poor risk awareness in daily ship management by the captain |
| S03 | Illegal or non-compliant operations of the ship, with issues in certificates or qualifications |
| S04 | Failure to provide sufficient and qualified crew members |
| S05 | Deliberate shutdown of AIS, use of false AIS, and AIS failures |
| S06 | Failure to monitor the vessel’s navigation dynamics and technical status |
| A01 | Serious negligence in lookout, failure to maintain suitable lookout |
| A02 | Failure to assess collision risks properly |
| A03 | Failure to comply with onboard navigation or related operational procedures |
| A04 | Failure to adopt a safe speed |
| A05 | Underestimation of environmental impacts, poor risk management decisions |
| A06 | Failure of pilots to navigate with care |
| A07 | Improper operation |
| A08 | Inadequate estimation of environmental risks and risky voyages out of port |
| A09 | Failure to exercise caution and maintain necessary vigilance during navigation |
| A10 | Failure to maneuver the ship with good seamanship |
| A11 | Violation of rules and regulations related to ship navigation |
| A12 | Poor sense of responsibility of the crew on duty |
| A13 | Violation of operational procedures, habitual violations |
| A14 | Failure to take effective avoidance measures promptly |
| A15 | Inadequate or erroneous use of navigational aids, or unavailability of navigational aids |
| A16 | Failure of the crew on duty to grasp and strictly carry out the planned route. |
| A17 | Improper selection of anchoring and docking positions |
| A18 | Inadequate maintenance of a safe distance from navigational obstructions, shore, or other vessels. |
| A19 | Violation of collision avoidance provisions |
| A20 | Failure to verify the effectiveness of avoidance response measures |
| A21 | Improper emergency response measures |
| A22 | Failure to conduct shift handovers according to regulations |
| A23 | Failure to report the emergency or accident to maritime authorities |
| A24 | Insufficient or no staff on duty |
| No. | Rules | Support | Confidence | Lift |
|---|---|---|---|---|
| 1 | {A17} => {A01} | 0.01 | 1.00 | 1.09 |
| 2 | {P02} => {A01} | 0.01 | 1.00 | 9.50 |
| 3 | {A08} => {A01} | 0.02 | 1.00 | 1.09 |
| 4 | {P10} => {A01} | 0.03 | 1.00 | 1.09 |
| 5 | {A16} => {A01} | 0.03 | 1.00 | 1.09 |
| 6 | {S05} => {P12} | 0.03 | 1.00 | 3.04 |
| 7 | {O02} => {A01} | 0.03 | 1.00 | 1.09 |
| 8 | {P09} => {P08} | 0.05 | 1.00 | 7.24 |
| 9 | {A23} => {A01} | 0.07 | 1.00 | 1.09 |
| 10 | {S01} => {A01} | 0.06 | 1.00 | 1.09 |
Disclaimer/Publisher’s Note: The statements, opinions and data contained in all publications are solely those of the individual author(s) and contributor(s) and not of MDPI and/or the editor(s). MDPI and/or the editor(s) disclaim responsibility for any injury to people or property resulting from any ideas, methods, instructions or products referred to in the content. |
© 2025 by the authors. Licensee MDPI, Basel, Switzerland. This article is an open access article distributed under the terms and conditions of the Creative Commons Attribution (CC BY) license (https://creativecommons.org/licenses/by/4.0/).
Share and Cite
Du, Q.; Ma, X.; Zhang, R.; Qiao, W. Analyzing the Causation of Collision Accidents Between Merchant and Fishing Vessels in China’s Coastal Waters by Integrating Association Rules and Complex Networks. J. Mar. Sci. Eng. 2025, 13, 1086. https://doi.org/10.3390/jmse13061086
Du Q, Ma X, Zhang R, Qiao W. Analyzing the Causation of Collision Accidents Between Merchant and Fishing Vessels in China’s Coastal Waters by Integrating Association Rules and Complex Networks. Journal of Marine Science and Engineering. 2025; 13(6):1086. https://doi.org/10.3390/jmse13061086
Chicago/Turabian StyleDu, Qiaoling, Xiaoxue Ma, Ruiwen Zhang, and Weiliang Qiao. 2025. "Analyzing the Causation of Collision Accidents Between Merchant and Fishing Vessels in China’s Coastal Waters by Integrating Association Rules and Complex Networks" Journal of Marine Science and Engineering 13, no. 6: 1086. https://doi.org/10.3390/jmse13061086
APA StyleDu, Q., Ma, X., Zhang, R., & Qiao, W. (2025). Analyzing the Causation of Collision Accidents Between Merchant and Fishing Vessels in China’s Coastal Waters by Integrating Association Rules and Complex Networks. Journal of Marine Science and Engineering, 13(6), 1086. https://doi.org/10.3390/jmse13061086