Abstract
Over the past two decades, extensive coastal development in China has led to numerous small-scale enclosed coastal water bodies. Due to complex shoreline geometries, these areas suffer from disturbed hydrodynamic conditions, weak water exchange, which quickly leads to sediment accumulation, and difficulty maintaining ecological water levels, posing serious environmental threats. Enhancing seawater exchange capacity and achieving coordinated optimization of exchange efficiency and ecological water level are critical prerequisites for the environmental restoration of eutrophic enclosed coastal areas. This study takes the Ligao Block in Tianjin as a case study and proposes a real-time sluice gate regulation scheme. By incorporating hydrodynamic conditions, engineering layout, and present characteristics of the benthic substrate environment, the number, width, location, and operation modes of sluice gates are optimized to maximize water exchange efficiency while maintaining natural flow patterns. The result of the numerical simulation of hydrodynamic exchange and intelligent optimization analysis reveals that the optimal sluice gate operation strategy should be tailored to regional tidal flow characteristics and substrate conditions. Through intelligent scheduling of exchange sluice gates, systematic gate parameter optimization, and active control of gate opening, this approach achieves intelligent seawater exchange, optimized flow dynamics, active exchange, and sustained ecological water levels in enclosed coastal water bodies.
1. Introduction
In recent years, the rapid expansion of coastal engineering in China, particularly large-scale land reclamation projects, has become a key strategy to accommodate the accelerating economic development in coastal regions and alleviate land resource shortages. These reclamation projects not only provide effective pathways for the exploitation of marine resources but also bring about numerous economic and social benefits [1]. However, while offering considerable economic gains, reclamation projects significantly alter the natural geometric features and hydrodynamic conditions of coastal waters, leading to profound impacts on tidal dynamics that are far-reaching and irreversible. Specifically, modifications to tidal flats and shoreline structures directly affect the distribution of local flow fields and the processes of sediment erosion and deposition, resulting in marked changes in hydrodynamic regimes. Furthermore, large-scale reclamation of tidal flats can produce far-field effects on tidal dynamics, with propagative impacts exhibiting large-scale spatial propagation such that substantial alterations in tidal constituent characteristics can emerge in offshore domains extending hundreds to even thousands of kilometers seaward [2,3,4]. As reclamation projects continue to expand, the formation of numerous enclosed coastal water bodies has emerged as a new environmental challenge. These artificially isolated water areas gradually evolve into semi-independent ecosystems due to their disconnection from open seas and significantly reduced seawater exchange. As a result, the risk of water quality degradation increases sharply, posing threats to marine biodiversity and exerting substantial pressure and potential risks on the overall marine ecological environment [5]. Thus, the ecological impacts of reclamation-induced enclosed water bodies must not be overlooked, and their environmental restoration has drawn increasing scholarly attention.
At present, the measures of water environment ecological restoration mainly include sediment dredging [6,7], sediment capping [8], submerged macrophyte recovery [9,10], physicochemical adsorption [11], and aeration [12]. In the context of enclosed coastal systems, Tammeorg et al. [13] proposed a sustainable lake restoration framework, suggesting that internal watershed restoration measures can more effectively promote ecosystem recovery compared to reducing external pollutant loads alone. Kinuma et al. [14] conducted continuous in situ water quality monitoring in urban moat systems in Tokyo and emphasized the importance of water quality supervision in closed urban water bodies during rapid urbanization processes. However, given the inherently low exchange rates and poor self-purification capacity of enclosed coastal water bodies [15], maintaining sufficient hydrodynamic circulation is a prerequisite for successful water quality improvement [16]. Therefore, enhancing the seawater exchange rate is crucial for ecological restoration in such systems.
Seawater exchange capacity is a fundamental indicator for assessing the environmental carrying capacity of semi-enclosed bays, directly influencing the overall water quality status [17]. Studies on seawater exchange are essential for coastal ecological protection, and the exchange capacity of nearshore current has been the focus of much scholarly attention. An increasing number of scholars, both domestic and international, have proposed various evaluation metrics and mathematical models to assess this capacity. For instance, Xie et al. [18] simulated the seawater exchange capacity of Shuidong Bay using hydrodynamic models and solute tracer transport to support water quality improvement efforts. Yuan et al. [19] employed hydrodynamic models and Lagrangian particle tracking methods to analyze the impact of reclamation on seawater exchange in Bohai Bay. Lin et al. [20] highlighted the significance of ecological restoration in Sansha Bay and proposed a hydrodynamics-based physical restoration scheme, emphasizing the role of tidal currents in facilitating internal–external water exchange. Ranjbar H.M. et al. [21] provided targeted recommendations for enhancing seawater exchange in semi-enclosed bays, including dredging existing inlets and constructing artificial channels to promote seawater circulation and improve water quality. Although these studies have provided detailed analyses of hydrodynamic exchange in semi-enclosed bays [22,23,24], research on effective engineering-based solutions to enhance seawater exchange rates in existing reclamation-modified coastal systems remains limited.
The land reclamation project had an impact on the coastal wetland and near-shore sea topography and landscape, which directly changes the length and shape of the coastline so that the shoreline from the natural evolution of the form changes to the artificial construction of dykes form [25]. Consequently, the natural coastline has been modified, potentially becoming highly irregular due to the complex nature of the enclosed area. This transformation may result in intricate water flow patterns within the affected marine environment. In addition, these waters are usually part of the coastal seas, which have relatively poor environmental conditions and are highly vulnerable to pollution, degradation of seawater quality, and other problems [26]. From a functional perspective, these water bodies are often designed for critical uses such as ports, industrial applications, or aquaculture, each of which has specific requirements for depth and terrain. Reclamation-induced alterations typically result in complex underwater topography and significantly altered tidal currents [27,28,29,30], which in turn affect sediment transport and deposition. These changes hinder pollutant dispersion, leading to blockages and accumulation [31,32]. Therefore, the requirement of sediment erosion conditions is also a key factor to maintain the functional viability of these waters. Given the multitude of conditions that must be satisfied to improve seawater exchange in enclosed bays formed by reclamation, this study proposes an intelligent dynamic control strategy for real-time sluice gate regulation. By harnessing tidal patterns to adjust gate operations, the method optimizes water renewal efficiency while maintaining natural hydrodynamic connectivity. This approach effectively balances ecological and operational demands by utilizing tidal data to adapt gate behavior, ensuring sustainable flow regimes without compromising environmental integrity.
This study integrates hydrodynamic modeling and intelligent optimization approaches, using the Ligao Block in Tianjin as a case study. Based on simulations of flow field distributions and water exchange performance before and after gate reconstruction, the optimal scheme was identified. Subsequently, an intelligent control strategy is proposed to implement real-time dynamic gate regulation. By employing a backpropagation (BP) neural network algorithm to analyze tidal fluctuations, the operation levels of sluice gates are determined. This study proposes a novel intelligent control method for sluice gates, aiming to mitigate ecological problems arising from land reclamation projects and to offer a new approach to water environment management.
2. Materials and Methods
2.1. Hydrodynamic Numerical Model
2.1.1. Governing Equations
A hydrodynamic model is employed for simulating the current field changes in this paper, and the triangle mesh technique is applied close to the complex coastline. The governing equations of this model are as follows:
Continuity equation:
Motion equations:
where h is the water level, H is the water depth, u and v are the components of current velocity in the x and y directions, respectively, f is the Coriolis coefficient, C is the Chezy coefficient (, where M is the Manning coefficient, equal to 36), t is the time, and g is the gravitational acceleration (g = 9.8 m/s2).
2.1.2. Numerical Methods
- Spatial discretization
The computational domain is discretized using the finite volume method (FVM), which provides accurate flux conservation across unstructured computational grids.
- 2.
- Shallow water equation
The integration of the two-dimensional depth-averaged shallow water equations is relatively complex and is not described in full detail here. It is noteworthy that an approximate Riemann solver is employed to calculate convective fluxes across the interfaces of adjacent grid cells, and the ROE method is utilized to estimate physical variables on either side of the interfaces. The linear gradient reconstruction technique is applied to achieve second-order spatial accuracy.
For time integration, both low-order and high-order time-stepping schemes are available. The low-order integration adopts the first-order explicit Euler method, while the high-order integration applies the second-order Runge–Kutta method. In this numerical study, a low-order integration scheme was used to integrate the shallow water equation.
2.1.3. Boundary Conditions
In this study, two types of boundary conditions are prescribed in the numerical model: closed and open boundary conditions.
- Open boundary conditions
Open boundaries are those where water exchange occurs with adjacent water bodies. At these boundaries, either water level or current velocity are specified. The tidal lever at intermediate boundary nodes is determined using linear interpolation between neighboring known points.
- 2.
- Closed boundary condition
Closed boundaries represent land–water interfaces, where the normal velocity component at the boundary is set to zero to ensure no flow across the land boundary.
For intertidal zones, where the shoreline position varies with tidal fluctuations, the model incorporates a wetting–drying algorithm to dynamically update the status of grid cells based on water depth.
The initial conditions for the model are as follows: all velocity components and tidal surface elevations are initialized to zero.
2.2. Pollution Diffusion Model
To better represent pollutant dispersion processes and evaluate seawater exchange capacity, a convection–diffusion transport model is employed in this study, which aligns well with the physical behavior of enclosed bay systems.
where C is the concentration of pollutants; u and v are the flow velocities in the x and y directions, respectively; Dx and Dy are the diffusion coefficients in the x and y directions, respectively; h is the water depth; F is the linear attenuation coefficient (sec−1); c is the pollutant concentration in the pollution source terms; and S is the pollution source term.
2.3. Calculation Method for Water Exchange Capacity
- Based on the convection–diffusion pollutant transport model, in this study, the initial concentration is assumed to be inferior to the external water in the outer seawall of the enclosed sea area, and there is no external load near this water area. The distribution is based on an external concentration of 0.5 units and an internal concentration of 1 unit. The shore and vertical boundaries adopt no flux conditions, and the open boundary is selected as inflow and outflow with no gradient conditions. The water quality model and the hydrodynamic model use the same set of computational grids.
- The model simulates long-term pollutant transport and dispersion, and the seawater exchange rate is determined by comparing the temporal change in pollutant concentration with initial conditions.
2.4. Intelligent Optimization Method
Following the initial proposal of artificial neural networks (ANNs) by McCulloch and Pitts (1943), various models have been developed [33]. The backpropagation neural network (BPNN) proposed by Rumelhart et al. (1986) overcame the learning limitations in multi-layer networks and has become one of the most widely used ANN models [34]. The BP algorithm is based on the steepest descent method, wherein error backpropagation is used to iteratively adjust the connection weights from input to output layers to minimize prediction error. One of the key advantages of BPNN is its ability to approximate arbitrary nonlinear continuous functions based on training datasets. The technique is now well-established in environmental modeling.
In this study, the BPNN algorithm is selected as the core intelligent optimization method. The sigmoid transfer function used for nonlinear transformation is
where is the threshold value of hidden neurons.
2.4.1. Data Normalization
All input data for the BPNN are normalized within the range of [0, 1] to ensure model stability and convergence. The normalization formula is
where is the value of the data after normalization, is the value of the data before normalization, is the maximum of all data, and is the minimum of all data.
2.4.2. Learning Rate and Appended Momentum
The convergence efficiency and training speed of the BPNN depend on the choice of learning rate () and the appended momentum (L&A). These are control parameters that affect the step size of weight updates during training. A low momentum leads to slow learning, while a high momentum may cause divergence and instability. The choice of momentum depends on the variability of the time series; for more fluctuating series, higher momentum values are preferred.
In this study, considering the strong periodicity and learnability of tidal data, the learning rate is set to 0.05, and the momentum term is set to 0.5 after model testing.
2.4.3. Error Function
In this algorithm, the root mean square error (RMSE) is used to evaluate the predictive ability of the network and is defined as follows:
where n represents the number of samples, indicates the measured tidal level value, and represents the neural network prediction value of the tide level.
2.5. Neural Network Structure
The structure of the neural network, including the number of hidden layers and neurons, is determined by the complexity of the problem. Although increasing the number of hidden layers can improve generalization, it does not necessarily enhance accuracy in problems with strong periodicity, such as tidal forecasting. Therefore, a single hidden layer is sufficient for this study. The number of neurons in the hidden layer is estimated by the following formula:
where NH is the number of neurons in the hidden layer, NI indicates the number of neurons in the input layer, and NO indicates the number of neurons in the output layer. Relevant details can be found in the works of Li et al. (2007) and Liang et al. (2008) [35,36].
3. Case Study
To investigate approaches for enhancing seawater exchange capacity in enclosed marine areas and improving common ecological environmental issues currently observed in these regions, this study focuses on a typical enclosed coastal water body located within the Ligao Block in Tianjin. The Ligao Block is situated in the tidal flat area of Caijiabao Village, Tianjin, and falls within the designated planning area of the coastal tourism zone. It is bounded by the Central Fishing Port to the east, the outer embankment of the Binhai Aircraft Carrier Theme Park to the west, and the Coastal Expressway to the north, forming a visual corridor aligned with the Mazu Statue in the coastal tourism zone (Figure 1).
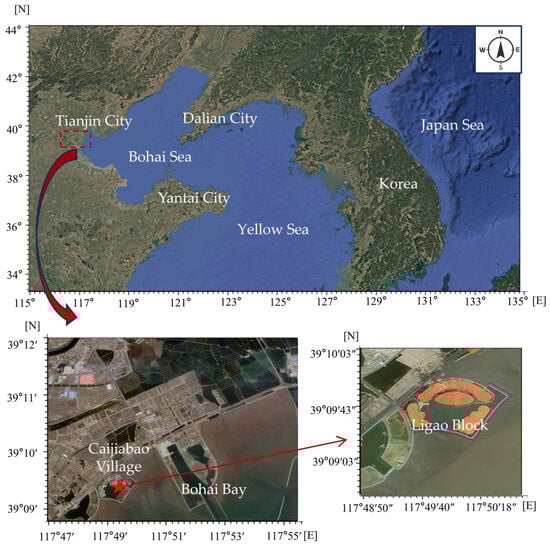
Figure 1.
Schematic location of the Ligao Block project. The red boxes and pentagrams here are the exact location of the project area, and the red arrows point to a zoomed-in detail view of the project area.
In Figure 1, the coordinates of the outer coastal embankment of the Ligao Block range from 117°49′07.90″ to 117°50′18.54″ E and 39°09′23.85″ to 39°10′04.85″ N, covering a total area of approximately 1.45 km2. The project area is subject to irregular semi-diurnal tides, with maximum tidal ranges of 285 cm and 205 cm during spring and neap tides, respectively. The average tidal ranges are 237 cm and 163 cm. The tidal current in this region exhibits the nature of oscillatory flow.
3.1. Current Conditions of the Study Area
Due to the implementation of reclamation engineering, the hydrodynamic conditions of the study area have been significantly altered, giving rise to multiple ecological and environmental issues, including the following: (1) reduced seawater exchange capacity and tidal prism within the enclosed water body behind the outer embankment; (2) difficulty in maintaining ecological water level thresholds due to poor hydraulic connectivity; and (3) severe sediment deposition in the waterway between the Ligao Block and the Central Fishing Port, further diminishing the seawater flushing efficiency in the region.
It is, therefore, imperative to carry out ecological rehabilitation and hydrodynamic restoration in and around the Ligao Block. This study holds practical significance for improving the seawater renewal performance of the enclosed water body and adjacent areas.
3.2. Design Concept
As critical hydraulic structures, tidal sluice gates play a vital role in regulating water levels, controlling flow discharge, and preventing flood inundation and sedimentation. In response to the environmental challenges identified in the Ligao Block, implementing gate retrofitting can effectively enhance natural water circulation and improve ecological conditions within the enclosed basin. However, traditional gate control methods are insufficient to meet the growing demand for active seawater exchange.
Accordingly, this study proposes an intelligent sluice gate control strategy that integrates regional hydrodynamic characteristics and flow field simulations post-retrofitting. The scheme aims to enhance intelligent seawater flushing through systematic gate optimization and real-time gate regulation.
3.3. Scheme Design
This study focuses on improving the seawater exchange efficiency in the Ligao Block and surrounding areas by implementing sluice gate retrofit engineering. The proposed solution consists of two major components: a static optimization scheme and an intelligent control scheme. The static scheme is guided by a hydrodynamic numerical model for optimization of the gate parameter system. Building upon the static scheme, the intelligent scheme employs an intelligent optimization algorithm to determine the optimal gate operation strategy, enabling real-time adaptive control.
3.3.1. Static Scheme
Details of the six alternative sluice gate engineering schemes, including comparative relationships and gate parameters, are provided in Table 1, with gate locations shown in Figure 2.

Table 1.
Alternative gate engineering schemes.
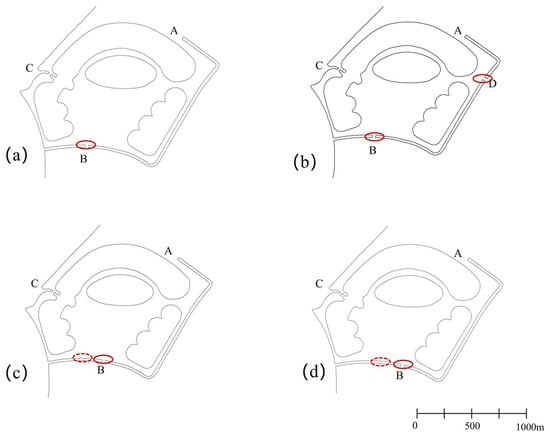
Figure 2.
Schematic diagram of gate locations: (a) Scheme 1; (b) Scheme 2; (c) Schemes 3, 5, and 6; and (d) Scheme 4. The dashed circle indicates the location of this gate in the previous scheme, and the solid red circle indicates the main change in this scheme to the previous scheme.
In Figure 2: (1) Scheme 1 sets two gates on the outer embankment at points A and C, with one additional gate at the west side (Point B) (Figure 2a). (2) Scheme 2 adds a gate at the east embankment (Point D) based on Scheme 1, keeping all other gate parameters unchanged (Figure 2b). (3) Schemes 3, 5, and 6 relocate the gate at Point B 100 m eastward to the midpoint of the southern embankment; other gate parameters remain as in Scheme 1 (Figure 2c). (4) Scheme 4 further shifts the gate at Point B an additional 100 m eastward compared to Scheme 3, with other parameters consistent with Scheme 3 (Figure 2d).
The static scheme is guided by hydrodynamic numerical modeling, using gate number, location, and opening width as key parameters to simulate and compare different layouts. The objective is to maximize water renewal behind the outer embankment of the Ligao Block while considering tidal current dynamics and flow field response.
3.3.2. Intelligent Scheme
Given the complex boundary conditions and internal flow field sensitivity of this reclamation-induced enclosed coastal system, uncontrolled gate operation may result in hydrodynamic disorder, failing to meet ecological water level requirements. Therefore, this study introduces a BPNN-based intelligent gate control model on top of the static scheme to optimize gate operation modes, ensuring internal flow field stability and ecological balance.
Based on field surveys, the target ecological water level range is set between 5.2 m and 6.0 m, meaning that post-operation, the internal water level must reach at least 5.2 m. Accordingly, the intelligent control scheme aims to identify the optimal safe gate opening levels while ensuring adequate water exchange rates.
3.4. Evaluation of Static Schemes
3.4.1. Model Computational Domain
The hydrodynamic model in this study adopts a three-level nested grid approach, covering the Bohai Sea, Bohai Bay, and the project area. Figure 3 illustrates the domains of the three models and the mesh configuration of the third model.
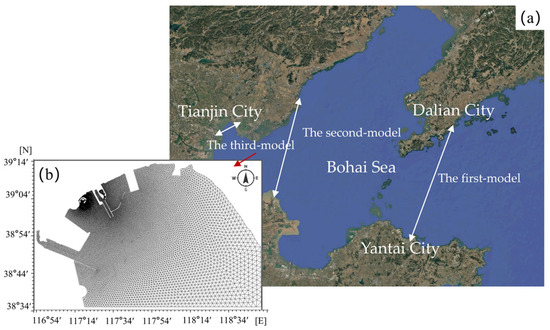
Figure 3.
Model calculation range diagram: (a) computational domain and (b) model calculation grid diagram.
In the tidal current calculation model, the open boundary is controlled by tidal levels, where the boundary water levels for the larger Bohai Sea region are obtained by interpolating tidal data from the Yantai Port and Dalian Port tidal stations (Figure 3a). After calculating the tidal currents in the Bohai Sea, the tidal-level boundary conditions for Bohai Bay and the project vicinity are provided by the calculation results from the upper-layer model.
The computational domain of the third model encompasses the sea area adjacent to Tianjin City, forming a north–south oriented rectangular area measuring 46 km × 30 km. The model uses triangular unstructured grid mesh for spatial discretization in the project area (Figure 3b). A total of 35,425 computational elements and 18,644 nodes are generated, with a minimum grid resolution of 10 m in the project area, while the maximum grid resolution reaches 2000 m in the open sea region with relatively smooth bathymetric gradients to improve computational efficiency.
3.4.2. Model Validation
Model validation focuses on the tidal level and current velocity in the innermost (third model) nested domain. Field hydrological measurements during spring and neap tides in April 2017 were used for validation. Figure 4 shows the dataset includes three tidal-level stations and ten current velocity observation stations. Figure 5 presents the tidal-level validation curves at tidal stations in April 2017, along with the current velocity validation curves at selected stations during both spring and neap tides.
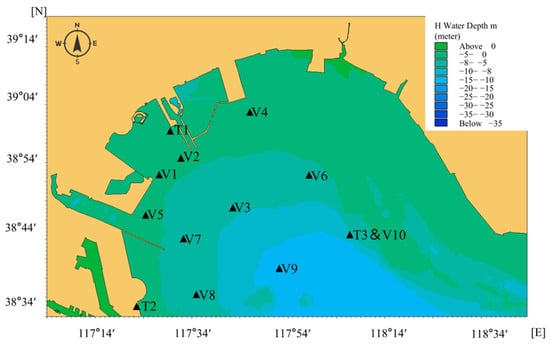
Figure 4.
Location map of the third model tide gauge station. The tidal-level stations are T1–T3, current velocity stations are V1–V10.
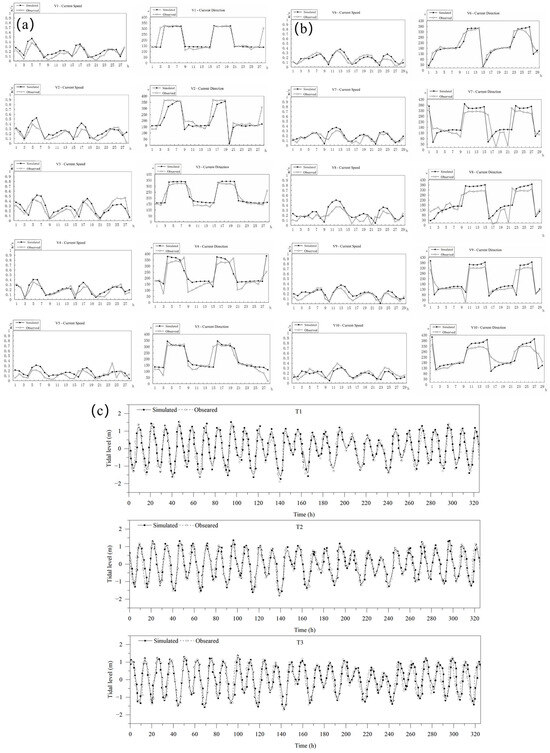
Figure 5.
The validation curves of the model: (a) current speed and direction during the spring tide period at stations v1–v5; (b) current speed and direction during the neap tide period at stations v6–v10; and (c) tide level verification curve.
Comparative analysis of Figure 5 indicates that the calculated tidal levels, current velocities, and current directions at each station agree well with the observed data throughout the continuous variation process, satisfying the requirements of relevant standards. Therefore, the model’s simulation of tidal dynamics effectively reflects the hydrodynamic conditions in the vicinity of the project area and can serve as a reliable foundation for subsequent analyses and computations.
3.4.3. Pre-Construction Tidal Current Field Analysis
The validated hydrodynamic model was applied to simulate the tidal current field. The tidal current field during peak flood and ebb tide in the Bohai Sea, Bohai Bay, and the project vicinity is shown in Figure 6.
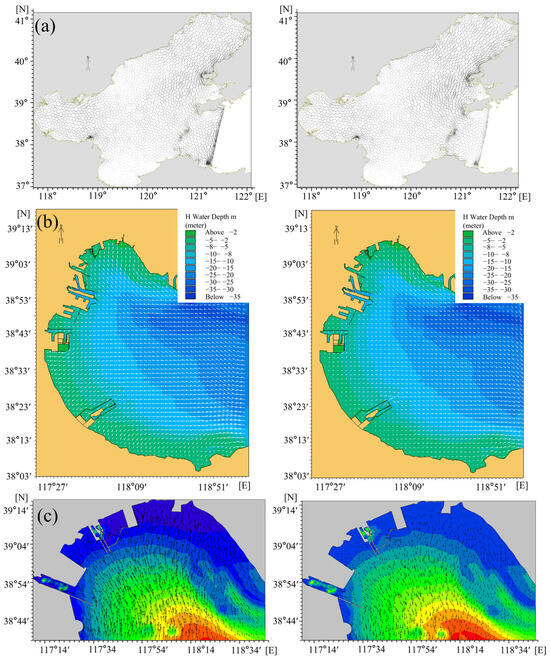
Figure 6.
Current field diagram during peak flood and ebb tide: (a) Bohai Sea; (b) Bohai Bay; and (c) the project vicinity. The left figure shows the flow field at the moment of peak flood and the right figure shows the flow field at the moment of ebb tide.
The results show that during flood tide, the current enters the Bohai Sea via the Bohai Strait and splits; one branch flows into Liaodong Bay, and the other merges with outflow from Laizhou Bay into Bohai Bay. During ebb tide, the tidal currents flow outward from the Bohai Sea (Figure 6a). At this time, the tidal currents in the Liaodong Bay flow toward the northern part of the Bohai Strait, while the tidal currents in the Bohai Bay partially flow toward the southern part of the Bohai Strait and partially enter the Laizhou Bay. The tidal conditions in Liaodong Bay are similar to those in the Bohai Strait, and the overall water flow in the Bohai Sea exhibits a rotational pattern. The tidal currents in Liaodong Bay and Bohai Bay mainly rotate counterclockwise, while the central part of the Bohai Sea primarily rotates clockwise.
The study area is located in the northwestern corner of Bohai Bay, where the flood current flows northwestward and the ebb current flows southeastward, indicating the nature of oscillatory flow (Figure 6b,c). The mean flood current velocity is slightly higher than that during ebb. Current velocity gradually decreases from offshore to nearshore areas, with a maximum velocity of about 0.3 m/s, especially near the corners of the north and east embankments. Along the outer side of the northern embankment, the flow velocity is relatively high, with the maximum velocity ranging between 0.2 m/s and 0.3 m/s. Along the outer side of the eastern embankment, the maximum velocity gradually increases from south to north, ranging between 0.1 and 0.3 m/s. Along the outer side of the southern embankment, the maximum velocity gradually decreases from east to west, with the maximum velocity being less than 0.2 m/s.
3.4.4. Scheme Comparison
Under tidal forcing, seawater exchange in the Ligao Block occurs through sluice gates. The convection–diffusion transport model and exchange capacity evaluation method are used to simulate seawater flushing performance under six gate retrofit schemes, as previously defined.
Figure 7 shows local flow fields for Schemes 1–6 during peak flood tide. Figure 8 presents the spatial distribution of the water exchange rate under each scheme. The average water exchange rate in the internal waters of the embankment surrounding the Ligao Block is shown in Table 2.
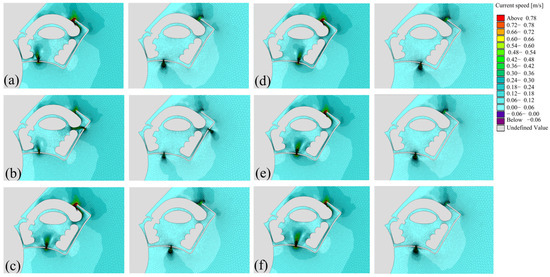
Figure 7.
Flow field diagrams after the implementation of gate reconstruction: (a) Scheme 1; (b) Scheme 2; (c) Scheme 3; (d) Scheme 4; (e) Scheme 5; and (f) Scheme 6.
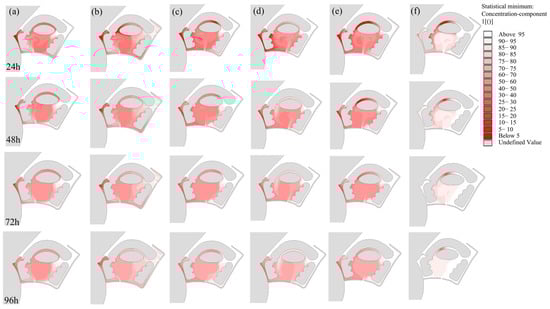
Figure 8.
The spatial distributions of water exchange rates: (a) Scheme 1; (b) Scheme 2; (c) Scheme 3; (d) Scheme 4; (e) Scheme 5; (f) Scheme 6.
Table 2.
Water exchange rate for each scheme.
- Gate Number Analysis
A comparison between Schemes 1 and 2 shows that the four-gate configuration (Scheme 2) performs worse than the three-gate configuration (Scheme 1). This is attributed to the following: (1) The small area of the Ligao Block, where tidal inflows at gates A, B, and D occur nearly synchronously, resulting in flow interference and complex internal flow patterns that hinder exchange. (2) The additional gate D in Scheme 2, due to limited connectivity and the topography near the northern island, does not significantly enhance internal water exchange. Therefore, a three-gate layout is more effective.
- 2.
- Gate Location Analysis
A comparative analysis of Schemes 1, 3, and 4 reveals that the location of Scheme 1 is the most optimal. This is attributed to the following: (1) Compared to Scheme 1, in Scheme 3, the gate at location B is moved 100 m eastward, positioned in the middle of the southern embankment, which weakens the water exchange in the western channel. Influenced by the southern island, the incoming flood tide quickly splits after entering, resulting in reduced water exchange capacity in the channel between the northern and southern islands of the Ligao Block. (2) Compared to Scheme 3, in Scheme 4, the gate at location B is moved another 100 m eastward, further weakening the water exchange capacity in the waters west of the gate and near the southern island. (3) Scheme 1 is adjacent to the western channel, which enhances its water exchange capacity. It also aligns with the channel between the northern and southern islands, facilitating smoother water flow. (4) Compared to Scheme 3 and Scheme 4, Scheme 1 is located in shallower waters, which not only facilitates construction organization and proximity to the land but also effectively reduces or avoids the ecological and environmental impacts on the sea area caused by the project. (5) For the modified gate project in Scheme 1, the simulated water exchange rates at 24 h, 48 h, 72 h, and 96 h are 61.9%, 68.5%, 73.2%, and 77.2% (Table 2), respectively, which is outperforming Scheme 3 and Scheme 4. The advantages are particularly evident in the initial 24 h and 48 h, which aligns more closely with the actual situation of the gate opening cycle. Therefore, the gate location in Scheme 1 is suitable.
- 3.
- Gate Width Analysis
Comparing Schemes 3, 5, and 6 shows that a larger gate width at location B is not necessarily better. Optimal gate width must be balanced with site-specific hydrodynamic conditions. Compared to Scheme 3 (30 m), as the gate width increases, the seawater exchange capacity generally shows a declining trend. This is attributed to the following: (1) The overall volume of the Ligao Block is relatively small, and the flood and ebb tides at gates A and B are synchronized, with no significant time difference. During the flood tide, the incoming water flows from gates A and B create a backing-up effect, and combined with the complex internal terrain of the Ligao Block, the flow field becomes extremely complicated, which is not conducive to water exchange. (2) By comparing the flow fields at the moment of maximum flood tide in Schemes 3, 5, and 6, it can be observed that as the gate width at location B increases, the convergence point of the two flood tide currents from gates A and B gradually shifts northward. In Scheme 6, the convergence point has already entered the channel between the northern and southern islands of the Ligao Block, which is the main reason for the decline in the water exchange rate. Therefore, Scheme 3’s 30 m gate width is preferable.
In conclusion, Scheme 1 offers the best combination of gate number, location, and width. Moreover, based on the figures of water exchange rates for each scheme, it can be observed that the closer the internal waters of the outer seawall are to the gate, the faster the water exchange occurs. Over time, the exchange becomes more thorough. All six schemes improve seawater exchange within the Ligao Block, confirming the effectiveness of the sluice gate retrofitting strategy in enhancing internal circulation. Results indicate that vortices form inside the enclosed area upon gate opening, with size and strength dependent on gate layout parameters. To achieve site-specific optimization, the gate parameters must be aligned with the existing engineering layout and should conform to the tidal current characteristics and benthic conditions of the project area.
3.5. Intelligent Optimization Scheme
To further enhance exchange efficiency and achieve coordinated optimization with ecological water levels, Scheme 1 was selected for intelligent optimization. Considering the environmental characteristics of the sea area near the Ligao Block, the plot has a relatively small area, and the tidal processes on its northern and southern sides show no significant differences. The internal shoreline of the embankment is winding and complex, which is not conducive to water exchange, and the sediment gradients in the surrounding seabed are higher in the north and lower in the south. Therefore, a ‘south-in, north-out’ strategy is adopted for the gate operation.
This study, based on the results of the numerical simulation, employs a backpropagation (BP) neural network model to establish a nonlinear response relationship between the block internal water level and the sluice gate water level. Considering the practical requirements of the project, the ecological water level range for the enclosed waters is set between 5.2 and 6 m. This range is used as the input condition and incorporated into the neural network’s nonlinear relationship model to optimize the prediction of the gate water level regulation range. Schematic diagrams of the simulation results are shown in Figure 9.
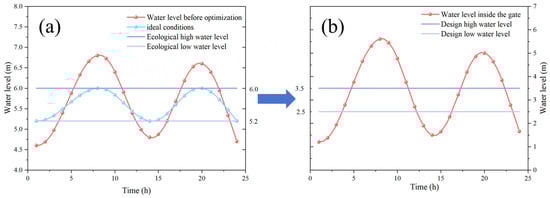
Figure 9.
Schematic diagrams of the response water level: (a) block internal and (b) sluice gate.
In Figure 9, the left figure shows the external water level of the block. The red curve indicates the average water level trend within the basin before optimization, exhibiting significant fluctuations. The blue curve represents the water level trend within the enclosed basin under ideal conditions that meet ecological water level requirements. The upper and lower horizontal lavender lines denote the maximum and minimum water levels specified by environmental standards, respectively. The right figure shows the internal water level at the gate. The red curve illustrates the water level variation inside the gate. The upper and lower horizontal purple lines indicate the gate regulation range, derived from the BP neural network model optimized based on the nonlinear mapping relationship and the calculated ecological water level requirements.
Based on the nonlinear mapping relationship established by the model between the internal water level of the block and the water level at the gate, this scheme ensures the ecological water level requirements by regulating the water level at the gate. The reasonable regulation range for the gate water level is determined to be between 2.5 and 3.5 m.
The intelligent optimization scheme proposed in this study fully considers the tidal characteristics of the research area, incorporating the ‘south-in, north-out’ strategy. Gate B opens when the flood tide reaches 2.5 m and closes when it reaches 3.5 m; Gate A opens when the ebb tide falls to 3.5 m and closes when it falls to 2.5 m. This enables synchronized operation with tidal cycles. This scheme not only effectively ensures the ecological water level requirements of the Ligao Block but also maximizes water exchange efficiency, achieving a harmonious balance between seawater exchange capacity and ecological water level.
3.6. Effectiveness Analysis of Optimized Scheme
To evaluate the final optimized gate operation strategy (Scheme 1), the convection–diffusion pollutant transport model is used to simulate the water exchange process over one tidal cycle within the enclosed area.
The spatial distribution of the exchange rate is shown in Figure 10. Through one tidal cycle of water exchange, the water exchange rate in the internal waters of the outer seawall of the Ligao Block is 40.2%. This indicates that, with the proposed gate operation strategy, the optimized scheme for the gate retrofit schemes of the Ligao Block can achieve 80% water exchange within one day and nearly complete exchange within two days. Therefore, it is recommended to open the gates once every half month during the spring tide with a duration of 1–2 days each time to facilitate seawater exchange.
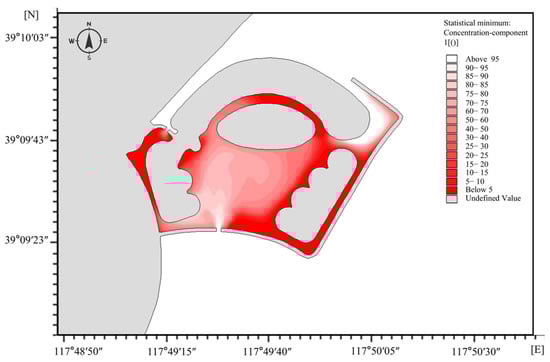
Figure 10.
Spatial distribution of water exchange rate during a tidal cycle.
Field measurement data indicate that the sediment concentration in the closed area has significantly decreased after the implementation of the scheme. This demonstrates that the proposed ‘south-in, north-out’ gate strategy effectively alleviates the siltation issue in the Ligao Block. Further analysis of the seawater exchange in the channel between the northern island and the shoreline of the Ligao Block reveals that the optimized scheme maintains a certain level of water flow in the enclosed waters, effectively ensuring the ecological water level and maximizing water exchange efficiency. The real-time sluice gate regulation scheme not only achieves automated seawater exchange within the enclosed area but also reduces manual intervention and operational costs.
4. Conclusions
This study focuses on the ecological and environmental challenges arising from coastal land reclamation enclosed coastal water, taking the enclosed sea area of the Ligao Block in Tianjin as a representative case. Through comprehensive field investigations and extensive data collection, a set of design principles was developed to address the current issues. A real-time dynamic sluice gate regulation scheme based on intelligent control was proposed and successfully validated. This scheme provides an effective technical solution and practical reference for tackling the ecological degradation of small-scale enclosed coastal areas.
The proposed method integrates a static gate optimization scheme and an intelligent control strategy. By comparing multiple design alternatives, it effectively identifies gate parameters that are best adapted to the specific hydrodynamic and ecological conditions of the enclosed sea area. This integrated approach enables intelligent and adaptive gate control, offering a practical solution for enhancing water exchange capacity and addressing environmental challenges in coastal engineering. A hydrodynamic numerical model was used to simulate the seawater exchange processes, followed by a comprehensive analysis of the post-retrofit effectiveness. The results indicate that a well-designed and optimized sluice gate system can significantly enhance the seawater exchange capacity of the enclosed coastal basin, enabling the coordinated optimization of exchange efficiency and ecological water level. This research not only provides important practical guidance for the ecological restoration of the enclosed sea area in the Ligao Block but is also applicable to ecological remediation and water environment management in other small-scale enclosed coastal waters.
The key conclusions drawn from the scheme design and comparative analysis are as follows:
- In the static scheme phase, six different gate layout configurations were designed by varying gate numbers, locations, and opening widths under the guidance of hydrodynamic modeling. Scheme 1 was ultimately identified as the optimal solution. This configuration includes three sluice gates: one on the northern embankment of the Ligao Block with a width of approximately 60 m (location A), one on the embankment with a width of 30 m (location B), and another on the southwest side with a width of approximately 20 m (location C).
- In the process of static scheme comparison, the gate configuration was refined by closely considering regional hydrodynamic characteristics and flow field conditions. Detailed analyses of gate number, width, and location indicated the following: (1) In terms of the number of gates, due to the relatively small area of the Ligao Block, adding more gates does not necessarily improve water exchange. In the four-gate configuration, tidal inflows at different gates occurred nearly simultaneously, leading to mutual interference and complex internal flow fields that hinder exchange. Thus, a three-gate layout was determined to be more suitable. (2) In terms of the location of the gates, the selected gate locations are adjacent to the western channel and well aligned with the waterway between the northern and southern islands, which facilitates smoother flow paths. Moreover, the locations are situated in relatively shallow waters close to land, simplifying construction logistics and minimizing ecological disturbance. (3) In terms of the width of the gates, simulation results showed that increasing the width at location B led to a decline in overall exchange capacity. This highlights that gate width must be carefully planned based on site-specific hydrodynamic conditions rather than arbitrarily increased.
- In the intelligent scheme phase, built upon the static optimization results, based on BPNN to construct a nonlinear mapping model between internal water level and gate water level, accurately determining a suitable gate control range. The “south-in, north-out” tidal gate regulation strategy was proposed, synchronizing with tidal fluctuations and ensuring ecological water level thresholds.
- The effectiveness of the final optimized scheme was further validated through simulation. The results demonstrated a notable improvement in seawater exchange rate, a significant reduction in suspended sediment concentration, and effective alleviation of internal sediment deposition. In addition, the scheme reliably maintained the ecological water level in the enclosed basin. These outcomes confirm the technical feasibility and ecological benefits of the proposed solution. This strategy demonstrates strong applicability and replicability in similar coastal systems.
Author Contributions
Conceptualization, M.L. and X.J.; methodology, M.L.; software, A.L.; validation, A.L.; formal analysis, X.J.; investigation, M.L.; resources, M.L.; data curation, M.L.; writing—original draft preparation, X.J.; writing—review and editing, X.J. and M.L.; visualization, A.L.; supervision, M.L.; project administration, M.L.; funding acquisition, M.L. All authors have read and agreed to the published version of the manuscript.
Funding
This research was funded by the Central Guidance on Local Science and Technology Development Fund of Zhejiang Province, grant number 2023ZY1021.
Data Availability Statement
The original contributions presented in this study are included in the article. Further inquiries can be directed to the corresponding author.
Conflicts of Interest
The authors declare that this research was conducted in the absence of any commercial or financial relationships that could be construed as potential conflicts of interest.
References
- Bishop, M.J.; Mayer-Pinto, M.; Airoldi, L.; Firth, L.B.; Morris, R.L.; Loke, L.H.L.; Hawkins, S.J.; Naylor, L.A.; Coleman, R.A.; Chee, S.Y.; et al. Effects of ocean sprawl on ecological connectivity: Impacts and solutions. J. Exp. Mar. Biol. Ecol. 2017, 492, 7–30. [Google Scholar] [CrossRef]
- Song, D.; Wang, X.H.; Zhu, X.; Bao, X. Modeling studies of the far-field effects of tidal flat reclamation on tidal dynamics in the East China Seas. Estuar. Coast. Shelf Sci. 2013, 133, 147–160. [Google Scholar] [CrossRef]
- Song, N.-q.; Wang, N.; Lin, W.-n. Assessment of the impact of artificial island airport reclamation on marine ecosystem health: A case study of the Dalian offshore airport, China. Ocean. Coast. Manag. 2022, 226, 106281. [Google Scholar] [CrossRef]
- Lu, J.; Zhang, Y.; Cao, R.; Lv, X.; Xu, M.; Gao, G.; Liu, Q. Enhanced Impact of Land Reclamation on the Tide in the Guangxi Beibu Gulf. Remote Sens. 2023, 15, 5210. [Google Scholar] [CrossRef]
- Kuang, C.; Wang, D.; Wang, G.; Liu, J.; Han, X.; Li, Y. Impact of reclamation projects on water quality in jinmeng bay, China. Estuar. Coast. Shelf Sci. 2024, 300, 108719. [Google Scholar] [CrossRef]
- Chen, H.; Guo, S.; Zhang, S.; Tang, Y.; Zhang, T.; Lv, X.; Wang, D.; Zhong, J. Comprehensive effects of lake dredging on microbial community and dissolved organic matter compositions in surface sediments. Ecol. Indic. 2025, 175, 113566. [Google Scholar] [CrossRef]
- Carreira, C.; Bollwerk, S.M.; Lønborg, C. A review on beneficial use of dredged marine sediment. Anthr. Coasts 2025, 8, 12. [Google Scholar] [CrossRef]
- Chaudhary, D.K.; Bailon, M.X.; Kim, H.; Reible, D.; Hong, Y. Evaluation of sediment capping effectiveness in Hyeongsan River for in-situ management of total mercury and methylmercury contamination. J. Soils Sediments 2022, 22, 2578–2591. [Google Scholar] [CrossRef]
- Liu, Z.; Bai, G.; Liu, Y.; Zou, Y.; Ding, Z.; Wang, R.; Chen, D.; Kong, L.; Wang, C.; Liu, L.; et al. Long-term study of ecological restoration in a typical shallow urban lake. Sci. Total Environ. 2022, 846, 157505. [Google Scholar] [CrossRef]
- Hernández-Vásquez, L.A.; Romo-Gómez, C.; Alvarado-Lassman, A.; Prieto-García, F.; Camacho-López, C.; Acevedo-Sandoval, O.A. Artificial Floating Islands for the Removal of Nutrients and Improvement of the Quality of Urban Wastewater. Water 2024, 16, 1443. [Google Scholar] [CrossRef]
- Huang, Z.; Chen, F.; Yang, S.; Ding, Y.; Peng, G.; Chen, C.C. Surface physicochemical properties and dibutyl phthalate adsorption of microplastics naturally aged in seawater. Mar. Pollut. Bull. 2025, 217, 118064. [Google Scholar] [CrossRef] [PubMed]
- Sun, L.; Cao, Z.; Jia, S.; Zhang, P.; Zhang, G. Micro-aeration strategies: Optimizing nitrogen and phosphorus removal in vertical flow constructed wetlands for rural sewage treatment. J. Water Process Eng. 2025, 75, 107931. [Google Scholar] [CrossRef]
- Tammeorg, O.; Chorus, I.; Spears, B.; Nõges, P.; Nürnberg, G.K.; Tammeorg, P.; Søndergaard, M.; Jeppesen, E.; Paerl, H.; Huser, B.; et al. Sustainable lake restoration: From challenges to solutions. WIREs Water 2023, 11, 1689. [Google Scholar] [CrossRef]
- Kinuma, D.; Qian, C.; Yamada, T. A Fundamental Study in the Characteristics of Water Quality for Improvement in the Urban Closed Water Body. Procedia Eng. 2016, 154, 565–573. [Google Scholar] [CrossRef]
- Zhang, R.J.; Zhang, H.Z.; Jiang, Q. Numerical Study on Effects of Change of Water Depth on Water Exchange Ability of Nearly Closed Bay. Adv. Mater. Res. 2011, 243–249, 4691–4695. [Google Scholar] [CrossRef]
- Liu, Z.; Wei, H.; Liu, G.; Zhang, J. Simulation of water exchange in Jiaozhou Bay by average residence time approach. Estuar. Coast. Shelf Sci. 2004, 61, 25–35. [Google Scholar] [CrossRef]
- Cao, X.; Xing, C.; Yu, J.; Ma, Y.; Shi, W.; Lv, X. Wave Effects on Water Exchange Capacity in the Dalian Bay: A Numerical Study. J. Mar. Sci. Eng. 2025, 13, 367. [Google Scholar] [CrossRef]
- Xie, M.X.; Yao, S.S.; Liu, Y.Q. Environmental Assessment of the Water Exchange Ability of Shuidong Bay, China Based on Numerical Simulations. Adv. Mater. Res. 2013, 726–731, 1006–1011. [Google Scholar] [CrossRef]
- Yuan, D.K.; Li, G.; Wang, D.S.; Yang, Z.B. Numerical simulation of effects of land reclamation on water exchange capability of bohai bay. J. Tianjin Univ. Sci. Technol. 2015, 48, 605–613. (In Chinese) [Google Scholar] [CrossRef]
- Lin, H.; Chen, Z.; Hu, J.; Cucco, A.; Zhu, J.; Sun, Z.; Huang, L. Numerical simulation of the hydrodynamics and water exchange in Sansha Bay. Ocean. Eng. 2017, 139, 85–94. [Google Scholar] [CrossRef]
- Ranjbar, M.H.; Jandaghi Alaee, M.; Nazarali, M. A modeling study of the impact of increasing water exchange rate on water quality of a semi-enclosed bay. Ecol. Eng. 2019, 136, 177–184. [Google Scholar] [CrossRef]
- Tian, Z.; Shi, J.; Liu, Y.; Wang, W.; Liu, C.; Li, F.; Shao, Y. Response of Sea Water Exchange Processes to Monsoons in Jiaozhou Bay, China. Sustainability 2023, 15, 15198. [Google Scholar] [CrossRef]
- Yan, J.; Zhai, F.; Gu, Y.; Liu, X.; Li, P.; Liu, Z.; Wang, Y. Drastic Fluctuation in Water Exchange Between the Yellow Sea and Bohai Sea Caused by Typhoon Lekima in August 2019: A Numerical Study. J. Geophys. Res. Ocean. 2023, 128, e2022JC019260. [Google Scholar] [CrossRef]
- Zhang, N.; Liang, S.; Wang, K.-H.; Zhang, Q.; Xu, N.; Wang, Y.P.; Wu, Z.; Wang, T. Evaluating sea ice influence on water exchange dynamics through three-dimensional hydrodynamic simulation in a semi-closed shallow sea. Ocean. Coast. Manag. 2024, 258, 107428. [Google Scholar] [CrossRef]
- Zhang, T.; Niu, X. Analysis on the utilization and carrying capacity of coastal tidal flat in bays around the Bohai Sea. Ocean. Coast. Manag. 2021, 203, 105449. [Google Scholar] [CrossRef]
- Zhang, H.-X.; Shen, Y.-M.; Tang, J. Numerical investigation of successive land reclamation effects on hydrodynamics and water quality in Bohai Bay. Ocean. Eng. 2023, 268, 113483. [Google Scholar] [CrossRef]
- Shen, Y.; Jia, H.; Li, C.; Tang, J. Numerical simulation of saltwater intrusion and storm surge effects of reclamation in Pearl River Estuary, China. Appl. Ocean. Res. 2018, 79, 101–112. [Google Scholar] [CrossRef]
- Zhang, Q.; Fan, D.; Feng, T.; Tu, J.; Guo, X. Impacts of land reclamation projects on hydrodynamics and morphodynamics in the highly altered North Branch of the Changjiang Estuary. Anthr. Coasts 2022, 5, 6. [Google Scholar] [CrossRef]
- Chu, N.; Yao, P.; Ou, S.; Wang, H.; Yang, H.; Yang, Q. Response of tidal dynamics to successive land reclamation in the Lingding Bay over the last century. Coast. Eng. 2022, 173, 104095. [Google Scholar] [CrossRef]
- Huang, Z.; Xu, H.; Bai, Y.; Shi, F.; Wen, Z. Coastline changes and tidal current responses due to the large-scale reclamations in the Bohai Bay. J. Oceanol. Limnol. 2023, 41, 2045–2059. [Google Scholar] [CrossRef]
- Zhong, Y.; Du, J.; Wang, Y.; Li, P.; Xu, G.; Miu, H.; Zhang, P.; Jiang, S.; Gao, W. Modeling the Impacts of Land Reclamation on Sediment Dynamics in a Semi-Enclosed Bay. J. Mar. Sci. Eng. 2024, 12, 1633. [Google Scholar] [CrossRef]
- Liu, Y.; Xia, X.; Cai, T.; Wang, X.; Zheng, J. Effects of Coastal Reclamation on the Topographic Changes of an Open Estuary: A Case Study in Taizhou Bay, East China. J. Mar. Sci. Eng. 2024, 12, 1744. [Google Scholar] [CrossRef]
- McCulloch, W.; Pitts, W. A logical calculus of the ideas immanent in nervous activity. Bull. Math. Biol. 1990, 52, 99–115. [Google Scholar] [CrossRef] [PubMed]
- Rumelhart, D.E.; Hinton, G.E.; Williams, R.J. Learning representations by back-propagating errors. Nature 1986, 323, 533–536. [Google Scholar] [CrossRef]
- Li, M.C.; Liang, S.X.; Sun, Z.C. Application of artificial neural networks to tide forecasting. J. Dalian Univ. Technol. 2007, 3, 101–105. (In Chinese) [Google Scholar]
- Liang, S.X.; Li, M.C.; Sun, Z.C. Prediction models for tidal level including strong meteorologic effects using a neural network. Ocean. Eng. 2008, 35, 666–675. [Google Scholar] [CrossRef]
Disclaimer/Publisher’s Note: The statements, opinions and data contained in all publications are solely those of the individual author(s) and contributor(s) and not of MDPI and/or the editor(s). MDPI and/or the editor(s) disclaim responsibility for any injury to people or property resulting from any ideas, methods, instructions or products referred to in the content. |
© 2025 by the authors. Licensee MDPI, Basel, Switzerland. This article is an open access article distributed under the terms and conditions of the Creative Commons Attribution (CC BY) license (https://creativecommons.org/licenses/by/4.0/).