1. Introduction
Wind turbines, particularly large-scale models like the NREL IEA 15 MW, are subjected to various wind conditions that significantly influence their structural performance. Wind speed variability and turbulence intensity are critical factors that affect the mechanical loads, fatigue life, and overall efficiency of wind turbines. Wind speed variability refers to the fluctuations in wind speed over time, which can lead to dynamic loading on wind turbine components. The NREL IEA 15 MW wind turbine, designed for offshore environments, operates efficiently within a specific wind speed range. Research indicates that wind speeds between 9 and 12 m/s are optimal for this turbine, as they maximize the power coefficient while minimizing mechanical loads on the blades, tower, and foundation [
1].
Turbulence intensity, which quantifies the variability in wind speed, plays a significant role in determining the structural loads on wind turbines. Studies have shown that turbulence intensity has a more pronounced impact on rotor and tower loads than mean shear profiles [
2]. Higher turbulence intensity can lead to increased fatigue loads, particularly in the blade root and tower base, due to the repeated stress cycles caused by turbulent wind flows [
3]. The influence of turbulence intensity is further complicated by its interaction with blade flexibility. Flexible blades, while beneficial for reducing material costs, exhibit greater sensitivity to turbulent inflows, leading to increased flap-wise and torsional displacements [
4]. These displacements can result in a 14% reduction in thrust and a 10% decrease in power output compared to rigid blades [
4].
The blades and tower of the NREL IEA 15 MW turbine are subjected to various loads under turbulent wind conditions. Blade root flap-wise moments are particularly sensitive to turbulence, with higher turbulence intensity leading to increased load fluctuations [
2]. Similarly, the tower base experiences fore-aft moments that are influenced by both wind speed variability and turbulence intensity [
5]. The distribution of these loads is not uniform. For instance, the maximum bending moment on the tower occurs below sea level, while the above-sea portion experiences approximately 20% less force [
1]. This non-uniform load distribution highlights the importance of considering three-dimensional flow effects and structural dynamics in turbine design.
Turbulence also affects the wake characteristics of the NREL IEA 15 MW turbine. The wake, which is the region of disturbed airflow behind the turbine, is influenced by the interaction between turbulent inflows and the rotor. Studies have shown that higher turbulence intensity can lead to a more expanded wake, with increased mixing and energy exchange between the wake and the surrounding atmosphere [
6]. This can result in faster wake recovery, which is beneficial for downstream turbines in a wind farm setup [
7]. However, the presence of turbulent coherent structures in the inflow can also disturb the wake, leading to unfavorable effects such as increased wake width and height [
6]. These structures, which are large-scale eddies in the atmospheric boundary layer, can also influence the position and dissipation rate of wake vortices, further complicating the wake dynamics [
6,
8].
The fatigue life of wind turbine components is significantly affected by the variability in wind conditions. Turbulence intensity and wind speed fluctuations contribute to repeated stress cycles on the blades and tower, leading to fatigue damage over time. Research has shown that the annual fatigue damage on blade roots and tower bases can be accurately predicted using joint distributions of mean wind speed and turbulence intensity [
9,
10]. The reliability of wind turbines under variable wind conditions is also influenced by the choice of turbulence distribution models. Probabilistic modeling of turbulence intensity, as opposed to deterministic approaches, provides a more accurate assessment of fatigue loads and reliability levels [
10]. This is particularly important for offshore wind turbines, where the harsh marine environment and complex wind conditions necessitate robust design and reliability analysis.
Although several recent studies have also highlighted the importance of environmental conditions in wind turbine performance, they have not fully addressed the structural implications under extreme and variable wind scenarios. For instance, ref. [
11] emphasized the role of turbulence intensity and wind shear in affecting power output, yet it did not evaluate how these conditions influence the structural loads on large-scale turbines like the NREL IEA 15 MW. Similarly, ref. [
12] investigated the impact of turbulence on the dynamic modes of an NREL 5 MW turbine wake, without extending the analysis to structural integrity or larger turbine models. The study in [
13] explored the uncertainties in blade structural and aerodynamic behavior and their effect on wind turbine loads, but it lacked a focused assessment of environmental wind characteristics such as shear and turbulence on full-system structural performance. Furthermore, ref. [
14] analyzed turbulence intensity effects on blade aerodynamics using fluid–structure interaction methods, reporting an increase in blade deflection and stress under high turbulence, although the study was limited to the 5 MW model and did not address system-level stability under combined wind conditions. Lastly, ref. [
15] examined the stability of turbine blades under different structural models but did not consider the compounded impact of Shear Exponent, wind inclination angle, or variable turbulence intensity on the overall structural response of the support system.
Despite extensive research on wind turbine power performance and aerodynamic response under varying wind conditions, there remains a significant gap in understanding the structural behavior of large offshore wind turbines-particularly the NREL IEA 15 MW-under combined environmental extremes. The existing literature primarily focuses on 5 MW class turbines and often isolates the impact of individual parameters such as turbulence intensity or wind shear, rather than examining their combined influence on system-level loads and dynamic responses. Moreover, a few studies have integrated multivariate stochastic sampling methods, such as Latin Hypercube Sampling (LHS), to strategically explore a wide design space involving turbulence intensity, Shear Exponent, Extreme Wind Speed, and Flow Inclination Angle. Additionally, the use of aero-hydro-servo-elastic simulation tools like DNV BLADED for structural analysis under sampled extreme cases has not been sufficiently addressed. These limitations constrain the current understanding of load variability, resonance risk, and design-critical response features for next-generation offshore turbines generally deployed in complex marine environments.
The primary aim of this study is to systematically evaluate the structural performance of the NREL IEA 15 MW offshore wind turbine subjected to a range of combined extreme wind conditions using a Latin Hypercube Sampling (LHS) strategy. A total of 27 representative design cases were selected from a large multidimensional design space, defined by variations in Extreme Wind Speed, turbulence intensity, Shear Exponent, and Flow Inclination Angle. For each case, detailed simulations were performed using DNV BLADED, allowing for an in-depth analysis of the resulting forces, moments, displacements, and vibrational characteristics at key structural locations such as the tower and foundation interface. Through comparative analysis of time-domain and frequency-domain responses, the study seeks to identify cases with maximum and minimum structural demands, detect potential resonance phenomena, and provide insights for optimizing support structure designs. Ultimately, this paper provides a methodological framework and critical findings that can inform design load considerations and safety evaluations for future large-scale offshore wind turbine installations.
2. Materials and Methods
2.1. Variables and Ranges
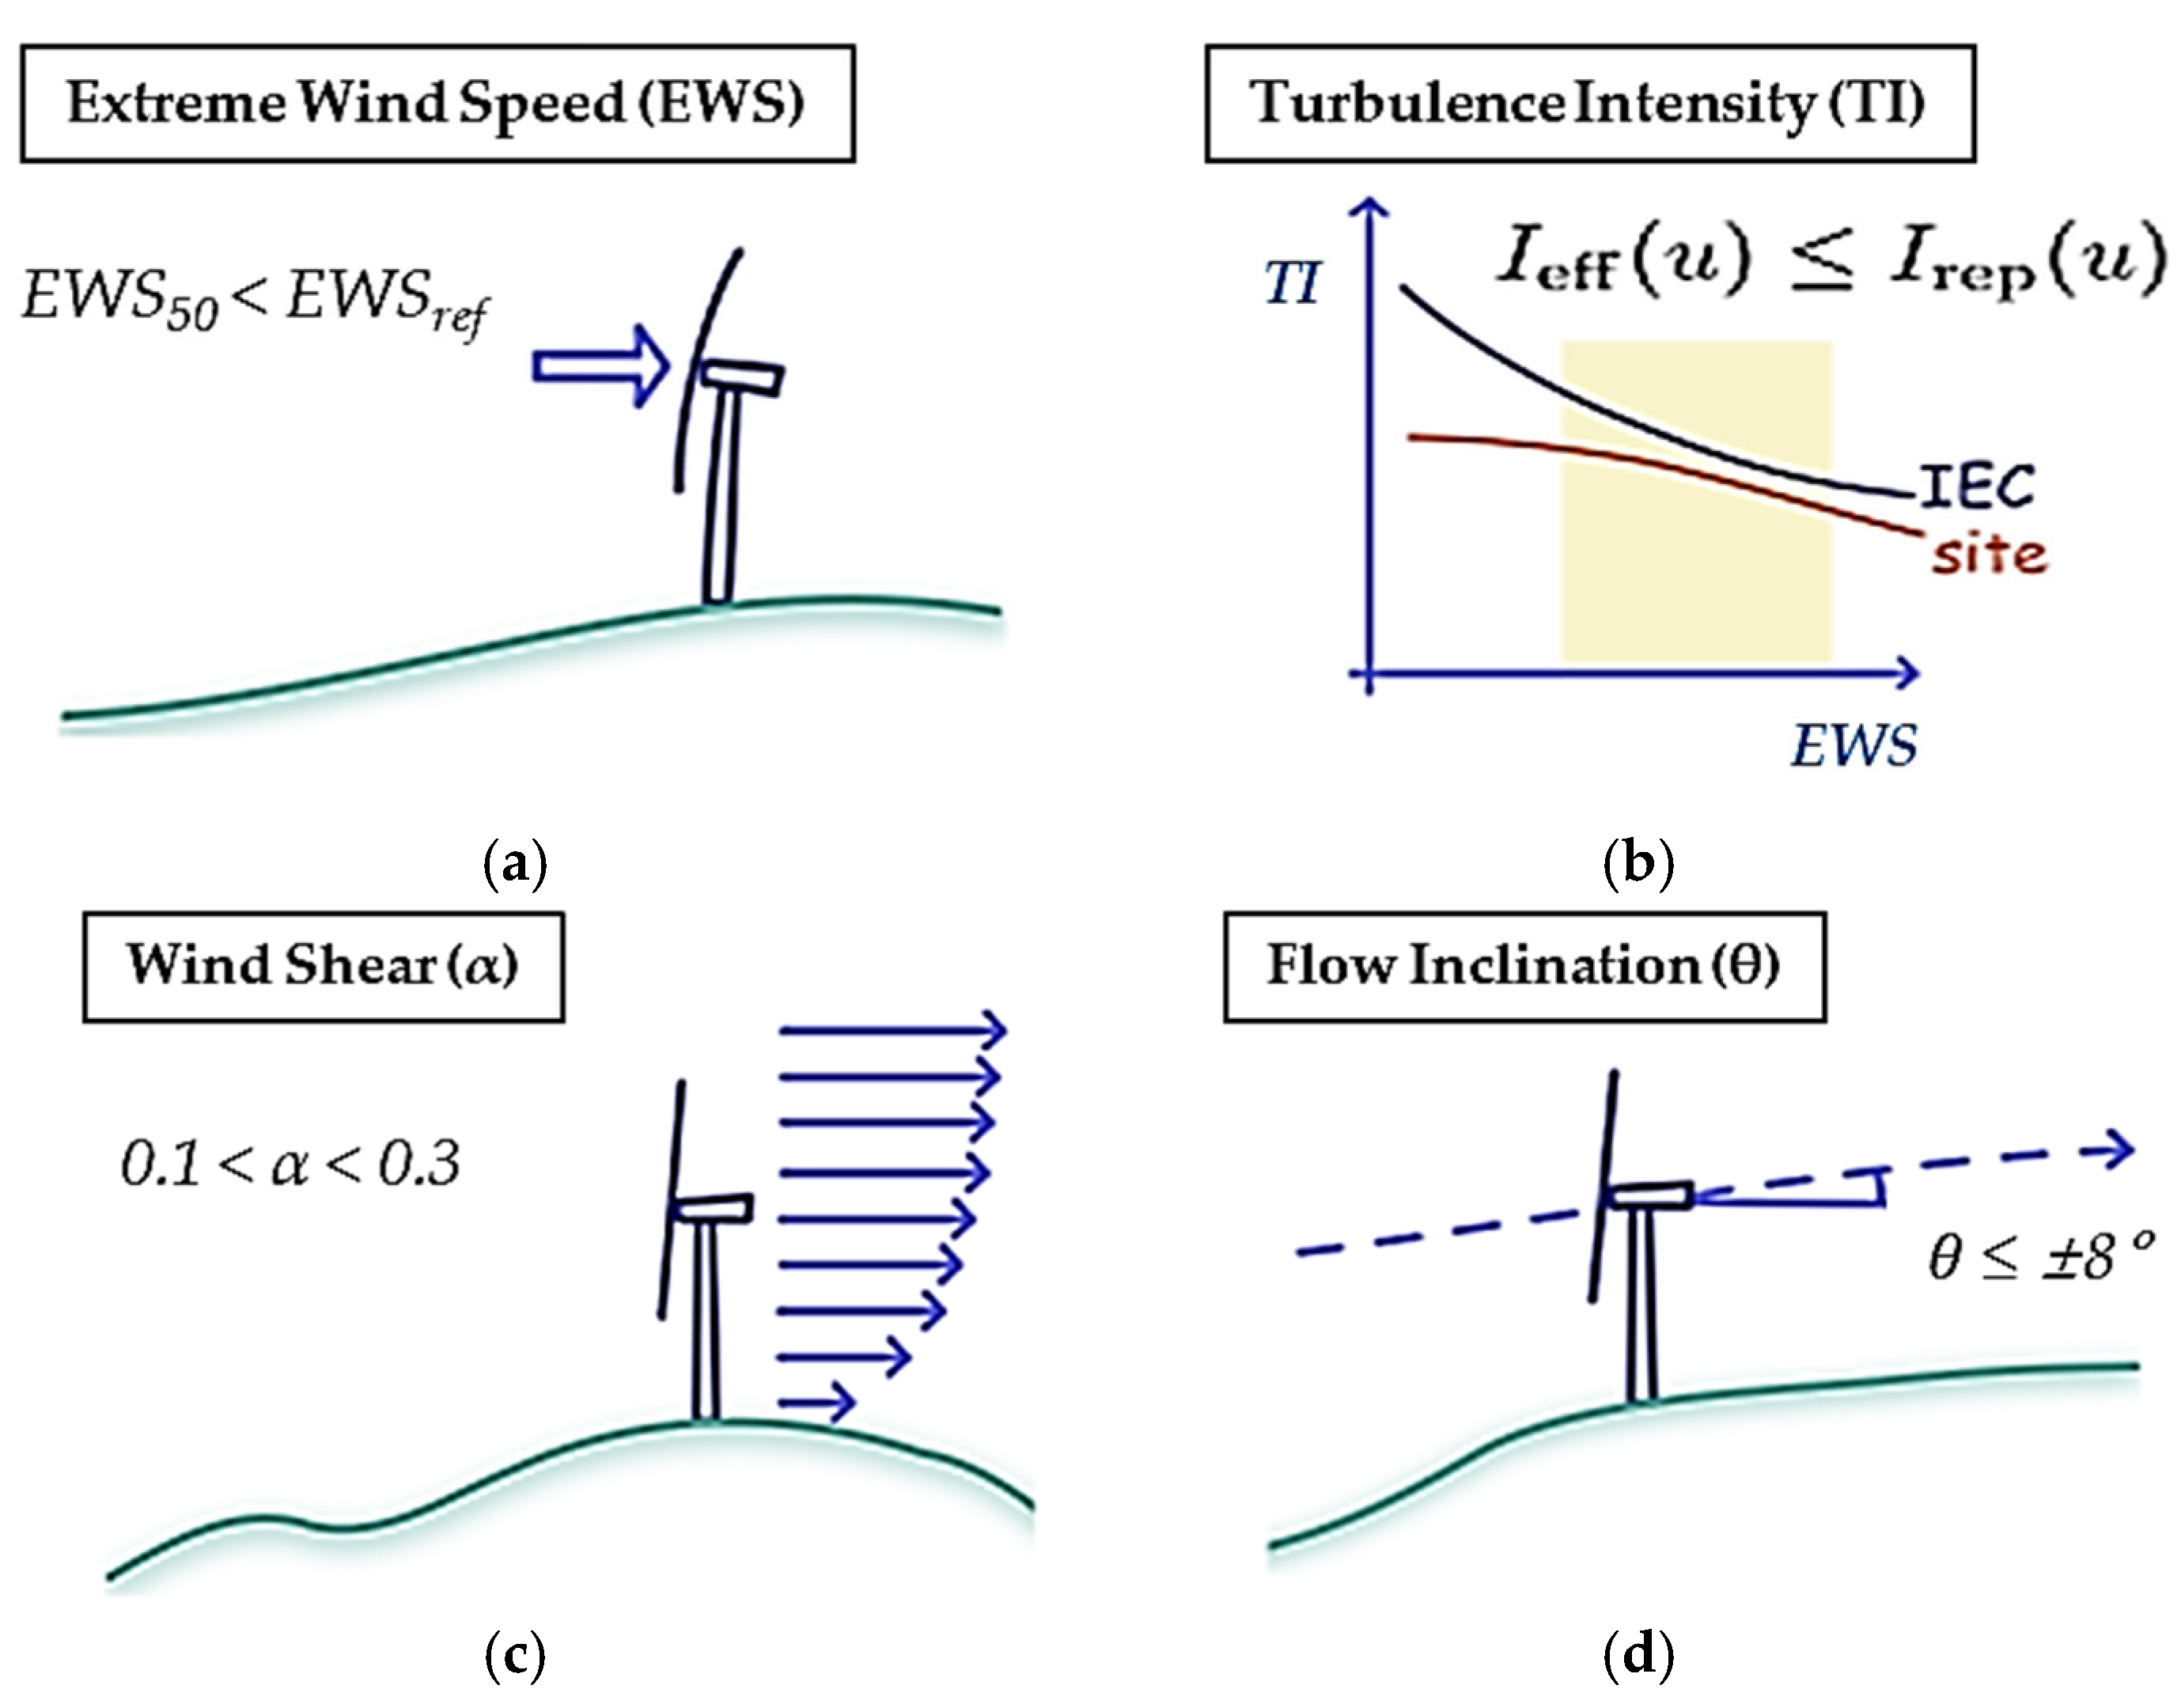
To evaluate the structural performance of the NREL IEA 15 MW offshore wind turbine under various environmental conditions, four key wind-related parameters were selected as input variables for this study, as illustrated in
Figure 1. These include Extreme Wind Speed (EWS), turbulence intensity (TI), Wind Shear Exponent (α), and Flow Inclination Angle (θ). Each of these variables plays a significant role in determining the dynamic loading and overall structural response of large-scale offshore wind turbines.
Figure 1a represents Extreme Wind Speed, which was varied between 30 m/s and 40 m/s to simulate 50-year return-period wind events based on site-specific forecasts. This range ensures the coverage of both moderate and extreme operational limits as encountered in offshore deployments.
Figure 1b illustrates turbulence intensity, denoted by the ratio of the standard deviation of wind speed fluctuations to the mean wind speed. In this study, TI values ranging from 12% to 16% were used, incorporating both IEC-recommended and site-specific turbulence characteristics.
Figure 1c shows the Wind Shear Exponent (α), which was varied between 0.1 and 0.3 to reflect typical offshore boundary layer conditions and vertical wind profile steepness. Lastly,
Figure 1d depicts the Flow Inclination Angle (θ), representing the deviation of wind direction from the horizontal plane due to atmospheric stratification or terrain-induced effects. The angle was constrained within ±8°, covering both upward and downward inflow scenarios.
Table 1 summarizes the full set of variable definitions, units, operating ranges, and discretization strategies applied in this study to generate the total design space. The Extreme Wind Speed (EWS) was defined over a range of 30 to 40 m/s, which corresponds to site-specific Korean offshore conditions informed by long-term meteorological analysis [
18]. The turbulence intensity (TI) followed the IEC 61400-1 standard [
16] and recommendations by Hannesdóttir et al. [
19], with a range of 12% to 16% and a step resolution of 0.1%, resulting in 41 discrete levels.
For Wind Shear Exponent (α), the range of 0.1 to 0.3 with 0.01 increments was selected based on IEC guidelines [
16] for offshore vertical wind profiles, yielding 21 distinct levels. The Flow Inclination Angle (θ), representing the vertical deviation of wind inflow from the horizontal, was varied symmetrically from −8° to +8°, in accordance with WAsP recommendations [
17] and IEC 61400-1 [
16]. The fine resolution of 0.1° led to 161 levels in this variable.
Multiplying the number of levels across all four variables resulted in a total design space of 14,000,721 possible combinations. Simulating the full space is computationally intractable; therefore, a Latin Hypercube Sampling (LHS) technique was adopted in
Section 2.2 to extract a reduced set of 27 representative cases that capture the multidimensional variability of wind conditions.
2.2. Latin Hypercube Sampling
In this study, a Latin Hypercube Sampling (LHS) technique was applied to efficiently select representative cases from a high-dimensional design space for structural performance assessment of the NREL IEA 15 MW offshore wind turbine. LHS is a stratified statistical method that allows for uniform coverage of the input variable range while requiring fewer samples than full factorial or random sampling techniques.
Four environmental parameters were defined as the primary sources of uncertainty affecting the turbine’s structural response:
Extreme Wind Speed, EWS [m/s];
Turbulence Intensity, TI [%];
Shear Exponent, α [-];
Flow Inclination Angle, θ [°].
There, the full design space
is described as the Cartesian product of the ranges of each variable.
where the respective ranges were defined as follows:
;
;
;
.
To generate the LHS design, each input parameter range was divided into
non-overlapping, equally probable intervals. A single sample was drawn from each interval of each variable, with the sampling points randomly shuffled across dimensions to ensure maximum stratification. Mathematically, the
-th sample point
is constructed as follows.
where
represents the variable index (for );
is a unique permutation index for variable ;
is a uniformly distributed random number for sub-interval variability.
The final set of 27 LHS-sampled input vectors provided comprehensive coverage of the input space while avoiding clustering. These selected cases were then used as inputs for time-domain simulations in DNV’s BLADED software (version 4.15) to assess structural responses, including force, moment, displacement, and frequency content at critical tower locations.
Table 2 presents the final set of 27 simulation cases selected through the Latin Hypercube Sampling (LHS) strategy described earlier. These cases were strategically chosen from the full 14-million-point design space, ensuring optimal coverage of the variable domain while minimizing redundancy. Each case is uniquely defined by a combination of four wind-related parameters: Extreme Wind Speed (EWS) in m/s, turbulence intensity (TI) in %, Shear Exponent (α) in dimensionless form, and Flow Inclination Angle (θ) in degrees.
The sampled values were generated using stratified randomization, ensuring that each parameter range was well-represented without clustering. This allowed for a uniform distribution of test conditions across the multidimensional space, which is particularly advantageous when investigating nonlinear interactions between environmental inputs and structural responses. All simulations were performed using DNV BLADED with a consistent 10 min simulation time, as recommended by Haid et al. [
20] and Ru Li [
21], which provides sufficient temporal resolution to capture transient structural behaviors and vibration modes.
2.3. Numerical Model
Figure 2 shows the numerical model of the NREL IEA 15 MW offshore wind turbine implemented in DNV BLADED for time-domain aero-hydro-servo-elastic simulations. The turbine consists of a 150 m hub height, 240 m rotor diameter, and a monopile-type support structure integrated into the seabed. The numerical model accounts for gravitational, aerodynamic, and dynamic loads, along with wind inflow variations as defined in the 27 LHS-selected cases. The foundation is fixed-bottom, and the simulations assume rigid seabed boundary conditions consistent with preliminary monopile designs.
The model integrates the aerodynamic blade element momentum (BEM) theory, linear hydrodynamic loading based on Morison’s equation, a shaft-aligned drivetrain model, and a proportional-integral-derivative (PID) control system for both pitch and yaw. The structural response
at each time step is computed as follows:
where
: aerodynamic force using BEM with dynamic inflow and tip loss corrections;
: hydrodynamic force on monopile (Morison’s equation without wave loading in this study);
: constant gravitational load;
: time-dependent mass-inertia effect from rotating components;
: force/moment adjustments due to pitch and yaw controller feedback.
The modal behavior of the structure was modeled using a reduced-order finite element representation with 15 DOFs, including tower bending in side-side and fore-aft directions, blade flap-wise and edgewise motion, and drivetrain torsion. The tower-monopile system was modeled as a continuous tapered beam fixed at the mudline, with a modal damping ratio of 0.01 assigned to the first mode.
Aerodynamic loads were applied using BLADED-generated turbulent wind fields, and the simulations were run for 600 s with a 0.01 s time resolution to ensure convergence of vibrational features and transient load fluctuations.
To accurately capture unsteady aerodynamic phenomena, the dynamic stall effect was activated using the Beddoes–Leishman model integrated within DNV BLADED. This model accounts for delayed stall onset and vortex shedding that occur under rapidly changing inflow conditions. This is particularly relevant in high turbulence and inclined flow cases, where rapid changes in angle of attack induce unsteady lift and moment variations. The model was chosen for its wide adoption in offshore wind turbine simulations and its compatibility with BEM theory under transient wind inflow.
The turbine structure was represented using a modal-based multi-body dynamics formulation. The tower-monopile system was modeled as a flexible tapered beam with two side-to-side and two fore-aft bending modes. The blades included flap-wise and edgewise flexibility in their first modes. The drivetrain was modeled with one torsional degree of freedom. Mass and stiffness distributions followed the IEA 15 MW reference geometry [
22], ensuring that natural frequencies matched benchmark values, as validated in
Section 3.1.
Hydrodynamic forces were modeled using Morison’s equation, focusing on drag and inertia components without wave excitation. Since the scope of this study was centered on wind-induced structural response, wave loading was excluded to isolate the influence of wind-only cases. The hydrodynamic force
on the monopile is expressed as follows:
where
The fixed-bottom assumption with rigid seabed conditions was applied to focus on aerodynamic effects and simplify the boundary response.
The turbine used a variable-speed control strategy with independent blade pitch control implemented via a PID controller. The pitch controller regulates rotor speed by adjusting blade pitch to maintain generator torque setpoints, especially under Region 3 operation (rated and above-rated wind speeds). Nacelle yaw control was also governed by a separate PID controller that aligned the turbine with the mean wind direction at a 1 Hz update frequency. The control architecture was retained from the IEA 15 MW reference model with appropriate gain tuning to avoid oscillatory behavior during high-turbulence events.
To ensure realistic load extraction relevant to support structure fatigue and stability analysis, the load estimation point was defined at the transition piece (TP), just above the seabed interface. This point is particularly critical, as it captures the cumulative structural response of both tower and monopile under combined environmental loading. The aerodynamic loads, hydrodynamic forces, tower vibrations, and controller-induced effects are all transferred and resolved at this location, enabling a consistent comparison across all simulated scenarios.
3. Results
3.1. Numerical Model Validation
To ensure the accuracy and credibility of the numerical model implemented in DNV BLADED, the computed natural frequencies were compared against reference values reported in [
22], as summarized in
Table 3. The validation focused on three primary modes: the first tower side-to-side bending mode, the first flap-wise blade bending mode, and the first edgewise blade bending mode. The results show that the tower’s first side-side mode in our model is 0.16 Hz, closely matching the reference value of 0.17 Hz with a deviation of 6.25%. Similarly, the first flap-wise mode of the blade was computed as 0.509 Hz, exhibiting a 9.04% deviation from the reference. The edgewise mode frequency was found to be 0.685 Hz, differing by only 6.28% from the cited benchmark.
All discrepancies are within a 10% threshold, which is consistent with tolerances reported in prior studies for structural modal validation of offshore wind turbine systems [
22,
23]. These results confirm that the model is sufficiently accurate for the time-domain simulations and frequency analyses conducted in the subsequent sections of this study.
3.2. Effect of Variables on Extreme Loads
Figure 3 illustrates the influence of each of the four wind-related variables–Extreme Wind Speed (EWS), turbulence intensity (TI), Shear Exponent (α), and Flow Inclination Angle (θ)–on the estimated resultant moment (Mxyz) at the transition piece (TP) of the NREL IEA 15 MW offshore wind turbine. Each subplot includes a linear regression line that reveals the trend and relative sensitivity of the structural moment to the variation in that input.
In
Figure 3a, a positive linear correlation is observed between EWS and Mxyz, with the regression model suggesting that the resultant moment increases by approximately 1229.8 kNm per 1 m/s increase in wind speed. Similarly,
Figure 3b indicates that TI is also positively correlated with structural moment, though with a slightly higher rate of increase (1344.5 kNm per 1% TI), underscoring the amplifying role of turbulence in dynamic loading.
The most significant sensitivity is observed in
Figure 3c, where the Shear Exponent (α) causes a steeper increase in Mxyz, with a gradient of 56,200 kNm per unit α, highlighting the nonlinear effect of vertical wind profile steepness on bending moments. Lastly,
Figure 3d shows that Flow Inclination Angle (θ) also influences Mxyz positively, albeit with a smaller slope (958.8 kNm per degree), suggesting a moderate but consistent contribution from upward or downward wind inflow.
These results confirm that while all four parameters positively affect structural loading, Wind Shear Exponent and turbulence intensity have the most pronounced impact.
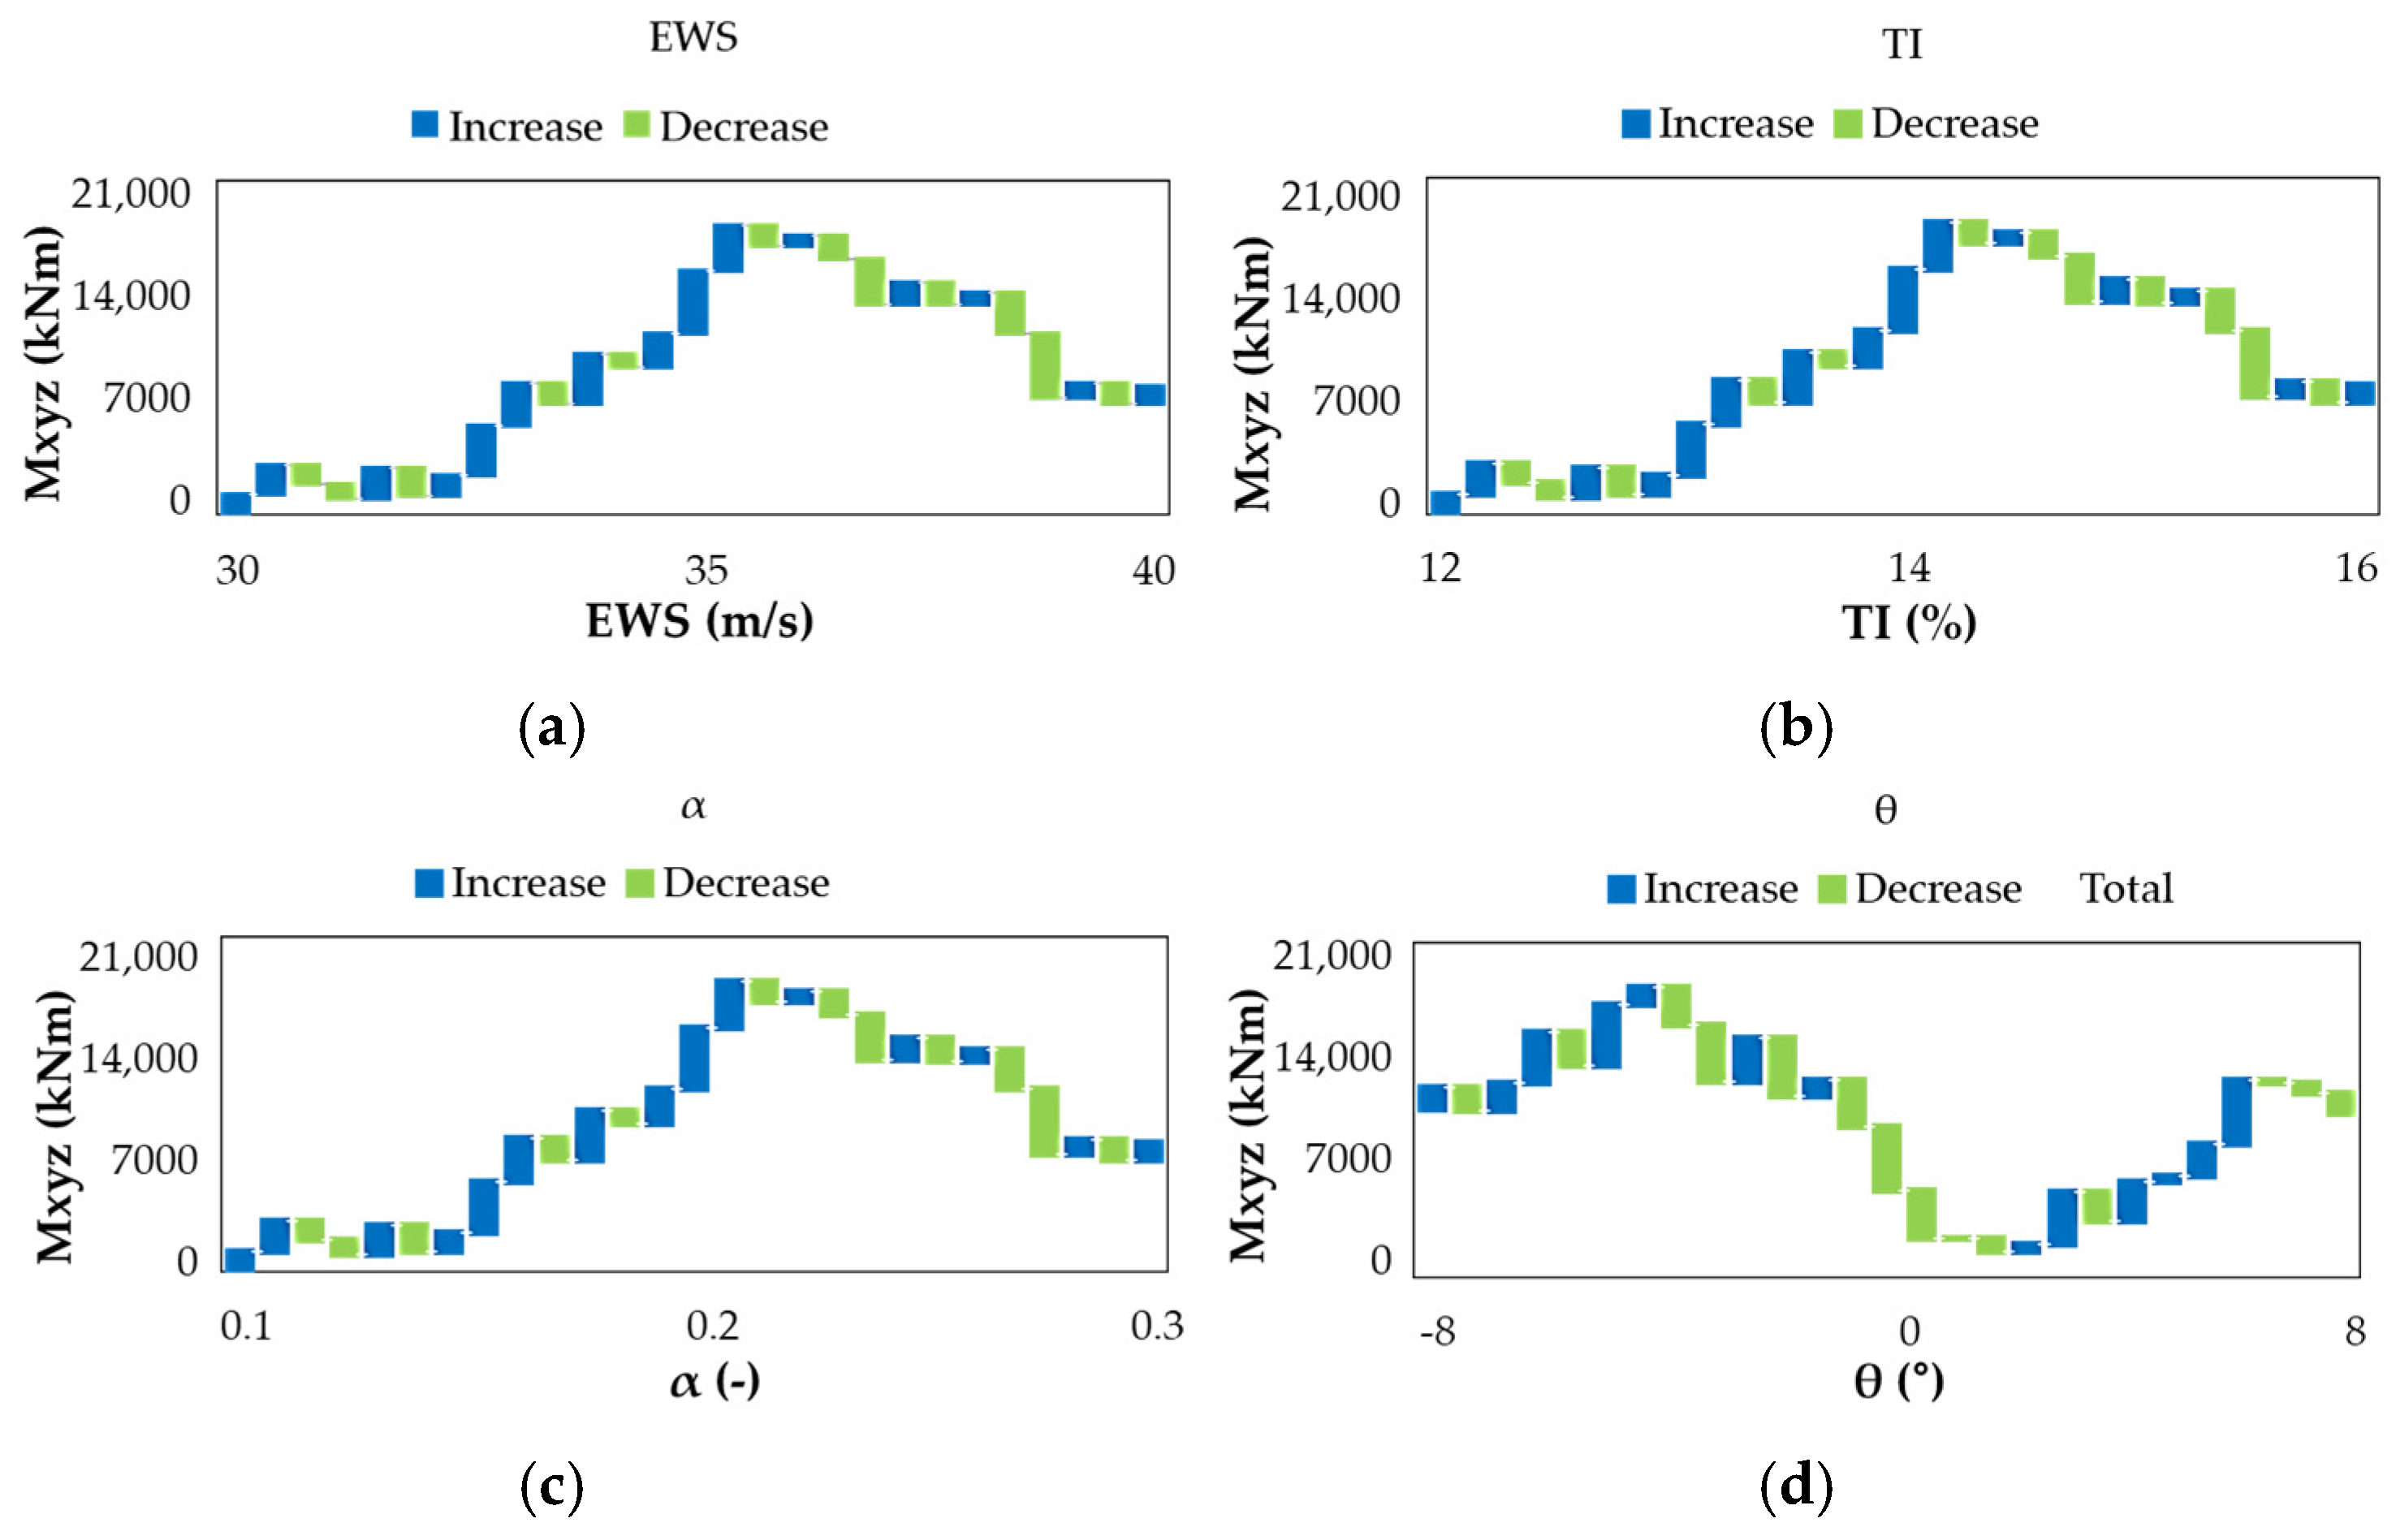
Figure 4 provides a visual interpretation of the incremental change in resultant 3D moment (Mxyz) as a function of each individual input variable: EWS, TI, α, and θ. The use of blue and green bars allows a clear distinction between increases and decreases in moment magnitude relative to the previous simulation point along the axis of each variable.
In
Figure 4a, the changes in EWS display a primarily increasing trend in Mxyz, although the rate of increase becomes less consistent beyond 35 m/s, reflecting the influence of interactions with other parameters.
Figure 4b shows that TI contributes to moment growth more sharply between 12% and 14.5%, after which further increases in TI yield diminishing returns or even slight reductions in Mxyz. This suggests a saturation or nonlinear turbulence-load effect.
Figure 4c highlights that changes in Shear Exponent (α) cause consistently increasing loads up to approximately α = 0.22, beyond which the moment responses become irregular, likely due to aerodynamic interaction with hub height wind speeds. In contrast,
Figure 4d shows that Flow Inclination Angle (θ) has a more oscillatory effect on Mxyz: moderate positive angles increase loads, while negative inclinations result in either minor increases or load alleviation. This trend may be attributed to asymmetry in the wind inflow profile and its interaction with blade pitch and yaw.
Collectively, these plots enhance the interpretation of linear trends from
Figure 3 by illustrating the localized effects and nonlinear transitions, confirming that EWS and α dominate structural loading increases, while TI and θ exhibit more complex, nonlinear behaviors across their ranges.
3.3. All Extreme Cases
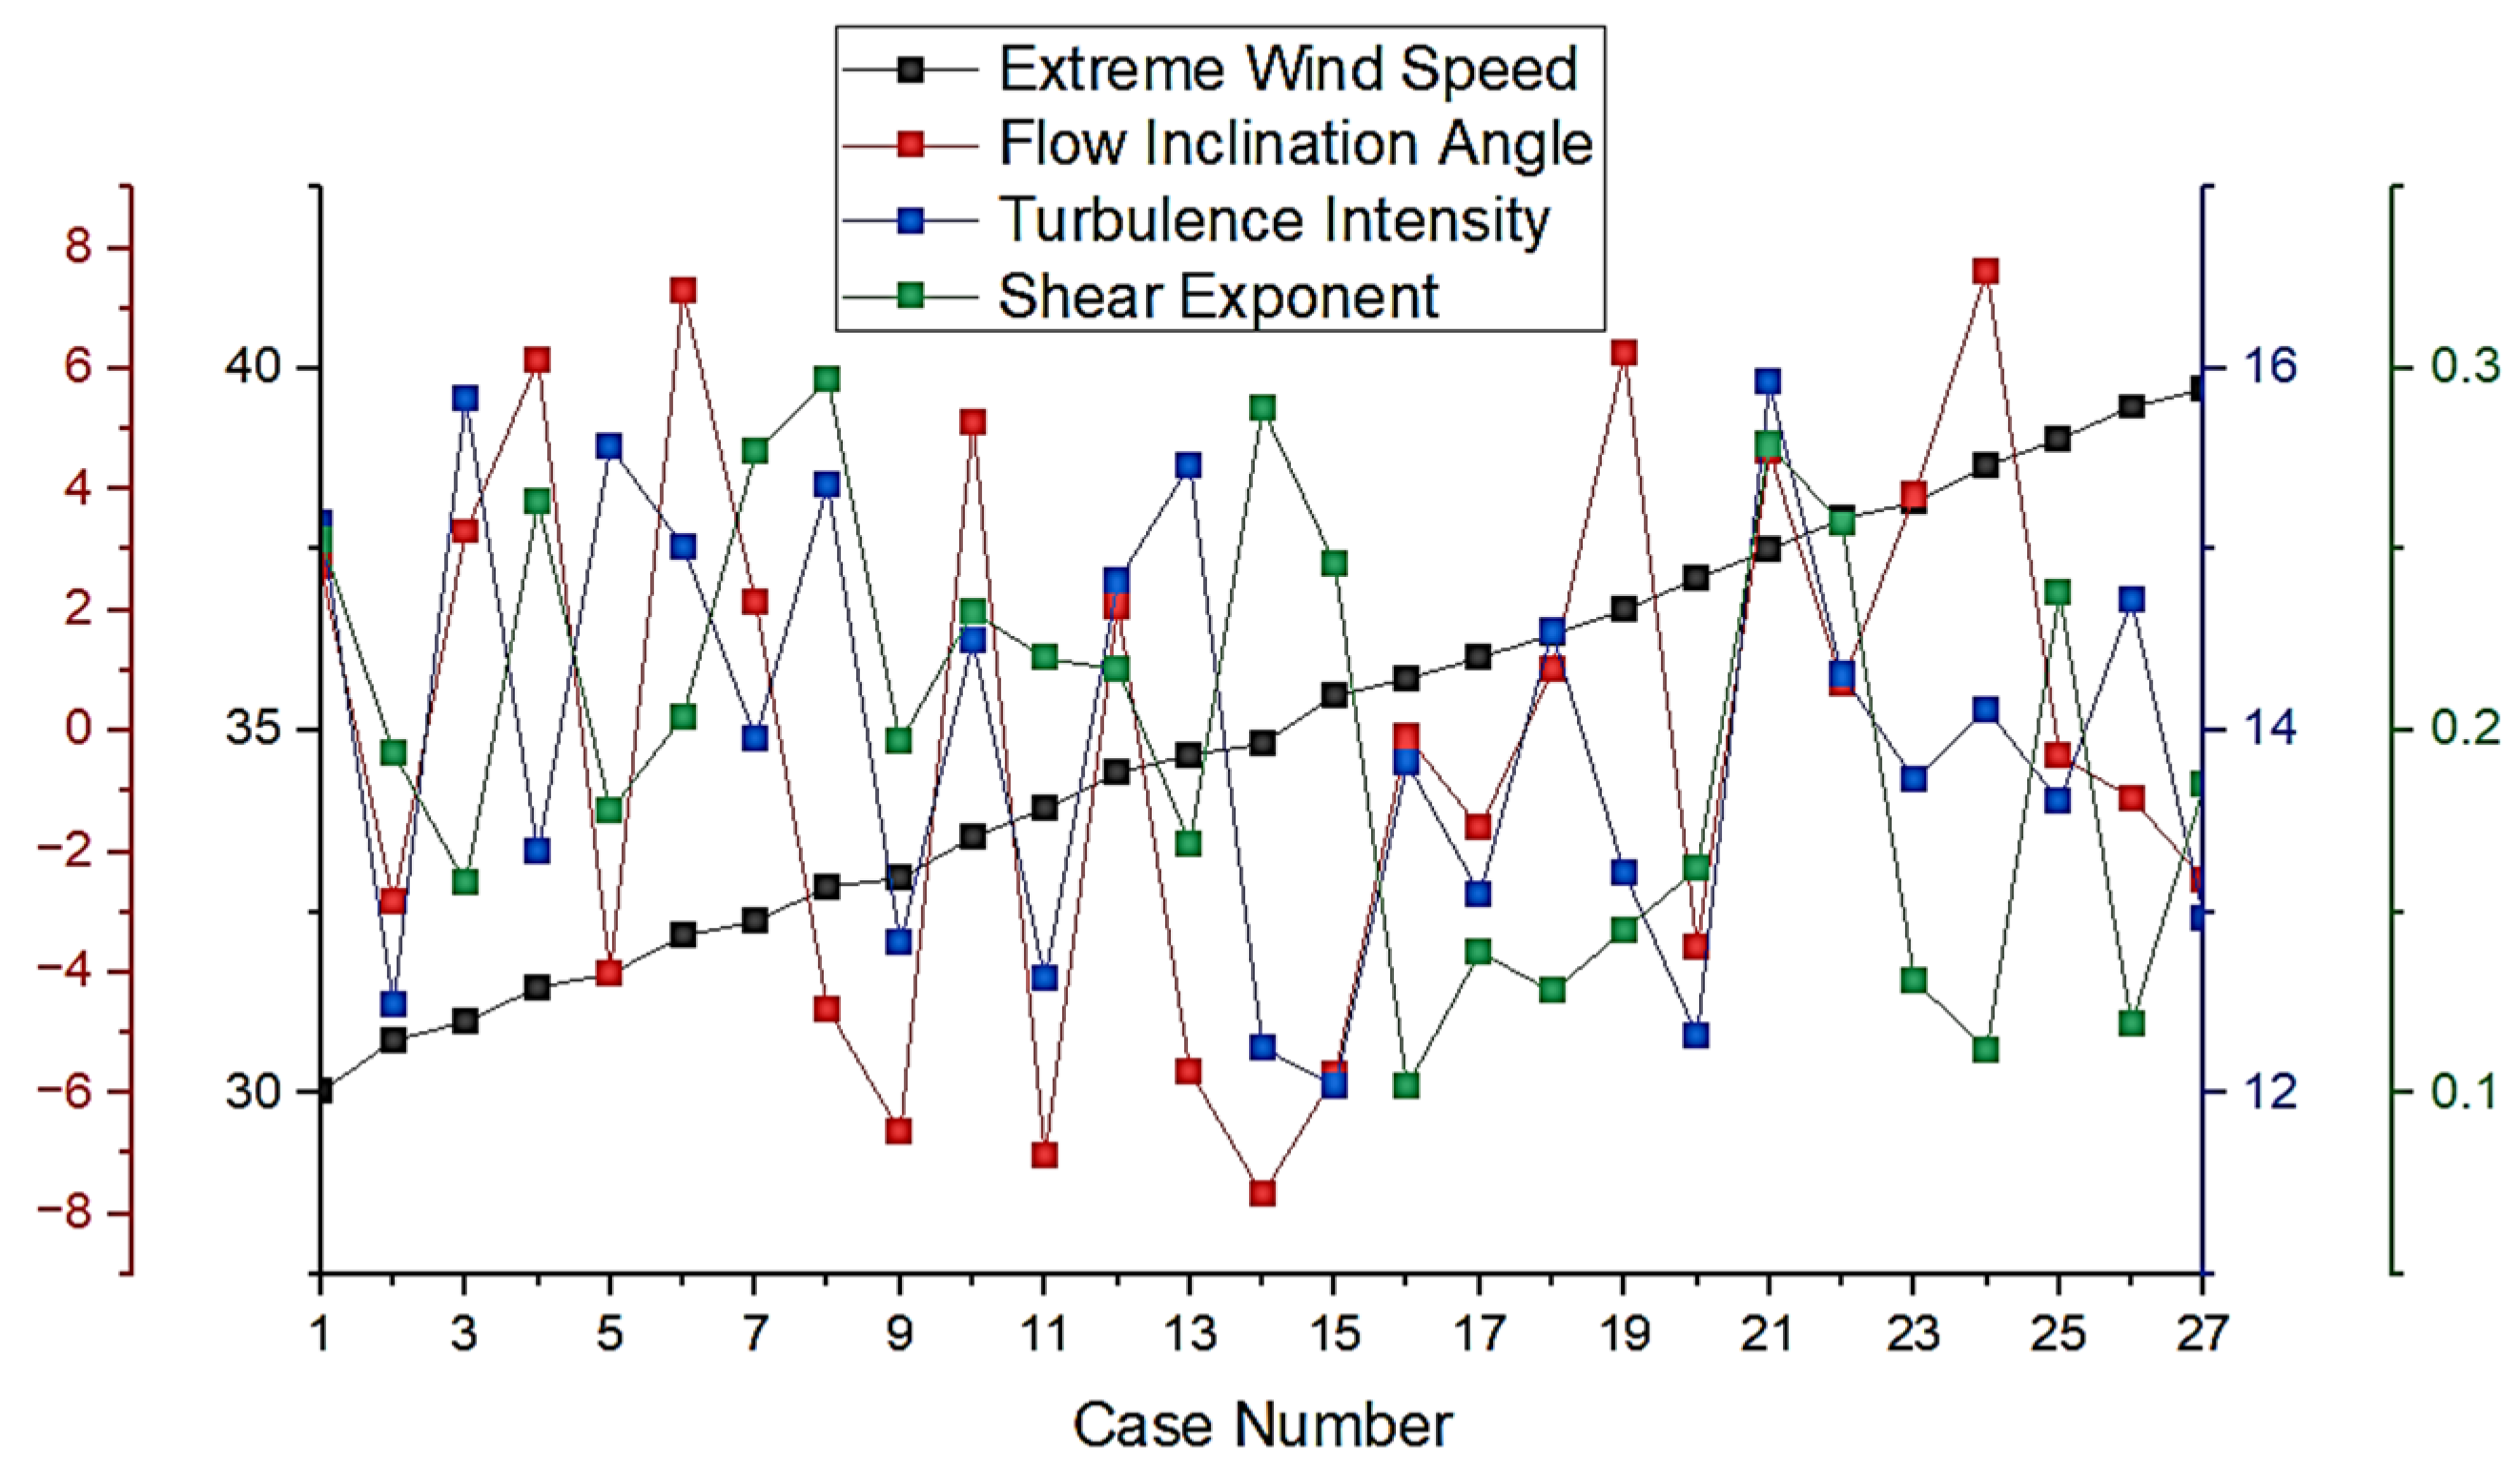
Figure 5 presents the multidimensional design space distribution for the 27 extreme cases selected through Latin Hypercube Sampling (LHS). The plot captures the case-wise variation in all four input variables: Extreme Wind Speed (black line), Flow Inclination Angle (red), turbulence intensity (blue), and Shear Exponent (green).
A clear upward trend in EWS is visible due to the stratified LHS design in that dimension, ensuring that wind speed values are uniformly distributed across their full range of 30 to 40 m/s. In contrast, the other three variables-θ, TI, and α-exhibit randomized but evenly spread values throughout the entire case set. This randomness ensures statistical independence while maintaining coverage over the full design space. The jagged behavior of these lines confirms that no local clustering or bias exists in the sampling, which is essential for reducing uncertainty and ensuring that the structural responses derived from these 27 cases are representative of the larger input domain.
This figure reinforces that the simulation cases collectively span the complete range of input conditions, validating the effectiveness of LHS in exploring a high-dimensional parametric space for structural performance analysis.
Table 4 provides a comprehensive summary of the structural response in terms of bending moments for all 27 LHS-selected simulation cases. The individual moment components about the x, y, and z axes, Mx, My, and Mz, respectively, were extracted at the transition piece (TP) of the wind turbine structure. These components were combined vectorially to compute the resultant 3D moment (Mxyz).
Among all cases, Case 21 exhibits the highest resultant moment (Mxyz = 189,829.2 kNm), indicating the most critical loading condition. This case is characterized by a combination of high turbulence (15.92%), strong flow inclination (4.64°), and elevated shear (0.279), which synergistically contribute to extreme structural demands. In contrast, Case 13 shows the lowest moment (Mxyz = 159,502.5 kNm) with relatively mild wind conditions (EWS = 34.4 m/s, TI = 14.83%, α = 0.217, and θ = 2.07°).
These two cases-representing structural extremes-were selected for detailed follow-up analysis involving frequency-domain transformation (FFT), RMS evaluation, and modal resonance comparisons in the subsequent sections. Their inclusion enables direct investigation into how wind condition combinations influence tower dynamics and structural risk levels.
3.4. Cases with Maximum and Minimum Loads
Figure 6 highlights a comparative assessment of Case 13 and Case 21, which represent the minimum and maximum resultant structural load scenarios, respectively, from the 27 Latin Hypercube-sampled simulations.
As shown in
Figure 6a, Case 21 exhibits a significantly higher resultant moment (Mxyz) of approximately 189,829.2 kNm, compared to 159,502.5 kNm for Case 13. This translates to nearly a 19% increase in overall structural moment, confirming Case 21 as the critical design scenario in terms of combined wind-induced loading.
Figure 6b further reveals that yaw misalignment—the angular deviation between rotor orientation and actual wind direction—is greater in Case 21 (~0.075°) than in Case 13 (~0.035°). Although the absolute values of yaw misalignment appear small, even minor misalignment can amplify unbalanced aerodynamic loading, leading to asymmetric force distribution and elevated fatigue stresses.
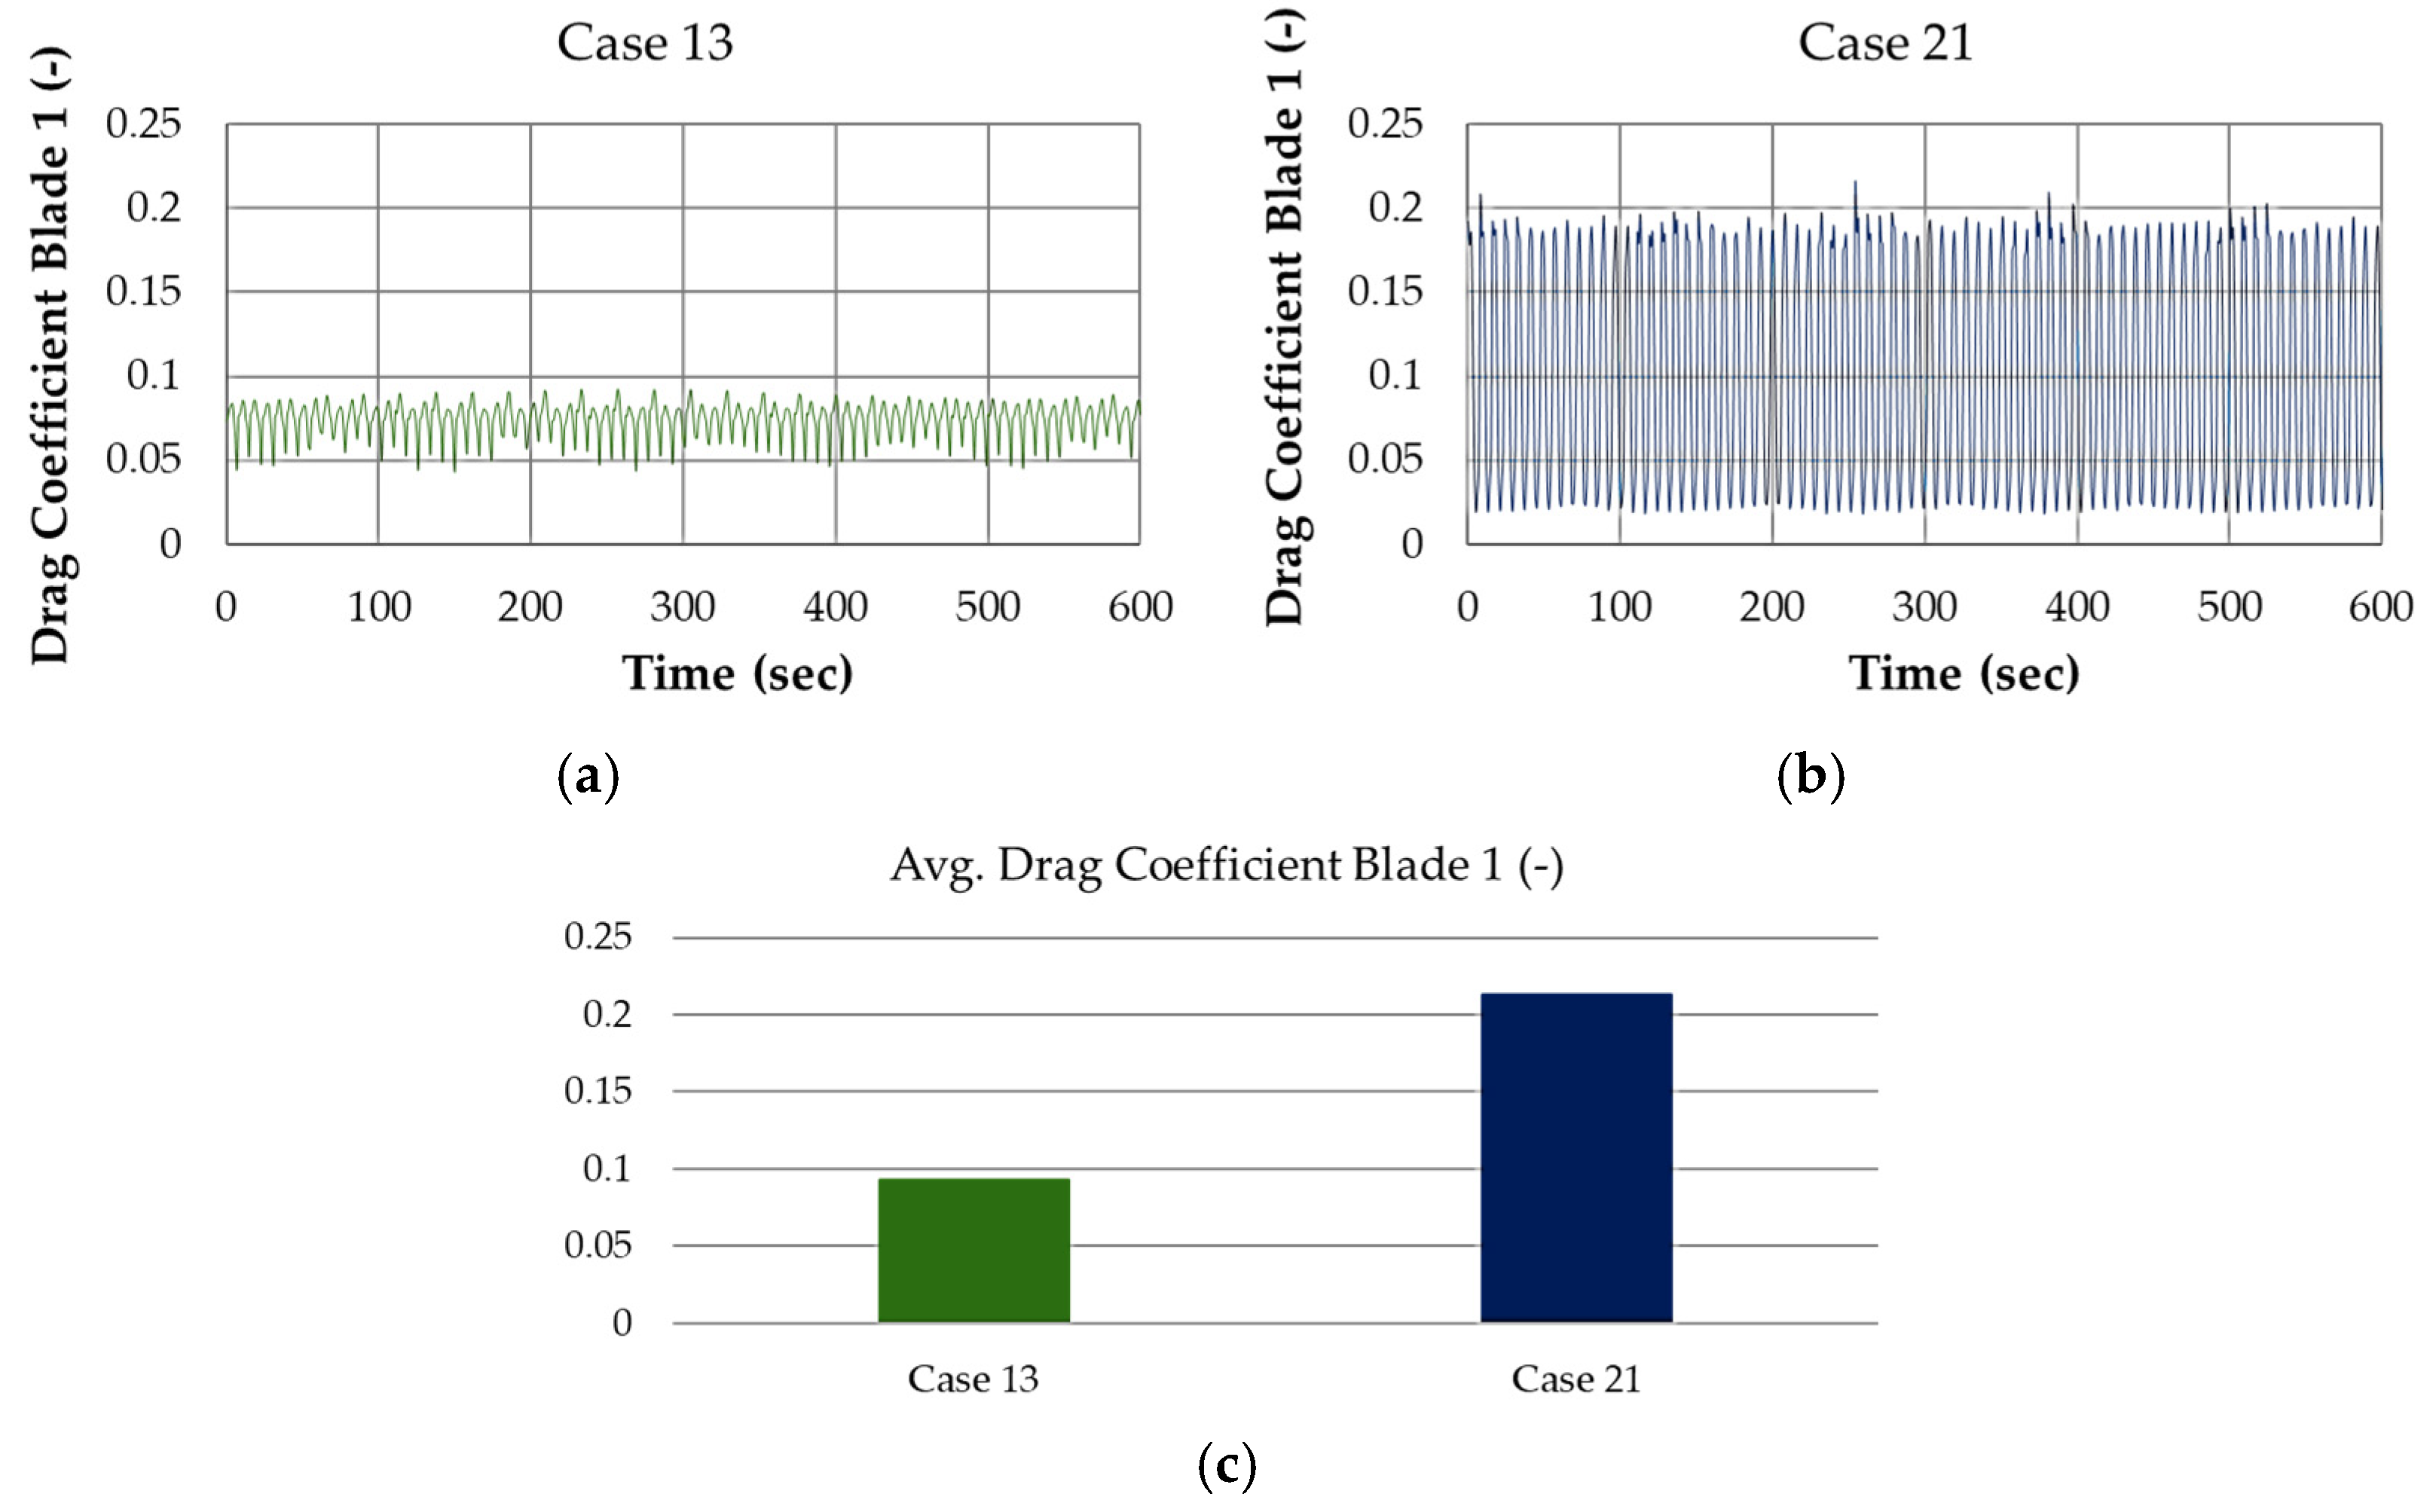
Figure 7 presents a comparison of the drag coefficient variation for blade 1 under the two structurally extreme cases—Case 13 (minimum load) and Case 21 (maximum load). The coefficient of drag was extracted from time-domain simulations in DNV BLADED over a 10 min interval.
As seen in
Figure 7a, Case 13 demonstrates relatively low and stable drag fluctuations, with a mean drag coefficient around 0.08. In contrast,
Figure 7b shows that Case 21 experiences significantly higher drag amplitudes and more pronounced oscillatory behavior, with a peak coefficient reaching above 0.22. This increased drag is likely the result of higher wind speeds, flow inclination, and turbulence intensity in Case 21, all of which intensify blade–air interactions and unsteady aerodynamic effects.
Figure 7c quantitatively summarizes this contrast, showing that the average drag coefficient in Case 21 is nearly three times higher than that of Case 13. This rise in drag not only contributes to elevated thrust loading but also increases flap-wise blade bending moments, which are later translated into higher tower base moments and overall structural stresses.
These observations suggest that the aerodynamic environment in Case 21 is far more aggressive, reinforcing its status as the most critical design condition. The correlation between drag behavior and structural response further emphasizes the importance of including aerodynamic indicators in extreme load assessment frameworks for large offshore turbines.
Figure 8 compares the external pitch bearing moment of Blade 1 for the two structural boundary cases, Case 13 and Case 21, across a 10 min simulation period. This moment is a crucial indicator of the fatigue and mechanical stress imposed on the blade root pitch system, which directly affects both reliability and service life of the turbine’s pitch bearings.
As shown in
Figure 8a, Case 13 demonstrates a relatively stable time series, with average moments around 460 kNm and minimal transient spikes. In contrast,
Figure 8b shows that Case 21 exhibits significantly higher moment fluctuations, with frequent dynamic peaks reaching over 600 kNm, likely due to higher inflow turbulence and larger Flow Inclination Angle. This variability indicates increased cyclic loading, which can exacerbate bearing fatigue and long-term wear.
Figure 8c summarizes these trends by comparing average values, confirming that Case 21 results in a ~10% higher mean pitch bearing moment than Case 13. This is consistent with the higher structural loading and aerodynamic drag observed earlier, reaffirming Case 21 as the most critical design condition.
These results suggest that under high-turbulence and inclined flow conditions, the pitch system is subject to enhanced stress, making it a priority area for design reinforcement and monitoring in large-scale offshore wind turbines.
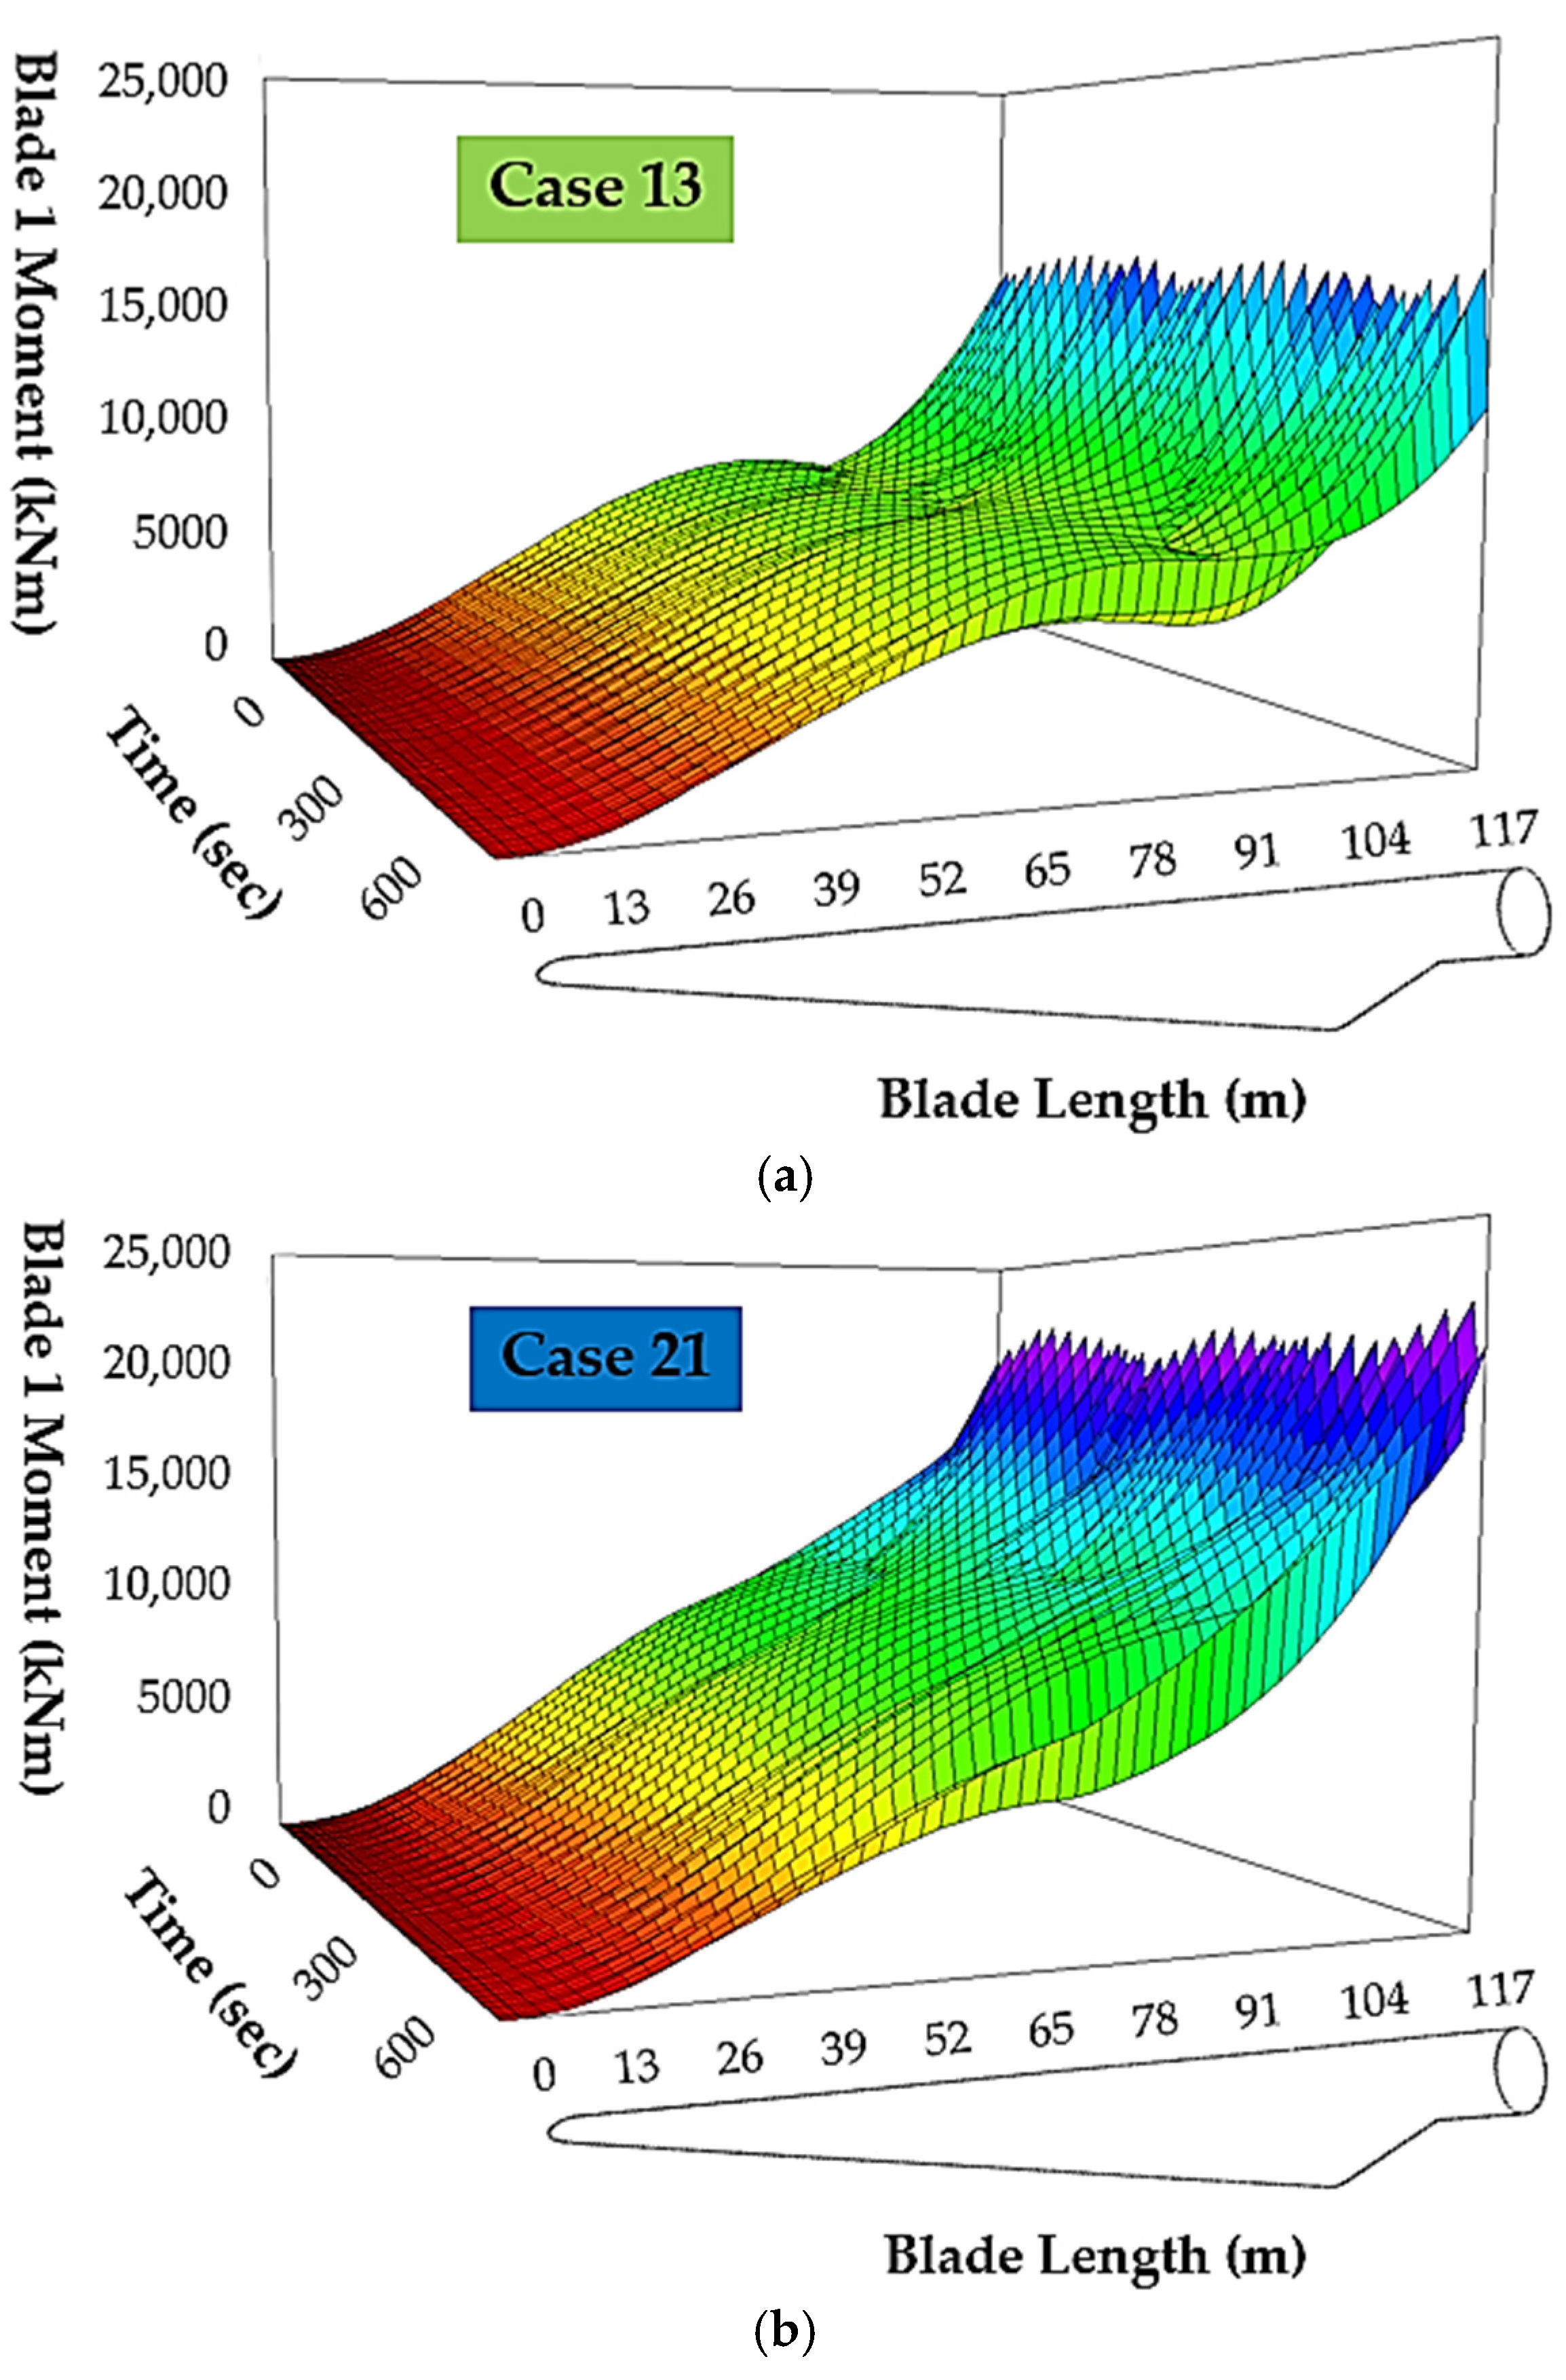
Figure 9 presents a three-dimensional surface map of the bending moment along Blade 1 for both Case 13 (minimum load) and Case 21 (maximum load), plotted over the full blade length (117 m) and simulation duration (600 s). These plots provide a detailed spatial-temporal representation of moment evolution, offering insight into the structural stress gradients experienced by the blade under contrasting wind conditions.
In
Figure 9a, Case 13 demonstrates a relatively smoother and less intense load profile. The moment increases gradually along the blade span, peaking near the blade root (~117 m), as expected due to maximum bending leverage near the hub. The surface is smooth and stable, confirming the lower-intensity aerodynamic environment. Conversely,
Figure 9b for Case 21 shows a steeper gradient of blade moment along the length, with significant amplification over time. The dynamic contour surface exhibits larger oscillatory variations, especially near the trailing edge, indicating strong coupling between turbulence-induced unsteadiness and blade structural response. Peak values exceed 22,000 kNm, significantly higher than those observed in Case 13.
These results highlight how extreme wind scenarios (Case 21) not only elevate the magnitudes of structural loads but also introduce more complex dynamic variations along the blade span, which are critical in fatigue assessment and structural integrity evaluation of pitch-controlled offshore turbines.
3.5. FFT Analysis
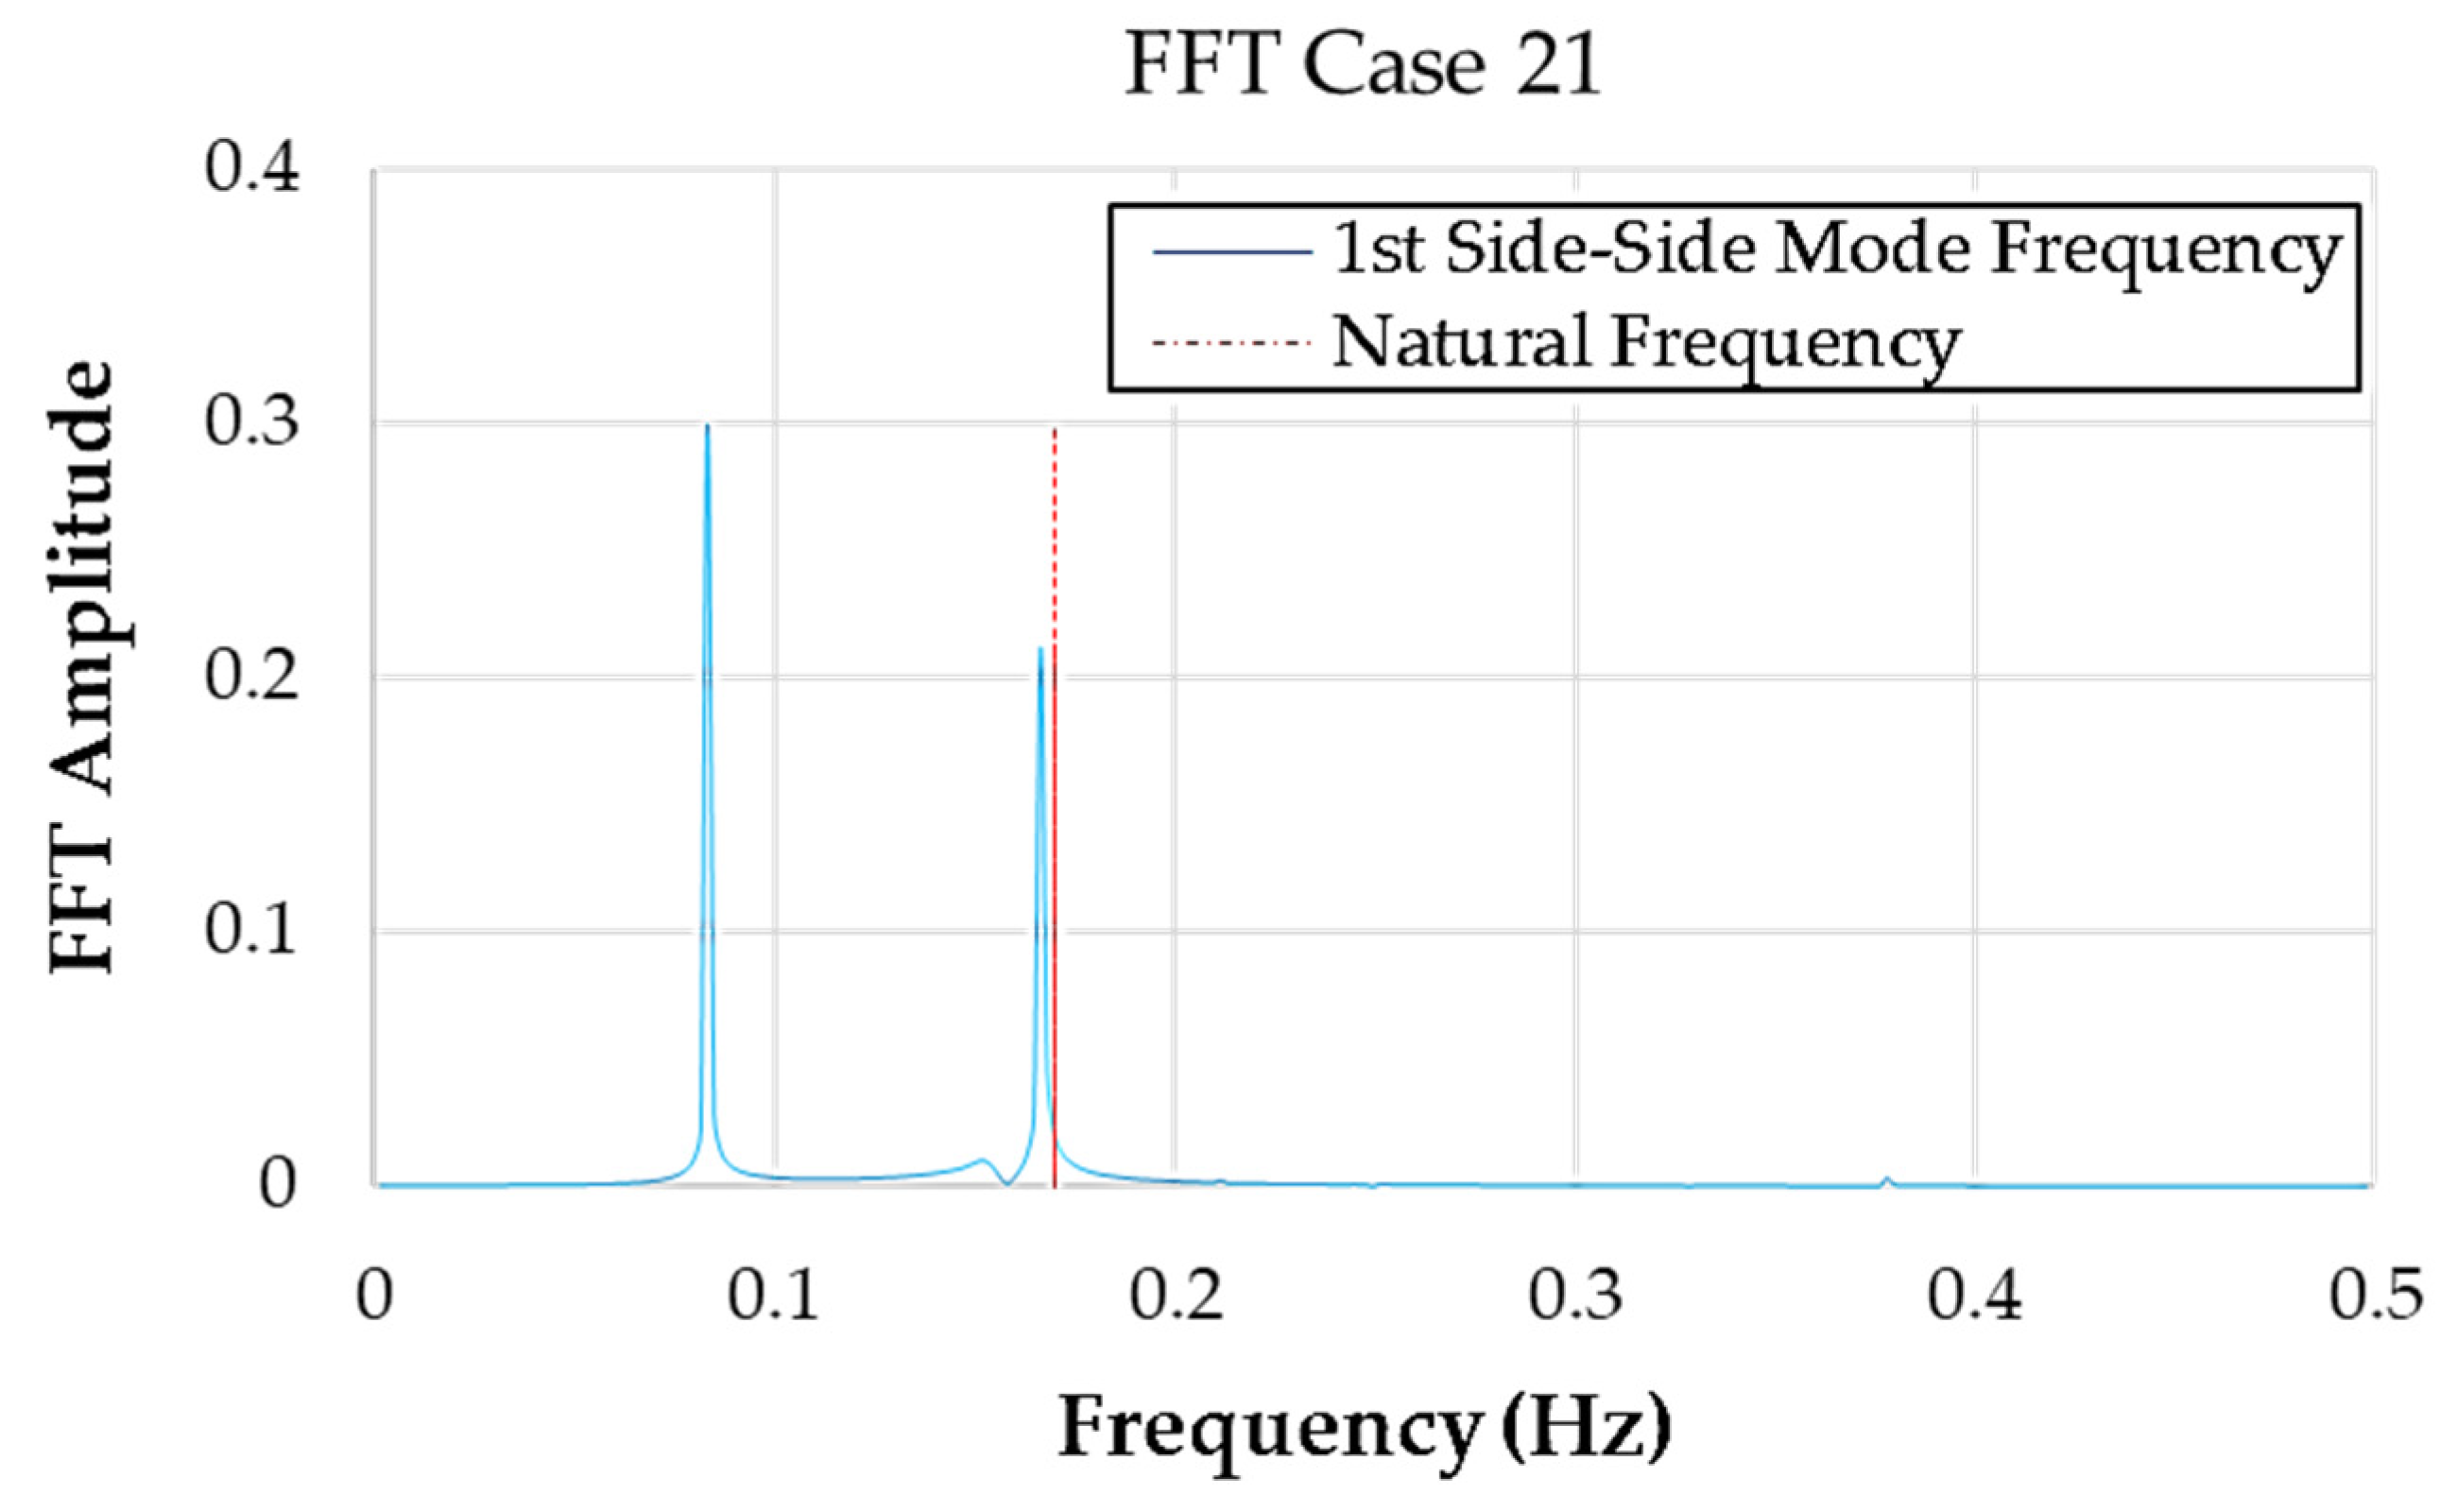
Figure 10 presents the FFT spectrum of vibrational response data at the tower top for Case 21, the most critical load scenario. The analysis aims to identify the frequency components contributing to structural resonance and determine their alignment with the system’s natural frequencies.
The FFT result reveals two distinct frequency peaks. The first dominant frequency occurs at approximately 0.13 Hz, corresponding to the rotor frequency or aerodynamic excitation. The second peak aligns closely with the 1st side-to-side tower mode at 0.17593 Hz, which is the system’s natural frequency (indicated by the dashed red line). The proximity of the dominant excitation frequency to the tower’s natural frequency suggests the presence of resonant amplification, a condition that can significantly magnify dynamic loads and increase fatigue risks.
The frequency amplitude near resonance reaches nearly 0.3 (normalized), which is markedly higher than other spectral components, reinforcing that Case 21 exhibits strong dynamic coupling with the tower’s first mode. This resonance behavior must be carefully considered in structural design and load mitigation strategies, especially for ultra-large turbines like the NREL IEA 15 MW.
4. Discussion and Future Recommendations
The results from 27 simulation cases, selected using Latin Hypercube Sampling (LHS), have revealed the complex interaction between inflow conditions and structural responses of the NREL IEA 15 MW offshore wind turbine. Four primary variables—Extreme Wind Speed (EWS), turbulence intensity (TI), Shear Exponent (α), and Flow Inclination Angle (θ)—were shown to significantly influence the combined moment (Mxyz) at the transition piece. Among these, EWS and TI were found to have the strongest correlation with structural load escalation.
The comparative study between Case 13 and Case 21 illustrated a clear contrast in aerodynamic and structural performance. Case 21, which presented the highest Mxyz (~189,829.2 kNm), showed elevated drag coefficients, larger external pitch bearing moments, and stronger modal excitations, particularly aligned with the tower’s first side-side mode. The FFT analysis confirmed a frequency amplification phenomenon close to the natural frequency of the structure (0.17593 Hz), indicating potential resonance under such extreme conditions. This signifies a critical scenario for fatigue loading and demands attention in control strategy and support structure design.
Despite the robustness of the simulation approach, a few limitations remain. Firstly, the current study is limited to 27 cases, which, although strategically chosen, may not fully capture all nonlinear interactions or rare-event scenarios. Secondly, soil–structure interaction effects and aeroelastic feedback loops were not considered explicitly, which could slightly alter dynamic responses under operational wind–wave conditions.
Therefore, the following topics are suggested in this area of study as future recommendations.
Expanded Case Space: Future work should explore a wider range of design points (e.g., >200 simulations) using advanced LHS or AI-based sampling to derive generalized predictive equations for moment and force responses.
Foundation Interaction Modeling: The inclusion of monopile-soil interaction and hydrodynamic loads would improve the realism and accuracy of transition piece force estimation.
Fatigue Life Assessment: Incorporating rain flow counting and damage-equivalent load (DEL) methods could quantify long-term fatigue sensitivity of the tower and blade components.
Control Strategy Integration: Evaluation of blade pitch and nacelle yaw control effects under varying inflow profiles could offer design-level mitigation techniques.
Validation with Field Data: Coupling simulated results with SCADA or site measurement data from offshore turbines (if available) will support the validation of both load trends and modal behavior under real operating conditions.
5. Conclusions
This study analyzed the structural response of the NREL IEA 15 MW offshore wind turbine under varying inflow conditions using 27 simulation cases selected via Latin Hypercube Sampling (LHS) from a total design space of approximately 14,000,721 combinations. Four environmental variables—Extreme Wind Speed (EWS: 30–40 m/s), turbulence intensity (TI: 12–16%), Shear Exponent (α: 0.1–0.3), and Flow Inclination Angle (θ: −8° to +8°)—were varied to understand their influence on structural loads. The combined moment (Mxyz) ranged from 159,502.5 kNm in Case 13 to 189,829.2 kNm in Case 21, showing a ~19% increase due to inflow variability. Linear trend analysis indicated that EWS and TI had the strongest correlation with Mxyz, while α and θ contributed to moderate variations of up to 12% in the combined moment.
Case 21 consistently exhibited more critical behavior. The drag coefficient on Blade 1 averaged 0.21, which is 2.6× higher than 0.08 in Case 13. Similarly, the external pitch bearing moment increased from 460 kNm (Case 13) to over 520 kNm (Case 21), a ~13% increase. Blade root moments in Case 21 also exceeded 22,000 kNm near the hub. Frequency-domain analysis using FFT showed that Case 21 exhibited dominant vibrational frequencies near 0.175 Hz, closely aligned with the tower’s first side-side natural frequency of 0.17593 Hz, confirming the risk of resonance. This condition can significantly amplify dynamic response and increase fatigue damage potential.
Overall, the study confirms that realistic inflow variability can lead to significant load amplification in offshore wind turbine structures. Yaw misalignment also increased from 0.035° (Case 13) to 0.075° (Case 21), indicating asymmetric loading under high-turbulence, inclined-flow scenarios. While Case 13 serves as a minimum-load reference, Case 21 is identified as the most critical load case, suitable for use in extreme design verification.


