1. Introduction
With the rising global demand for renewable energy, wind power has been rapidly promoted as a clean energy source. By the end of 2022, China’s installed capacity of onshore wind power has reached 360 million kilowatts [
1], and offshore wind power has also shown a development trend of scale, clustering, and depth, becoming an important part of the wind power industry. However, to achieve the commercialisation and large-scale development of wind energy, the only way to ensure the efficient use of wind power energy and long-distance transmission is through efficient power transmission, thus supporting the large-scale application and industrialisation of wind energy.
In the operation of offshore small wind farms, the use of high-voltage AC cables enables direct connection to the land-based AC grid [
2]. This connection method has a high degree of maturity and relatively low investment cost, but the economically reasonable transmission distance of submarine cables generally does not exceed 70 km due to the limitation of the charging current to which they are subjected [
3]. In the context of the coming era of wind power parity, how to improve the technical economy of offshore wind power generation systems is the key to promoting the scale development of offshore wind power generation in China. In the face of the great potential of deep-sea wind power generation, there is an urgent need to establish a set of lower-cost and more reliable transmission schemes for medium- and long-distance offshore wind power generation systems.
Currently, phase-commutated converter (LCC-HVDC) and voltage-source converter (VSC-HVDC) are the mainstream technologies. The LCC-HVDC system has a large transmission capacity and high reliability, but its converter valves are unable to be actively switched off, and its stability is poor [
4]. The VSC-HVDC system, on the other hand, adopts omni-controllable device IGBTs, which are flexible to be controlled, but its application is limited in high-voltage and large-capacity occasions [
5,
6]. In order to overcome this problem, modular multilevel converter (MMC) technology has been proposed. With high modularity, low switching frequency and good voltage waveform, MMC has become a standard scheme for flexible DC transmission and has been applied in real offshore wind power projects [
7]. In a typical scheme, the remote offshore wind turbine adopts a grid-following type of control, which makes the operating frequency of the wind farm consistent with that of the onshore grid. Modular multilevel converters (MMCs) are used at both ends of the DC transmission system, where the MMC at the sending end is controlled by voltage magnitude-frequency (V-f) and the MMC at the receiving end is controlled by constant DC voltage. It is estimated that the offshore platform is large under the typical scheme, and its investment accounts for 19% of the investment in the entire offshore wind power DC transmission project [
8].
Offshore wind low-frequency AC transmission (LFAC) technology is an innovative transmission technology proposed by Prof. Xifan Wang’s team at Xi’an Jiaotong University, aiming to solve the efficiency and stability problems encountered in long-distance power transmission [
9]. The core advantage of the LFAC technology lies in the reduction in line impedance by lowering the frequency of alternating current (AC), a practice that can significantly improve the transmission capacity of electrical energy and effectively reduce power loss [
10]. However, the realisation of LFAC technology relies on the key equipment of AC/DC inverters, and usually, LFAC systems use frequency-doubling transformers to achieve frequency conversion. This frequency-doubling transformer is not difficult to manufacture and is highly reliable, so it is widely used in LFAC systems. However, the efficiency of this type of frequency converter is relatively low, and there may be nonlinear characteristics, which may have a certain impact on the stability of the system, especially under high loads or special working environments, when the stability of the system is relatively low [
11,
12,
13].
Although existing offshore wind power flexible DC transmission projects use the same operating frequency as the onshore AC system, there is independence between the offshore wind farm frequency and the onshore AC grid, and the offshore wind farm system is able to flexibly select the appropriate operating frequency in actual operation. In order to reduce the size and weight of the offshore wind turbine electrical equipment, the system operating frequency can be increased to the middle-frequency band. According to the principle of electromagnetic induction, increasing the operating frequency can reduce the volume of the transformer and converter, which can make the offshore booster platform and converter platform lighter and reduce the investment cost of deep and distant sea wind power generation. The literature [
14] investigated the effect of operating frequency on the capital expenditure of offshore AC grids and found that the optimal frequency choice was 93 Hz when the required cost was the lowest. The literature [
15] compared the application of medium-frequency AC distribution grids with DC distribution grids in offshore wind farms and showed that medium-frequency AC distribution grids were superior to DC distribution grids in terms of cost and efficiency. The literature [
16,
17,
18] explored the feasibility of generic high-frequency or medium-frequency lines integrating wind energy conversion systems and photovoltaic generators.
Against this background, the diode rectifier unit (DRU) converters have become an important research direction in offshore wind power delivery systems due to their unique advantages: small size, low loss, high reliability, and ability to withstand high voltage and large capacity, which make them very suitable for offshore wind power transmission systems. In particular, its unidirectional power transfer characteristics are very suitable for the demand for power flow control in offshore wind power delivery systems. Therefore, in this paper, we will study the DRU-based medium-frequency AC DC delivery system for offshore wind power, aiming to improve the stability and economy of offshore wind power delivery projects. In this paper, we first analyse the influence of topology and frequency enhancement on the parameters of the main loop equipment, then calculate the distribution parameters and transmission capacity of the medium-frequency submarine cables based on finite element submarine cable modelling, and then calculate the transmission losses of the medium-frequency AC pooling system, including the collector losses, converter valve losses and transformer losses. Finally, an economic analysis is carried out through a specific example, which is compared with the Jiangsu Rudong offshore wind power transmission project, in order to verify the economy of the mid-frequency AC transmission system for medium and distant offshore wind power using diode rectifier technology.
2. Diode Rectifier-Based Intermediate Frequency Pooling System for Offshore Wind Power
2.1. Medium Frequency Equivalent Modelling of Diode Converters
The establishment of the mid-frequency equivalent model of the diode (DRU) needs to be based on the steady-state mathematical model and extended to the influence of the mid-frequency component. The mid-frequency fluctuations of the diode converter during the current exchange process mainly come from the diode’s conduction and turn-off characteristics, especially during the conversion between the AC grid frequency and the DC output, which is caused by the higher order harmonics during the exchange process and the current pulsation of the converter.
DRU steady-state modelling can be expressed using the following equation:
where
Udc0 is the unphased ideal no-load DC voltage determined with the AC bus voltage
Uac and transformer ratio
kt;
Rμ is the equivalent internal resistance, which is mainly related to the commutator’s commutation reactance
Xc, and
Idc is the DC output current.
In the steady state model, the input power
Pac on the ac side and the output power
Pdc on the dc side should be asymptotically equal; therefore,
According to the power balance relationship, the AC side fundamental frequency current
Iac can be expressed by the following equation:
In this formula, Uac is the effective value of the AC side voltage; Iac is the fundamental frequency current of the AC side; Idc is the DC output current, and Udc is the DC output voltage.
The medium frequency effect usually manifests itself as a high-frequency component of the AC side current waveform. To simplify this analysis, it is assumed that the medium frequency fluctuations are caused by the current pulsations generated during the diode commutation process. Considering these fluctuations in relation to the AC reactance
Xc and the DC current
Idc, a medium frequency reactance
Xmf can be introduced, which is related to the reactance
Xc on the AC side and the commutation angle
μ in some way. Due to the high-frequency component of the current during the commutation process, the actual mid-frequency current
Imf can be expressed as
where
Xmf is the reactance associated with the medium frequency fluctuations;
δ is the phase of the medium frequency fluctuations, and
ω is the angular frequency of the AC side.
The medium frequency effect leads to changes in power factor, which fluctuates, especially when the current change angle
μ and the AC bus voltage
Uac are varied. The reactive power
Qac during phase change mainly comes from these current pulsations and reactance effects, and the relationship between the power factor angle
φ and the phase change angle
μ can be expressed by the following equation:
The relationship between the commutation angle
μ and the medium frequency reactance can be obtained using the following equation:
With the introduction of the medium frequency reactance and the current fluctuations during the commutation process, the voltage fluctuations on the DC side will be affected by these effects. To represent this, the voltage on the dc side can be expressed as a controlled voltage source, and the effect of the medium frequency current introduces an additional medium frequency reactance
Xmf. Therefore, the voltage
Udc on the dc side of the final medium frequency equivalent model can be expressed as
where
Rμ is the equivalent internal resistance associated with the phase change reactance of the diode converter;
Xmf is the parameter associated with the medium frequency reactance caused by current fluctuations during the current change;
Udc0 is the phase-less ideal no-load voltage on the DC side, which depends on the AC-side voltage and the ratio of the converter transformer, and
Idc is the output current on the DC side.
The mid-frequency effect of the diode can be modelled by introducing the mid-frequency reactance Xmf. This model can effectively describe the current pulsations and voltage fluctuations during the current exchange process, thus providing a more accurate tool for stability analysis and optimisation of AC-DC transmission systems. With known system parameters, the electrical quantities of the system can be calculated based on the medium frequency equivalent model, and the response of the system under medium frequency disturbances can be further analysed.
2.2. System Topology
For nearly two decades, doubly-fed induction generators (DFIG-WT) dominated onshore wind farms. After 2010, fully rated converter wind turbines (FRC-WT) have become the mainstream for offshore wind farms, and in particular, FRC-WT based on permanent magnet synchronous generators (PMSGs) are the best choice due to the elimination of the gearbox and the enhancement of dynamics [
19]. The PMSG-FRC-WT is controlled by the DC voltage of the converter on the machine side, and the output is regulated by the converter on the grid side, making it suitable for offshore wind farms connected to diode rectifier unit converter stations.
The topology of the diode rectifier-based medium frequency AC pooling DC delivery system for offshore wind power is given in
Figure 1. The output power of the wind turbine is delivered to the offshore booster station by the medium voltage AC system and then connected to the offshore converter station via a high voltage submarine cable, and finally, the power is delivered to the land grid by the DC submarine cable. The offshore converter station adopts a 12-pulse type DRU structure, and its harmonic characteristics are filtered using AC filters; the onshore converter station adopts a half-bridge type MMC converter. In order to solve the grounding problem of the offshore converter station, the grounding of the DC transmission system is realised by a star reactor on the valve side of the onshore MMC.
Compared to the traditional flexible DC transmission method, the advantage of the proposed scheme in this paper is the adoption of DRU topology, which reduces the size and investment cost of the offshore converter station. Although DRU has the advantages of miniaturisation and low cost, the introduction of AC filters in the offshore converter station will increase the investment cost of the whole system and reduce its economy. For this reason, in this paper, the frequency of the offshore wind power AC convergence system is increased to medium frequency, which can effectively reduce the volume and cost of the main circuit equipment of the offshore wind power AC system and improve the system’s lightweight and economy. At the same time, since the DRU does not have active control capability, it is necessary to use grid-type wind turbines or auxiliary voltage control equipment to stabilise the AC aggregation system voltage.
2.3. Main Circuit Parameter Change Rule with Frequency
For the medium frequency scheme, the impact of offshore AC system-rated operating frequency changes on the main circuit equipment of the DRU-based offshore wind DC delivery system is mainly reflected in the two aspects of transformers and AC filters, which are analysed separately in the following.
2.3.1. Subsubsection
- (1)
The transformer leakage inductance Lt can be expressed by the following equation:
where
Lt is the transformer’s leakage inductance;
xt is the transformer’s short-circuit impedance percentage (leakage resistance standard value);
Ut is the transformer’s rated voltage;
St is the transformer’s rated capacity, and
f is the operating frequency.
From the above equation, transformer leakage inductance is inversely proportional to the frequency f. When the operating frequency f of the system increases, the leakage inductance Lt decreases. This means that the rate of change in electromagnetic induction and flux in the transformer increases when the frequency increases, which leads to a faster change in the magnetic field and a decrease in the leakage inductance;
- (2)
The transformer excitation potential is calculated using the following equation:
where
Et is the excitation potential;
Nt is the number of coil turns of the transformer;
B is the magnetic induction strength of the core;
A is the cross-sectional area of the core, and
f is the operating frequency.
It can be seen that an increase in frequency f leads to a decrease in the cross-sectional area A of the iron core while keeping the excitation potential Et and other parameters constant. This is because the rate of change in magnetic flux is accelerated when increasing the frequency f, and the required cross-sectional area of the core material can be reduced. Therefore, the core portion of the transformer volume decreases with increasing frequency.
The length of the windings of a transformer is closely related to the capacity St and the rated voltage Ut of the transformer. Assuming that the number of coil turns Nt and the voltage rating Ut of the transformer remains constant, the length l of the windings is usually related to the number of turns and the layout of the windings. Since Nt and A are inversely proportional to the frequency f in the equation for the excitation voltage of a transformer, the total length of the windings decreases as the frequency increases. Specifically, the number of turns and the length of the windings of a transformer decreases as the frequency increases, thus reducing the size of the windings.
In summary, when the operating frequency f of the AC system is raised, due to the leakage resistance standard value and frequency being inversely proportional to the leakage inductance of the transformer, Lt will be reduced; the volume of the transformer will be reduced, mainly manifested in the core cross-sectional area A and the winding length l of the reduction; the weight of the transformer will be reduced, thus reducing the burden of the overall equipment. This volume and weight reduction is particularly important for offshore wind power, wind power step-up transformers, offshore platforms, and other application scenarios, which can effectively reduce the cost and difficulty of engineering and construction.
2.3.2. AC Filters
The harmonic characteristics of the diode rectifier unit are similar to those of the LCC and can be derived using the switching function. Theoretically, the characteristic harmonic currents on the AC side are mostly of the order of (12 k ± 1), and the characteristic harmonic voltages on the DC side are mostly of the order of 12 k. AC filters should be installed to filter out the characteristic harmonic currents and provide reactive power compensation.
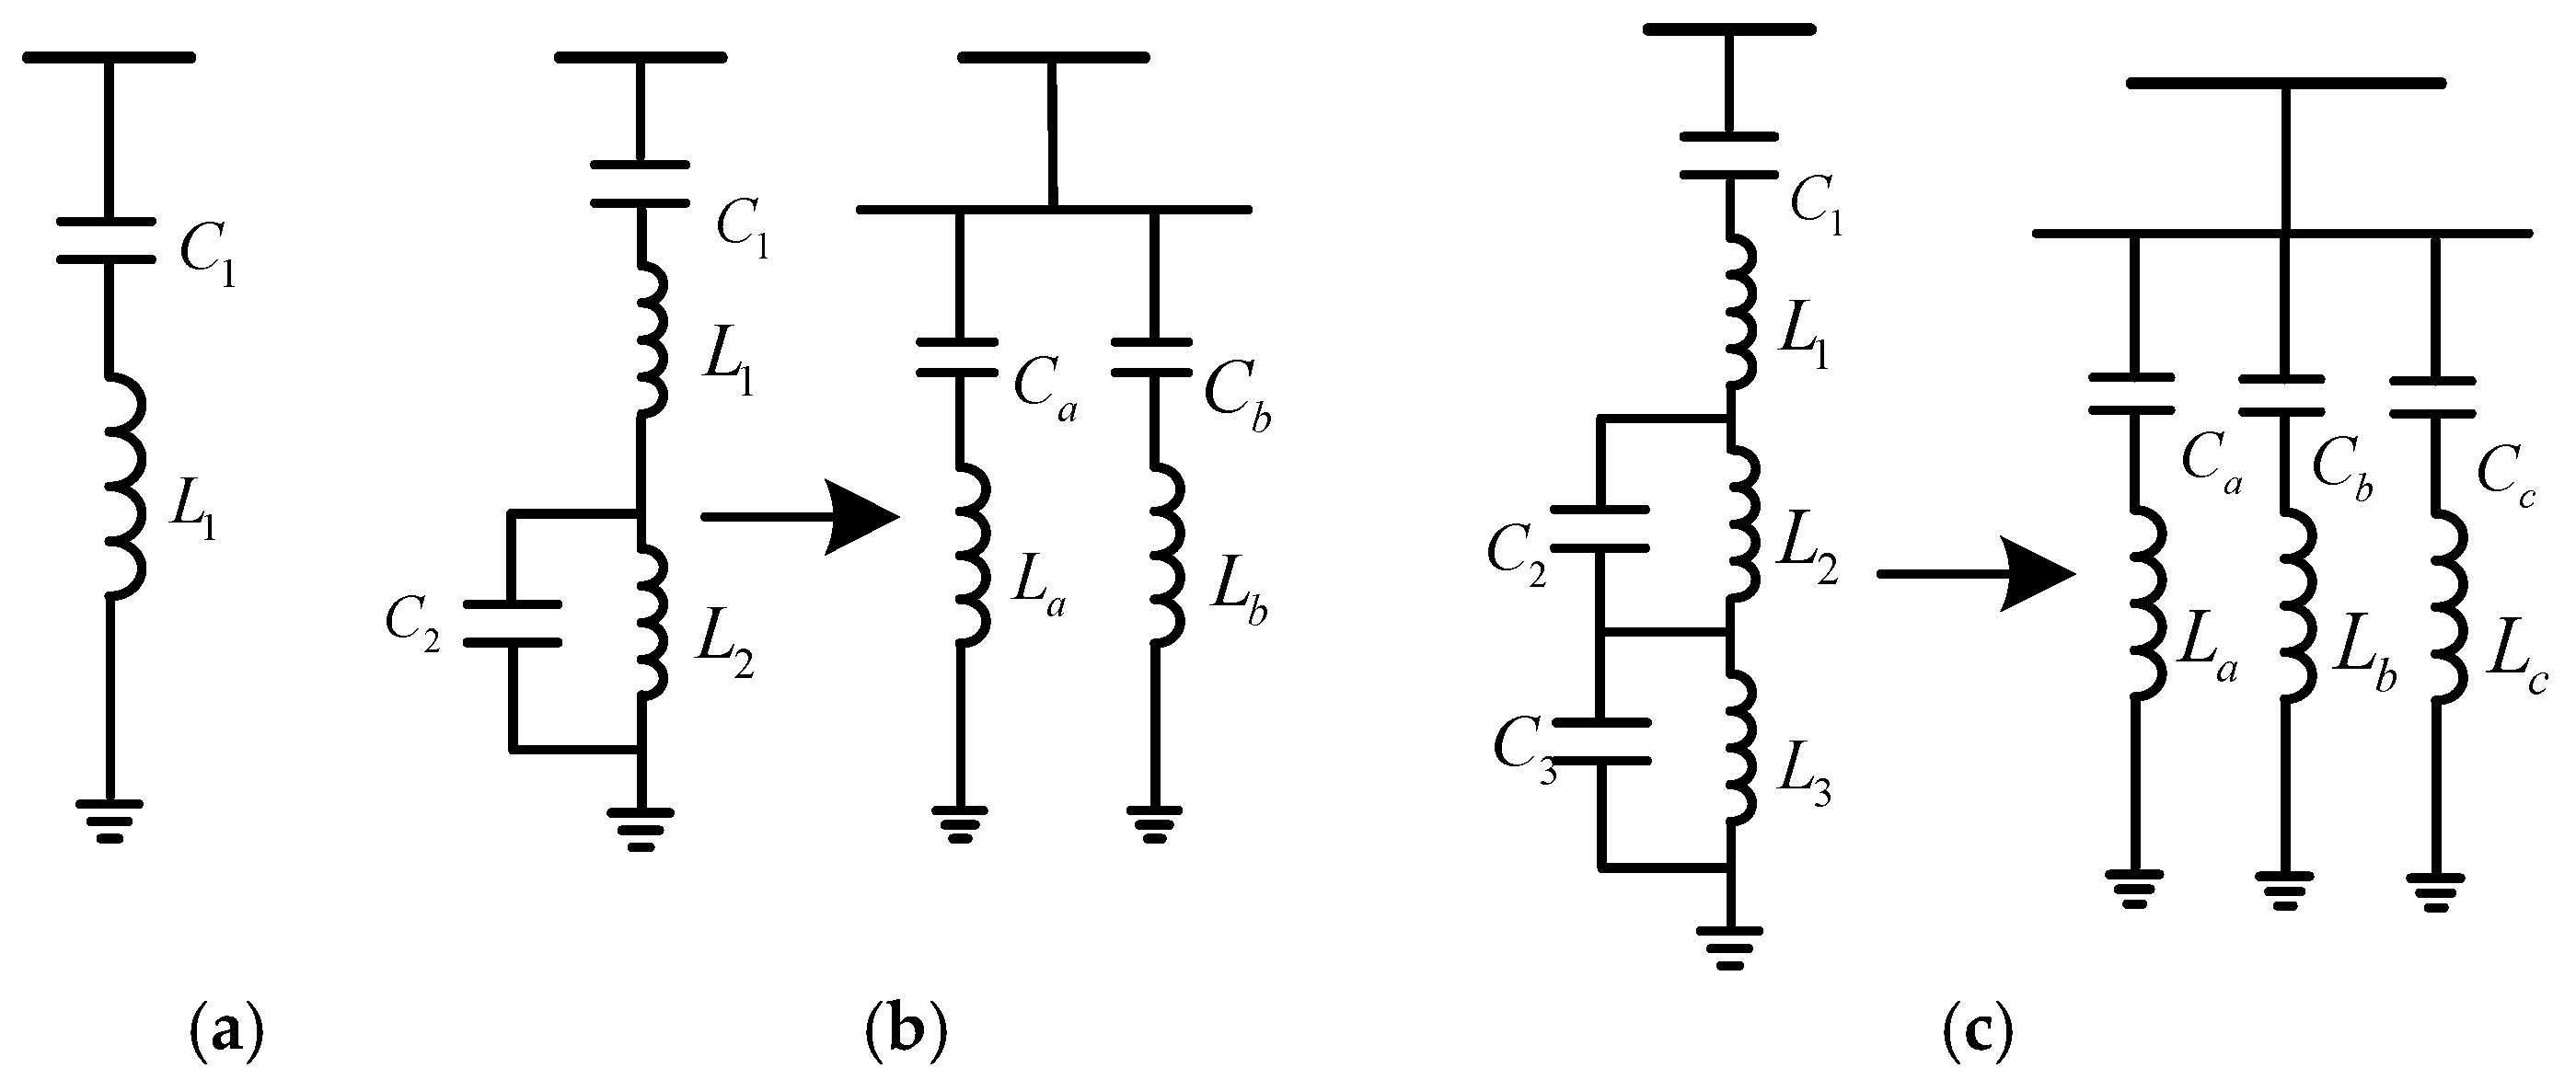
There are three types of AC filters in practical engineering, namely, single-tuned filters (ST), double-tuned filters (DT) and triple-tuned filters (TT). A double-tuned filter is equivalent to two single-tuned filters connected in parallel, and a triple-tuned filter is equivalent to three single-tuned filters connected in parallel. Regardless of the damping resistance, all three types of filters are shown in
Figure 2, including the original and equivalent structures. In
Figure 2,
Ci and
Li (i = 1, 2, 3) are the actual capacitors and actual inductors in the ac filter;
Cj and
Lj (j = a, b, c) are the equivalent capacitors and equivalent inductors of the ac filter. For a single-tuned filter consisting of
C1 and
L1, the capacitive reactive power
Q0 at the resonant frequency
ω1 and fundamental frequency
ω0 can be calculated by the following equation [
20]:
In practical engineering, the resonance frequency is chosen near the characteristic harmonic, and
ω1 can be written in the form of
ω1 =
n1 ×
ω0 (
n1 is the number of tuning orders,
n1 >> 1). In addition to filtering the AC side harmonics, the AC filter can act like a reactive power compensator to provide the reactive power consumed by the DRU in the LCC-HVDC system. Assuming that the capacitive reactive power
Q0, the fundamental frequency
ω0, the converter AC bus r.m.s. voltage
Uac, and the tuning order
n1 are known, the actual capacitance
C1 and the actual inductance
L1 of the single-tuned filter can be computed by solving the following equations [
20]:
From Equation (11), both C1 and L1 are approximately inversely proportional to ω0 when the tuning order n1, the fundamental frequency reactive power Q0, and the converter AC bus voltage Uac are certain. Therefore, the dimensions of the single-tuned filter with the medium frequency diode rectifier unit are smaller than the normal industrial frequency scheme. With the help of the same assumptions and magnitude analysis, it can also be concluded that the actual capacitors and actual inductors in the double-tuned and triple-tuned filters are also approximately inversely proportional to ω0. Therefore, the dimensions of the double-tuned and triple-tuned filters of the medium frequency diode rectifier unit are also smaller than those of the normal industrial frequency scheme, which contributes to a direct reduction in the size and weight of the offshore rectifier platform.
3. Distribution Parameters and Current Carrying Capacity Calculation of Intermediate Frequency AC Submarine Cables
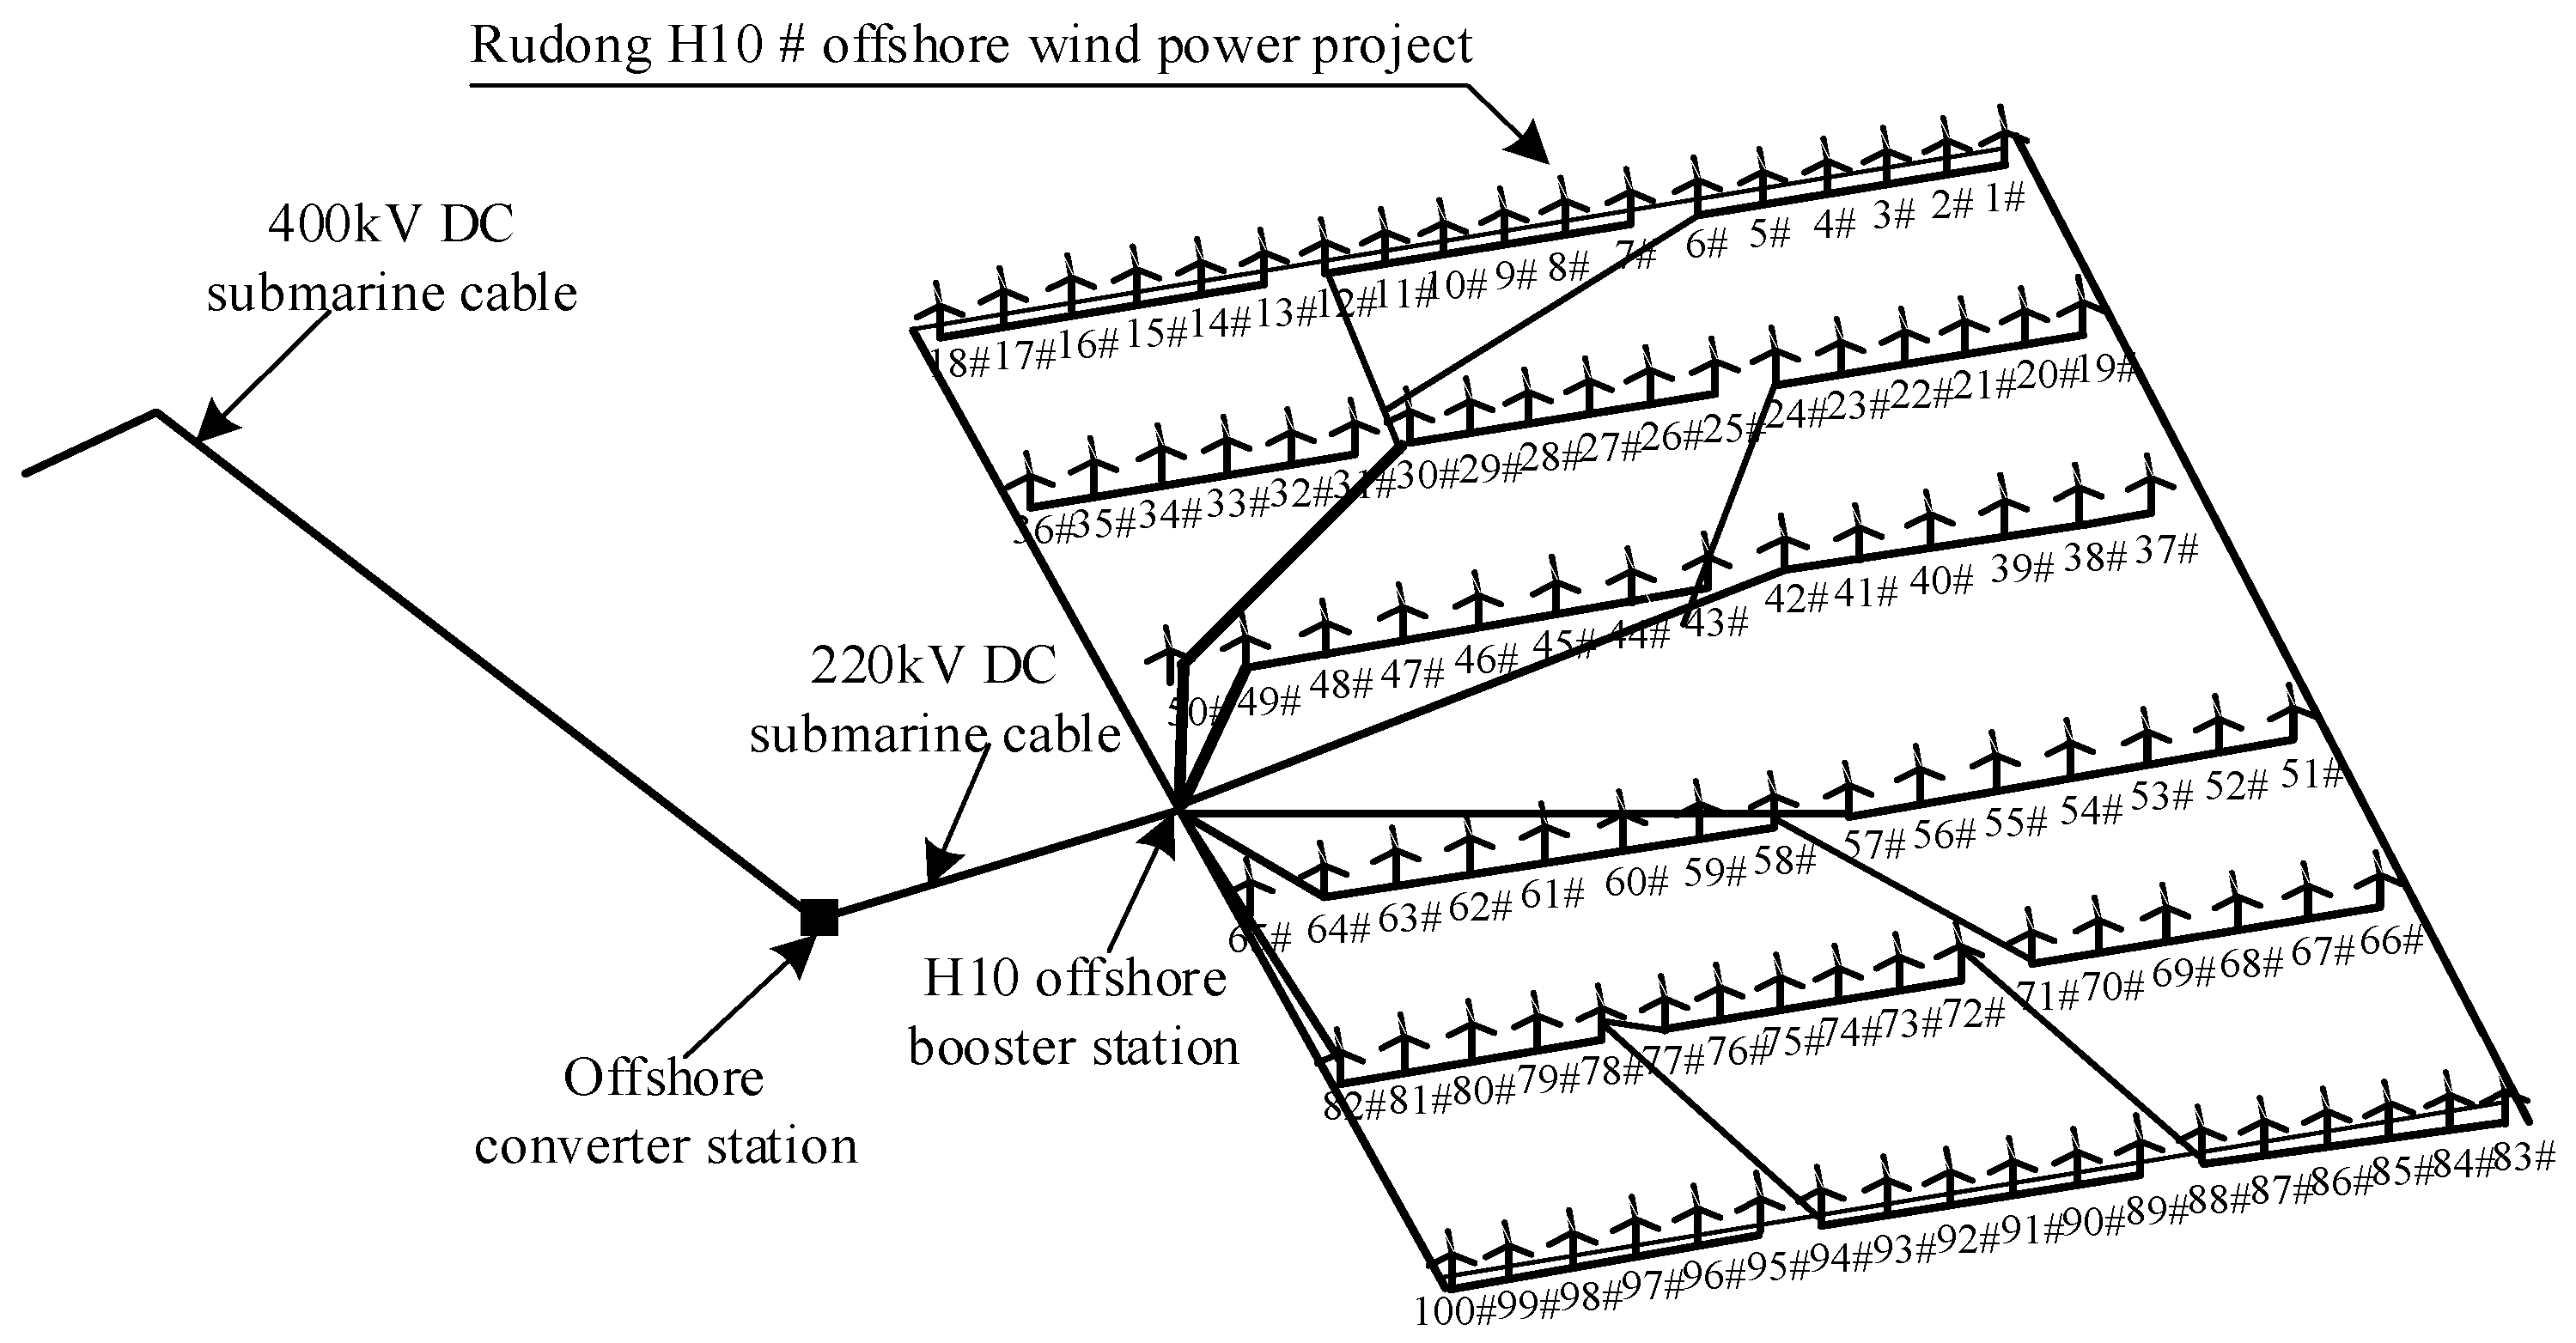
In the field of offshore wind power, submarine cables play a vital role as a key component in the transmission system. As can be seen from the following
Figure 3 of the Three Gorges Rudong H10 in-field collector line arrangement, submarine cables are required to connect from within the nacelle of the wind turbine to the nacelle and under the tower to the box-type transformer at the bottom of the tower, or in the vast sea area between the wind turbine and the turbine and between the wind turbine and the offshore booster station. However, the high investment cost of submarine cables has become a major challenge for offshore wind projects, especially if the wind farms are far away and the transmission distance is more than 70 km, and the cost of submarine cables accounts for a significant portion of the cost. In order to effectively reduce these costs and improve economic efficiency, it is particularly important to study the effect of frequency increase on the amount of submarine cable capacity and investment cost.
3.1. Calculation of Submarine Cable Distribution Parameters Based on Finite Element Modelling
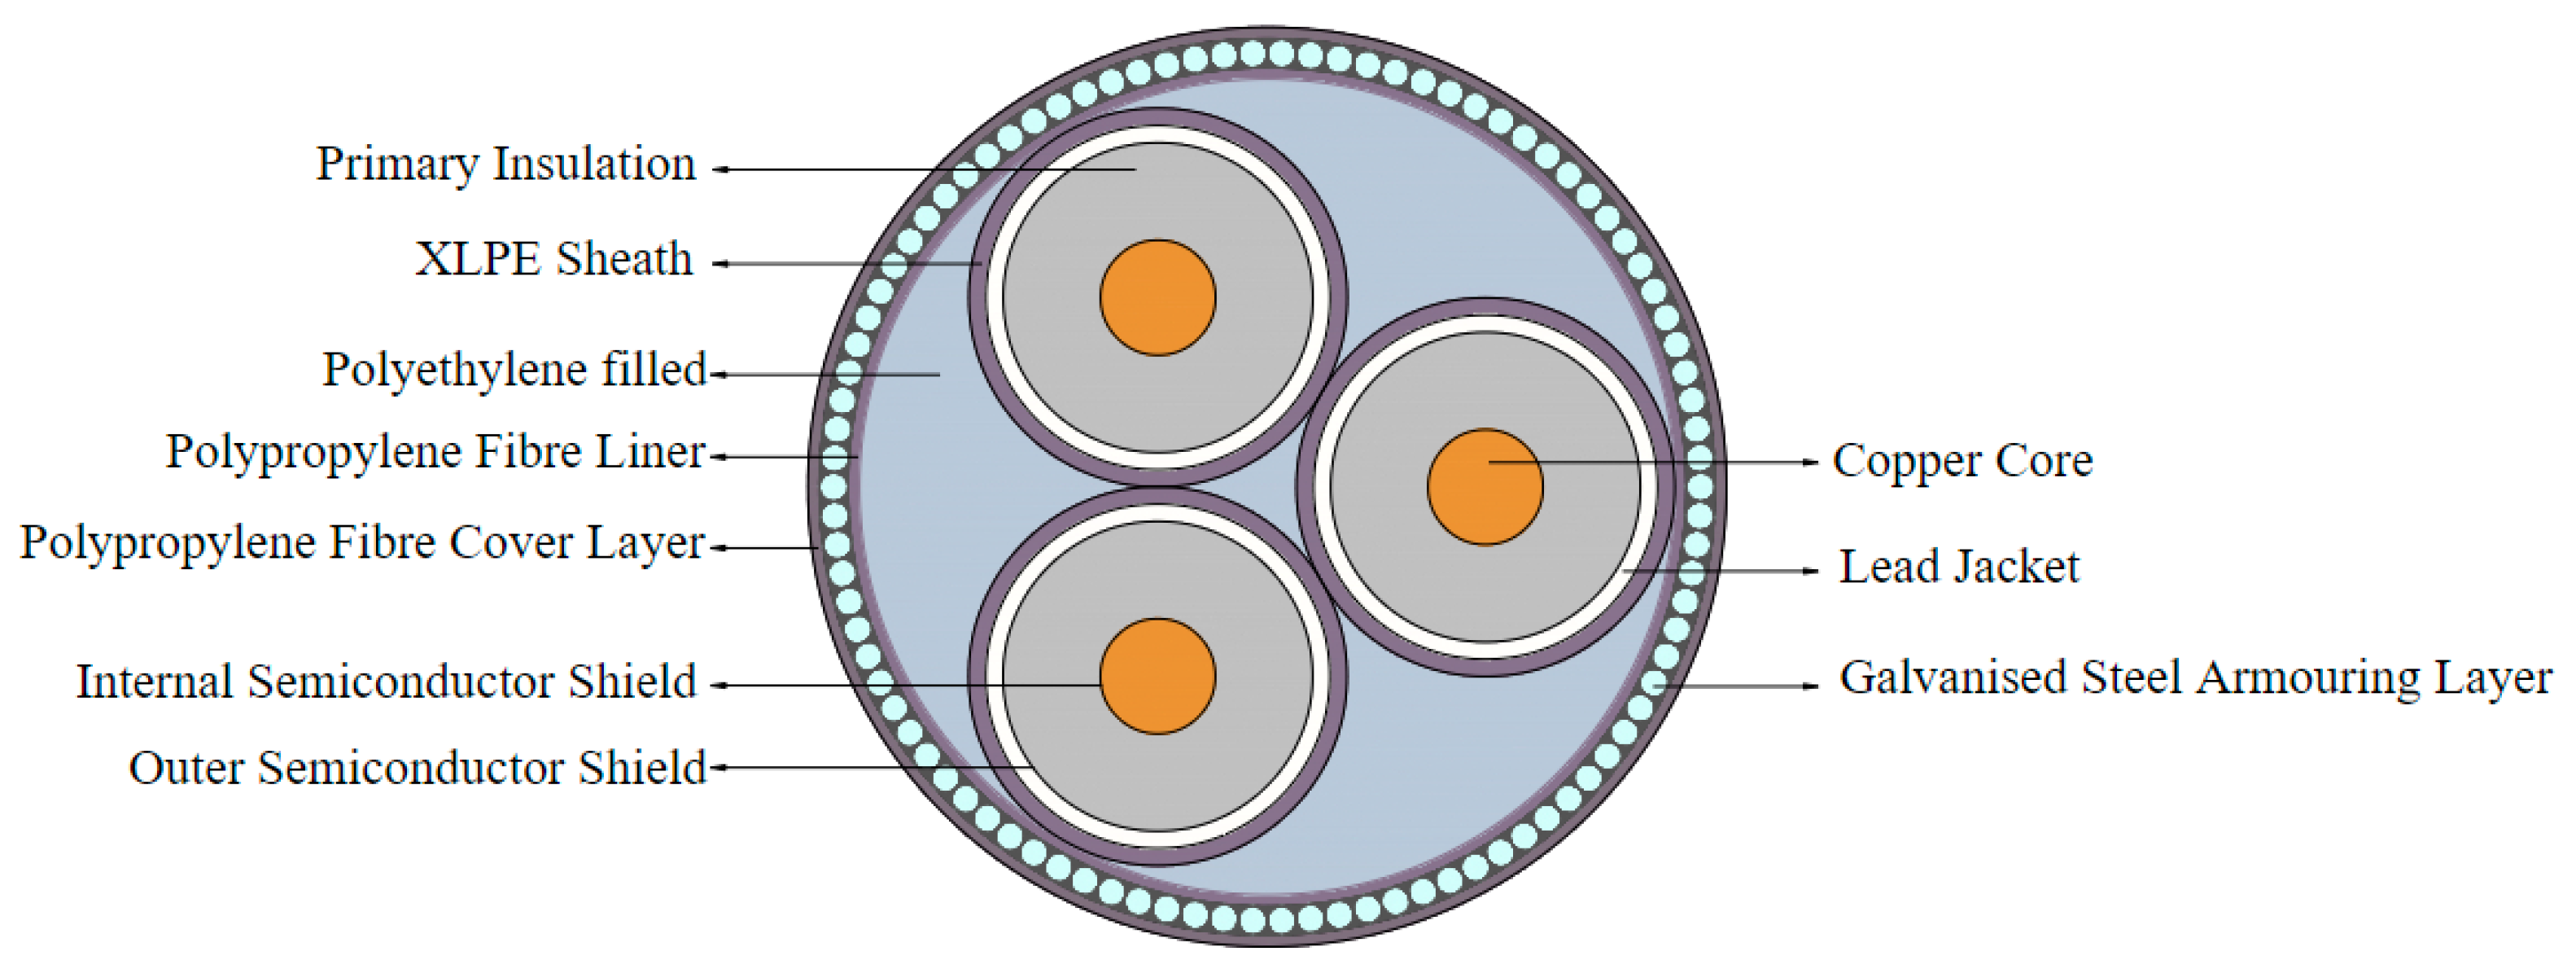
Currently, both MATLAB R2023b and PSCAD v4.6 are equipped with the function of transmission line parameter calculation. MATLAB is able to simulate the transmission characteristics of various cables through its powerful numerical calculation ability, and PSCAD has a frequency-dependent phase domain model (FDPM), which can accurately reflect the frequency-variable effects of single-core coaxial cables. However, the calculation of parameters for multi-core submarine cables is usually simplified to the equivalent model of three single-core coaxial cables. This simplification ignores the coupling effect between the phase conductors inside the submarine cable, and this coupling will significantly affect the distribution parameters of the cable, leading to certain errors in the calculation results. In order to solve this problem, this paper proposes a more accurate calculation of the distribution parameters of the submarine cable based on the multi-physical field finite element analysis software, and the geometric model of the submarine cable is shown in
Figure 4 below.
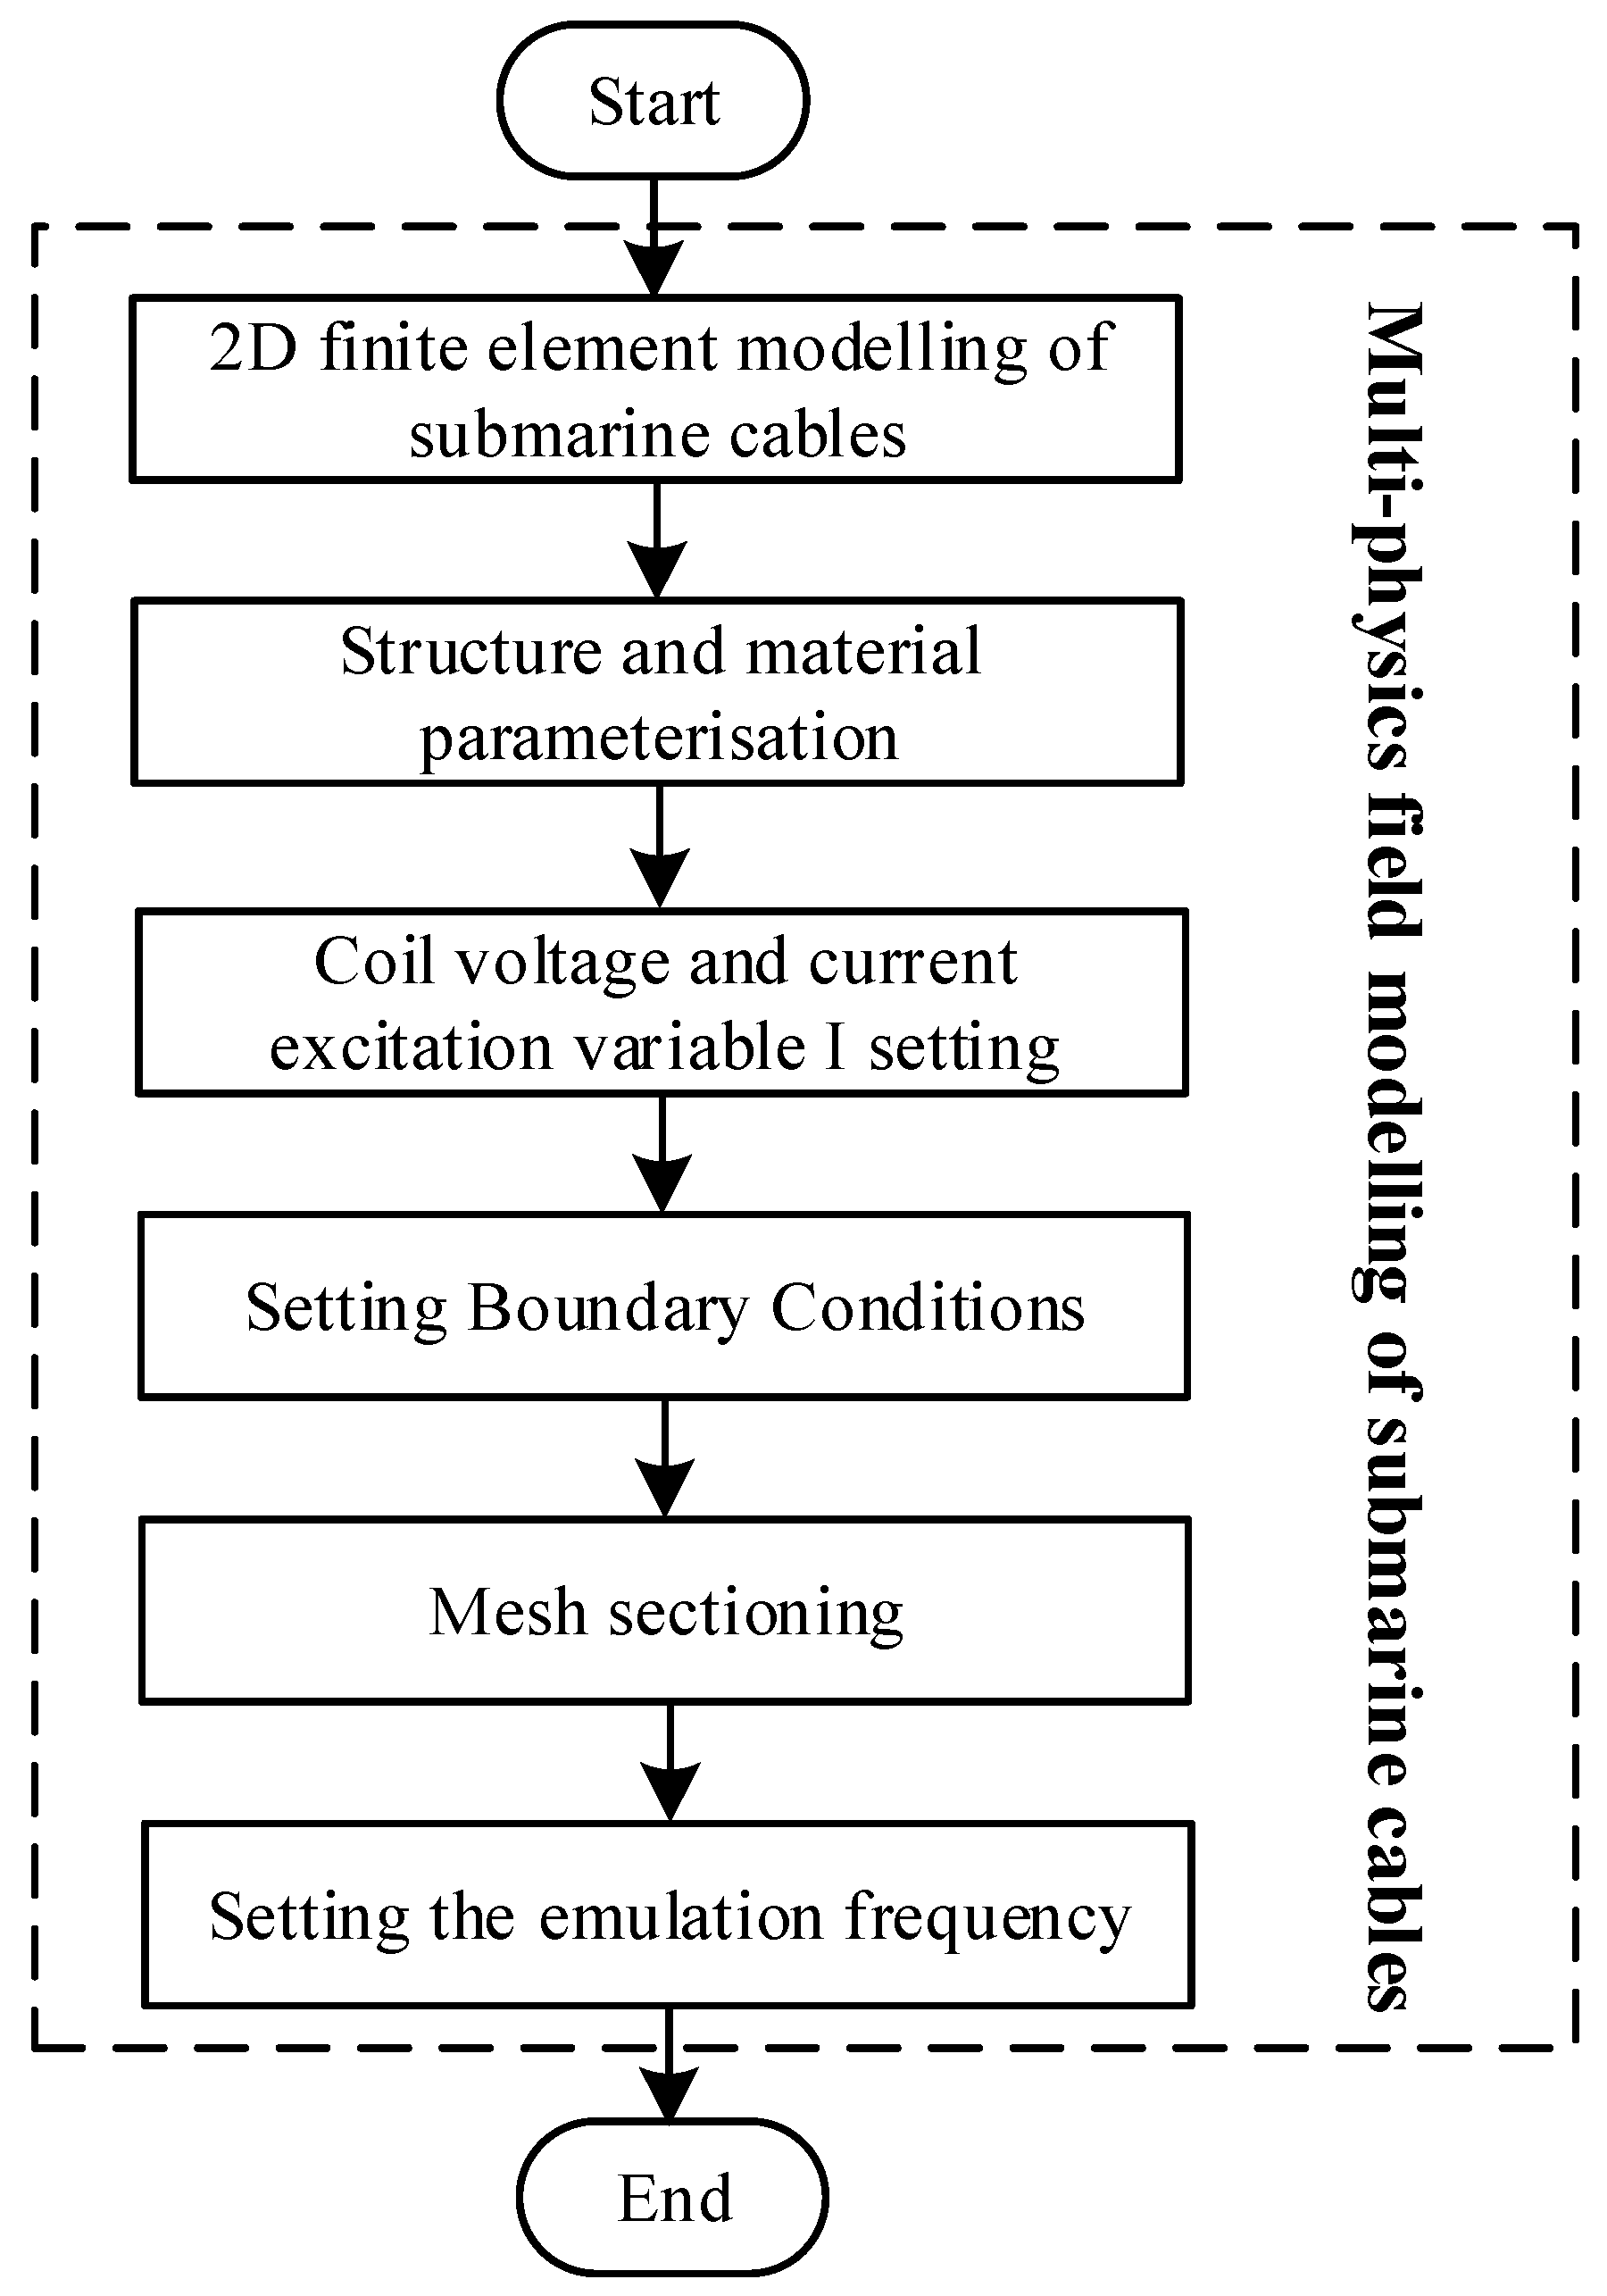
This paper uses finite element software to model the internal conductors of the cable and calculates the impedance distribution parameters of the submarine cable based on the finite element method. The specific modeling process is shown in
Figure 5: Firstly, according to the material parameters provided by the submarine cable supplier and based on the submarine cable structure, a two-dimensional finite element model of three-core armoured submarine cable with multi-physical fields is established; secondly, taking into account the electromagnetic coupling between the conductors, the coil current excitation variables and terminal voltage excitation variables are set, and the boundary conditions of the submarine cable are defined; next, based on the structure of the submarine cable and the finite element model, mesh delineation is carried out, and the quality of the meshing is checked to provide the accuracy of the calculation; finally, the simulation frequency is adjusted to 50–200 Hz, and a suitable solver is selected to calculate the impedance distribution parameters of the submarine cable. The frequency of 50 Hz is selected as the lower limit in order to fully reflect the impact of frequency increase on the economic performance of the offshore AC system; 200 Hz is selected as the upper limit; through theoretical studies and calculations, it is shown that after the frequency of more than 200 Hz, the current-carrying capacity of the submarine cable is obviously reduced, and the further increase in the frequency will reduce the economic performance of the whole offshore AC system.
As the frequency increases, the skin effect shortens the effective flow path of the current, causing the current to concentrate on the surface of the conductor at high frequencies. The actual effective cross-sectional area of the conductor decreases, thereby increasing the resistance per unit length of the submarine cable. The distribution of current changes the electromagnetic field inside the cable, which affects the calculation of inductance. Specifically, high-frequency signals may cause more changes in the electric field, further affecting the inductance of the current path and resulting in a slight decrease in the inductance value per unit length within a certain frequency range.
In this paper, the impedance parameters per unit length of 50~200 Hz submarine cables are calculated, and the results of the capacitance parameters per unit length of typical submarine cables applicable to industrial frequency AC systems are derived, as shown in
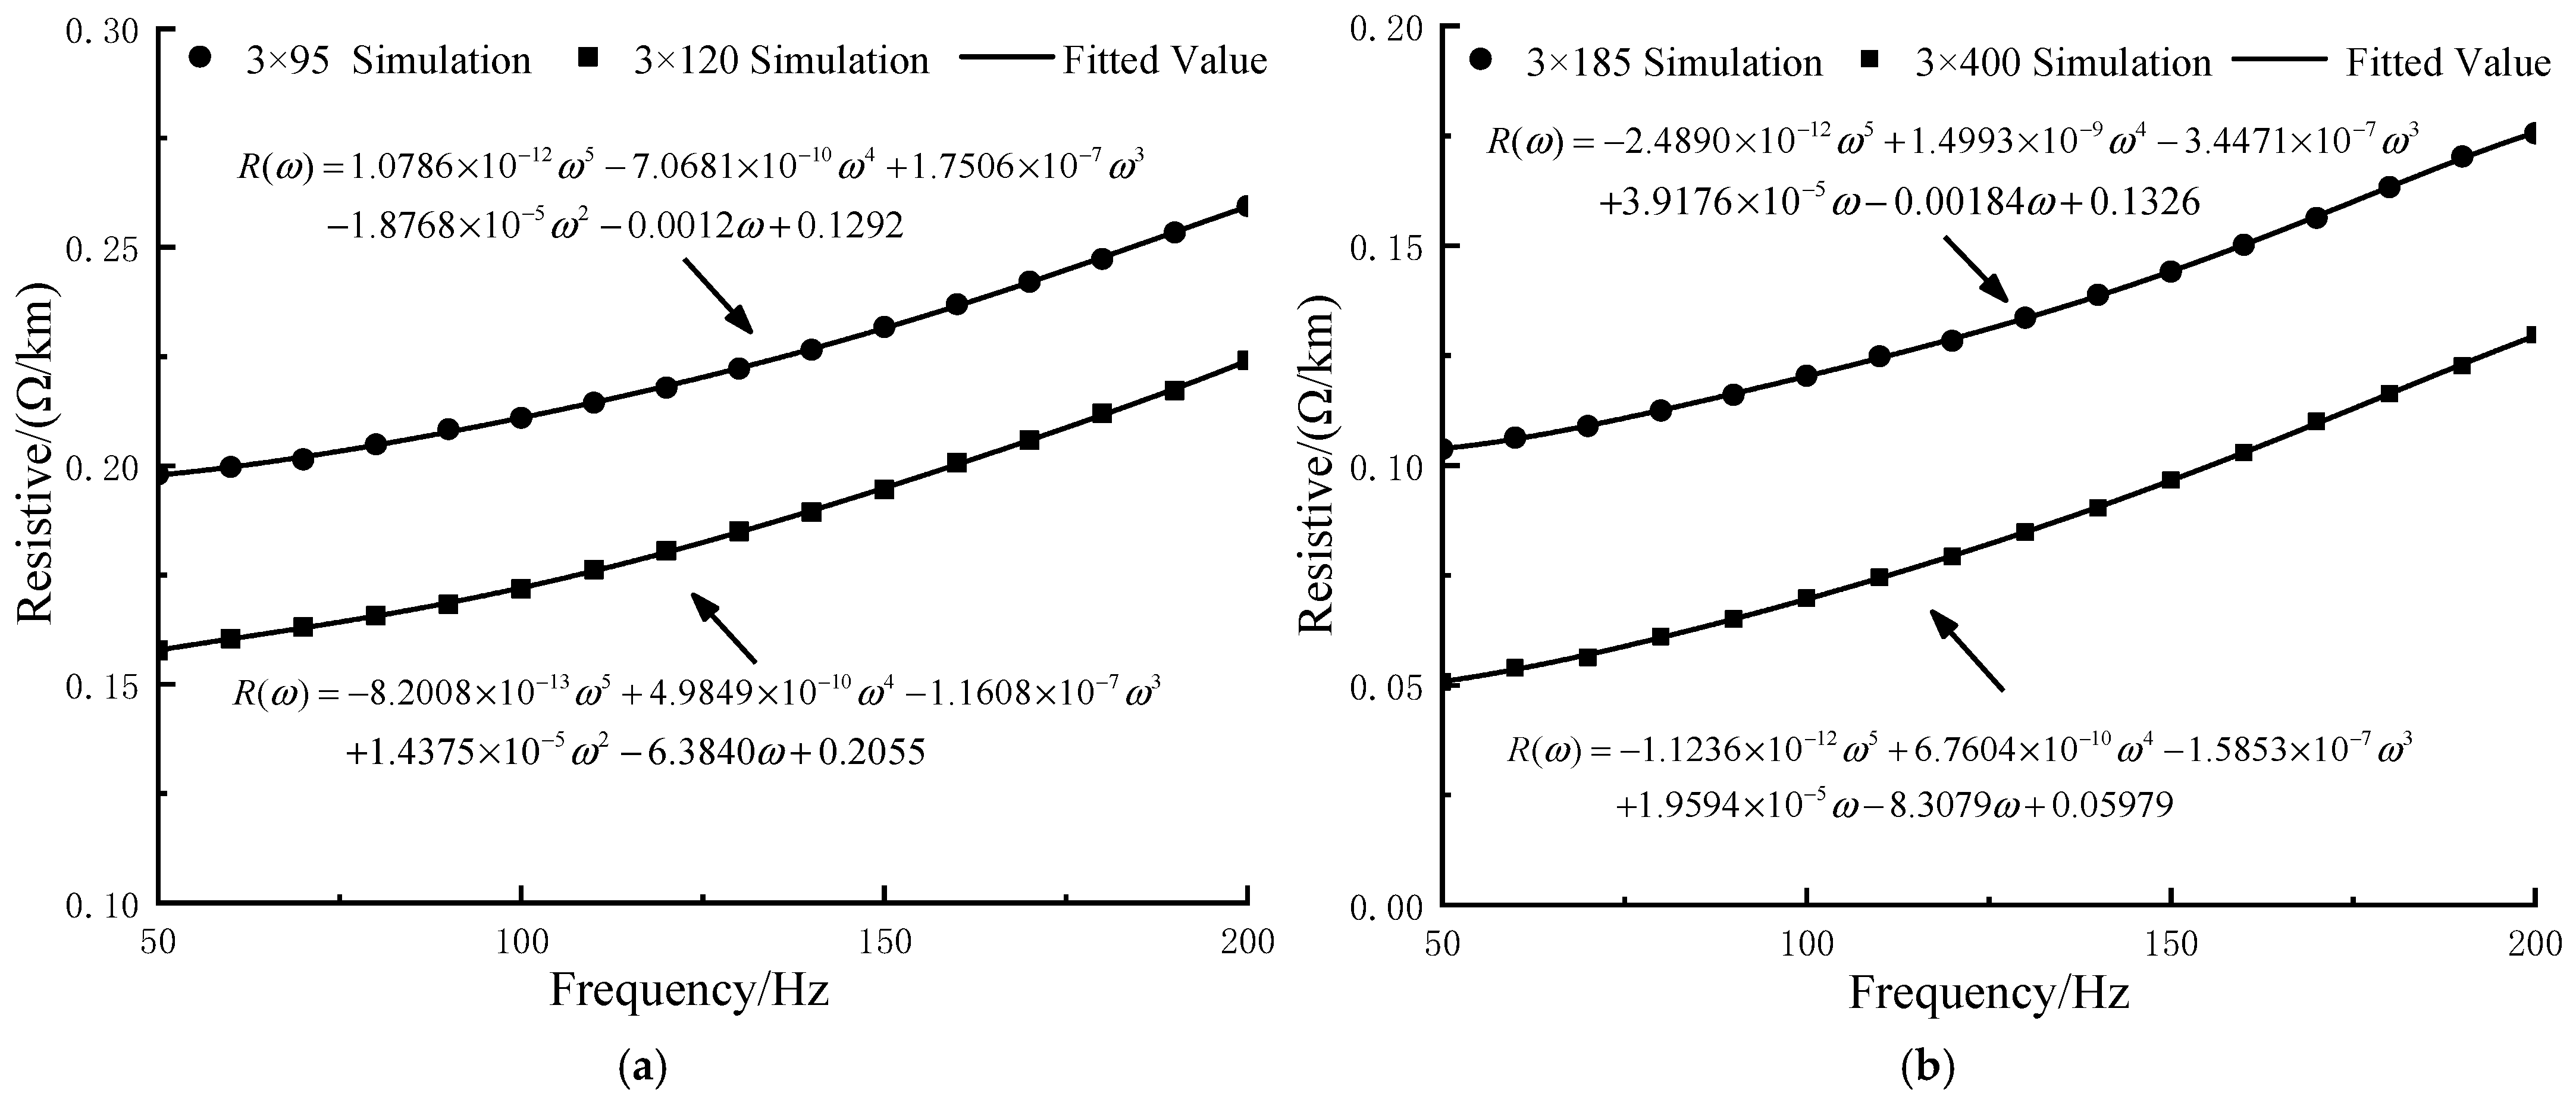
Table 1. In order to consider the influence of frequency variation on the impedance of submarine cables, this paper adopts a multi-physical field finite element model for modelling the internal conductors of the cable and combines the distribution parameter calculation method to analyse the frequency variation effect and skin collection effect of submarine cables. In the simulation process, the frequency characteristics of the resistance and inductance per unit length of the submarine cable are accurately fitted by polynomial fitting (95% confidence level), and the result is shown in
Figure 6 below.
Based on the simulation fitting results, it can be seen that in the frequency range under study, the resistance per unit length of the submarine cable increases with frequency due to the skin effect and proximity effect of the conductor, while the induced currents on the metal layers produce additional losses, thus increasing the AC resistance of the submarine cable even more. The inductance of submarine cables is affected by the interaction between multiple metal layers, and the induced currents on the shielding layer enhance the weakening effect of the cable’s magnetic field when the frequency increases, thus reducing the value of the submarine cable inductance. In addition, as the cross-sectional area of the conductor of a submarine cable increases, the resistance and inductance values of the cable will decrease. For the same frequency, the larger the cross-sectional area of the submarine cable, the lower the resistance and inductance values per unit length, but the larger the capacitance value per unit length.
3.2. Analysis of Submarine Cable Transmission Capacity
Based on the distribution parameters per unit length obtained by the finite element method and combined with the calculation method of three-core cable current-carrying capacity in the IEC standard, since the IEC standard attributes the excessive power loss to armouring and fails to consider the influence of the armour layer’s helical rotating strand and magnetic field strength on the current-carrying capacity, as well as underestimates the sheath loss coefficients
λ1 and
λ2, the sea cable current-carrying capacity derived in this paper on the basis of the IEC standard formula, which can calculate the current-carrying capacity of three-core submarine cables more accurately.
where
λi is the sheath loss factor, and
Pc,
P1 and
P2 are the power losses of the single-phase conductor, sheath, and armour layer, respectively.
The loss factor formulae in the EC standard are based on the relationship given in (12) for tubular-type
SL cables with magnetic armour layers, which applies to single-core submarine cables with sheathing and armour layers connected at both ends by fixed points. In fact, regarding the sheath loss factor
λ1, there is no formula in Equation (12) specifically designed for three-core armoured submarine cables, and Equation (13) takes into account losses caused by circulating currents.
where
RS and
X are the AC resistance and reactance values per unit length, respectively, and
R is the DC resistance value. Factor 1.5 is an empirical value to simulate the loss of the armouring layer to the sheath of the submarine cable.
For three-core armoured submarine cables, the sheath loss factor
λ2 can be calculated according to the given Equation (14):
where the last term in parentheses considers the power loss of the armouring layer due to the shielding effect of the sheath;
RA and
dA are the values of the AC resistance of the armouring layer and the diameter of the armouring layer, respectively, and
c is the distance from the axis of the conductor to the centre of the submarine cable for each phase.
After obtaining the loss factors
λ1 and
λ2 by the above method, the submarine cable current-carrying capacity
Ir is calculated according to the formula in the IEC standard:
where
Ir is the current-carrying capacity of the submarine cable;
is the permissible temperature difference of the conductor;
Wd is the medium loss per unit length, and
Ti is the value of thermal resistance of the
ith layer per unit length.
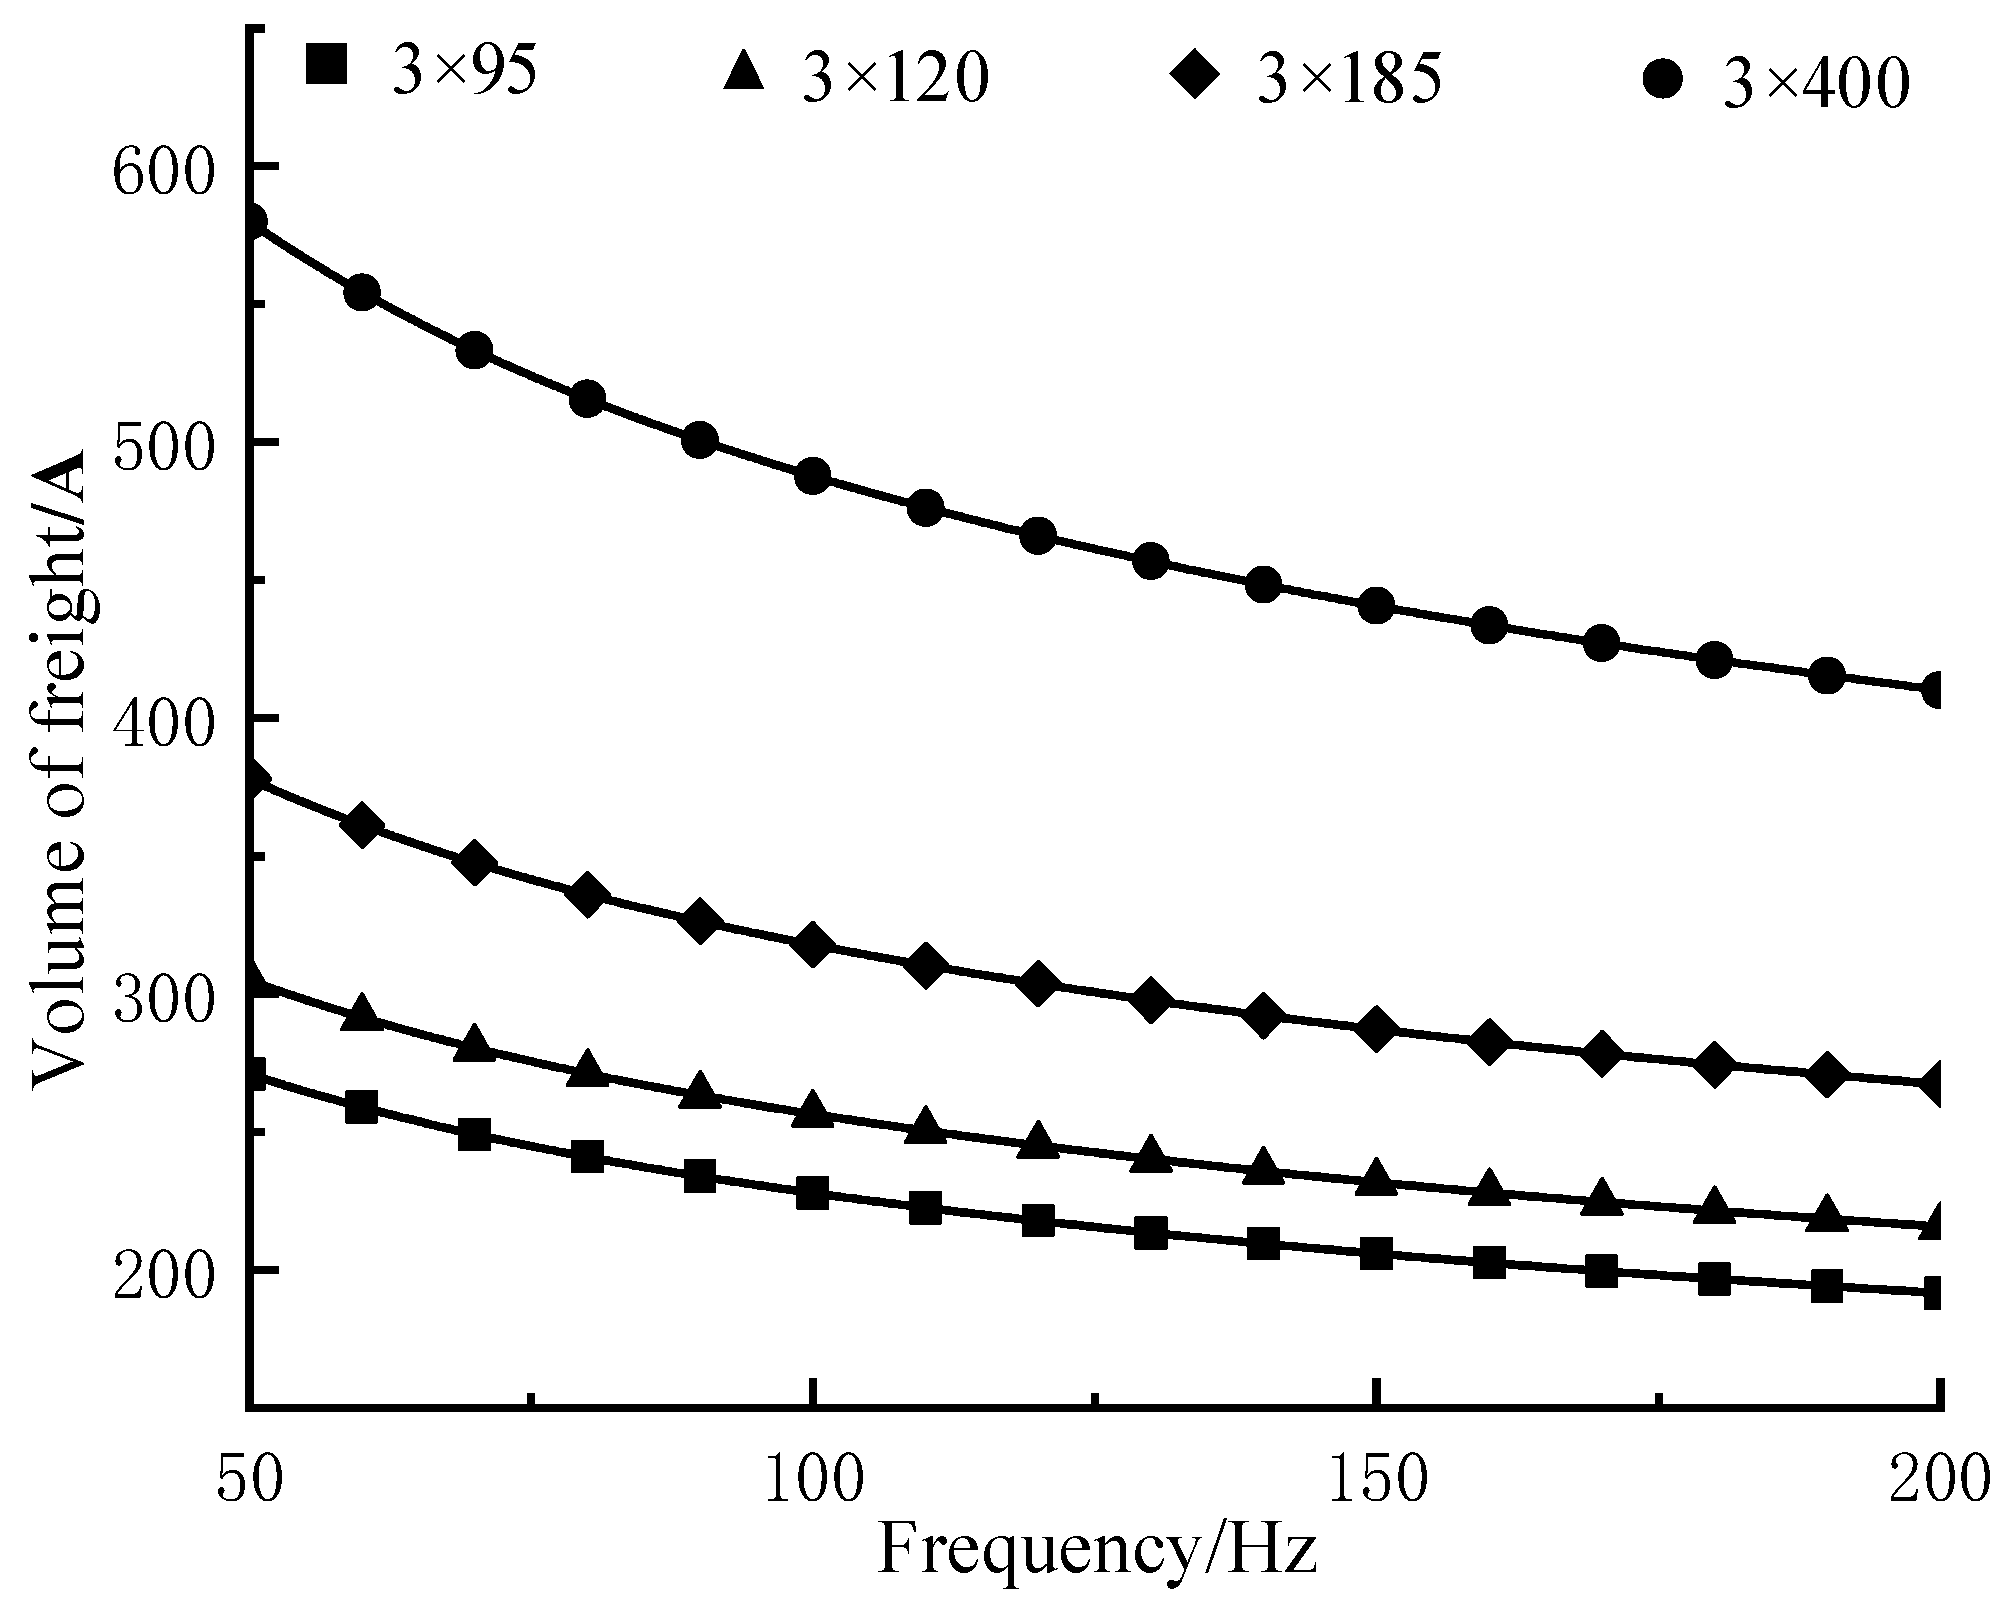
Calculations of the current carrying capacity of a typical type of submarine cable for AC grids in the frequency range of 50 to 200 Hz were carried out, and the results are shown in
Figure 7.
It can be seen that increasing the operating frequency of AC submarine cables leads to a decrease in the line carrying capacity. Therefore, in order to achieve the same active transmission capacity as industrial frequency AC pooling in an offshore wind farm of the same size, it is necessary to use a larger conductor cross-section submarine cable model or increase the number of cable circuits, thus increasing the investment cost of submarine cables.
4. Operational Losses in the Offshore Medium Frequency AC System
In offshore wind power systems, the change in operating frequency is mainly in terms of transmission line losses. However, theoretically, the change in AC pooling frequency also affects the transformer losses and converter losses. Therefore, in this section, the collection system operating losses, transformer losses, and converter losses are analysed separately.
4.1. Collector System Operating Losses
The power loss
PLL of an AC line is mainly determined by the line current and line resistance. Assuming that the current of the submarine cable consists of active and reactive currents
Ip and
Iq, and that the total current
IL contains the components of both, it can be expressed as
According to the line loss equation, the power loss
PLL of AC submarine cable can be expressed as
where
Rac is the AC resistance of the AC submarine cable.
An increase in the operating frequency will result in an increase in the reactive current charging the capacitor to ground in the medium frequency AC submarine cable, and therefore, the total current IL will increase, especially if the same active power is being transmitted, and a system with a high operating frequency will result in a larger line current. This change implies that if the frequency is increased, the same active power will generate higher reactive currents, which, in turn, will increase the total current, thus increasing the line losses.
According to the current relationship, the current after the frequency increase can be expressed as
where
f0 is the operating frequency;
f00 is the reference frequency, and Δ
f is the amount of frequency change.
The skin effect causes the current in the submarine cable to tend to flow along the surface of the conductor as the frequency increases, thus increasing the resistance
Rac. The effect of this phenomenon can be described by the skin factor
αR. The skin factor increases with frequency, resulting in an increase in resistance as well. According to the equation in the text, the relationship between the AC resistance
Rac under the influence of skin effect and frequency
f0 is
where
Rdc is the DC resistance;
α0 is the reference skin factor;
f00 is the reference frequency.
Therefore, as the frequency increases, the AC resistance of the submarine cable increases, which, in turn, increases the power loss of the line. Taking into account the effect of frequency change on current and resistance, the effect of total power loss
PLL with increasing frequency
f0 can be expressed as
where both
IL(
f0) and
Rac(
f0) are functions of frequency. It can be approximated and estimated as
As a result, the power loss PLL(f0) of the AC submarine cables will increase significantly with increasing frequency, and the effect of the skin effect will be more pronounced in the case of large frequency variations, leading to an increase in the resistance and an increase in the total current. Accordingly, increasing the operating frequency of the AC collector system will increase the operating loss of the AC submarine cable therein.
4.2. Transformer Losses
In offshore wind power systems, transformer losses mainly include core losses and winding losses, both of which are significantly affected as the operating frequency increases. Compared with industrial frequency transformers, the core loss density and winding loss density usually increase due to its higher operating frequency, but its volume and coil length are smaller, and the change in overall loss needs to be considered comprehensively.
The core loss consists of two components, hysteresis loss (Phys) and eddy current loss (Pedd), which are dependent on frequency and magnetic induction, respectively.
- (1)
The hysteresis loss Phys is proportional to the square of the frequency and is expressed as
where
kh is the material coefficient of hysteresis loss;
f0 is the operating frequency of the transformer;
Brms is the rms value of magnetic induction, and
Vt is the volume of the transformer core.
The eddy current loss
Pedd is mainly affected by the frequency, which is proportional to the square of the frequency and is expressed as
where
ke is the material coefficient of eddy current loss, and
Bm is the maximum value of magnetic induction.
Therefore, the core loss
Pcor is
- (2)
Winding losses consist of losses in the primary and secondary windings, which are affected by the current magnitude and skin effect. Considering the increase in frequency, the skin effect leads to an increase in resistance per unit length, which in turn increases the losses.
Primary winding losses:
where
It1 is the current in the primary winding, and
Rt1 is the resistance per unit length of the primary winding.
Secondary winding losses:
where
It2 is the current in the secondary winding, and
Rt2 is the unit length resistance of the secondary winding.
The unit length resistance increases due to the fact that an increase in frequency leads to the skin effect. Therefore, the unit resistance of the winding increases with increasing frequency and can be expressed in terms of the skin effect factor:
Thus, the total loss in the winding can be expressed as
In summary, the total loss of the transformer includes core loss and winding loss. Medium frequency transformer loss compared with the industrial frequency transformer, core loss, and winding loss will increase with the increase in frequency; the specific performance is as follows:
Since medium-frequency transformers are usually smaller in size and winding length than industrial-frequency transformers, the increase in overall losses is not necessarily significant, although the loss density increases. Compared with the industrial frequency transformer, the core loss density and winding loss density of the medium frequency transformer are larger. However, from the above analysis, it can be seen that the volume and coil length of the medium frequency transformer are smaller than the industrial frequency transformer for the same capacity. Therefore, the use of a medium-frequency AC pooling scheme has little effect on the transformer losses [
21].
4.3. Converter Loss
The converter loss is mainly composed of two parts: the conduction loss and the switching loss of the internal power electronics. At different operating frequencies, the conduction loss is basically not affected by the operating frequency of the AC system, but the switching loss is greatly affected by the operating frequency. This paper takes the diode rectifier-based offshore wind farm as the research object, and on the basis of analysing the influence of AC grid frequency fluctuation on converter operation loss, uses the parameter table data to establish the diode conduction voltage drop, switching loss with the current of the fitted functional relationship, and combines with the actual working conditions to determine the corresponding converter operation.
A diode incurs losses during conduction, which are directly related to the diode’s on-state voltage drop
VD and the average current flowing
Iavg. The conduction loss
Pcond can be expressed as
where
VD is the on-state voltage drop of the diode, which is usually a relatively constant value but may rise slightly at high currents, and
Iavg is the average conduction current of the diode.
In a medium frequency AC system, the average diode current
Iavg can be expressed by the peak current
Ipeak and the AC waveform frequency
f for a full wave rectifier:
Bringing Equation (31) into Equation (30) gives
From Equation (31), it can be seen that the conduction loss of the diode is not directly related to the frequency, so it does not change directly with the increase in frequency.
The switching loss of a diode is mainly affected by its reverse recovery characteristics. As the frequency of the AC system increases, the number of diode on–offs per second increases, resulting in the enhancement of the switching loss. The switching loss
Psw can be expressed as
where
f is the frequency of the alternating current;
Qrr is the reverse recovery charge of the diode, reflecting the charge consumed when the current returns to zero during reverse recovery of the diode, and
VDC is the average value of the rectified output voltage.
Qrr is usually closely related to the rate of rise of the current and the operating current, which increases at high currents. Consequently, switching losses increase with frequency and current.
Ultimately, the total loss
Ptotal of diode rectifiers in offshore wind farms, taking into account the effect of AC system frequency
f and current
Ipeak, can be expressed as
Table 2 gives the results of fitting the primary function of the relationship between the on-state voltage drop of the selected diode and the current and the results of fitting the quadratic function of the relationship between the diode switching energy loss and the current.
5. Case Study Analysis
5.1. Key Main Circuit Equipment Parameters
In this section of this study, a detailed comparative analysis of the Jiangsu Rudong offshore wind power delivery project is carried out, focusing on comparing the economics of diode rectifier (DRU) technology applied in offshore wind power systems. In the calculation process, it is assumed that the rated capacity of the offshore wind power DC delivery system is 1000 MW, and the rated voltage of the DC transmission system is ±320 kV. These parameters reflect the scale and technical level of the more common offshore wind power delivery systems and are representative to a certain extent. In order to assess the economics of the different pooling schemes, a detailed analysis of the medium-frequency AC pooling scheme was carried out. In this scheme, the rated operating frequency of the AC pooling system of an offshore wind farm is set to 100 Hz.
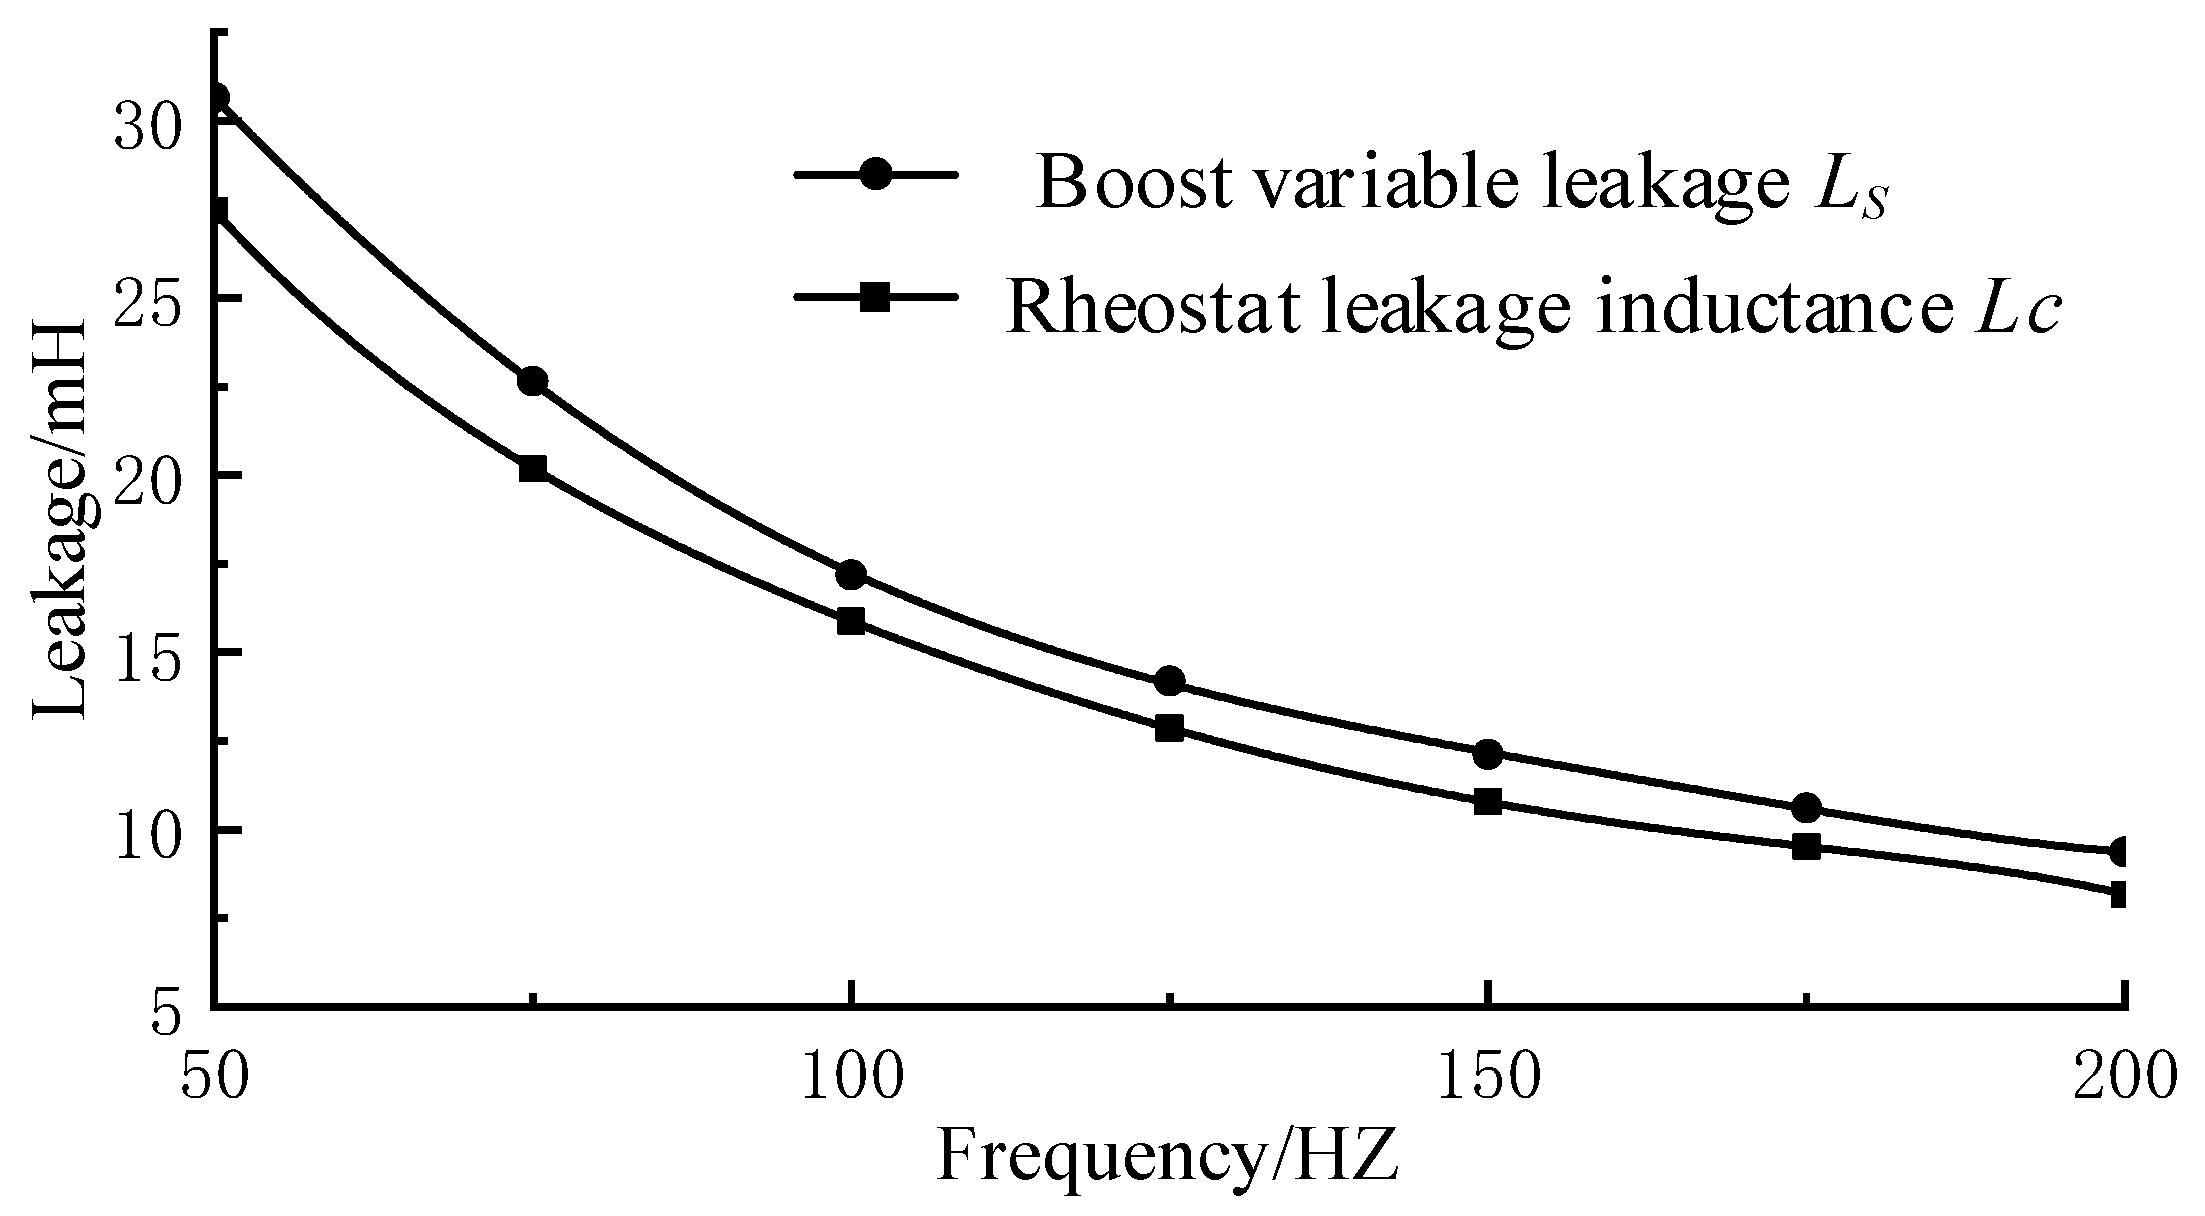
This study shows that when the rated operating frequency of the wind farm is increased from 50 Hz to 100 Hz, the leakage inductance value of the transformer decreases significantly. As shown in
Figure 8, the leakage inductance of the step-up transformer decreases from 32.6 mH to 15.6 mH, while that of the converter transformer decreases from 28.3 mH to 13.8 mH. This change indicates that increasing the rated operating frequency of the wind farm can effectively reduce the leakage inductance of the transformer, which, in turn, reduces the energy loss in the transmission of power and improves the overall efficiency of the system.
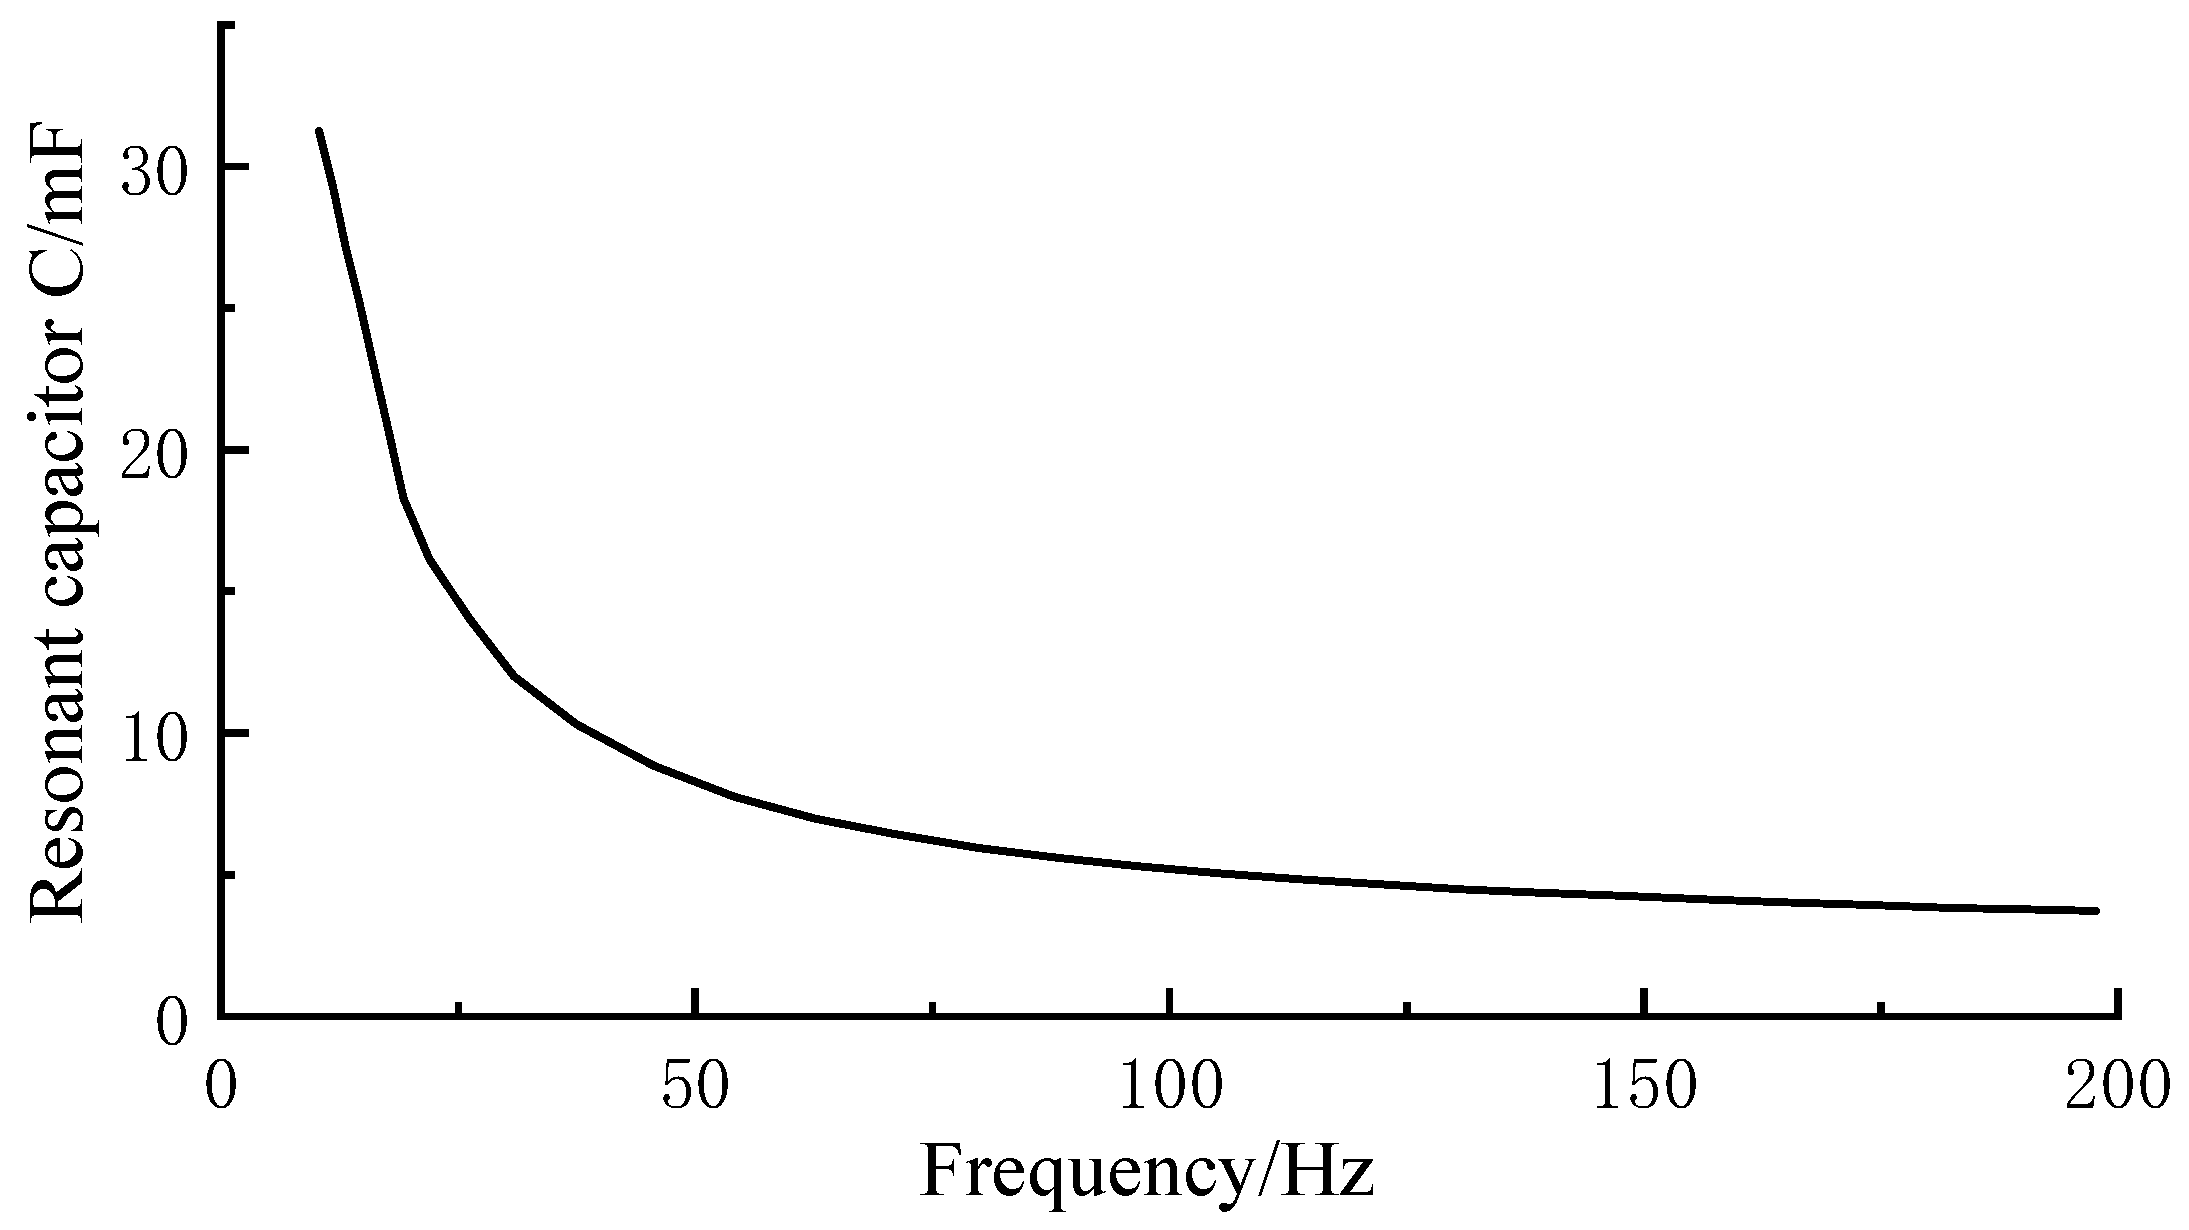
The resonant capacitance and inductance of the AC filter changed significantly when the rated operating frequency of the wind farm was increased from 50 Hz to 100 Hz. Specifically, four sets of equal-capacity double-tuned filters are used, in which the tuning times are 11.98 and 23.98, respectively. With the increase in the wind farm operating frequency, as can be seen from
Figure 9, the resonant capacitance
C1 of the filter decreases from the original 8.2352 μF to 5.1471 μF. As can be seen from
Figure 10, the resonant inductance
L1 decreases from 6.0174 mH to 4.1983 mH. Therefore, increasing the rated operating wind farm frequency not only helps to reduce the resonant capacitance and inductance of the AC filter but also effectively optimises the performance of the filter.
5.2. Investment Cost
In the design and implementation of offshore wind power DC delivery systems, the choice of different frequency pooling schemes can significantly affect the overall investment cost. Compared to the conventional industrial frequency AC pooling scheme, the investment cost of the medium frequency AC pooling scheme is higher, which is mainly reflected in several key equipment parts: AC cables, offshore booster stations, and offshore converter stations.
In carrying out the calculation of the investment cost of the AC submarine cable, reference was made to the typical projects in China, such as the East China Sea Wind Power Delivery Project, and analysed in conjunction with the relevant technical standards. The carrying capacity of the submarine cable is initially selected based on the calculation results under 50 Hz industrial frequency operating conditions to ensure sufficient transmission capacity in practical applications.
According to the calculation of cable distribution parameters and carrying capacity in Chapter 2 of this paper, the investment cost of AC submarine cable for a medium-frequency pooling system can be obtained. According to the calculation results in
Table 3 and
Table 4, it can be found that the cross-sectional area of the AC submarine cable of the medium frequency pooling system is larger, which means that in order to meet the higher transmission demand and more stable operation conditions, the medium frequency pooling system needs to use a larger specification of submarine cable than the conventional industrial frequency AC pooling scheme. As a result, the investment cost of the cables required for the medium frequency AC pooling scheme is about 20 per cent higher than that of the conventional industrial frequency AC pooling scheme.
In the construction of offshore wind farms, the manufacturing cost of the step-up transformer
Ct and the manufacturing cost of the offshore booster station platform
Css are the main cost factors affected by the rated operating frequency of the wind farm AC system
f0. As the frequency increases, the design and manufacturing requirements of the step-up transformers and platforms may change, thus affecting their costs. In order to quantify this effect, this paper uses (35) and (36) to estimate the relationship between the cost of manufacturing the step-up transformer, the manufacturing cost of the platform, and the rated operating frequency of the wind farm AC system.
In the conventional flexible DC transmission scheme,
Cts(50) and
Css(50) represent the cost of step-up transformer manufacturing and offshore booster station platform manufacturing, respectively, and their specific values can be referred to the actual data of the domestic Rudong offshore project. This study shows that the topology of the DC transmission system does not significantly affect the design of the offshore wind farm booster station. Therefore, in the economic analysis, Equations (35) and (36) can be used to calculate the offshore wind power DC delivery system based on the diode rectifier scheme, and the results obtained are shown in
Table 5.
Due to the lack of actual engineering data, for the cost estimation of the offshore DRU converter station, it is assumed that its weight is similar to that of the offshore MMC converter station in the conventional flexible DC delivery scheme using the same AC convergence frequency. Then, the cost of the DRU offshore converter platform can be estimated using Equation (37). This approach provides a reasonable estimation framework by comparing the weight similarity of the two converter stations.
In the medium-frequency AC pooling scenario, the cost of the offshore booster station is reduced by approximately 28 per cent compared to the conventional industrial frequency AC pooling scenario. The key factor in this reduction is the reduction in the cost of the offshore booster platforms themselves; specifically, the cost of the offshore booster platforms is reduced by $97 million compared to the conventional scheme. Similarly, the cost of the offshore converter station has decreased significantly by approximately 26 per cent compared to the conventional industrial frequency AC convergence scheme, with the key factor in this decrease being the $38.618 million reduction in the cost of the offshore converter platform itself.
For wind turbines, the impact of the frequency increase on various key components is mainly felt in the wind turbine’s box transformer and LC filter. The frequency uplift effectively reduces the size and weight of these components, thus helping to reduce the burden on the system and improve overall efficiency. However, although frequency jacking has some impact on the size and weight of the wind turbine’s box transformers and LC filters, the impact of frequency changes on the overall economics and investment costs of the wind turbine is limited and almost negligible, as the cost of these components is a relatively small proportion of the total cost of the wind turbine (usually less than 2 per cent). In addition, the change in frequency does not have a significant impact on the investment cost of the turbine’s grid-side inverter; the initial investment in the inverter remains the same. However, the frequency increase may lead to a certain increase in operating losses, but through reasonable optimisation of design and control measures, it is possible to keep the operating losses at the same level as the industrial frequency system, thus avoiding unnecessary additional operating costs.
As a result, thanks to the optimal design of the medium frequency AC pooling scheme, As shown in
Table 6, the investment costs associated with the offshore wind DC delivery system have been reduced by a total of about
$50 million. These cost reduction measures not only reflect the progress of technology, but also provide an important reference for the economic efficiency improvement of similar projects in the future.
5.3. Operating Losses
In this section, the operating losses of AC submarine cables for offshore wind power are estimated by assuming that the utilisation rate of the submarine cables’ current-carrying capacity is 100%, i.e., the operating currents of the corresponding lines are determined in accordance with the maximum current-carrying capacity of each type of submarine cables in
Table 4. Then, based on the impedance parameters of the lines in
Table 3 and
Table 4, the losses of the AC cables were calculated under both industrial and medium frequencies, respectively. Based on the results of the calculations in
Table 7, it is concluded that the cable losses are significantly reduced by about 20% using the medium frequency pooling method compared to the conventional industrial frequency pooling method. The main reason for this difference is that the medium frequency pooling method uses a larger cross-sectional area of the submarine cable, which correspondingly has a lower resistance per unit length, thus reducing the power loss.
However, while the use of medium-frequency pooling can effectively reduce losses, it also brings additional investment costs. By reasonably selecting the type of submarine cable and optimising the design, the impact of the medium frequency pooling method on the enhancement of cable loss can be reduced to a certain extent, but this will be accompanied by an increase in investment expenditure. Therefore, in practical application, it is necessary to comprehensively consider the balance between the reduction in cable loss and the increase in investment costs to ensure the optimal combination of economy and efficiency of system design.
In calculating the losses of the offshore converter platform, the converter (DRU) of the offshore converter station is taken as an example to study in depth the influence of the AC convergence frequency change on the operating losses of the converter of the offshore wind farm. Based on the relationship between the on-state voltage drop and switching loss of the diode and the current given in
Table 2, the corresponding function fitting relation equation is established. In the specific calculation process, a single converter contains 160 series diodes inside; based on this, the corresponding offshore converter station DRU operation loss calculation results under different AC convergence schemes are shown in
Table 8. It can be seen that the switching loss accounts for about 3–5% of the total operating loss of the converter. Compared with the traditional industrial frequency AC pooling scheme, the increase in the converter operation loss in the medium frequency AC pooling scheme is about 0.06 MW, which accounts for about 2% of the total loss. Therefore, overall, the medium frequency AC pooling scheme has a limited impact on converter losses and can still meet the operational requirements to a certain extent, and the benefits and technological advantages it brings may compensate for this small increase in losses.
A discounted future cash flow model has been used to assess the economic impact of operating losses on an offshore AC system based on diode rectification. The core purpose of the model is to provide a detailed assessment of the AC transmission line and its loss costs over its entire life cycle. For the purposes of a sound economic assessment, it was assumed that the price of electricity per kWh was
$0.8, and the annual usage time of the wind turbines was 3000 h, which meant that the actual amount of electricity generated by the wind farm each year would be based on this length of time of usage, and the lifecycle of the project was set to be 20 years, with an interest rate of 5% per annum, yielding a series of results for the economic assessment based on these settings, as shown in
Table 9. These results provide the basis for the economic feasibility analysis of the project, helping to assess the impact of different operational losses on the overall economics and whether the project has sufficient economic returns to offset the long-term operational costs and losses.
It can be seen that the medium frequency AC pooling scheme has a significantly lower operating loss cost of about $15.4 million compared to the conventional industrial frequency AC pooling scheme, which translates into a reduction of nearly 19 per cent. This shows that the medium frequency AC pooling scheme has a greater advantage in reducing losses in the power transmission process. Further analysis reveals that the AC submarine cable operation loss cost for the medium frequency AC pooling scheme is reduced by $115 million compared to the conventional industrial frequency scheme. This difference indicates that the medium frequency AC pooling scheme can effectively reduce the losses of AC cables, thus significantly reducing the overall operating loss costs. This provides a useful economic reference for future projects, especially in optimising power transmission efficiency and reducing costs.
6. Conclusions
Aiming at the problems of economy and reliability of the medium- and long-distance offshore wind power delivery system, this paper proposes a diode rectifier-based low-cost delivery system for medium- and long-distance offshore wind power and carries out a detailed study. Compared with the traditional industrial frequency MMC-HVDC offshore wind power delivery system, the advantages of the delivery system proposed in this paper have the following two points:
(1) The medium-frequency AC convergence scheme effectively reduces the size and investment cost of conventional modular multilevel converter ancillary equipment (e.g., AC filters and offshore transformers) by adopting DRU diode rectification. Although the introduction of intermediate-frequency AC filters will increase the investment cost of the system, the reasonable design of the filter structure can effectively reduce the investment cost of the filter. Compared with the cost of the entire rectifier platform, this scheme promotes the lightweighting of offshore converter stations and significantly reduces the cost of offshore booster platforms and converter platforms. It helps to reduce the total cost of the offshore wind DC delivery system, bringing higher economic benefits to the project and promoting the sustainable development of the offshore wind industry;
(2) The medium-frequency AC pooling scheme has the problems of reduced transmission capacity and increased operational losses of the submarine cable compared with the industrial-frequency AC pooling scheme, mainly because the high frequency will lead to a reduction in the transmission efficiency of the submarine cable. In order to alleviate this problem, the loss can be reduced by increasing the cross-sectional area of submarine cables, although this practice will increase the initial investment cost; but, after considering the impact of frequency changes on the investment of equipment, system operation and maintenance costs, the medium-frequency AC pooling scheme shows greater economic advantages. Especially in long-term operations, by optimising equipment volume, reducing maintenance costs, and improving system efficiency, the medium-frequency scheme still possesses a strong economy. Therefore, in large-scale deep-sea wind power projects, the medium-frequency AC pooling scheme has a better overall economic performance than the industrial frequency scheme.
However, increasing the working frequency can also bring some side effects. A major issue is that increasing frequency will reduce the maximum transmission length of submarine cables, as the capacitance effect makes the transmission capacity of the cable inversely proportional to frequency. But, this restriction has a relatively small impact on offshore wind farms, as wind turbines are typically deployed in smaller areas, and cable length is not a key limiting factor. In addition, with the increase in operating frequency, the power loss of the system will increase, including transmission loss, iron loss of transformers, and switching loss of wind turbine converters, which need to be considered in the design. Furthermore, the equipment currently used for offshore wind farms is mostly designed for 50/60 Hz, and a large amount of research and experimentation is still needed to adapt to intermediate-frequency electrical equipment.
Although the intermediate frequency AC convergence scheme has economic advantages, it still requires a lot of research and experimentation to develop electrical equipment suitable for intermediate frequency, especially for optimizing equipment in offshore wind power systems. Therefore, it is recommended that the government provide policy support, establish special funds, conduct technology research, establish development subsidies, encourage the wind power industry to strengthen cooperation with research institutions, and promote the research and innovation of related technologies. Wind power technology is the focus of global competition, especially for the COSCO offshore wind power system. International cooperation will help accelerate technological breakthroughs and application promotion. The government can strengthen its connection with the international market, promote cooperation with advanced countries in wind power technology, equipment manufacturing, and operation management, introduce advanced technology from Western countries, learn from mature experience, and promote the development of the domestic offshore wind power industry.
Author Contributions
T.X.—writing, reviewing and editing; Y.Z.—conceptualization, data curation, methodology, validation, writing—original draft; Q.Z.—review, investigation, and data curation; H.L.—supervision, validation, and project administration; L.H.—review. All authors have read and agreed to the published version of the manuscript.
Funding
This research was funded by the National Natural Science Foundation of China under Grant 41876096, the Youth Fund of Jiangsu Natural Science Foundation under Grant BK20201034, Postgraduate Research & Practice Innovation Program of Jiangsu Province (SJCX25_1270), Jiangsu Collaborative Innovation Centre for Distribution Network Intelligent Technology and Equipment under Grant XTCX202002, and the Major Project of Basic Science (Natural Science) Research in Jiangsu Province’s Universities 22KJA470005.
Institutional Review Board Statement
Not applicable.
Informed Consent Statement
Not applicable.
Data Availability Statement
Data are contained within the article.
Conflicts of Interest
The authors declare no conflicts of interest.
References
- National Energy Administration. China’s Wind Power Generation is “Heading Towards the Deep Sea” [EB/OL]. Available online: http://www.nea.gov.cn (accessed on 26 May 2025).
- Andersson, D.; Petersson, A.; Agneholm, E.; Karlsson, D. Kriegers Flak 640 MW off-shore wind power grid connection—A real project case study. IEEE Trans. Energy Convers. 2007, 22, 79–85. [Google Scholar] [CrossRef]
- Huang, M.; Wang, X.; Liu, S.; Wang, X.; Meng, Y.; Ye, R. Technical and economic analysis of split-frequency transmission applied to grid-connected deep-sea wind power. Power Syst. Autom. 2019, 43, 167–174. [Google Scholar]
- Xia, T.; Li, J.; Zhang, Y.; Yu, H.; Lu, K. Comparison and Optimization of a Magnetic Lead Screw Applied in Wave Energy Conversions. Electronics 2022, 11, 2825. [Google Scholar] [CrossRef]
- Tang, G.; He, Z.; Teng, L.; Yi, R.; He, W. Recent advances in voltage source converter high-voltage direct current transmission technology. Power Grid Technol. 2008, 291, 39–44+89. [Google Scholar]
- Wang, D.; Hu, P.; Cao, Y.; Syed, M. A Novel Post-Transient Voltage based Protection Scheme for DC Shipboard Systems. IEEE Trans. Transp. Electrif. 2025; early access. [Google Scholar] [CrossRef]
- Li, W.; Zhu, M.; Chao, P.; Liang, X.; Xu, D. Enhanced FRT and postfault recovery control for MMC-HVDC connected offshore wind farms. IEEE Trans. Power Syst. 2020, 35, 1606–1617. [Google Scholar] [CrossRef]
- Rong, Q.; Hu, P.; Yu, Y.; Wang, D.; Cao, Y.; Xin, H. Virtual External Perturbance-Based Impedance Measurement of Grid-Connected Converter. IEEE Trans. Ind. Electronics 2024, 72, 2644–2654. [Google Scholar] [CrossRef]
- Rong, Q.; Hu, P.; Wang, L.; Li, Y.; Yu, Y.; Wang, D.; Cao, Y. Asymmetric Sampling Disturbance-Based Universal Impedance Measurement Method for Converters. IEEE Trans. Power Electronics 2024, 39, 15457–15461. [Google Scholar] [CrossRef]
- Hu, P.; Li, Y.; Yu, Y. Frede Blaabjerg, Inertia estimation of renewable-energy-dominated power system. Renew. Sustain. Energy Rev. 2023, 183, 113481. [Google Scholar] [CrossRef]
- Wang, X.; Wang, X.; Wang, J.; Bie, Z. A preliminary study on the experiment of frequency-divided transmission system. China Electr. Power 1996, 29, 33–36+71. [Google Scholar]
- Xia, T.; Zhang, X.; Zhu, Z.; Yu, H.; Li, H. An Adaptive Control Strategy for Underwater Wireless Charging System Output Power with an Arc-Shaped Magnetic Core Structure. J. Mar. Sci. Eng. 2023, 11, 294. [Google Scholar] [CrossRef]
- Xia, T.; Li, Z.; Liu, H.; Zhang, Y.; Yu, H. Design of a Magnetic Field Modulated Screw Containing Composite Rotors for Wave Energy Conversion. IEEE Trans. Power Electron. 2024, 39, 13869–13878. [Google Scholar] [CrossRef]
- Domínguez-García, J.L.; Rogers, D.J.; Ugalde-Loo, C.E.; Liang, J.; Gomis-Bellmunt, O. Effect of non-standard operating frequencies on the economic cost of offshore AC networks. Renew. Energy 2012, 44, 267–280. [Google Scholar]
- Gierschner, S.; Eckel, H.; Bakran, M. A competitive medium frequency AC distribution grid for offshore wind farms using HVDC. In Proceedings of the 2013 15th European Conference on Power Electronics and Applications (EPE), Lille, France, 2–6 September 2013; pp. 1–10. [Google Scholar]
- Islam, M.R.; Guo, Y.; Zhu, J. A high-frequency link multilevel cascaded medium-voltage converter for direct grid integration of renewable energy systems. IEEE Trans. Power Electron. 2013, 29, 4167–4182. [Google Scholar] [CrossRef]
- Hafez, B.; Krishnamoorthy, H.S.; Enjeti, P.; Borup, U.; Ahmed, S. Medium voltage AC collection grid for large scale photovoltaic plants based on medium frequency transformers. In Proceedings of the 2014 IEEE Energy Conversion Congress and Exposition (ECCE), Pittsburgh, PA, USA, 14–18 September 2014; pp. 5304–5311. [Google Scholar]
- Xia, T.; Li, H.; Yu, H.; Zhang, Y.; Hu, P. A Circular-Arc-Type Magnetic Coupler with Strong Misalignment Tolerance for AUV Wireless Charging System. J. Mar. Sci. Eng. 2023, 11, 162. [Google Scholar] [CrossRef]
- Nan, Q.; Shi, Y.; Zhao, X.; Vladislav, A. Offshore wind farm connection with low frequency AC transmission technology. In Proceedings of the 2009 IEEE Power & Energy Society General Meeting, Calgary, AB, Canada, 26–30 July 2009. [Google Scholar]
- Zhang, Z.; Tang, Y.; Xu, Z. Medium frequency diode rectifier unit based HVDC transmission for offshore wind farm integration. IET Renew. Power Gener. 2021, 15, 717–730. [Google Scholar] [CrossRef]
- Lüth, T.; Merlin, M.M.; Green, T.C.; Hassan, F.; Barker, C.D. High-Frequency Operation of a DC/AC/DC System for HVDC Applications. IEEE Trans. Power Electron. 2014, 29, 4107–4115. [Google Scholar] [CrossRef]
Figure 1.
Topology of offshore wind power mid-frequency convergence soft direct feeder system.
Figure 1.
Topology of offshore wind power mid-frequency convergence soft direct feeder system.
Figure 2.
Structure of different AC filters in real engineering. (a) ST. (b) DT. (c) TT.
Figure 2.
Structure of different AC filters in real engineering. (a) ST. (b) DT. (c) TT.
Figure 3.
Rudong H10 in-field collector line layout.
Figure 3.
Rudong H10 in-field collector line layout.
Figure 4.
Geometric modelling of submarine cable cross sections.
Figure 4.
Geometric modelling of submarine cable cross sections.
Figure 5.
Finite element submarine cable modelling process.
Figure 5.
Finite element submarine cable modelling process.
Figure 6.
(a) Resistance fitting results of 3 × 95 and 3 × 120 sea cables. (b) Resistance fitting results of 3 × 185 and 3 × 400 sea cables. (c) Inductance fitting results for 3 × 95 and 3 × 120 type submarine cables. (d) Inductance fitting results for 3 × 185 and 3 × 400 type submarine cables.
Figure 6.
(a) Resistance fitting results of 3 × 95 and 3 × 120 sea cables. (b) Resistance fitting results of 3 × 185 and 3 × 400 sea cables. (c) Inductance fitting results for 3 × 95 and 3 × 120 type submarine cables. (d) Inductance fitting results for 3 × 185 and 3 × 400 type submarine cables.
Figure 7.
Carrying capacity of typical types of submarine cables at different frequencies.
Figure 7.
Carrying capacity of typical types of submarine cables at different frequencies.
Figure 8.
Transformer leakage inductance versus wind farm operating frequency.
Figure 8.
Transformer leakage inductance versus wind farm operating frequency.
Figure 9.
Relationship between the resonant capacitance of AC filter and the operating frequency of wind farms.
Figure 9.
Relationship between the resonant capacitance of AC filter and the operating frequency of wind farms.
Figure 10.
Relationship between resonant inductance of AC filter and frequency of wind farm operation.
Figure 10.
Relationship between resonant inductance of AC filter and frequency of wind farm operation.
Table 1.
Capacitance parameters per unit length for typical types of submarine cables.
Table 1.
Capacitance parameters per unit length for typical types of submarine cables.
| Models | Capacitance (μF/km) |
|---|
| 3 × 95 | 0.1152 |
| 3 × 120 | 0.1215 |
| 3 × 185 | 0.1307 |
| 3 × 400 | 0.1708 |
Table 2.
Diode Operating Characteristics Fitting Function.
Table 2.
Diode Operating Characteristics Fitting Function.
| Fitting Object | Regular Term | Primary Term Coefficients | Secondary Term Coefficients |
|---|
| Switching Energy Loss (mJ) | 699.8 | 2.634 | 3.653 × 10⁻⁴ |
| Throughput voltage drop (kV) | 1.391 | 7.072 × 10⁻⁴ | 0 |
Table 3.
Industrial frequency (50 Hz) AC pooling system cable investment cost.
Table 3.
Industrial frequency (50 Hz) AC pooling system cable investment cost.
Voltage Level
(kV) | Cross-Sectional Area
(mm2) | Carrying Capacity
(A) | Resistance
(Ω/km) | Length
(km) | Total Price
($ Million) |
|---|
| 35 | 3 × 95 | 270 | 0.198 | 62.6 | 16.876 |
| 35 | 3 × 120 | 303 | 0.158 | 26.6 | 7.134 |
| 35 | 3 × 185 | 378 | 0.103 | 24.2 | 6.481 |
| 35 | 3 × 300 | 477 | 0.078 | 71.9 | 19.329 |
| 35 | 3 × 400 | 580 | 0.051 | 121.2 | 32.396 |
| 220 | 3 × 630 | 680 | 0.039 | 13 | 10.273 |
Table 4.
Medium frequency (100 Hz) AC pooling system cable investment cost.
Table 4.
Medium frequency (100 Hz) AC pooling system cable investment cost.
Voltage Level
(kV) | Cross-Sectional Area
(mm2) | Carrying Capacity
(A) | Resistance
(Ω/km) | Length
(km) | Total Price
($ Million) |
|---|
| 35 | 3 × 150 | 339 | 0.159 | 62.6 | 20.424 |
| 35 | 3 × 185 | 328 | 0.103 | 26.6 | 8.643 |
| 35 | 3 × 300 | 416 | 0.078 | 24.2 | 7.835 |
| 35 | 3 × 500 | 580 | 0.051 | 71.9 | 23.429 |
| 35 | 3 × 630 | 630 | 0.043 | 121.2 | 39.477 |
| 220 | 3 × 1000 | 810 | 0.027 | 13 | 11.891 |
Table 5.
Costs of offshore booster and converter stations for different frequency convergence.
Table 5.
Costs of offshore booster and converter stations for different frequency convergence.
Cost of Investment
($ Million) | Industrial Frequency AC Pooling
System | Medium Frequency AC Convergence System |
|---|
| Step-up transformer | 6.277 | 3.275 |
| The offshore lift platform itself | 40.985 | 27.661 |
| Transformers for converter stations | 12.003 | 6.401 |
| DRU converter | 1.091 | 1.091 |
| AC filters | 14.488 | 7.231 |
| The offshore converter platform itself | 120.209 | 81.591 |
| Other costs | 78.529 | 78.529 |
| Total price | 273.582 | 205.779 |
Table 6.
Comparison of Integrated Investment Costs of Offshore Wind Farms with Different Frequency Pooling Systems.
Table 6.
Comparison of Integrated Investment Costs of Offshore Wind Farms with Different Frequency Pooling Systems.
Cost of Investment
($ Million) | Industrial Frequency AC Pooling
System | Medium Frequency AC Convergence System |
|---|
| Offshore Booster Station | 76.386 | 60.151 |
| Offshore converter | 197.116 | 145.778 |
| AC sea cable | 82.216 | 99.808 |
| Total | 355.718 | 305.737 |
Table 7.
Operational losses in submarine cables of different frequency pooling systems.
Table 7.
Operational losses in submarine cables of different frequency pooling systems.
Loss Composition
(MW) | Industrial Frequency AC Pooling
System | Medium Frequency AC Convergence
System | |
|---|
| 35 kV submarine cable | 0.7 | 0.56 | 60.151 |
| 220 kV submarine cable | 16.23 | 12.5 | 145.778 |
| Total loss | 16.93 | 13.06 | 99.808 |
Table 8.
Calculation results of the operating loss of the offshore converter.
Table 8.
Calculation results of the operating loss of the offshore converter.
Type of Loss
(MW) | Industrial Frequency AC Pooling
System | Medium Frequency AC Convergence
System | |
|---|
| Through-state loss | 2.42 | 2.42 | 60.151 |
| Switching loss | 0.07 | 0.13 | 145.778 |
| Total loss | 2.49 | 2.55 | 99.808 |
Table 9.
Comparison of the results of the evaluation of the corresponding operational loss costs of AC convergence systems with different frequencies.
Table 9.
Comparison of the results of the evaluation of the corresponding operational loss costs of AC convergence systems with different frequencies.
Cost Components
($ Million) | Industrial Frequency AC Pooling
System | Medium Frequency AC Convergence
System | |
|---|
| AC sea cable | 69.0 | 53.3 | 60.151 |
| Offshore converters | 10.1 | 10.4 | 145.778 |
| Aggregate | 79.1 | 63.7 | 99.808 |
| Disclaimer/Publisher’s Note: The statements, opinions and data contained in all publications are solely those of the individual author(s) and contributor(s) and not of MDPI and/or the editor(s). MDPI and/or the editor(s) disclaim responsibility for any injury to people or property resulting from any ideas, methods, instructions or products referred to in the content. |
© 2025 by the authors. Licensee MDPI, Basel, Switzerland. This article is an open access article distributed under the terms and conditions of the Creative Commons Attribution (CC BY) license (https://creativecommons.org/licenses/by/4.0/).


