Article

A Framework for Risk Evolution Path Forecasting Model of Maritime Traffic Accidents Based on Link Prediction

by
Shaoyong Liu
1,
Jian Deng
1,2,3,4,* and
Cheng Xie
1
1
School of Navigation, Wuhan University of Technology, Wuhan 430063, China
2
National Engineering Research Center for Water Transport Safety, Wuhan 430063, China
3
State Key Laboratory of Maritime Technology and Safety, Wuhan 430063, China
4
Hubei Key Laboratory of Inland Shipping Technology, Wuhan 430063, China
*
Author to whom correspondence should be addressed.
J. Mar. Sci. Eng. 2025, 13(6), 1060; https://doi.org/10.3390/jmse13061060
Submission received: 10 May 2025 / Revised: 26 May 2025 / Accepted: 26 May 2025 / Published: 28 May 2025
(This article belongs to the Section Ocean Engineering)

Abstract

:
Water transportation is a critical component of the overall transportation system. However, the gradual increase in traffic density has led to a corresponding rise in accident occurrences. This study proposes a quantitative framework for analyzing the evolutionary paths of maritime traffic accident risks by integrating complex network theory and link prediction methods. First, 371 maritime accident investigation reports were analyzed to identify the underlying risk factors associated with such incidents. A risk evolution network model was then constructed, within which the importance of each risk factor node was evaluated. Subsequently, several node similarity indices based on node importance were proposed. The performance of these indices was compared, and the optimal indicator was selected. This indicator was then integrated into the risk evolution network model to assess the interdependence between risk factors and accident types, ultimately identifying the most probable evolution paths from various risk factors to specific accident outcomes. The results show that the risk evolution path shows obvious characteristics: “lookout negligence” is highly correlated with collision accidents; “improper route selection” plays a critical role in the risk evolution of grounding and stranding incidents; “improper on-duty” is closely linked to sinking accidents; and “illegal operation” show a strong association with fire and explosion events. Additionally, the average risk evolution paths for collisions, groundings, and sinking accidents are relatively short, suggesting higher frequencies of occurrence for these accident types. This research provides crucial insights for managing water transportation systems and offers practical guidance for accident prevention and mitigation.

1. Introduction

The global economy depends significantly on maritime transportation [1]. In recent years, the implementation of China’s maritime power strategy has driven the rapid growth of the waterborne transport sector [2]. However, water traffic accidents continue to occur with alarming frequency. The sustainable development of inland water transport hinges on safety as a fundamental prerequisite. Accidents in inland waterways often result in casualties, substantial property damage, and environmental pollution [3,4]. In particular, fuel leakage from vessels can severely contaminate aquatic ecosystems, compromise the safety of local water supplies, and trigger widespread public concern. The overall safety outlook for water traffic remains concerning [5,6]. Inland waterway transportation systems exhibit high fragility [7], with risk evolution characterized by superposition, rapid escalation, and abrupt transitions. Therefore, a comprehensive analysis of risk evolution patterns in accidents, along with the development of methodologies for identifying risk evolution pathways, is imperative. This analytical framework forms the foundation for implementing dynamic risk prevention and control strategies, thereby enabling a more proactive and effective response to emerging hazards.
At present, while water traffic accidents have attracted attention from all walks of life, many scholars have conducted research on water traffic risk analysis. Wan et al. [8] combined the “2–4” model and complex network theory to analyze the key causes of water traffic accidents from different stages such as accident latent, diffusion, and occurrence. Ziaul et al. [9] trained various machine learning algorithms using historical accident data to develop a decision support system for accident risk assessment. Hu et al. [10] used model simulation to analyze the coupling effect and degree of influence of the risk causes of the maritime transportation system. Liu et al. [11] used machine learning methods to establish a data-driven Bayesian network to analyze the causes of accidents in China’s coastal waters. Bye et al. [12] utilized statistical analysis of historical accident data and AIS data, integrating these with a multivariate logistic regression model to predict the correlation between accidents and navigation. Yan et al. [13] developed a maritime accident analysis model based on a content-aware corpus to explore and analyze the potential relationships between maritime accident hazards.
The analysis of water traffic risks currently focuses on risk causes, risk coupling, and risk evolution. In the study of accident risk evolution, complex network theory is widely used in many fields such as power accidents [14], aviation accidents [15], railway accidents [16,17,18], coal mine accidents [19] and road traffic accident [20]. For example, Yang et al. [21] combined complex network and human factors analysis and classification systems to identify key risk causes of chemical accidents. Cao et al. [22] combined complex networks and risk matrices and proposed quantitative indicators for network node risk levels to quantitatively assess node risks. Wang [23] established a dynamic risk analysis and system protection method based on the importance of complex networks and node structures, and combined cases to verify the effectiveness of the method. Sui et al. [24] used complex network theory to analyze the practical sequence characteristics and dynamic changes in maritime accidents in the Yangtze River. Deng et al. [25] used complex networks to study the evolution law of accident risks of larger and higher levels along China’s coast. Currently, link prediction theory is relatively underutilized in accident risk research. Ma et al. [26] established a network topology diagram depicting the relationships between events and factors, and, drawing on link prediction principles, devised a comprehensive method for assessing human error factors. Ma et al. [27] devised an algorithm for computing factor correlation and importance, integrating link prediction technology to analyze multifactor relationship issues pertaining to the index system. At the same time, complex networks have also been used to some extent in waterway traffic accidents.
Overall, current research on accident risk evolution primarily focuses on the characteristics of risk evolution and the key causes of accidents [28,29]. However, there are still gaps in the analysis of risk evolution paths. To address this issue, this study integrates complex network theory with link prediction to propose a quantitative framework for analyzing the risk evolution paths of water traffic accidents. This framework enables an in-depth examination of the evolution of risk, explores the interdependencies between various risk factors and accident types, and identifies the most probable evolution pathways from risk factors to accidents.
In this article, Section 2 provides an overview of the investigation reports on water traffic accident cases. Section 3 introduces the complex network model and link prediction methods and presents the framework of the proposed risk evolution path prediction model. In Section 4, the risk evolution paths of water traffic accidents are analyzed and solved following the proposed framework. Finally, Section 5 concludes this paper by summarizing the research findings.

2. Accident Sample

The accident data analyzed in this study are derived from investigation reports published on the official websites of the China Maritime Safety Administration and its affiliated local maritime safety administrations under the Ministry of Transport. A total of 371 representative investigation reports on inland waterway traffic accidents in China, spanning the period from 2012 to 2023, were systematically compiled and analyzed to provide a comprehensive overview of inland navigation accidents.

2.1. Accident Location

These reports cover major inland waterways in China, including the Yangtze River, Pearl River, and Xijiang River, among others, offering a broad and representative sample of inland waterway incidents. Based on the geographical information contained in the investigation reports, a heat map illustrating the spatial distribution of the accidents was generated, as shown in Figure 1. The figure reveals that inland water traffic accidents are most concentrated in the lower reaches of the Yangtze River and the Pearl River system. A notable number of incidents also occur in the upper and middle reaches of the Yangtze River. Additionally, a smaller number of accidents are distributed across other waterways such as the Xijiang River, Huangpu River, Daliao River, and Songhua River. Overall, the spatial coverage of the cases indicates that the dataset analyzed in this study is broadly representative of inland waterway accidents across China.

2.2. Accident Level

Among the 371 investigation reports analyzed, there were no particularly significant accidents, 8 were classified as major accidents, 37 as larger accidents, 290 as general accidents, and 36 as small accidents. Overall, the majority of inland waterway traffic accidents in China fall into the general and minor categories, collectively accounting for 87.9% of the total. Notably, general-level accidents comprise the largest share, representing 78.2% of all incidents. A detailed breakdown is presented in Figure 2.

2.3. Type of Accident and Number of Casualties
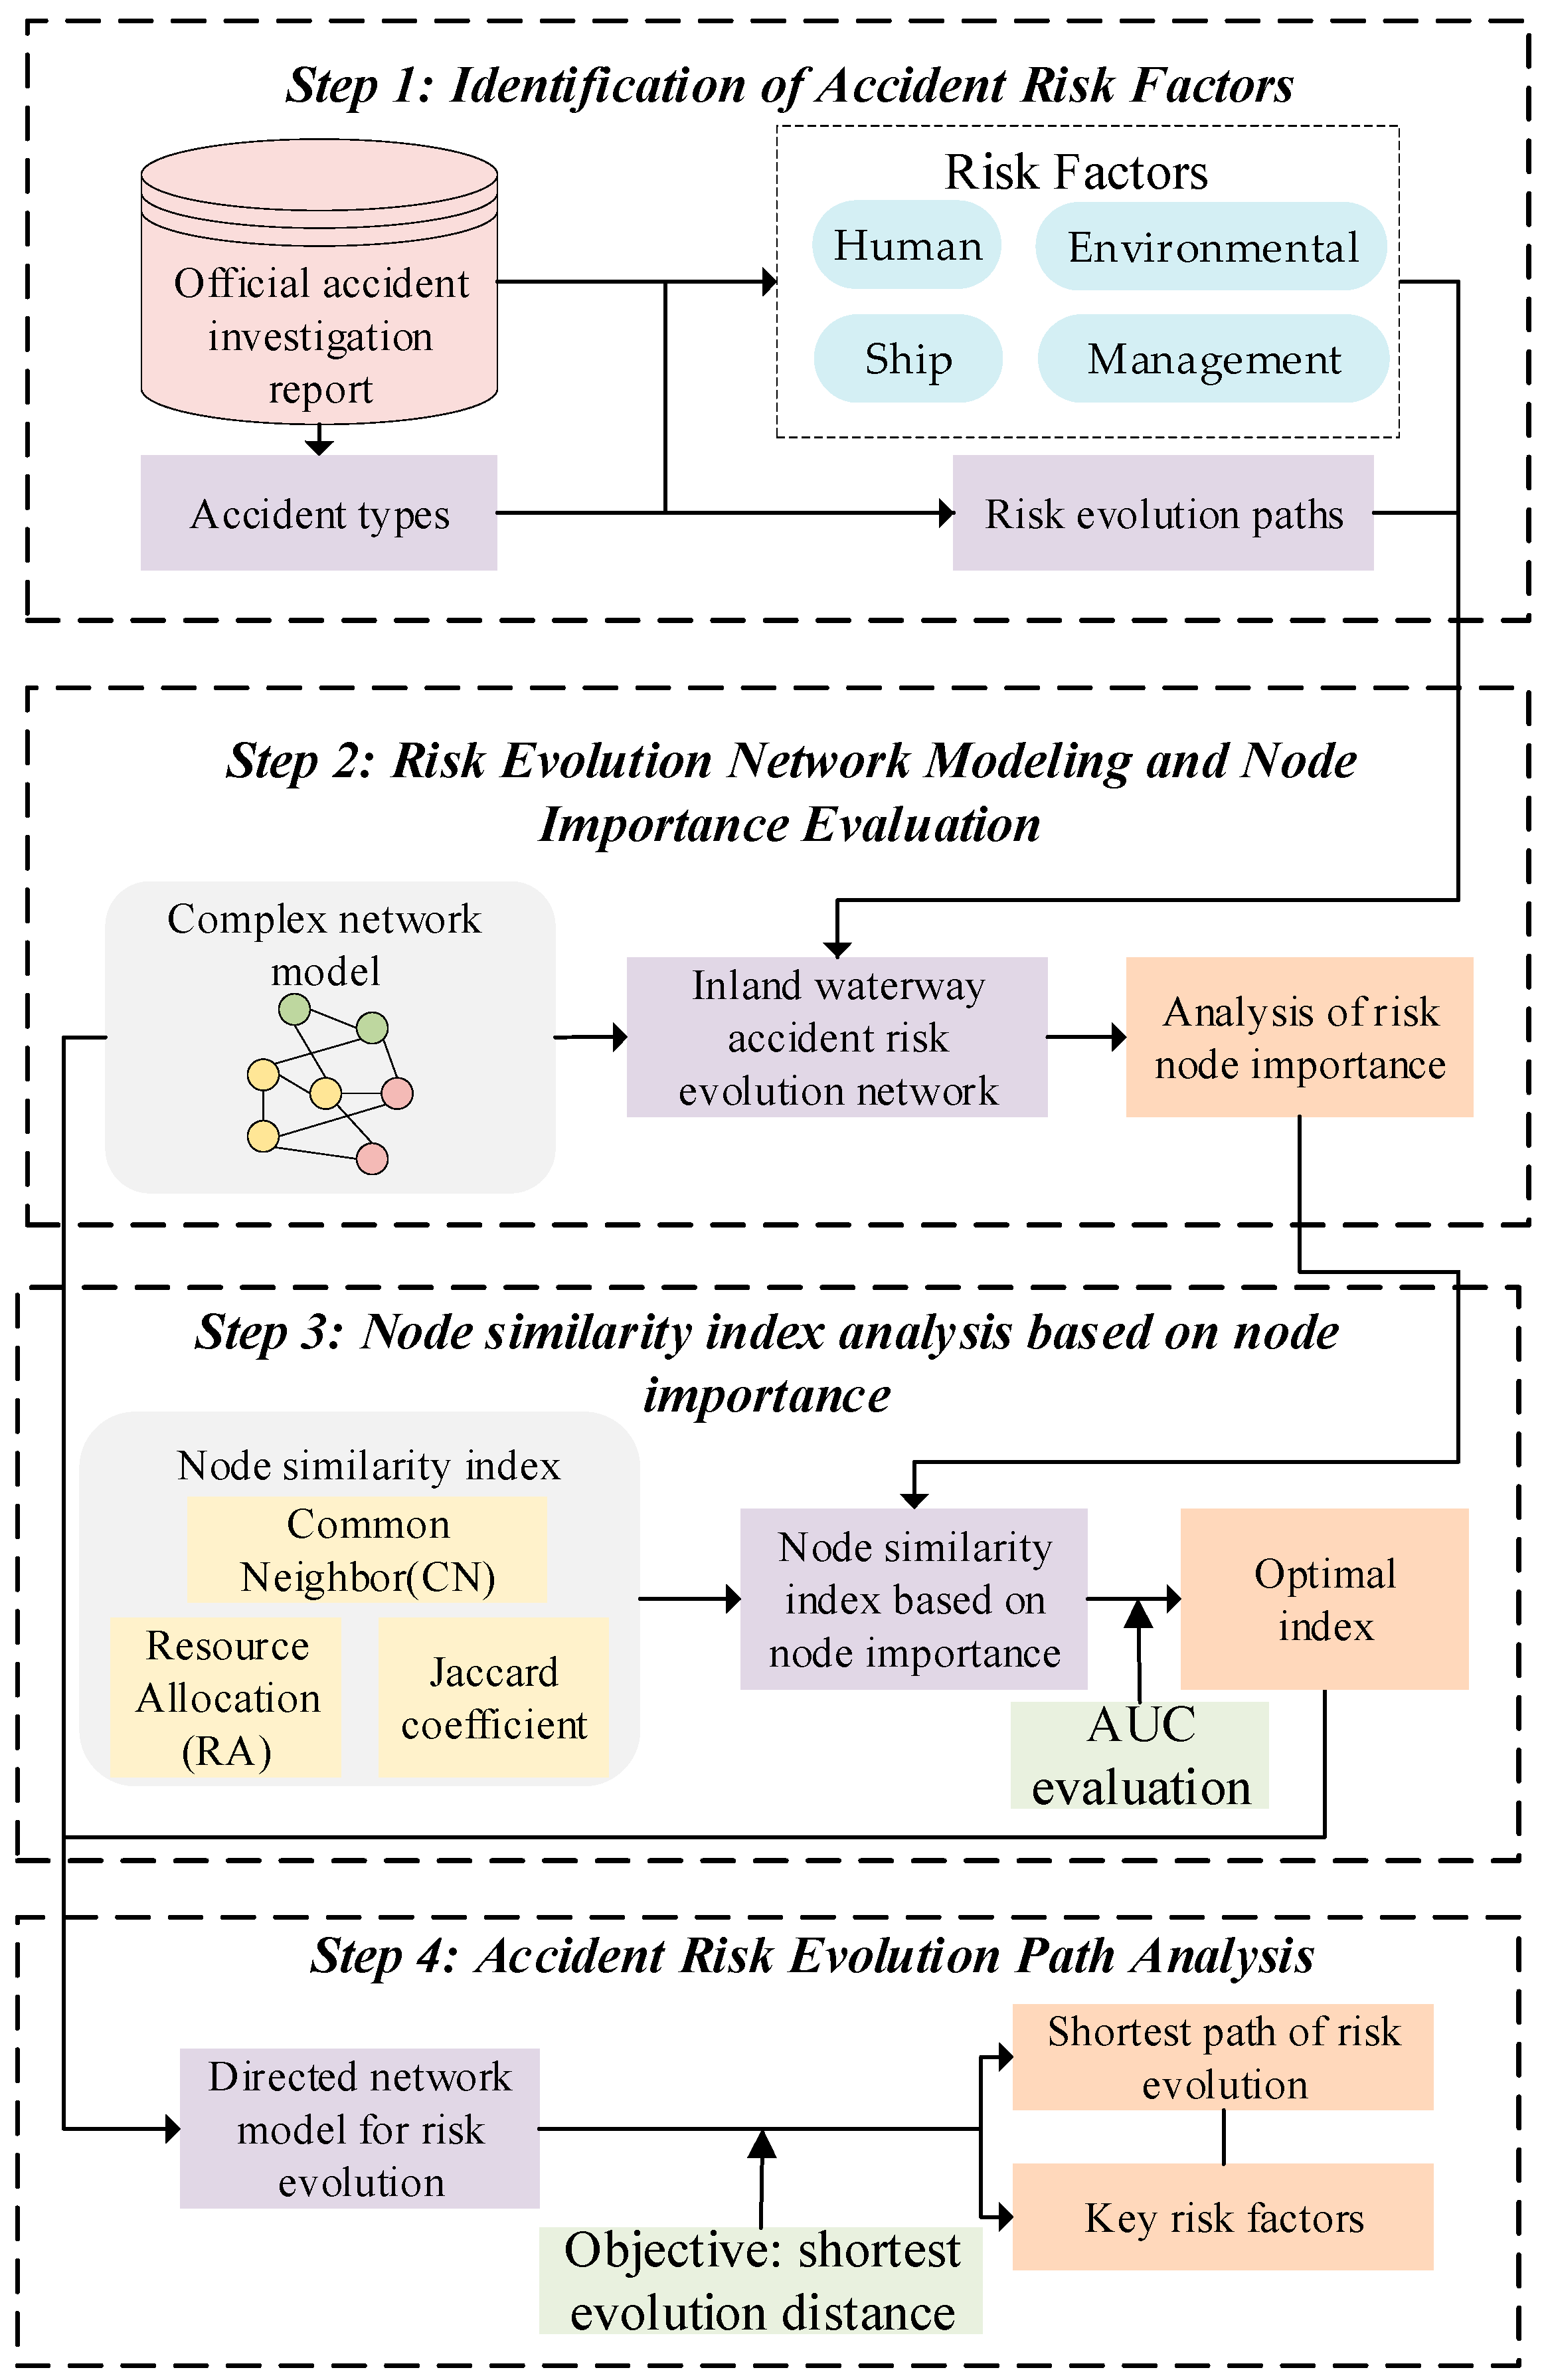
According to the statistical analysis, the types of accidents documented in this study include 152 collisions, 66 sinkings, 30 contacts, 15 wind damage accidents, 9 fire/explosion, 10 grounding, 4 stranding, and 85 classified as other types. The distribution of these accident types is illustrated in Figure 3. Among them, collision accidents constitute the largest proportion at 40.97%, followed by other types (22.91%) and sinking accidents (17.79%). Due to the high frequency of collision incidents, they also account for a relatively large number of fatalities and missing persons, totaling 164. However, sinking accidents exhibit the highest average fatality/missing rate per incident, exceeding two individuals per case. This indicates that, although less frequent, sinking accidents have the most significant impact on the incremental mortality rate [30,31].

3. Methods

This paper constructs an accident risk network, identifies the importance of network nodes, and introduces a novel approach for calculating node similarity by integrating node importance with traditional link prediction techniques. Section 3.1 details the method for calculating node importance. Section 3.2 reviews the traditional node similarity index calculation methods. Finally, Section 3.3 presents the methodological innovation proposed in this paper: a node similarity index calculation method based on node importance.

3.1. Node Importance Calculation Method

(1)
Node degree
The node degree value represents the number of edges connected to this node. For any node i in the network, its degree value is calculated as shown in (1):
D i = j = 1 N l i j
Among them, l i j represents the edge between node i and node j; N represents the number of nodes in the network.
(2)
Betweenness centrality
Betweenness centrality is a measure used to quantify how often the shortest paths within a network pass through a specific node, denoted as node i. It reflects the frequency with which node i lies on the shortest paths between all other pairs of nodes in the network, thereby indicating the centrality and influence of the node within the network structure [32]. At the same time, it can also show the degree to which the node controls other nodes in the network. The calculation method is as follows:
B i = i s t Q i s , t Q s , t
Among them, Q s , t represents the number of shortest paths between node s and node t; Q i s , t represents the number of shortest paths passing through node i.
(3)
Closeness centrality
Closeness centrality reflects the proximity of any given node to all other nodes in the network [33]. It is expressed as the reciprocal of the sum of the shortest path lengths from that node to all other nodes. This metric can be used to assess the importance of a node within the network. For any node i, its closeness centrality is calculated as follows:
C C i = 1 L i
L i = 1 N 1 j = 1 N L i j
Among them, L i represents the average distance from any node i in the network to other points in the network; L i j represents the distance from any node i in the network to node j in the network.
(4)
PageRank value
PageRank value is an important basis for analyzing key nodes in complex networks [34]. If a network contains N nodes, for node i, its PageRank value is as follows:
P R i = 1 d N + d j M i W i , j × P R j D j
Among them, M i is the point connected to i; W i , j is the weight of edge (i, j). Here, the product of the degree values of node i and node j is calculated as the weight of edge (i, j); D j is the degree of vertex j; d is the attenuation factor, usually d = 0.85.

3.2. Traditional Similarity Index Calculation Method

The node similarity index has the advantages of simplicity, interpretability, low operation time, strong scalability, and competitive prediction accuracy. Therefore, this article combines three local similarity indicators: Common Neighbor (CN), Resource Allocation (RA), and Jaccard coefficient (Jaccard) to carry out relevant calculations. The calculation method is as follows:
(1)
CN index
The CN index [35] utilizes the number of common neighbors between two nodes as an index to assess the likelihood of edges connecting the two nodes. In other words, a higher number of common neighbors between two nodes indicates a greater probability of the existence of an edge between the connection points. For node i and node j, their neighbor node sets are Γ i and Γ j , respectively; then, the set of common neighbors of nodes i and j is Γ i Γ j , then the CN index is defined for
C N = Γ i Γ j
(2)
RA index
The RA index [36] originates from the perspective of resource allocation, positing that each node in the network possesses a certain amount of resources. When considering a pair of nodes i and j, even if they are not directly connected, node i can allocate some resources to node j. In this scenario, the common nodes between them serve as intermediaries for resource transfer. Thus, the RA index can be defined as follows:
R A = k Γ i Γ j 1 d k
(3)
Jaccard index
The Jaccard index [37] is used to compare the similarities and differences between limited sample sets. The greater the Jaccard similarity index value, the higher the similarity between samples. In complex networks, the proportion of the intersection of adjacent nodes of node i and node j in the union of adjacent nodes becomes the Jaccard similarity index between node i and node j. The calculation method is as follows:
J a c c a r d = Γ i Γ j Γ i Γ j
Among them, Γ i Γ j represents the intersection of adjacent nodes of node i and node j; Γ i Γ j represents the union of adjacent points of node i and node j.

3.3. Node Similarity Index of Node Importance

This paper combines the similarity index and node importance and innovatively proposes a similarity index calculation method based on node importance. The AUC index is used to compare the advantages and disadvantages of the methods. The relevant calculations are as follows:
(1)
CN index based on node importance
To avoid the situation where the number of common neighbors is the same but the node importance is different, resulting in the same possibility of linking between the calculated nodes. Therefore, in the calculation process of the CN index, the importance of the node is also considered, and the following CN index calculation method considering the node importance attribute is obtained:
M . C N = k Γ i Γ j M k
Among them, M k represents the importance value of node k, including degree, betweenness centrality, closeness centrality, and PageRank value.
(2)
RA index based on node importance
Based on the RA index, this paper uses the importance attribute as the resource allocation ratio parameter and allocates resources according to the ratio of the importance of adjacent nodes to the sum of the importance of all adjacent nodes. Therefore, the RA index calculation method considering the node importance attribute in this article is as follows:
M . R A = k Γ i Γ j M k h Γ k S h
Among them, S h represents the sum of the importance values of the adjacent nodes of node h. This part of the importance includes degree, betweenness centrality, closeness centrality, and PageRank value, which correspond to M k ; Γ k represents the set of adjacent nodes of node k.
(3)
Jaccard index based on node importance
For the Jaccard indicator based on node importance, this article considers two scenarios: the first scenario involves calculating the Jaccard index by considering the sum of the importance values of the common neighbors of the two nodes, as described by Equation (11). In the second scenario, the calculation incorporates the ratio of the sum of the importance values of the common neighbors of the two nodes to the sum of the union importance values of the neighbor nodes of both nodes. This modified Jaccard index is calculated using Equation (12). The specific calculation methods for these scenarios are outlined below.
M 1 . J a c c a r d = Γ i Γ j Γ i Γ j · k Γ i Γ j M k
M 2 . J a c c a r d = Γ i Γ j Γ i Γ j · k Γ i Γ j M k h Γ i Γ j M h
(4)
Area Under Curve (AUC) indicator
The ROC curve can better reflect the accuracy of the node similarity index [38], and the AUC value represents the area under the ROC curve, which can more intuitively reflect the accuracy difference in the shape similarity index. The calculation method of the AUC value is as follows:
A U C = n 1 + 0.5 n 2 n
Among them, n 1 represents the number of times the test set E p test value is large; n 2 represents the number of times that the two test values are equal; n represents the total number of experiments.

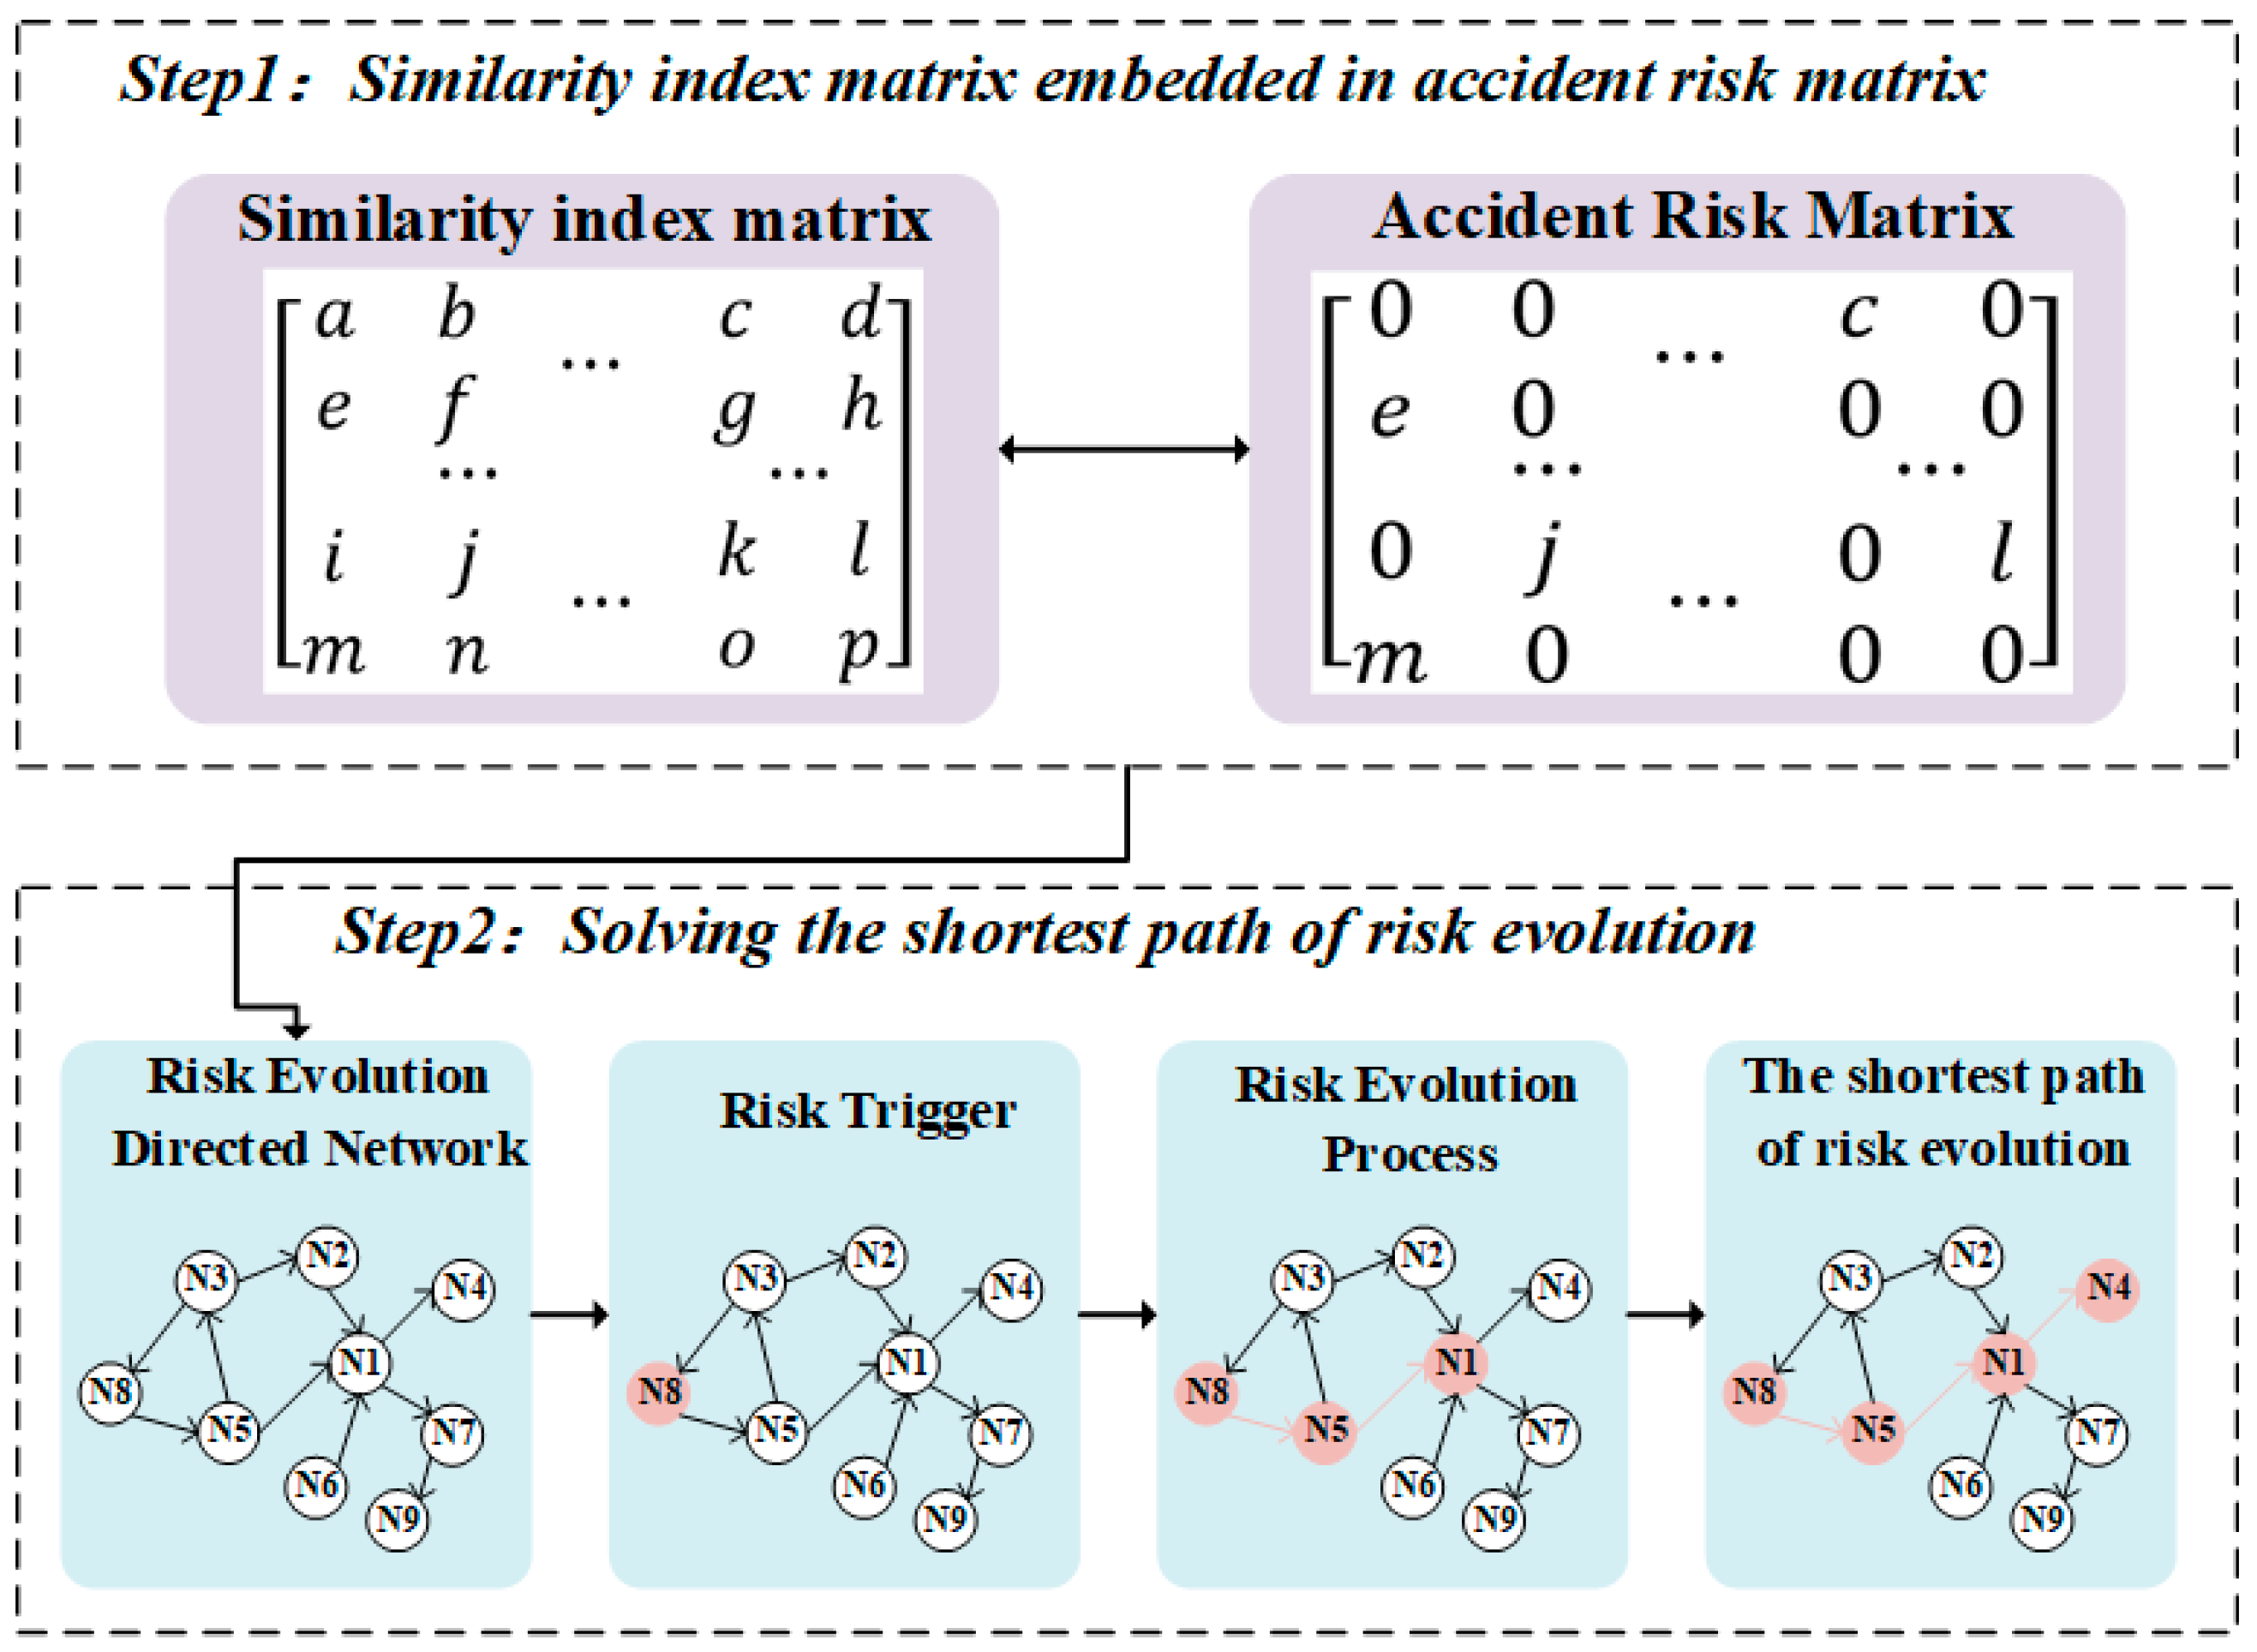
3.4. Risk Evolution Path Analysis Framework

Based on a large volume of historical accident data, this study proposes a framework for analyzing the risk evolution paths of inland waterway traffic accidents. The framework integrates a complex network model, node importance analysis, and a novel node similarity index calculation method that incorporates node importance. The four main steps of the proposed research framework are illustrated in Figure 4. Among them, the calculation of the shortest path of risk evolution is to construct a risk evolution directed network by combining the accident risk evolution matrix and the node similarity index matrix. Then, the risk trigger point and accident type are selected, and the shortest path of risk evolution is calculated with the shortest distance as the weight. Details are shown in Figure 5.

4. Risk Evolution Path Analysis

4.1. Accident Risk Factors and Accident Chain Extraction

The occurrence of inland waterway traffic accidents is often the result of the interaction of multiple risk factors. This paper systematically extracts both the direct and indirect causes of these accidents from investigation reports and categorizes them into four main groups: people, ships, environment, and management. The identified risk factors for inland waterway accidents are summarized in Table 1.
The occurrence of accidents can also be understood through the evolution of risk factors over time. This paper integrates the detailed accident processes and causes from the investigation reports to determine the sequence in which risk factors emerge, linking them in series to form what is referred to as an “accident chain”. Each accident’s risk evolution process is represented by its corresponding accident chain, providing a systematic way to illustrate the progression of events leading to an incident. Sample accident chains are presented in Table 2.

4.2. Construction of Accident Risk Evolution Model

Leveraging complex network theory, the risk factors within the accident chain were utilized as network nodes, and the relationships between these factors were employed as network edges. By integrating the accident chains from 371 accidents, an inland river accident risk evolution network model was constructed, as depicted in Figure 6.
The network comprises 54 nodes and 394 edges. It has a diameter of 3, an average path length of 1.774, a network density of 0.275, and a clustering coefficient of 0.547. This shows that the average path of the inland river accident risk evolution network is short, and on average every two nodes passing through can lead to an accident. Moreover, the network demonstrates a relatively high density and a large clustering coefficient, indicating that the nodes within the network are highly interconnected. This suggests that any node can be reached from another through a small number of key nodes, highlighting the network’s tightly knit structure.

4.3. Network Node Importance

Combined with the previous node importance calculation method, calculate the degree value, betweenness, closeness centrality, and PageRank value of each node. Some results are shown in Table 3:

4.4. Accident Risk Evolution Directed Network Construction

4.4.1. Node Similarity Index Accuracy Comparison

To verify the superiority of the proposed similarity index calculation method, a comparative analysis was conducted using the basic CN, RA, and Jaccard similarity indices as benchmarks. The effectiveness of each method was evaluated based on their respective AUC values. The AUC results for each method are presented in Table 4. Furthermore, the ranking of each method in terms of improvement ratio and effectiveness is illustrated in Figure 7.
As shown in Table 4, the AUC values of the three similarity indices that incorporate different node importance measures exhibit either increases or decreases when compared with the baseline similarity indices.
Through comparative analysis, it was found that among the Common Neighbor (CN) indicators, the prediction accuracy of the CN indicator that incorporates closeness centrality is the highest, showing an improvement of 0.28% compared to the standard CN algorithm. Among the Resource Allocation (RA) indicators, the accuracy of the RA indicator that considers the degree value and the RA indicator that incorporates the PageRank (PR) value of nodes increased by 2.20% and 2.14%, respectively. In terms of AUC (Area Under the Curve) values for the Jaccard index, the M1.Jaccard index showed improved prediction accuracy when node degree value and closeness centrality were taken into account, with increases of 3.46% and 4.25%, respectively. For the M2.Jaccard index, the AUC value also indicated better prediction accuracy when considering node degree value and closeness centrality, with improvements of 1.19% and 1.09%, respectively.
Furthermore, as illustrated in Figure 7, among all evaluated indices based on the AUC value ranking, the RA index incorporating node degree yields the highest AUC value, indicating superior accuracy. Therefore, in the subsequent analysis, the RA index that considers node degree is adopted for calculating risk evolution paths.

4.4.2. Risk Evolution Directed Network Matrix

The node similarity index with the highest predictive accuracy is selected to construct the similarity index matrix, which is subsequently embedded into the inland water traffic accident risk network. This matrix, in conjunction with a shortest path algorithm, is employed to predict the shortest risk evolution paths originating from various risk trigger points. In the similarity index matrix, each element denotes the probability of a connection between a pair of nodes. This similarity index is transformed into an adjacency matrix within the risk evolution network model, which is then utilized to compute inter-node distances. By integrating the derived adjacency matrix with the existing edges in the inland water traffic accident risk network, a directed graph is formed. This graph facilitates the calculation of shortest paths from different initial risk factors to specific accident types. The resulting directed risk evolution network is represented in matrix form in Figure 8. In this matrix, risk evolution flows from column nodes to row nodes, with the asymmetry of the matrix reflecting the inherent directionality of the network’s edges.

4.5. Analysis of Accident Risk Evolution Path Characteristics

Based on the constructed risk evolution-directed network, the shortest evolution distances from each risk factor to different types of accidents are calculated using the shortest risk propagation distance as the weight. Additionally, the average path length for all evolution paths leading to each type of accident is computed. The top 10 shortest paths for each accident type are statistically analyzed and presented in Table 4.
From Table 5, it can be observed that the average paths for collision, sinking, and other types of accidents are relatively short, measuring 1.8001, 1.6600, and 1.7439, respectively. This suggests that the risk evolution speed for these types of accidents is faster, indicating a higher probability of occurrence with fewer intermediate nodes. On average, an accident can occur with just two nodes in between. Additionally, the risk paths for various accidents show a strong correlation with specific risk factor nodes.
(1)
In the risk evolution path of grounding accidents, the two risk factors—”improper operation” and “improper route selection”—are directly associated with the occurrence of grounding accidents, with relatively short evolution distances of 1.4605 and 1.5195, respectively. Moreover, over 95% of all identified risk paths pass through the “improper operation” node. These findings indicate that enhancing the operational proficiency of crew members can effectively reduce the likelihood of grounding accidents.
(2)
In the case of stranding accidents, the risk factors “improper route selection” and “underestimation of risk” exhibit relatively short evolution distances to the accident node, at 1.6705 and 1.7727, respectively. This suggests that insufficient anticipation of stranding risks and course deviations during navigation are key contributors to such incidents. Therefore, maintaining accurate vessel positioning and avoiding deviations during navigation are essential measures for mitigating stranding accidents.
(3)
For collision accidents, multiple risk nodes are directly connected to the collision node with short evolution distances, indicating the diversity of risk factors contributing to such events. This complexity increases the difficulty of prevention and control. Additionally, most risk nodes require only two evolutionary steps to lead to a collision incident, highlighting the rapid progression of risk evolution in such scenarios and the likelihood of swift accident occurrence following risk activation.
(4)
In the risk evolution path of fire/explosion accidents, “illegal operation” and “improper on-duty” are associated with relatively short evolution distances to the accident node, measured at 2.0413 and 2.3089, respectively. Furthermore, in other risk paths, the evolution towards fire and explosion incidents often passes through these two risk nodes. Although “lack of management” and “equipment failure” frequently appear in the paths, they are not directly connected to the accident node. This is likely because poor management often induces the emergence of other risk factors, and the coupling of these risks amplifies the overall hazard, eventually leading to fire or explosion events. Consequently, improving ship and crew management practices, as well as refining operational and watchkeeping protocols, are effective approaches to reducing the occurrence of fire and explosion accidents.
(5)
In the risk evolution path of collision accidents, the risk nodes “weak safety awareness” and “lookout negligence” exhibit relatively short evolution distances to the collision accident node, measured at 0.533 and 0.5372, respectively. Moreover, negligent lookout is present in the vast majority of collision incidents. Therefore, enhancing crew members’ safety awareness and maintaining proper lookout during navigation are critical measures for reducing the occurrence of collision accidents.
(6)
In the case of sinking accidents, ship factors appear with high frequency across the risk paths. The overall evolution distances in sinking accident paths are relatively short, with an average path length of 1.66—the shortest among all accident types. Furthermore, sinking accidents result in the highest fatality rates per incident. Consequently, daily management should prioritize the maintenance of ship structures and the proper stowage and securing of onboard cargo. These measures can effectively prevent scenarios such as unseaworthiness and flooding, which may compromise vessel stability. Simultaneously, improving crew safety awareness and ensuring vigilant watchkeeping can facilitate the early detection of anomalies and interruption of risk propagation, thereby reducing the likelihood of sinking incidents.
(7)
In the risk evolution path of wind damage accidents, the “heavy wind and waves” factor shows a relatively short evolution distance to the accident node, at 2.3853. Due to the inherent nature of such accidents, the risk evolution paths are relatively simple and concentrated, with the vast majority of paths passing through the “heavy wind and waves” node before leading to a storm-related accident. From the perspective of risk evolution, storm-related accidents are comparatively easier to prevent. Timely forecasting and early warning of extreme weather, along with avoiding navigation under heavy sea and strong wind conditions, are effective strategies to mitigate the occurrence of such incidents.
(8)
For other accidents, the risk factor “weak safety awareness” has the shortest evolution distance to the accident node, measured at 0.4663. This is closely related to the nature of these accidents, which typically involve injuries or fatalities during crew operations. Such incidents are often directly linked to insufficient safety awareness and inadequate use of protective measures. Therefore, strengthening safety awareness training for crew members is an effective approach to preventing these types of accidents.

5. Conclusions

Based on the analysis of water traffic accident investigation reports, this study identifies key risk factors and, by integrating complex network theory with link prediction methods, proposes a quantitative framework for analyzing the risk evolution paths of waterborne traffic accidents. The proposed framework quantifies the importance of risk factors and the dynamics of risk propagation, offering a more intuitive representation of the interdependencies between various risk factors and accident types.
Results show that collision (1.8001), sinking (1.6600), and other accidents (1.7439) have the shortest average path lengths, indicating faster risk evolution and higher accident likelihood with fewer intermediate nodes. In particular, for different accident types, certain risk factors exhibit a high degree of correlation with the corresponding risk evolution paths, playing a pivotal role as critical connectors. For instance, the risk factor “lookout negligence” is strongly associated with collision accidents, while “improper route selection” emerges as a key intermediate factor in the evolution of grounding and stranding accidents. Sinking incidents are closely linked to “improper on-duty”. Additionally, over 90% of all identified risk evolution paths involve human-related factors, underscoring the dominant role of human error in the occurrence of water traffic accidents. Moreover, this quantitative analysis reveals that risk factors with shorter evolution distances play a more pivotal role in the causation of accidents. Consequently, disrupting key short-distance pathways—particularly those related to human and managerial errors—can significantly enhance accident prevention capabilities. These findings provide a data-driven foundation for targeted safety interventions and dynamic risk management within waterborne transportation systems.
In addition, this study presents several aspects that warrant further investigation and refinement in future research. For instance, considering the limitations of accident data from a single water area, a comparative analysis incorporating accident data from multiple countries could be conducted to enhance the generalizability of the proposed model. Moreover, as the risk factors identified in accident investigation reports are typically static, integrating dynamic elements—such as real-time changes in weather and water conditions—by introducing dynamic nodes or adaptively adjusting edge weights, could further improve the accuracy and robustness of the model framework.

Author Contributions

Conceptualization, J.D.; methodology, C.X. and S.L.; software, S.L.; formal analysis, S.L.; investigation, C.X.; resources, J.D.; data curation, C.X. and S.L.; writing—original draft preparation, J.D. and S.L.; writing—review and editing, J.D. and S.L.; visualization, S.L.; project administration, J.D.; funding acquisition, J.D. All authors have read and agreed to the published version of the manuscript.

Funding

This research was funded by The National Natural Science Foundation of China, grant number 52271368.

Data Availability Statement

The original contributions presented in this study are included in the article. Further inquiries can be directed to the corresponding author.

Conflicts of Interest

The authors declare that they have no known competing financial interests or personal relationships that could have appeared to influence the work reported in this paper.

References

  1. Fu, S.S.; Yu, Y.R.; Chen, J.H.; Xi, Y.T.; Zhang, M.Y. A framework for quantitative analysis of the causation of grounding accidents in arctic shipping. J. Reliab. Eng. Syst. Saf. 2022, 226, 108706. [Google Scholar] [CrossRef]
  2. Shu, Y.Q.; Han, B.Y.; Song, L.; Yan, T.; Gan, L.X.; Zhu, Y.X.; Zheng, C.M. Analyzing the spatio-temporal correlation between tide and shipping behavior at estuarine port for energy-saving purposes. J. Appl. Energy 2024, 367, 123382. [Google Scholar] [CrossRef]
  3. Xin, X.R.; Liu, K.Z.; Li, H.H.; Yang, Z.L. Maritime traffic partitioning: An adaptive semi-supervised spectral regularization approach for leveraging multi-graph evolutionary traffic interactions. J. Transp. Res. Part C Emerg. Technol. 2024, 164, 104670. [Google Scholar] [CrossRef]
  4. Gan, L.Q.; Gao, Z.Y.; Zhang, X.Y.; Xu, Y.; Liu, W.R.; Xie, C.; Shu, Y.Q. Graph neural networks enabled accident causation prediction for maritime vessel traffic. J. Reliab. Eng. Syst. Saf. 2025, 257, 110804. [Google Scholar] [CrossRef]
  5. Chen, X.; Wu, S.B.; Shi, C.J.; Huang, Y.G.; Yang, Y.S.; Ke, R.M.; Zhao, J.S. Sensing Data Supported Traffic Flow Prediction via Denoising Schemes and ANN: A Comparison. IEEE Sens. J. 2020, 20, 14317–14328. [Google Scholar] [CrossRef]
  6. Chen, X.Q.; Wei, C.X.; Xin, Z.G.; Zhao, J.S.; Xian, J.F. Ship Detection under Low-Visibility Weather Interference via an Ensemble Generative Adversarial Network. J. Mar. Sci. Eng. 2023, 11, 2065. [Google Scholar] [CrossRef]
  7. Yu, Y.R.; Liu, K.Z.; Fu, S.S.; Chen, J.H. Framework for process risk analysis of maritime accidents based on resilience theory: A case study of grounding accidents in Arctic waters. J. Reliab. Eng. Syst. Saf. 2024, 249, 110202. [Google Scholar] [CrossRef]
  8. Wan, C.P.; Liu, Y.F.; Wu, B. Study on risk identification and accident evolution mechanism of maritime traffic accidents based on complex network. J. Saf. Sci. Technol. 2023, 19, 165–171. [Google Scholar] [CrossRef]
  9. Ziaul, H.M.; Michael, A.S.; Hyungju, K.; Ilan, A. Predicting maritime accident risk using Automated Machine Learning. J. Reliab. Eng. Syst. Saf. 2024, 248, 110148. [Google Scholar] [CrossRef]
  10. Hu, S.P.; Li, F.M.; Xi, Y.T.; Wu, J.J. Novel Simulation on Coupling Mechanism of Risk Formation Segments for Marine Traffic System. J. Basic Sci. Eng. 2015, 23, 409–419. [Google Scholar] [CrossRef]
  11. Liu, K.Z.; Yu, Q. A systematic analysis for maritime accidents causation in Chinese coastal waters using machine learning approaches. J. Ocean Coast. Manag. 2021, 213, 105859. [Google Scholar] [CrossRef]
  12. Bye, R.J.; Aalberg, A.L. Maritime navigation accidents and risk indicators: An exploratory statistical analysis using AIS data and accident reports. J. Reliab. Eng. Syst. Saf. 2018, 176, 174–186. [Google Scholar] [CrossRef]
  13. Yan, K.; Wang, Y.H.; Jia, L.M.; Wang, W.H.; Liu, S.L.; Geng, Y.B. A content-aware corpus-based model for analysis of marine accidents. J. Accid. Anal. Prev. 2023, 184, 106991. [Google Scholar] [CrossRef] [PubMed]
  14. Zhou, D.Y.; Hu, F.N.; Chen, J. Robustness analysis of power system based on a complex network. J. Power Syst. Prot. Control 2021, 49, 72–80. [Google Scholar] [CrossRef]
  15. Yue, R.T.; Li, J.W.; Han, M. Aviation accident causation analysis based on complex network theory. J. Trans. Nanjing Univ. Aeronaut. Astronaut. 2021, 38, 646–655. [Google Scholar] [CrossRef]
  16. Shao, F.B.; Li, K.P. A Complex Network Model for Analyzing Railway Accidents Based on the Maximal Information Coefficient. J. Commun. Theor. Phys. 2016, 66, 459–466. [Google Scholar] [CrossRef]
  17. Hong, W.T.; Clifton, G.; Nelson, J.D. Railway accident causation analysis: Current approaches, challenges and potential solutions. J. Accid. Anal. Prev. 2023, 186, 107049. [Google Scholar] [CrossRef]
  18. Jiao, L.D.; Luo, Q.D.; Hao Lu, H.; Huo, X.S.; Zhang, Y.; Wu, Y. Research on the urban rail transit disaster chain: Critical nodes, edge vulnerability and breaking strategy. Int. J. Disaster Risk Reduct. 2024, 102, 104258. [Google Scholar] [CrossRef]
  19. Yang, Y.L.; Jin, L.H.; Bo Shao, B.; Chen, S.; Jiang, X.; Chen, Y. Research on causes of coal mine fire and explosion based on complex network. China Saf. Sci. J. 2023, 33, 145–151. [Google Scholar] [CrossRef]
  20. Wei, M.; Xu, J.G. Assessing road network resilience in disaster areas from a complex network perspective: A real-life case study from China. Int. J. Disaster Risk Reduct. 2024, 100, 104167. [Google Scholar] [CrossRef]
  21. Yang, J.F.; Wang, P.C.; Liu, X.Y. Analysis on causes of chemical industry accident from 2015 to 2020 in Chinese mainland: A complex network theory approach. J. Loss Prev. Process Ind. 2023, 83, 105061. [Google Scholar] [CrossRef]
  22. Cao, D.Q.; Cheng, L.H. Risk accumulation assessment method for building construction based on complex network. J. Eng. Constr. Archit. Manag. 2025, 32, 1522–1545. [Google Scholar] [CrossRef]
  23. Wang, L.D. Dynamic risk assessment of hybrid hydrogen-gasoline fueling stations using complex network analysis and time-series data. Int. J. Hydrogen Energy 2023, 48, 30608–30619. [Google Scholar] [CrossRef]
  24. Sui, Z.Y.; Wen, Y.Q.; Huang, Y.M.; Song, R.X.; Piera, M.A. Maritime accidents in the Yangtze River: A time series analysis for 2011–2020. J. Accid. Anal. Prev. 2023, 180, 106901. [Google Scholar] [CrossRef]
  25. Deng, J.; Liu, S.Y.; Shu, Y.Q.; Hu, Y.C.; Xie, C.; Zeng, X.H. Risk evolution and prevention and control strategies of maritime accidents in China’s coastal areas based on complex network models. J. Ocean Coast. Manag. 2023, 237, 106527. [Google Scholar] [CrossRef]
  26. Ma, J.; Wan, J. Multiplitudinous correlations in the causative relationship assessment of human errors. J. Saf. Environ. 2017, 17, 2257–2262. [Google Scholar] [CrossRef]
  27. Ma, J.; Wan, J. Research on human factor accident based on link prediction. J. Chem. Pharm. Res. 2014, 6, 1433–1440. [Google Scholar]
  28. Gan, L.X.; Ye, B.Y.; Huang, Z.Q.; Xu, Y.; Chen, Q.H.; Shu, Y.Q. Knowledge graph construction based on ship collision accident reports to improve maritime traffic safety. J. Ocean Coast. Manag. 2023, 240, 106660. [Google Scholar] [CrossRef]
  29. Liu, H.D.; Wu, C.J.; Li, B.; Zong, Z.C.; Shu, Y.Q. Research on Ship Anomaly Detection Algorithm Based on Transformer-GSA Encoder. J. IEEE Trans. Intell. Transp. Syst. 2025, 1–12. [Google Scholar] [CrossRef]
  30. Weng, J.X.; Yang, D. Investigation of shipping accident injury severity and mortality. J. Accid. Anal. Prev. 2015, 76, 92–101. [Google Scholar] [CrossRef]
  31. Chen, J.H.; Bian, W.T.; Zheng Wan, Z.; Wang, S.J.; Zheng, H.Y.; Cheng, C. Factor assessment of marine casualties caused by total loss. Int. J. Disaster Risk Reduct. 2020, 47, 101560. [Google Scholar] [CrossRef]
  32. Chen, F.Y.; Lei, S.Y.; Wei, Y.C. Risk analysis of construction accidents with a weighted network model considering accident level. J. Qual. Reliab. Eng. Int. 2022, 39, 1–22. [Google Scholar] [CrossRef]
  33. Xiao, Q.; Fan Luo, F. Safety Risk Evolution of Amphibious Seaplane During Takeoff and Landing——Based on Complex Network. J. Complex. Syst. Complex. Sci. 2019, 16, 19–30. [Google Scholar] [CrossRef]
  34. Zhu, D.R.; Wang, H.F.; Wang, R.; Duan, J.D.; Bai, J. Identification of Key Nodes in a Power Grid Based on Modified PageRank Algorithm. J. Energ. 2022, 15, 797. [Google Scholar] [CrossRef]
  35. Li, Y.L.; Zhou, T. Local Similarity Indices in Link Prediction. J. Univ. Electron. Sci. Technol. China 2021, 50, 422–427. [Google Scholar] [CrossRef]
  36. Yu, Y.; Wang, Y.G.; Luo, Z.G.; Yang, Y.; Wang, X.K.; Tao, G.; Qian, Y. Link prediction algorithm based on clustering coefficient and node centrality. J. Tsinghua Univ. (Sci. Technol.) 2022, 62, 98–104. [Google Scholar] [CrossRef]
  37. Gao, Y.; Yanping Zhang, Y.P.; Qian, F.L.; Zhao, S. Combined with Node Degree and Node Clustering Coefficient of Link Prediction Algorithm. J. Chin. Comput. Syst. 2017, 38, 1436–1441. [Google Scholar] [CrossRef]
  38. Tom, F. An introduction to ROC analysis. J. Pattern Recognit. Lett. 2003, 27, 861–874. [Google Scholar] [CrossRef]
Figure 1. Accident location heat map.
Jmse 13 01060 g001
Figure 2. Distribution of accident levels.
Jmse 13 01060 g002
Figure 3. Type of accident and number of casualties.
Jmse 13 01060 g003
Figure 4. Framework for analyzing the risk evolution paths of water traffic accidents.
Jmse 13 01060 g004
Figure 5. Risk evolution shortest path solution process.
Jmse 13 01060 g005
Figure 6. Inland river accident risk evolution network model.
Jmse 13 01060 g006
Figure 7. Comparison of AUC value of similarity index of node importance.
Jmse 13 01060 g007
Figure 8. Risk evolution directed network matrix.
Jmse 13 01060 g008
Table 1. Risk factors.
TypeNode NumberNodeNode NumberNode
Human factors1Weak safety awareness11Drowsy driving
2Improper operation12Lookout negligence
3Captain’s failure to perform13Illegal operation
4Unfamiliar hydrological environment14No early avoidance
5Underestimation of risk15Driving without caution
6Improper route selection16Unused safe speed
7Insufficient skill level17Improper on-duty
8Inexperienced18Poor communication
9Drunk driving19Improper avoidance measures
10Improper anchoring method20Improper emergency response
Ship factors21Not displaying the AIS signal27Improper cargo stowage
22Overload28Lack of maintenance
23Unairworthiness29Equipment failure
24Unballasted30Device missing
25Insufficient watertightness of the cabin31Unsealed cabin trimming
26Ship compartment flooding32No signal type shown
Environmental factors33Heavy wind and waves36Poor visibility
34Complex navigation environment37Rainstorm
35Unfavorable water flow38Lack of warnings and lighting
Management factors39Failure to implement main responsibility 43Lack of training
40Insufficient shore-based support44Understaffed
41Incompetent crew 45Lack of management
42Lack of rules and regulations 46Lack of emergency drills
Accident type47Grounding 51Collision
48Stranding 52Sinking
49Contact 53Wind damage
50Fire/ Explosion 54Other
Table 2. Some accident chain samples.
Serial NumberTimeTypeAccident Chain
12 April 2015SinkingInsufficient watertightness of the cabin—Ship compartment flooding—Sinking
211 June 2015CollisionLookout negligence—No early avoidance—Collision
324 July 2015OtherWeak safety awareness—Other
417 April 2016Fire/ExplosionEquipment failure—Underestimation of risk—Fire/Explosion
55 October 2016ContactDriving without caution — Weak safety awareness—Contact
631 December 2017CollisionUnused safe speed—Driving without caution—Lookout negligence—No early avoidance—Collision
729 July 2018GroundingIncompetent crew—Device missing—Insufficient skill level—Grounding
89 April 2019StrandingLookout negligence—Complex navigation environment—Underestimation of risk—Stranding
95 July 2020Fire/ExplosionEquipment failure—Improper on-duty—Fire/Explosion
102 June 2021SinkingLack of management—Underestimation of risk—Heavy wind and waves—Sinking
Table 3. Node importance ranking.
Serial NumberDegreeBetweenness CentralityCloseness CentralityPagerank Value
Node NumberValueNode numberValueNode NumberValueNode NumberValue
11233120.084867120.726027120.059338
213310.0836410.72602710.058595
31332130.068689130.716216130.056326
4230170.05444620.69736820.051428
552850.04618750.67948750.045726
61726330.045794170.6625170.037438
7332420.042661330.638554330.032926
8292360.03955760.630952290.032111
92023230.034172200.630952200.03137
10722450.026698290.630952450.029854
Table 4. Model accuracy comparison.
CND.CNPR.CNBC.CNCC.CN
DegreePRBetweenness CentralityCloseness Centrality
AUC0.77850.77070.75890.73010.7813
Optimize ratio (%)/−0.78−1.96−4.840.28
RAM.RA
DegreePRBetweenness CentralityCloseness Centrality
AUC0.79560.81760.81700.76410.7749
Optimize ratio (%)/2.202.14−3.15−2.07
JacM1.Jaccard
DegreePRBetweenness CentralityCloseness Centrality
AUC0.65420.68880.64860.62300.6967
Optimize ratio (%)--3.46−0.56−3.124.25
JacM2.Jaccard
DegreePRBetweenness CentralityCloseness Centrality
AUC0.65420.66610.65210.63440.6651
Optimize ratio (%)/−0.781.19−0.21−1.98
Table 5. Evolution paths of various types of accident risks.
Serial NumberGroundingStrandingContactFire/Explosion
PathDistancePathDistancePathDistancePathDistance
12–471.46055–481.670511–4913–502.0413
26–471.51956–481.77271212–4912–13–502.2763
31–2–471.709312–5–481.93911313–4917–502.3089
412–2–471.711223–5–482.071455–495–13–502.3545
513–2–471.732745–5–482.096422–4923–13–502.3921
633–2–471.778629–5–482.143966–4945–13–502.4139
75–2–471.79461–12–5–482.16521717–1–4943–13–502.4884
823–2–471.834716–5–482.18962323–12–4916–13–502.4955
945–2–471.85835–5–482.21164545–1–491–12–13–502.5024
107–471.88217–12–5–482.2192020–4941–13–502.5721
Average path distance2.87803.33761.85113.6577
Serial numberCollisionSinkingWind damageOther
PathDistancePathDistancePathDistancePathDistance
11–510.53313–520.429833–532.38531–540.4663
212–510.537217–520.48615–532.505813–540.5103
313–510.583233–520.50221–33–532.696233–540.5963
45–510.71591–520.526517–33–532.77015–540.6264
52–510.73035–520.527512–5–532.77442–540.639
617–1–510.81282–520.538123–33–532.85312–13–540.7453
76–12–510.859523–520.590845–5–532.931617–1–540.7462
823–12–510.877320–520.663813–1–33–532.943620–540.7883
945–1–510.894312–13–520.664829–5–532.97927–540.8234
1020–510.90097–520.693416–5–533.024945–1–540.8277
Average path distance1.80011.66003.93601.7439
Disclaimer/Publisher’s Note: The statements, opinions and data contained in all publications are solely those of the individual author(s) and contributor(s) and not of MDPI and/or the editor(s). MDPI and/or the editor(s) disclaim responsibility for any injury to people or property resulting from any ideas, methods, instructions or products referred to in the content.

