
Comparative Analysis of Hydrodynamic Characteristics off Shandong Under the Influence of Two Types of Storm Surges


Abstract
1. Introduction
2. Numerical Models
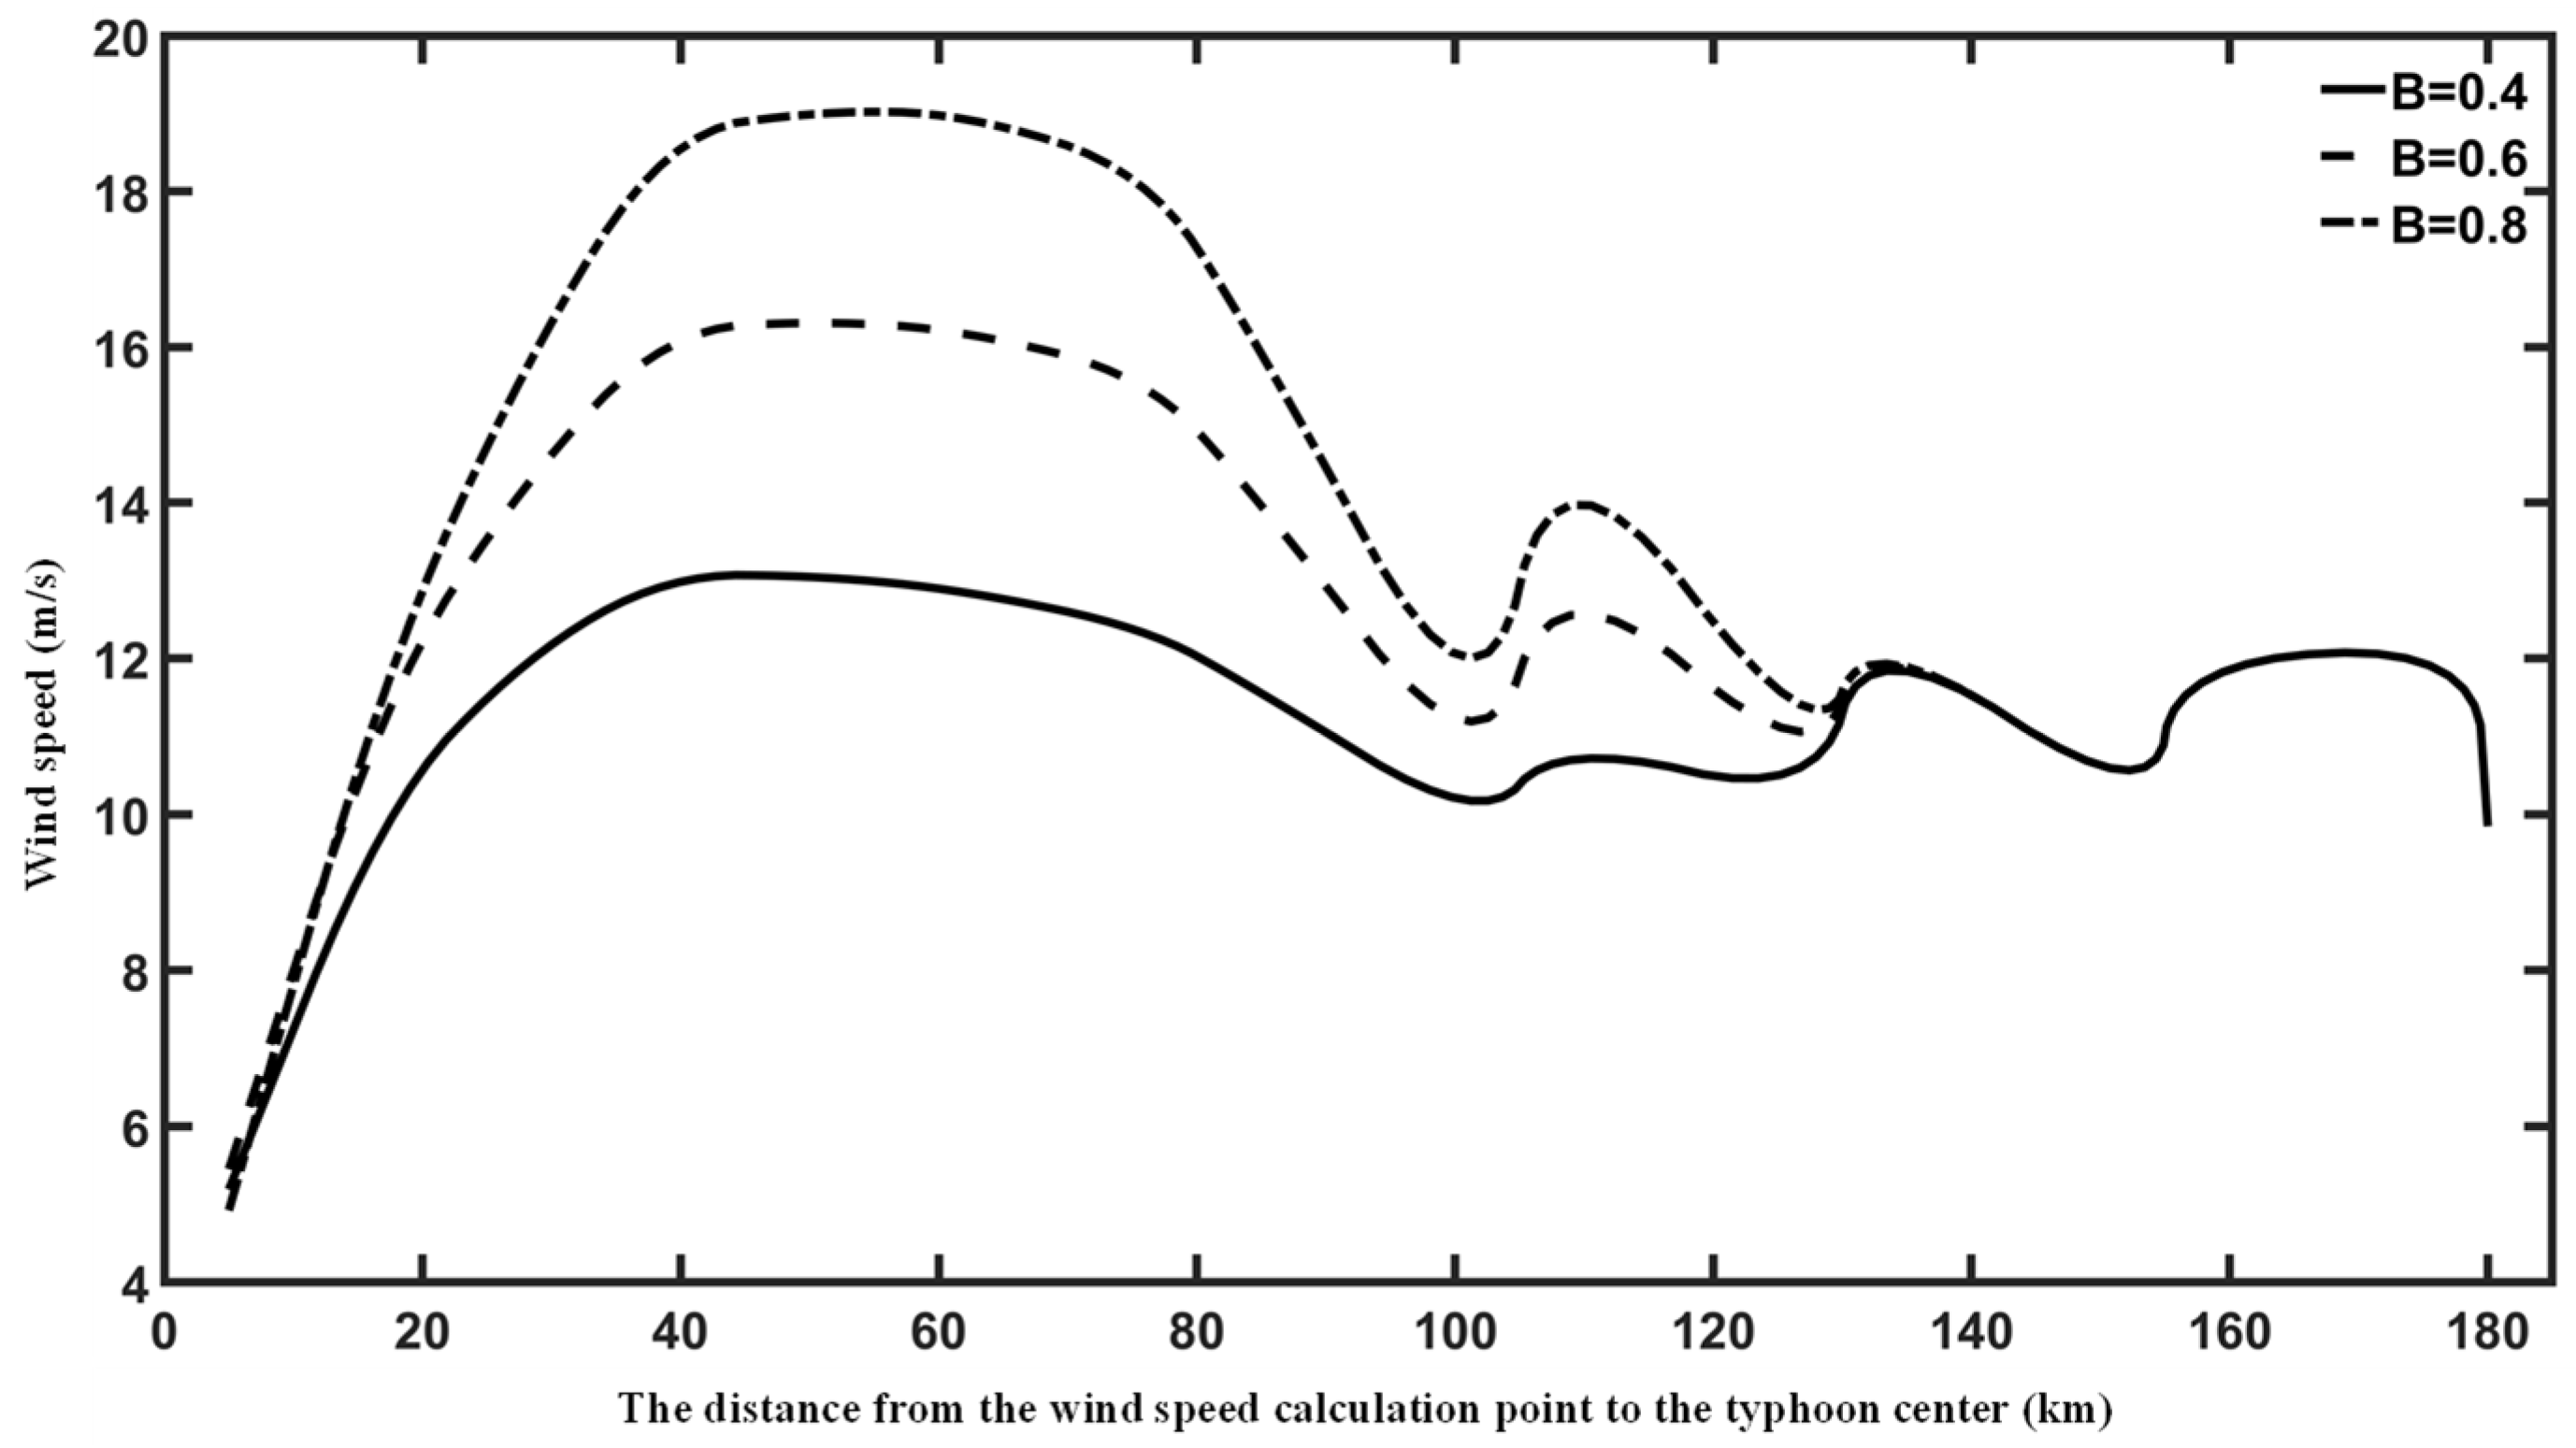
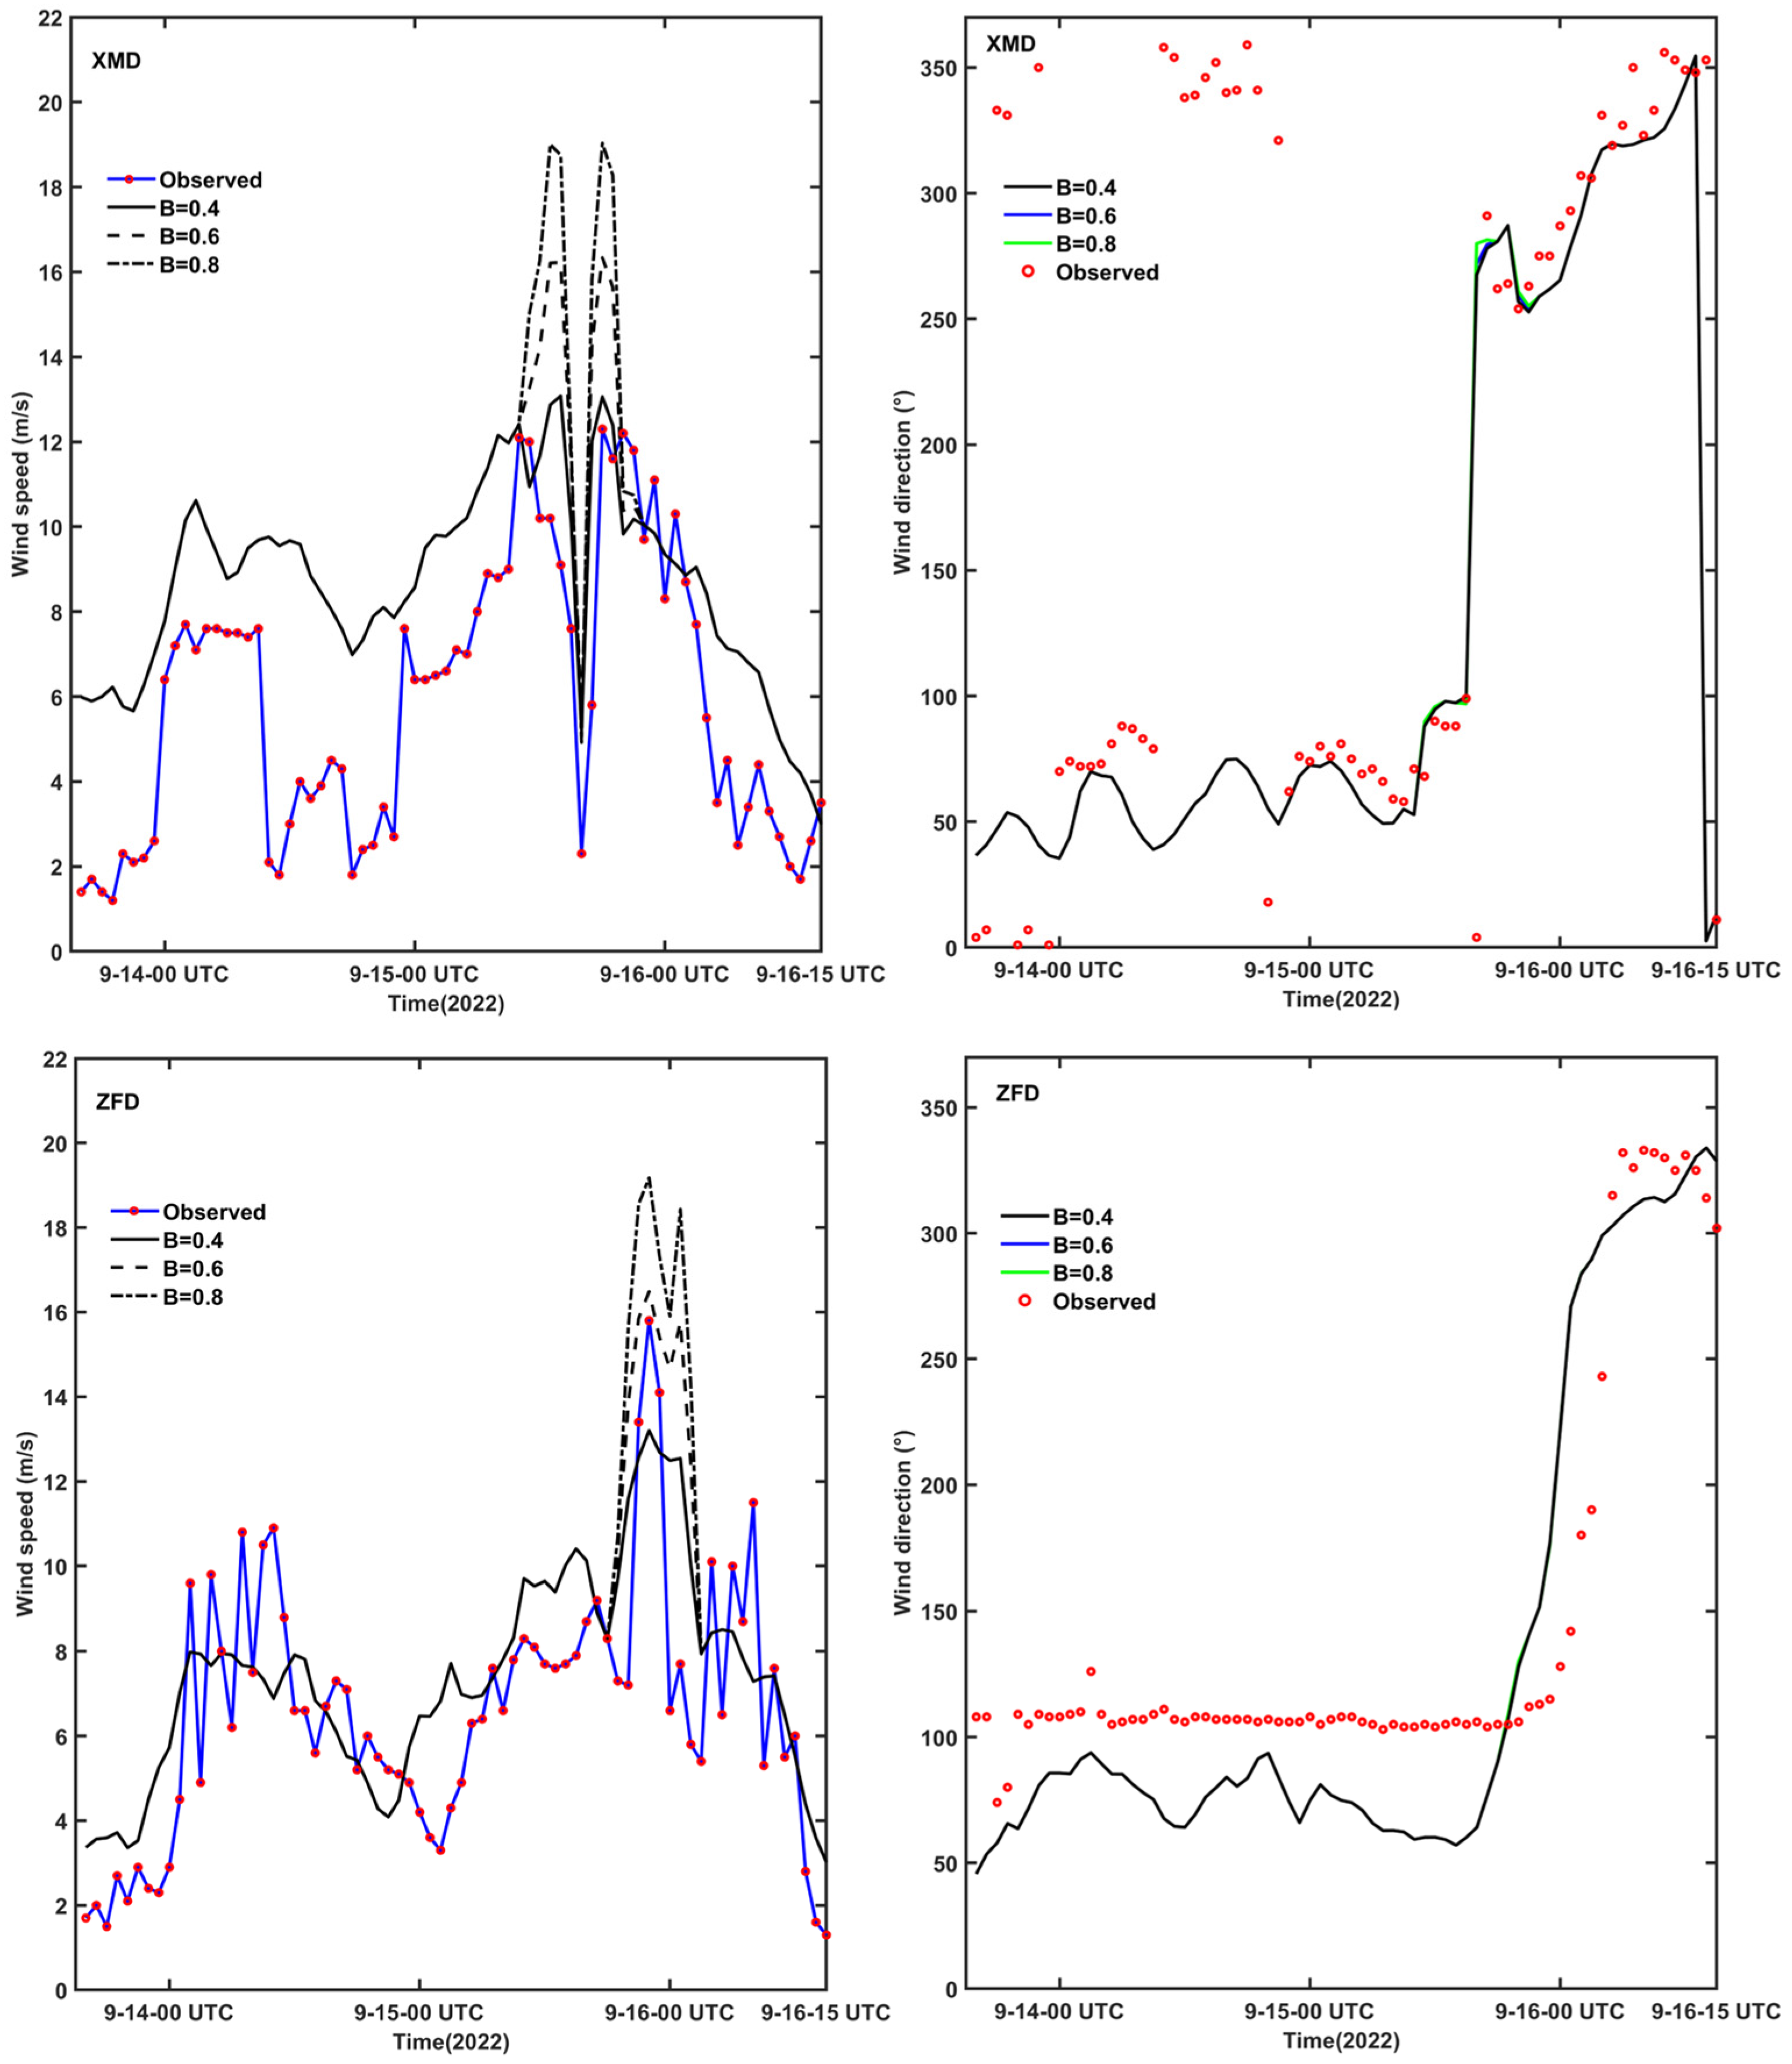
2.1. Holland-ERA5
2.2. FVCOM-SWAVE
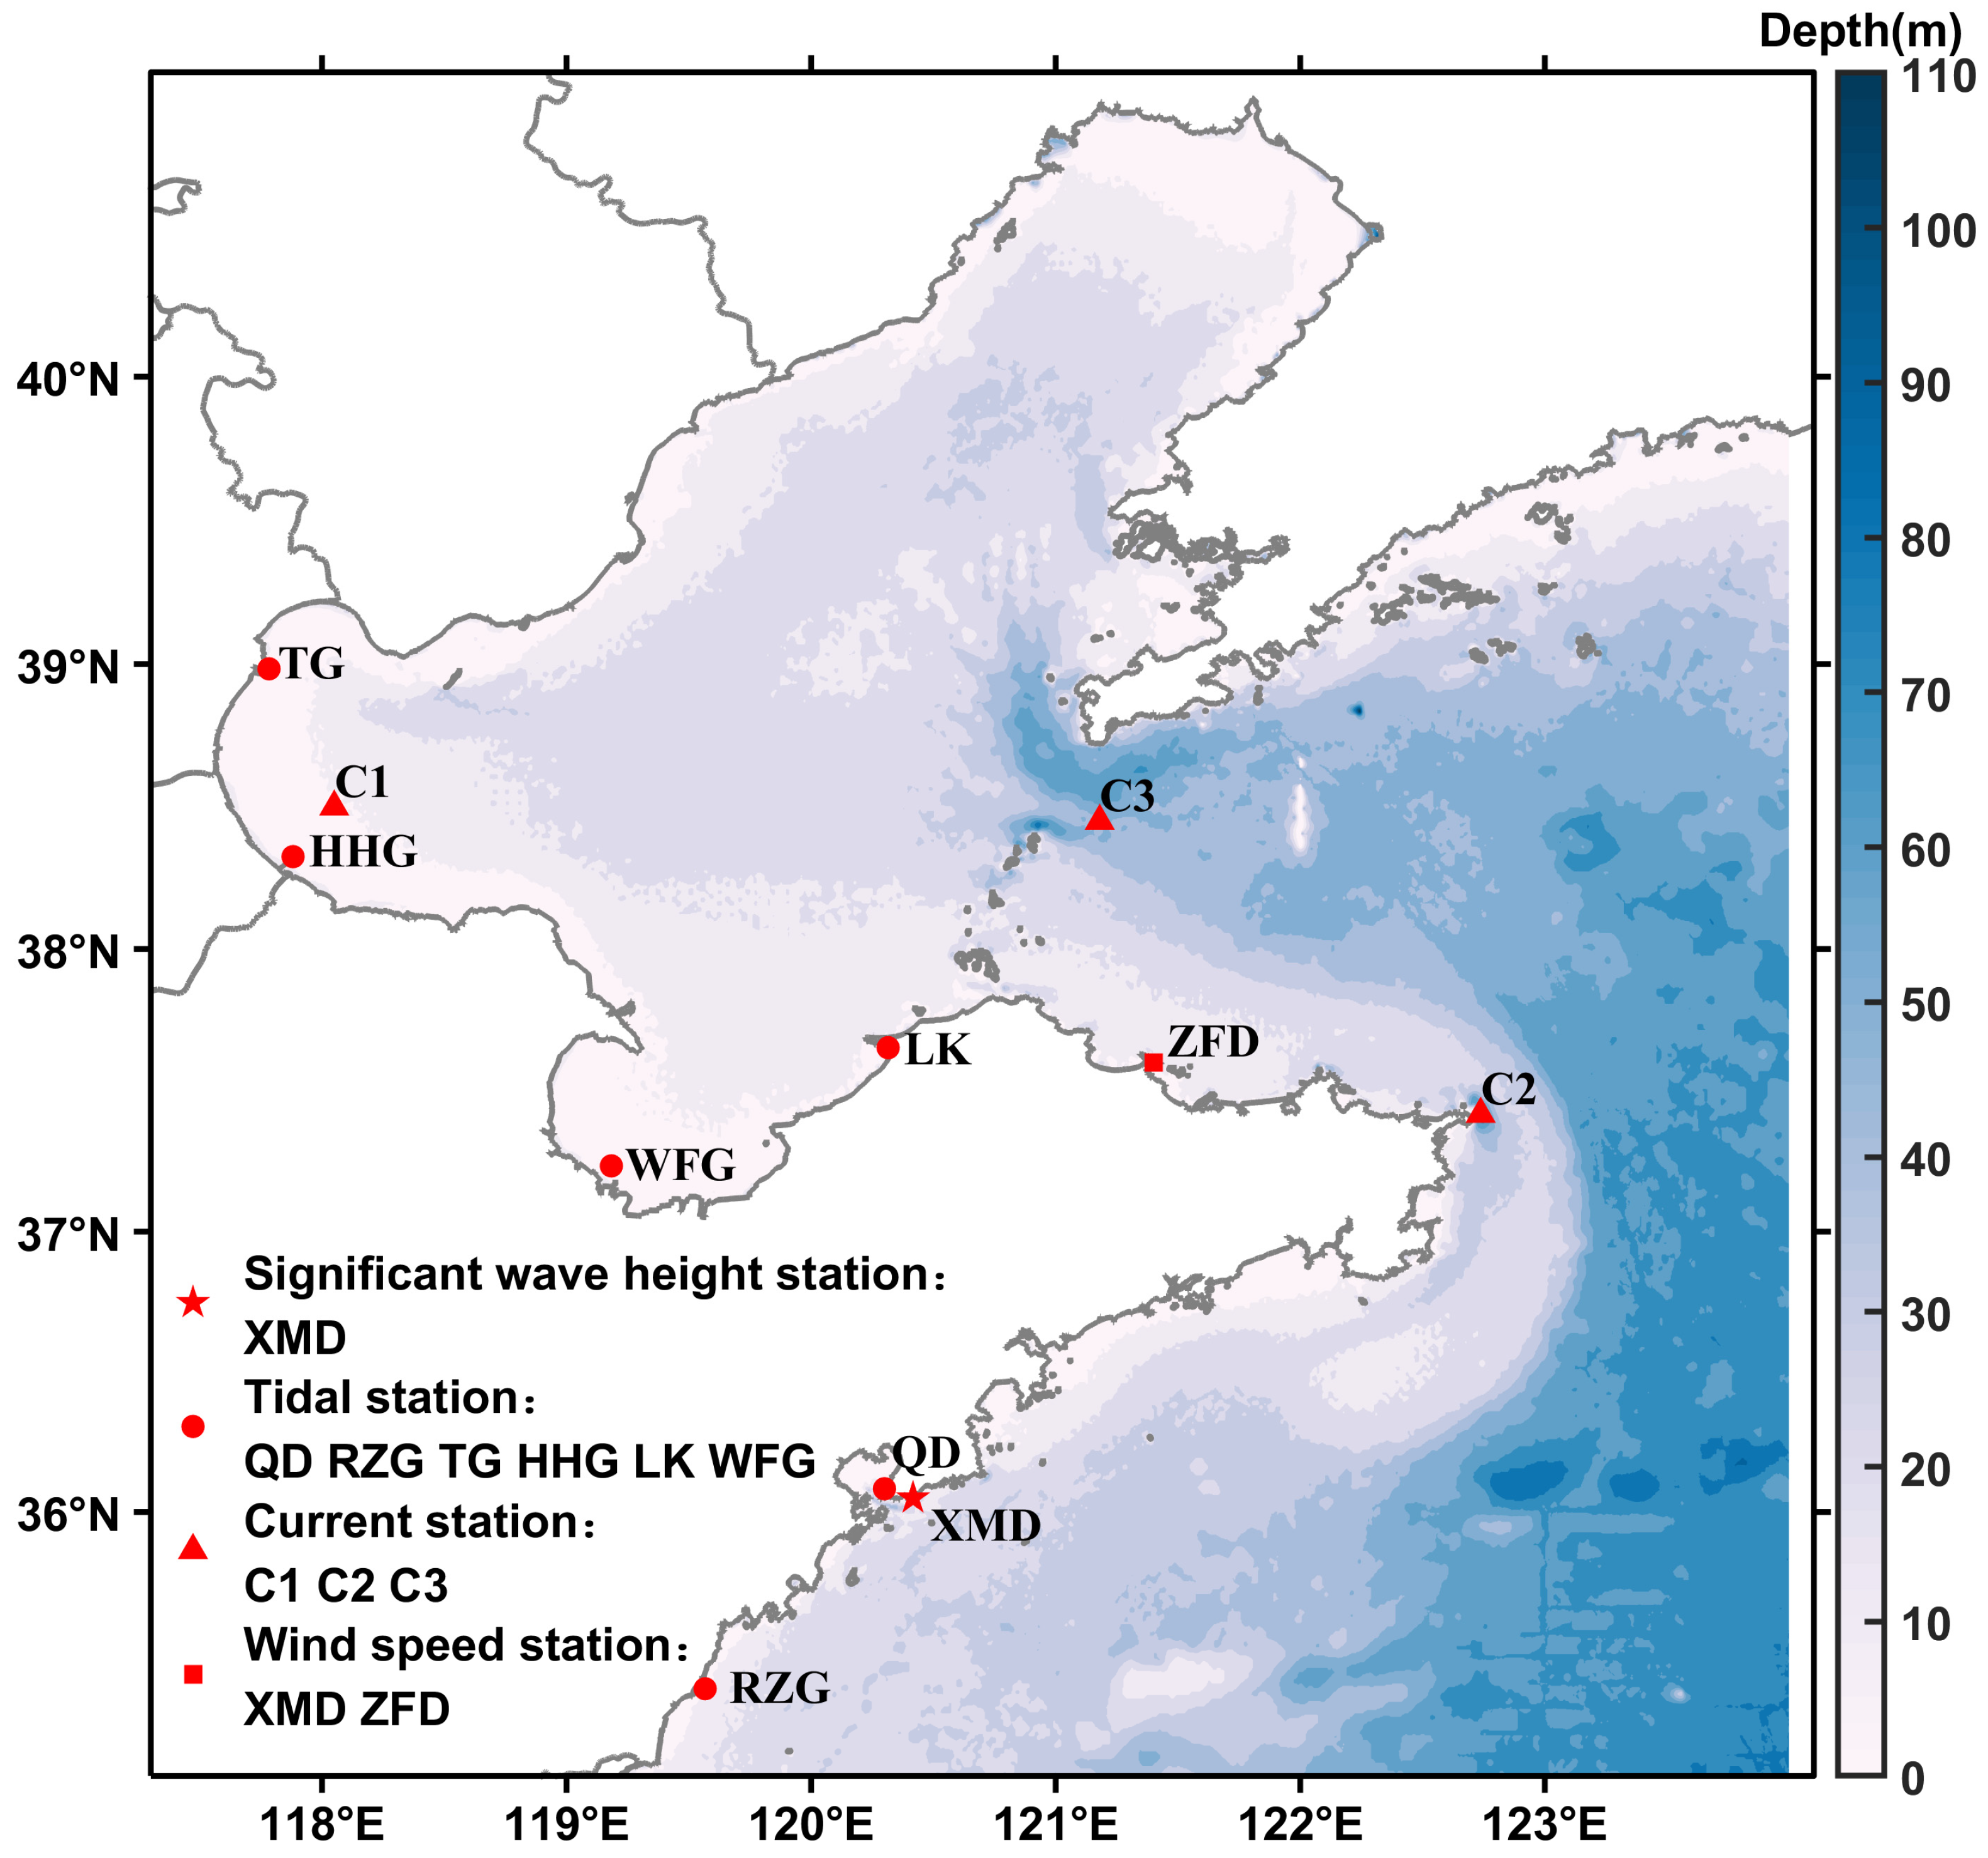
3. Model Setup
4. Results
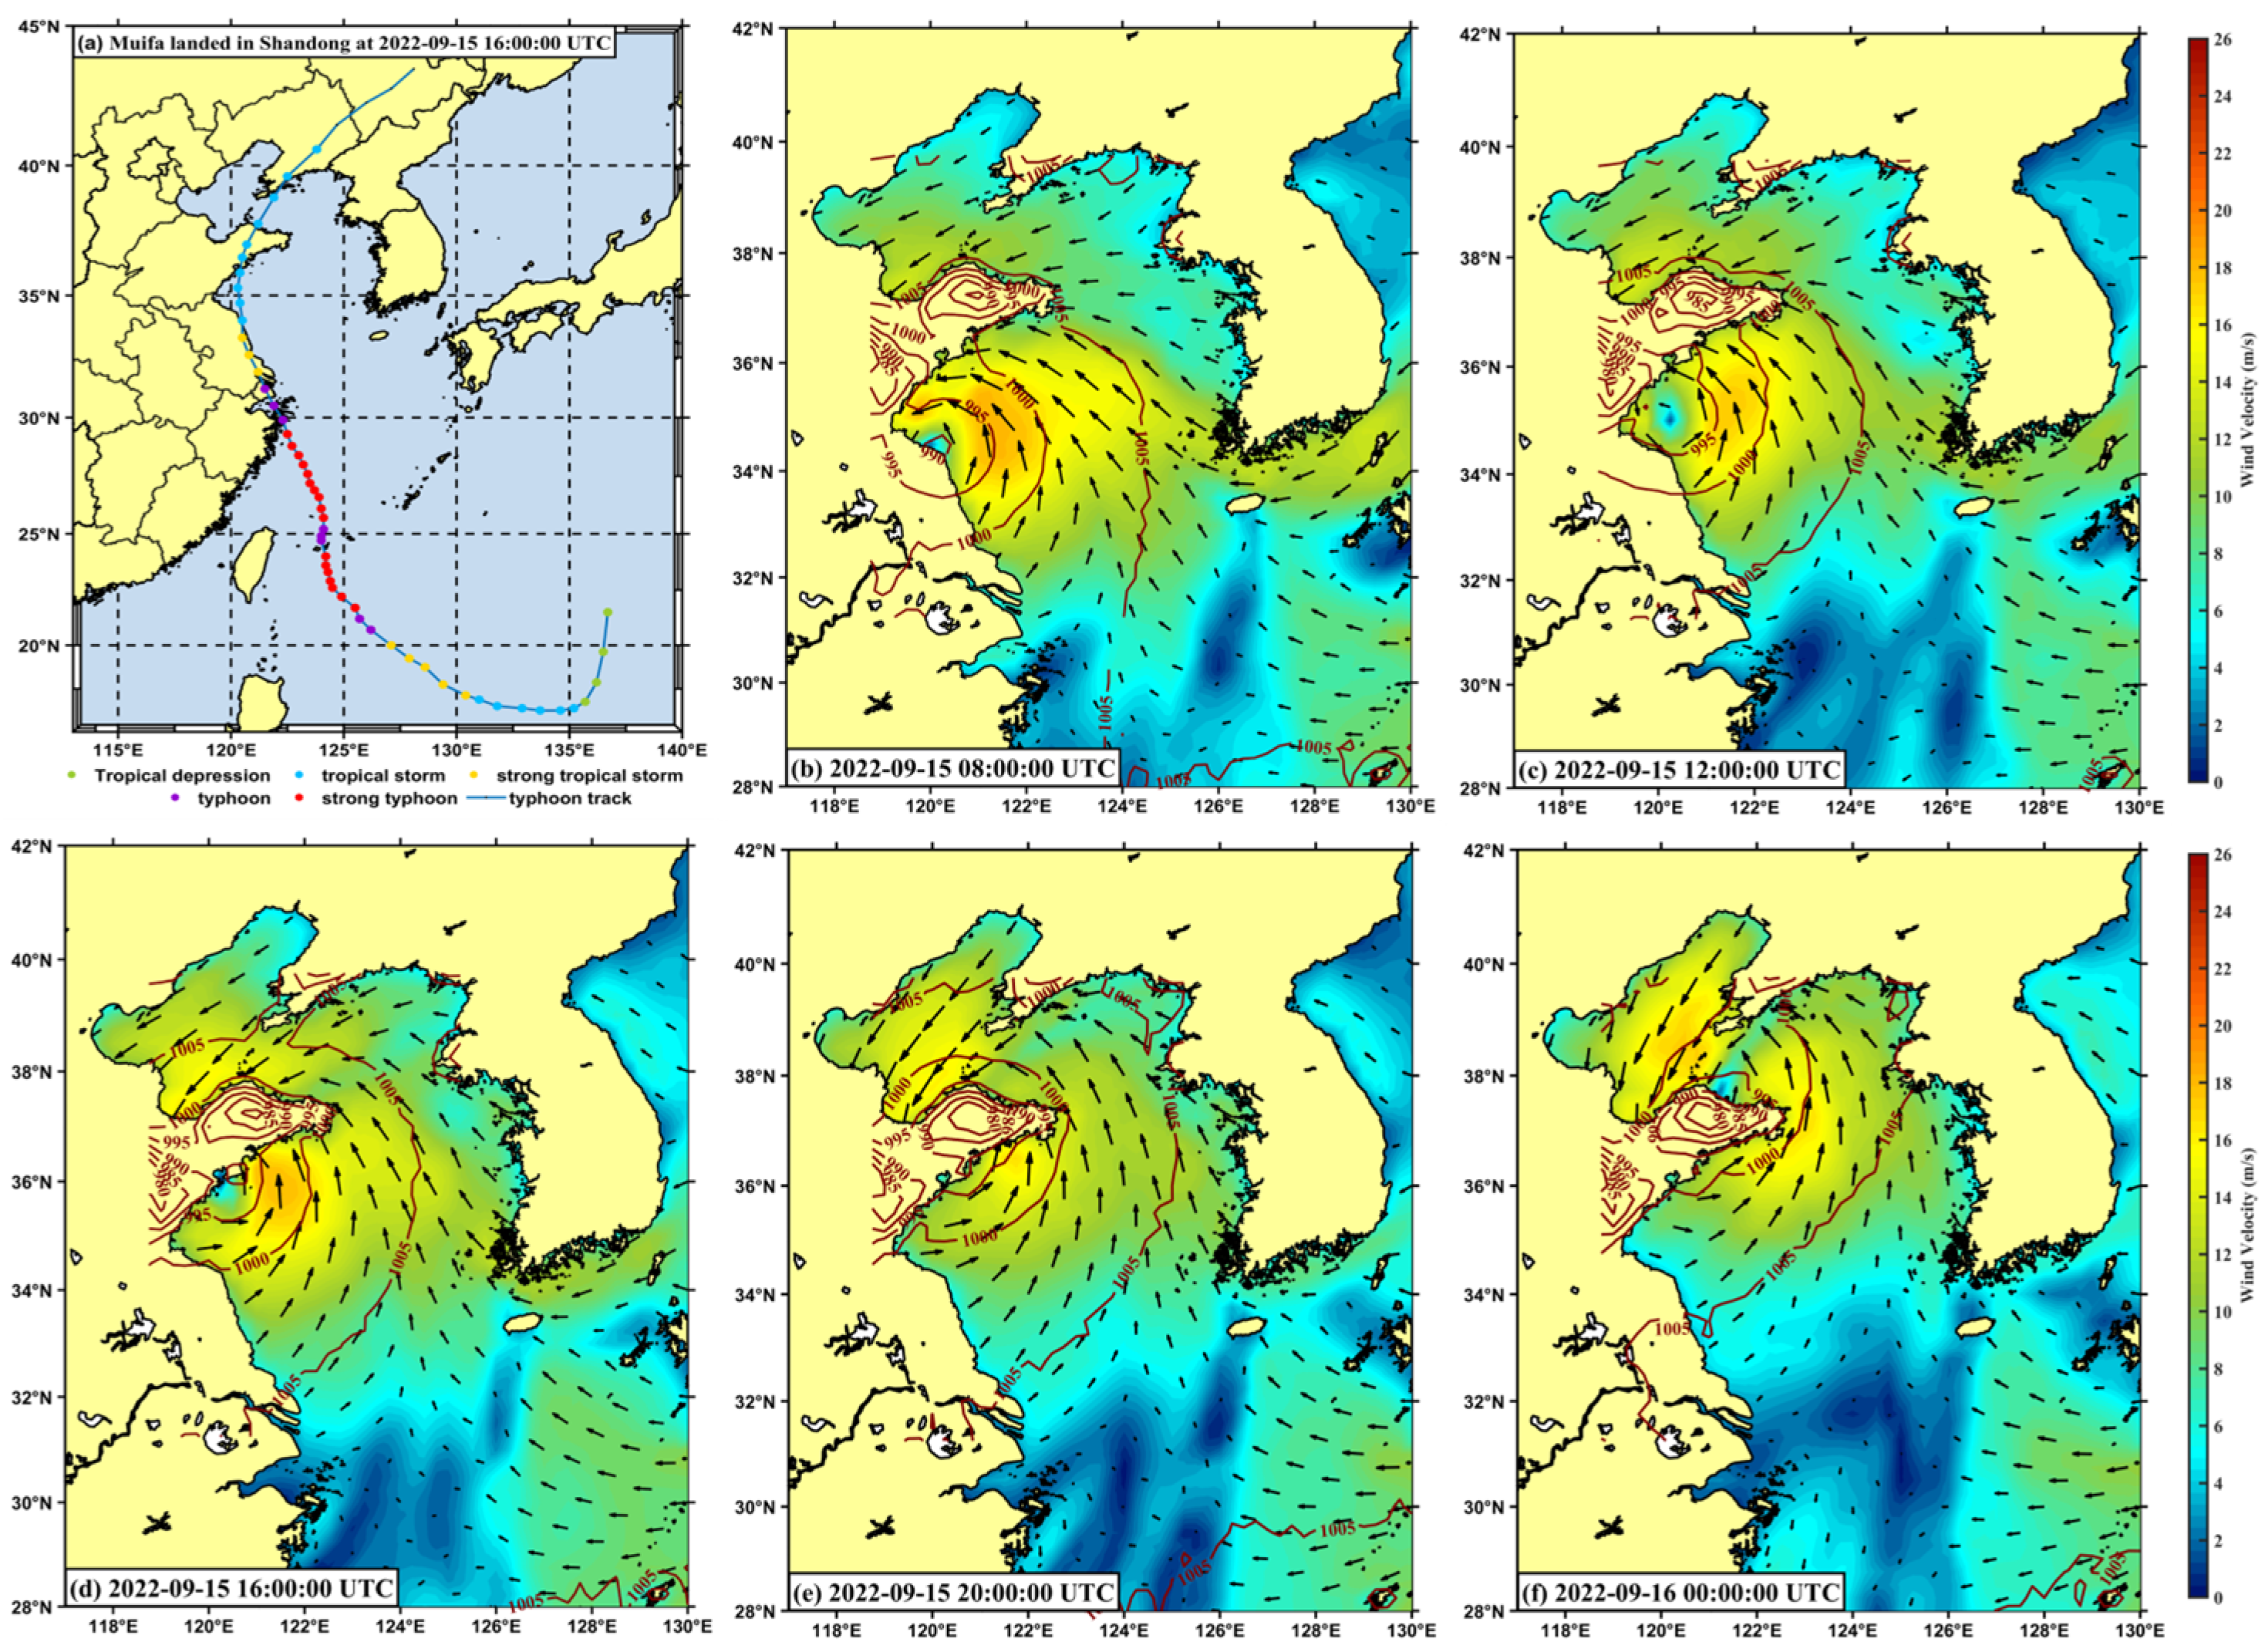
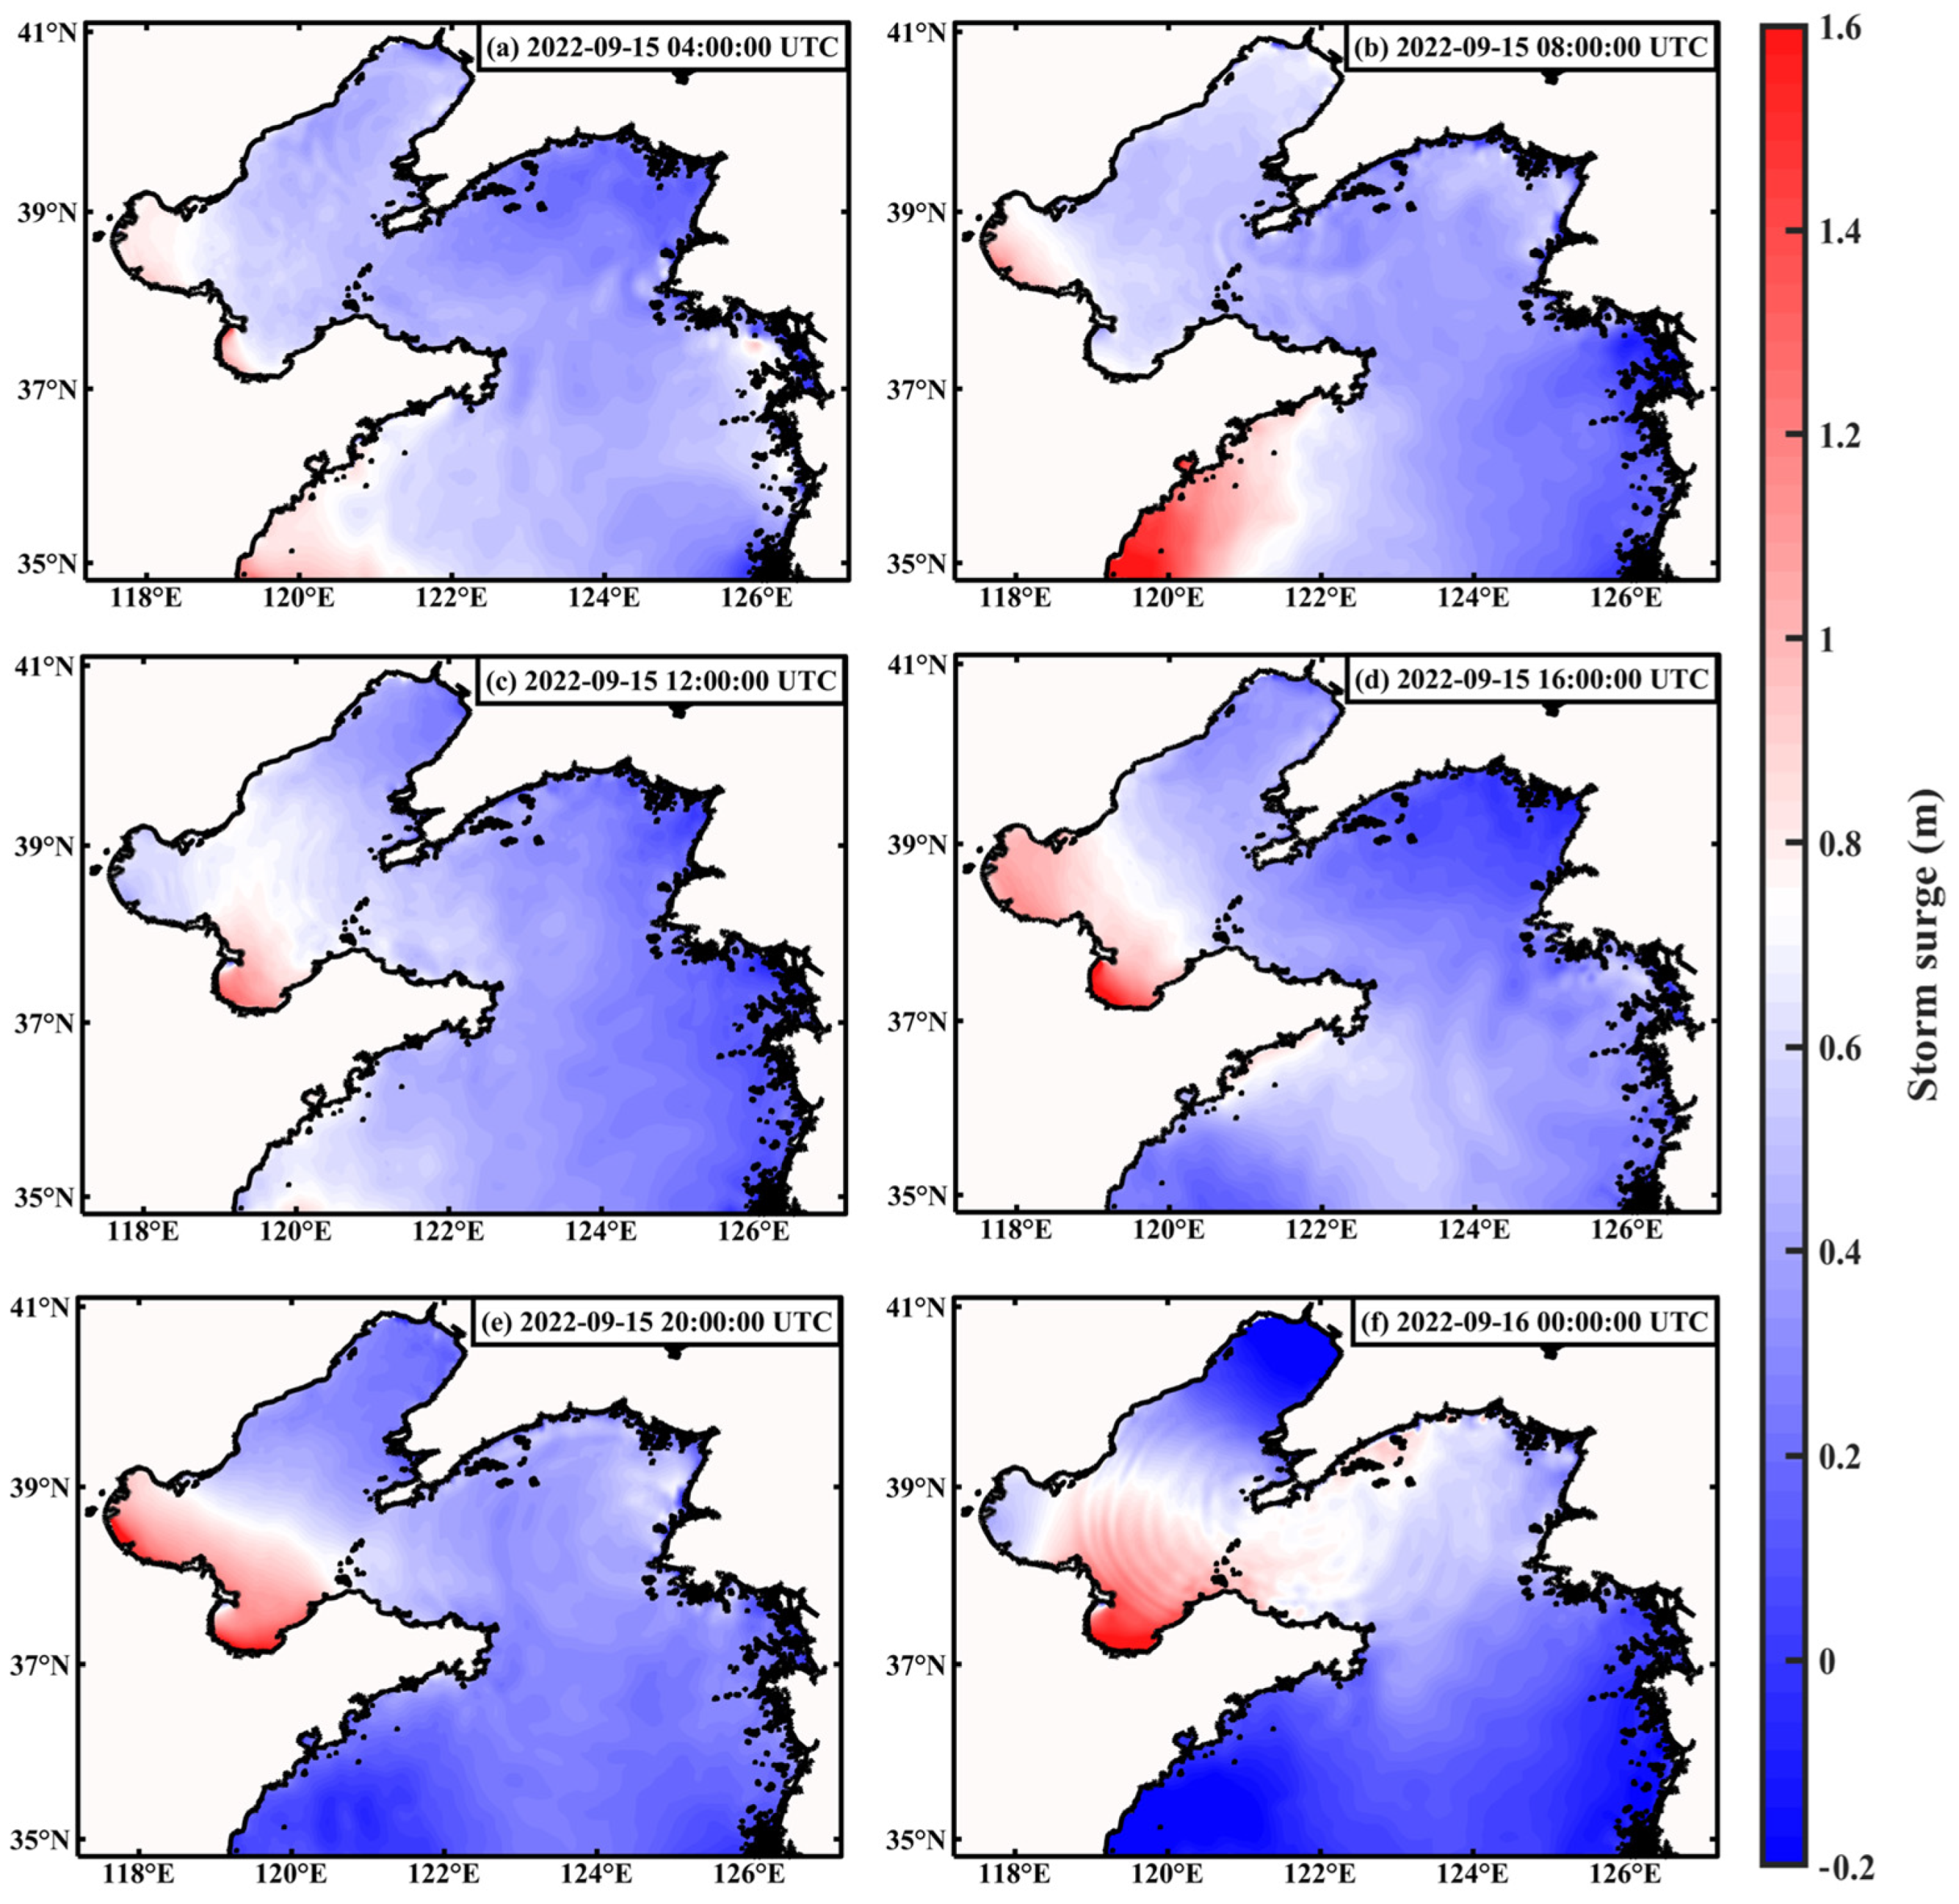
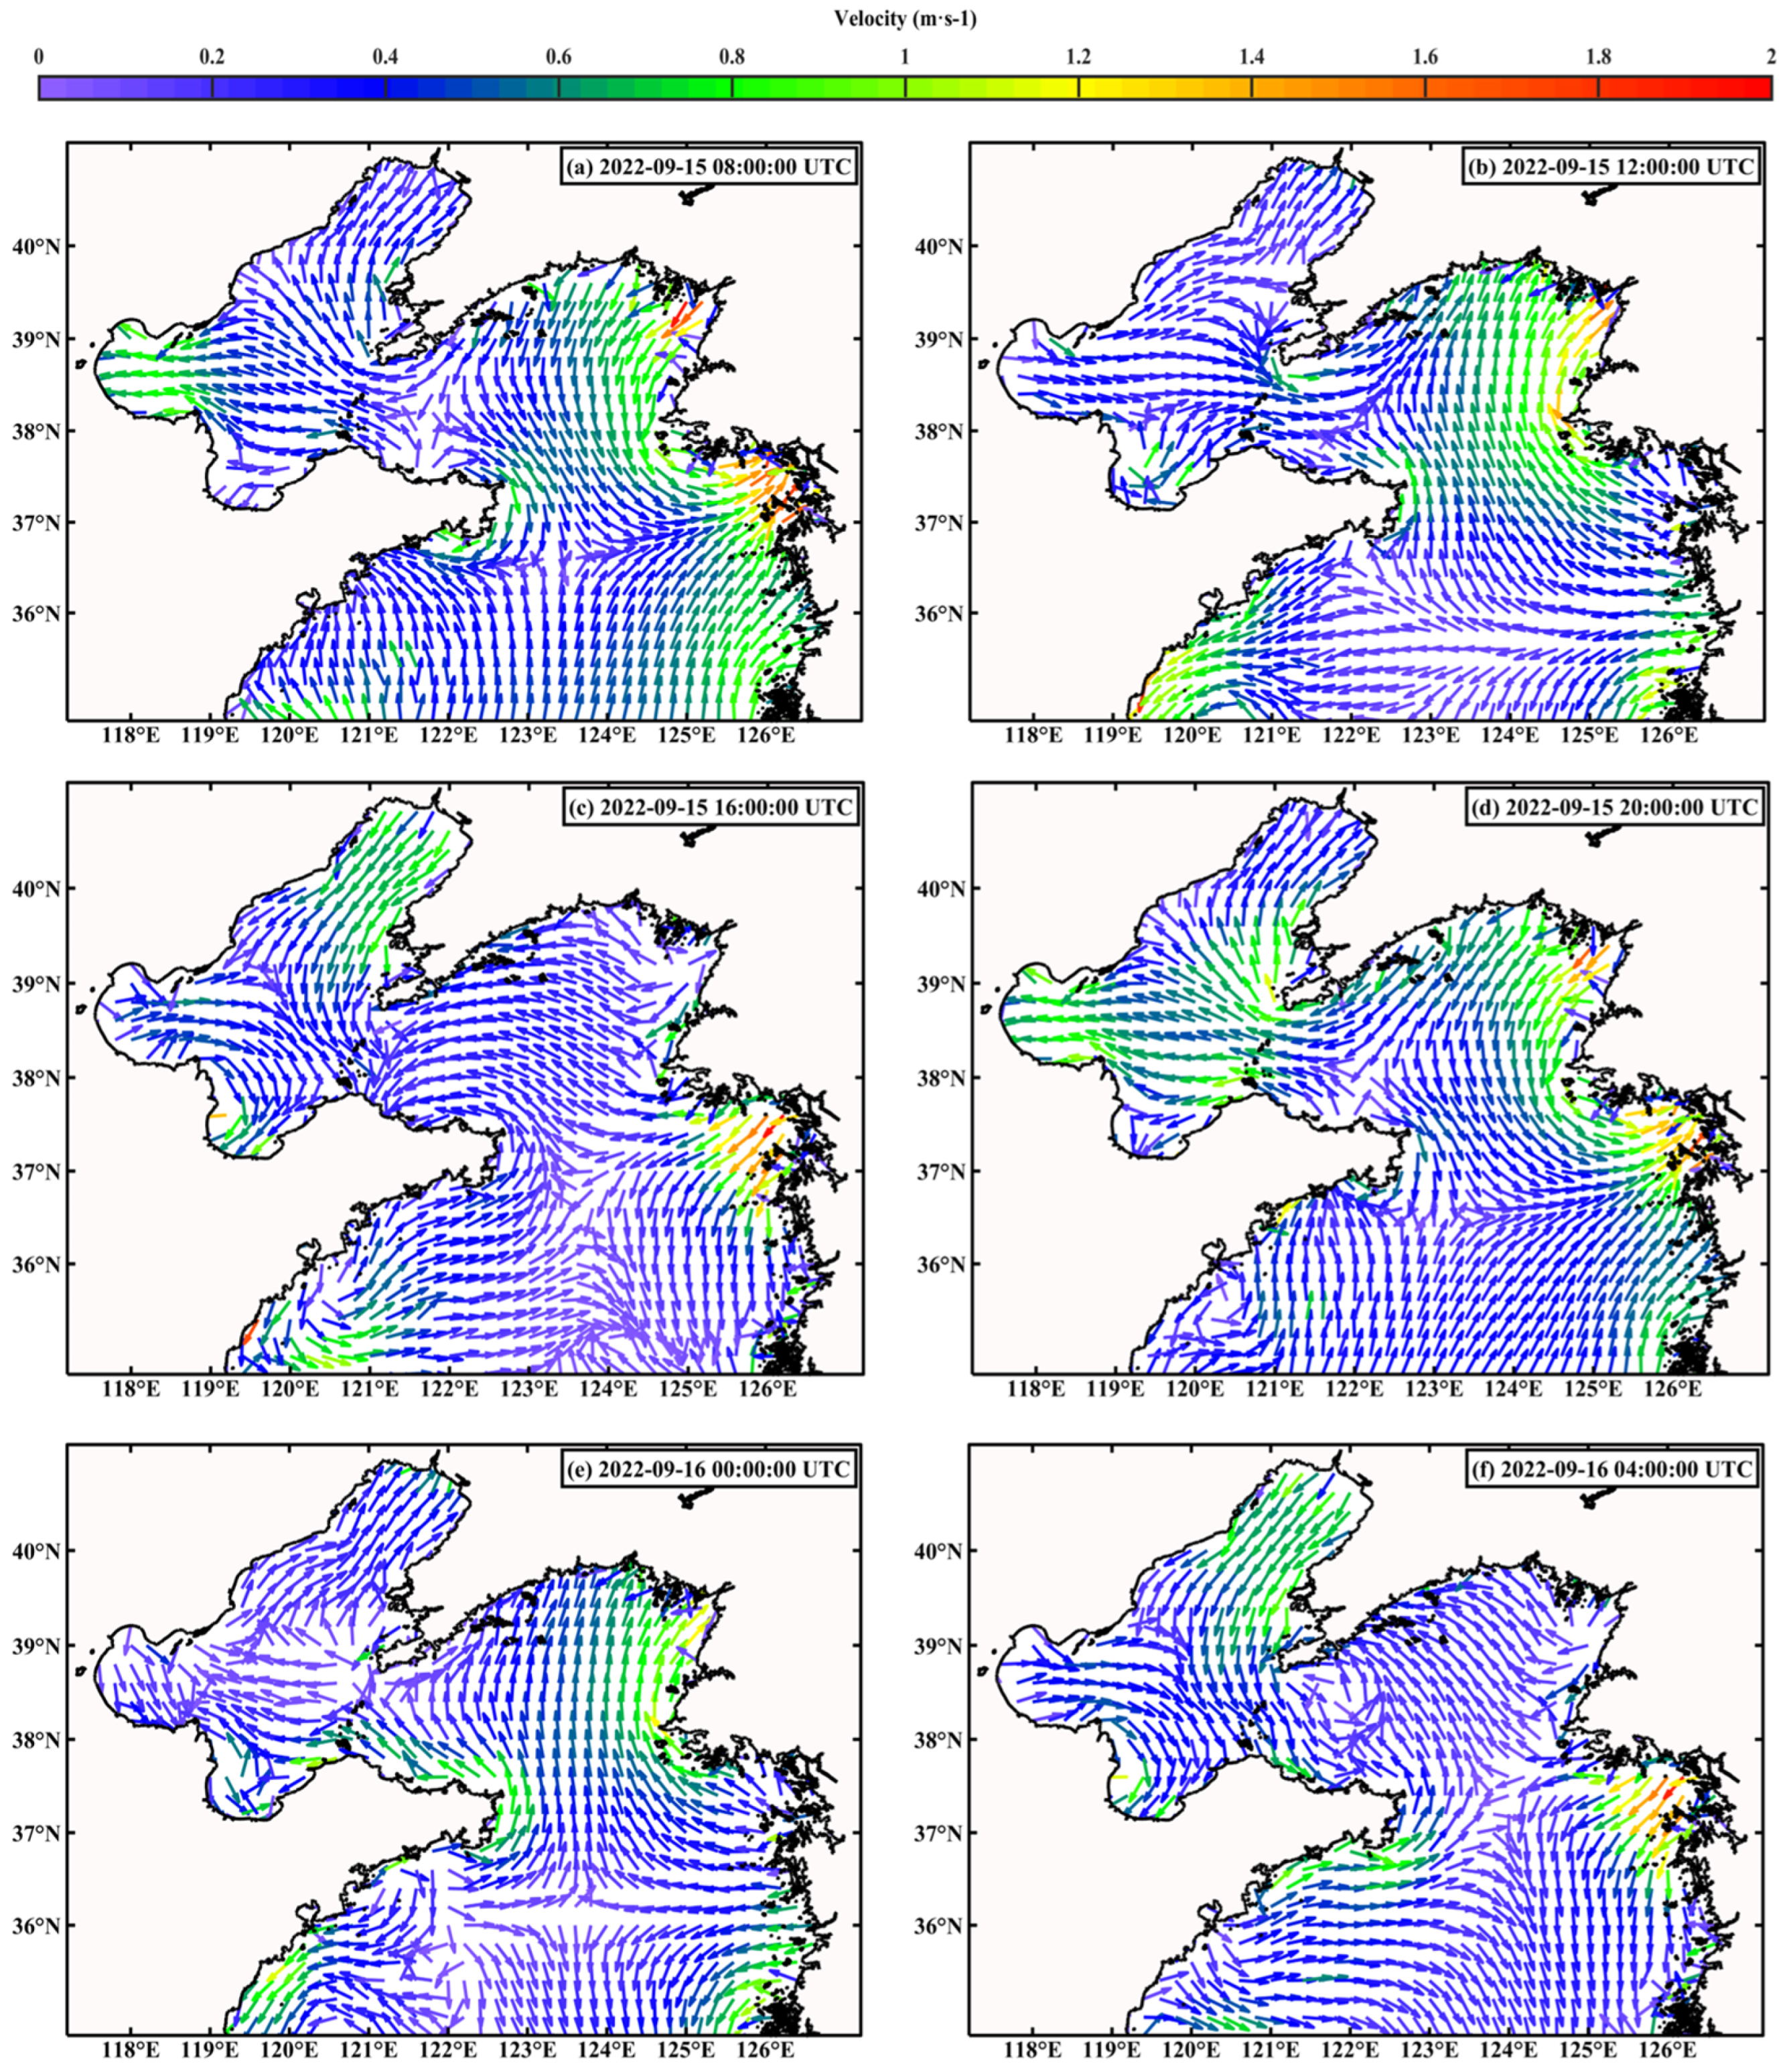
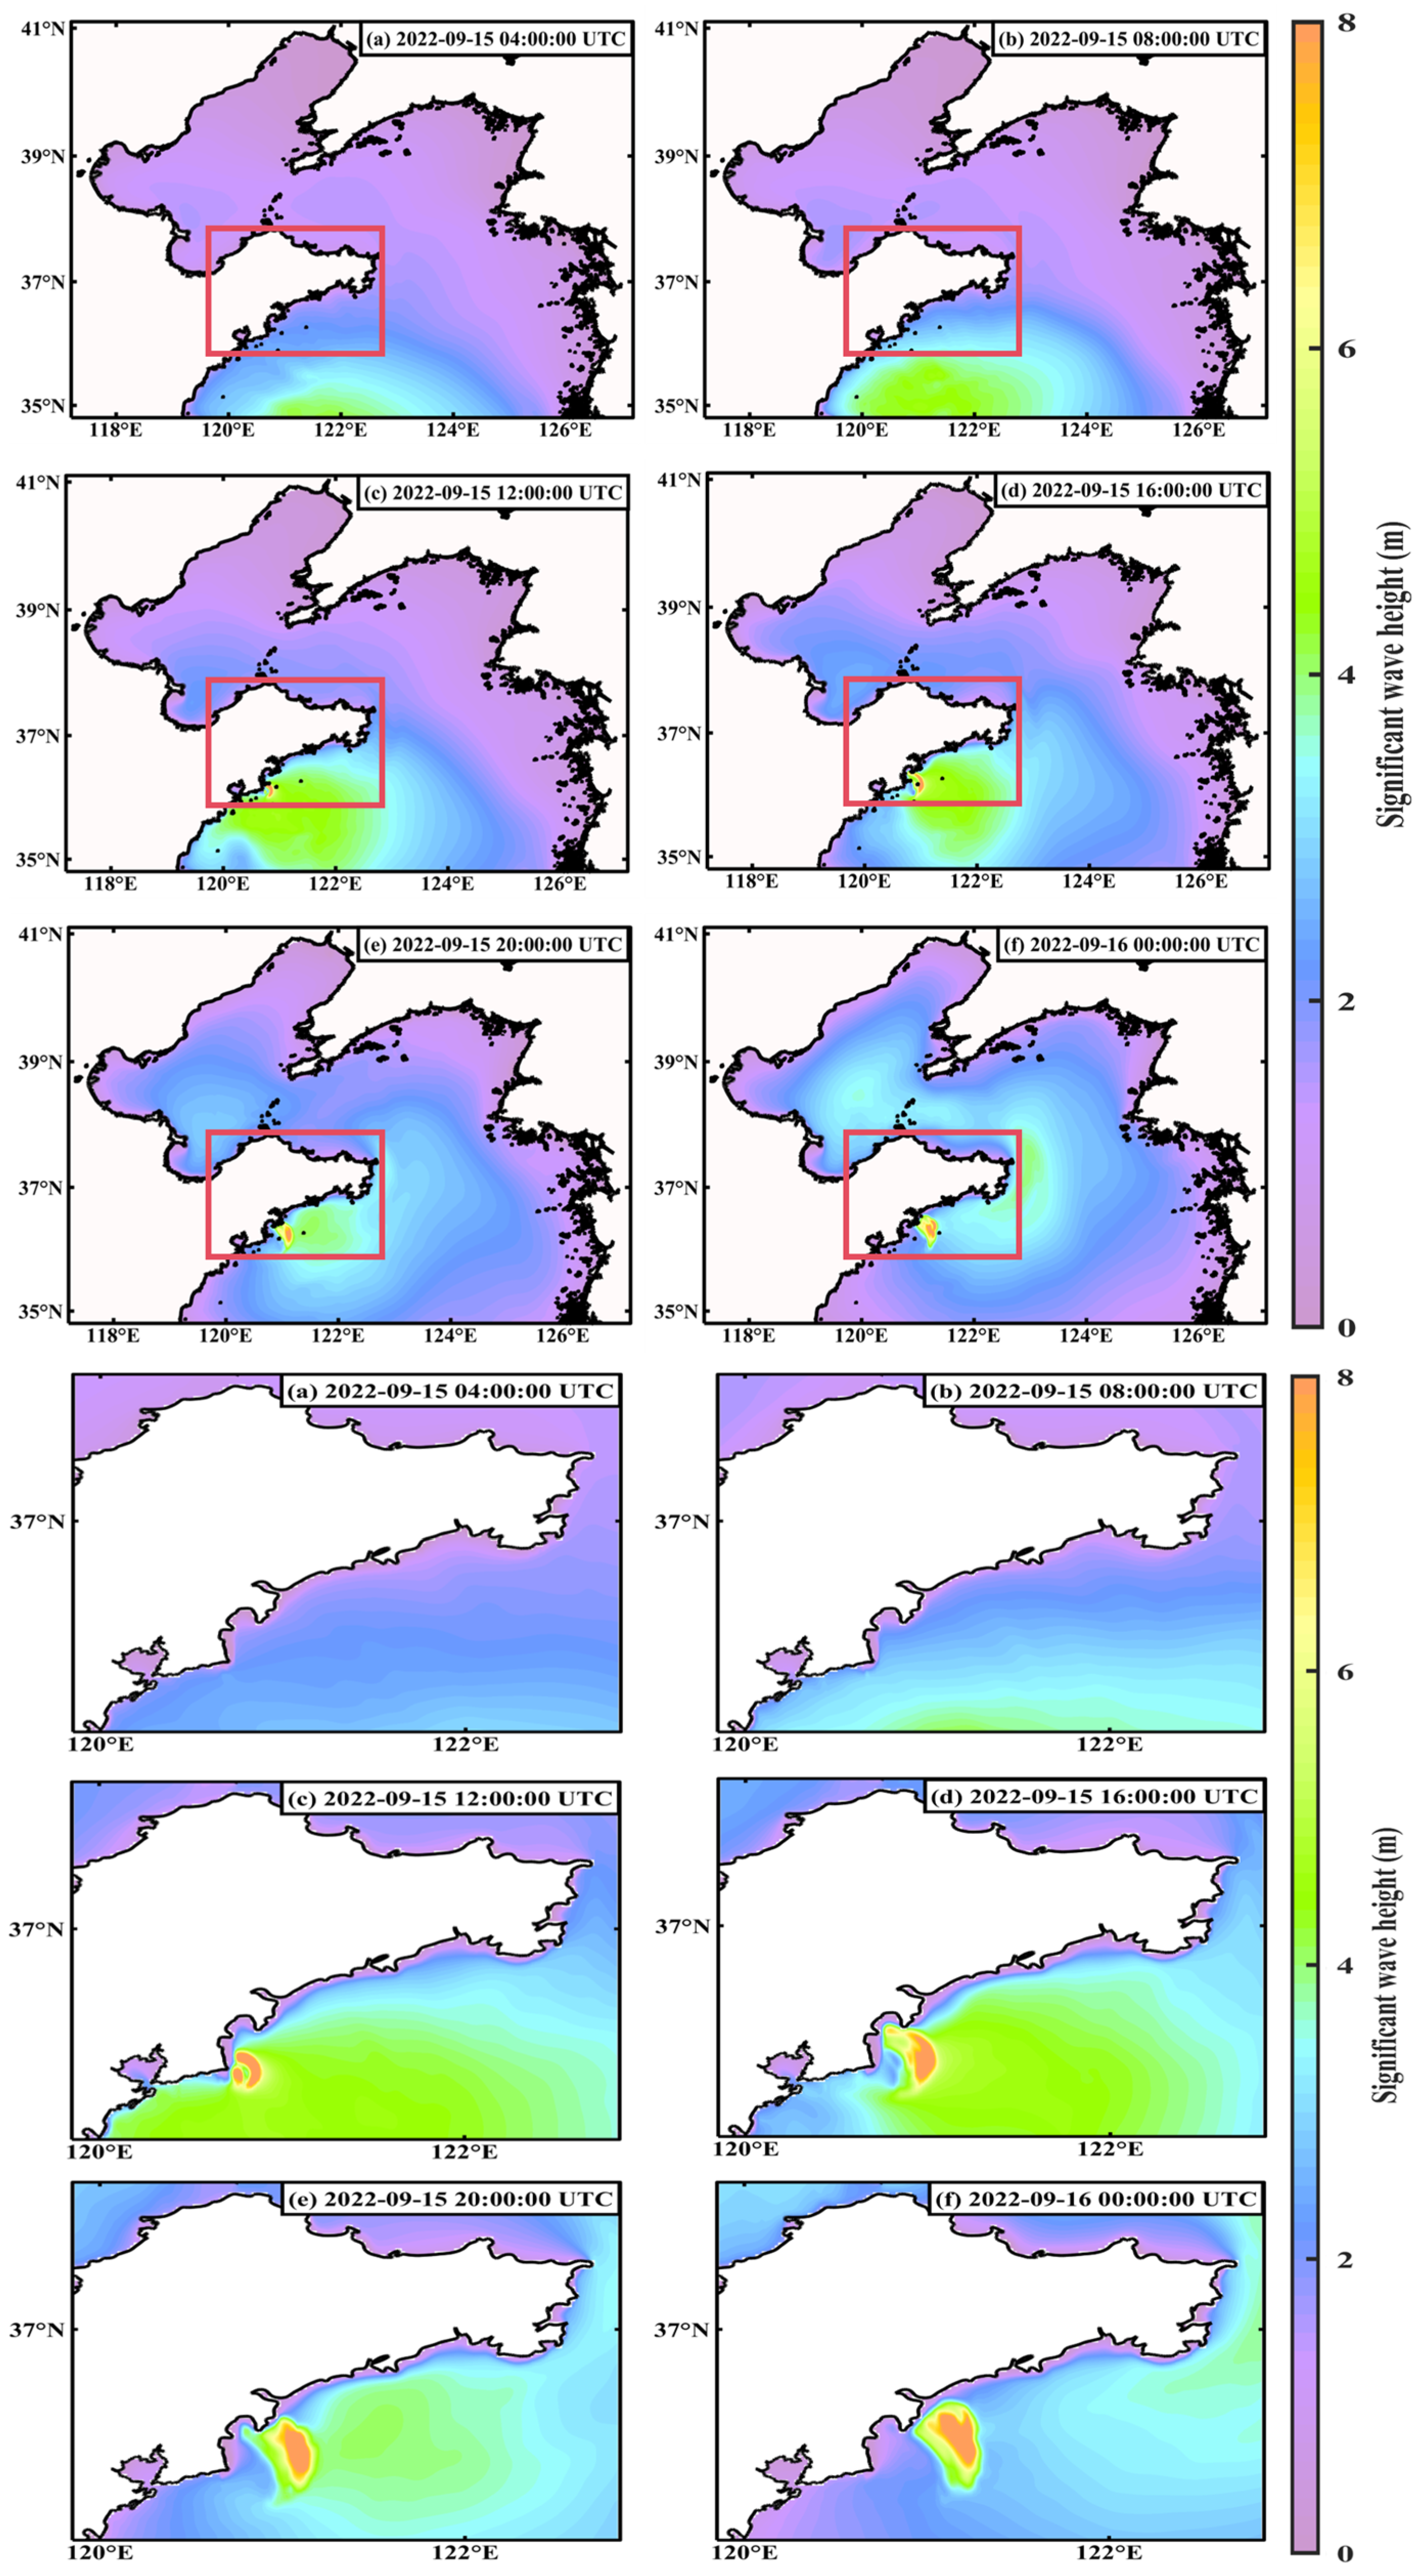
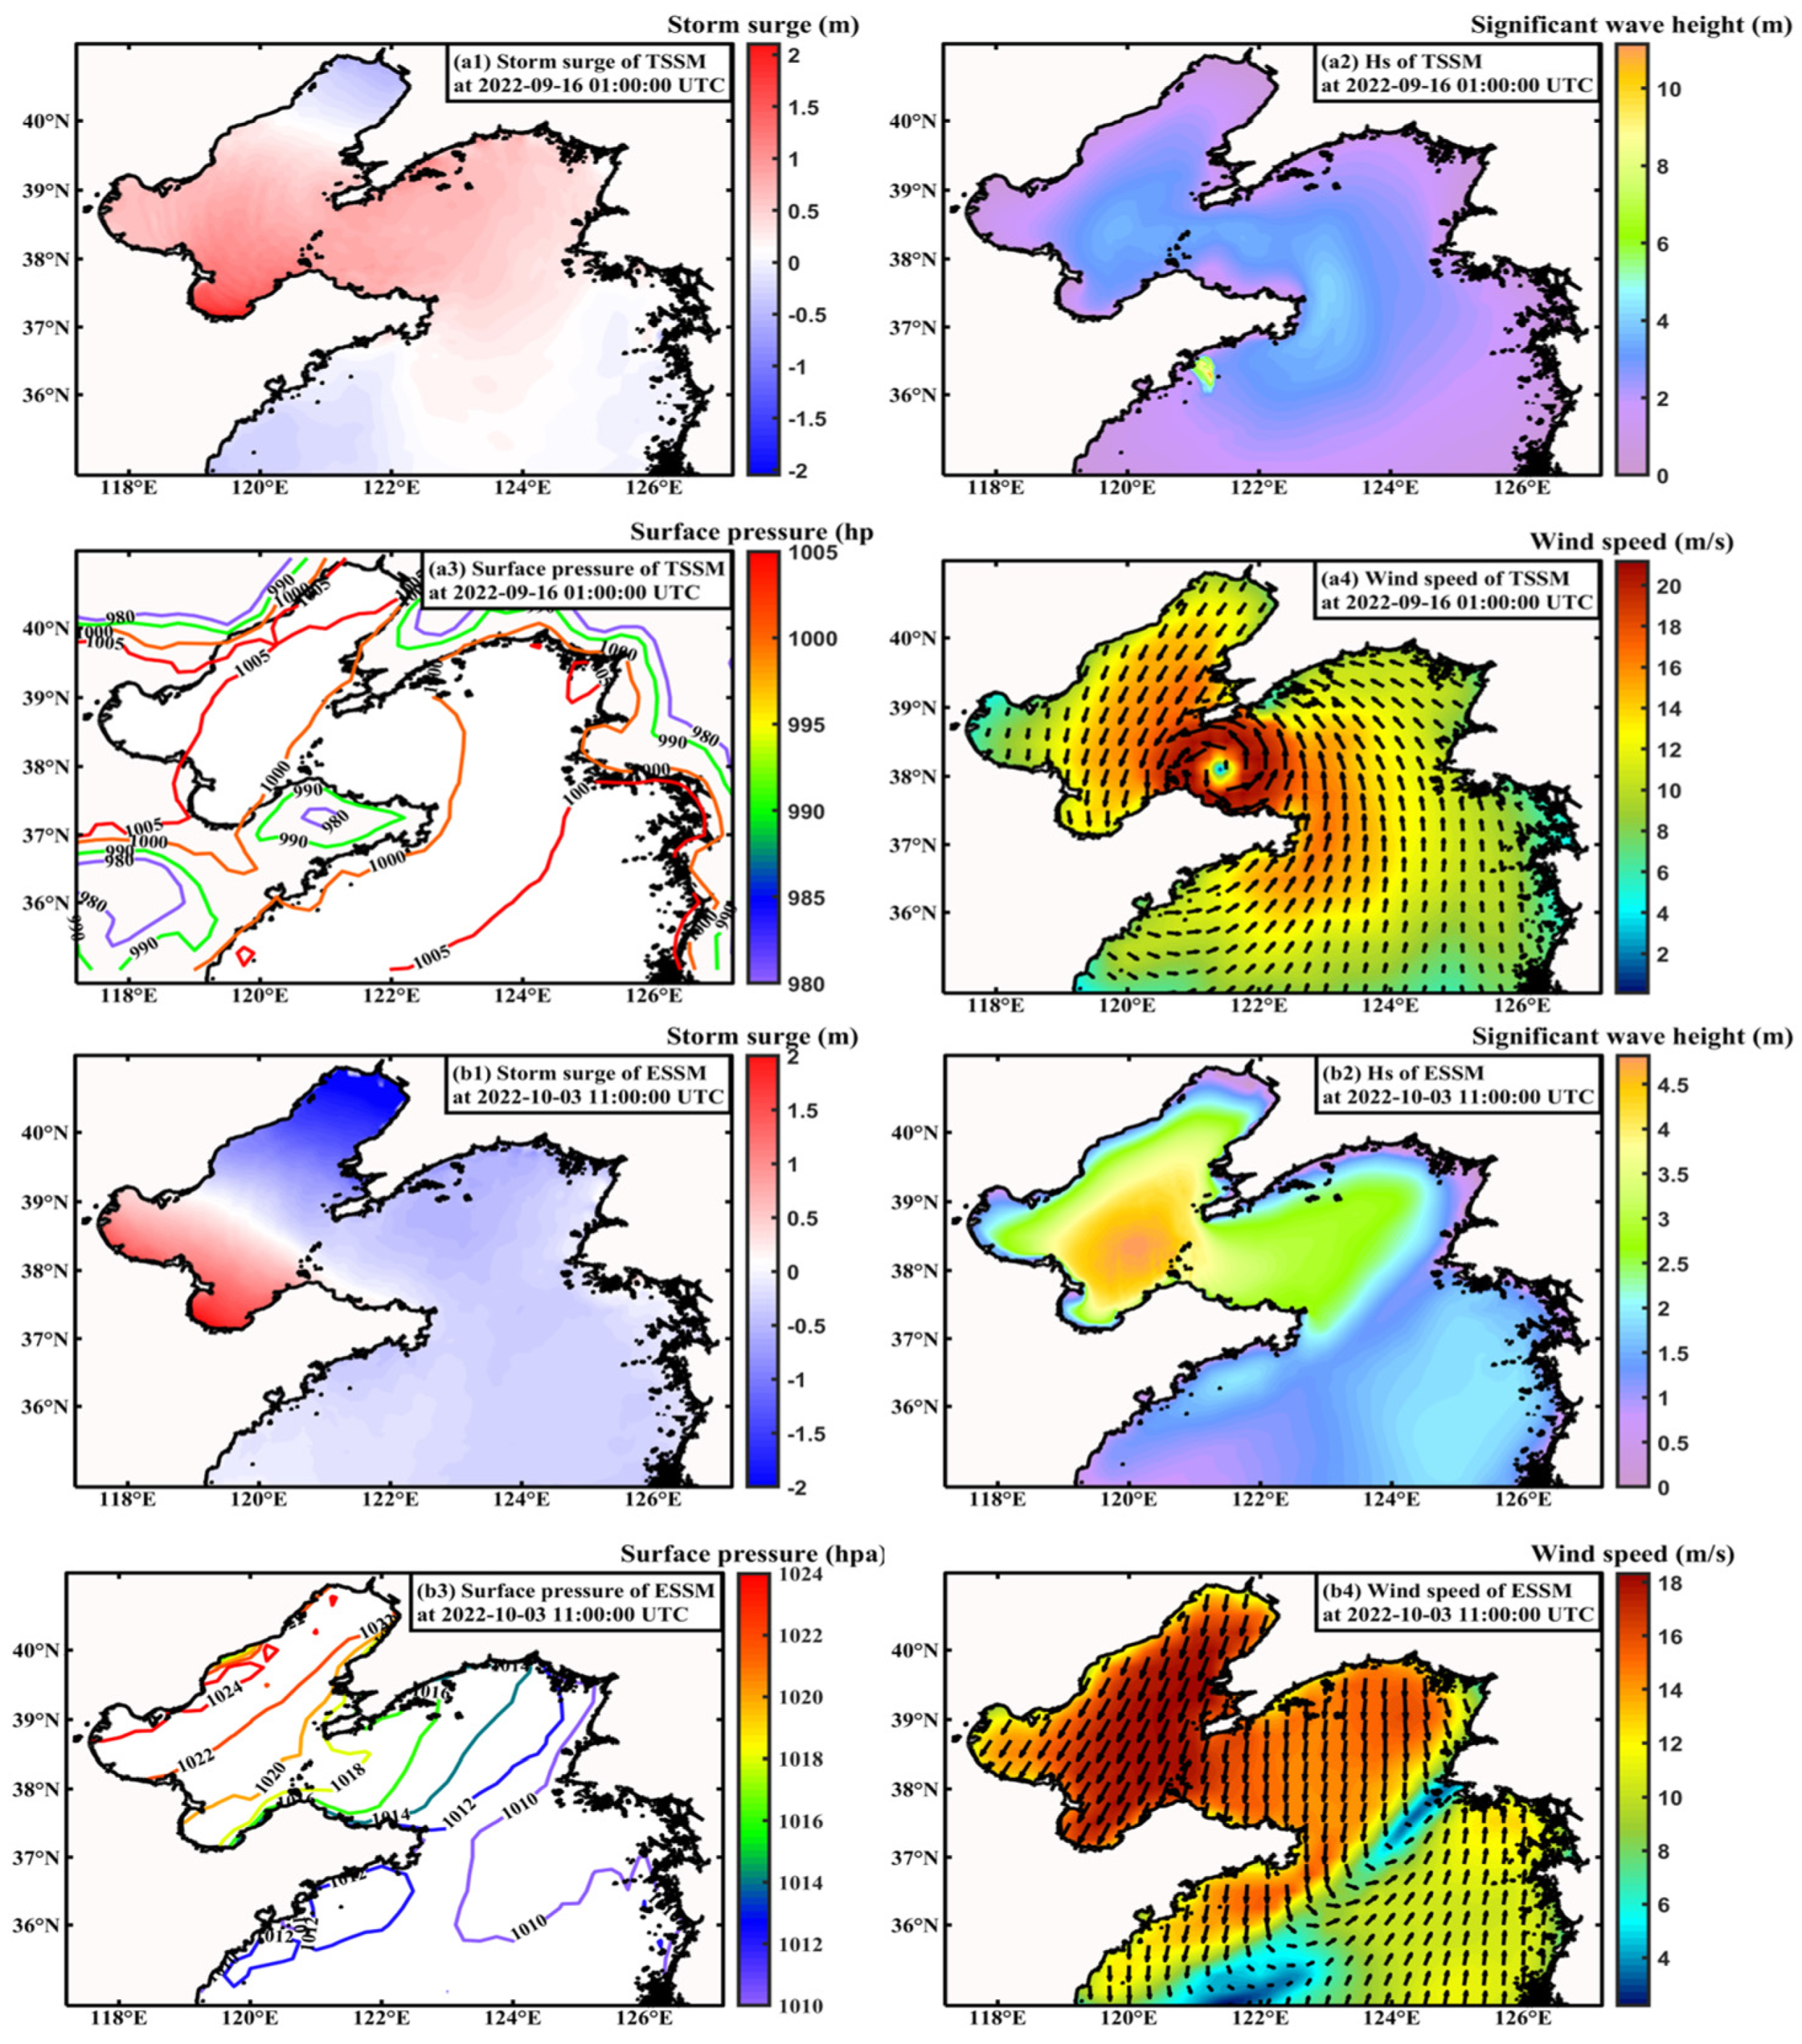
4.1. 2212 Typhoon Storm Surge
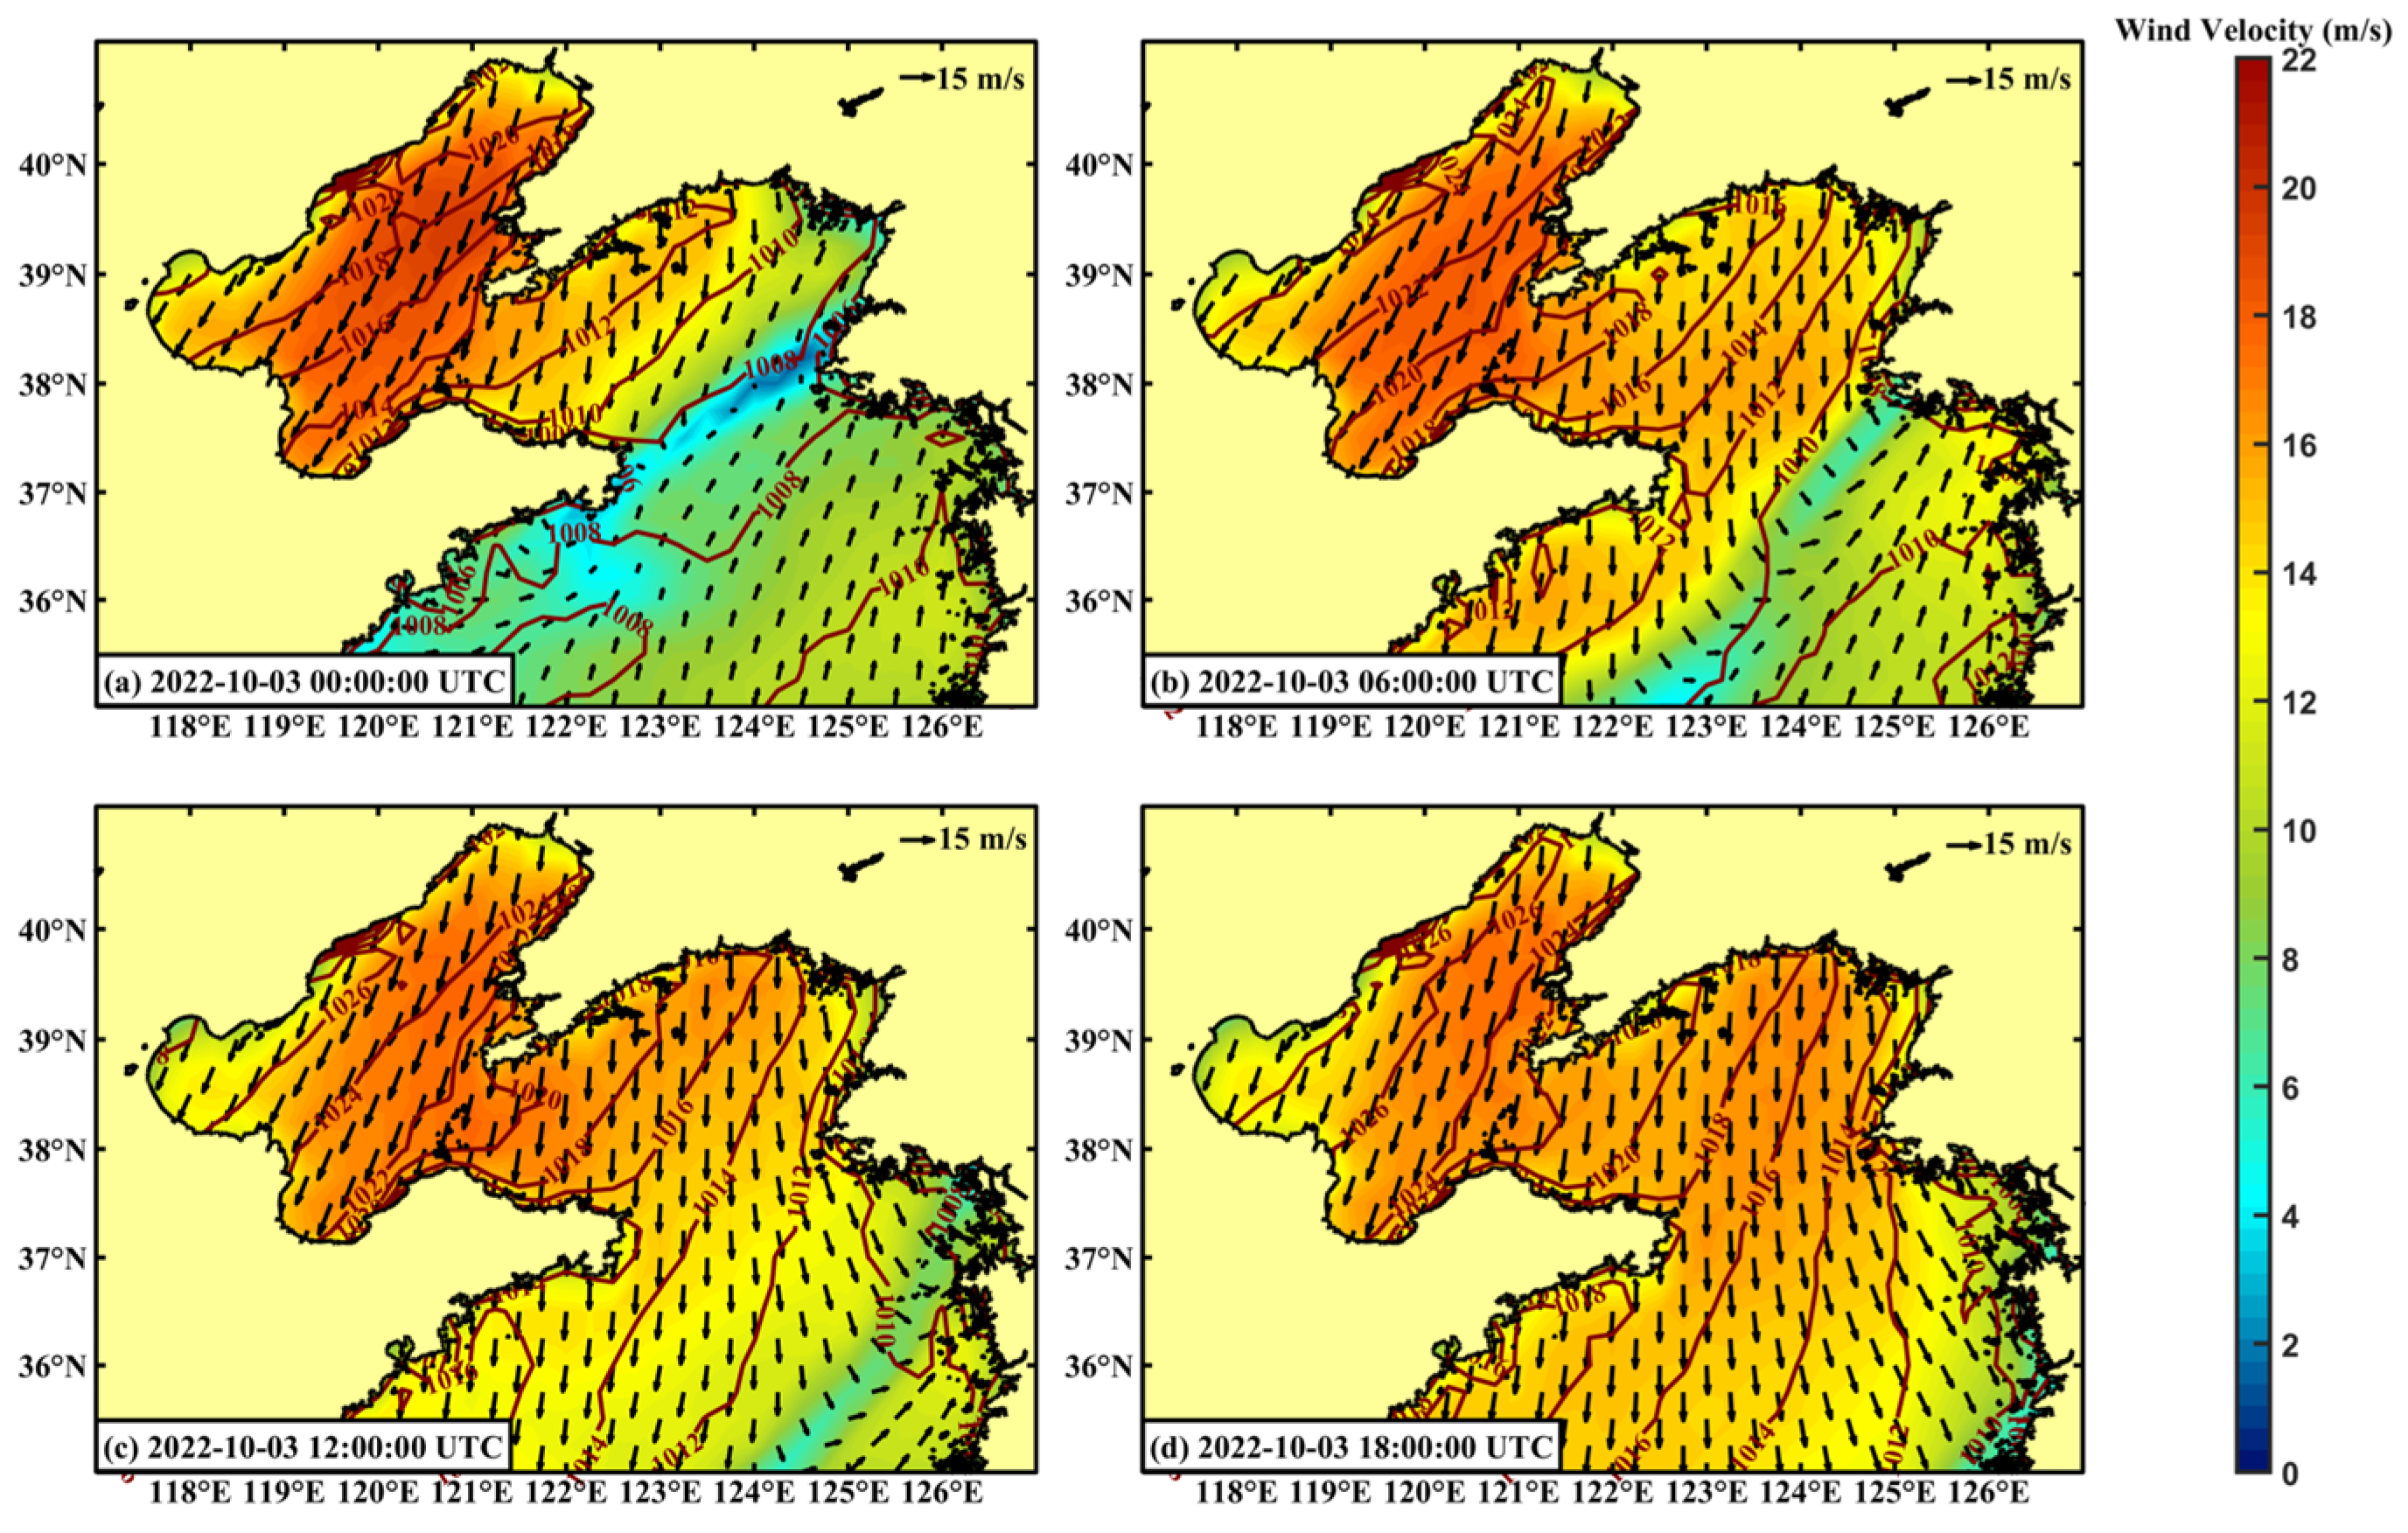
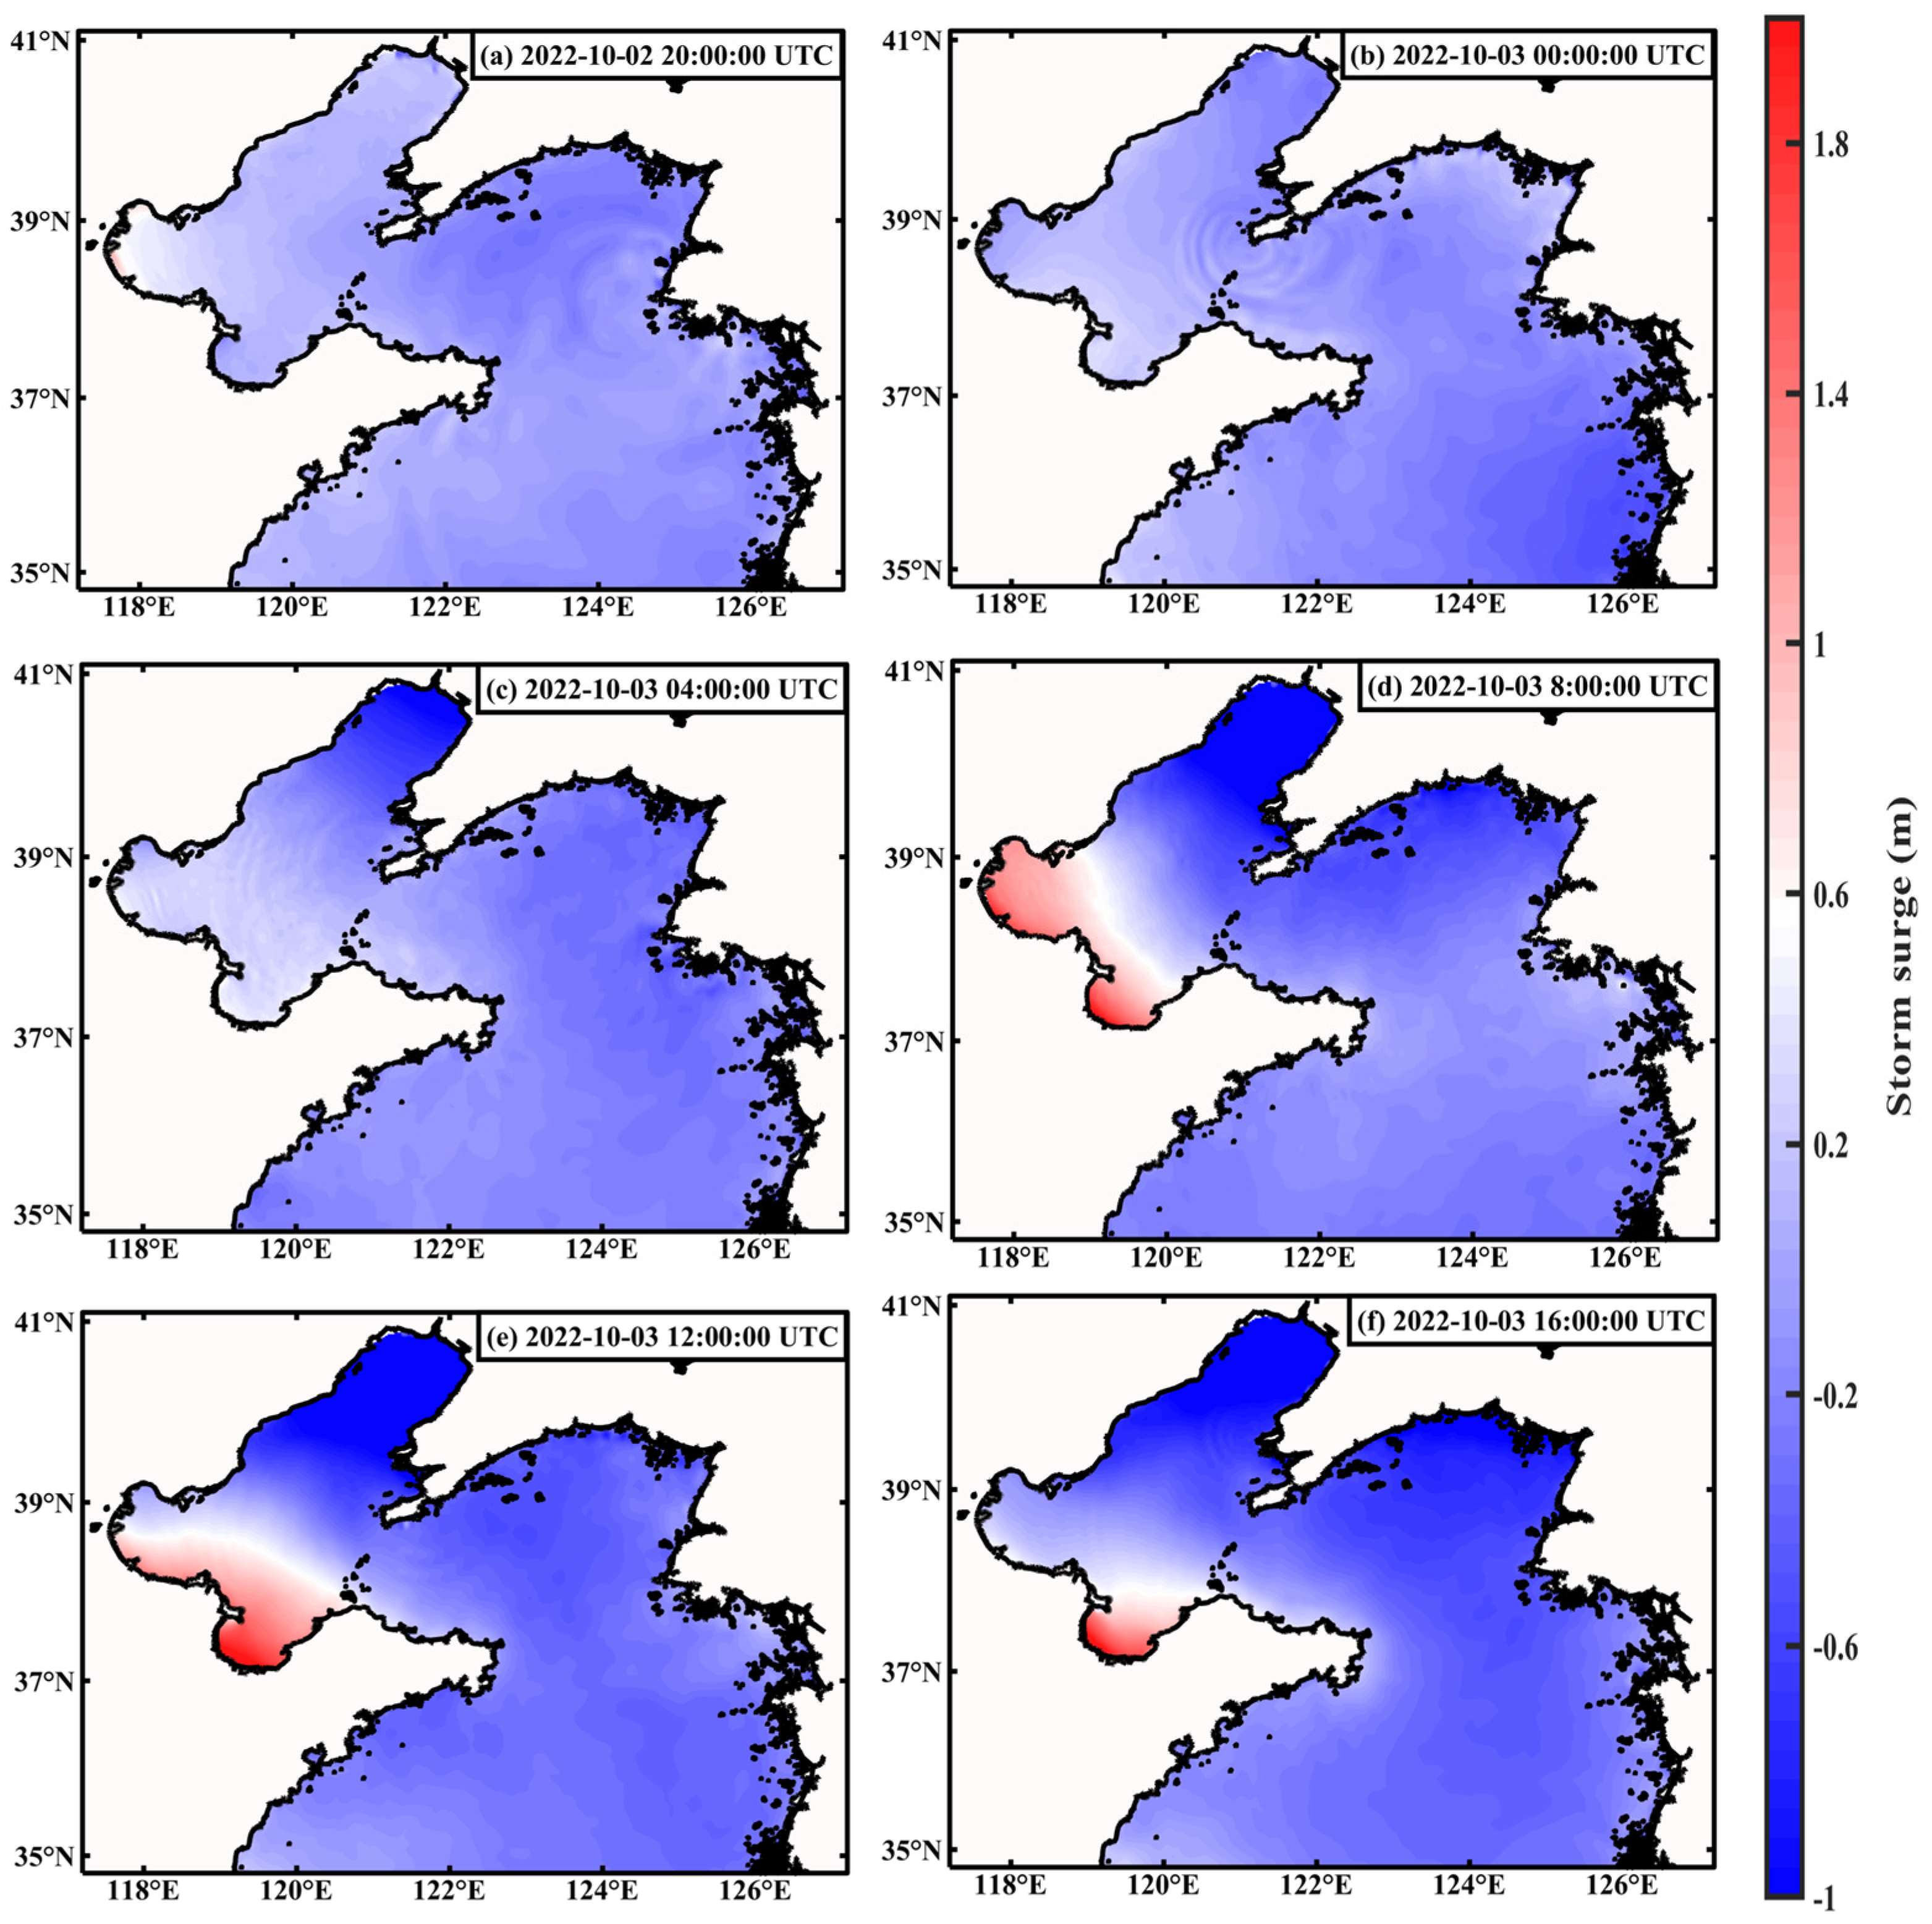
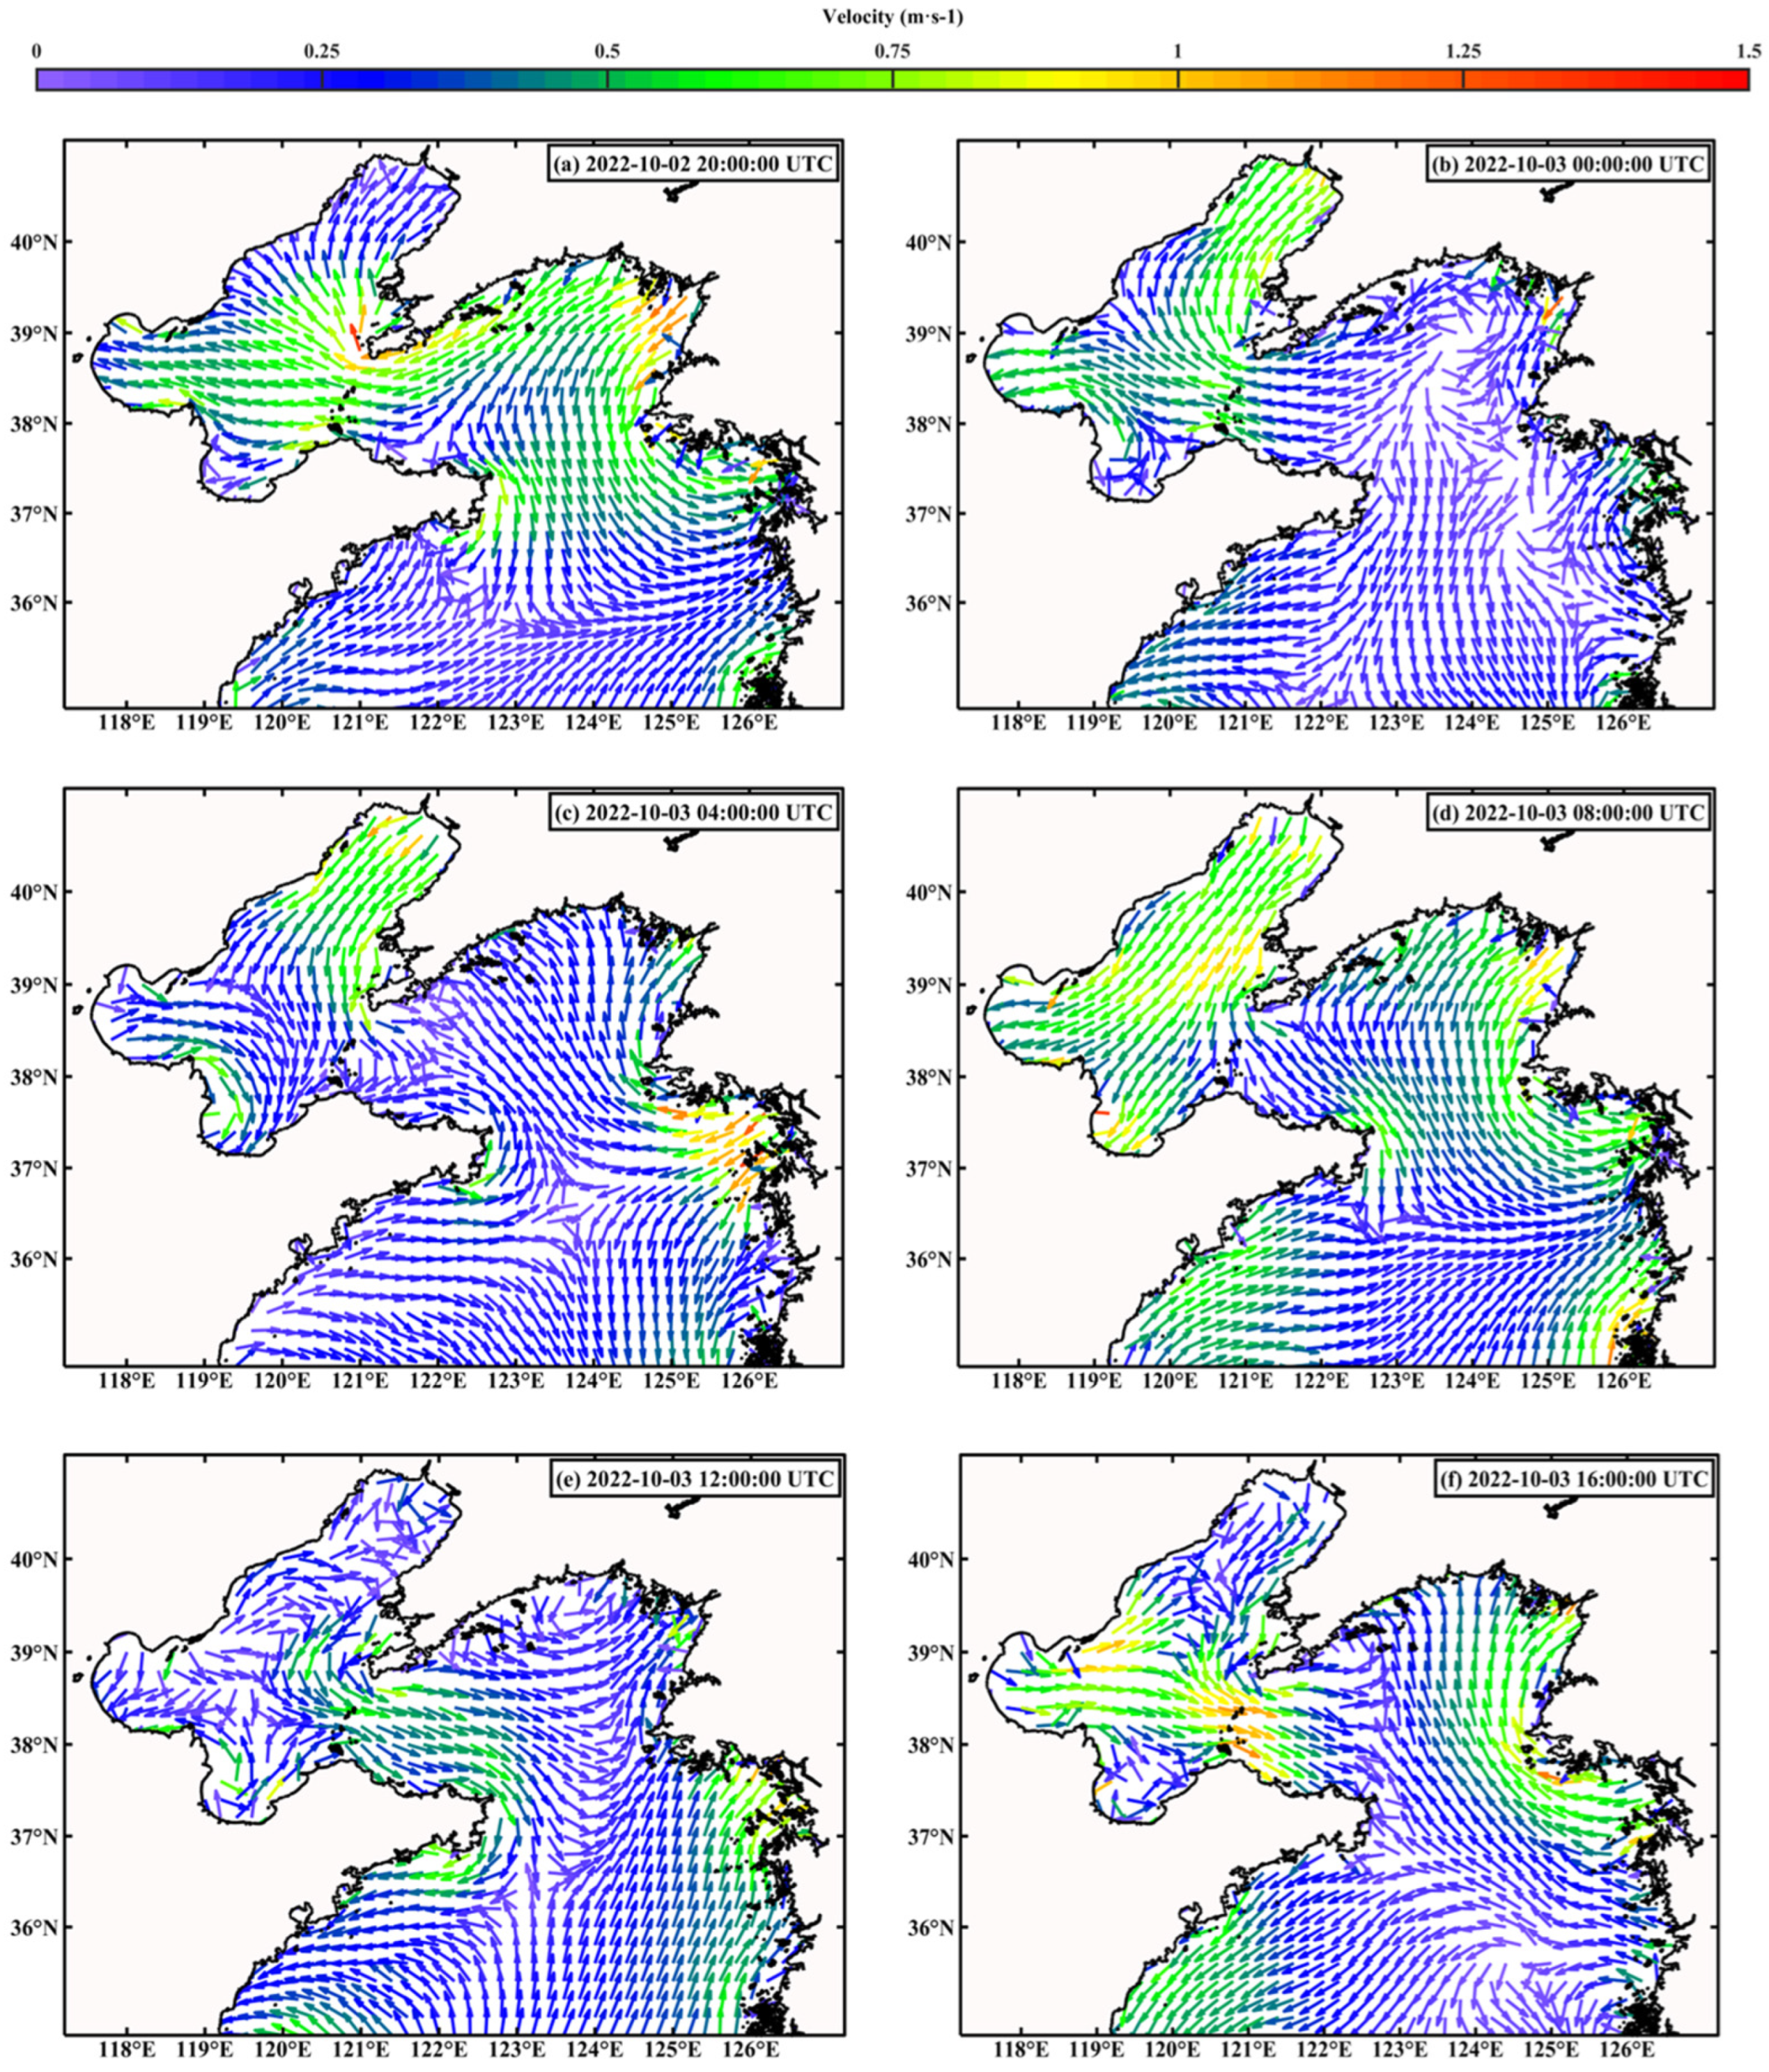
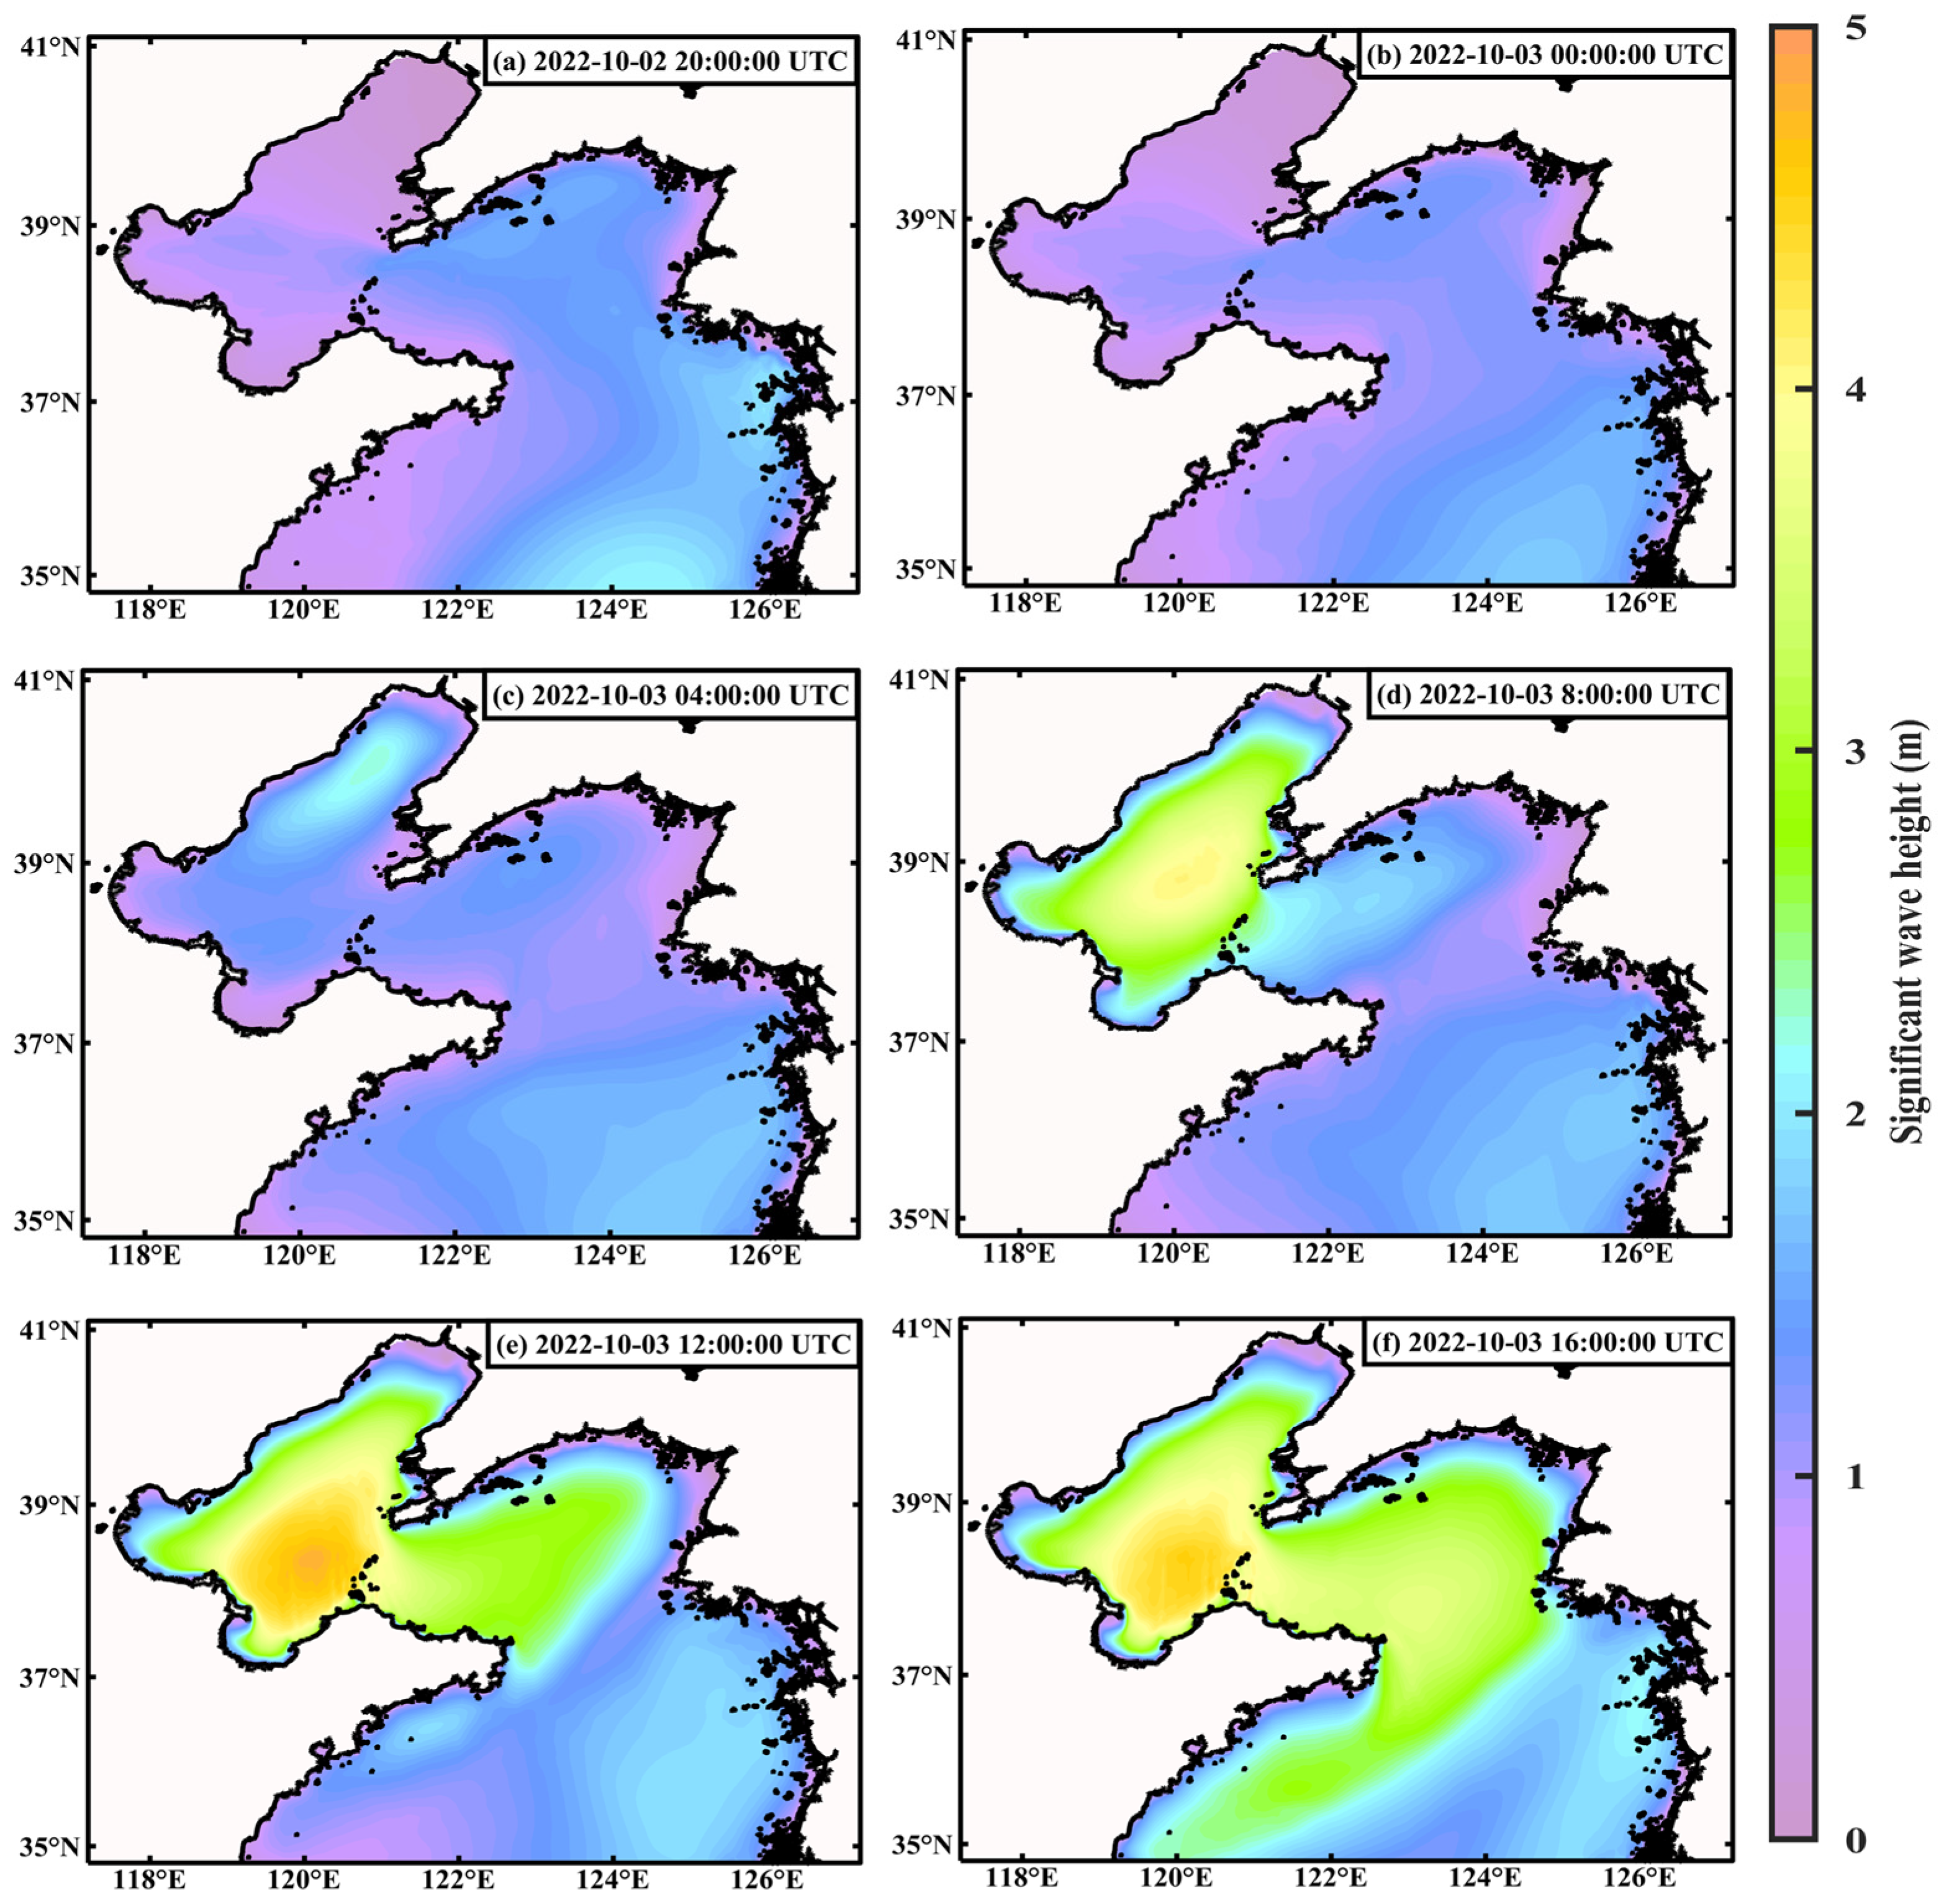
4.2. 221003 Extratropical Storm Surge
5. Discussion
6. Conclusions
Author Contributions
Funding
Data Availability Statement
Acknowledgments
Conflicts of Interest
References
- Feng, S.Z. Introduction to Storm Surge, 1st ed.; Science Press: Beijing, China, 1982. [Google Scholar]
- Xu, J.; Guo, J.B.; Chen, Z.Q.; Zhu, Z.H.; Wang, Q.; Tang, Y.L. Comparative study on the contribution of various influential factors and characteristics analysis of an extra-tropical storm surge caused by cold front in the Yangshan Port and its adjacent area. Redai Haiyang Xuebao 2022, 41, 126–135. [Google Scholar]
- Yuan, B.K.; Jiang, C.B.; Li, Z.X.; Li, P.S.; Wang, X.Y.; Guo, K.C.; Shang, J.; Li, G.; Lü, F.L. Characteristic Analysis of Marine Disasters and Countermeasures in Shandong Province. J. Inst. Disaster Prév. 2012, 14, 1–6. [Google Scholar]
- Li, Y.; Chen, X.; Jiang, X.Y.; Li, J.F.; Tian, L.Z. Numerical simulations and comparative analysis for two types of storm surges in the Bohai Sea using a coupled atmosphere-ocean model. Acta Oceanol. Sin. 2019, 38, 35–47. [Google Scholar] [CrossRef]
- Du, Z.J.; Wang, Y.P.; Mao, X.Y. Hazard analysis of storm surges for marine ranchings in the Shandong Peninsula in the past three decades. Haiyang Kexue 2023, 47, 1–11. [Google Scholar]
- Li, Q.J.; Hong, X.; Cao, X.F.; Yin, L.; Li, P.Y.; Mao, X.L.; Cao, H.Y. Effects of Different Wind Stress Drag Coefficients on Simulation Accuracy of Typhoon Storm Surge in Beihai Region. J. Hainan Trop. Ocean Univ. 2023, 30, 92–100. [Google Scholar]
- Xu, H.; Zhang, C.H.; Chai, C.X.; Wang, J.; Wang, Q.Y.; Zhang, M.L. Numerical simulation of storm surge and wave processes in Bohai Sea and North Huanghai Sea under the wave-current interaction. Haiyang Tongbao 2021, 40, 512–523. [Google Scholar]
- Mo, D.X.; Li, J.; Hou, Y.J. Assessing the Impact of Wave–Current Interactions on Storm Surges and Waves during Cold Air Outbreaks in the Northern East China Sea. J. Mar. Sci. Eng. 2021, 9, 824. [Google Scholar] [CrossRef]
- Chen, X.Y.; Yu, J.M.; Shen, Y.; Ni, Y.L.; Lu, F. The applicability study of different typhoon wind fields in typhoon wave simulation in Zhejiang sea area. J. Mar. Sci. 2024, 42, 15–25. [Google Scholar]
- Holland, G.J. An analytic model of the wind and pressure profiles in hurricanes. Mon. Weather Rev. 1980, 108, 1212–1218. [Google Scholar] [CrossRef]
- Willoughby, H.E.; Rahn, M.E. Parametric representation of the primary hurricane vortex. Part I: Observations and evaluation of the Holland (1980) model. Mon. Weather Rev. 2004, 132, 3033–3048. [Google Scholar] [CrossRef]
- Pan, D.D.; Wang, J.; Zhou, C. Numerical simulation of wave based on Typhoon Mangkhut. J. Waterw. Harb. 2021, 42, 194–199+219. [Google Scholar]
- Chen, C.S.; Liu, H.D.; Beardsley, R.C. An unstructured grid, finite-volume, three-dimensional, primitive Equations Ocean. model: Application to Coastal Ocean and estuaries. J. Atmos. Ocean. Technol. 2003, 20, 159–186. [Google Scholar] [CrossRef]
- Qi, J.H.; Chen, C.S.; Beardsley, R.C.; Will, P.; Geoffrey, W.C.; Lai, Z.G. An unstructured-grid finite-volume surface wave model (FVCOM-SWAVE): Implementation, validations and applications. Ocean Model. 2009, 28, 153–166. [Google Scholar] [CrossRef]
- Wu, L.Y. FVCOM-Based Wave-Current-Sediment Model Coupling and Its Application. Ph.D. Thesis, Ocean University of China, Qingdao, China, 2010. [Google Scholar]
- Ministry of Natural Resources of the People’s Republic of China. 2022 Bulletin of China Marine Disaster (Excerpt); China Natural Resources News: Beijing, China, 2023.
- Willmott, C.J. On the validation of models. Phys. Geogr. 1981, 2, 184–194. [Google Scholar] [CrossRef]
- Tang, Y.L.; Xu, L.D.; He, Z.G.; Chen, B.D.; Xu, J.; Li, L. Numerical simulation of three-dimensional characteristics of tidal current and residual current in Yangshan Harbor. J. Zhejiang Univ. Eng. Sci. 2019, 53, 315–324. [Google Scholar]
- Chu, D.D.; Li, M.Y.; Zhu, Y.H.; Yuan, Y.; He, Z.C.; Che, Z.M.; Zhang, J.C. Numerical Study on the Effects of Wave-Current Interaction for Typhoon-induced Storm Surges: A Case Study of Typhoon “Chan-hom”. J. Changjiang River Sci. Res. Inst. 2025, 42, 106–114. [Google Scholar]
- Ying, M.; Zhang, W.; Yu, H.; Lu, X.Q.; Feng, J.X.; Fan, Y.X.; Zhu, Y.T.; Chen, D.Q. An overview of the China Meteorological Administration tropical cyclone database. J. Atmos. Ocean. Technol. 2014, 31, 287–301. [Google Scholar] [CrossRef]
- Lu, X.Q.; Yu, H.; Ying, M.; Zhao, B.K.; Zhang, S.; Lin, L.M.; Bai, L.N.; Wan, R.J. Western North Pacific tropical cyclone database created by the China Meteorological Administration. Adv. Atmos. Sci. 2021, 38, 690–699. [Google Scholar] [CrossRef]
- Cao, Y.N.; Liu, T.; Wang, H.; Zhang, Z.H. Autumn 2022 marine weather review. J. Mar. Meteorol. 2023, 43, 117–126. [Google Scholar]
- Liang, S.D.; Zhang, Y.B.; Fu, X.; Zhu, X.Y. Statistics and numerical simulation on the storm surge in the west coast of the Bohai Sea caused by cold-air-induced northeast strong wind. Mar. Forecast. 2024, 41, 12–21. [Google Scholar]
- Yu, L.J. The Identification and Differentiation of Temperate Storm Surge Disaster Chains-A Case Study on the Storm Surge in Laizhou Bay. J. Catastrophol. 2021, 36, 13–17. [Google Scholar]
- Ignacio, T.; José, I.P.; Isabel, L.; Jorge, O.; Luis, A. Storm surge in Spain: Factors and effects on the coast. Mar. Geol. 2024, 476, 107373. [Google Scholar]
- You, X.Y.; Wu, G.X.; Liang, B.C.; Liu, S.C. Study on the Nonlinear Interaction Between Astronomical Tide and Storm Surge Along the Yellow Sea Based on Long Time Series. Zhongguo Haiyang Daxue Xuebao Ziran Kexueban 2022, 52, 77–88. [Google Scholar]


| Parameter | Value |
|---|---|
| Mesh domain | 117° E~129° E, 30°–41° N |
| Mesh resolution | Maximum triangular mesh is 20 km; minimum triangular mesh is 450 m |
| Mesh nodes and elements | 107298 nodes and 209024 elements |
| Vertical stratification | Nine layers |
| Run duration (UTC) | TSSM: from 7 September 2022 00:00 to 16 September 2022 18:00; ESSM: from 28 September 2022 00:00 to 7 October 2022 00:00 |
| Time step (FVCOM) | The external mode is 0.5 s, the internal mode is 5 s, and the time splitting mode ratio is 10 |
| Time step (SWAVE) | 5 s |
| Spectral resolution (frequency × angle) | 20 × 72 |
| Wave spectrum | JONSWAP |
| Boundary stage | Four diurnal tides (K1, O1, P1, Q1) and four semidiurnal tides (M2, S2, N2, K2) simulated by TPXO9 |
| Starting conditions | Cold start (TSSM initial temperature is 20 °C, ESSM is 18 °C; the salinity was set to 30%) |
| Wind and air pressure fields | TSSM: Holland-ERA5wind field; ESSM: ECMWF-ERA5 reanalysis wind field data |
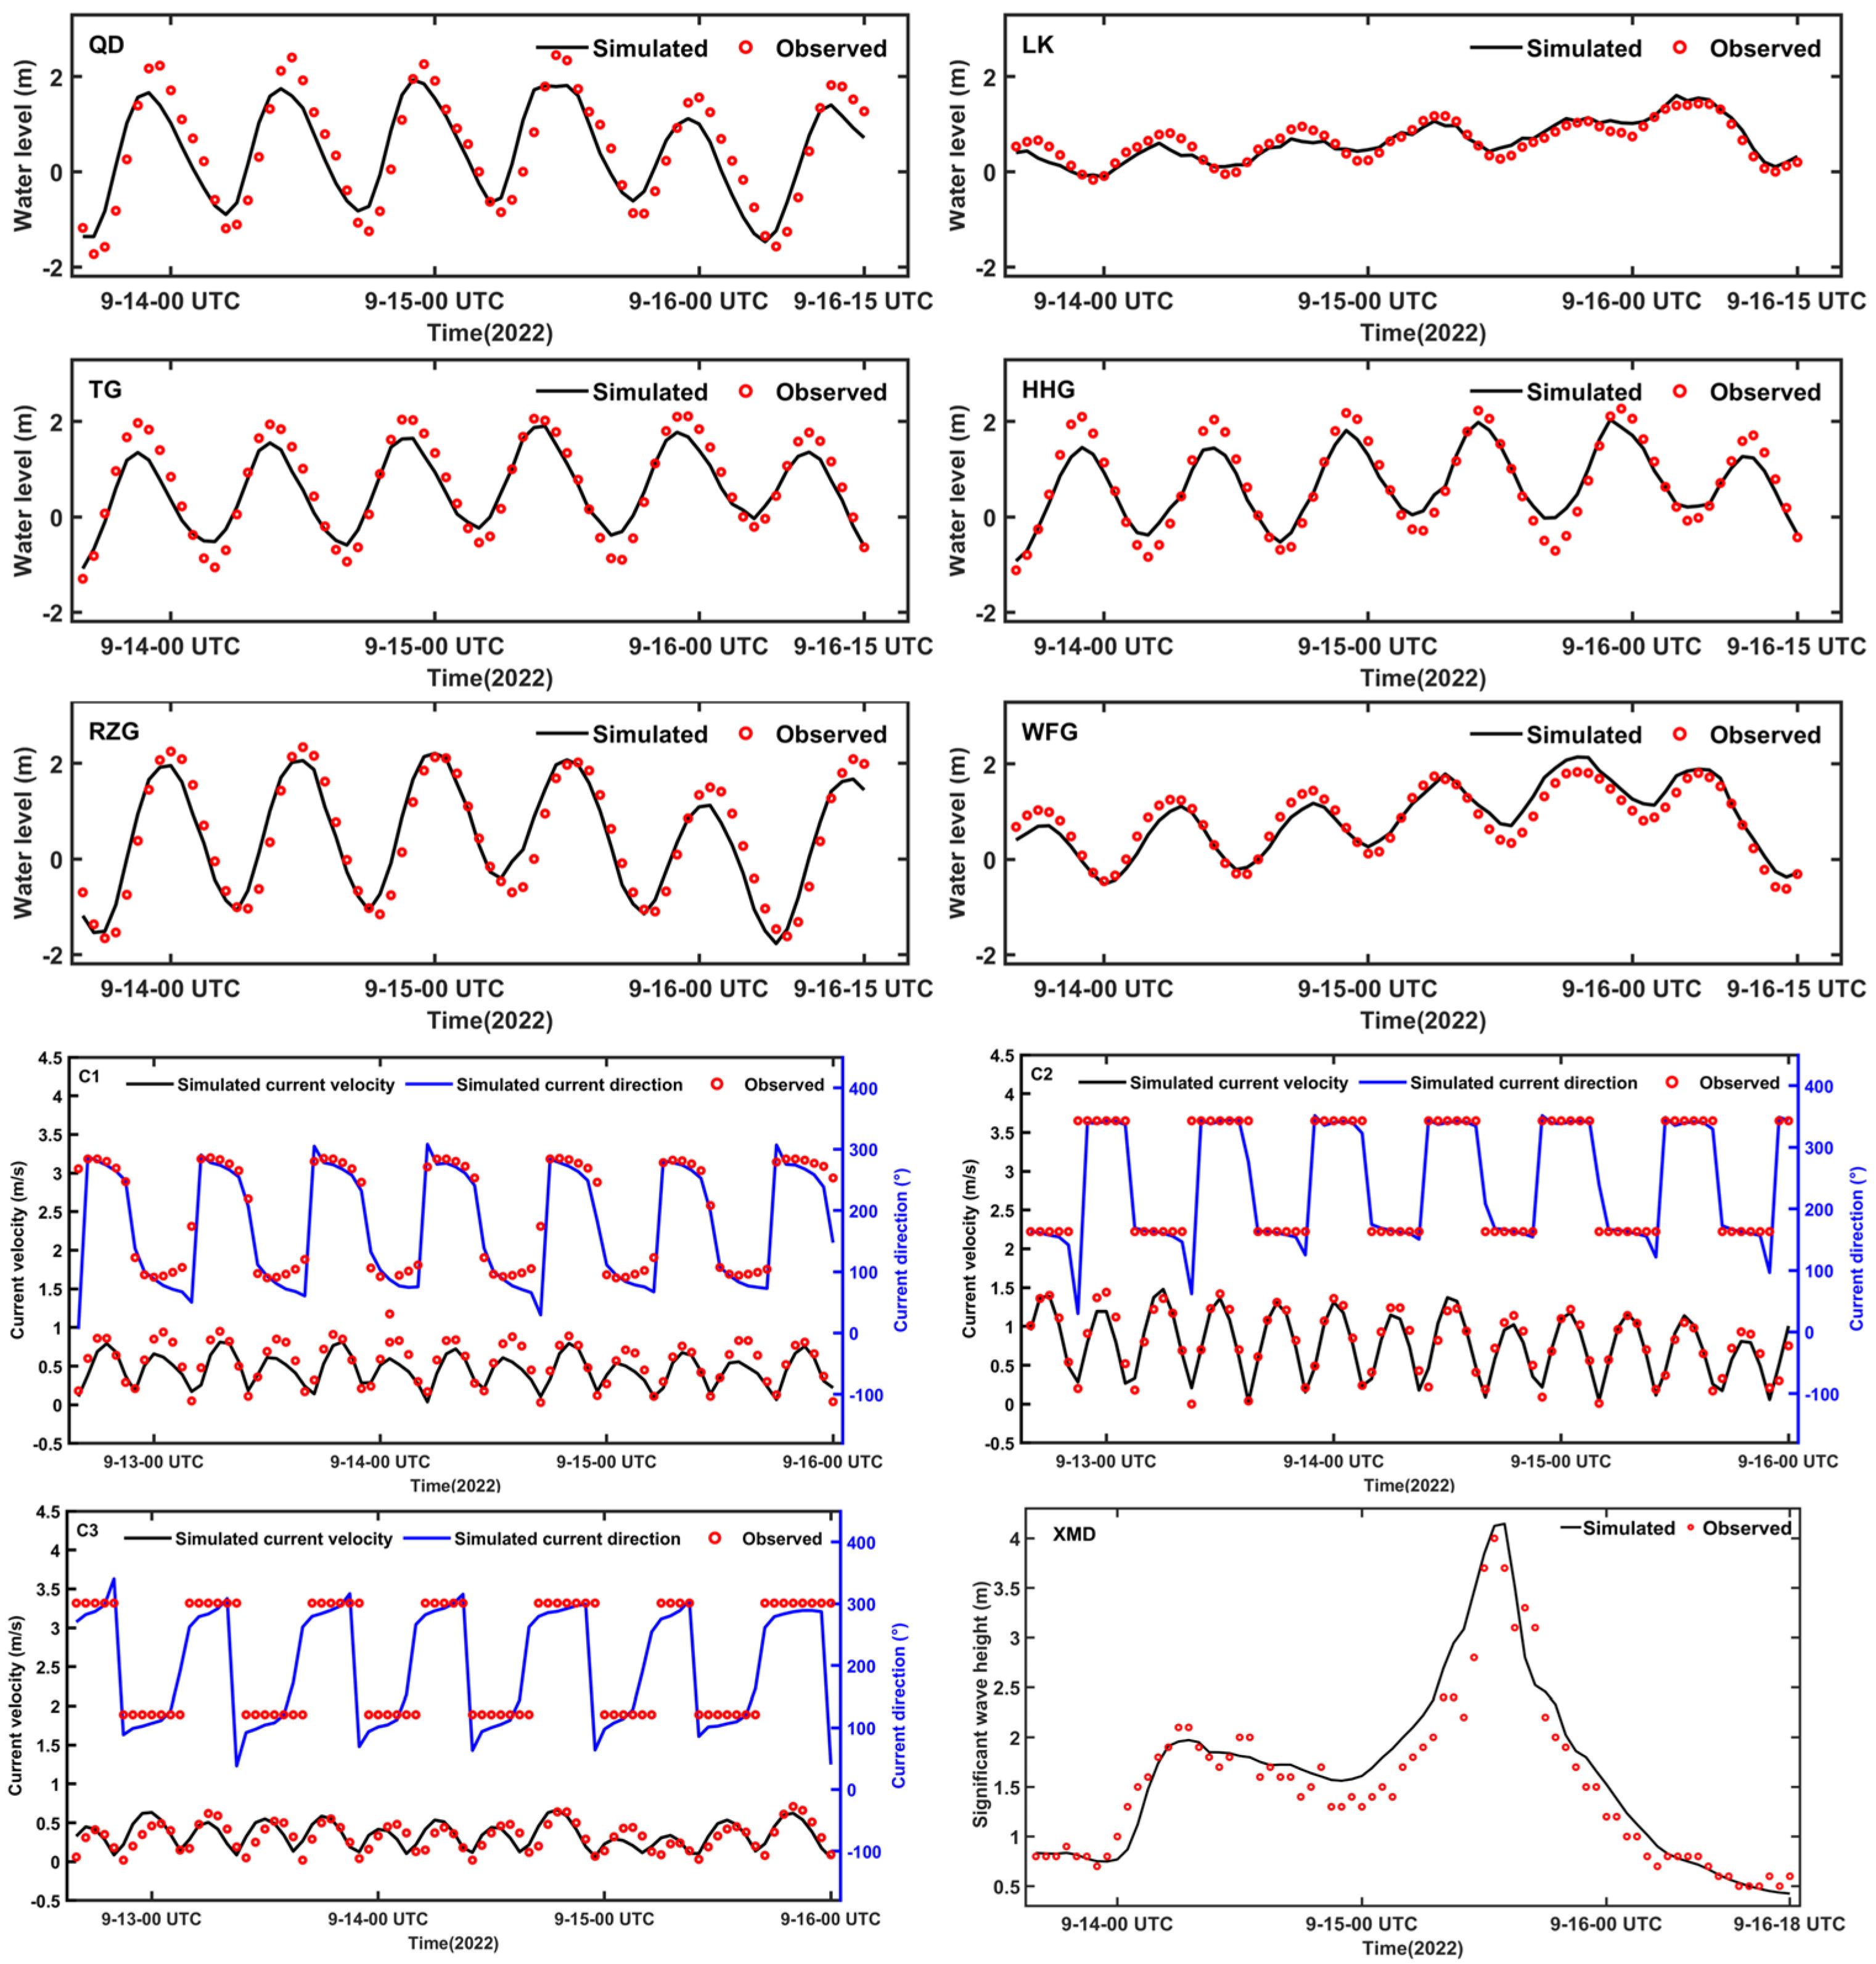
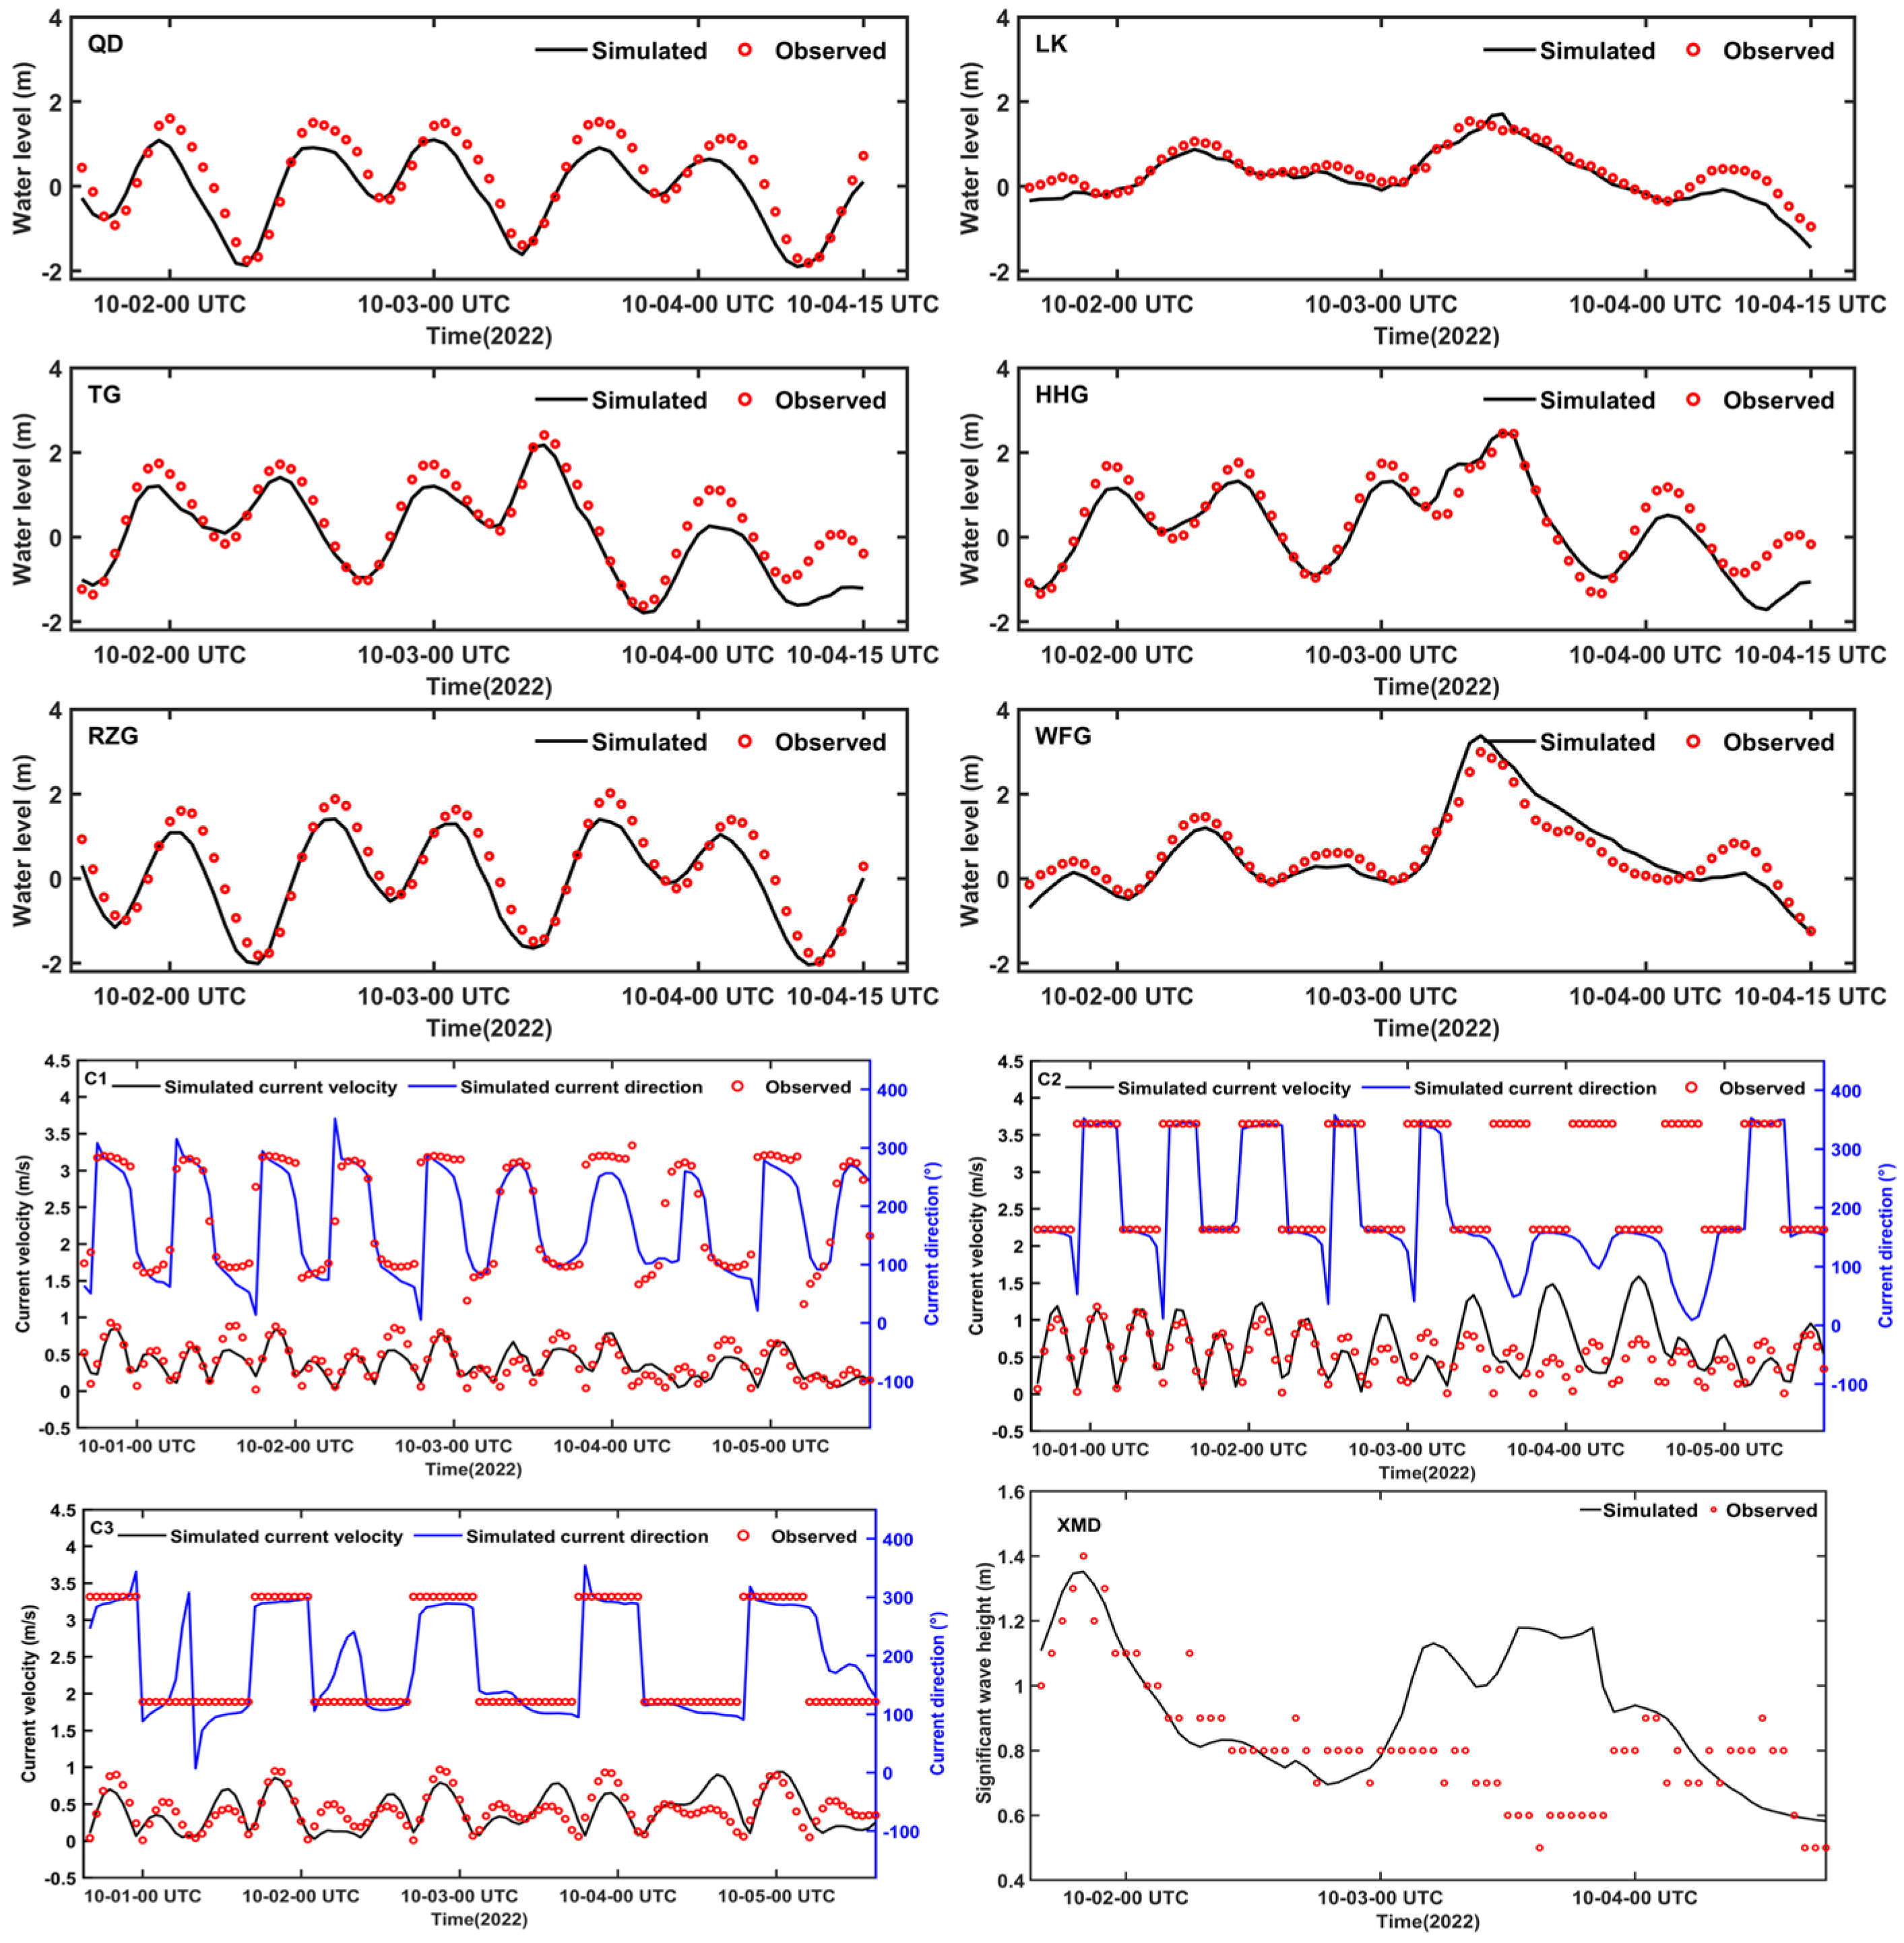
| Verification Elements | Observation Stations | S-Value | R-Value |
|---|---|---|---|
| Water level | QD | 0.94 | 0.53 |
| LK | 0.96 | 0.17 | |
| TG | 0.96 | 0.33 | |
| HHG | 0.97 | 0.31 | |
| RZG | 0.97 | 0.42 | |
| WFG | 0.97 | 0.24 | |
| Current velocity | C1 | 0.90 | 0.15 |
| C2 | 0.98 | 0.12 | |
| C3 | 0.81 | 0.14 | |
| Current direction | C1 | 0.94 | - |
| C2 | 0.93 | - | |
| C3 | 0.86 | - | |
| Significant wave height | XMD | 0.98 | 0.26 |
| Verification Elements | Observation Stations | S-Value | R-Value |
|---|---|---|---|
| Water level | QD | 0.93 | 0.51 |
| LK | 0.94 | 0.27 | |
| TG | 0.94 | 0.49 | |
| HHG | 0.94 | 0.48 | |
| RZG | 0.95 | 0.47 | |
| WFG | 0.96 | 0.36 | |
| Current velocity | C1 | 0.89 | 0.15 |
| C2 | 0.77 | 0.36 | |
| C3 | 0.84 | 0.21 | |
| Current direction | C1 | 0.91 | - |
| C2 | 0.63 | - | |
| C3 | 0.92 | - | |
| Significant wave height | XMD | 0.64 | 0.25 |
Disclaimer/Publisher’s Note: The statements, opinions and data contained in all publications are solely those of the individual author(s) and contributor(s) and not of MDPI and/or the editor(s). MDPI and/or the editor(s) disclaim responsibility for any injury to people or property resulting from any ideas, methods, instructions or products referred to in the content. |
© 2025 by the authors. Licensee MDPI, Basel, Switzerland. This article is an open access article distributed under the terms and conditions of the Creative Commons Attribution (CC BY) license (https://creativecommons.org/licenses/by/4.0/).
Share and Cite
Liu, W.; Zheng, Q.; Wang, Z.; Zuo, J. Comparative Analysis of Hydrodynamic Characteristics off Shandong Under the Influence of Two Types of Storm Surges. J. Mar. Sci. Eng. 2025, 13, 1054. https://doi.org/10.3390/jmse13061054
Liu W, Zheng Q, Wang Z, Zuo J. Comparative Analysis of Hydrodynamic Characteristics off Shandong Under the Influence of Two Types of Storm Surges. Journal of Marine Science and Engineering. 2025; 13(6):1054. https://doi.org/10.3390/jmse13061054
Chicago/Turabian StyleLiu, Wenwen, Qingdan Zheng, Zhizu Wang, and Juncheng Zuo. 2025. "Comparative Analysis of Hydrodynamic Characteristics off Shandong Under the Influence of Two Types of Storm Surges" Journal of Marine Science and Engineering 13, no. 6: 1054. https://doi.org/10.3390/jmse13061054
APA StyleLiu, W., Zheng, Q., Wang, Z., & Zuo, J. (2025). Comparative Analysis of Hydrodynamic Characteristics off Shandong Under the Influence of Two Types of Storm Surges. Journal of Marine Science and Engineering, 13(6), 1054. https://doi.org/10.3390/jmse13061054