Article

Variation Characteristics of Nitrous Oxide Along the East Antarctic Coast

1
School of Ocean Sciences, China University of Geosciences, Beijing 100083, China
2
Chinese Academy of Meteorological Sciences, Beijing 100081, China
3
Meteorological Observation Centre, China Meteorological Administration, Beijing 100081, China
*
Authors to whom correspondence should be addressed.
J. Mar. Sci. Eng. 2025, 13(6), 1040; https://doi.org/10.3390/jmse13061040
Submission received: 13 April 2025 / Revised: 13 May 2025 / Accepted: 21 May 2025 / Published: 26 May 2025
(This article belongs to the Section Ocean and Global Climate)

Abstract

:
Based on a laboratorial analysis of nitrous oxide (N2O) concentrations collected in gas bottles (glass flask) at the Zhongshan Station on the East Antarctic coast from 2008 to 2021, the variation characteristics and trends in the background concentration of N2O at the station were analyzed and compared with the N2O data from other Antarctic stations. The results showed that the annual average concentration of atmospheric N2O along the East Antarctic coast increased from 320.40 ppb in 2008 to 333.31 ppb in 2021, with an overall increasing trend of 0.99 ppb per year. Pronounced seasonal variability was observed, with elevated concentrations occurring during austral spring–summer and reduced levels in autumn–winter, consistent with the seasonal patterns documented at other Antarctic sites. The overall variation trend of the N2O concentration at Zhongshan Station is basically consistent with the observation results at other stations in Antarctica, suggesting that the station’s background N2O measurements are representative of continental-scale atmospheric composition dynamics. Combined with the analysis of air mass tracks, this seasonal variation in N2O is mainly related to the mass movement of air mass and, to a certain extent, is influenced by the seasonal melting of sea ice and the exchange between the troposphere and stratosphere. The results supplement important basic data on N2O concentrations along the East Antarctic coast and have potential reference significance for further understanding the causes of atmospheric N2O variations in the Antarctic region.

1. Introduction

Nitrous oxide (N2O) is a trace gas that has an important impact on the climate and atmospheric chemistry [1]. Because N2O can absorb long-wave radiation emitted from the ground, sea surface, and clouds, it has a greenhouse effect and can aggravate global warming [2,3]. The N2O concentration in the atmosphere has increased from ~270 ppb before the industrial revolution to ~333 ppb in 2020, steadily increasing at a rate of 0.26% per year [4,5,6,7]. The Global Warming Potential of N2O is approximately 300 times that of CO2 and 12 times that of CH4, and its contribution to the global greenhouse effect is 5~6%, making it the third most important anthropogenic greenhouse gas after CO2 and CH4 [8]. Moreover, N2O has a long residence time in the atmosphere and can be transported to the stratosphere. The photochemical product of N2O, namely, NO, can react with O3 to destroy the ozone layer and cause ozone holes [9]. Therefore, research on background concentrations of atmospheric N2O has received increasing amounts of attention.
The Antarctic continent is far from human settlements and has little environmental pollution. It is extremely sensitive to the response and feedback of global climate change. Therefore, Antarctica is an ideal region in which to observe the background level of greenhouse gases in the global atmosphere [10]. At present, research on atmospheric N2O in the polar region is mainly divided into the following aspects: the first is the contribution of water bodies (the Southern Ocean) near the Antarctic to atmospheric N2O [10,11,12,13]; the second is the sources of atmospheric N2O in East Antarctica [14,15]; the third is the study of N2O sources and sinks in polar animal habitats [16,17]; and the fourth is the effect of light intensity variations on N2O sources/sinks in polar regions [18,19,20,21].
In the past few decades, a number of observatories have been established in polar regions to measure the concentration of atmospheric trace gases, including N2O, and study the changes in various substances (including greenhouse gases) in the atmosphere. However, long-term observational data on atmospheric N2O background concentrations and seasonal variations are relatively lacking, especially on the East Antarctic coast. Since 2008, long-term sampling and on-site online analyses of major greenhouse gases have been carried out at Zhongshan Station in East Antarctica. Atmospheric N2O observations at Zhongshan Station mainly involve the use of glass flask bottles for air sampling, which are then transported back to domestic laboratories for N2O concentration analyses.
In this paper, the atmospheric N2O concentration of Zhongshan Station in Antarctica is taken as the research object, and a relatively complete and long-term observation data series of N2O concentrations is obtained. The variation characteristics and long-term trend in atmospheric N2O at Zhongshan Station are revealed and the possible sources of atmospheric N2O in this area are investigated. The influence of meteorological factors on the atmospheric background N2O concentration at Zhongshan Station is also discussed. This study will add important N2O concentration data along the East Antarctic coast to the global observation of atmospheric composition.

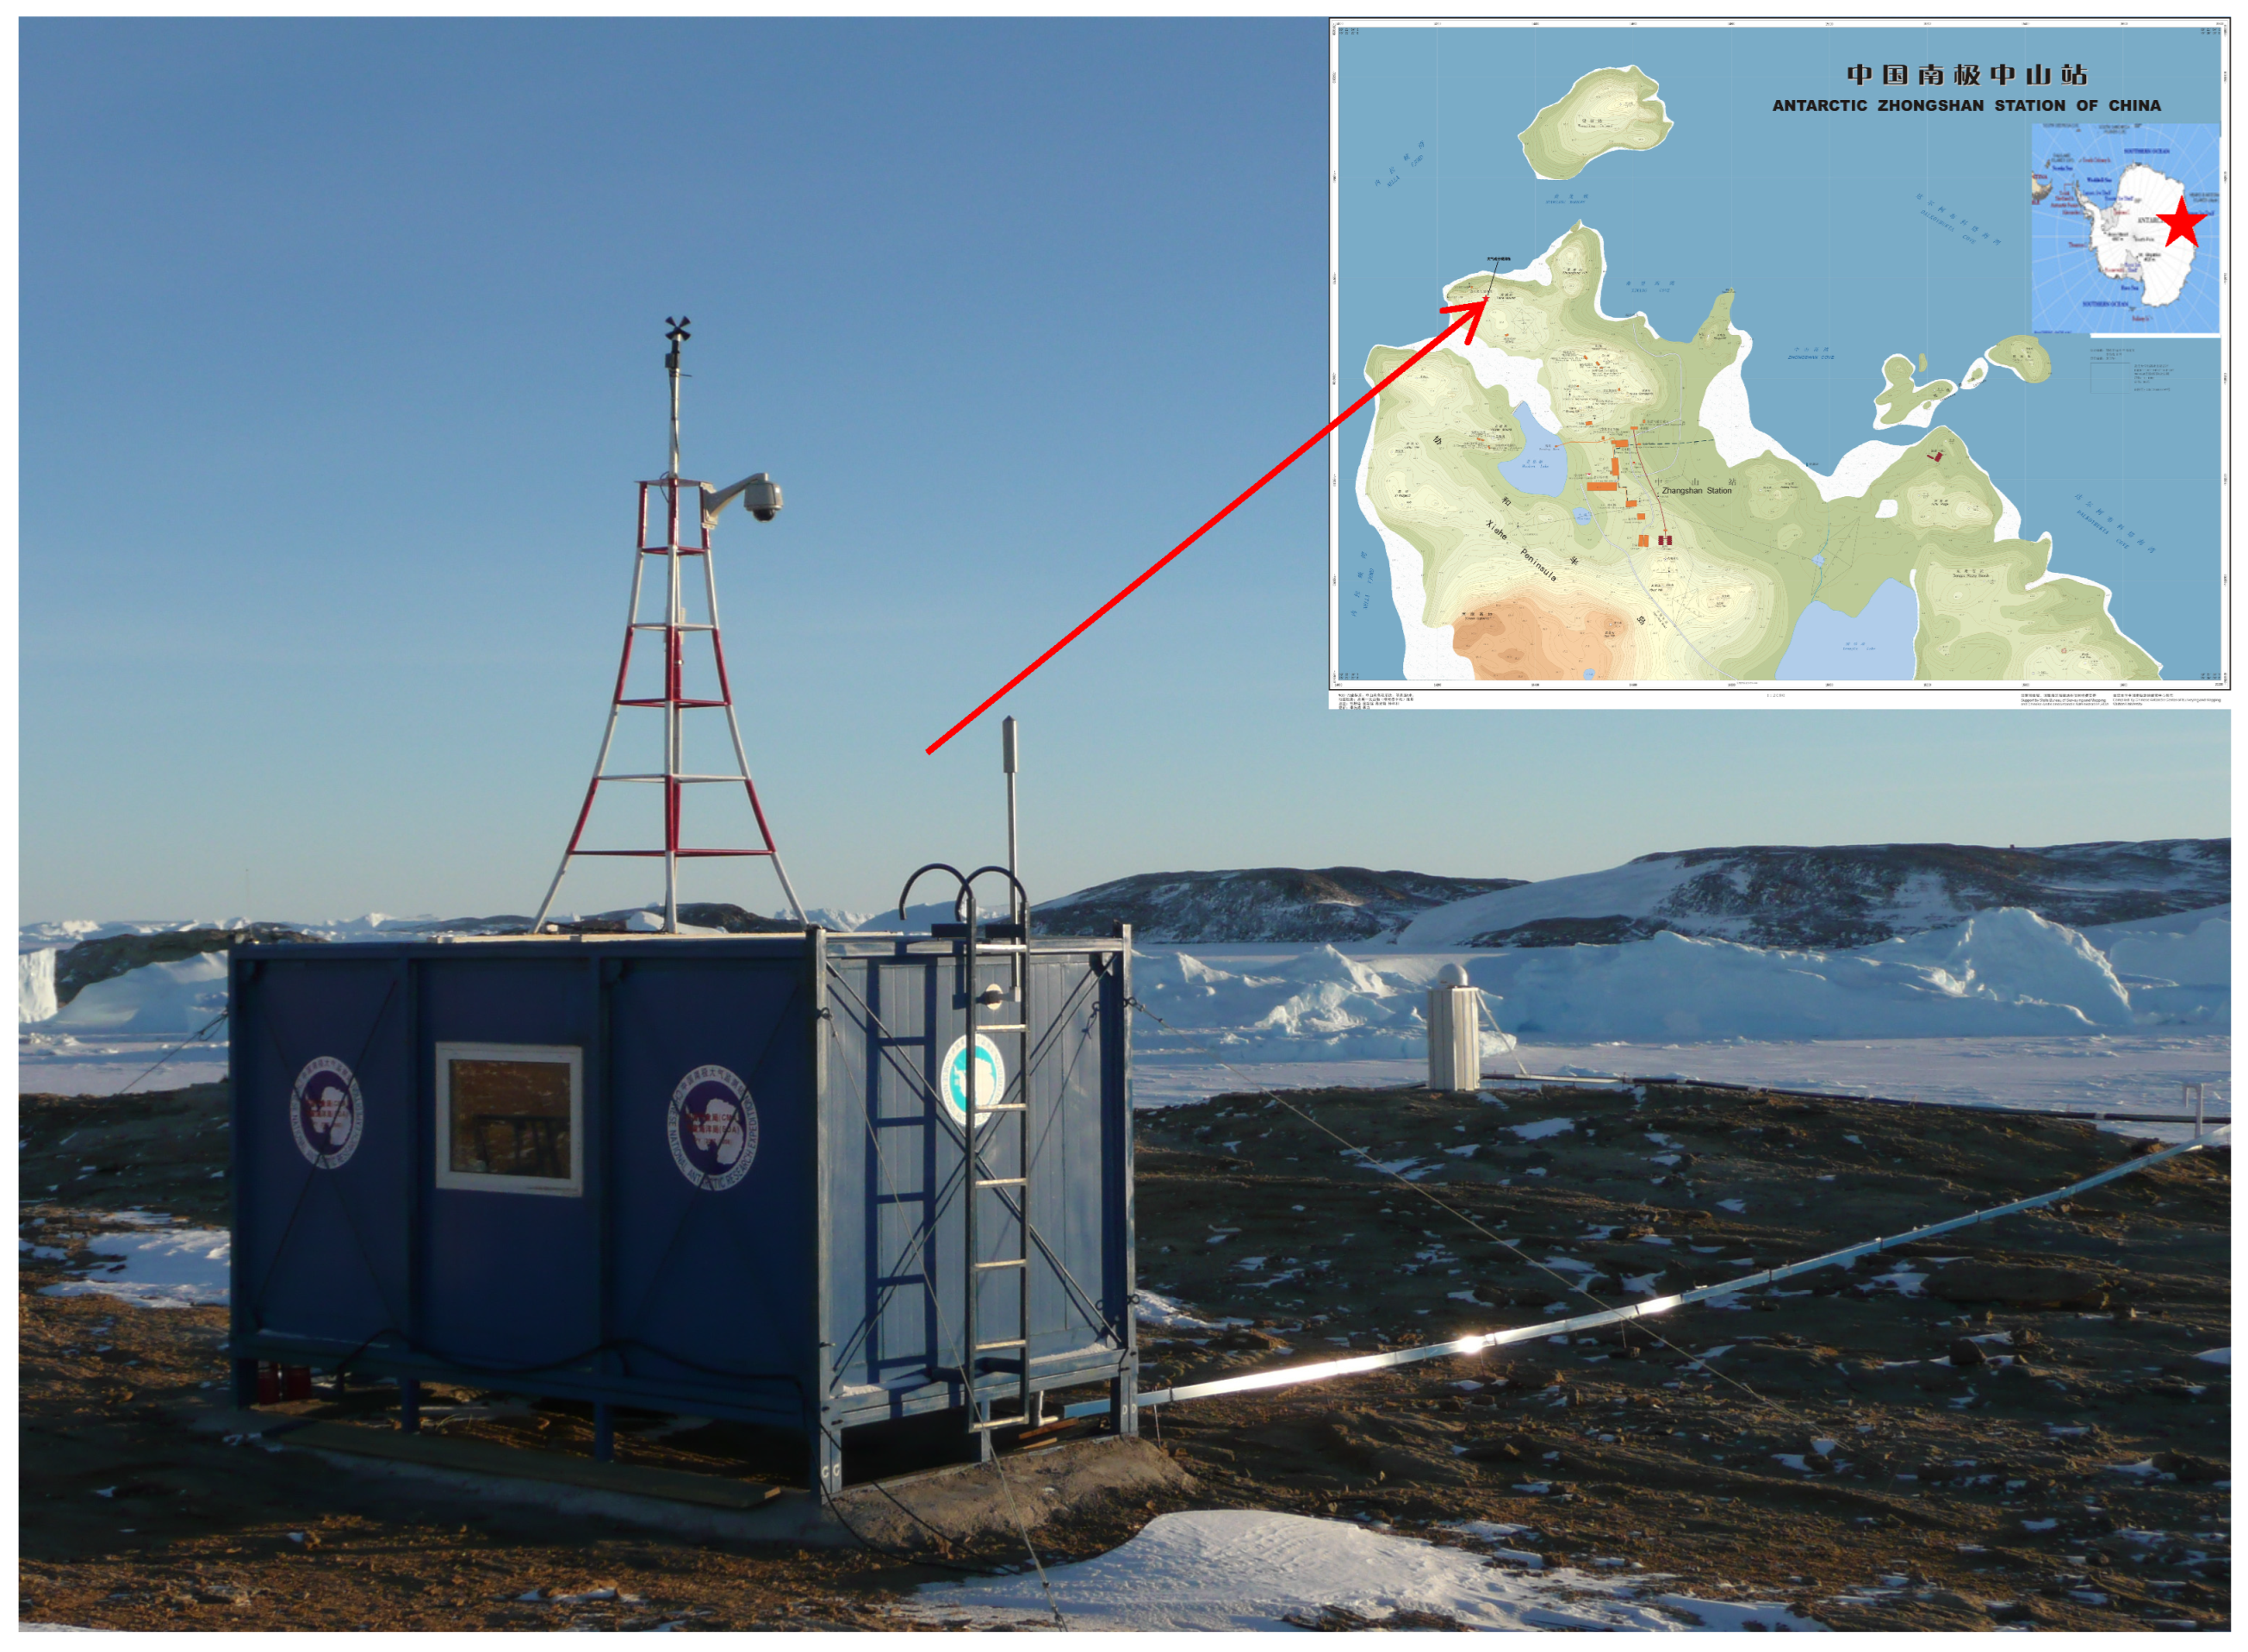
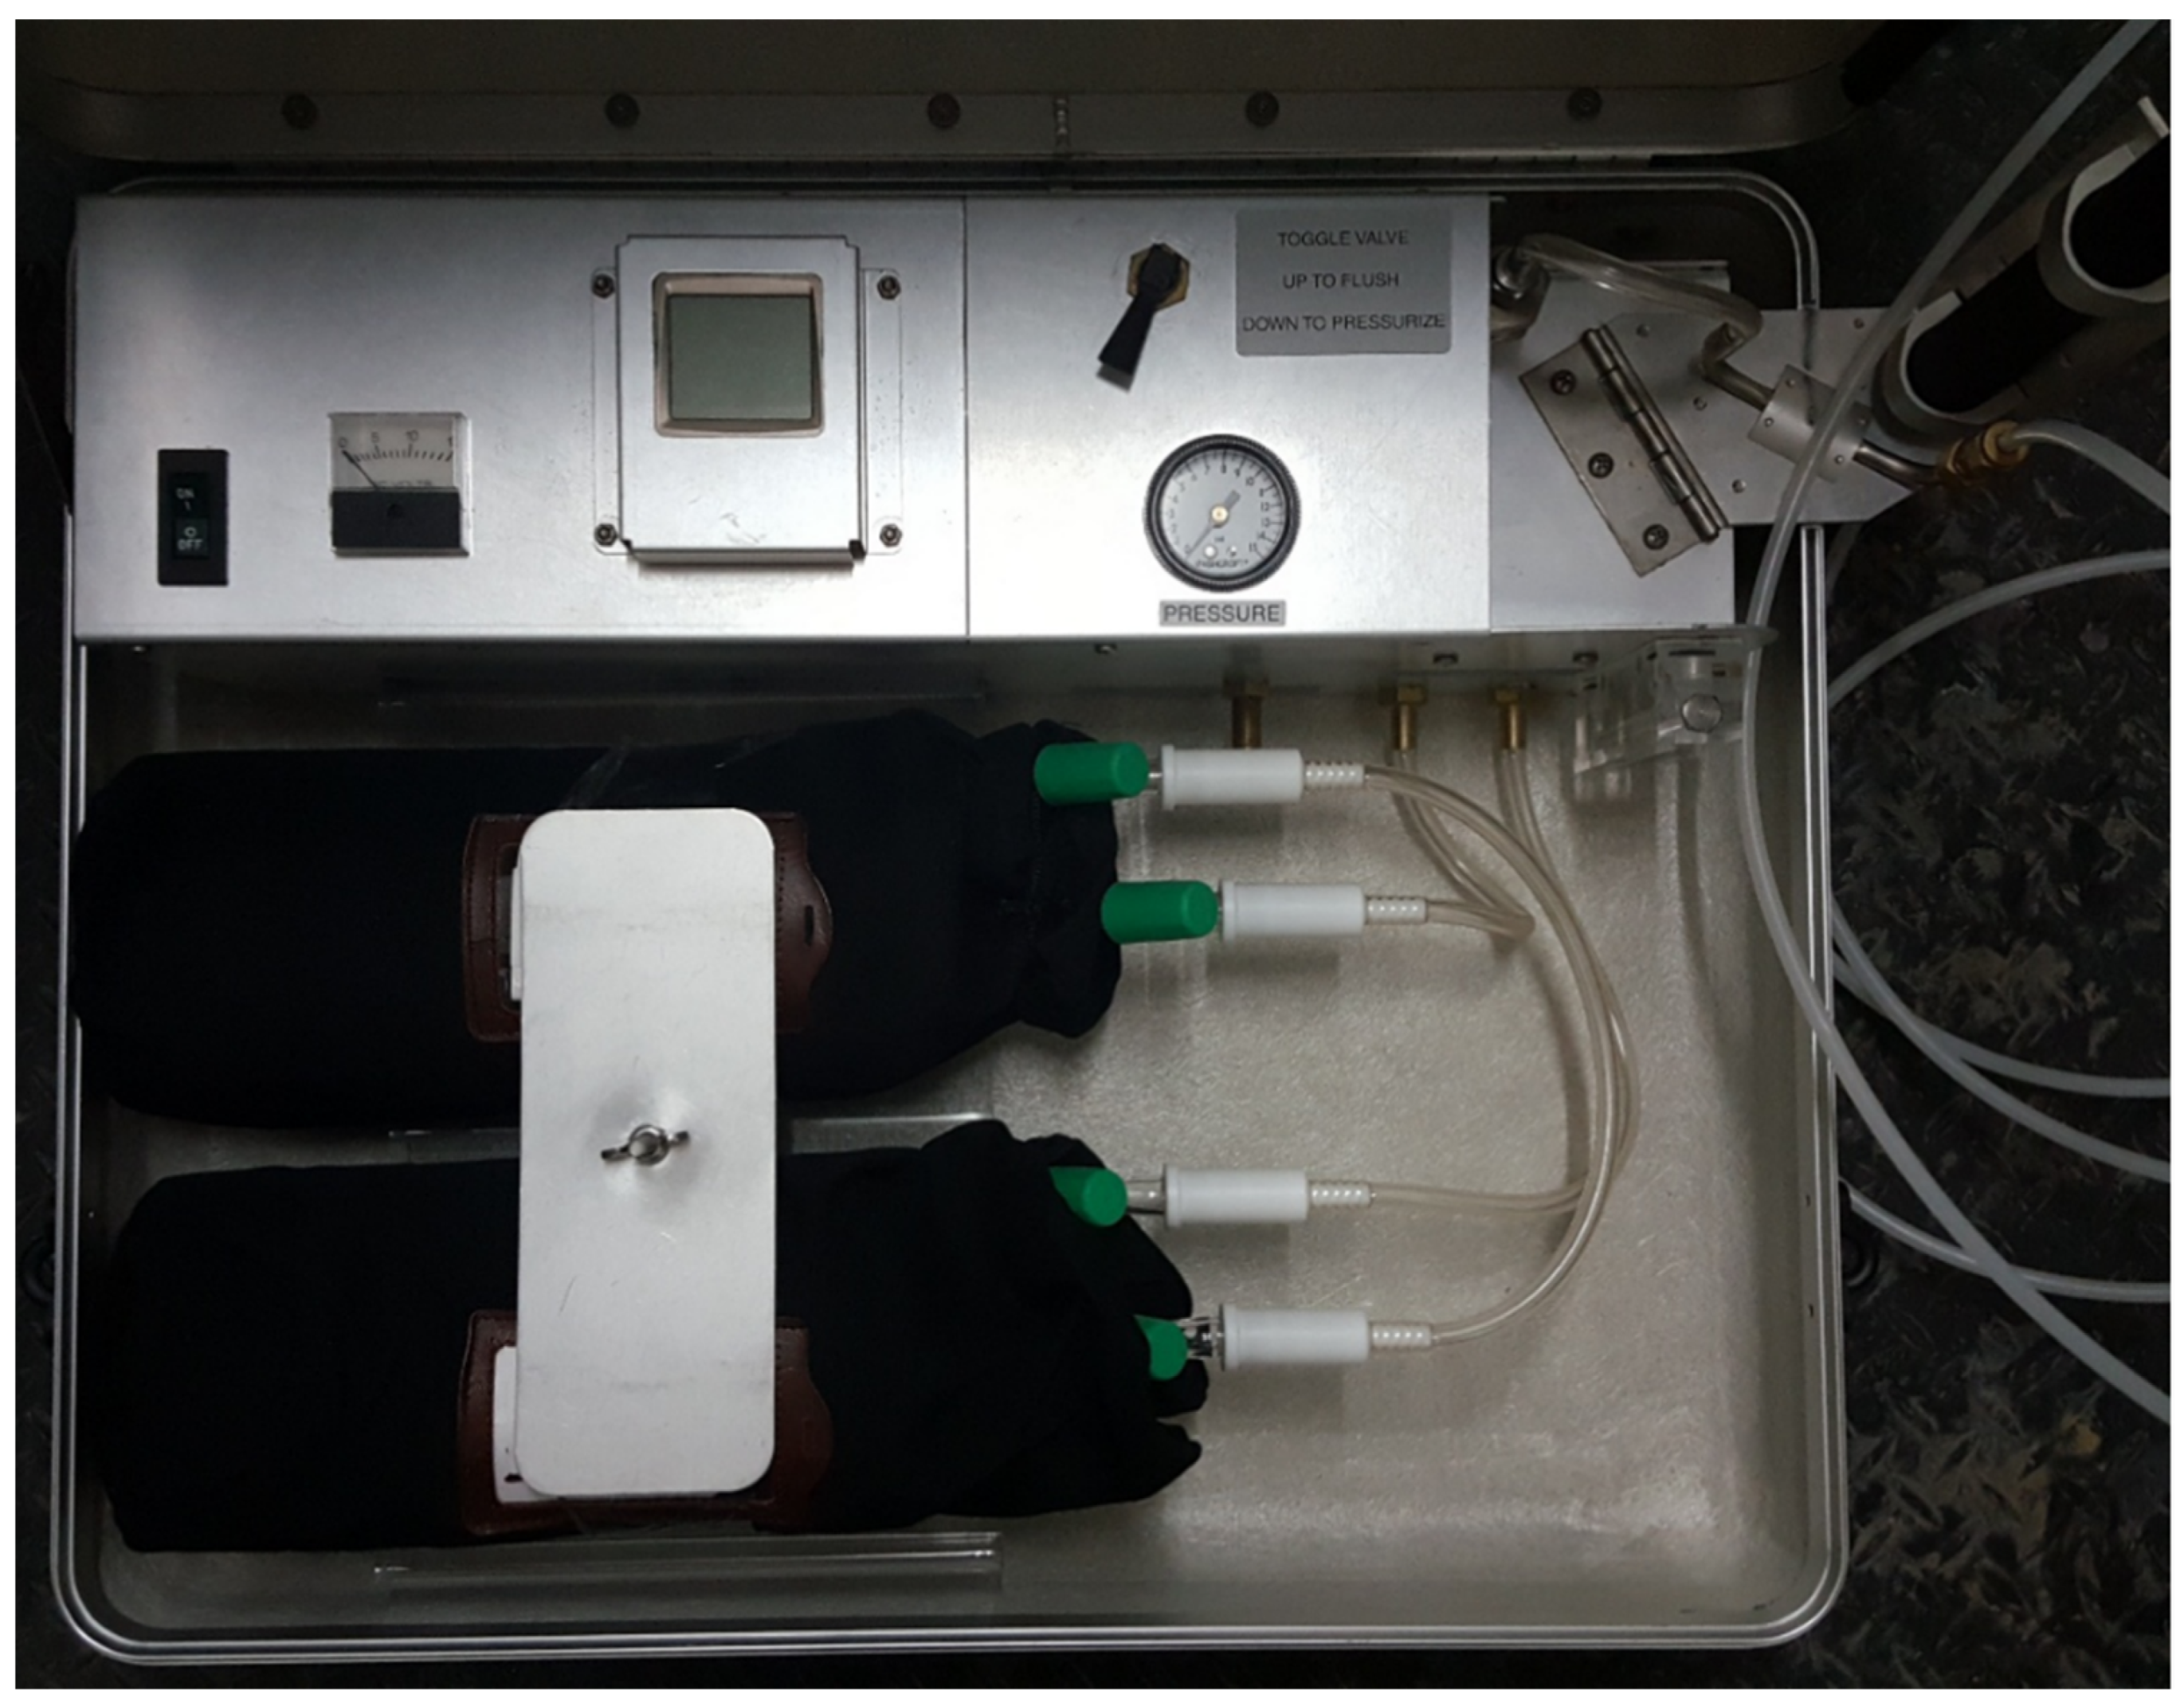
2. Materials and Methods

Zhongshan Station is located on the southeast coast of Prydz Bay in Antarctica, on the Milo Peninsula (69°22′24″ S, 76°22′40″ E) in the Lassmann Hills of Princess Elizabeth Land in East Antarctica (Figure 1). Zhongshan Station covers an area of approximately 4.4 km2, with an average altitude of 11 m above sea level. The climate in this area is cold and dry, with an annual average temperature of −10 °C and a minimum temperature of −36.4 °C, which are typical Antarctic continent climate characteristics. The biological and chemical processes occurring in this area are very weak, because the area is composed of bare bedrock in summer without real soil development. The atmospheric composition observatory (69°22′12″ S, 76°21′49″ E) is located on the flat rock of the Swan Ridge, which is to the northwest of Zhongshan Station [22].
Air samples were collected using NOAA/ESRL/GML standard glass flasks (Figure 2), with two parallel gas samples collected each time. The sampling frequency was once a week. The sampling bottles were stored in a dry low-temperature environment and regularly transported back to China. The Atmospheric Composition Laboratory of Meteorological Observation Center, China Meteorological Administration, used a Gas Chromatography-Electron Capture Detector (GC-ECD, Agilent, Santa Clara, CA, USA) to quantitatively detect the N2O concentration of the samples. The temperature of the detector and column were 395 °C and 75 °C, respectively. The carrier gas flow rate was 90 mL·min−1, and the blowback gas flow rate was 180 mL·min−1. The analysis time was 9.5 min [23,24,25]. The quantitative method used was single standards with offset compensation [24]. The standard gases used are traceable to the World Meteorological Organization/Global Atmospheric Watch (WMO/GAW) scale. The daily concentration value was calculated as the average value of the concentrations in parallel glass flask samples, and the data’s integrity was high, reaching 97.6%. In order to remove interference from abnormal data, and according to empirical analyses, when there is no sudden obvious pollution in the local area, the difference in the concentration data of two parallel samples is no more than 1 ppb (when collecting the sampled gas, the two parallel gas samples were collected at almost the same time). Therefore, the values of two parallel samples with a concentration difference higher than 1 ppb were preliminarily screened out. The data without parallel control samples were also excluded. On this basis, a secondary processing was performed according to the Lajda criterion (|xi − “ x - ”| > 3б), where outliers larger than three standard deviations were removed; xi is the measured concentration, x - is the daily average concentration, and б is the daily standard deviation. Data from other representative sites in Antarctic regions were taken from the World Data Center for Greenhouse Gases [26]. The included sites were the Casey (66°16′54″ S, 110°31′28″ E, CYA, https://www.antarctica.gov.au/antarctic-operations/stations/casey, accessed on 13 May 2025), Mawson (67°36′ S, 62°52′ E, MAA, https://www.antarctica.gov.au/antarctic-operations/stations/mawson, accessed on 10 May 2025), Arrival Heights (77°50′58″ S, 166°46′06″ E, ARH, https://www.ats.aq/devph/en/apa-database/27, accessed on 13 May 2025), Syowa (69°00′19″ S, 39°34′52″ W, SYO, https://www.nipr.ac.jp/antarctic/english/jarestations/#syowa, accessed on 13 May 2025), Palmer (64°46′27″ S, 64°03′11″ W, PSA, https://www.nsf.gov/geo/opp/ail/palmer-station, accessed on 14 May 2025) and South Pole sites (89°54′ S, 24°48′ W, SPO, https://gml.noaa.gov/obop/spo, accessed on 13 May 2025).
Casey station situated in an area near the low, rocky Windmill Islands and peninsulas; Casey station is perched on the edge of the massive Antarctic ice cap. The main features of environmental significance at Casey station are large areas of mosses and lichens. Mawson station is situated on an isolated outcrop of rock on the coast in Mac Robertson Land, at the edge of the Antarctic plateau. In this coastal region, the plateau surface is mostly blue ice. Occasionally, the ice is covered with light snow in winter and spring. Arrival Heights is a small range of low hills near the south-eastern end of Hut Point Peninsula, south-east Ross Island. It is about 1.5 km north of McMurdo Station and 3 km northwest of Scott Base. It is 184 m above sea level. Syowa Station (29 m above sea level) is located on Higashi-Ongul To (East Ongul Island), approximately 4 km from the mainland on the eastern side of Lutzow-Holmbukta Bay in eastern Antarctica. Due to its location on an island 4 km from the Antarctic mainland, Syowa Station is not markedly affected by katabatic (downslope) winds, meaning it has a relatively warm coastal climate with mild wind conditions. Palmer Station is located in a protected harbor on the southwestern coast of Anvers Island off the Antarctic Peninsula, which is known for its diverse marine ecosystems, including krill, fish, and various species of whales, seals, and penguins. It is 10 m above sea level. The South Pole Station is positioned at 90° S, the geographic South Pole. South Pole Station sits atop the Antarctic ice sheet at an elevation of approximately 2835 m above sea level. South Pole Station is located in the interior of Antarctica, one of the most remote and extreme environments on Earth.
To analyze the possible influence of local meteorological conditions on the N2O concentration, the correlations between atmospheric N2O concentrations and meteorological factors such as air pressure, air temperature, relative humidity, and visibility at Zhongshan Station were analyzed. The correlation coefficients between the above meteorological factors and the N2O concentration were low, less than 0.4, and the correlations were not significant; there was no obvious regularity at the daily, monthly, or seasonal scales. In addition, the correlation between wind direction and N2O concentration was also not significant at the daily scale. The minute-level data of wind direction frequencies and the corresponding N2O concentrations at Zhongshan Station in 2021 were calculated. The prevailing wind directions of E and ENE at Zhongshan Station accounted for 32.1% and 24.3% of the wind direction frequency in a year, respectively, and the N2O concentration did not increase significantly during these periods. It was concluded that the prevailing wind direction has no significant effect on the concentration of N2O in the area. Therefore, the change in local meteorological factors was considered to have no obvious effect on N2O concentration.

3. Results and Discussion

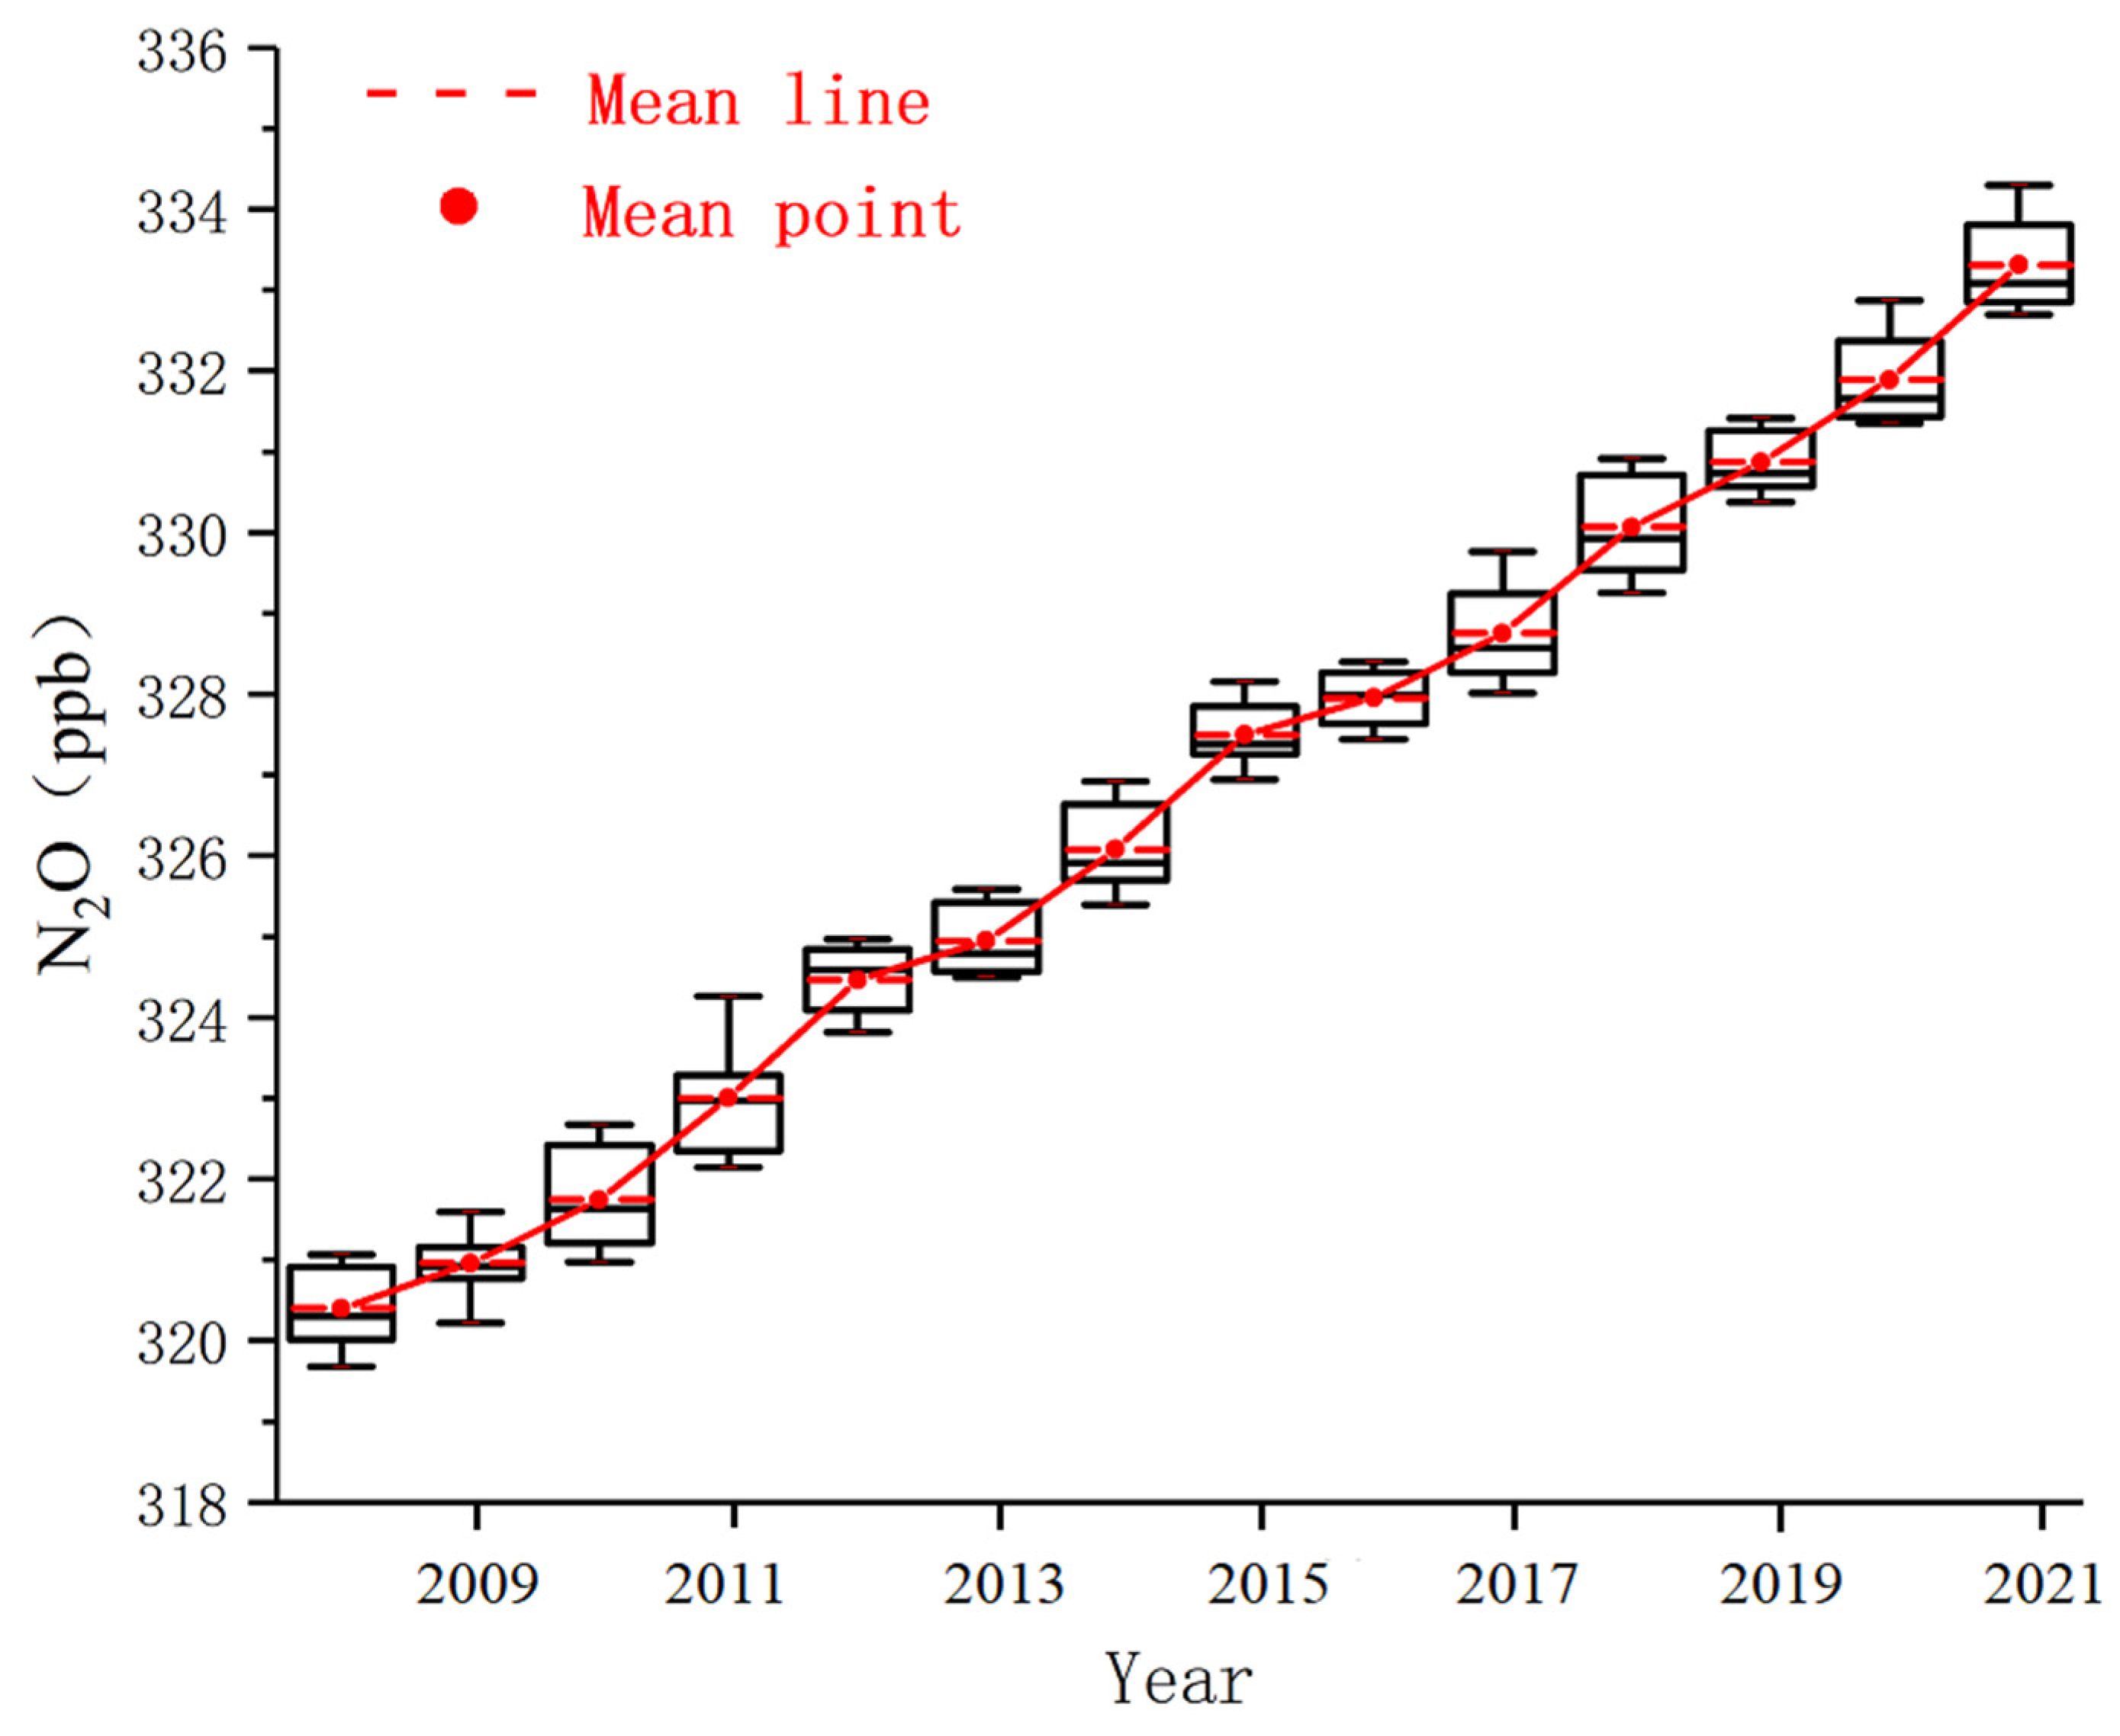
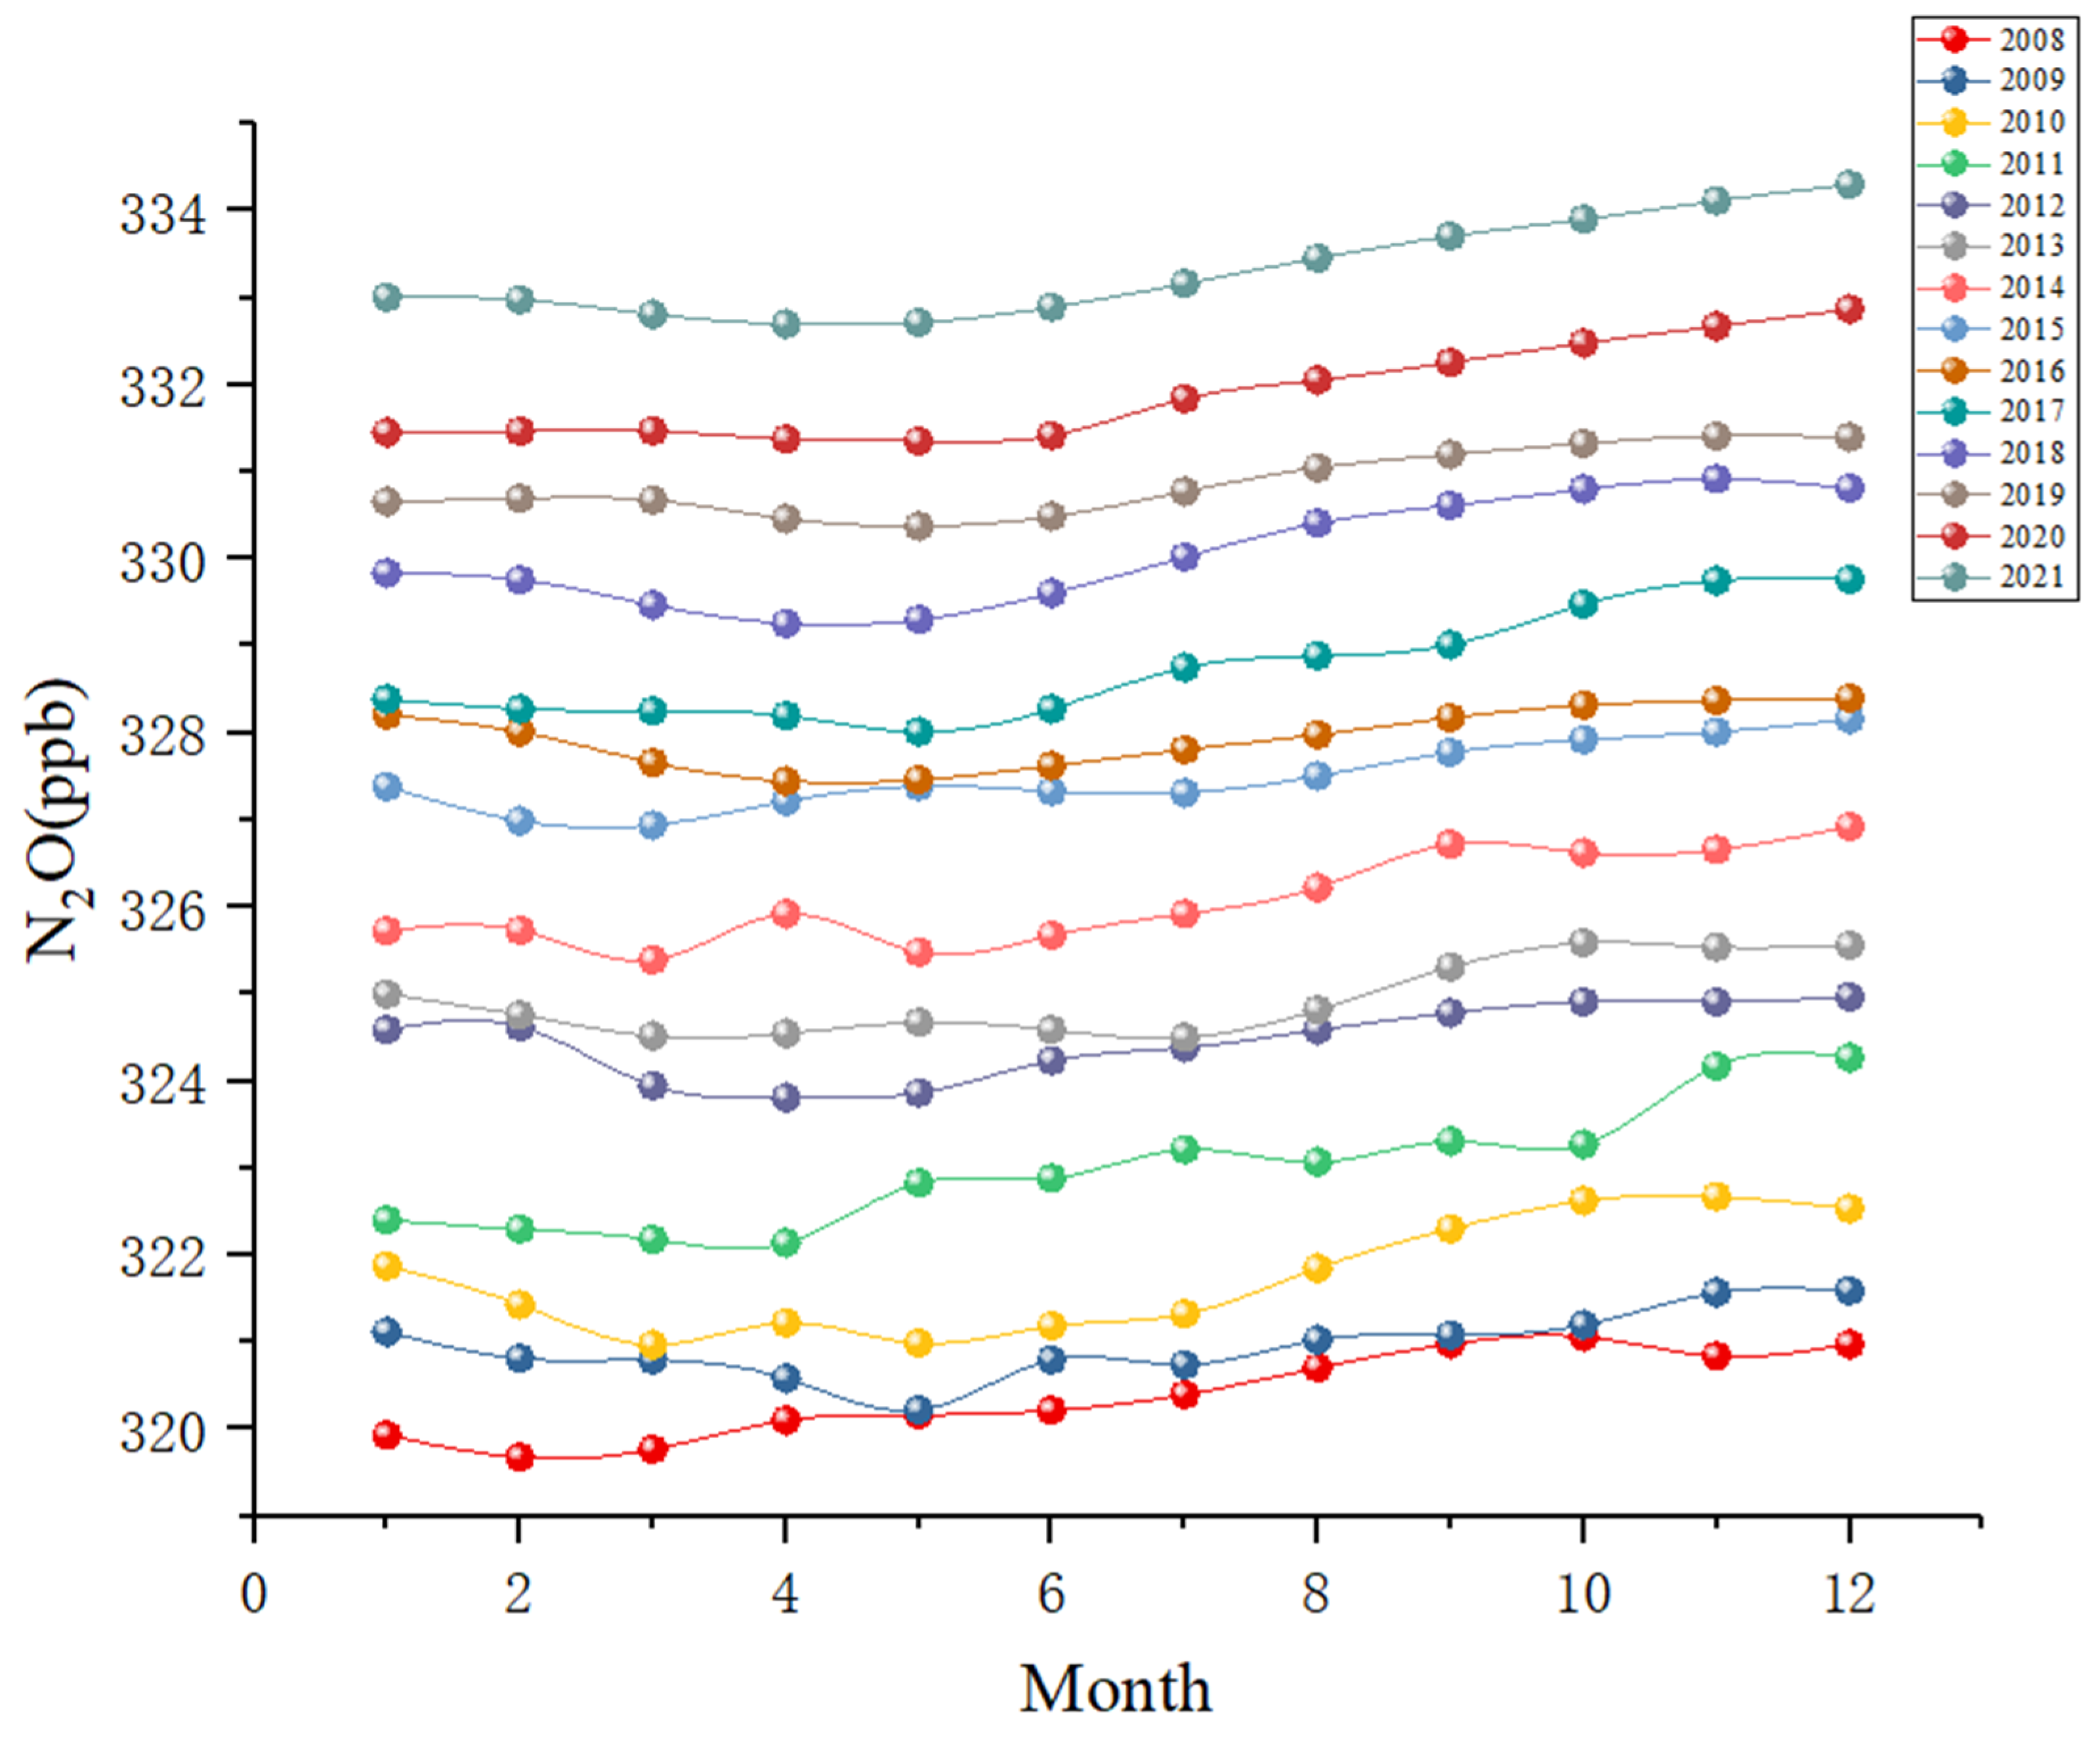
3.1. Interannual Variation in N2O Concentration

From 2008 to 2021, the annual mean value of the atmospheric N2O concentration in the Antarctic Zhongshan Station area rose year by year (Figure 3), from 320.40 ppb in 2008 to 333.31 ppb in 2021, with an annual average increase of 0.99 ppb (Table 1) and increase rates ranging from 0.46 to 1.5 ppb/yr. The Mann–Kendall Trend Test was conducted using R language. The z value was 2.2045 (a z value greater than zero indicates an upward trend, while a z value less than zero indicates a downward trend), and the p value was 0.0275. Through this analysis, it can be determined that the annual mean value of the atmospheric N2O concentration in the Antarctic Zhongshan Station area rose year by year, and this trend was indeed significant. The annual growth rate in 2012~2013 and 2015~2016 were relatively low, at 0.48 ppb/yr and 0.46 ppb/yr, respectively.
N2O in the troposphere is chemically stable and can travel long distances [27]. Moreover, this observation point is less affected by human activities. By comparing global annual mean concentration in 2008–2021 from world greenhouse gas data center (https://gaw.kishou.go.jp/publications/global_mean_mole_fractions#content3, accessed on 13 May 2025), the variation in atmospheric N2O concentration at Zhongshan Station in Antarctica is generally consistent with that of the global average. Therefore, the multi-year trend in atmospheric N2O concentration at this observation point can reflect the trend in global atmospheric N2O concentration, which showed an increasing trend each year. This global trend is closely related to N2O emissions from human activities, such as the increased usage of nitrogen fertilizer in agricultural systems, industrial development, and the increase in fossil fuel combustion [4,23].

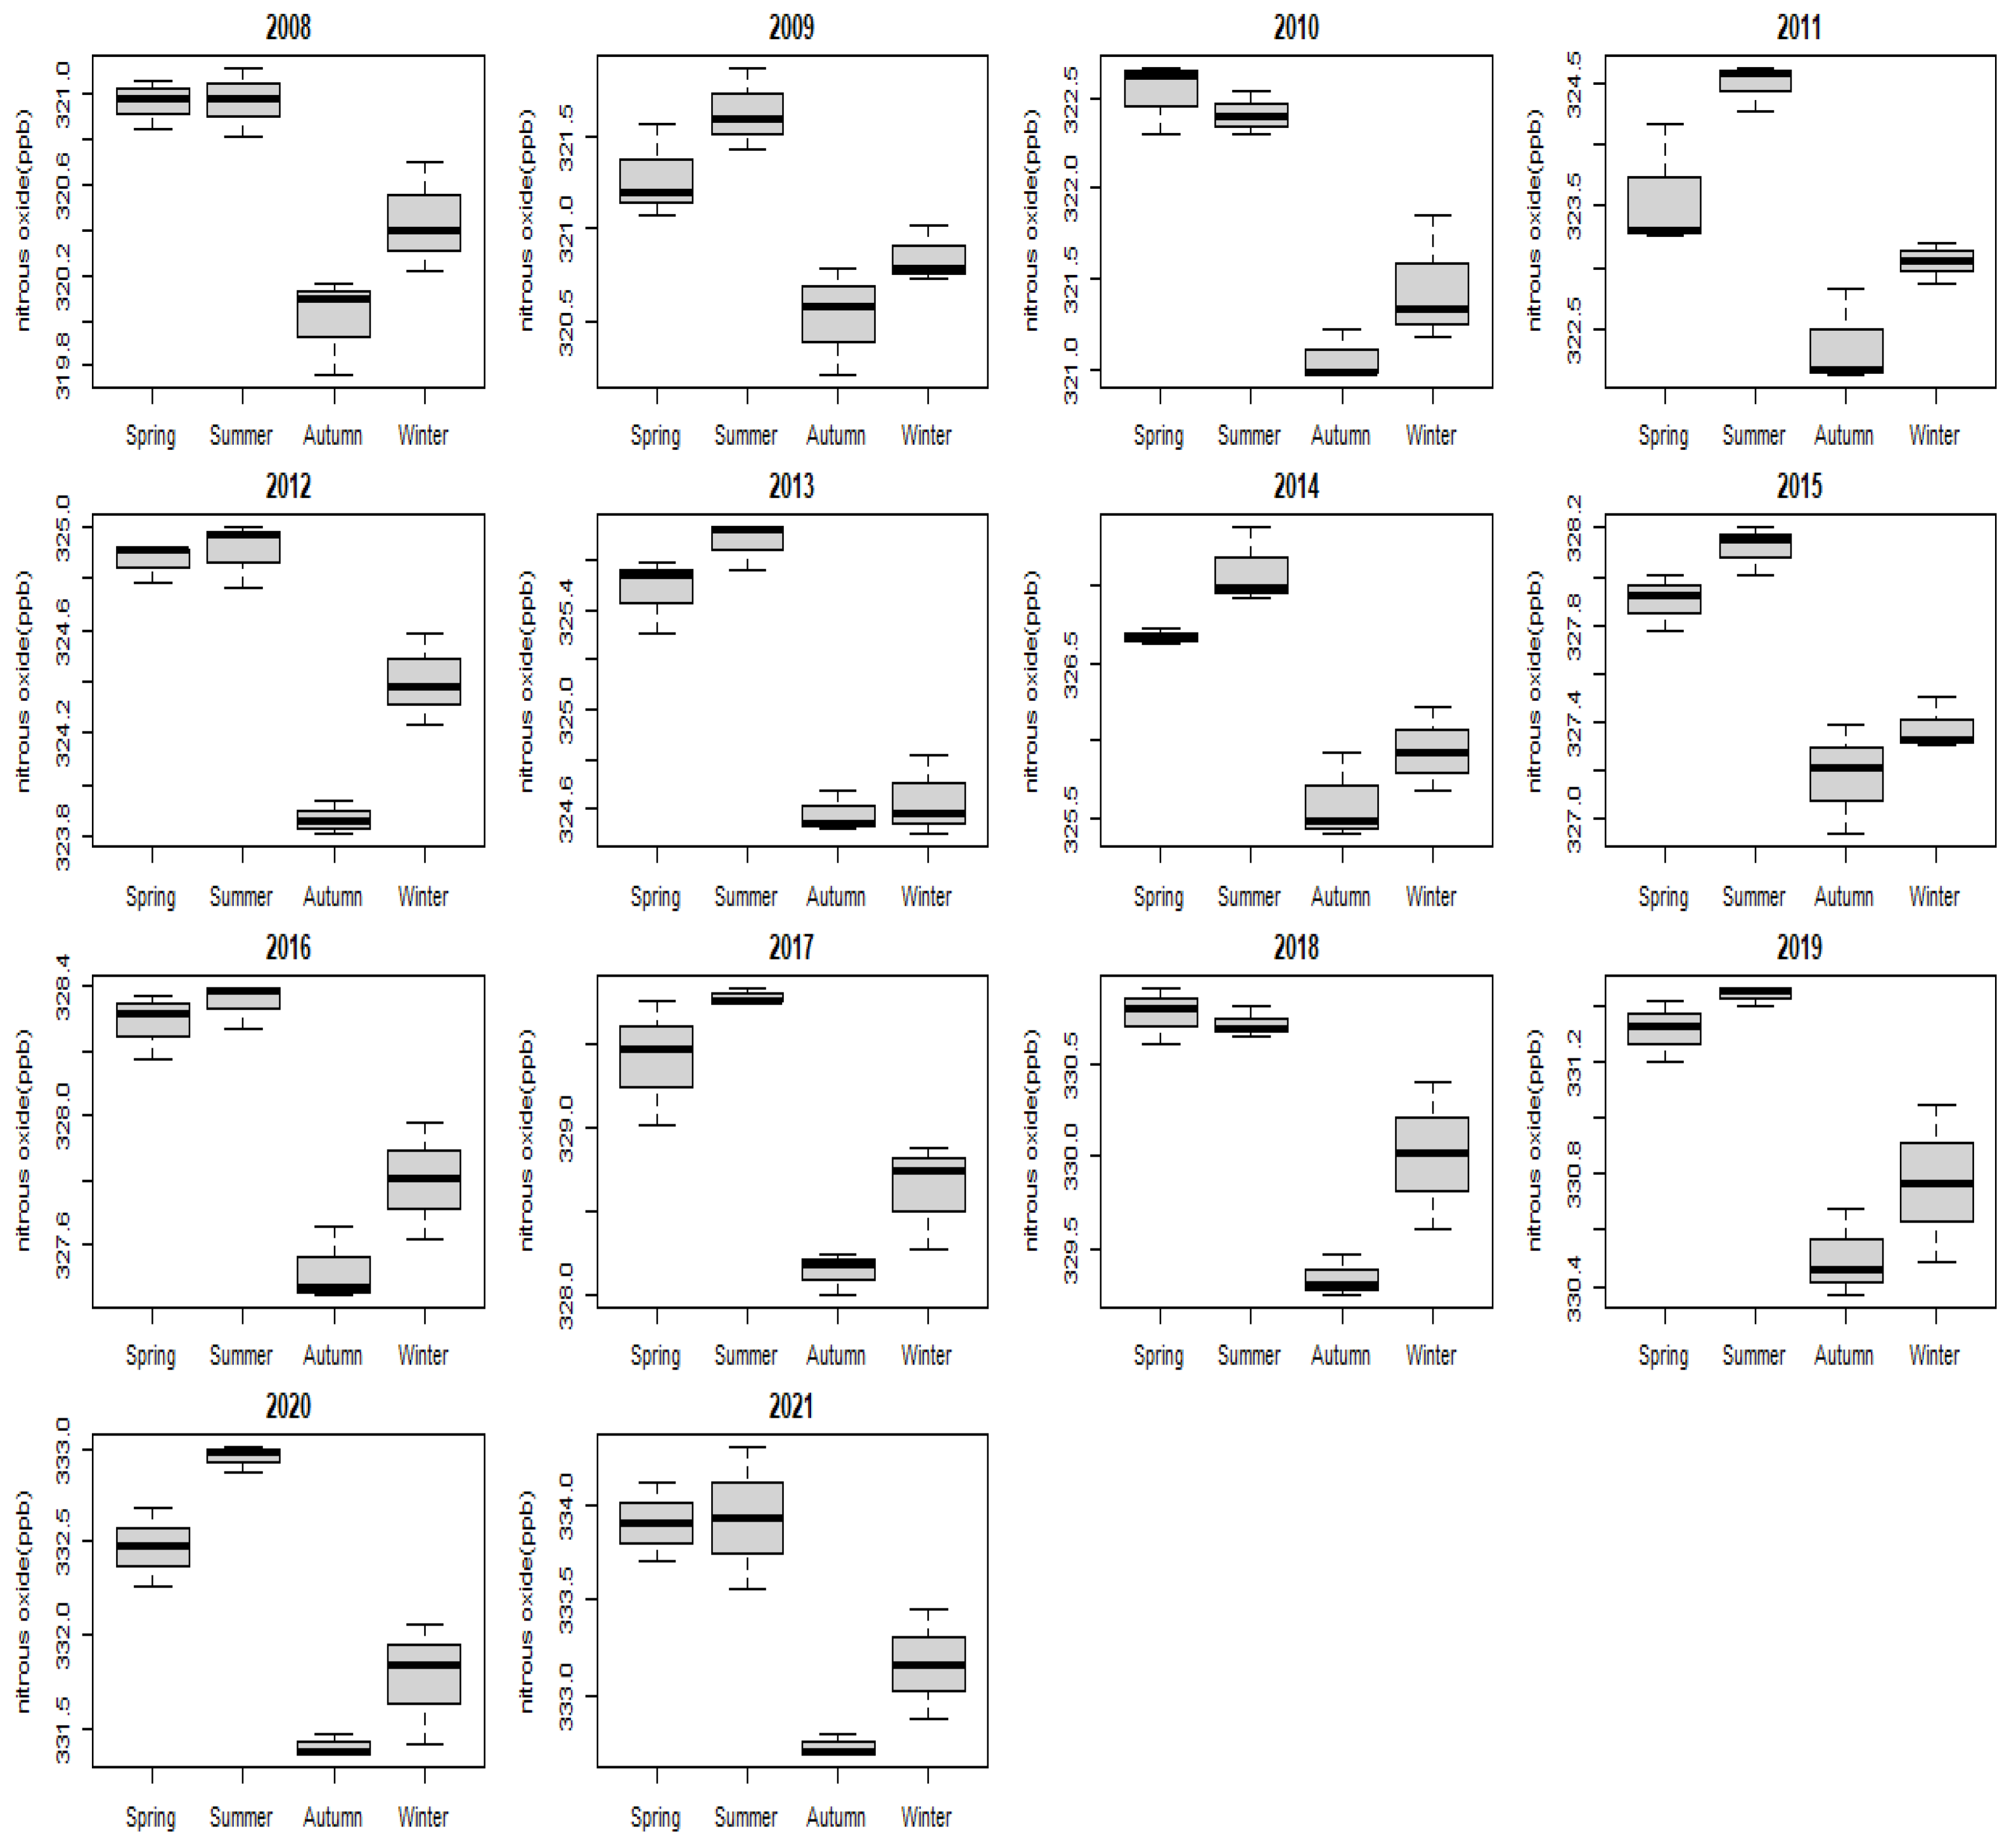
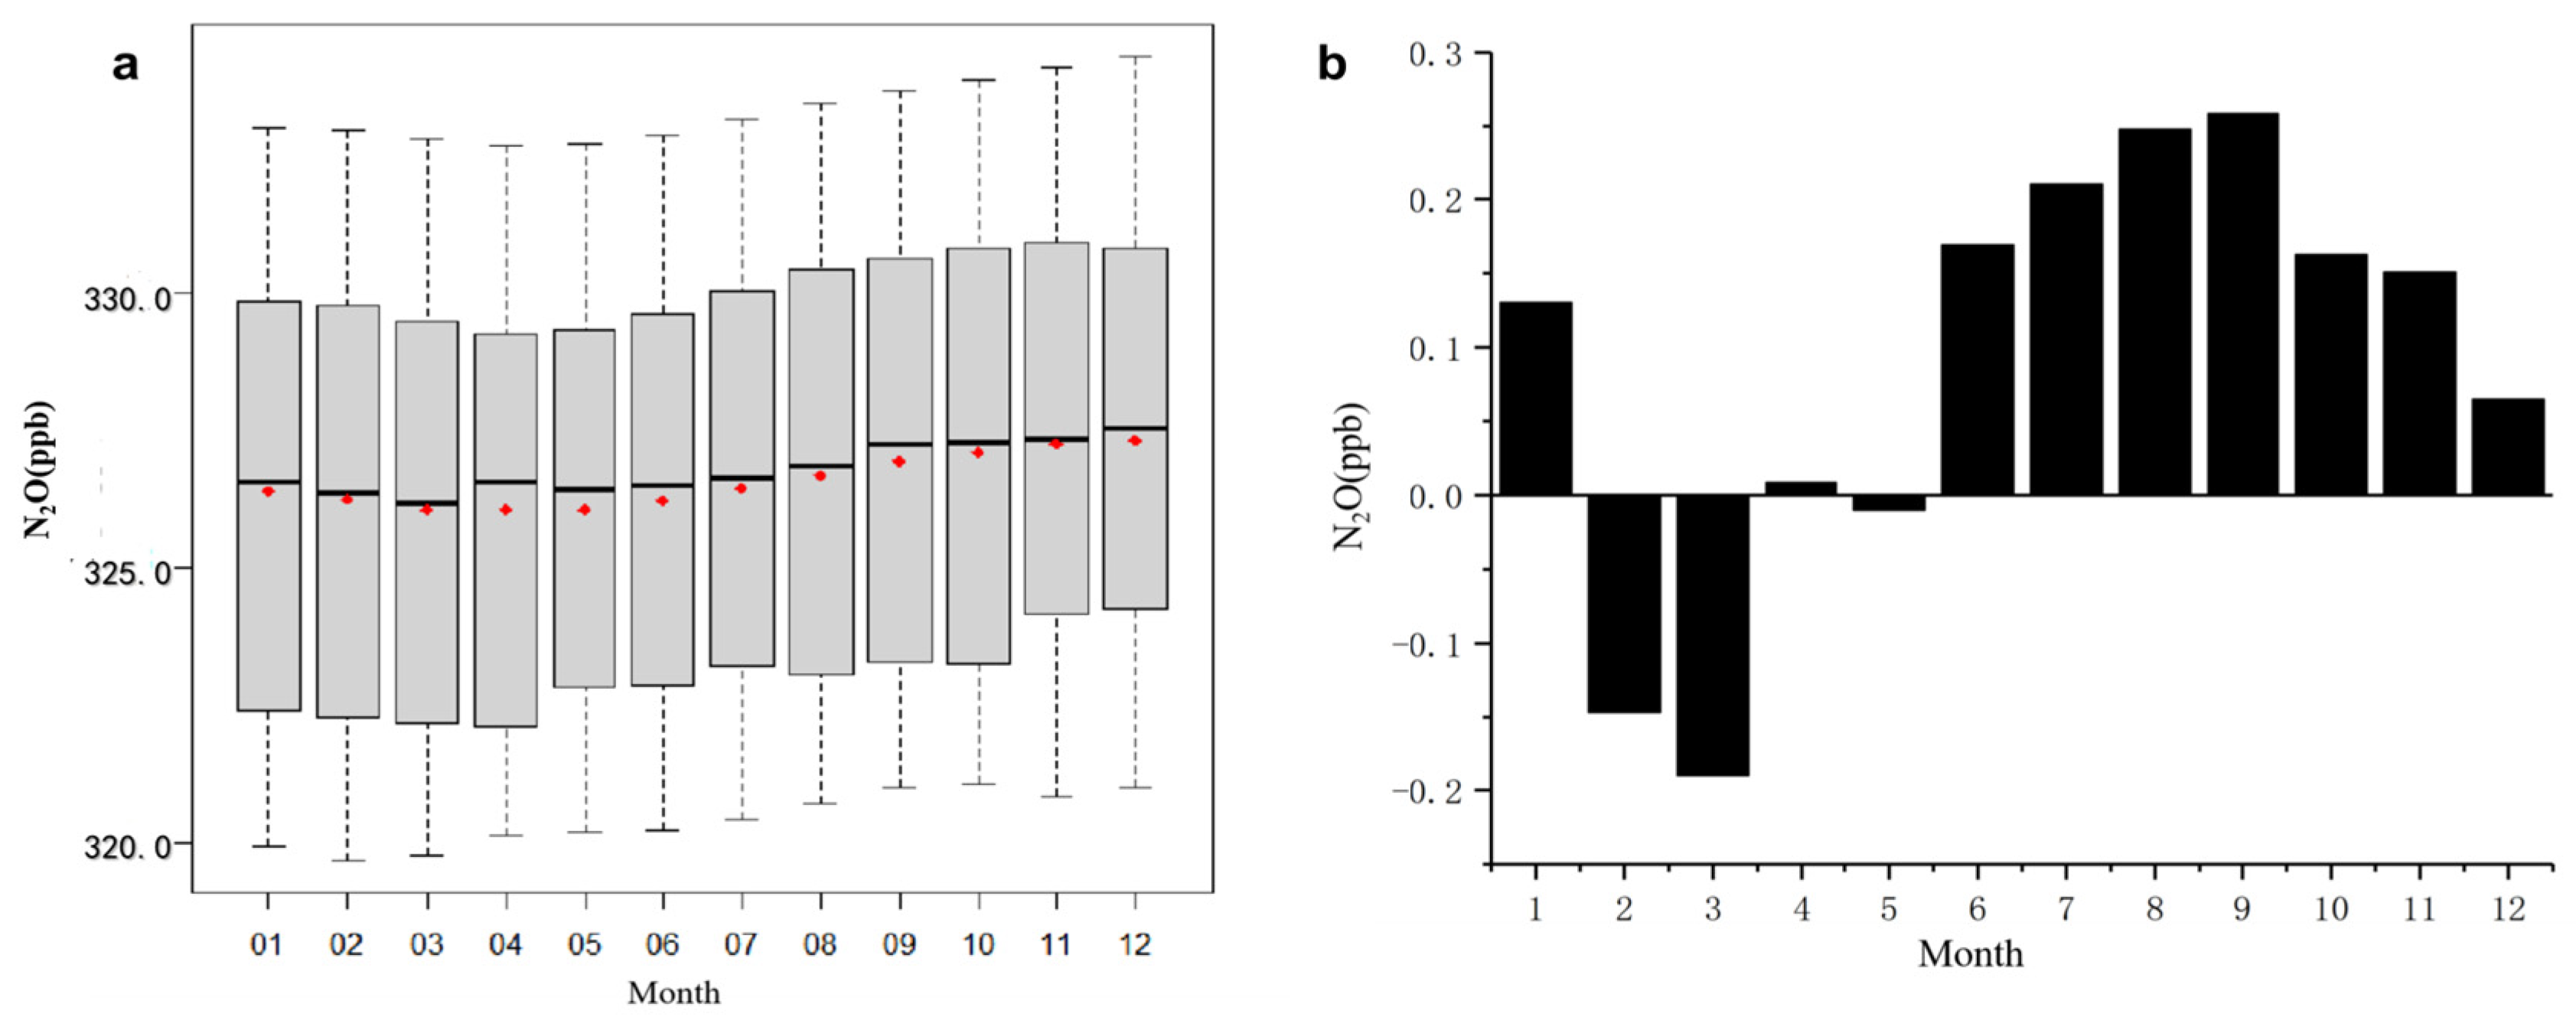
3.2. Seasonal and Monthly Variations in N2O Concentration

The monthly mean values of atmospheric N2O concentrations from 2008 to 2021 were used to calculate trends in seasonal variation for each year (Figure 4), revealing a significant pattern of seasonal variation.
The analysis of the monthly variation in atmospheric N2O concentration across the whole time series shows that the atmospheric N2O concentration in the Zhongshan Station area presents an overall monthly variation trend of first decreasing and then increasing (Figure 5a). The average monthly atmospheric N2O concentration reached a yearly low of 326.06 ppb in May and then began to rise month by month. In December, the atmospheric N2O concentration reached its yearly high of 327.32 ppb. Figure 5b shows the variation in the rate of the monthly mean increase in atmospheric N2O concentration in adjacent months at Zhongshan Station. Autumn has the smallest growth rate of about 0.01 ppb, while spring has the largest growth rate of about 0.26 ppb.
To obtain a clearer understanding of the seasonal variation in the atmospheric N2O concentration at Zhongshan Station, the monthly variation seen each year for 14 consecutive years, from 2008 to 2021 (Figure 6), was calculated. The monthly variation in most years was consistent with the overall seasonal variation. In most years, the lowest values of the year were observed in March (in 2010, 2014, and 2015), April (in 2011, 2012, 2016, 2018, and 2021), and May (in 2009, 2017, 2019, and 2020), which are the months of autumn in the Southern Hemisphere. There was a significant increase in April 2014 compared with the trends in other years, but this phenomenon was not seen at other Antarctic sites. By analyzing the observational data from Zhongshan Station that month, it was found that only two groups of samples were collected that month in 2014 due to weather, and the concentration values of one set of parallel samples (12 April) was obviously abnormal. After quality control, only one set of values from 3 April were retained, which were, respectively, 325.28 ppb and 326.26 ppb, with a difference of 0.98 ppb. This was very close to the limit of our initial filtering criteria, i.e., the difference in concentration values between two parallel samples did not exceed 1 ppb. It was speculated that leakage happened during transportation or there was an overly large measurement error in the GC analysis, causing an abnormally high monthly mean N2O concentration to appear.
Among these years, 2010 and 2018 deviated slightly from the overall trend, with their N2O concentration in spring being higher than that in summer. Through further comparative analysis, it could be seen that the annual concentration began to decline in November in these two years, which was slightly earlier than in other years, which is considered to be the cause of the low atmospheric N2O concentration recorded in summer.
There is a strong stable boundary layer in the atmosphere in the spring and winter in Antarctica, and transport from the stratosphere to troposphere is difficult, while transport from the stratosphere to troposphere in autumn is stronger than that in spring and winter [28,29,30]. This also provides an explanation for the seasonal variation in atmospheric N2O concentration at Zhongshan Station.
In this paper, the TrajStat plug-in tool (the 2021 version, the online software: MeteoInfo: http://www.meteothink.org, accessed on 13 March 2025) was used to calculate the trajectory of the air mass at Zhongshan Station in Antarctica. The trajectory height was set to 1000 m above the ground. The total running time of each trajectory was 168 h (that is, 7 days), and the time interval of each run was 24 h. To study the influence of synoptic-scale atmospheric motion on the seasonal variation in N2O concentration, we conducted a cluster analysis of the air mass trajectories in the summer and winter of 2021 at Zhongshan Station (Figure 7). Most of the air masses (more than 75.11%) originated from the adjacent sea area in summer, while 5.63% of the air masses came from the Antarctic interior in winter. It can be seen from the figure that there are certain differences in N2O concentration in various air clusters. The average N2O concentration of the adjacent sea area was 333.78 ppb in summer while the average N2O concentration of the inland air mass was only 332.97 ppb in winter 2021, which was the lowest concentration recorded for all air mass trajectories. In summer, sea ice melts, surrounding the Antarctic continent. Due to Ekman transport, the Antarctic circumpolar current region south of the Antarctic polar front produces upwelling, which transports dissolved N2O from deep water to the surface, which results in a higher N2O concentration in the surface seawater [12]. The air–sea exchange in this region thus changes the atmospheric N2O concentration in the vicinity for a short period of time [22,23]. The atmospheric observatory at Zhongshan Station is located in a coastal area of the Southern Ocean near Prydz Bay. The atmospheric N2O concentration in this area is easily affected by the high concentration in air masses from the ocean, which result in the higher summer values seen. However, in winter, the atmosphere from inland regions is more likely to be mixed with air masses with low concentrations of N2O generated by the downward stratospheric exchange, which makes the N2O concentration of air masses from inland areas relatively low [29,31,32,33]. Therefore, this leads to the seasonal characteristics of low atmospheric N2O concentrations at the Zhongshan Station in winter and relatively high concentrations in summer.

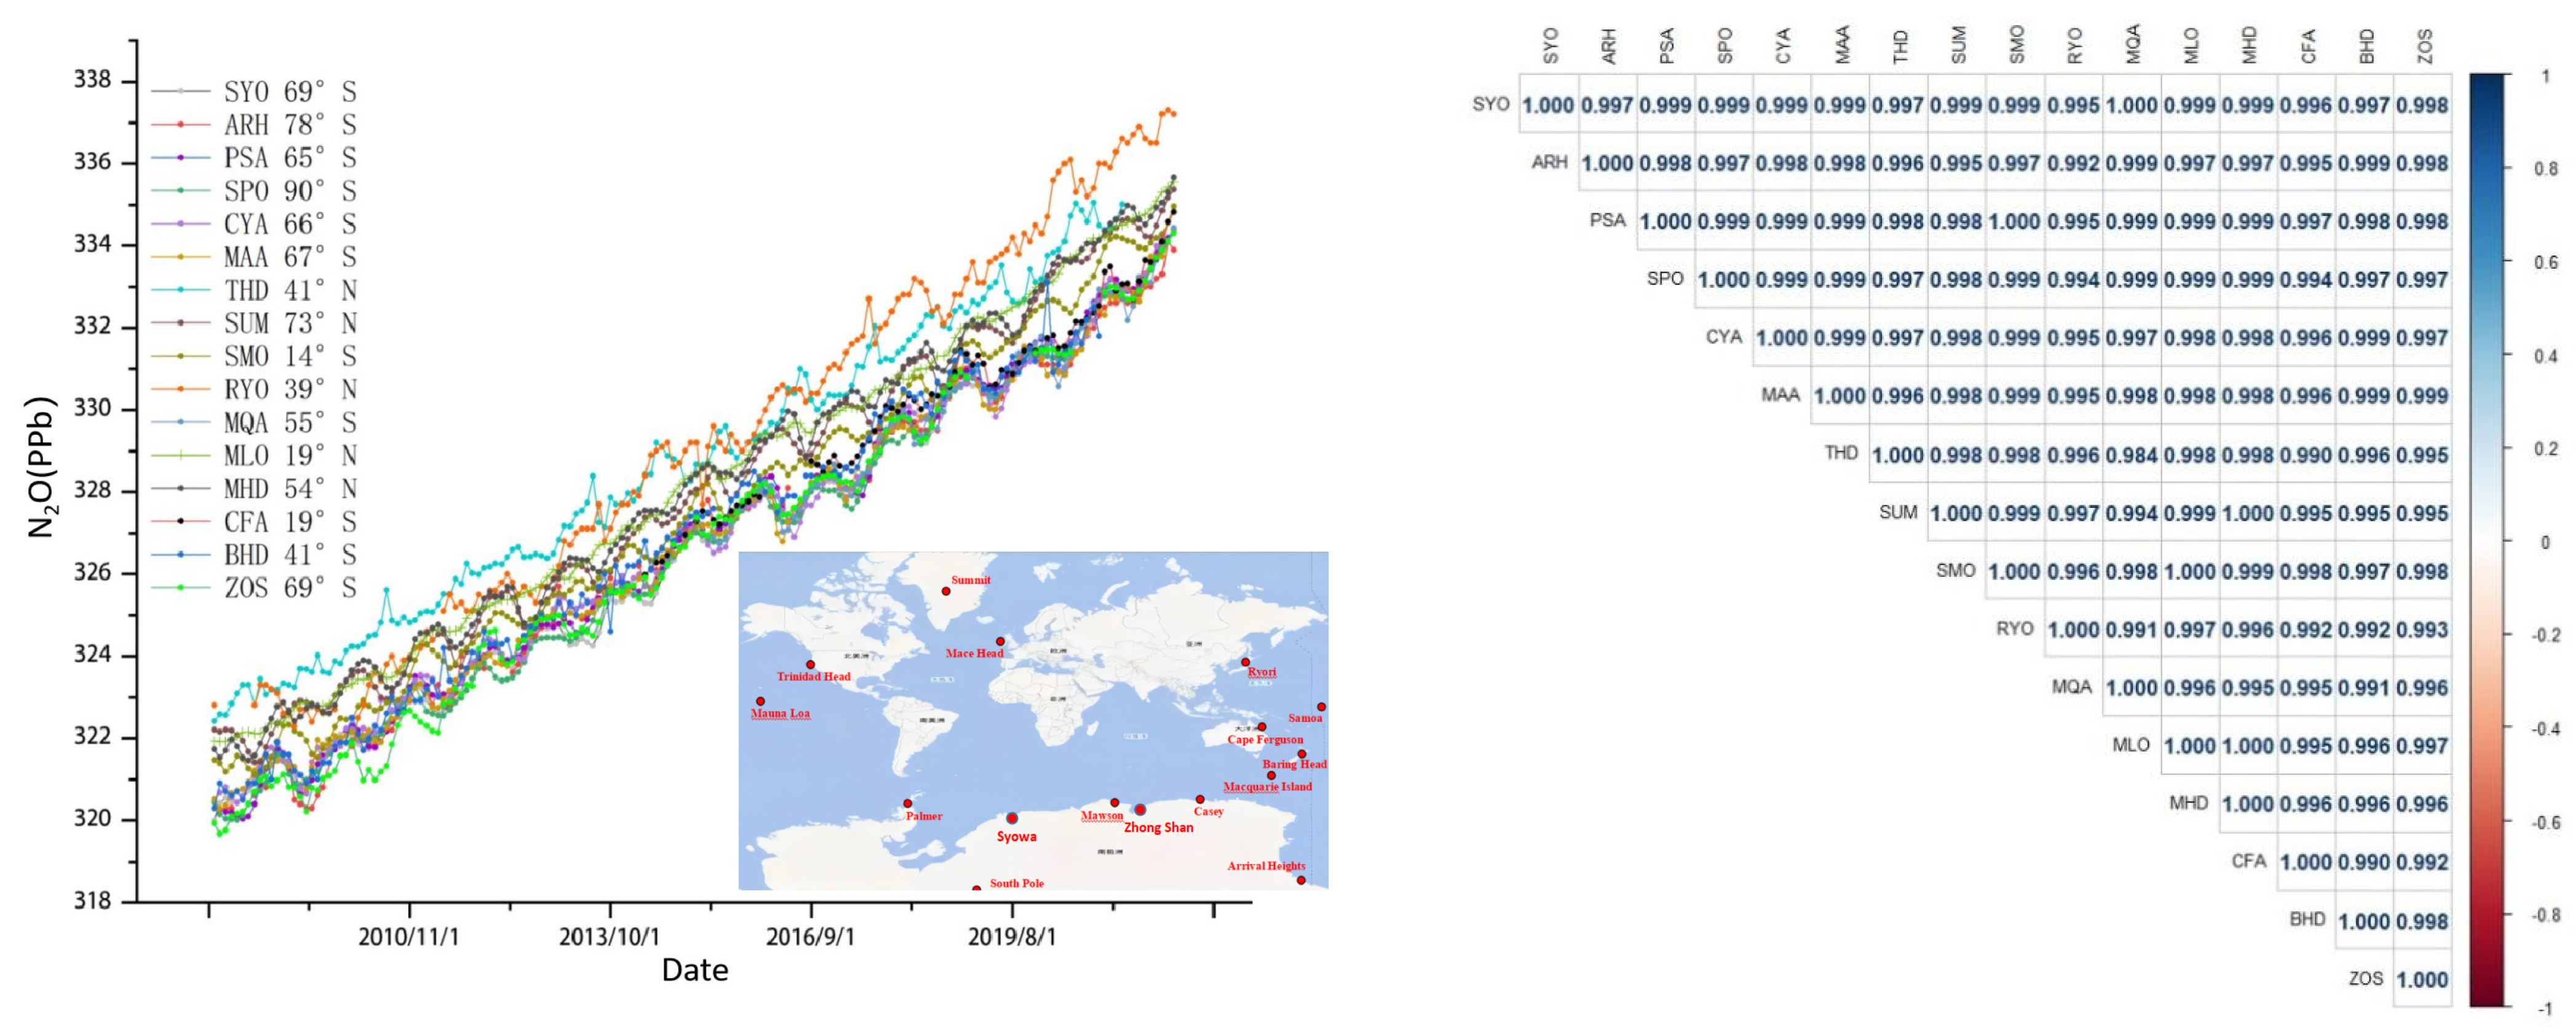
3.3. Comparison with Other Antarctic Observatories

By comparing our measurements with those of globally renowned stations (Figure 8), the annual variation at Zhongshan station was found to be consistent with that of the other stations. The difference in concentration each year was small, and the maximum difference was no more than 1 ppb. We conducted a correlation analysis of the annual observation values at each station using Pearson product-moment correlation coefficient (PPMCC). As can be seen from the figure, there is a strong linear relationship between the stations. The background concentration of atmospheric N2O observed at Zhongshan Station reflects the variation in the background concentration of global atmospheric N2O. Strengthening the long-term background concentration observations made at Zhongshan Station can make them a reference for further understanding the background status of atmospheric environments in Antarctica and the change in global greenhouse gas concentrations. However, there were still slight differences in the concentrations measured at different stations; for example, the monthly average N2O concentration of Zhongshan station is 0.04 ppb higher than that measured at the South Pole Station located in the Antarctic interior, while the monthly average N2O concentrations at other coastal stations (ARH, CYA, MAA, SYO, and PSA) were slightly higher than those at Zhongshan station (0.04 to 0.22 ppb higher). This phenomenon indicated that the local marine environment and atmospheric circulation may have varying degrees of impact on these stations, requiring station-by-station research to be conducted.

4. Conclusions

The background concentration and variation in atmospheric N2O at Zhongshan Station were obtained by statistical analysis of atmospheric N2O concentrations measured from 2008 to 2021. The conclusions show the following:
The atmospheric N2O concentration at Zhongshan Station has monthly and seasonal variations. The monthly mean value of the N2O concentration showed a trend of decreasing at first and then increasing each year. Atmospheric N2O concentrations are high in austral spring and summer and low in autumn and winter. They reached their lowest value in austral autumn. This seasonal change is mainly related to atmospheric mixing caused by atmospheric circulation, which is affected by the different concentrations of the air masses formed by seasonal sea ice melting and stratospheric exchange. At present, the data cannot explain this well, and further research is needed.
Compared with other representative stations in Antarctica, the atmospheric N2O concentration at Zhongshan Station is similar, and its annual trend is generally consistent with the atmospheric N2O concentration trends at various stations in Antarctica. Thus, the data in this paper represent the variation characteristics of atmospheric N2O concentrations in Antarctica. However, there are some differences in the annual increase in atmospheric N2O concentration between Zhongshan Station and other stations, and the reasons for this phenomenon need to be further discussed on a station-by-station basis.

Author Contributions

Conceptualization, D.Z.; methodology, B.T., Y.X., J.T. and L.B.; formal analysis, Y.X.; investigation, D.Z.; data curation, B.T., W.S. and D.Z.; writing—original draft preparation, Y.X. and D.Z.; writing—review and editing, D.Z.; visualization, Y.X.; supervision, X.X. and D.Z.; funding acquisition, M.D. All authors have read and agreed to the published version of the manuscript.

Funding

This work is financially supported by the National Natural Science Foundation of China (42201151) and the Basic Research Fund of Chinese Academy of Meteorological Sciences (2023Z015, 2023Z004, 2024Z007).

Data Availability Statement

The original contributions presented in this study are included in the article. Further inquiries can be directed to the corresponding author.

Acknowledgments

We give our thanks to the assistance of all staff who wintered at Zhongshan station during data collection. We thank the data providers at WDCGG for their excellent work in producing the data sets referenced in this article. We wish to thank the reviewers for their efficient review work and constructive suggestions. We would like to express our gratitude to the editors for their substantial efforts in polishing the English of this article.

Conflicts of Interest

The authors declare that this research was conducted in the absence of any commercial or financial relationships that could be construed as a potential conflict of interest.

References

  1. Ruiz, D.J.; Prather, M.J.; Strahan, S.E.; Thompson, R.L.; Froidevaux, L.; Steenrod, S.D. How atmospheric chemistry and transport drive surface variability of N2O and CFC-11. J. Geophys. Res. Atmos. 2021, 126, e2020JD033979. [Google Scholar] [CrossRef]
  2. Yang, R.; Yuan, L.J. Generation, emission reduction/utilization, and challenges of greenhouse gas nitrous oxide in wastewater treatment plants—A review. J. Water Process Eng. 2023, 53, 103871. [Google Scholar] [CrossRef]
  3. Lin, H. Research Status and Prospect of Marine Nitrous Oxide. Adv. Geosci. 2014, 4, 115–121. [Google Scholar] [CrossRef]
  4. Khalil, M.A.K.; Rasmussen, R.A.; Shearer, M.J. Atmospheric nitrous oxide: Patterns of global change during recent decades and centuries. Chemosphere 2002, 47, 807–821. [Google Scholar] [CrossRef]
  5. Stocker, T.F. Climate Change 2013: The Physical Science Basis: Working Group I Contribution to the Fifth Assessment Report of the Intergovernmental Panel on Climate Change; Cambridge University Press: Cambridge, UK; New York, NY, USA, 2014; p. 1535. Available online: https://www.ipcc.ch/report/ar5/wg1/ (accessed on 24 April 2025).
  6. Graves, C.J.; Makrides, E.J.; Schmidt, V.T.; Giblin, A.; Cardon, Z.; Rand, D. Functional responses of salt marsh microbial communities to long-term nutrient enrichment. Appl. Environ. Microbiol. 2016, 82, 2862–2871. [Google Scholar] [CrossRef]
  7. Smith, K.A. Changing views of nitrous oxide emissions from agricultural soil: Key controlling processes and assessment at different spatial scales. Eur. J. Soil. Sci. 2017, 68, 137–155. [Google Scholar] [CrossRef]
  8. Thompson, R.L.; Lassaletta, L.; Patra, P.K.; Wilson, C.; Wells, K.C.; Gressent, A.; Koffi, E.N.; Chipperfield, M.P.; Winiwarter, W.; Davidson, E.A.; et al. Acceleration of global N2O emissions seen from two decades of atmospheric inversion. Nat. Clim. Chang. 2019, 9, 993–998. [Google Scholar] [CrossRef]
  9. Ravishankara, A.R.; Aniel, J.S.; Portmann, R.W. Nitrous oxide(N2O): The dominant ozone-depleting substance emitted in the 21st century. Science 2009, 326, 123–125. [Google Scholar] [CrossRef]
  10. Chen, L.Q.; Zhan, L.Y.; Xu, S.Q.; Zhang, J.; Zhang, Y. Multiple processes affecting surface seawater N2O saturation anomalies in tropical oceans and Prydz Bay, Antarctica. Adv. Polar Sci. 2012, 23, 87–94. [Google Scholar] [CrossRef]
  11. Zhan, L.Y.; Chen, L.Q. Distributions of N2O and its air-sea fluxes in seawater along cruise tracks between 30°S–67°S and in Pryde Bay, Antarctica. J. Geophrsical Res. 2009, 114, C03019. [Google Scholar] [CrossRef]
  12. Zhan, L.Y.; Chen, L.Q.; Zhang, J.X. Contribution of upwelling to air-sea N2O flux at the tip of the Antarctica Peninsula. J. Limnol. Oceanogr. 2018, 63, 2737–2750. [Google Scholar] [CrossRef]
  13. Zhan, L.Y.; Chen, L.Q.; Zhang, J.X.; Yan, J.P.; Li, Y.H.; Wu, M. Austral summer N2O sink and source characteristics and their impact factors in Prydz Bay, Antarctica. J. Geophys. Res. Oceans. 2015, 120, 5836–5849. [Google Scholar] [CrossRef]
  14. Zhu, R.B.; Liu, Y.S.; Hua, X.U.; Ma, J.; Sun, L.G. Temporal and spatial variations of δ15N and δ18O for atmospheric N2O above the oceanic surface from Shanghai to Antarctica. Sci. China Ser. D Earth Sci. 2008, 51, 899–910. [Google Scholar] [CrossRef]
  15. Liu, Y.S.; Zhu, R.B.; Ma, D.; Xu, H.; Luo, Y.H.; Huang, T. Temporal and spatial variations of nitrous oxide fluxes from the littoral zones of three alga-rich lakes in coastal Antarctica. Atmos. Environ. 2011, 45, 1464–1475. [Google Scholar] [CrossRef]
  16. Zhu, R.B.; Liu, Y.; Ma, E.; Sun, J.; Hua, X.; Sun, L. Greenhouse gas emissions from penguin guanos and ornithogenic soils in coastal Antarctica: Effects of freezing–thawing cycles. Atmos. Environ. 2009, 43, 2336–2347. [Google Scholar] [CrossRef]
  17. Hayashi, K.; Tanabe, Y.; Ono, K.; Loonen, M.J.J.E.; Asano, M.; Fujitani, H.; Tokida, T.; Uchida, M.; Hayatsu, M. Seabird-affected taluses are denitrification hotspots and potential N2O emitters in the High Arctic. Sci. Rep. 2018, 8, 17261. [Google Scholar] [CrossRef]
  18. Stewart, K.J.; Brummell Farrell, R.E.; Siciliano, S.D. N2O flux from plant-soil systems in polar deserts switch between sources and sinks under different light conditions. Soil. Biol. Biochem. 2012, 48, 69–77. [Google Scholar] [CrossRef]
  19. Li, F.; Zhu, R.B.; Bao, T.; Wang, Q.; Xu, H. Sunlight stimulates methane uptake and nitrous oxide emission from the High Arctic tundra. Sci. Total Environ. 2016, 572, 1150–1160. [Google Scholar] [CrossRef]
  20. Bao, T.; Zhu, R.B.; Wang, P.; Ye, W.J.; Ma, D.W.; Xu, H. Potential effects of ultraviolet radiation reduction on tundra nitrous oxide and methane fluxes in maritime Antarctica. Sci. Rep. 2018, 8, 3716. [Google Scholar] [CrossRef]
  21. Bao, T.; Zhu, R.B.; Ye, W.J.; Xu, H. Effects of sunlight on tundra nitrous oxide and methane fluxes in maritime antarctica. Adv. Polar Sci. 2020, 31, 178–191. [Google Scholar] [CrossRef]
  22. Bian, L.G.; Gao, Z.Q.; Sun, Y.L.; Ding, M.H.; Tang, J.; Schnell, R.C. CH4 Monitoring and Background Concentration at Zhongshan Station, Antarctica. Atmos. Clim. Sci. 2016, 6, 135–144. [Google Scholar] [CrossRef]
  23. Ye, W.J.; Bian, L.G.; Wang, C.; Zhu, R.; Zheng, X.; Ding, M. Monitoring atmospheric nitrous oxide background concentrations at Zhongshan Station, east Antarctica. J. Environ. Sci. 2016, 47, 193–200. [Google Scholar] [CrossRef] [PubMed]
  24. Pan, J.J.; Fang, S.X.; Wang, H.Y. Research on the working standards calibration method for measuring atmospheric nitrous oxide concentration. Acta Sci. Circumstantiae 2018, 38, 1768–1773. [Google Scholar] [CrossRef]
  25. Fang, S.X.; Zhou, L.X.; Zhang, F. Dual channel GC system for measuring background atmospheric CH4, CO, N2O and SF6. Acta Sci. Circumstantiae 2010, 30, 52–59. [Google Scholar] [CrossRef]
  26. Lan, X.; Mund, J.W.; Crotwell, A.M.; Thoning, K.W.; Moglia, E.; Madronich, M.; Baugh, K.; Petron, G.; Crotwell, M.J.; Neff, D.; et al. Atmospheric Nitrous Oxide Dry Air Mole Fractions from the NOAA GML Carbon Cycle Cooperative Global Air Sampling Network, 1997–2024, Version: 2025-04-26, 2025.
  27. Luís, A.; Laura, I.V.; Holz Celina, F.; Paulo, R.; Diogo, M.; Duncan, P.F.; Adélio, M. A comprehensive review of NOx and N2O mitigation from industrial streams. Renew. Sustain. Energy Rev. 2022, 155, 111916. [Google Scholar] [CrossRef]
  28. Nevison, C.D.; Dlugokencky, E.; Dutton, G.; Elkins, J.W.; Fraser, P.; Hall, B.; Krummel, P.B.; Langenfelds, R.L.; O’Doherty, S.; Prinn, R.G.; et al. Exploring causes of interannual variability in the seasonal cycles of tropospheric nitrous oxide. J. Atmos. Chem. Phys. 2011, 11, 3713–3730. [Google Scholar] [CrossRef]
  29. Thompson, R.L.; Chevallier, F.; Crotwell, A.M.; Dutton, G.; Langenfelds, R.L.; Prinn, R.G.; Weiss, R.F.; Tohjima, Y.; Nakazawa, T.; Krummel, P.B.; et al. Nitrous oxide emissions 1999 to 2009 from a global atmospheric inversion. Atoms. Chem. Phys. 2014, 14, 1801–1817. [Google Scholar] [CrossRef]
  30. Mckenzie, J.D.; Cassano, J.J.; Jozef, G.C.; Seefeldt, M. Variations in boundary layer stability across Antarctica: A comparison between coastal and interior sites. Weather. Clim. Dynam. 2023, 4, 1045–1069. [Google Scholar] [CrossRef]
  31. Ishijima, K.; Patra, P.K.; Takigawa, M.; Machida, T.; Matsueda, H.; Sawa, Y.; Steele, L.P.; Krummel, P.B.; Langenfelds, R.L.; Aoki, S.; et al. Stratospheric influence on the seasonal cycle of nitrous oxide in the troposphere as deduced from aircraft observations and model simulations. J. Geophys. Res. Atmos. 2010, 115, D20308. [Google Scholar] [CrossRef]
  32. Stohl, A.; Sodemann, H. Characteristics of atmospheric transport into the Antarctic troposphere. J. Geophys. Res. 2010, 115, D02305. [Google Scholar] [CrossRef]
  33. Gonzalez, Y.; Commane, R.; Manninen, E.; Daube, B.C.; Schiferl, L.D.; McManus, J.B.; McKain, K.; Hintsa, E.J.; Elkins, J.W.; Montzka, S.A.; et al. Impact of stratospheric air and surface emissions on tropospheric nitrous oxide during Atom. Atmos. Chem. Phys. 2021, 21, 11113–11132. [Google Scholar] [CrossRef]
Figure 1. Natural landscape of the atmospheric composition observatory at Zhongshan Station, Antarctica (in the top right is the plan of Zhongshan Station).
Jmse 13 01040 g001
Figure 2. Internal structure of sampler.
Jmse 13 01040 g002
Figure 3. Annual mean value variation in atmospheric N2O concentration at Zhongshan Station during 2008–2021.
Jmse 13 01040 g003
Figure 4. Overall seasonal variation in atmospheric N2O concentration at Zhongshan Station from 2008 to 2021.
Jmse 13 01040 g004
Figure 5. (a) Monthly variation and (b) Monthly increment rate in atmospheric N2O concentration at Zhongshan Station from 2008 to 2021.
Jmse 13 01040 g005
Figure 6. Monthly variation in atmospheric N2O concentration at Zhongshan Station in different years.
Jmse 13 01040 g006
Figure 7. (a,b) Backward trajectory of the air mass and the corresponding N2O concentrations of each cluster in the summer of 2021 and when the trajectory altitude was 1000 m; (c,d) backward trajectory of the air mass and the corresponding N2O concentrations of each cluster in the winter of 2021 and when the trajectory altitude was 1000 m.
Jmse 13 01040 g007
Figure 8. Annual mean value of atmospheric N2O recorded at various global sites and the correlation analysis graph of these values.
Jmse 13 01040 g008
Table 1. Annual growth rate of N2O concentration at Antarctic stations.
ZOSCYAMAASPOSPO (Insite)PSAARHSYO
Average annual growth rate/ppb0.990.950.950.981.000.990.960.97
Disclaimer/Publisher’s Note: The statements, opinions and data contained in all publications are solely those of the individual author(s) and contributor(s) and not of MDPI and/or the editor(s). MDPI and/or the editor(s) disclaim responsibility for any injury to people or property resulting from any ideas, methods, instructions or products referred to in the content.

