Article

The Numerical Analysis of Hydrodynamic Response and Structural Stability of an Eccentric Conical Floating Structure

1
College of Naval Architecture and Ocean Engineering, Dalian Maritime University, Dalian 116026, China
2
Liaoning Provincial Key Laboratory of Rescue and Salvage Engineering, Dalian Maritime University, Dalian 116026, China
3
International Joint Research Centre for Subsea Engineering Technology and Equipment, Dalian Maritime University, Dalian 116026, China
*
Author to whom correspondence should be addressed.
J. Mar. Sci. Eng. 2025, 13(6), 1032; https://doi.org/10.3390/jmse13061032 (registering DOI)
Submission received: 9 May 2025 / Revised: 21 May 2025 / Accepted: 22 May 2025 / Published: 24 May 2025
(This article belongs to the Special Issue Numerical Analysis and Modeling of Floating Structures)

Abstract

:
This study examines the hydrodynamic response and structural stability of an eccentric conical floating structure, a return capsule for manned space missions, to ensure safe water landings. Using numerical simulations and experiments, we evaluated how center-of-mass offsets, displacement volume control, and environmental factors, including waves, currents, and wind, affect capsule stability. In still water, lateral center-of-mass offsets strongly affect stability through nonlinear restoring moments, whereas foam-based displacement control reduces motion amplitude and tilt angle. In dynamic sea conditions, wave parameters dominate motion, with surge displacement and pitch angle varying by wavelength and sea state. At higher sea states, nonlinear phenomena, including subharmonic resonance, amplify pitch angle extrema, compromising safety margins. This research offers key insights for evaluating and improving return capsule safety, highlighting the importance of complex multi-physics interactions in marine environments.

1. Introduction

For manned lunar missions, the return capsule requires both land and sea landing sites to maximize the astronauts’ return window to Earth. During ascent, the return capsule must autonomously manage escape within seconds, unable to distinguish between land or sea landing, necessitating an emergency water landing mode adaptable to both scenarios [1,2,3]. In adverse sea conditions, limited helicopter speed and range delay rescue, requiring astronauts to remain in the capsule for extended periods, necessitating the consideration of its attitude and stability during sea landing to ensure astronaut safety [4].
Research on return capsule water landings began in 1958 with the U.S. Mercury program, initiating safe sea recovery studies [5,6]. In the 1960s, NASA extensively studied the Apollo capsule; Vaughan [7] analyzed rigid body impact acceleration during landing and water entry using two 1/6-scale dynamically similar models. Herting et al. [8] developed the capsule’s landing impact system, prioritizing water surface landings. Stubbs [9] investigated impact loads and post-impact floating conditions of the capsule at various attitudes using a scaled model. In 1966, Benson [10] reviewed water landing studies for the Apollo and Mercury capsules, concluding that scaled model tests, by comparing acceleration and pressure in rigid and elastic models, yielded results comparable to full-scale tests, reducing costs and enhancing efficiency. Building on Benson’s work, Baker and Westine [11] in 1967 analyzed the Apollo capsule’s structural response to water impact, employing complex models for dynamic simulations that included various failure states. In the same year, Thompson [12] extended prior Gemini capsule research, modeling its response to waves at varying yaw angles and horizontal speeds. Building on this, Wang [13] simulated the capsule’s water landing using explicit nonlinear dynamic finite element code, incorporating water and air meshes.
By the 1990s, advances in finite element analysis enabled integrated fluid–structure modeling. Anghilleri and Spizzica [14] employed MSC DYTRAN for finite element analysis, focusing on boundary conditions, material properties, and fluid–solid coupling algorithms; their ALE coupling enhanced accuracy and reduced computation time. Although these methods offer rapid calculations, they often neglect fluid viscosity. Consequently, researchers increasingly adopted computational fluid dynamics (CFD) models, which provide high accuracy and comprehensive results. Advances in CFD and computing have broadened its application in structural fluid dynamics; in 2019, Song [15] used CFD wall functions to model barnacle fouling surface roughness, predicting its impact on ship hydrodynamic characteristics. In December 2019, Jasak [16] compared sea trial data from two self-propelled ships with full-scale CFD results, demonstrating that numerical methods can accurately calculate ship-scale flow characteristics, including free surface effects, nonlinearity, turbulence, and propeller–hull–flow interactions. In 2020, Wang [17] simulated KVLCC1 ship stopping maneuvers using the CFD solver naoe-FOAM-SJTU with dynamic overlapping grids, experimentally validating results to identify optimal stopping methods under various conditions. In 2022, Jiao [18] employed a CFD-based unsteady Navier–Stokes and volume-of-fluid solver to estimate ship motion responses in bidirectional transverse waves. Islam [19] compared hull resistance and propulsion power predictions using empirical formulas and CFD schemes, finding strong agreement between the two. Kim [20] applied CFD methods to enhance the understanding of ship maneuverability in irregular waves, aiding captains and pilots in making informed decisions under adverse sea conditions. Andersson et al. [21] used CFD to predict power reductions from pre-delivery PSD installation on ships, establishing reliability indicators and clarifying the impact of computational processes on results. Huang [22] introduced a novel fluid–solid coupling method, bidirectionally integrating CFD and FEA solvers to estimate ship wave loads and hydroelastic responses, offering new approaches for fluid–solid coupling calculations. By late 2024, researchers had moved beyond investigating the hydrodynamics of a single body in isolation. Mi C. [23] employed a VOF–overset–grid technique to simulate two identical barges moored side-by-side and traced the wave–load spectrum from the initial transient stage to steady state. This work provided the first systematic quantification of higher-order harmonic forces generated during transient gap resonance under nonlinear focused-wave groups, offering direct design guidance for extreme-wave scenarios. Building on that advance, Gong S. K. [24] used a two-dimensional viscous CFD wave tank in OpenFOAM to examine a pair of dissimilar boxes. By comparing the fully fixed configuration with one that allowed all six degrees of freedom, Gong demonstrated that steady-state gap resonance is strongly modulated by the coupled motion of non-identical bodies—an aspect neglected in earlier studies. The results supply a more realistic baseline for extreme-load assessments in future side-by-side or mooring arrangements. With the dual-body groundwork established, Song Z. W. [25] reported, in January 2025, the first high-fidelity CFD investigation of three barges in close proximity, where two gaps interact simultaneously. The study revealed the intricate influence of multi-gap coupling on the force spectrum and harmonic generation, providing valuable insight for floating LNG transfer operations and other multi-vessel configurations.
Although research on conical return capsules is limited, advancements in computational fluid dynamics for ship hydrodynamics and offshore structures provide robust methodologies for modeling the complex fluid–structure interactions and wave-induced responses of the Apollo capsule, which have been adapted in this study. This study examines the Apollo capsule, integrating experiments and numerical simulations to analyze its water entry and floating dynamics, focusing on hydrodynamic characteristics in still water and diverse sea conditions. By developing a CFD-based fluid dynamics model, this study constructs a predictive framework for the conical capsule’s hydrodynamic characteristics and supports the optimization of its fluid dynamic shape and sea state adaptability for future designs.

2. Theory

2.1. Theoretical Background

Numerical simulations of the conical structure require modeling the flow field to analyze its motion response. Fluid flow adheres to three fundamental conservation laws—mass, momentum, and energy—mathematically expressed through governing equations.

2.1.1. Control Theory

The Reynolds-Averaged Navier–Stokes (RANS) equations [26], closely resembling the original Navier–Stokes equations, are employed to model the flow around the conical structure. Turbulence models supply closure relations for the RANS equations, governing the transport of mean flow momentum. The mean mass and momentum conservation equations are expressed as follows:
ρ t + 𝛻 · ρ v ˉ = 0
t ρ v ˉ + 𝛻 · ρ v ˉ v ˉ = 𝛻 · p ˉ I + 𝛻 · T + T t + f b
where ρ denotes density, v ˉ and p ˉ represent mean velocity and pressure, respectively, I is the identity tensor, T is the viscous stress tensor, T t is the Reynolds stress tensor, and f b is the resultant body force.
The Reynolds-Averaged Navier–Stokes (RANS) equations are discretized via the finite volume method (FVM) with the k-ε turbulence model. The Semi-Implicit Method for Pressure-Linked Equations (SIMPLE) is employed to couple pressure and velocity. The segregated flow model solves the equations independently, discretizing convection terms with a second-order upwind scheme. The volume of fluid (VOF) method accurately models the free surface evolution in two-phase flow. The dynamic fluid–body interaction (DFBI) module and overlapping grid technology account for the conical structure’s motion.

2.1.2. Wave Theory

The volume of fluid (VOF) wave model simulates surface gravity waves at the interface of light and heavy fluids [27]. Typically, it is coupled with the six-degree-of-freedom (6DOF) model for ocean engineering applications. The model characterizes fluid velocity, pressure, and wave height using steadily propagating periodic wave trains. These wave trains are defined and solved based on three fundamental quantities: water depth, wavelength, and wave height. The first-order VOF wave velocity is determined as follows:
The wave surface elevation Is given by the following:
η = A cos k x ω t
The horizontal velocity is as follows:
u = A ω cos k x ω t e k z
The vertical velocity is as follows:
w = A ω sin k x ω t e k z
where A denotes the wave amplitude, ω the wave frequency, k the wave number, and z the vertical distance from the mean water level.
The wave period for the i -th sub-wave is as follows:
  T = 2 π ω
Compared to paddle wave making, the VOF wave superposition module generates waves more efficiently and conveniently, with the expression referenced as follows:
η = i A i cos k i x ω i t
where A i denotes the amplitude, ω i the frequency, and k i the wave number of the i -th sub-wave in the superimposed wave.

3. Numerical Model Development and Validation

3.1. Environmental Conditions

This study’s environmental conditions are derived from hydrological data in the northern South China Sea, with reference locations marked by red solid circles in Figure 1. The wave parameters in Table 1 represent fifth-order Stokes waves, generated using the high-order volume of fluid (VOF) method, to provide a consistent and controlled wave environment for analyzing the capsule’s hydrodynamic characteristics. Wave data from 2012–2013 in this region were thoroughly analyzed, including maximum wave height, mean period, and other parameters. The South China Sea, situated off China’s southern coast, is China’s largest marginal sea and the world’s second-largest sea, making its vast expanse a natural landing site for return capsules.

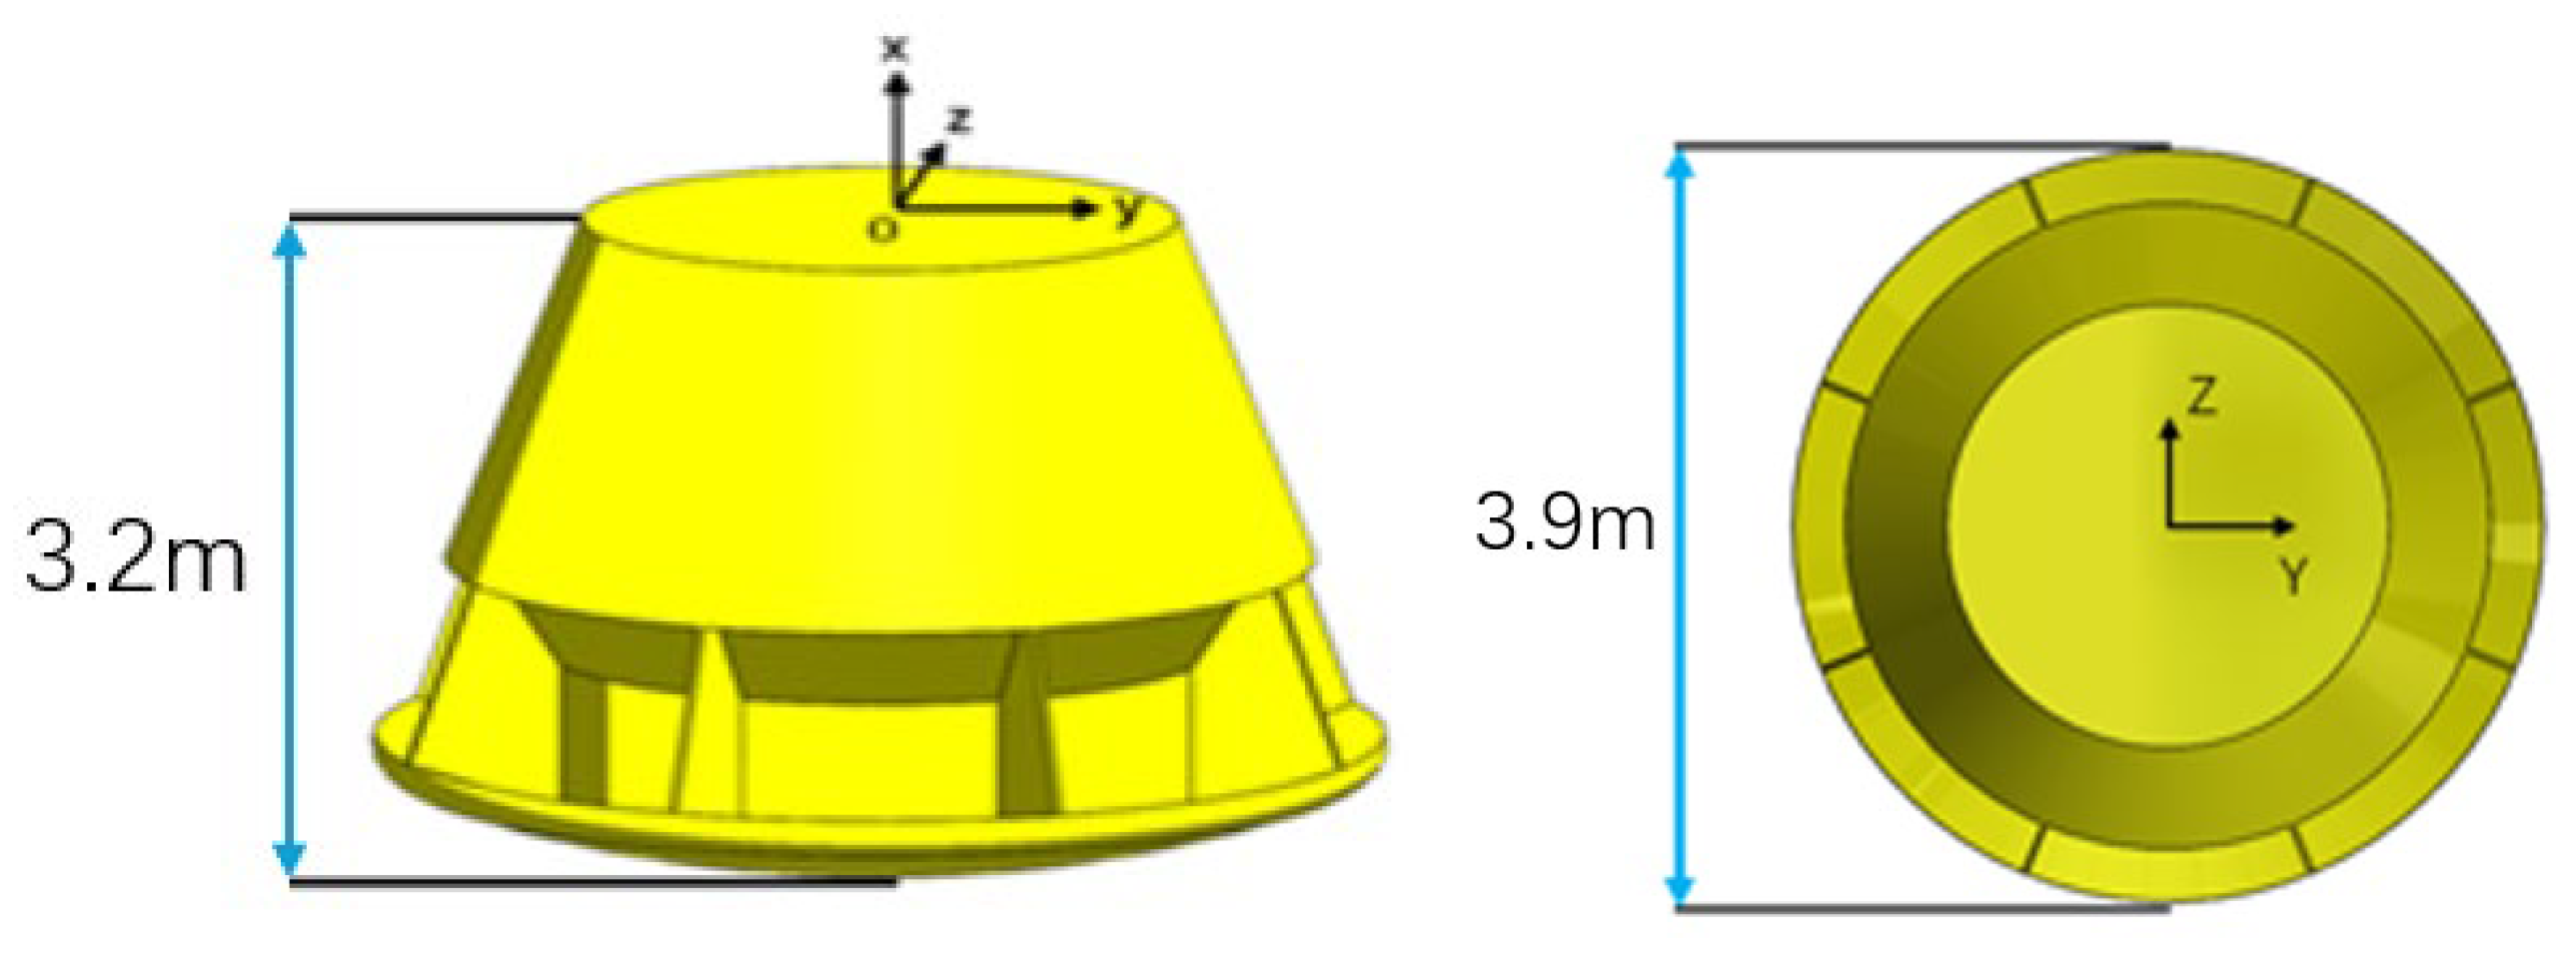
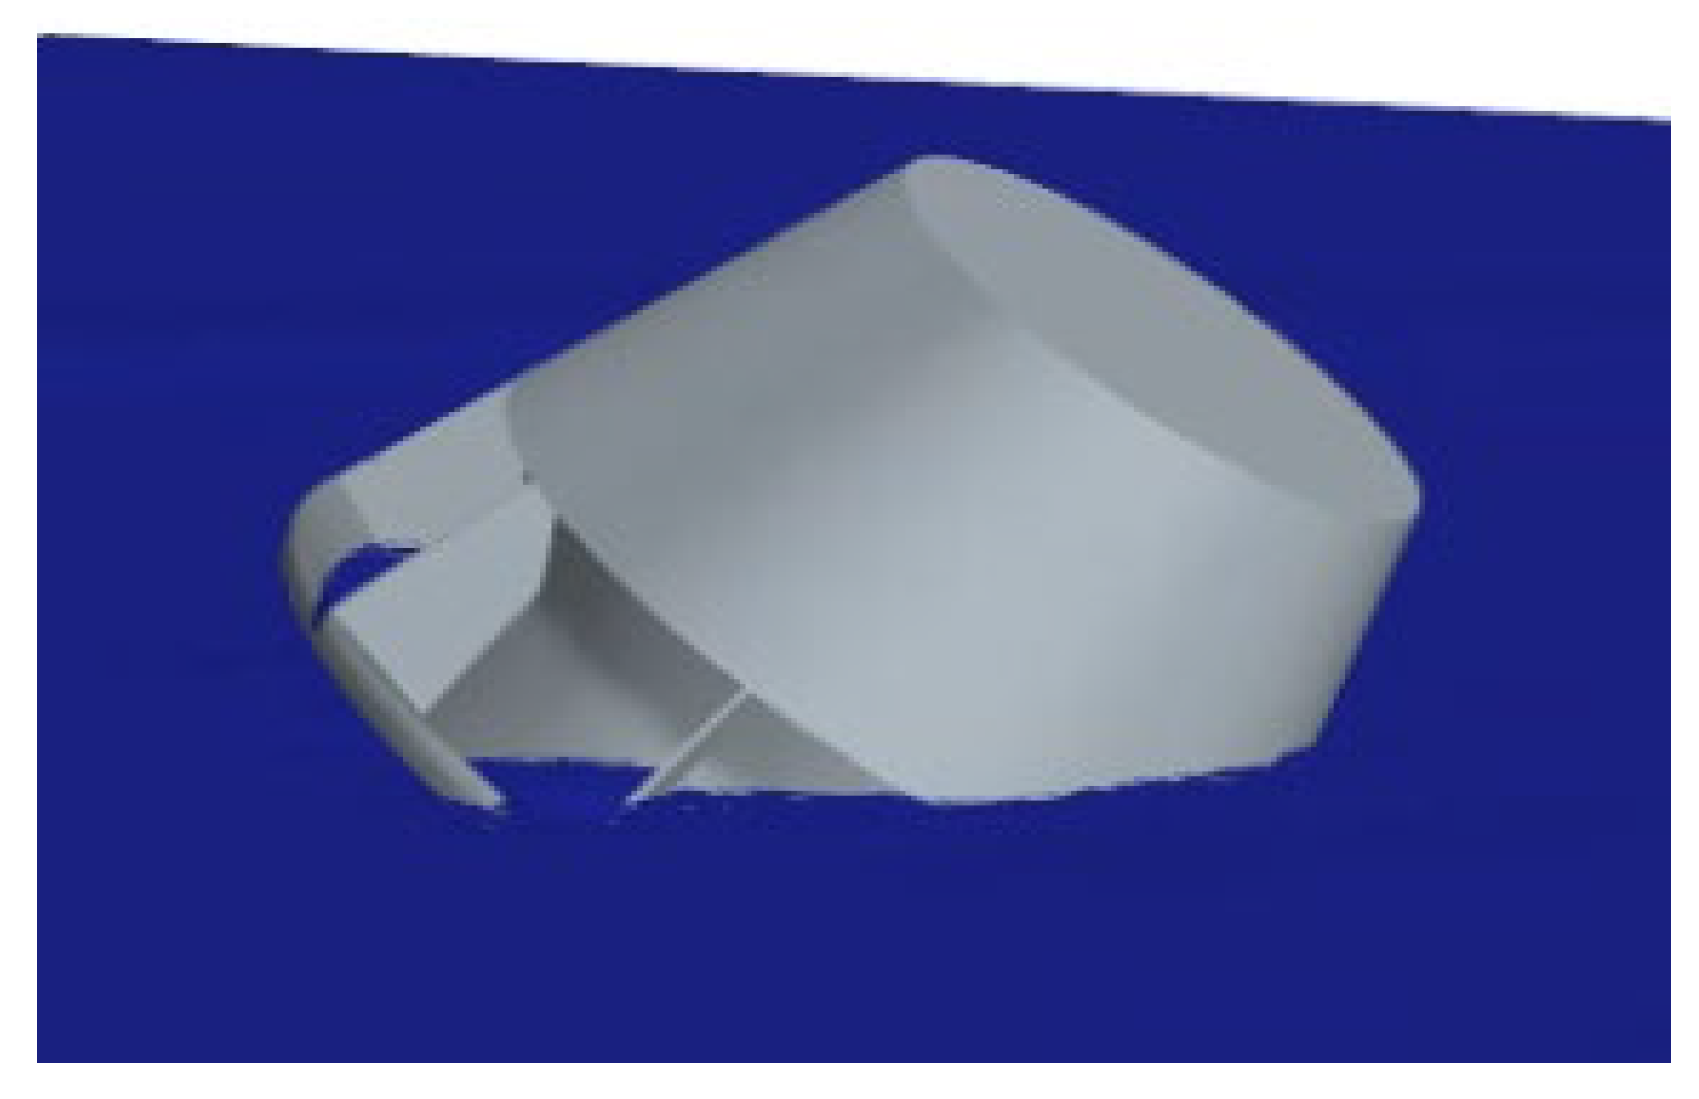
3.2. Eccentric Conical Structure Model

This study employs the Apollo return capsule model [28], depicted in Figure 2. The floating body, shaped as a conical structure, is hollow with an integrated center-of-mass adjustment mechanism and a skirt containing eight interconnected compartments for gas cylinders, batteries, and other components. The eccentric conical structure, constructed from aluminum alloy (density 2800 kg/m3), has a cabin thickness of 10 mm. The model’s mass parameters are computed using a mass properties plug-in, as presented in Table 2. The center-of-mass coordinates are provided in both the geodetic coordinate system and the structural coordinate system of the eccentric conical structure, with the origin at the center of the platform’s top circle, as shown in Figure 1. The x-axis is perpendicular to the model’s top plane and directed upward, the y-axis lies parallel to the platform’s top plane and points to the cabin’s right, and the z-axis lies parallel to the platform’s top plane and points to the object’s front. These definitions enable calculation of the platform’s detailed parameters, including mass, center of mass, and inertia tensor relative to the center of mass.

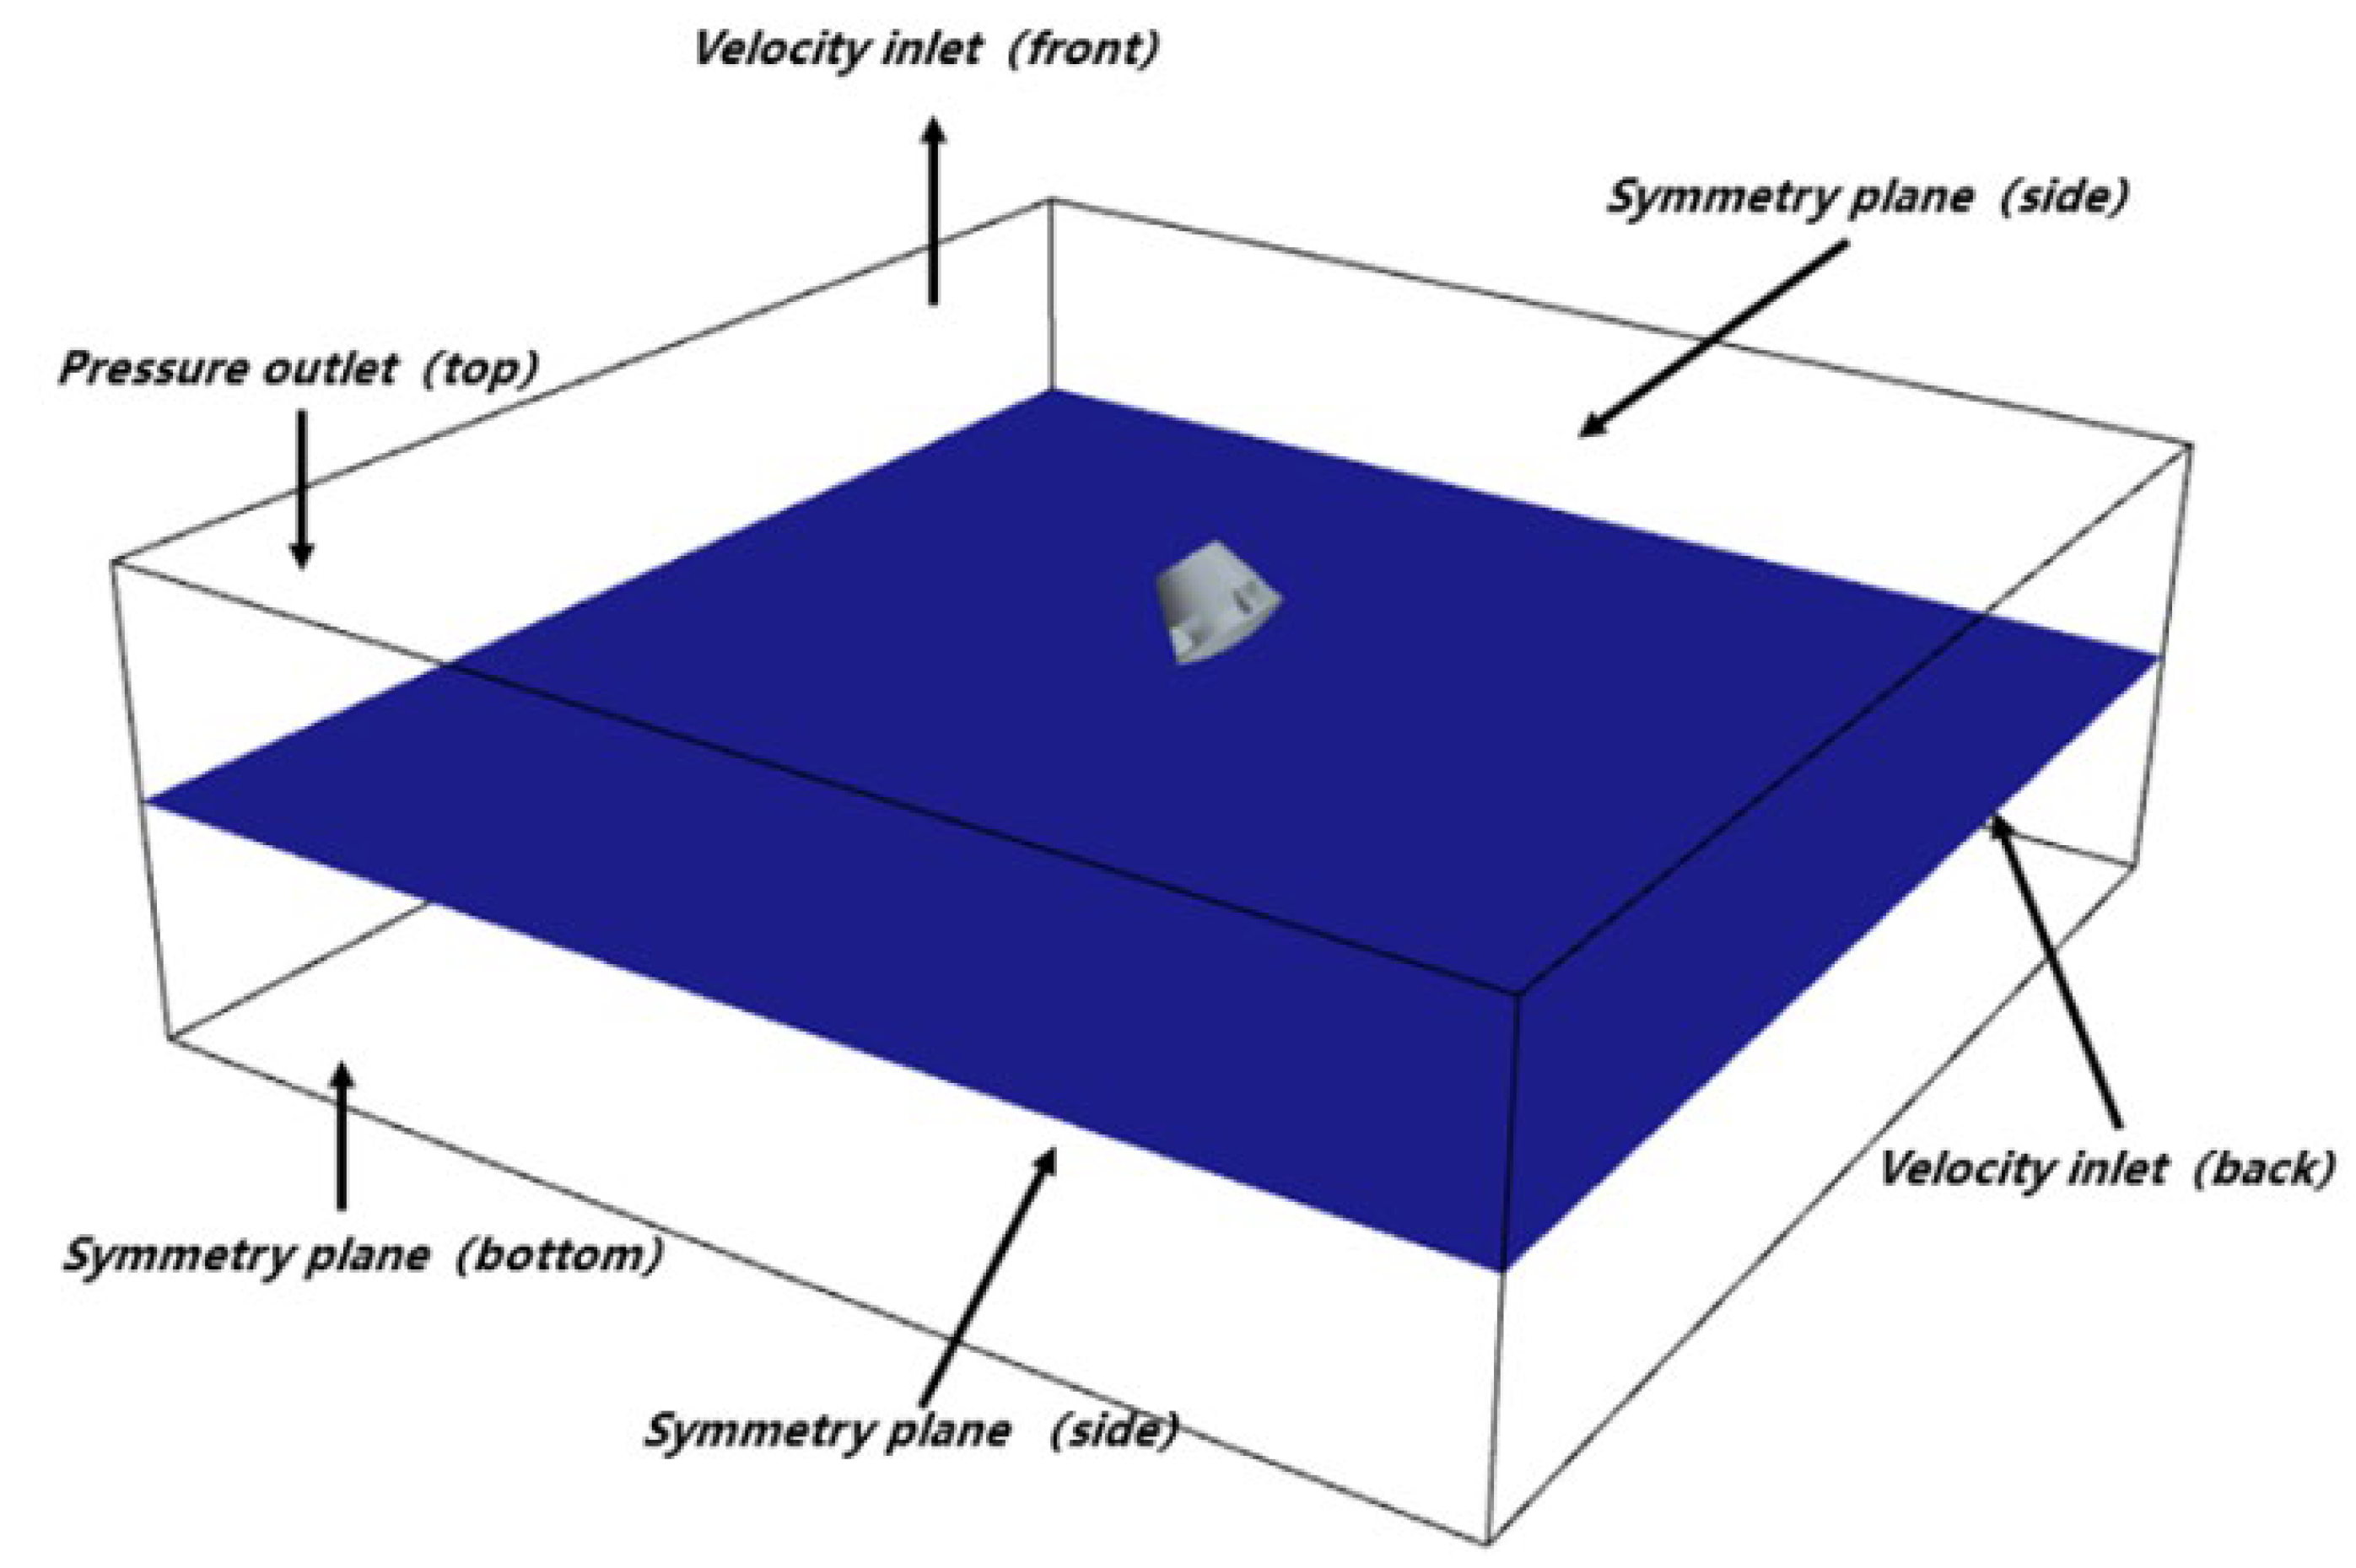
3.3. Simulation Setup

In this study’s numerical simulation, a 1:1 scale model is used, with a computational domain of 50 m × 50 m, a water depth of 10 m, and an air height of 5 m above the water surface. Boundary conditions follow standard numerical simulation methods [29]: velocity inlets at the front and back boundaries, a pressure outlet at the top, symmetry planes at the sides and bottom, and a wall boundary at the conical structure’s surface, as depicted in Figure 3.
This study employs structured overlapping grids, refining the mesh near the conical structure to optimize computational resources and enhance simulation accuracy. The mesh size varies across the computational domain: larger far from the platform and smaller near it, with overlapping grids in the central region simulating platform motion, as depicted in Figure 4. Prior to overlapping, the mesh is divided into background and overlapping grids. The computational domain typically comprises one background grid and one or more smaller overlapping grid regions. Overlapping grids categorize cells as active or inactive. Active cells solve the discretized governing equations. Inactive cells do not solve equations, but movement of the overlapping grid region may activate some inactive cells. The relative motion between sub-regions requires only the definition of motion laws, without grid deformation or regeneration. This method excels in handling complex geometries and dynamic object motion. Overlapping grids, due to their ease of generation, are widely used for managing complex mesh layouts.
Grid independence analysis verifies that the selected mesh division and time steps meet hydrodynamic accuracy requirements for wave–structure interactions. Table 3 presents the grid independence study for coarse, medium, and fine mesh types under Sea State 3 conditions, detailing maximum roll, pitch, and yaw responses of the conical structure. Comparisons reveal significant differences between coarse and fine meshes, whereas medium and fine meshes exhibit a maximum difference of 4.5% for pitch, with other key parameters varying by less than 5%, satisfying acceptable accuracy thresholds. Compared to fine meshes, medium meshes reduce computation time by approximately 25%, and coarse meshes by 46%. Considering computational efficiency, medium-density meshes were selected for numerical simulations.
From the perspective of grid computing and meshing principles, this grid resolution demonstrates robust generality across the simulated wave conditions (wave heights 1–5 m). The mesh was designed to resolve the spatial and temporal scales of nonlinear wave-structure interactions, governed by consistent wave steepness across all sea states. The grid size and time step adhere to the following:
  Δ x λ N , Δ t T w M
where Δ x and Δ t are the spatial and temporal grid sizes, λ is the wavelength, T w is the wave period, and N and M are constants ensuring adequate resolution. This resolution captures dominant hydrodynamic phenomena, such as boundary layer dynamics and vortex shedding, which scale primarily with wave steepness rather than wave height. The stable convergence of motion responses, including roll, pitch, and yaw, across all sea states, with errors below 5%, confirms the grid’s applicability to higher sea states without requiring additional studies. The volume-of-fluid (VOF) method and k-ε turbulence model ensure numerical stability by resolving free-surface dynamics and turbulent flows, maintaining accuracy across varying wave heights. This generality extends to multiple motion modes, as the grid effectively captures the coupled dynamics of roll, pitch, and yaw induced by eccentric structural configurations, ensuring reliable simulations across the studied conditions.

3.4. Experimental Pool Testing and Validation

3.4.1. Subsubsection Experimental Design

The eccentric conical structure was tested in a 50 m × 30 m × 4 m rectangular pool under still water conditions. As depicted in Figure 5, a bridge crane system lifted the platform to a preset height and released it, with the vertical water entry speed controlled by adjusting the lifting height. The initial vertical speed was calculated using the free fall formula v = 2 g h , where the lifting height h was measured as the vertical distance from the platform’s bottom to the water surface using a ruler.
During the water entry experiment, a three-axis attitude sensor monitored the platform’s pitch, roll, and yaw angles in real time. Time-domain low-pass filtering (cutoff frequency: 20 Hz) was applied to denoise the data, effectively removing high-frequency interference. The experiment verified floating stability under initial conditions: a 37° tilt angle, 8 m/s vertical speed, and zero horizontal speed.

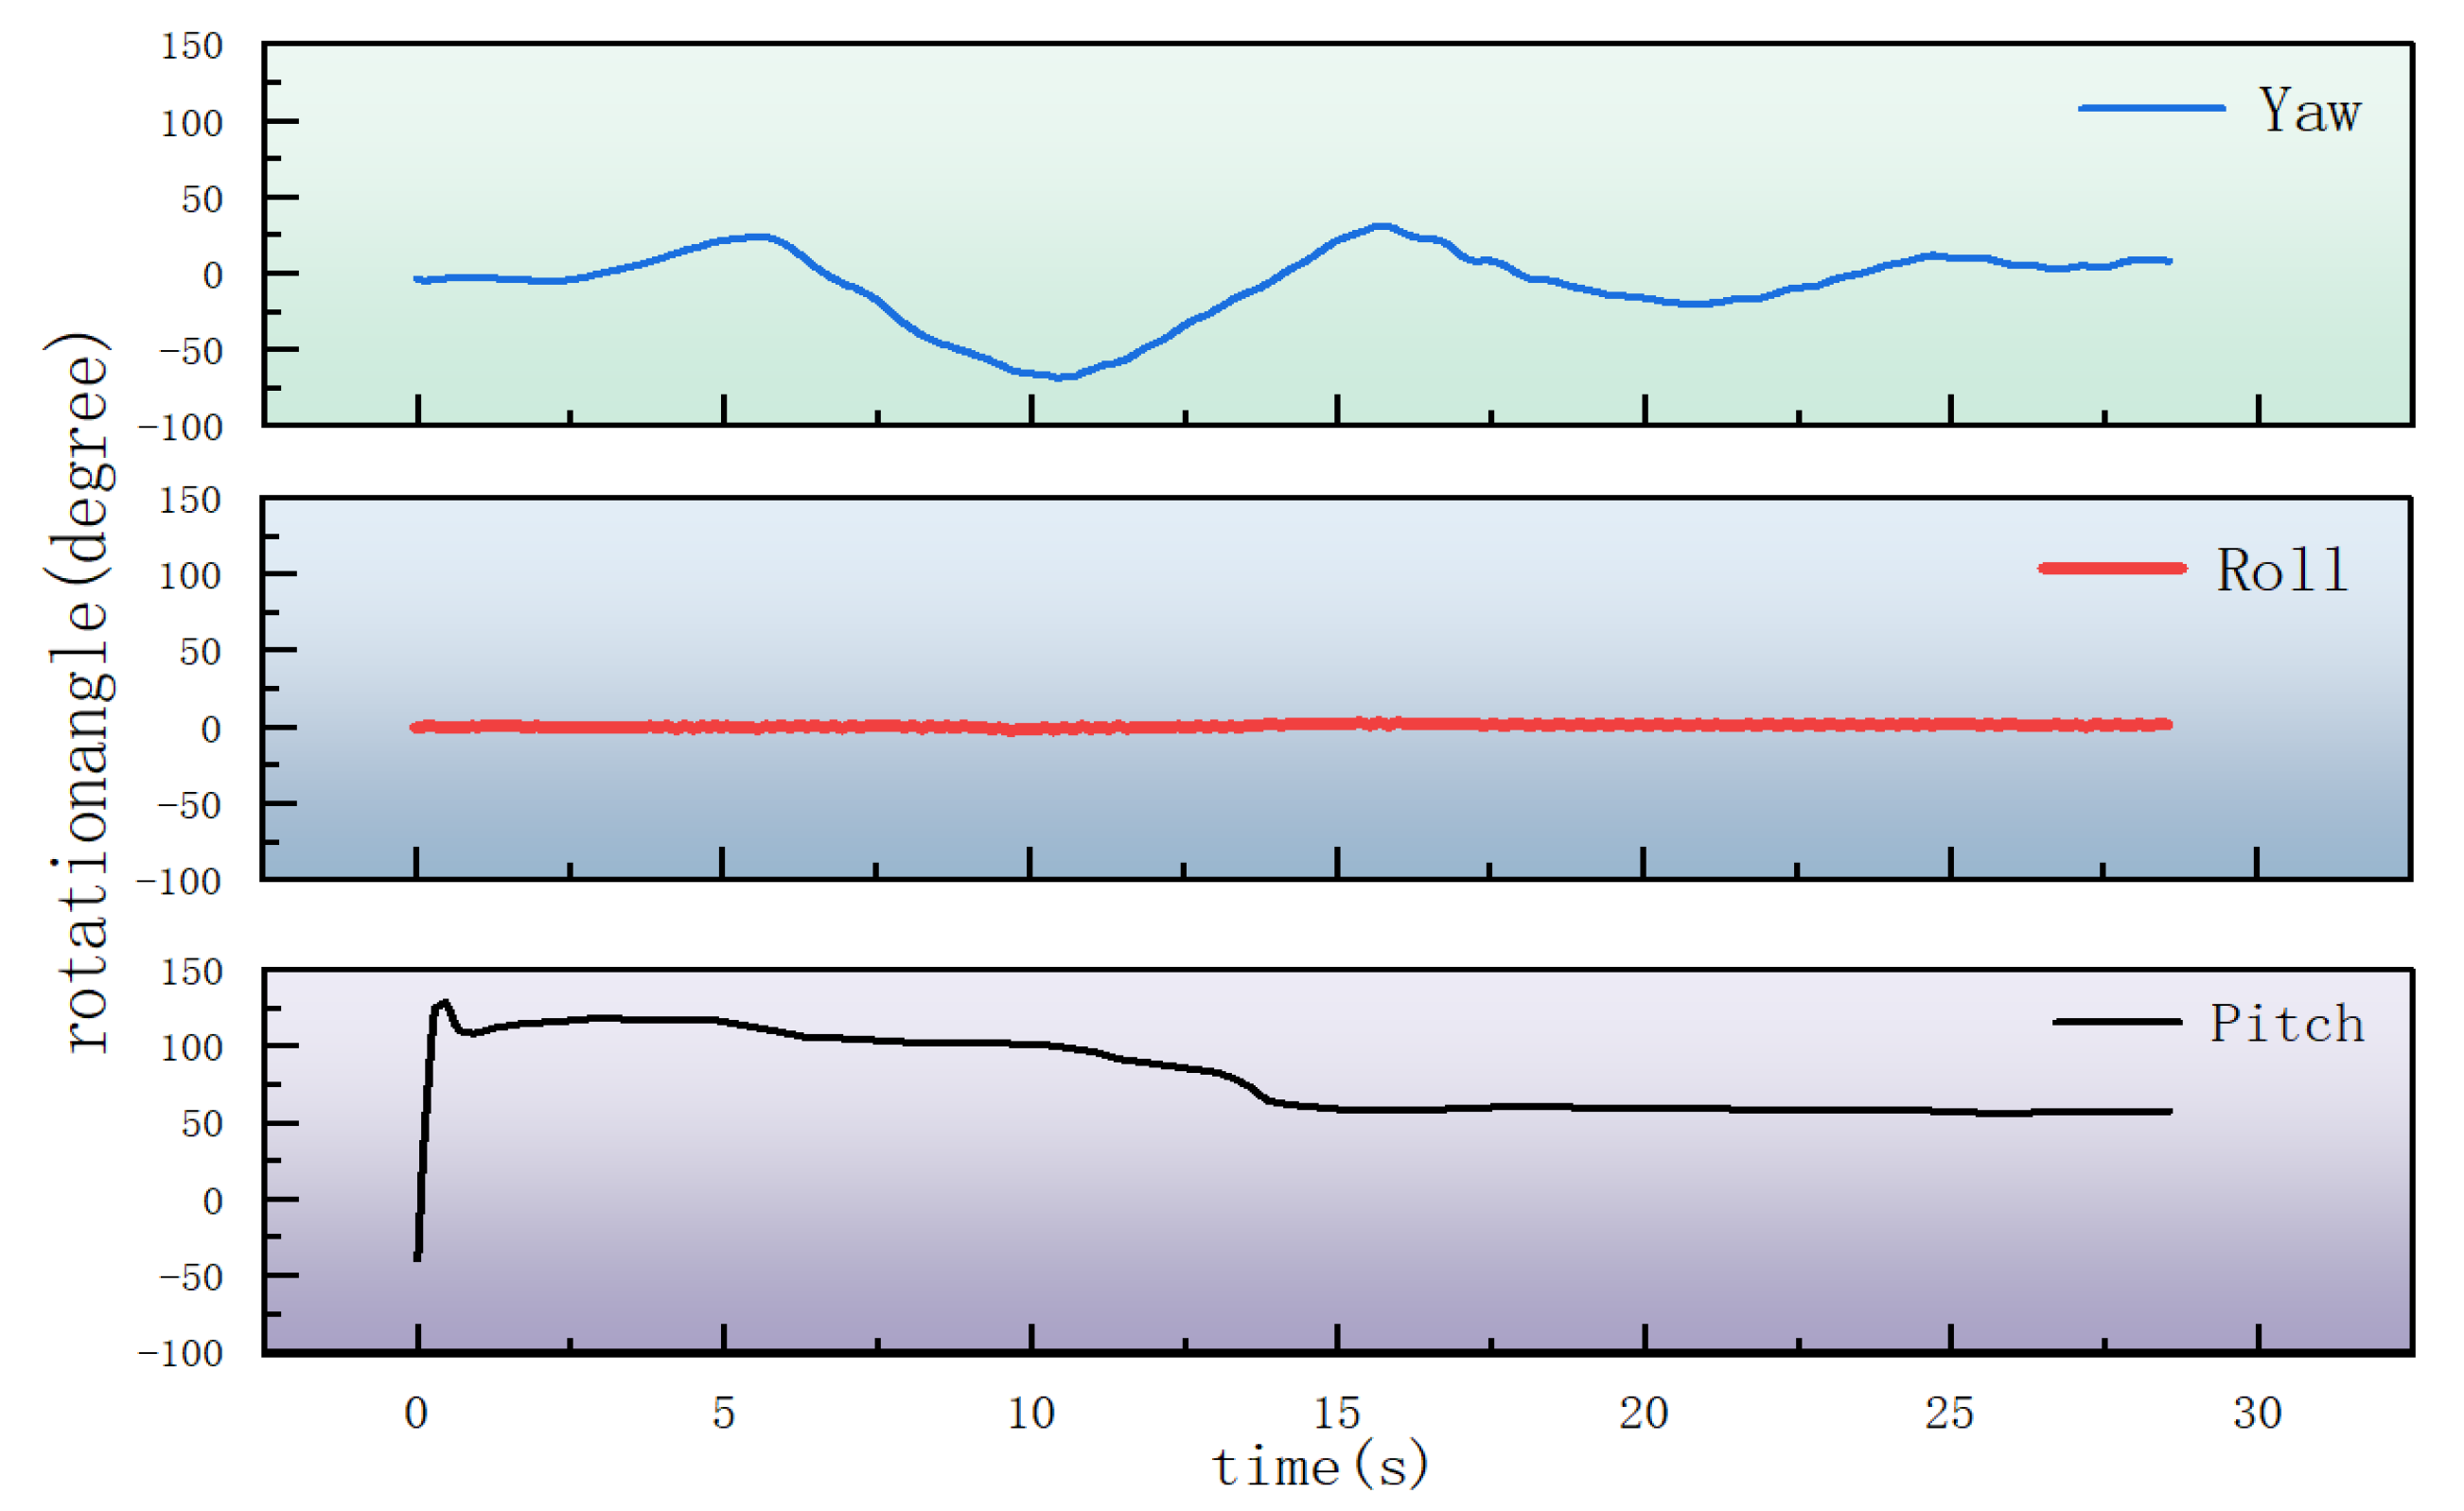
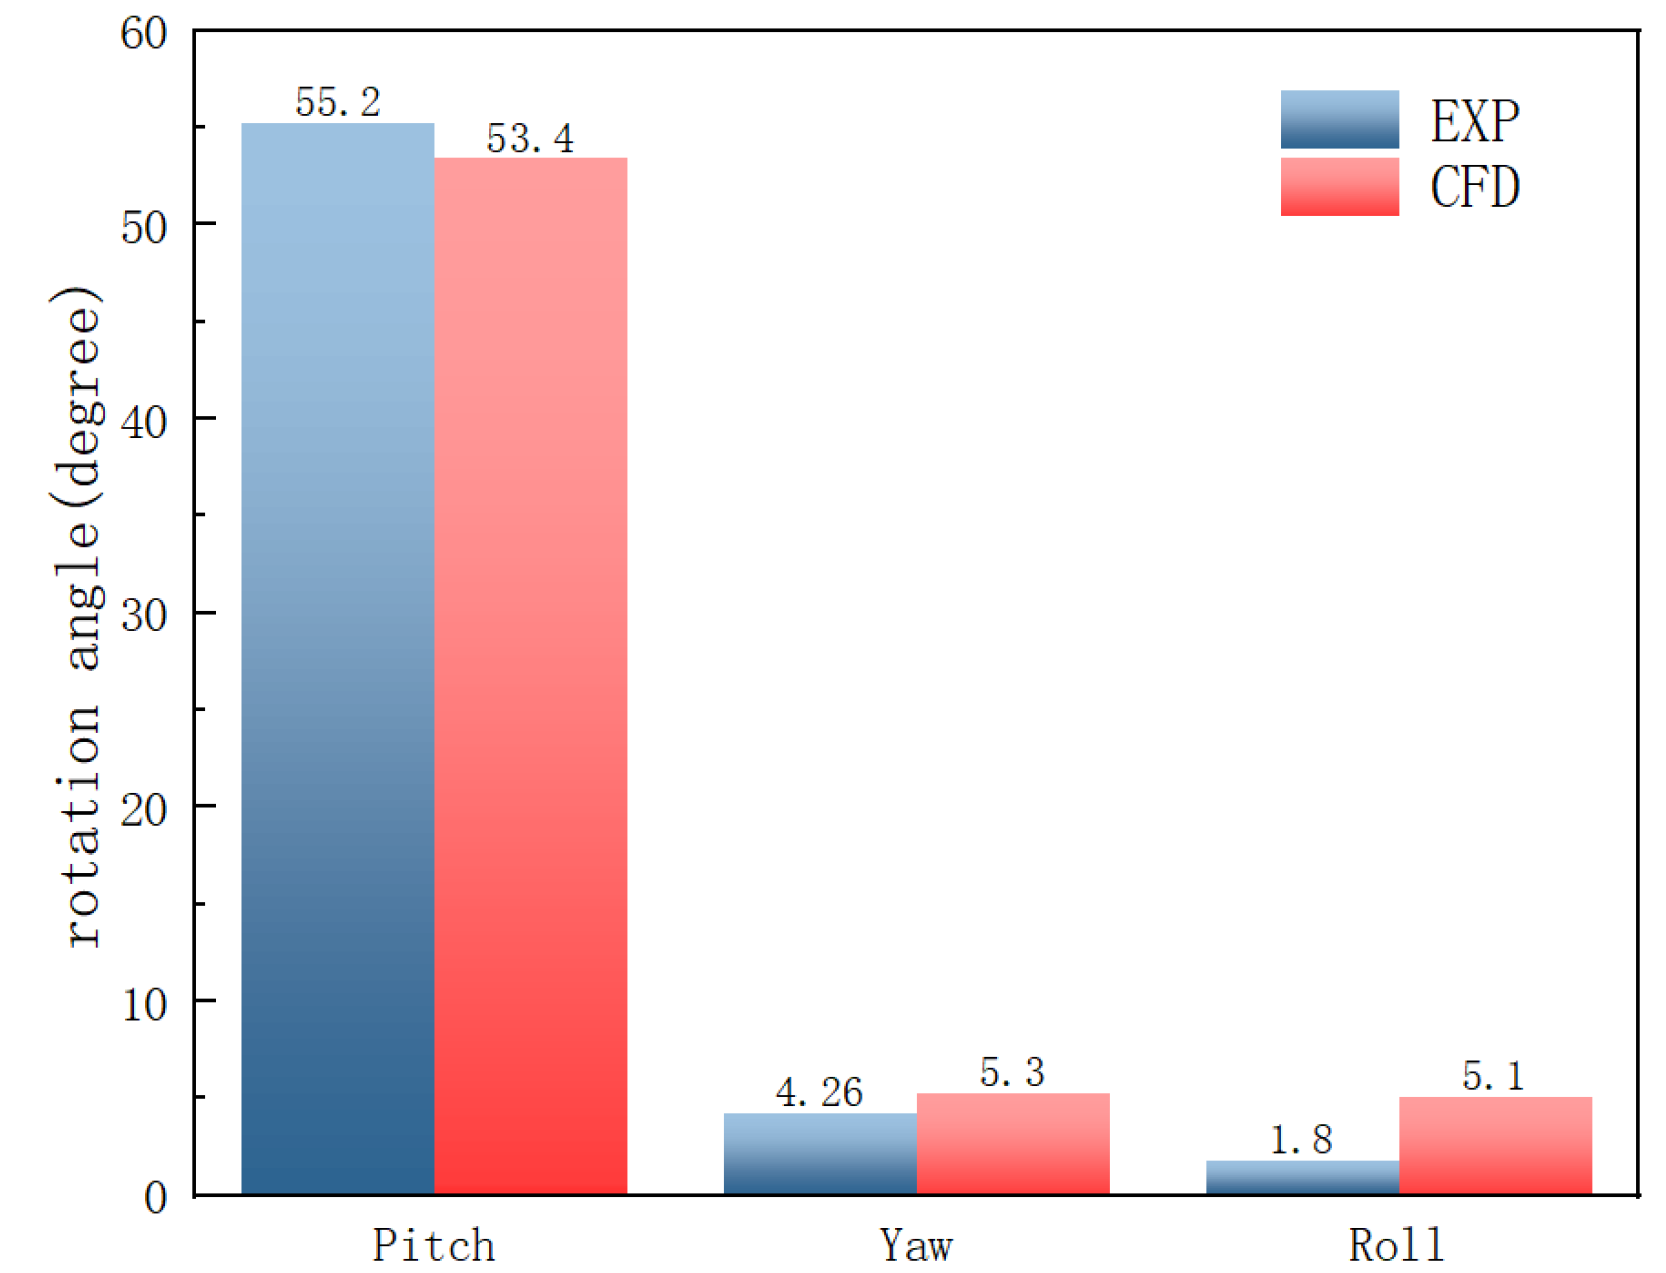
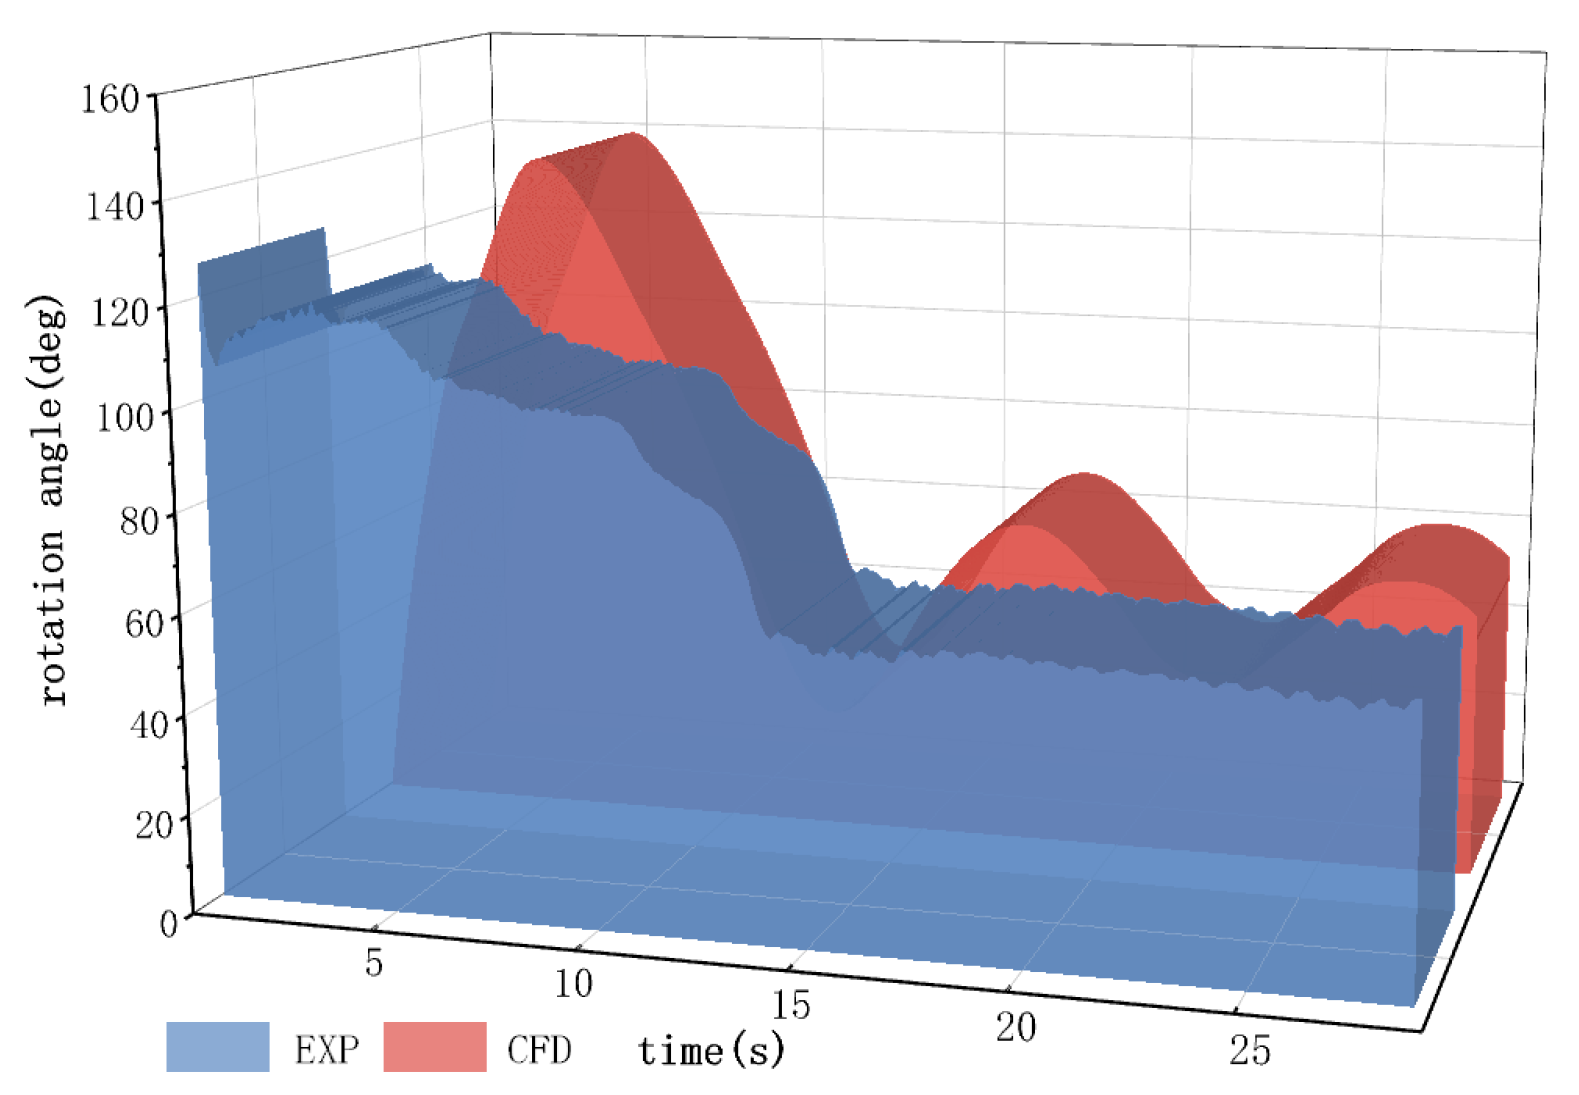
3.4.2. Results and Analysis

This experiment validates the hydrodynamic numerical model’s accuracy for the eccentric conical structure. Figure 6 shows the dynamic response of the platform’s three-degree-of-freedom attitude angles (pitch, roll, yaw) during the experiment. Experimental data indicate that, during early water entry (t < 1.5 s), the platform experiences significant angular displacement around the z-axis ( θ m a x = 129°), stabilizing to an equilibrium state ( θ s = 55.2°) via self-adjustment, with transient roll oscillations around the x-axis (ΔΦ < 5°).
Figure 7 compares steady-state pitch angles, revealing a 3.2% relative deviation between experimental and numerical results, confirming the model’s accuracy in predicting equilibrium states. Figure 8 analyzes the dynamic response, showing the experimental system reaches the maximum tilt angle 4.4 s earlier than the numerical model ( t e x p = 0.5 s vs. t c f d = 4.9 s), with a 23% shorter stabilization time. These differences arise from two numerical model assumptions: (1) a fluid viscosity coefficient set to the theoretical value μ = 1.0 × 10 3 Pa·s, lower than the experimental water’s measured viscosity, and (2) a rigid body model excluding structural elastic damping, leading to an 18% reduction in fluid damping due to viscosity parameter deviations. The 18% reduction in fluid damping, due to viscosity parameter deviations, primarily causes the delayed dynamic response in the numerical solution.
Figure 7 compares steady-state pitch angles, revealing a 3.2% relative deviation between experimental and numerical results, confirming the model’s accuracy in predicting equilibrium states. Figure 8 analyzes the dynamic response, showing the experimental system reaches the maximum tilt angle 4.4 s earlier than the numerical model ( t e x p = 0.5 s vs. t c f d = 4.9 s), with a 23% shorter stabilization time. These differences arise from two numerical model assumptions: (1) a fluid viscosity coefficient set to the theoretical value μ = 1.0 × 10 3 Pa·s, lower than the experimental water’s measured viscosity (approximately μ = 1.22 × 10 3 Pa·s, accounting for temperature and impurities), and (2) a rigid-body model excluding structural elastic damping. The 18% reduction in fluid damping, primarily due to viscosity parameter deviations, causes the delayed dynamic response in the numerical solution. The fluid damping force is modeled as follows:
F d = C d μ v A
where C d is the damping coefficient (determined via CFD calibration), μ is the fluid viscosity, v is the relative velocity, and A is the wetted surface area. The viscosity deviation results in a proportional reduction in damping force:
This closely aligns with the observed 18% damping reduction.
    Δ F d F d Δ μ μ = 1.22 × 10 3 1.0 × 10 3 1.22 × 10 3 16.67 %
Despite transient phase differences, relative errors of key parameters remain below 10% across the operating range, validating the numerical model’s accuracy in (1) predicting steady-state equilibrium angles (error band ± 5°); (2) reproducing nonlinear decay oscillation modes (attenuation index β error < 8%); and (3) characterizing multi-degree-of-freedom motion coupling (covariance matching degree > 91%). These validation results ensure reliability for subsequent numerical studies.

4. Steady-State Analysis

In return capsule design, the alignment of cabin mass characteristics with displacement volume is a critical parameter governing hydrodynamic stability. In practice, uncertainties from assembly tolerances (±1.5% mass moment of inertia) and trim errors (ΔV ≤ 0.3 m3) cause systematic deviations between actual and theoretical mass distributions. This section develops a dynamic characteristic model under multi-parameter coupling to investigate the influence of mass and displacement volume on the platform’s stability domain.

4.1. Impact of Mass Characteristics on Platform Floating Stability

Using the previously developed parameterized numerical model, six design sample spaces with mass deviations (Δ y ∈ [30, 180] mm) and (Δ x ∈ [−1750, −1670] mm) are generated via Latin Hypercube Sampling (LHS) [30]. A six-degree-of-freedom coupled dynamics solver quantifies the effects of each parameter on (1) steady-state equilibrium angle and (2) dynamic response amplitude.
Numerical simulations, accounting for the platform’s asymmetric mass distribution, reveal a significant +y-axis tilt under hydrostatic equilibrium (tilt angle θ = 24.3°, see Figure 9). To meet manned spacecraft attitude tolerance requirements, maintaining a stable upward cabin orientation is critical, with the lateral center-of-mass offset (y-axis coordinate) as the primary control parameter influencing the attitude angle.
Using the viscous fluid–rigid body coupled dynamics model from Section 3.2, this study conducts a parameterized scan of the y-axis center-of-mass offset, varying from 30 mm to 180 mm along the +y-axis (Δ y = +150 mm, step size 25 mm). Transient numerical simulations yield the pitch angle time history, steady-state equilibrium angle, and dynamic response amplitude (see Figure 10). Within the operating range (Δ y = 30–180 mm), the platform maintains a single stable equilibrium without capsizing instability, as shown by the numerical results.
The longitudinal center-of-mass offset (x-axis) also significantly affects the platform’s hydrodynamic stability, alongside the lateral offset (y-axis). This study employs the same six-degree-of-freedom coupled numerical model, shifting the center of mass 80 mm along the positive x-axis (from −1750 mm to −1670 mm). Parameterized numerical simulations yield the pitch angle dynamic response curve, equilibrium attitude angle, and extreme parameters (see Figure 11). Numerical results indicate that, as the x-axis center-of-mass shifts forward linearly, the pitch angle response amplitude in stable equilibrium increases monotonically by 33.5%, with no capsizing instability observed. Comparative analysis reveals that the y-axis mass eccentricity influence coefficient (0.155 deg/mm) on the steady-state equilibrium angle exceeds that of the x-axis (0.095 deg/mm), highlighting the dominant role of lateral center-of-mass distribution in hydrodynamic stability design. Notably, this analysis assumes an ideal fluid medium (Sea State 0). The presence of multi-stable equilibrium points and parametric roll risks in real wave conditions will be evaluated through subsequent restoring moment analysis.

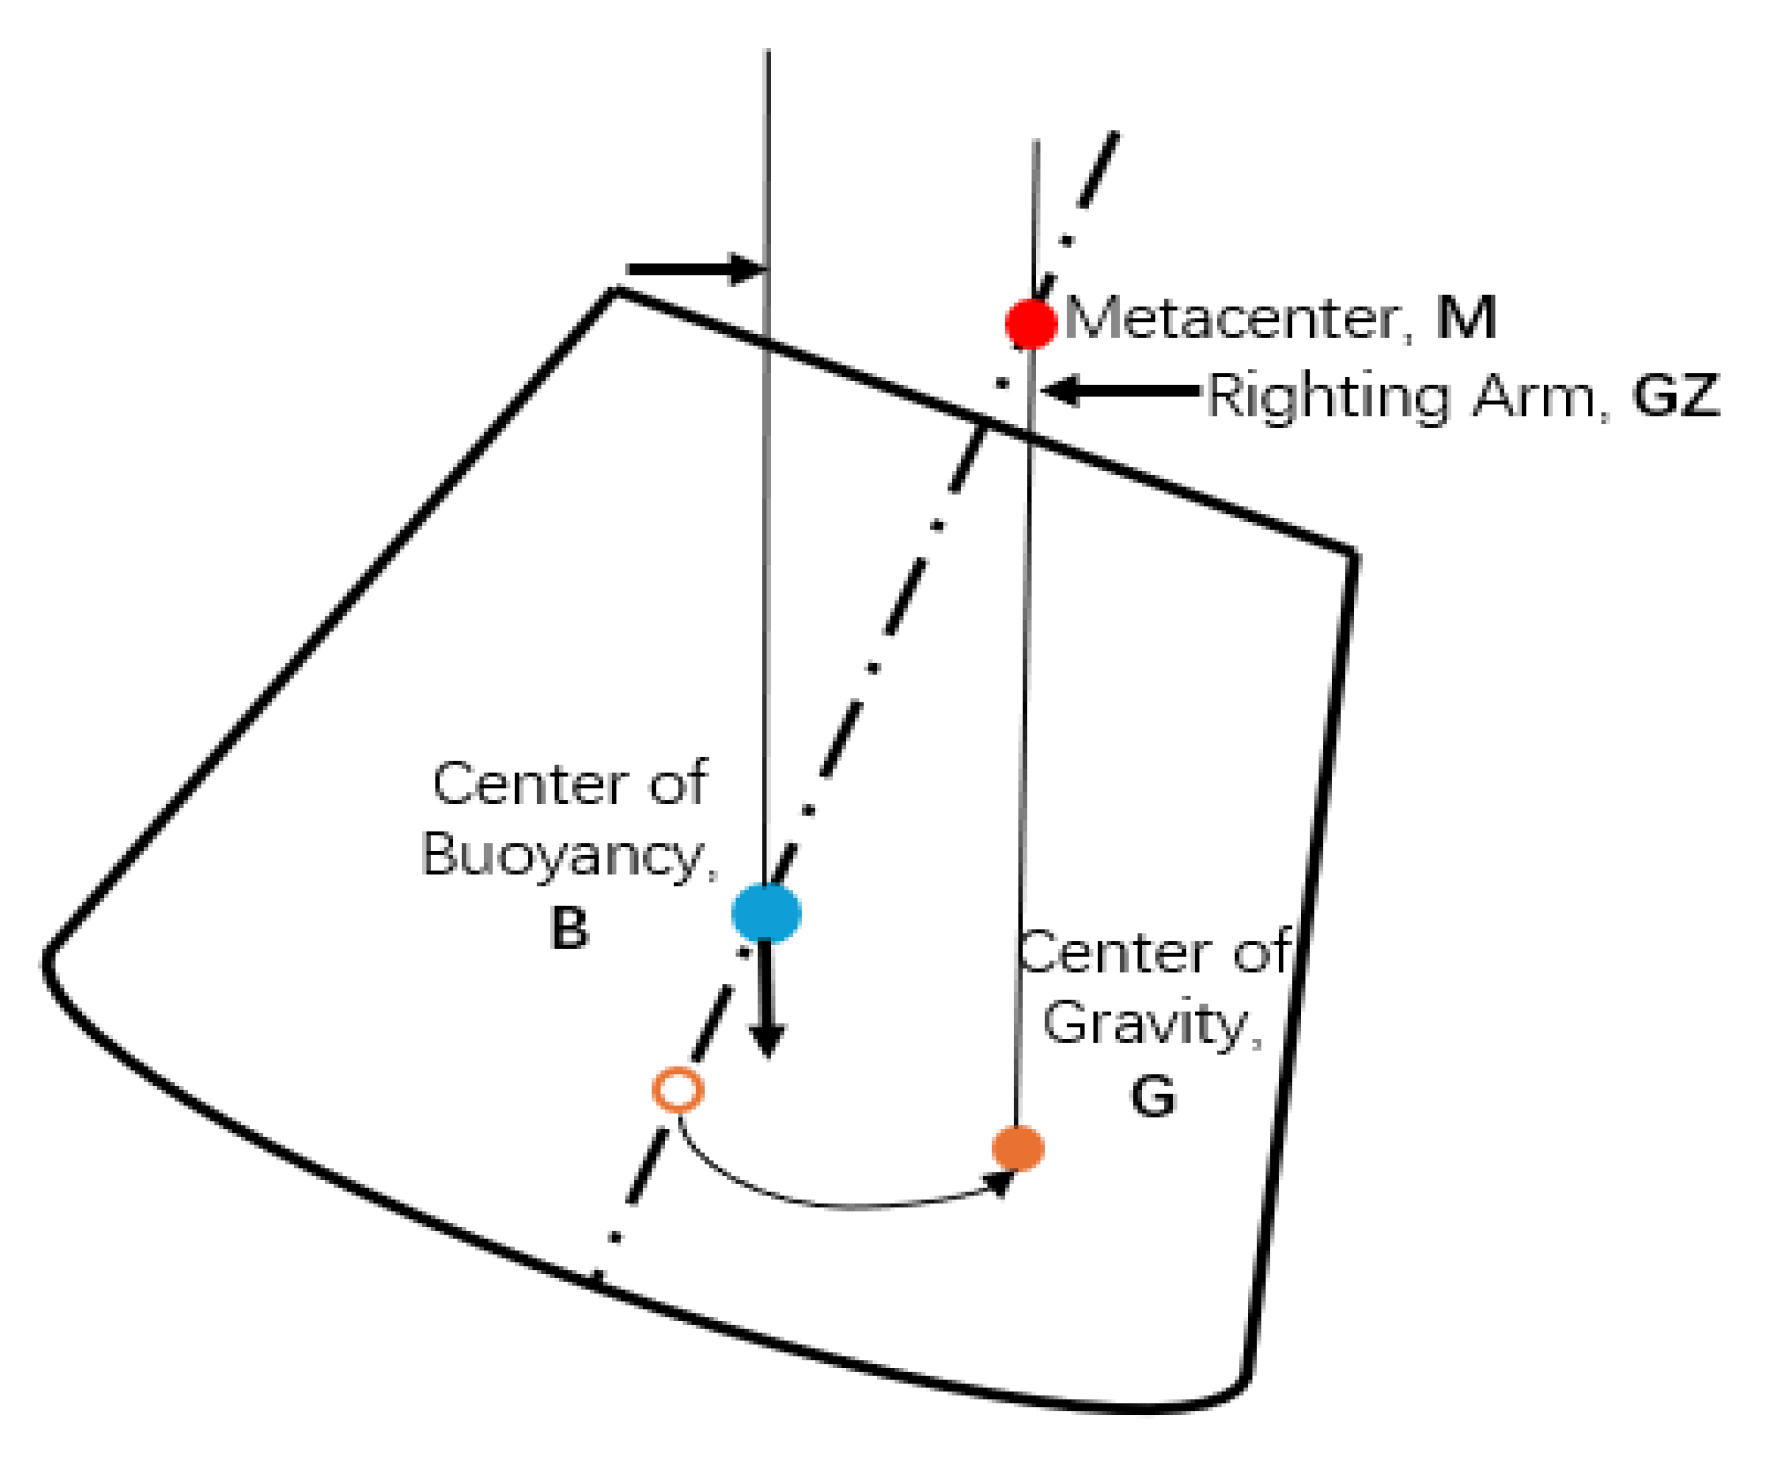
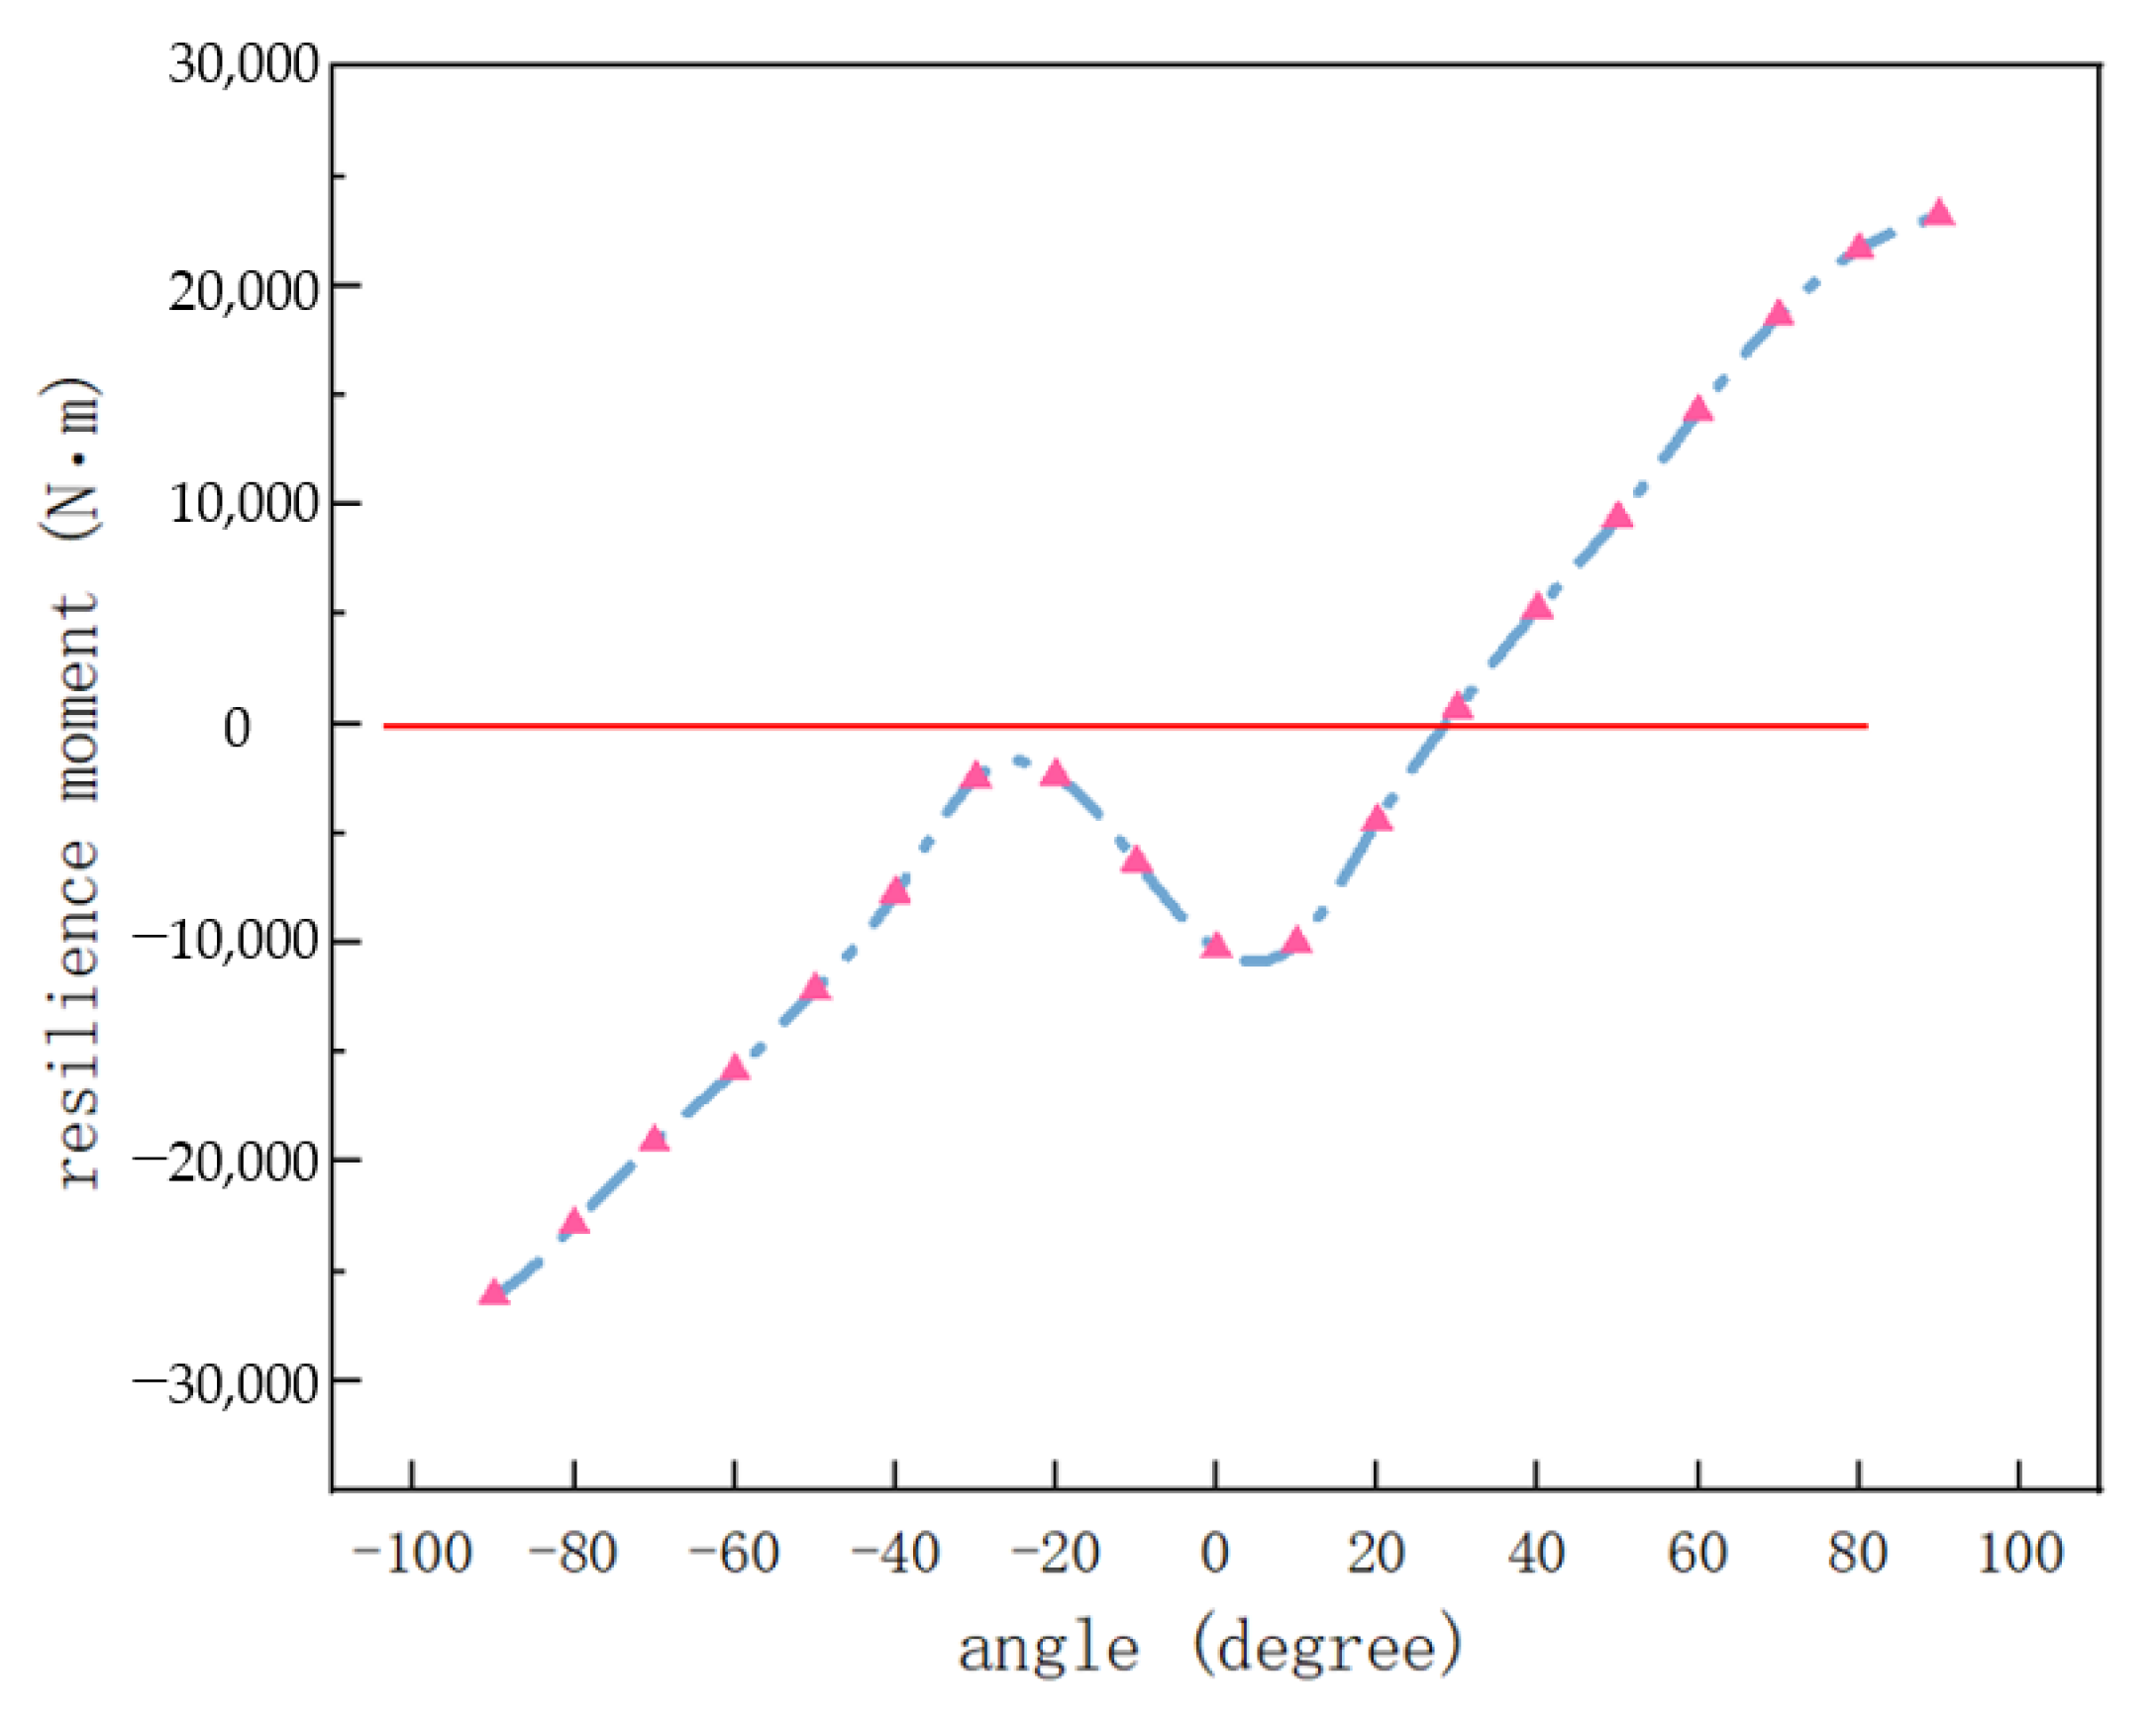
4.2. Restoring Moment Analysis of the Eccentric Conical Structure

To assess if the platform has a single stable equilibrium under the designed center-of-mass configuration, its restoring moment is calculated [31]. This method identifies all possible stable equilibria while excluding water entry effects on the platform’s stable attitude [32]. Restoring moment analysis for offshore structures is derived from ship hydrodynamics and fluid dynamics. A ship’s restoring moment depends on its moment of inertia and the relative positions of its center of gravity and center of buoyancy. For small heel angles, a ship is stable when the metacenter is vertically above the center of gravity. For large heel angles, stability is assessed by the restoring moment, arising from the coupling of gravity and buoyancy, expressed as follows:
M R = W s h i p × G Z ¯
where W s h i p is the ship’s weight, M is the righting moment, and G Z ¯ is the horizontal distance between the center of buoyancy and center of gravity. Figure 12 illustrates that the restoring moment’s magnitude primarily depends on G Z ¯ . For small heel angles, the restoring arm is calculated using the metacentric height:
G Z ¯ = G M ¯ s i n ϕ
Using the stability calculation module, multi-angle static stability simulations are conducted on the platform, systematically evaluating the restoring moment response at various tilt angles (see Figure 13). Numerical results indicate that, under the designed center-of-mass configuration, the platform exhibits a single stable equilibrium, satisfying the restoring moment condition M R = 0. Parameterized scans reveal that, at a 26° tilt angle, the restoring moment is zero ( M R (26°) = 0 N·m), confirming the platform’s static equilibrium, with the center of buoyancy aligning with the center of mass. This solution aligns closely with theoretical predictions in Section 4.2 (relative error < 2%), validating the hydrostatic equilibrium calculation method.

4.3. Impact of Displacement Volume on Platform Floating Stability

The return capsule’s skirt structure comprises eight circumferentially distributed compartments with asymmetric configurations. The +y-axis compartment houses the deceleration parachute system, while the remaining seven compartments contain battery packs, high-pressure gas cylinders, and other life support equipment. During water entry, parachute ejection from the +y-axis compartment causes significant variations in water ingress among compartments. This non-uniform fluid intrusion alters the cabin’s displacement volume distribution, significantly impacting its hydrostatic stability. To investigate the effect of skirt displacement volume distribution on the cabin’s hydrostatic equilibrium, three conditions were designed (see Figure 14): (1) baseline: no foam filling; (2) uniform: 0.5 m3 of closed-cell foam evenly distributed across eight compartments; and (3) directional: 0.5 m3 of closed-cell foam in the +y-axis compartment only. Controlling the foam’s spatial distribution enables a systematic study of displacement volume effects on cabin attitude.
Simulations (Figure 15) show that increasing displacement volume reduces the platform’s maximum pitch angle and stable tilt angle. Compared to the no-foam baseline, uniform foam filling in eight compartments reduces the maximum tilt angle by 12.1% and the stable tilt angle by 18.3%. Directional filling in the +y-axis compartment reduces the maximum tilt angle by 31.9% and the stable tilt angle by 56%. This effect likely stems from cabin tilt, which prevents foam in the −y-axis empty compartment from fully detaching from the water surface, reducing the effective displacement volume compared to directional filling. This suggests that a filling device could be designed to increase the +y-axis compartment’s displacement volume post-parachute ejection, aiding capsule righting.
Simulations (Figure 15) reveal significant differences in the capsule’s hydrodynamic characteristics across the three conditions: (1) uniform filling reduces the maximum pitch angle by 12.1% and the steady-state angle by 18.3%, and (2) directional filling in the +y-axis compartment achieves a 31.9% reduction in the maximum pitch angle and a 56% reduction in the steady-state angle. This effect results from buoyancy redistribution due to the platform’s asymmetric mass distribution. The reduced waterline surface in the −y-axis empty compartment, caused by the tilt angle, lowers the effective displacement volume below the theoretical value. To quantify the damping enhancement of the directional foam-filling strategy, we analyzed the energy dissipation rate ( Γ ), defined as follows:
Γ = 2 β E Δ t
where β represents the decay index of pitch angle oscillations, E is the initial oscillation energy, and Δ t is the oscillation period. Using numerical simulations from Figure 15, Table 4 presents the initial pitch angles, oscillation energies, and energy dissipation rates for baseline, uniform, and directional foam-filling conditions. The baseline condition exhibits a higher dissipation rate due to larger initial oscillations, while uniform and directional filling show progressively lower rates, reflecting enhanced damping through buoyancy redistribution. The reduced dissipation rate in directional filling indicates faster oscillation decay, aligning with its substantial reduction in pitch angles.
Analysis reveals that directional filling enhances hydrostatic moment balance by generating a +y-axis buoyancy correction moment, increasing the restoring moment coefficient by 64%. This finding suggests engineering optimization: post-parachute separation, a +y-axis controllable ballast system (capacity ≥ 0.5 m3) can maintain the steady-state angle within safety limits via active buoyancy compensation. Numerical validation confirms that this approach shortens the capsule’s righting time and enhances astronaut safety margins during water entry.

5. Multi-Physics Coupling Analysis

The marine environment is dynamic. After landing, the return capsule is influenced by waves, wind, and ocean currents, exhibiting complex coupling mechanisms. This section analyzes sea state conditions from Table 1 using three load combinations, i.e., waves only, waves with ocean currents, and waves with ocean currents and wind, to investigate the platform’s dynamic response mechanisms. The analysis of wind and current effects in this section focuses on their interactions with waves from the -y-axis direction, as this maximizes their impact on the eccentric conical floating structure’s motion responses due to its lateral center-of-mass offset along the +y-axis. Section 4.1 demonstrates that a +y-axis offset induces a significant pitch angle, making winds and currents from the opposite direction most critical for amplifying surge displacement and pitch angle extrema, as validated by CFD simulations.
Waves induce surge (y-axis translation), heave (x-axis translation), and pitch (z-axis rotation) in the floating platform. Once stabilized, the platform’s motion responses are analyzed (see Figure 16). The analysis reveals the following: (1) The platform’s motion responses are primarily governed by wave period. With waves alone, the motion period is twice the wave period. This occurs because, at this wavelength, the platform cannot return to a stable state before the next wave’s impact. (2) Ocean currents reduce the motion period from 5.0 s to 4.9 s, altering pitch angular velocity and surge extrema by 2–8%, while increasing surge displacement by 27%. (3) Wind primarily increases pitch angle extrema by up to 32%, due to the platform’s 3 m height and large windward area. (4) The platform’s motion responses vary across cycles, primarily due to the fifth-order Stokes waves used in this study.
The analysis of wave-coupled dynamics (Figure 16) identifies three key platform motion responses, i.e., surge (y-axis translation), heave (x-axis translation), and pitch (z-axis rotation): (1) fifth-order Stokes waves induce 1/2 subharmonic resonance in the platform, extending the motion period to 5.0 s, driven by frequency multiplication coupling between wave excitation and structural natural frequency. (2) Ocean currents reduce the motion period by 2% (T = 4.9 s) and increase surge displacement by 27%, due to the flow-induced added mass effect altering the system’s kinetic energy transmission. (3) Wind load amplifies pitch angle extrema by 32%, resulting from aerodynamic pressure center offset caused by the 3 m structural height. (4) Fifth-order Stokes waves excitation induces unsteady responses, with broadband characteristics causing quasi-periodic motion trajectories.
This study elucidates the nonlinear hydrodynamic response of the platform under multi-load coupling, confirming that wave–current–wind interactions significantly alter its energy transmission and hydrodynamic behavior. These findings support the optimization and control of the return capsule system and can be extended to analyze structural parameters under complex sea conditions across various geographical locations.

6. Wave Parameter Effects

Section 6 extends the findings of Section 5, which established that wind and current effects on the motion responses of the eccentric conical floating structure are negligible compared to wave parameters. Consequently, this study prioritizes wave height and wavelength as the primary drivers of hydrodynamic characteristics and dynamic stability. Using wave parameters from Table 1, this section systematically analyzes their relationship with the platform’s nonlinear hydrodynamic responses, elucidating their dominant role in shaping motion patterns under diverse wave conditions.

6.1. Wavelength Effects

Using the high-order volume of fluid (VOF) method, fifth-order Stokes waves are generated (surface reconstruction accuracy η ≥ 0.97) with a baseline wave environment of 1 m wave height and 0° incident angle (head-on). Parameterized analysis investigates the effects of wavelengths (λ = 8–32 m, 8 m increments) on the platform’s hydrodynamic characteristics, focusing on surge-heave coupled motion and pitch angle velocity amplitudes.
Figure 17 shows that wavelength (λ = 8–32 m) significantly influences the platform’s hydrodynamic responses. The key findings include the following: (1) Motion period evolution: As λ increases from 8 m to 32 m, the pitch angle period T p shifts from 2 T w (where T w is the wave period) to T w . This results from reduced phase differences in fluid excitation, enabling faster dynamic balance between the platform’s restoring moment and wave excitation moment. (2) Nonlinear surge displacement growth: Surge amplitude increases by 70% as λ rises from 8 m to 16 m, then slows to a 7% increase beyond 16 m. This is driven by a fluid–solid coupling mode transition at the critical wavelength ratio. At λ = 8 m, surge amplitude exhibits strong nonlinear growth in the subcritical region. Beyond 16 m, it enters the supercritical region, with growth slowing to 7%. The wave crest action time under these conditions is expressed as follows:
    t p = λ 2 c = λ 2 g λ 2 π = π λ 2 g
where t p is the wave crest action time, λ is the wavelength, and c is the water flow speed. When t p is less than the structural natural period, kinetic energy input is incomplete, yielding an energy transmission efficiency η e < 45%. Otherwise, a quasi-steady state is reached with η e ≈ 82%. (3) Pitch angle amplitude dependence on wavelength: Pitch angle extrema increase linearly with λ , while angular velocity extrema remain stable at 0.82 ± 0.05 rad/s. This suggests wavelength primarily affects displacement response amplitude, with minimal impact on inertial forces. This subsection elucidates the multi-scale effects of wavelength on the platform’s hydrodynamic characteristics via phase and energy transmission adjustments. Wave height, another critical parameter, influences fluid–structure nonlinear coupling and will be examined next.

6.2. Wave Height Effects

Using the high-order VOF method, fifth-order Stokes waves are generated (surface reconstruction accuracy η ≥ 0.97) with a baseline deep-water wave environment of λ = 40 m and 0° incident angle (head-on) [33]. Wave heights (H = 1–5 m), covering WMO Sea States 3–6, are analyzed to elucidate the nonlinear effects of height gradients on the platform’s hydrodynamic characteristics [34].
Numerical analysis (Figure 18) reveals that wave height significantly influences the platform’s hydrodynamic characteristics through nonlinear regulation [35]. In Sea States 3–5 (H = 1–3 m, δ = 0.125), motion parameters (e.g., pitch angle, surge frequency) align closely with the wave fundamental frequency ( f s / f w = 1.00 ± 0.05), with stable pitch angle extrema (48.6° ± 4.5°, CV = 8.5%), indicating predictable linear responses. At H = 5 m (Sea State 6, δ = 0.125), the system enters a strongly nonlinear regime, exhibiting subharmonic resonance and broadband random vibrations, with pitch angle extrema rising to 150°. In this state, the platform is critically stable, with the longitudinal distance between the center of buoyancy and center of mass reduced to 0.12 m. The restoring moment ( M R = ρ g G Z ) falls to 1.3 times the wave capsizing moment’s safety margin. To clarify the origin of the subharmonic resonance observed at Sea State 6, we analyzed whether it is driven by structural or fluid dynamics. The capsule’s pitching natural frequency ( f n ) is determined as follows:
    f n = 1 2 π k θ I z
where k θ is the pitching restoring stiffness, and I z is the moment of inertia about the z-axis. Using structural parameters from Table 2 and restoring moment data from Section 4.2, the capsule’s natural frequency is approximately 0.143 Hz, corresponding to a period of 7.0 s. In contrast, the wave excitation frequency for Sea State 6 is approximately 0.200 Hz (period 5.0 s), with its subharmonic component at 0.100 Hz (period 10.0 s), aligning with the observed resonance period. The proximity of the capsule’s natural frequency (0.143 Hz) to the subharmonic frequency (0.100 Hz) suggests a coupled response, but the resonance is primarily fluid-driven, resulting from nonlinear wave–structure interactions at high wave steepness (δ = 0.125). This is supported by CFD simulations, which capture the nonlinear fluid force spectrum exhibiting the subharmonic component.
The subharmonic resonance significantly impacts capsule design, as amplified pitch angles (up to 150°) reduce stability margins and increase astronaut physiological risks. To mitigate this, active damping systems, such as controllable ballast mechanisms (Section 4.3), can dynamically adjust the capsule’s natural frequency to avoid resonance. Additionally, optimizing the eccentric structure (Section 4.1) to minimize center-of-mass offsets and enhancing nonlinear damping through directional foam-filling (Section 4.3) can further suppress resonance effects. These strategies enhance capsule safety under extreme wave conditions, ensuring robust performance during water landings.
For H = 1–3 m, heave displacement extrema grow linearly ( h e a v e m a x = 0.95H ± 6%). At H = 5 m, they decrease to 0.84H, a reduction of 11.6%. This phenomenon primarily results from reduced energy transmission efficiency driven by wave steepness. When δ > 0.1, the wave crest action time ( t p ) is shorter than the structural dynamic response time ( t d ), limiting effective wave energy input to 82%.

7. Conclusions and Discussion

This study investigates manned return capsule dynamics using an eccentric conical structure, employing potential flow theory and integrating experimental and numerical methods to analyze wind, wave, and current interactions. It also examines the effects of wave height and wavelength on the platform’s dynamics. The key conclusions are as follows:
(1)
In still water, the lateral (y-axis) center-of-mass offset sustains a single stable equilibrium via a nonlinear restoring moment driven by geometric asymmetry. Its stability sensitivity exceeds that of the longitudinal (x-axis) offset. The x-axis offset increases pitch response amplitude but does not exceed the instability threshold. Biaxial center-of-mass disturbances do not cause capsizing in still water, but wave excitation in real sea conditions may induce multi-stable equilibria.
(2)
For displacement volume control, uniform foam filling across all compartments reduces motion amplitude and steady-state tilt angle compared to the no-foam baseline. Directional filling in the +y-axis compartment provides superior stability correction, reducing the maximum tilt angle more effectively than uniform filling. In engineering applications, post-parachute +y-axis ballast control can rapidly right the capsule by adjusting the center of buoyancy and center of mass.
(3)
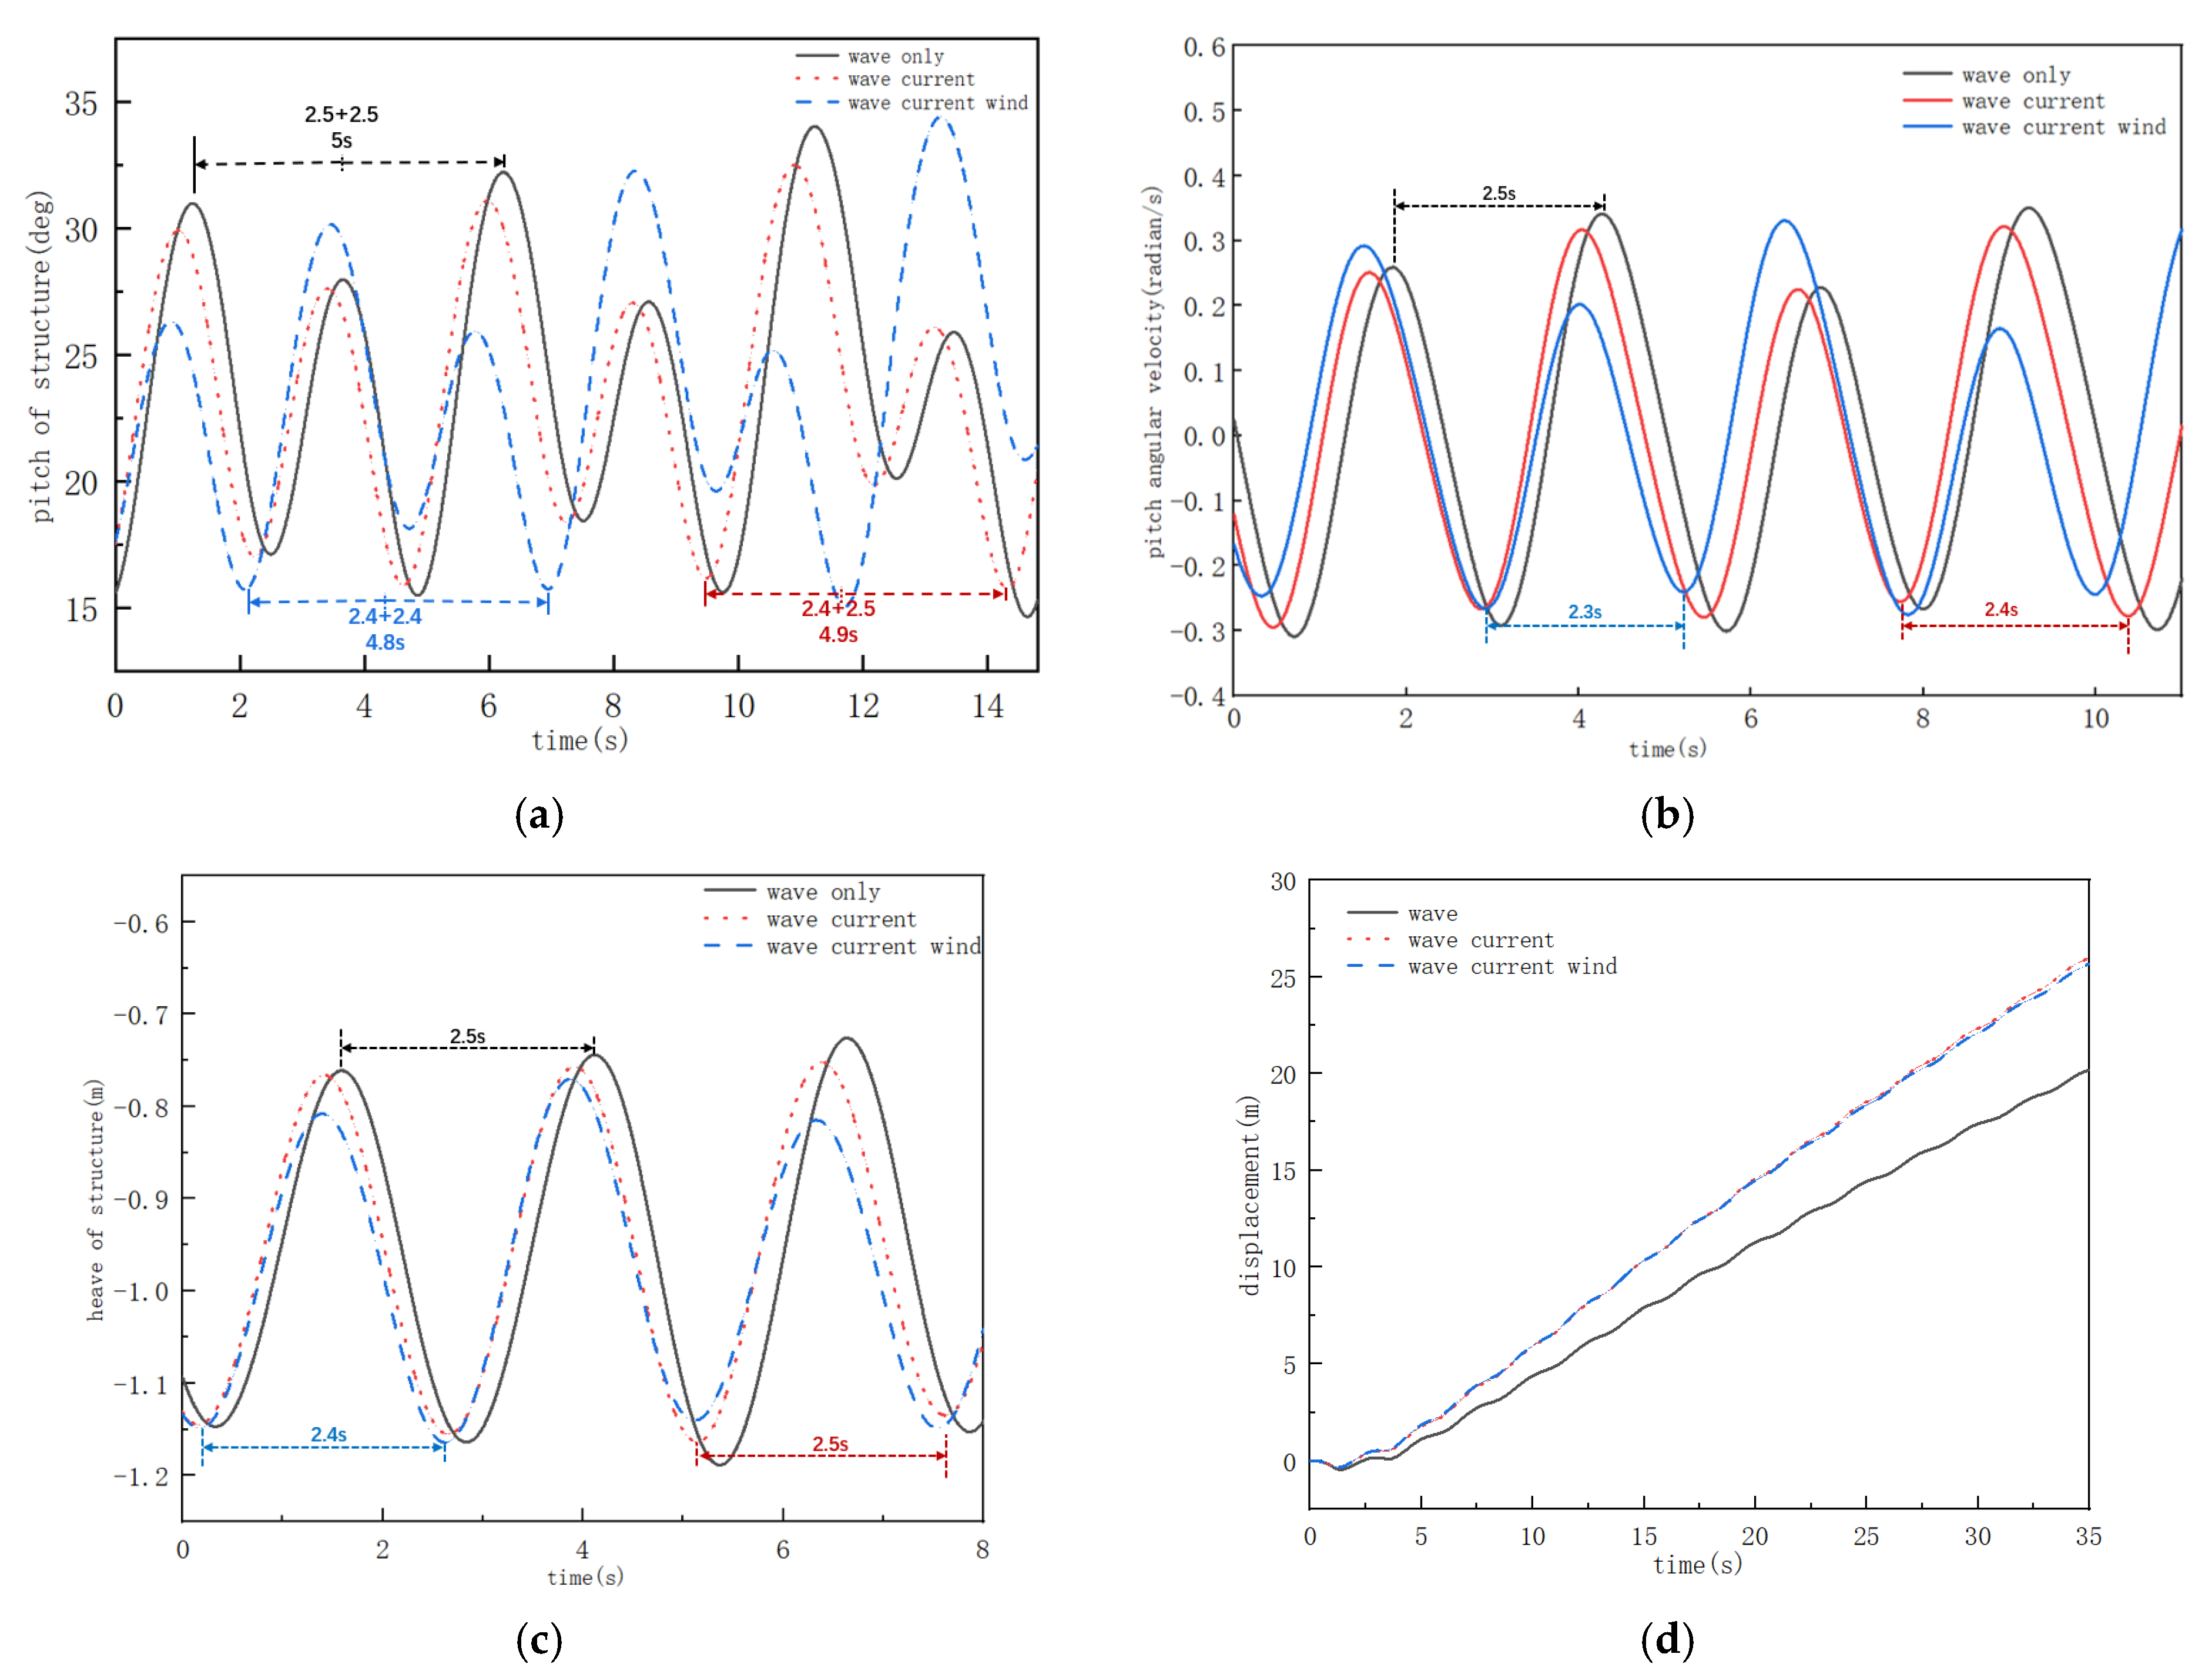
Waves induce significant surge, heave, and pitch coupling in the platform, with response periods strictly synchronized with the wave period. Ocean currents and wind loads slightly alter motion amplitude and phase, but their effects are less significant than wave periodicity. Wave parameters are the primary determinants of the platform’s dynamic stability, while current and wind disturbances have limited effects on local motion modes.
(4)
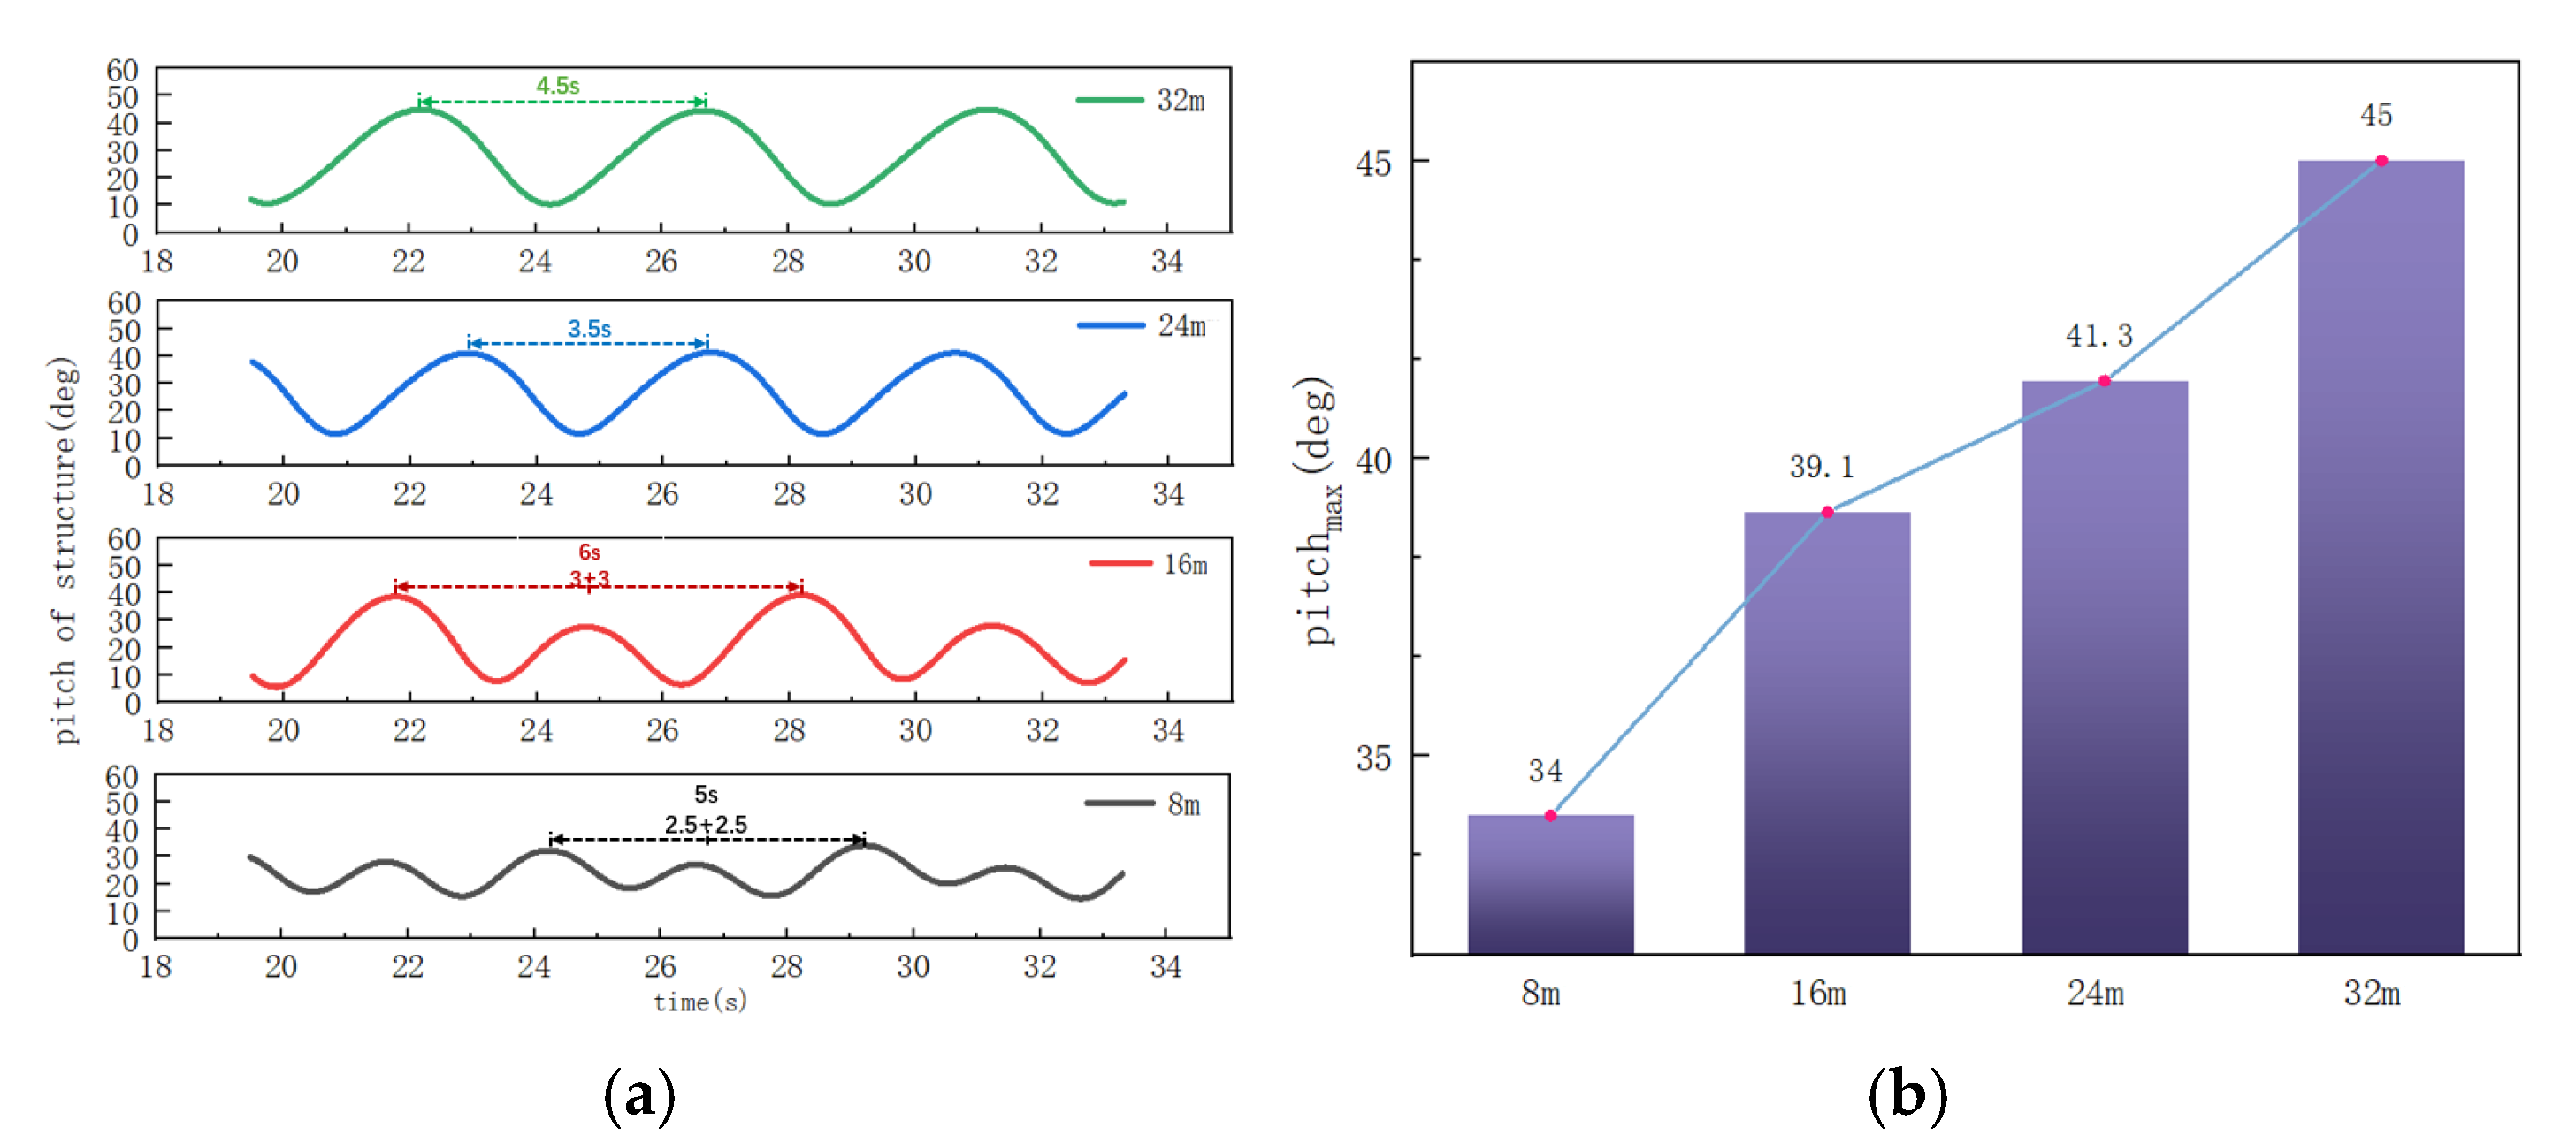
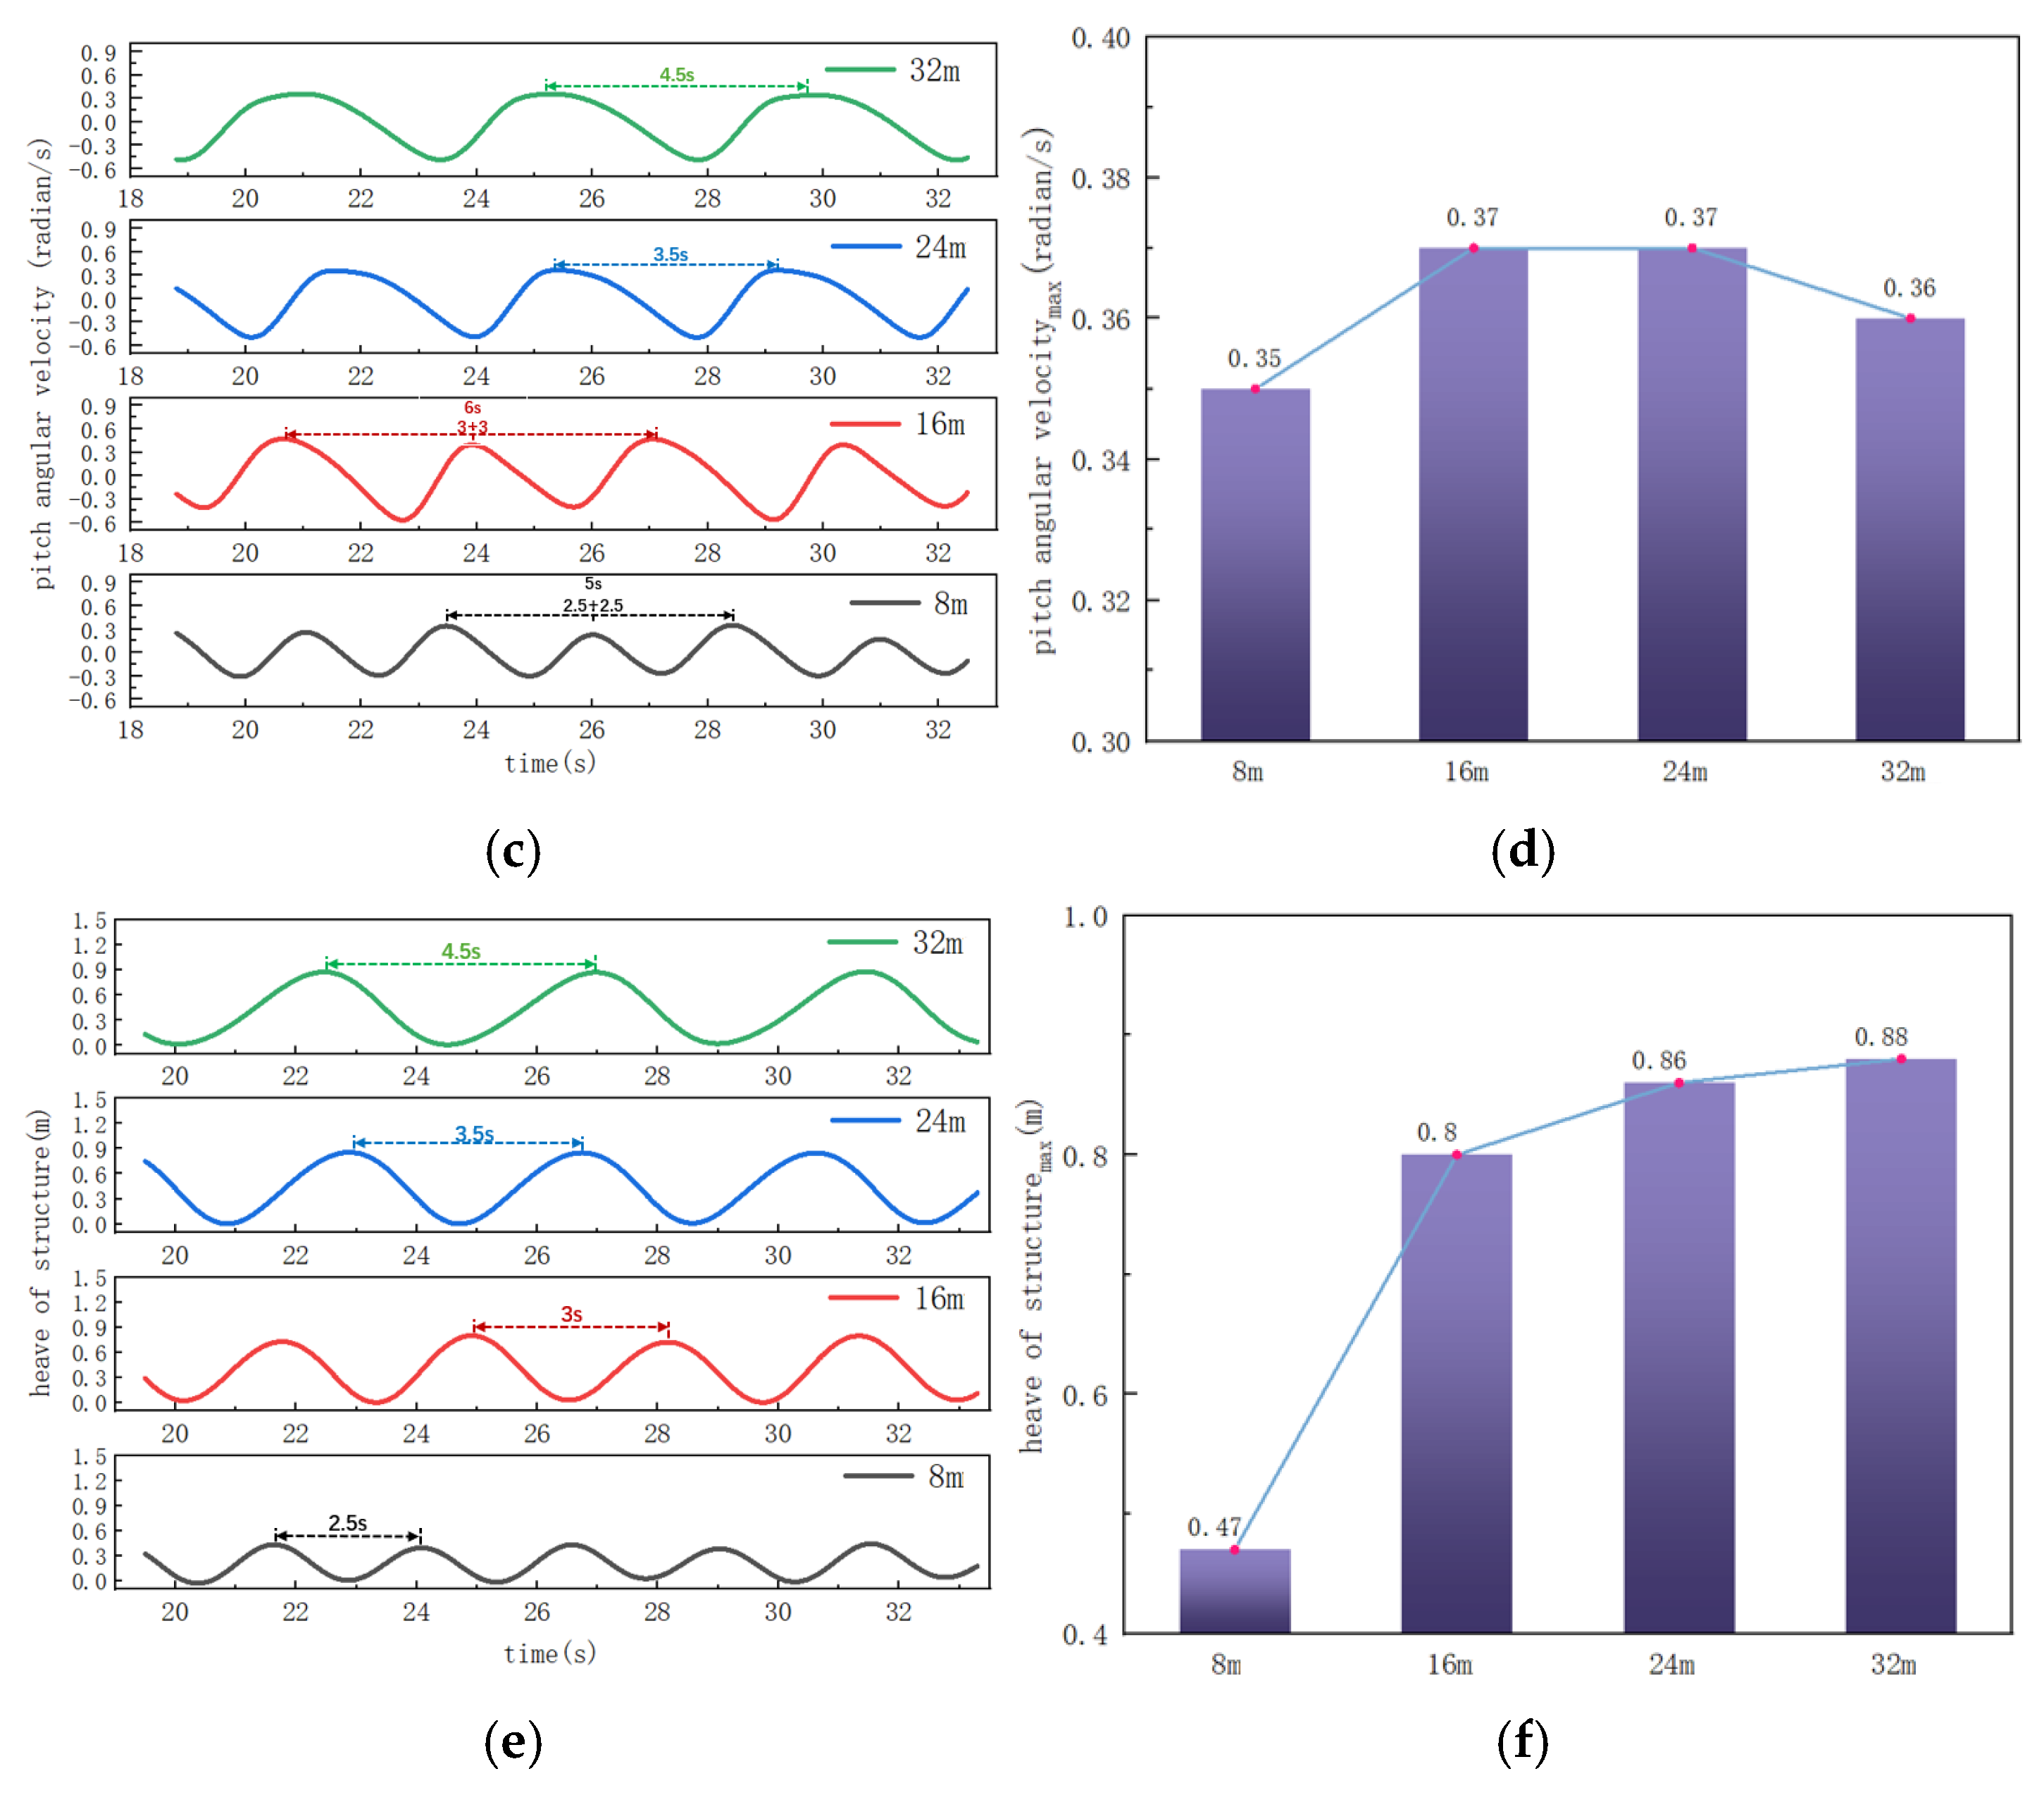
As wavelength increases, the platform’s restoring moment and wave action moment balance more rapidly, reducing the motion period from twice the wave period to wave period synchronization. Surge displacement amplitude exhibits nonlinear growth, rising sharply up to a wavelength threshold, then leveling off. Pitch angle amplitude increases linearly with wavelength, while angular velocity remains stable, suggesting that wavelength primarily affects displacement response potential energy, not inertial forces.
(5)
In moderate sea conditions (Sea States 3–5), the platform’s motion frequency aligns with the wave fundamental frequency, maintaining stable pitch angle amplitudes. At a wave height of 5 m (Sea State 6), the system enters a strongly nonlinear regime, with subharmonic resonance and broadband vibrations causing a sharp increase in pitch angle extrema and a reduced safety margin. Notably, increasing wave steepness reduces energy input efficiency, attenuating heave displacement responses at extreme wave heights.
This study addresses water landing stability requirements for manned return capsules, elucidating the effects of wave parameters and structural characteristics on capsule hydrodynamic responses and highlighting the critical role of parameter thresholds in dynamic stability. The platform model verifies self-stability characteristics under still water conditions; however, it insufficiently characterizes the complexity of multi-physics field coupling effects in actual wave conditions, potentially underestimating the risk of multi-stable instability, such as parametric roll, under extreme conditions. Future research will explore capsule dynamics in complex wave environments, emphasizing adaptive center-of-mass regulation, wave spectrum sensitivity optimization, rapid righting technologies, and the influence of structural elasticity to enhance model applicability under extreme conditions, such as through elastic models analyzing damping and motion responses. Additionally, studies will investigate a broader range of wind and current directions to elucidate their coupling with waves and address practical challenges of directional foam-filling, including deployment timing and reliability under dynamic wave conditions, to advance its engineering feasibility. These advancements aim to improve water landing safety and reduce astronaut physiological risks in high wave conditions.

Author Contributions

Conceptualization, S.C. and F.Q.; methodology, F.Q.; software, F.Q.; validation, S.C. and F.Q.; formal analysis, F.Q. and K.Z.; investigation, F.Q. and K.Z.; resources, S.C.; data curation, F.Q.; writing—original draft preparation, F.Q. and K.Z.; writing—review and editing, S.C. and F.Q.; visualization, S.C. and F.Q.; supervision, S.C.; project administration, S.C.; funding acquisition, F.Q. and K.Z. All authors have read and agreed to the published version of the manuscript.

Funding

This research was funded by the Fundamental Research Funds for the Central Universities (grant number: 3132023513).

Data Availability Statement

Due to confidentiality restrictions, the data used in this study are not publicly available. However, certain relevant data may be made available from the corresponding author upon reasonable request.

Acknowledgments

The author contribution and funding sections have covered all the received support.

Conflicts of Interest

The authors declare that they have no known competing financial interests or personal relationships that could have appeared to influence the work reported in this paper.

References

  1. Wang, Y.; Shi, X. Current status and progress of research on water impact problems. Explos. Shock Waves 2008, 28, 276–282. [Google Scholar]
  2. Xuan, J.; Miao, Y.; Cheng, J. Experimental study and theoretical calculation of water impact characteristics of return capsules. Hydrodyn. Res. Prog. (Ser. A) 2000, 3, 276–286. [Google Scholar]
  3. Mei, C.; Zhang, J.; Pan, G. Multi-objective optimization design of airbag cushioning for manned spacecraft return capsules. Manned Spacefl. 2015, 21, 444–449. [Google Scholar]
  4. Takasawa, H.; Fujii, T.; Takahashi, Y.; Moriyoshi, T.; Takayanagi, H.; Nagata, Y.; Yamada, K. Static attitude stability of deep space sample return capsule with thin aeroshell. CEAS Space J. 2025, 17, 55–69. [Google Scholar] [CrossRef]
  5. Lin, W.; Wang, N.; Gao, Z. Optimization of joint search and rescue by rescue ships and helicopters in remote sea areas. J. Transp. Eng. 2021, 21, 187–199. [Google Scholar]
  6. Peng, Z.; Yang, H.; Wei, J. Current status and prospects of China’s maritime search and rescue equipment development. World Shipp. 2023, 46, 26–29. [Google Scholar]
  7. Vaughan, V.L. Landing Characteristics and Flotation Properties of a Reentry Capsule. Unpublished report, 1961. Vaughan, V. L. Landing Characteristics and Flotation Properties of a Reentry Capsule; NASA Langley Research Center: Hampton, VA, USA, 1961. [Google Scholar]
  8. Herting, D.; Pohlen, J.; Pollock, R. Analysis and design of the Apollo landing impact system. In Proceedings of the AIAA 3rd Manned Space Flight Meeting, Houston, TX, USA, 4–6 November 1964. [Google Scholar] [CrossRef]
  9. Stubbs, S.M. Landing Characteristics of the Apollo Spacecraft with Deployed-Heat-Shield Impact Attenuation Systems; NASA Langley Research Center: Hampton, VA, USA, 1966. [Google Scholar]
  10. Benson, H.E. Water impact of the Apollo spacecraft. J. Spacecr. 1966, 3, 1282–1284. [Google Scholar] [CrossRef]
  11. Baker, W.E.; Westine, P.S. Model tests for determination of the structural response of the Apollo command module to water impact. Arch. Int. Pharmacodyn. Ther. 2013, 23, 165–174. [Google Scholar] [CrossRef]
  12. Thompson, W.C. Dynamic Model Investigation of the Rough-Water Landing Characteristics of a Spacecraft; NASA Langley Research Center: Hampton, VA, USA, 1967. [Google Scholar]
  13. Wang, J.T.; Lyle, K.H. Simulating Space Capsule Water Landing with Explicit Finite Element Method. In Proceedings of the AIAA Conference, San Antonio, TX, USA, 7–10 January 2007. [Google Scholar] [CrossRef]
  14. Anghileri, M.; Spizzica, A. Experimental validation of finite element models for water impacts. J. Spacecraft Rockets 1995, 32, 621–628. [Google Scholar]
  15. Song, S.; Demirel, Y.K.; Atlar, M. An investigation into the effect of biofouling on the ship hydrodynamic characteristics using CFD. Ocean Eng. 2019, 175, 122–137. [Google Scholar] [CrossRef]
  16. Jasak, H.; Vukevi, V.; Gatin, I.; Lalović, I. CFD validation and grid sensitivity studies of full scale ship self propulsion. Int. J. Nav. Archit. Ocean Eng. 2019, 1, 45–58. [Google Scholar] [CrossRef]
  17. Wang, J.; Wan, D. CFD study of ship stopping maneuver by overset grid technique. Ocean Eng. 2020, 197, 106895. [Google Scholar] [CrossRef]
  18. Jiao, J.; Huang, S.; Soares, C.G. Numerical investigation of ship motions in cross waves using CFD. Ocean Eng. 2021, 223, 108711. [Google Scholar] [CrossRef]
  19. Islam, H.; Ventura, M.; Guedes Soares, C.; Tadros, M.; Abdelwahab, H.S. Comparison between Empirical and CFD Based Methods for Ship Resistance and Power Prediction. J. Mar. Sci. Eng. 2022, 10, 258. [Google Scholar] [CrossRef]
  20. Kim, D.; Tezdogan, T. CFD-based hydrodynamic analyses of ship course keeping control and turning performance in irregular waves. Ocean Eng. 2022, 248, 110808. [Google Scholar] [CrossRef]
  21. Andersson, J.; Shiri, A.A.; Bensow, R.E.; Jin, Y.; Wu, C.; Qiu, G.; Deng, G.; Queutey, P.; Yan, X.-K.; Horn, P.; et al. Ship-scale CFD benchmark study of a pre-swirl duct on KVLCC2. Appl. Ocean Res. 2022, 123, 103134. [Google Scholar] [CrossRef]
  22. Huang, S.; Jiao, J.; Soares, C.G. Uncertainty analyses on the CFD–FEA co-simulations of ship wave loads and whipping responses. Mar. Struct. 2022, 82, 103129. [Google Scholar] [CrossRef]
  23. Mi, C.; Gao, J.; Song, Z.; Liu, Y. Hydrodynamic Wave Forces on Two Side-by-Side Barges Subjected to Nonlinear Focused Wave Groups. Ocean Eng. 2025, 317, 120056. [Google Scholar] [CrossRef]
  24. Gong, S.; Gao, J.; Yan, M.; Song, Z.; Shi, H. Effects of Floater Motion on Wave Loads during Steady-State Gap Resonance Occurring between Two Non-Identical Boxes. Ocean Eng. 2025, 323, 120649. [Google Scholar] [CrossRef]
  25. Song, Z.; Jiao, Z.; Gao, J.; Mi, C.; Liu, Y. Numerical Investigation on the Hydrodynamic Wave Forces on the Three Barges in Proximity. Ocean Eng. 2025, 316, 119941. [Google Scholar] [CrossRef]
  26. Lari, K.S. Comparison and verification of turbulence Reynolds-averaged Navier–irregular waves closures to model spatially varied flows. Sci. Rep. 2020, 10, 76128. [Google Scholar] [CrossRef]
  27. Zhan, J.; Li, Y. A hybrid turbulence model for wave breaking simulation. Chin. J. Theor. Appl. Mech. 2019, 51, 1712–1719. [Google Scholar] [CrossRef]
  28. Babaji, B. Computational Aerodynamic Analysis of Flow Around Apollo Reentry Capsule with Anisotropic Mesh Adaptation. Ph.D. Thesis, Cranfield University, Bedford, UK, 2021. [Google Scholar]
  29. Wheeler, M.P.; Matveev, K.I.; Xing, T. Numerical study of hydrodynamics of heavily loaded hard-chine hulls in calm water. J. Mar. Sci. Eng. 2021, 9, 184. [Google Scholar] [CrossRef]
  30. Yuan, R.; Guo, B.; Liu, M.Q. Flexible sliced Latin hypercube designs with slices of different sizes. Stat. Pap. 2021, 62, 137–157. [Google Scholar] [CrossRef]
  31. Ma, Y.; Chen, C.; Fan, T.; Lu, H. Research on the Dynamic Behaviors of a Spar Floating Offshore Wind Turbine with an Innovative Type of Mooring System. Front. Energy Res. 2022, 10, 853448. [Google Scholar] [CrossRef]
  32. Arredondo-Galeana, A.; Brennan, F. Floating Offshore Vertical Axis Wind Turbines: Opportunities, Challenges and Way Forward. Energies 2021, 14, 8000. [Google Scholar] [CrossRef]
  33. Fang, H.; Liu, L.F.; Tang, L.; Lin, P. The theory of fifth-order Stokes waves in a linear shear current. Proc. R. Soc. A 2023, 479, 19. [Google Scholar] [CrossRef]
  34. Ahn, H.; Shin, H. Experimental and numerical analysis of a 10 MW floating offshore wind turbine in regular waves. Energies 2020, 13, 2608. [Google Scholar] [CrossRef]
  35. Jana, O.; Taylor, P.H.; Wolgamot, H.A.; Madsen, F.J.; Pegalajar-Jurado, A.M.; Bredmose, H. Wave- and drag-driven subharmonic responses of a floating wind turbine. J. Fluid Mech. 2021, 929, A50. [Google Scholar]
Figure 1. Geographical Locations of Observation Points in the Northern South China Sea.
Jmse 13 01032 g001
Figure 2. The structural coordinate system for the eccentric conical structure.
Jmse 13 01032 g002
Figure 3. The schematic of the computational domain and boundary conditions.
Jmse 13 01032 g003
Figure 4. The schematic of the computational mesh.
Jmse 13 01032 g004
Figure 5. The schematic of the pool experiment: (a) experimental flow chart; (b) the schematic diagram of the angle of entry into the water.
Jmse 13 01032 g005
Figure 6. Attitude angle variations in the eccentric conical structure during the pool experiment.
Jmse 13 01032 g006
Figure 7. The steady-state comparison of pitch, roll, and yaw for the eccentric conical structure.
Jmse 13 01032 g007
Figure 8. Dynamic pitch angle variation comparison.
Jmse 13 01032 g008
Figure 9. Stability state diagram of eccentric cone.
Jmse 13 01032 g009
Figure 10. The effects of y-axis center-of-mass offset on the eccentric conical structure: (a) maximum pitch angle; (b) stable attitude; (c) pitch angle response.
Jmse 13 01032 g010
Figure 11. The effects of x-axis center-of-mass offset on the eccentric conical structure: (a) maximum pitch angle; (b) stable attitude; (c) pitch angle response.
Jmse 13 01032 g011
Figure 12. Restoring arm.
Jmse 13 01032 g012
Figure 13. Restoring moment of the eccentric conical structure.
Jmse 13 01032 g013
Figure 14. Cabin states for (a) uniform filling and (b) directional filling.
Jmse 13 01032 g014
Figure 15. The effects of displacement volume on the eccentric conical structure: (a) maximum pitch angle; (b) stable attitude; (c) pitch angle response.
Jmse 13 01032 g015
Figure 16. The motion responses of the eccentric conical structure: (a) pitch variation; (b) pitch velocity variation; (c) heave variation; (d) surge displacement.
Jmse 13 01032 g016
Figure 17. Platform motion responses at varying wavelengths: (a) pitch variation; (b) pitch angle extremum; (c) pitch velocity variation; (d) pitch angular velocity extremum; (e) heave variation; (f) heave extremum.
Jmse 13 01032 g017aJmse 13 01032 g017b
Figure 18. Platform motion responses at varying waveheights: (a) pitch variation; (b) pitch angle extremum; (c) pitch velocity variation; (d) pitch angular velocity extremum; (e) heave variation; (f) heave extremum.
Jmse 13 01032 g018
Table 1. Measured sea state data for fifth-order Stokes waves, derived from hydrological data in the northern South China Sea.
Sea Condition LevelsLevel 3Level 4Level 5
Wave Height (m)123
Wavelength (m)81624
Wave Period (s)2.53.64.7
Wind Speed (m/s)4811
Table 2. Mass parameters of the eccentric conical structure.
Parameter NameParameter Value
Total Mass (kg)7800
Center of Mass X c (mm)−1750
Center of Mass Y c (mm)30
Center of Mass Z c (mm)0
Inertia Tensor I x x (kg ·m2)9675.11
Inertia Tensor I y y (kg·m2)11,805.97
Inertia Tensor I z z (kg·m2)11,266.03
Table 3. Grid independence analysis.
GroupCells
(Millions)
P i t c h m a x P i t c h d i f f Y a w m a x Y a w d i f f R o l l m a x R o l l d i f f
Coarse1.54.705.86%1.314.8%28.131.7%
Medium2.64.501.35%1.271.6%27.720.22%
Fine3.34.440%1.250%27.660%
Table 4. Foam-filling damping metrics.
ConditionInitial Pitch Angle (°)Oscillation (J)Energy Dissipation Rate (J/s)
Baseline24.51030.341.2
Uniform Filling20.0686.731.6
Directional Filling10.8200.210.4
Disclaimer/Publisher’s Note: The statements, opinions and data contained in all publications are solely those of the individual author(s) and contributor(s) and not of MDPI and/or the editor(s). MDPI and/or the editor(s) disclaim responsibility for any injury to people or property resulting from any ideas, methods, instructions or products referred to in the content.

