Article

The Sedimentary Distribution and Evolution of Middle Jurassic Reefs and Carbonate Platform on the Middle Low Uplift in the Chaoshan Depression, Northern South China Sea

1
Key Laboratory of Marine Mineral Resources, Ministry of Natural Resources, Guangzhou 510075, China
2
Guangzhou Marine Geological Survey, China Geological Survey, Guangzhou 510760, China
*
Authors to whom correspondence should be addressed.
J. Mar. Sci. Eng. 2025, 13(6), 1025; https://doi.org/10.3390/jmse13061025
Submission received: 21 April 2025 / Revised: 17 May 2025 / Accepted: 20 May 2025 / Published: 23 May 2025
(This article belongs to the Section Geological Oceanography)

Abstract

:
The Chaoshan Depression, situated in the northern South China Sea, is a Mesozoic residual depression beneath the Cenozoic Pearl River Mouth Basin. Borehole LF35-1-1 has confirmed the existence of marine Jurassic layers rich in organic carbon within this depression. However, the understanding of petroleum geology in this area is limited due to the complex interplay of Mesozoic and Cenozoic tectonic activities and the poor quality of seismic imaging from previous surveys, which have obstructed insights into the characteristics of Mesozoic reservoirs and the processes of oil and gas accumulation. Recent quasi-3D seismic data have allowed for the identification of Mesozoic bioherms and carbonate platforms in the Middle Low Uplift of the Chaoshan Depression. This research employs integrated geophysical data (MCS, gravity, magnetic) and well data to explore the factors that influenced Middle Jurassic reef development and their implications for reservoir formation. The seismic reflection patterns of reefs and carbonate platforms are primarily characterized by high-amplitude discontinuous to chaotic reflections, with occasional blank reflections or weak, sub-parallel reflections, as well as significant high-velocity, high Bouguer gravity and low reduced-to-pole (RTP) magnetic anomalies. Atolls, stratiform reefs, and patch reefs are located on the local topographic highs of the platform. Three vertical evolutionary stages have been identified based on the size of atolls and fluctuations in relative sea level: initiation, growth, and submergence. The location of bioherms and carbonate platforms was influenced by paleotectonic topography, while their horizontal distribution was affected by variations in relative sea level. Furthermore, the reef limestone reservoirs from the upper member of the Middle Jurassic, combined with the mudstone source rocks from the Lower Jurassic and the lower section of the Middle Jurassic, as well as the bathyal mudstone caprocks from the lower part of the Late Jurassic, create highly favorable conditions for hydrocarbon accumulation.

1. Introduction

Bioherms and carbonate rocks represent a significant hydrocarbon reservoir system, playing an essential role in petroleum exploration and development, as they account for approximately 50% to 70% of global hydrocarbon resources [1,2,3]. The Mesozoic era, specifically the Jurassic and Cretaceous periods, contains the largest known reserves of oil and gas associated with bioherms [4,5], followed by the Neogene–Paleogene and, subsequently, the Paleozoic era, particularly the Devonian Period [6,7,8,9]. Large offshore deepwater oil and gas fields associated with bioherms and carbonate formations have emerged as significant targets for global exploration efforts [8,9,10,11,12,13]. Within the South China Sea (SCS), numerous Cenozoic hydrocarbon-rich basins have revealed the presence of reef-related oil and gas deposits of varying magnitudes, exemplified by the LH11-1 reef oil field located in the Pearl River Mouth Basin (northern SCS) [14,15,16] and the L pinnacle reef gas field situated in the Zengmu Basin (southern SCS) [14,17]. These findings underscore the considerable exploration potential for Cenozoic reef reservoirs in the region. Conversely, Mesozoic bioherms and carbonate reservoirs have been infrequently identified and studied in the SCS to date.
The widespread occurrence of Mesozoic marine strata in the northern SCS was revealed through geophysical surveys and drilling activities. Notably, Lower Cretaceous marine deposits were revealed in the Taixinan Basin [18,19], while Lower Cretaceous transitional strata and organic-rich Middle–Late Jurassic marine sediments were identified in Well LF35-1-1 situated on the northern slope of the Chaoshan Depression (Figure 1b) [20,21]. Prior investigations have systematically mapped the spatial distribution of Mesozoic strata, which extends over an area of 100,000 km2 and have characterized the structural configurations of residual depressions [22,23]. The Chaoshan Depression is noted for having the most extensive Mesozoic coverage, the thickest residual strata, and the highest degree of exploration maturity (Figure 1) [24,25]. However, to date, no significant oil or gas discoveries have been made, as the existing wells have not encountered large-scale, high-quality reservoirs. The LF35-1-1 borehole revealed thin-bedded oolitic limestone from the Middle Jurassic (Figure 2), suggesting that conditions favorable for the formation of carbonate rocks developed during the evolution of the Chaoshan Depression (Figure 1b) [20,23]. Nonetheless, additional systematic research is necessary to clarify the scale, distribution, and formation mechanisms of these carbonate rocks, which would provide valuable insights for guiding future oil and gas exploration efforts in the region.
In recent years, high-quality quasi-3D multi-channel seismic (MCS) data were successfully acquired through the application of single-source/single-cable quasi-3D seismic acquisition technology. This technological innovation has significantly enhanced the image quality of seismic profiles, which provides a clearer depiction of the seismic reflection structures within Mesozoic strata in the Chaoshan Depression. Based on the detailed quasi-3D seismic stratigraphic interpretation, a series of stably distributed high-amplitude geological bodies have been identified in the upper part of the Middle Jurassic located on the Middle Low Uplift of the Chaoshan Depression. The stratigraphic position of these prominent amplitude bodies aligns with the layer of oolitic limestone observed in Borehole LF35-1-1. This study aimed to systematically investigate the geophysical characteristics of Middle Jurassic geological bodies, to explore their sedimentary environment and formation mechanisms in detail, to elucidate their significance in the context of oil and gas geology, and to assess their potential for hydrocarbon resource exploration.

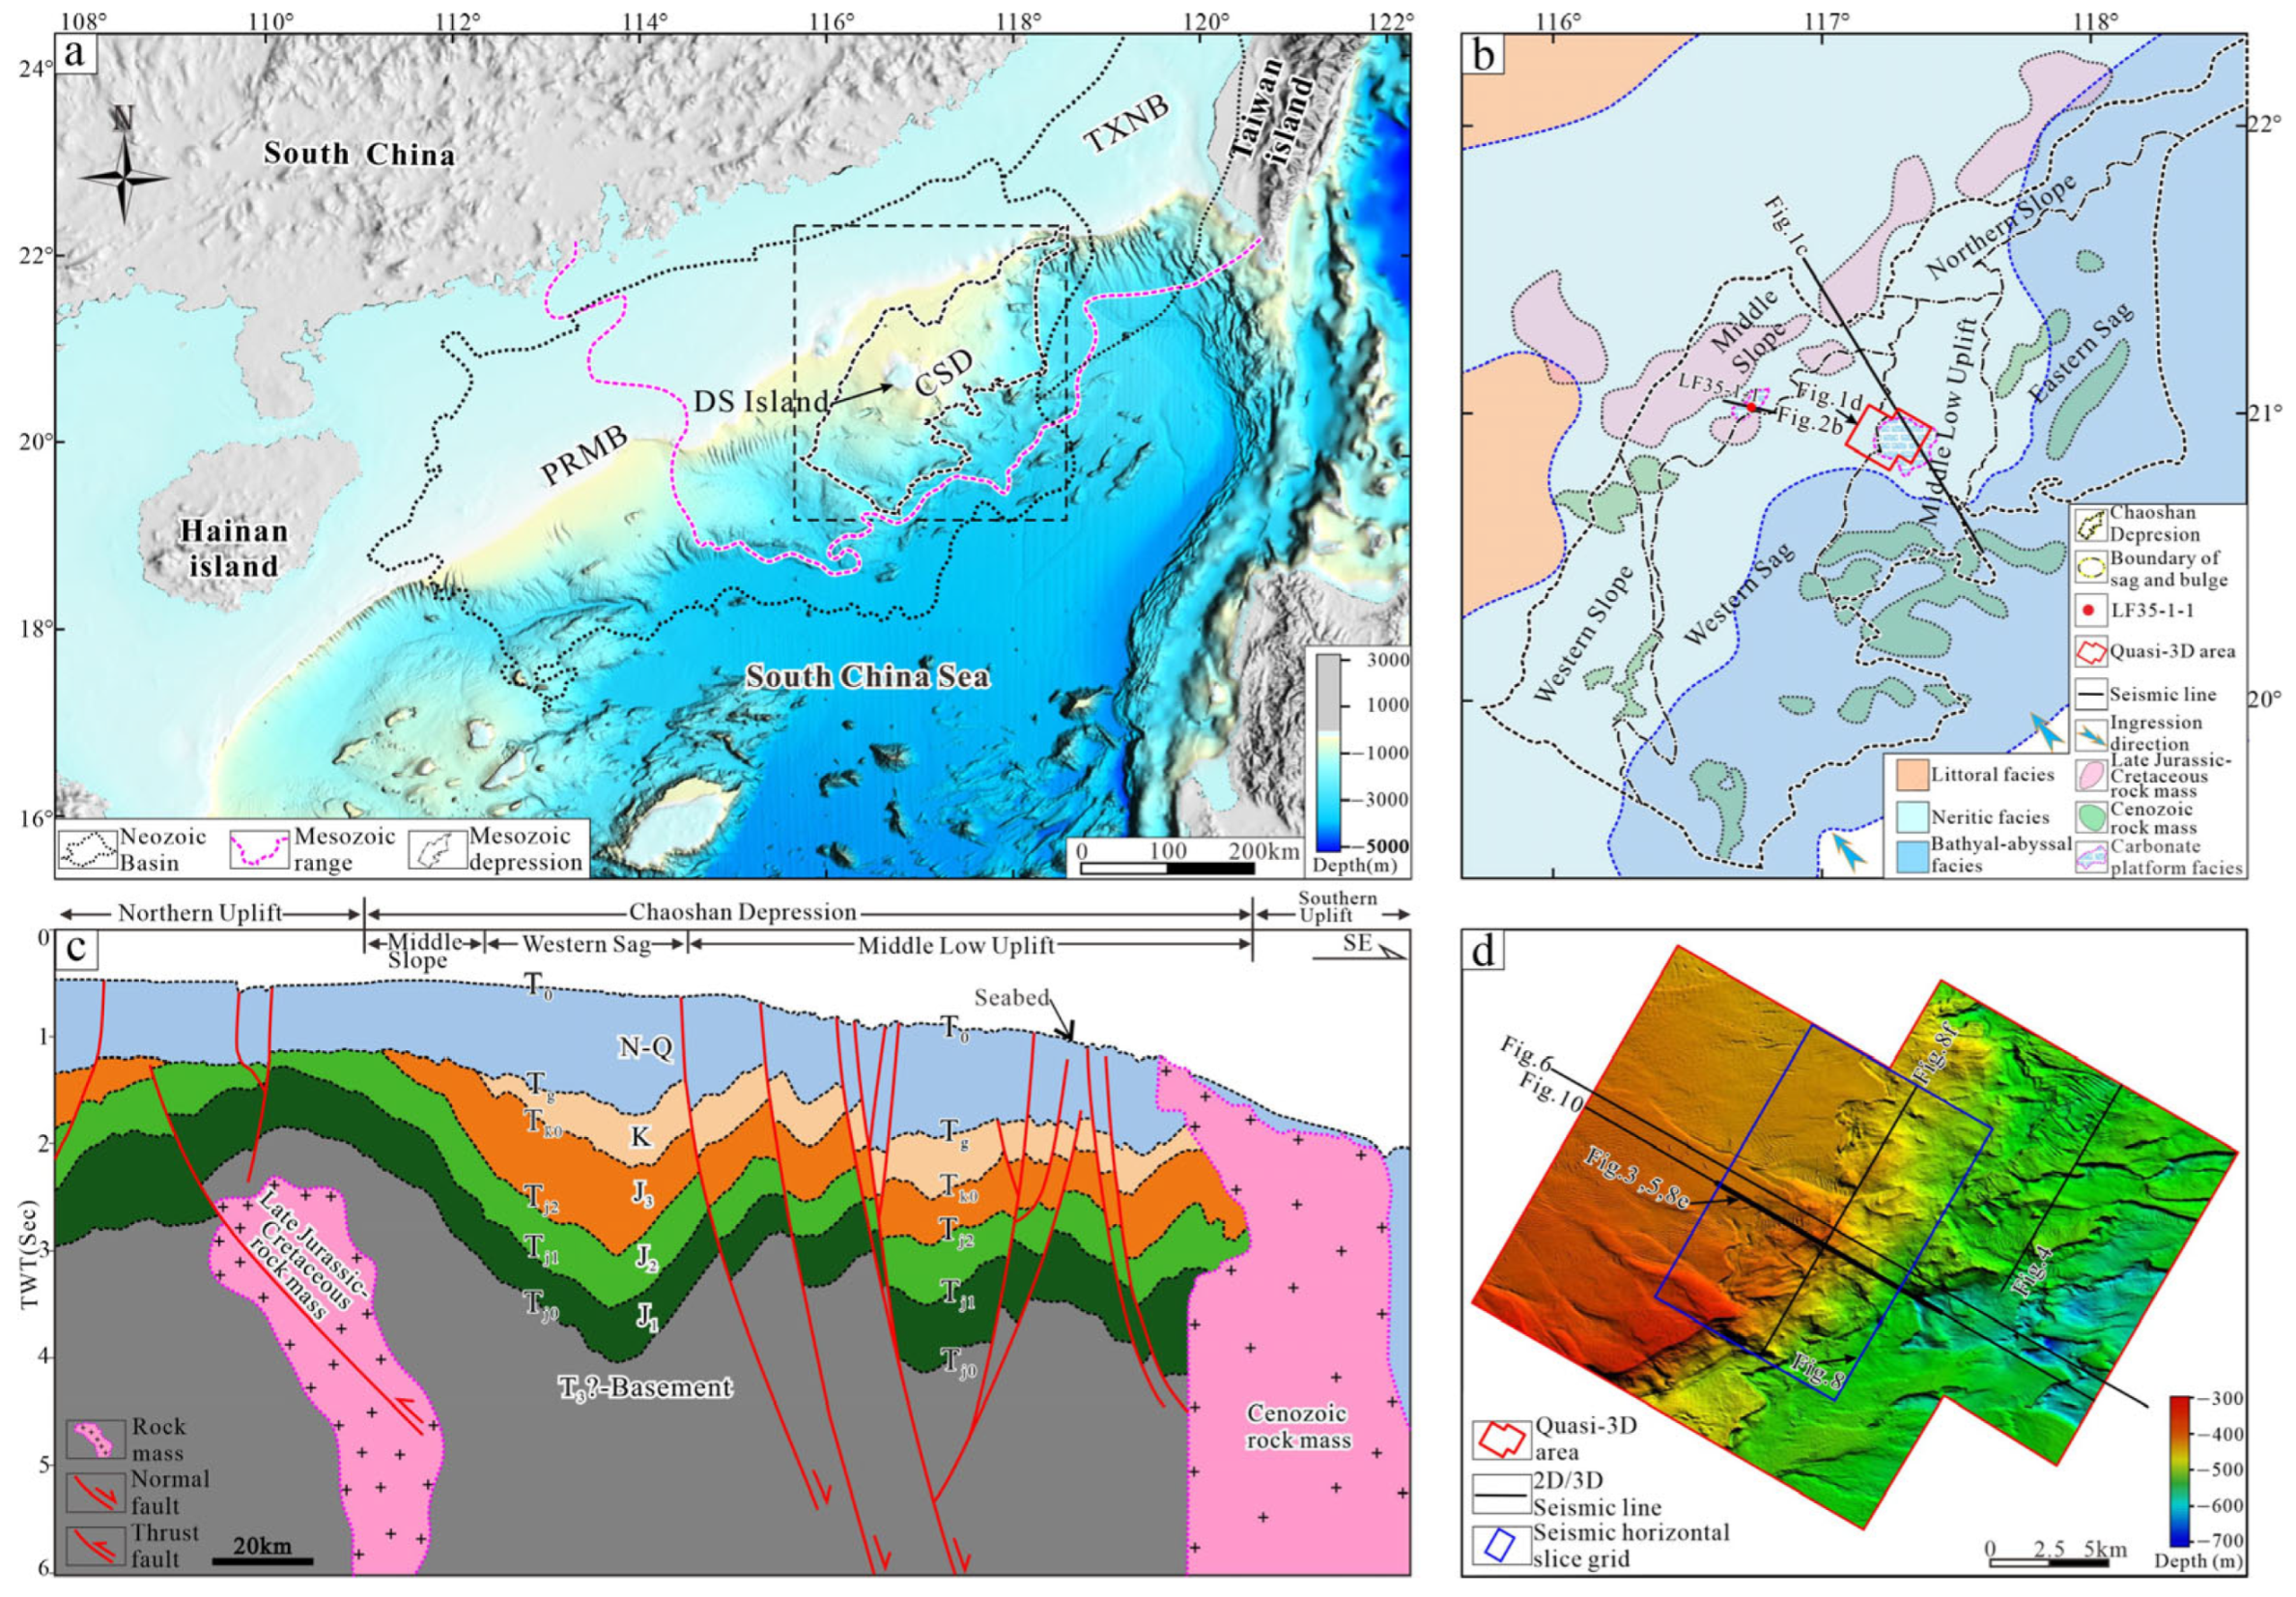
2. Geological Settings

The Mesozoic basins located in the northern SCS are largely superimposed basins that have developed from the overlapping of prototype basins with different evolution characteristics, which have the characteristics of multi-stage basin formation and transformation [23,26]. Since the Late Mesozoic, the Mesozoic basin has undergone prolonged structural uplift, resulting in a reduction in both terrestrial and marine areas, manifesting as residual depressions. However, a significant Mesozoic depression persists in the vicinity of Dongsha Island, where thicker Mesozoic strata are notably well-preserved [23,26,27,28,29,30,31]. The Chaoshan Depression, demarcated by the 1000 m isopach contour of Mesozoic strata and bounded by major fault systems, is the largest preserved Mesozoic residual basin within the continental slope of the northern SCS. It shares northwestern and southwestern boundaries with the Cenozoic Zhu I Depression of the Pearl River Mouth Basin (PRMB) while still separate from the TXNB to the southeast. The depression exhibits water depths ranging from 600 m to 3000 m, encompassing a total area of approximately 3.7 × 10⁴ km2, with its principal axis oriented in a NE–SW direction (Figure 1a) [23,25,28].
Figure 1. (a) Topography map of the northern SCS (after [32]), showing the location of the Chaoshan Depression (CSD). TXNB is Taixinan Basin; PRMB is Pearl River Mouth Basin. The black dotted box indicates the range of Figure 1b. (b) presents the structural units map of the Chaoshan Depression at the end of the Mesozoic, with an overlay of the distribution of Late Jurassic–Cretaceous and Cenozoic volcanic rocks, as well as the predominant sedimentary facies patterns during the Middle Jurassic. (c) is the geological section extending from NW to SE across the Chaoshan Depression, traversing three major structural units: the Middle Slope, Western Sag, and Middle Low Uplift. This profile passes through the quasi-3D seismic study area, with Late Jurassic–Cretaceous igneous rocks observed at the northern end and Cenozoic magmatic complexes exposed at the southern end [33]. See Figure 1b for the location. (d) illustrates the multibeam bathymetric morphological characteristics of the quasi-3D area, with the central area exhibiting pronounced step-like topographic variations. The positions of the main sections mentioned in the text are marked in this diagram.
Jmse 13 01025 g001
The Chaoshan Depression has undergone a series of geological transformations, including initial rifting during the Late Triassic, subsidence in the Jurassic, uplift at the end of the Late Jurassic, rifting in the Cretaceous, and subsequent uplift and denudation at the end of the Cretaceous (Figure 2a) [23]. The primary driving force can be largely attributed to the interactions between the Pacific Plate and the Eurasian Plate [26,28,30]. These geological phenomena, including plate subduction, lithospheric extension and thinning, and mantle-derived thermal activities, collectively played a significant role in shaping the tectonic framework of the depression [19,23,26,28,30,31]. The tectonic architecture of the Chaoshan Depression reveals two first-order structural units: (1) shallow structural domains (<4000 m burial depth), designated as the slope zone, which is further partitioned by major fault systems into three sub-units—the Western Slope, Middle Slope, and Northern Slope; and (2) deep structural domains (>4000 m burial depth), called the depression zone, which contains two primary subsidence centers (Western Sag and Eastern Sag) differentiated by the Middle Low Uplift structure and its associated fault system (Figure 1b) [23,24,25,27,31]. The quasi-3D study area extends approximately 45 km along a NW–SE trend, traversing the Western Sag and Middle Low Uplift structural units (Figure 1b), exhibiting a distinct topographic step (vertical relief exceeding 150 m) in the present-day seafloor morphology (Figure 1d).
Figure 2. (a) The LF35-1-1 well shows Jurassic to Lower Cretaceous sediments that progress upward from littoral to bathyal abyssal and then to humid-terrestrial facies [20]. The Vp curve is modified after [28,34]. The pink solid line illustrates the long-term relative sea-level change curve, which has been adjusted based on [25], while the light blue solid line depicts the short-term change curve, modified according to [28]. Thin-bedded oolitic limestone developed in the upper part of the Middle Jurassic corresponds to a high Vp exceeding background values by 39%. (b) The 2D MSC profile across Well LF35-1-1 and its interpretation. See Figure 1b for the location.
Jmse 13 01025 g002
Seismic profiles across the Chaoshan Depression reveal the presence of a prominent regional unconformity (Tg) separating Cenozoic and Mesozoic strata, representing a ~35 Ma depositional hiatus spanning from the Late Cretaceous to Paleogene [23,24,25,26,27]. The overlying Neogene–Quaternary succession (Tg–T0), typically <1000 m thick, exhibits high–frequency, laterally continuous and sub-parallel seismic reflections. In contrast, the underlying Mesozoic sequence (Tj0–Tg), with maximum preserved thickness exceeding 5000 m, displays low-frequency, discontinuous reflections associated with complex fold structures [26,28]. This pre-Cenozoic stratum is organized chronologically into the following stratigraphic units: (1) Lower Jurassic (Tj0–Tj1), (2) Middle Jurassic (Tj1–Tj2), (3) Upper Jurassic (Tj2–Tk0), and (4) Cretaceous (Tk0–Tg). This arrangement is depicted in the seismic geological interpretation section (Figure 1c).
Integrated analysis of gravity, magnetic, and seismic datasets reveals magmatic activity within the Chaoshan Depression [29,30,35]. Based on regional geological correlations, two primary magmatic episodes were identified: the Late Jurassic–Cretaceous and the Cenozoic periods (Figure 1b). Cenozoic volcanism is predominantly distributed in the southwestern and southeastern sectors of the depression, characterized by extrusive intermediate–basic igneous lithologies. In contrast, Late Jurassic–Cretaceous magmatic activity manifests as intrusive intermediate–acid plutonic complexes concentrated along the northern and central slope regions [33]. Notably, this quasi-3D study area remains unaffected by the development of either Late Jurassic–Cretaceous or Cenozoic igneous rocks (Figure 1b).
The Mesozoic succession penetrated by Well LF35-1-1 (total drilled thickness, ~1400 m; Figure 2) comprises a major sedimentary cycle evolving from Middle Jurassic littoral facies through Late Jurassic bathyal–abyssal facies to Early Cretaceous transitional/terrestrial depositional systems [20]. Drilling operations terminated within a Late Cretaceous indurated granite complex (~102 Ma K–Ar age) (Figure 2a), leading to the geological interpretation that the undrilled substratum likely represents Early Jurassic (J1) and/or Upper Triassic (T3) formations based on regional stratigraphic correlations [30].
Integrated with seismic section interpretation through Well LF35-1-1 [20] (Figure 2b), the Lower Jurassic interval (Tj0–Tj1) in the Chaoshan Depression is interpreted as dominantly comprising bathyal to neritic deposits. The Middle Jurassic (Tj1–Tj2) witnessed a significant paleogeographic reorganization initiated by Pacific tectonic domain influences, marked by southeast–derived marine transgression. The Lower Member of Middle Jurassic (Tj1–Tj1−1) features coastal swamp facies, while the Upper Member (Tj1-1–Tj2) progressively evolves from NW–SE trending coastal facies to shallow marine shelf deposits to bathyal facies (Figure 1b). The depression center, characterized by a distal position from sediment sources and sustained gradual relative sea-level rise during this period (Figure 2a), created optimal conditions for reef–shoal development. This depositional evolution resulted in a Tj1-1–Tj2 sedimentary assemblage dominated by interbedded mudstones, argillaceous siltstones, and limestones. Notably, oolitic limestone exhibiting relatively high P–wave velocities (Vp) was encountered in borehole LF35-1-1 at 1986–2028 m [23,24] (Figure 2a). Geological evidence suggests that the entire quasi-3D study area, situated approximately 60 km from this borehole, resided within shallow marine shelf environments during this phase (Figure 1b). Stratigraphically upward, borehole LF35-1-1 reveals that the lower Upper Jurassic (Tj2–Tj2-1) consists of bathyal facies intercalated with submarine fan deposits, reflecting a gradual transition from neritic to bathyal environments during the Late Jurassic following continuous water deepening since the Middle Jurassic. This sustained transgression rendered reef development increasingly unfavorable. The overlying Cretaceous succession (Tk0–Tg) displays characteristic fluvial–lacustrine lithofacies associations. Critical to the carbonate platform and reef development is the restricted upper member of the Middle Jurassic (Tj1-1–Tj2), which represents the primary stratigraphic target for carbonate reservoir exploration in the study area.

3. Materials and Methods

3.1. Data

Integrated geophysical data (mainly including MCS, gravity, and magnetic data) and borehole LF35-1-1 were used to reveal the development characteristics of Mesozoic strata in the Chaoshan Depression.
MCS data since 2019 with a long array, including a certain 2D network and one quasi-3D survey area of approximately 600 km2, were obtained from the GMGS. The primary parameters for seismic acquisition were as follows [23]: a source capacity of 5080 cubic inches; air guns operating at a pressure of 2000 PSI; source arrays deployed at a depth of 8 m; firing intervals of 25 m; a towed streamer length of 6 km with a minimum offset of 175 m; 480 receiver channels with intervals of 12.5 m for each channel; sampling at 2 ms; a coverage time of 120-fold; a cable sinking depth of around 9 m; and a recording duration of 8 s.
Additionally, the quasi-3D seismic survey was designed with CMP lines as the basis, incorporating a line spacing of 100 m, an original bin size measuring 25 m × 100 m, and an overlap rate of 50% between adjacent bins [25]. The MCS data were processed following standard industry procedures, which include pre-processing, pre-stack denoising, surface-related multiple elimination (SRME), high-precision Radon transforms for suppressing sea-surface-induced multiples, diffraction multiple-wave suppression, amplitude consistency processing, deconvolution, velocity analysis, and pre-stack time migration. Furthermore, the quasi-3D seismic data were subjected to advanced processing techniques, such as bubble effect elimination, frequency band broadening (for ghost wave suppression), and 3D volume regularization with reasonable parameters [25]. These processing techniques improve the discernibility of signals from shallow, intermediate, and deep layers, leading to more distinct wave train and amplitude characteristics. Enhanced seismic images provide a solid basis for the further analysis of complex geological structures and the identification of reservoirs.
The Bouguer gravity anomaly (ΔG-B) and reduced-to-pole magnetic anomaly (ΔT-RTP) data were derived through systematic calculations based on shipborne gravity and magnetic measurements collected simultaneously during the 2D MCS acquisition process. The Bouguer gravity anomaly reflects deep density contrasts after corrections for elevation, topography, and intermediate layers such as seawater and sedimentary deposits [36]. The magnetic anomaly reduced to the pole employs advanced mathematical techniques to convert oblique magnetization into vertical magnetization, effectively eliminating latitude-induced distortions [37]. In sedimentary basin research, these data are utilized to identify weakly magnetic basement uplifts, which are often associated with deep bioherms or carbonate platforms, and to delineate the structural characteristics of sedimentary layers.
The materials of borehole LF35-1-1 primarily stem from datasets released by CNOOC and previously published studies and are used to confirm the presence of Mesozoic strata. These materials mainly include original logging data such as lithological descriptions and P-wave velocity.

3.2. Methods

The 2D and quasi-3D MCS profiles were interpreted to show detailed sedimentary structures, e.g., unconformities, folds, and faults, using the GeoFrame software platform. The stratigraphy was interpreted primarily through correlation with the LF35-1-1 well drilled to the north of Dongsha Island (Figure 1b) and analyzed from seismic stratigraphy. The Chaoshan Depression, a basin characterized by Mesozoic–Cenozoic superposition, is predominantly composed of Mesozoic structural layers. Well–seismic calibration has identified five seismic interfaces (Tj0, Tj1, Tj2, Tk0, Tg, ordered from bottom to top) within the Mesozoic strata. Furthermore, seismic sequence interpretation has delineated the Tj1-1 boundary within the Middle Jurassic and the Tj2-1 boundary within the Upper Jurassic.
Based on the drilling lithology, P-wave velocity, sedimentary environment analysis, and relative sea-level change assessment of LF35-1-1 [28,34], combined with quasi-3D seismic reflection characteristics, the strong–amplitude geological bodies in the upper part of the Middle Jurassic (Tj1-1–Tj2) on the Middle Low Uplift in the Chaoshan Depression are interpreted to be biogenic reefs and carbonate deposits. The velocity structure and gravity–magnetic responses of these deposits are characterized, and their planar distribution and vertical evolution are systematically analyzed using quasi-3D seismic amplitude attributes and depth horizontal slices.

4. Results

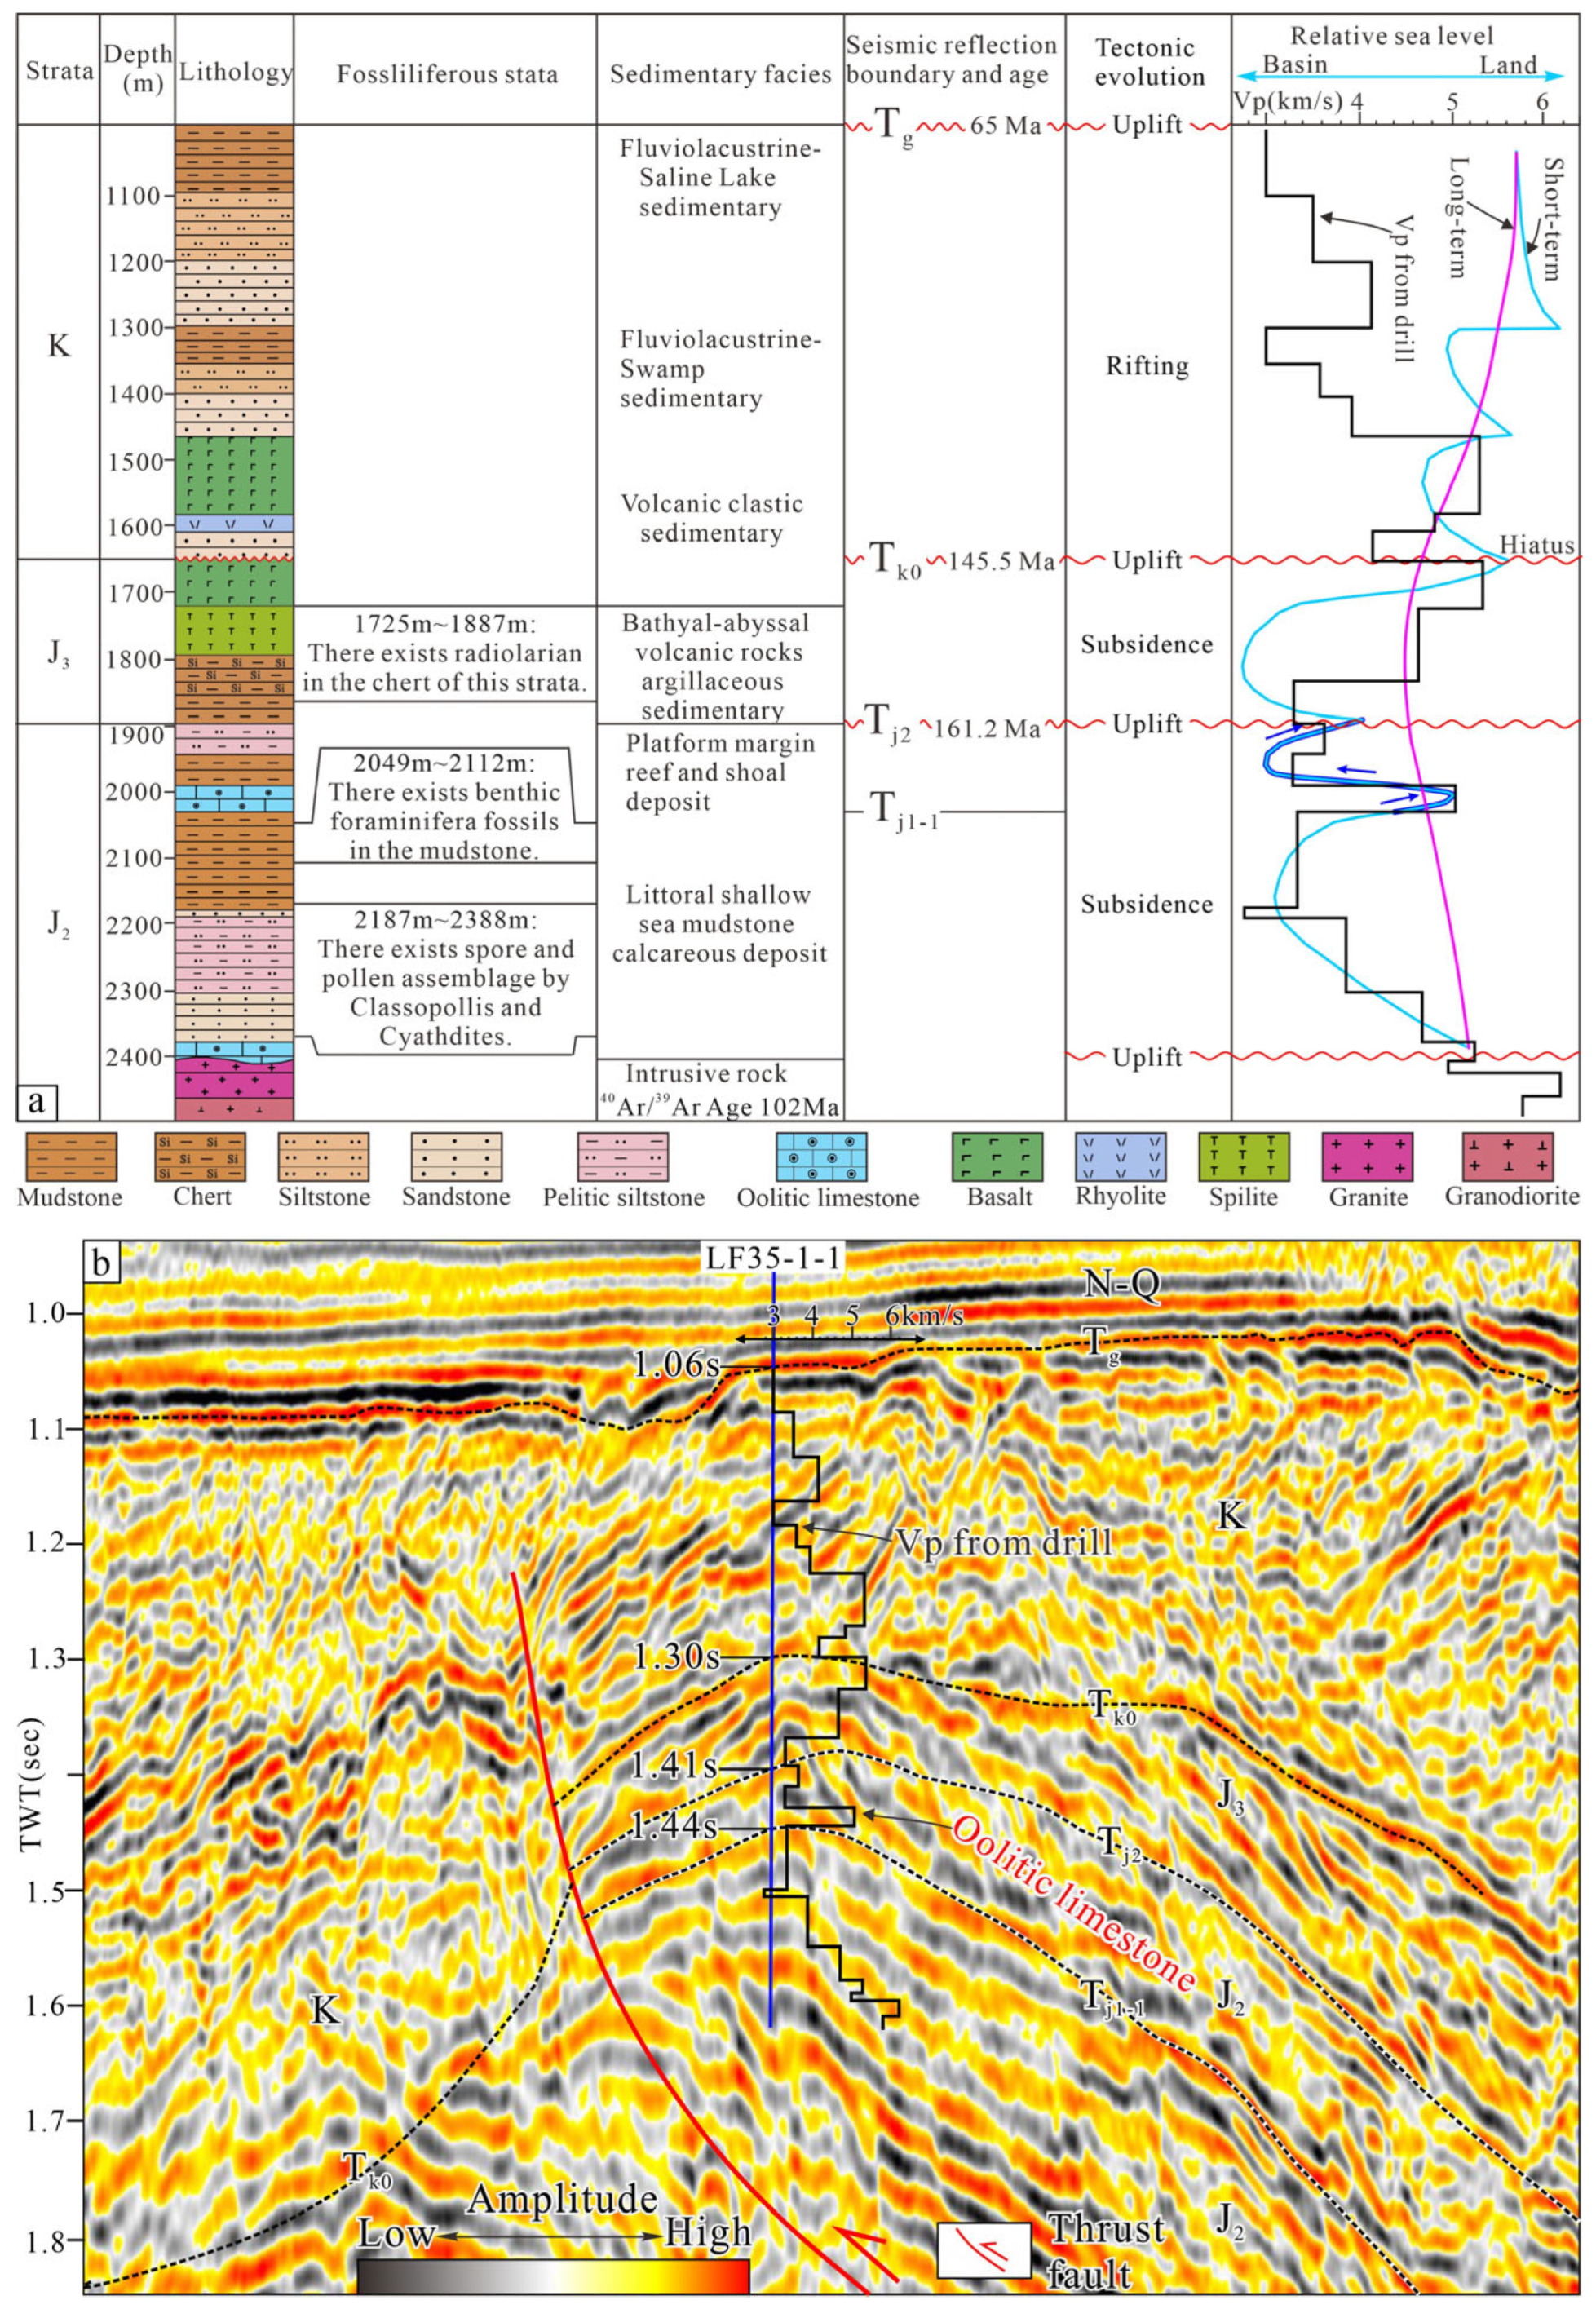
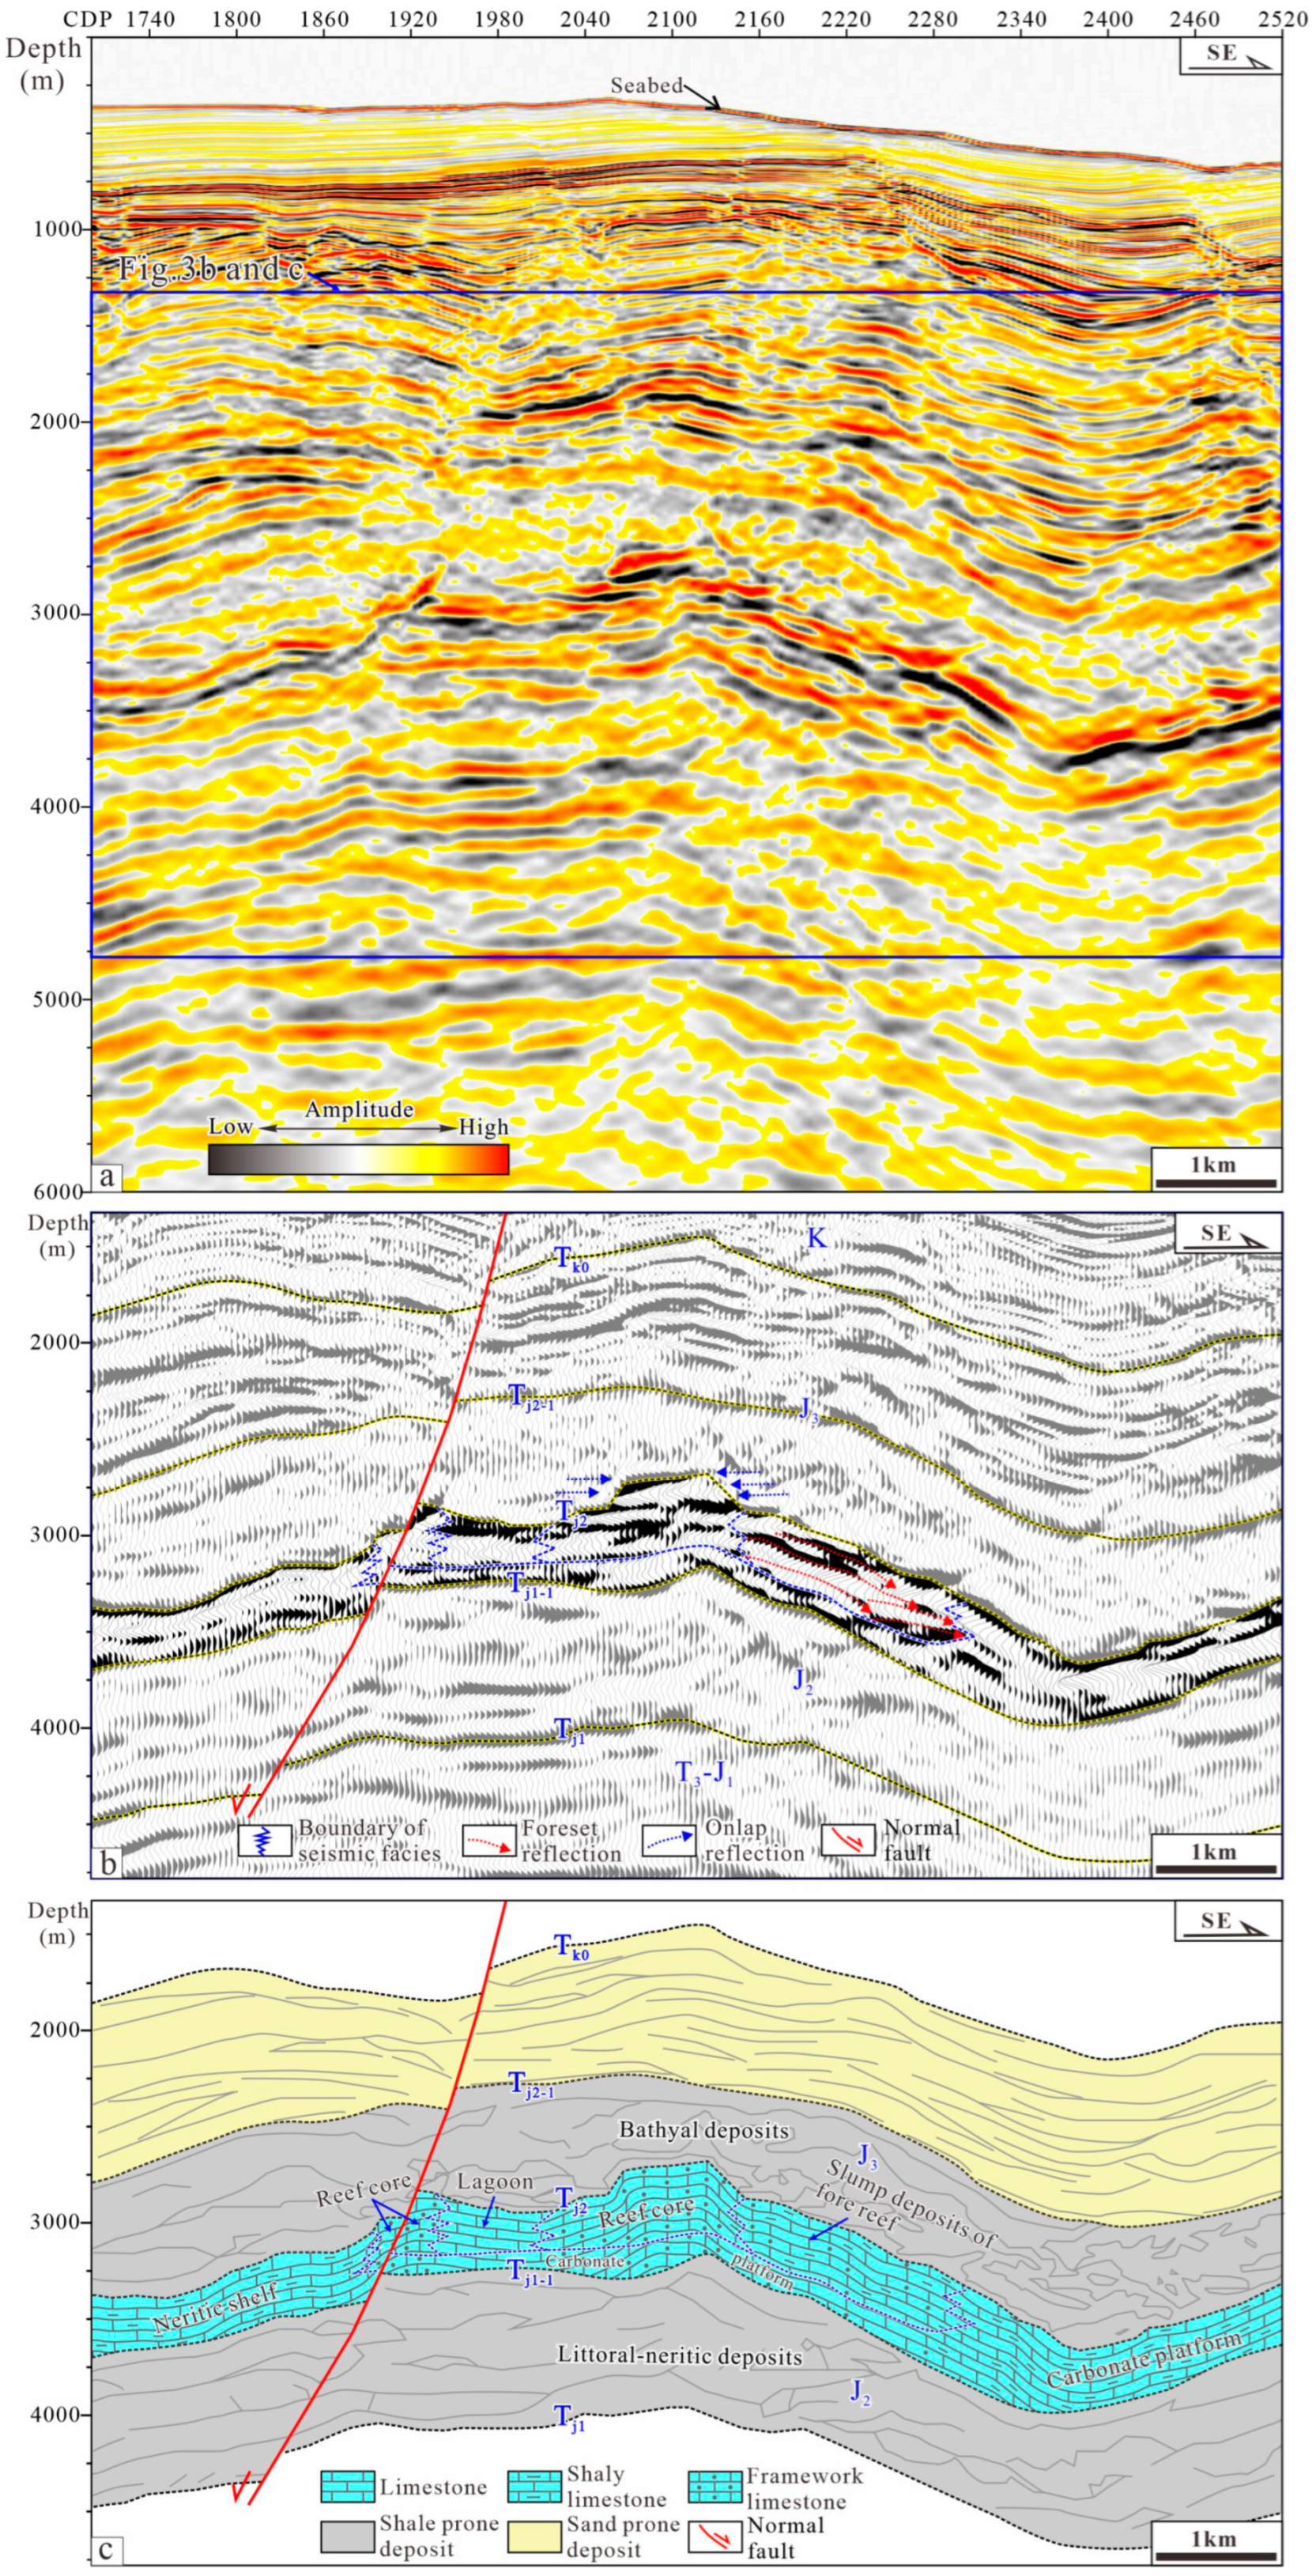
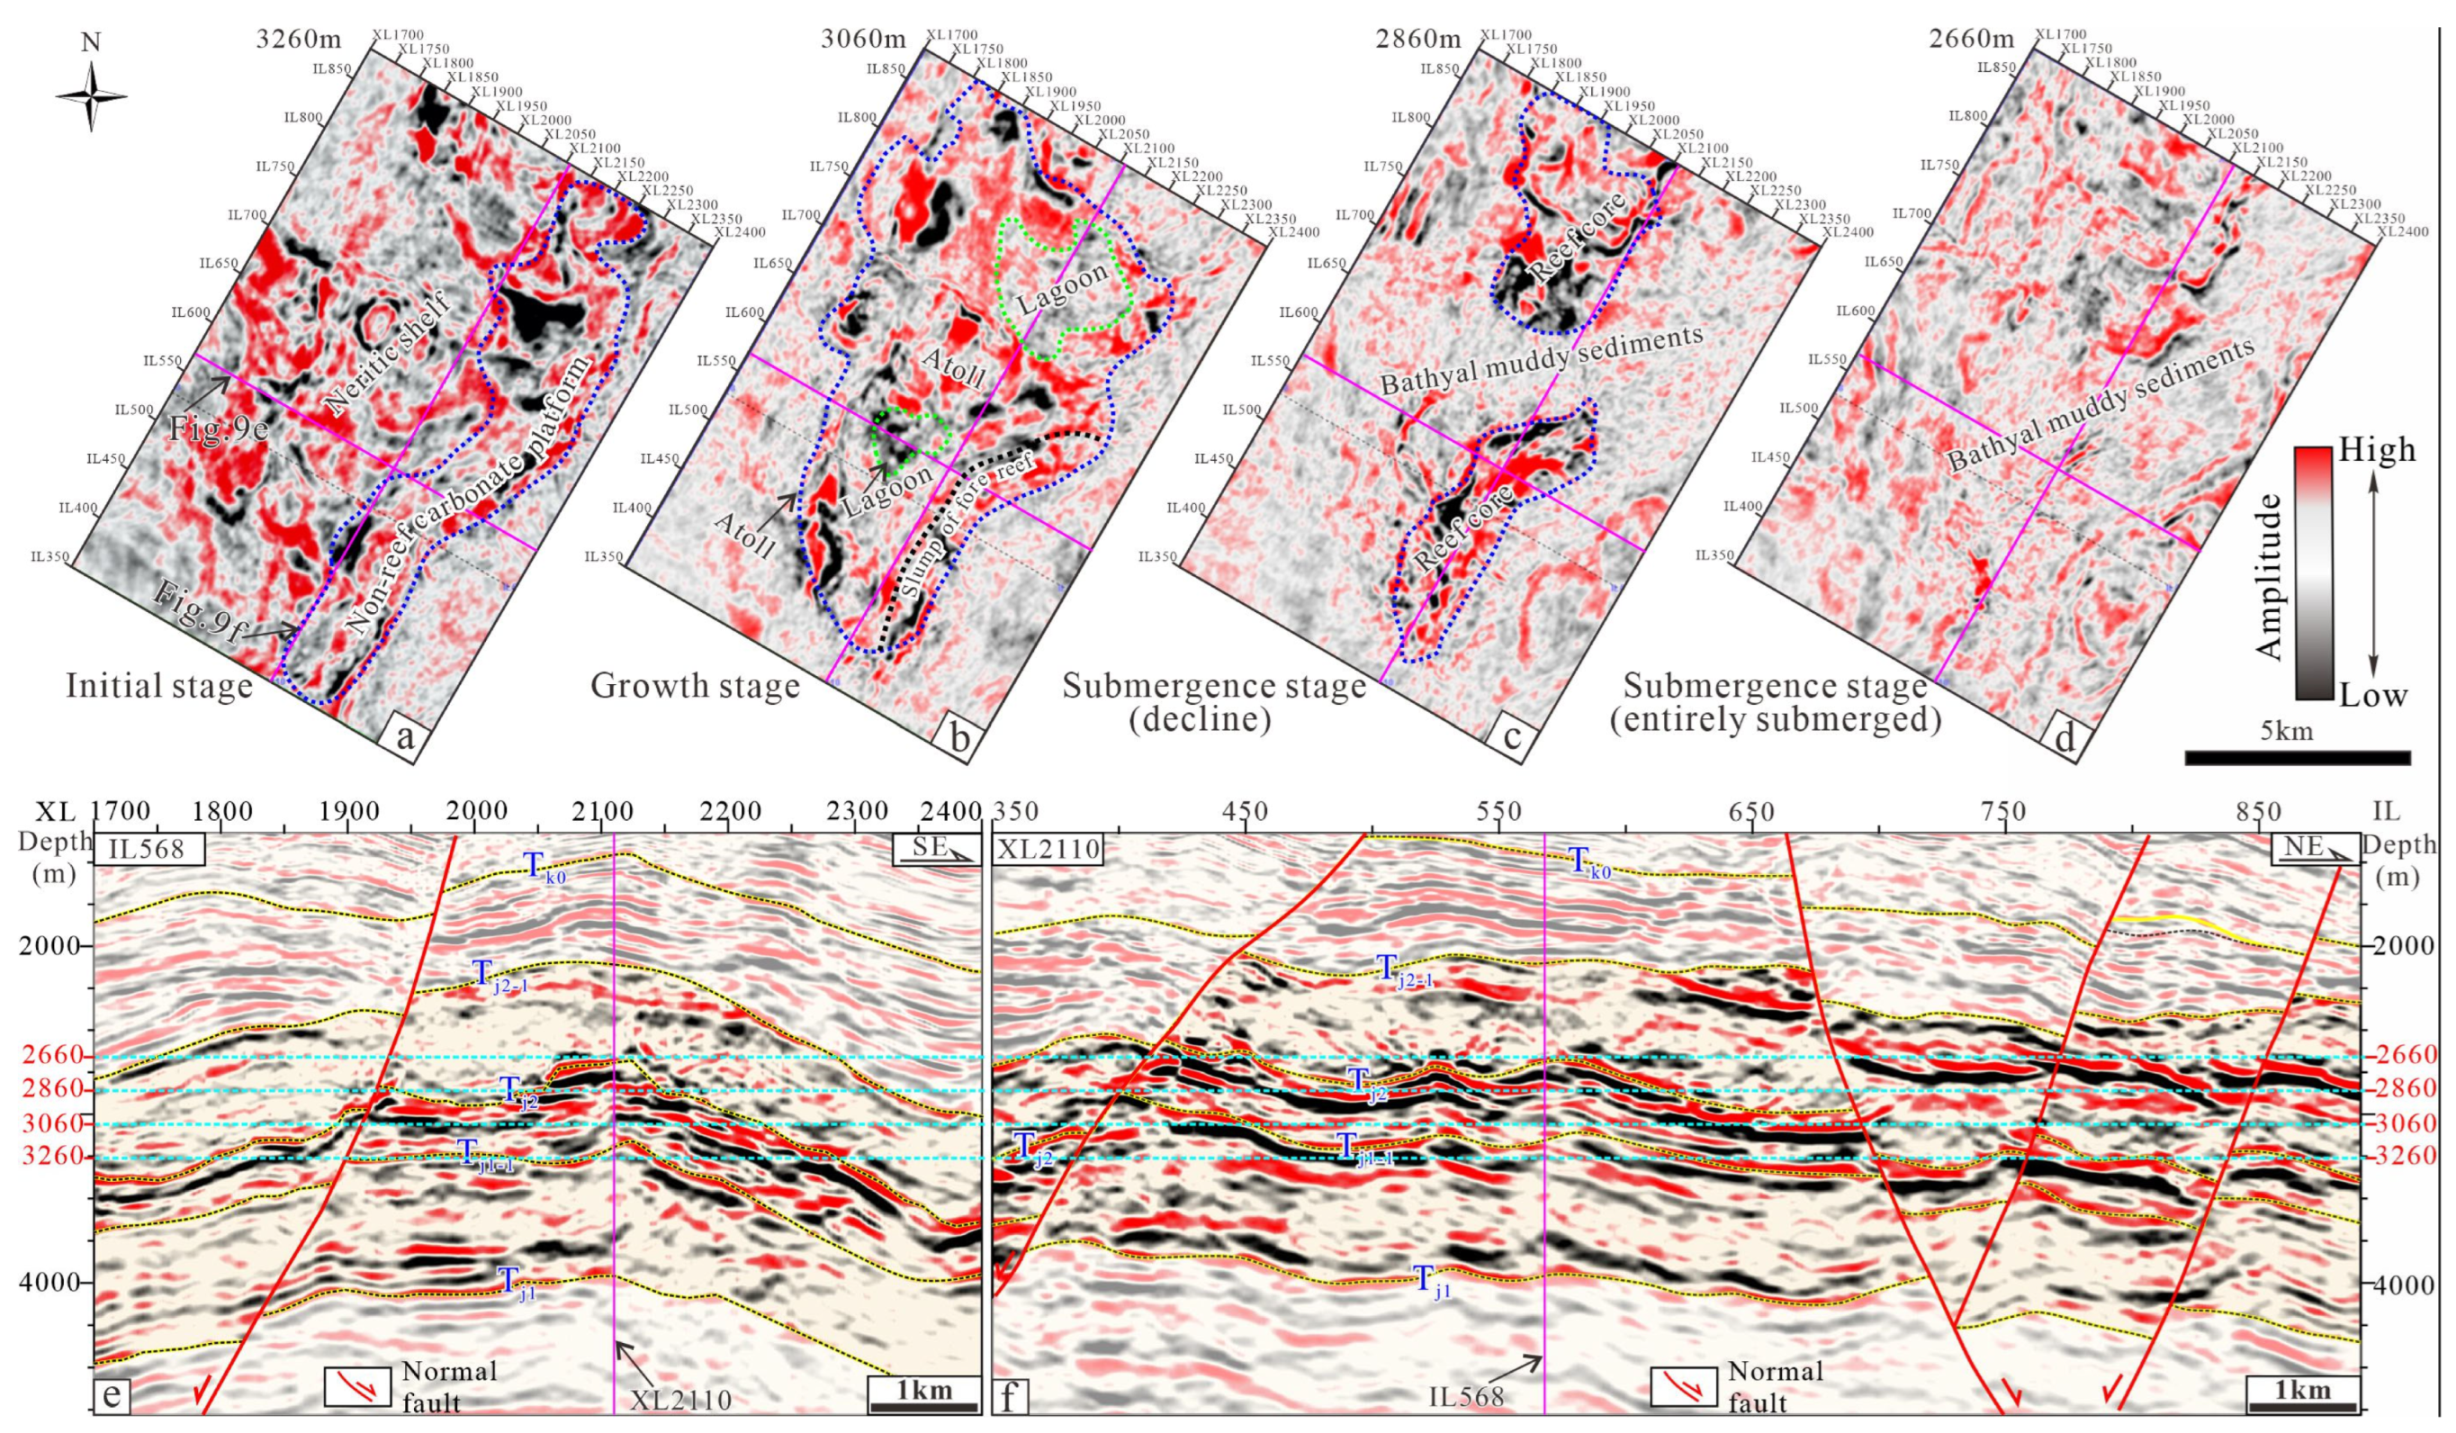
4.1. Seismic Reflection Characteristics

A laterally extensive, high-amplitude seismic anomaly was identified within the upper Middle Jurassic strata (Tj1-1–Tj2) using the quasi-3D seismic data (Figure 3 and Figure 4). This anomaly is distinguished by its heterogeneous internal reflection patterns, which exhibit a variation between discontinuous strong and weak reflections, as well as chaotic reflections, and which are interspersed with localized blank zones or sub-parallel low-amplitude reflections. These seismic facies are interpreted as deposits associated with carbonate platforms, which may correlate with limestone or reef structures.
The Tj2 and Tj1-1 boundaries exhibit significant lateral continuity within the quasi-3D seismic region (Figure 3 and Figure 4). The top boundary, Tj2, is characterized by high-amplitude, strong continuous, and parallel seismic reflections. A notable contrast in seismic reflection and facies is evident between the stratigraphic units situated above and below this boundary. The sequence located above Tj2 is marked by low-frequency, weak-amplitude reflections with moderate continuity, which are interpreted as bathyal muddy deposits from the Upper Jurassic period. In contrast, the strata beneath Tj2 exhibit distinct high-frequency, high-amplitude seismic facies with enhanced continuity and sub-parallel configuration, indicative of the upper part of the Middle Jurassic reef and carbonate platform deposits. The bottom boundary, Tj1-1, of this composite sedimentary succession presents a seismic reflection pattern characterized by a moderate–To–weak amplitude, with localized zones displaying laterally discontinuous reflections or even non-reflective features. This phenomenon is primarily attributed to the significant attenuation of the seismic signal, which is caused by the strong reflections from the overlying strata. The strata located beneath Tj1-1 reveal low–to–medium frequency seismic reflections with weak amplitude and poor continuity, suggesting a littoral–shallow marine muddy depositional environment during the early Middle Jurassic period.
The distinctive mound-shaped seismic reflections have been interpreted as reefs that formed on the local topographic highs at the margin of the platform. Through an analysis of the developmental regions and the morphological characteristics of the reefs, three distinct types of reefs have been classified: atoll reefs (Figure 3), stratified reefs, and patch reefs (Figure 4).
Atolls are characterized by the mound-shaped morphology observed in seismic profiles. The top boundary of the atolls is featured by continuous high-amplitude seismic reflections, while the internal structure exhibits 1–3 sub-parallel or chaotic reflection events (Figure 3a,b). In comparison to the surrounding contemporaneous sedimentary strata, the reef core of the atolls shows a notable thickening phenomenon. The overlying strata on either side of the reef core exhibit overlapping characteristics around the atolls. Lagoon deposits are characterized by continuous and parallel weak reflections. The atoll system comprises multiple encircling reefs and a central lagoon, with a diameter ranging from approximately 5 to 8 km. The progradational reflection configurations observed at the base of the slope have been interpreted as fore-reef landslides originating from the reefs at the periphery of the atoll system (Figure 3c).
Stratiform reefs are distinguished by predominantly layered seismic reflections that exhibit a blocky morphology in seismic profiles (Figure 4a,b). Both the top and the bottom of stratiform reef complexes are characterized by continuous high-amplitude reflections, which are clearly demarcated from the surrounding medium–weak reflection strata. The overlying strata of the reefs overlap around the top boundary. The internal structure of the stratiform reef complexes comprises 1 to 2 sub-parallel and strong continuous reflection events, which resulted from the vertical stacking of multiple massive reef phases at identical locations (Figure 4b,c).
Patch reefs are distinguished by their isolated, mound–shaped morphology, exhibiting nearly symmetrical flanks (Figure 4a,b). The top boundary of the patch reef is characterized by continuous high-amplitude reflections, whereas the lower boundary is marked by discontinuous medium to weak reflections, indicating a relatively unclear contact relationship with the underlying strata of the reefs. The internal structure of the patch reef is predominantly characterized by weak amplitude or blank reflections. The dimensions of individual patch reefs are relatively small, typically ranging from approximately 1 to 1.5 km in diameter (Figure 4b,c).

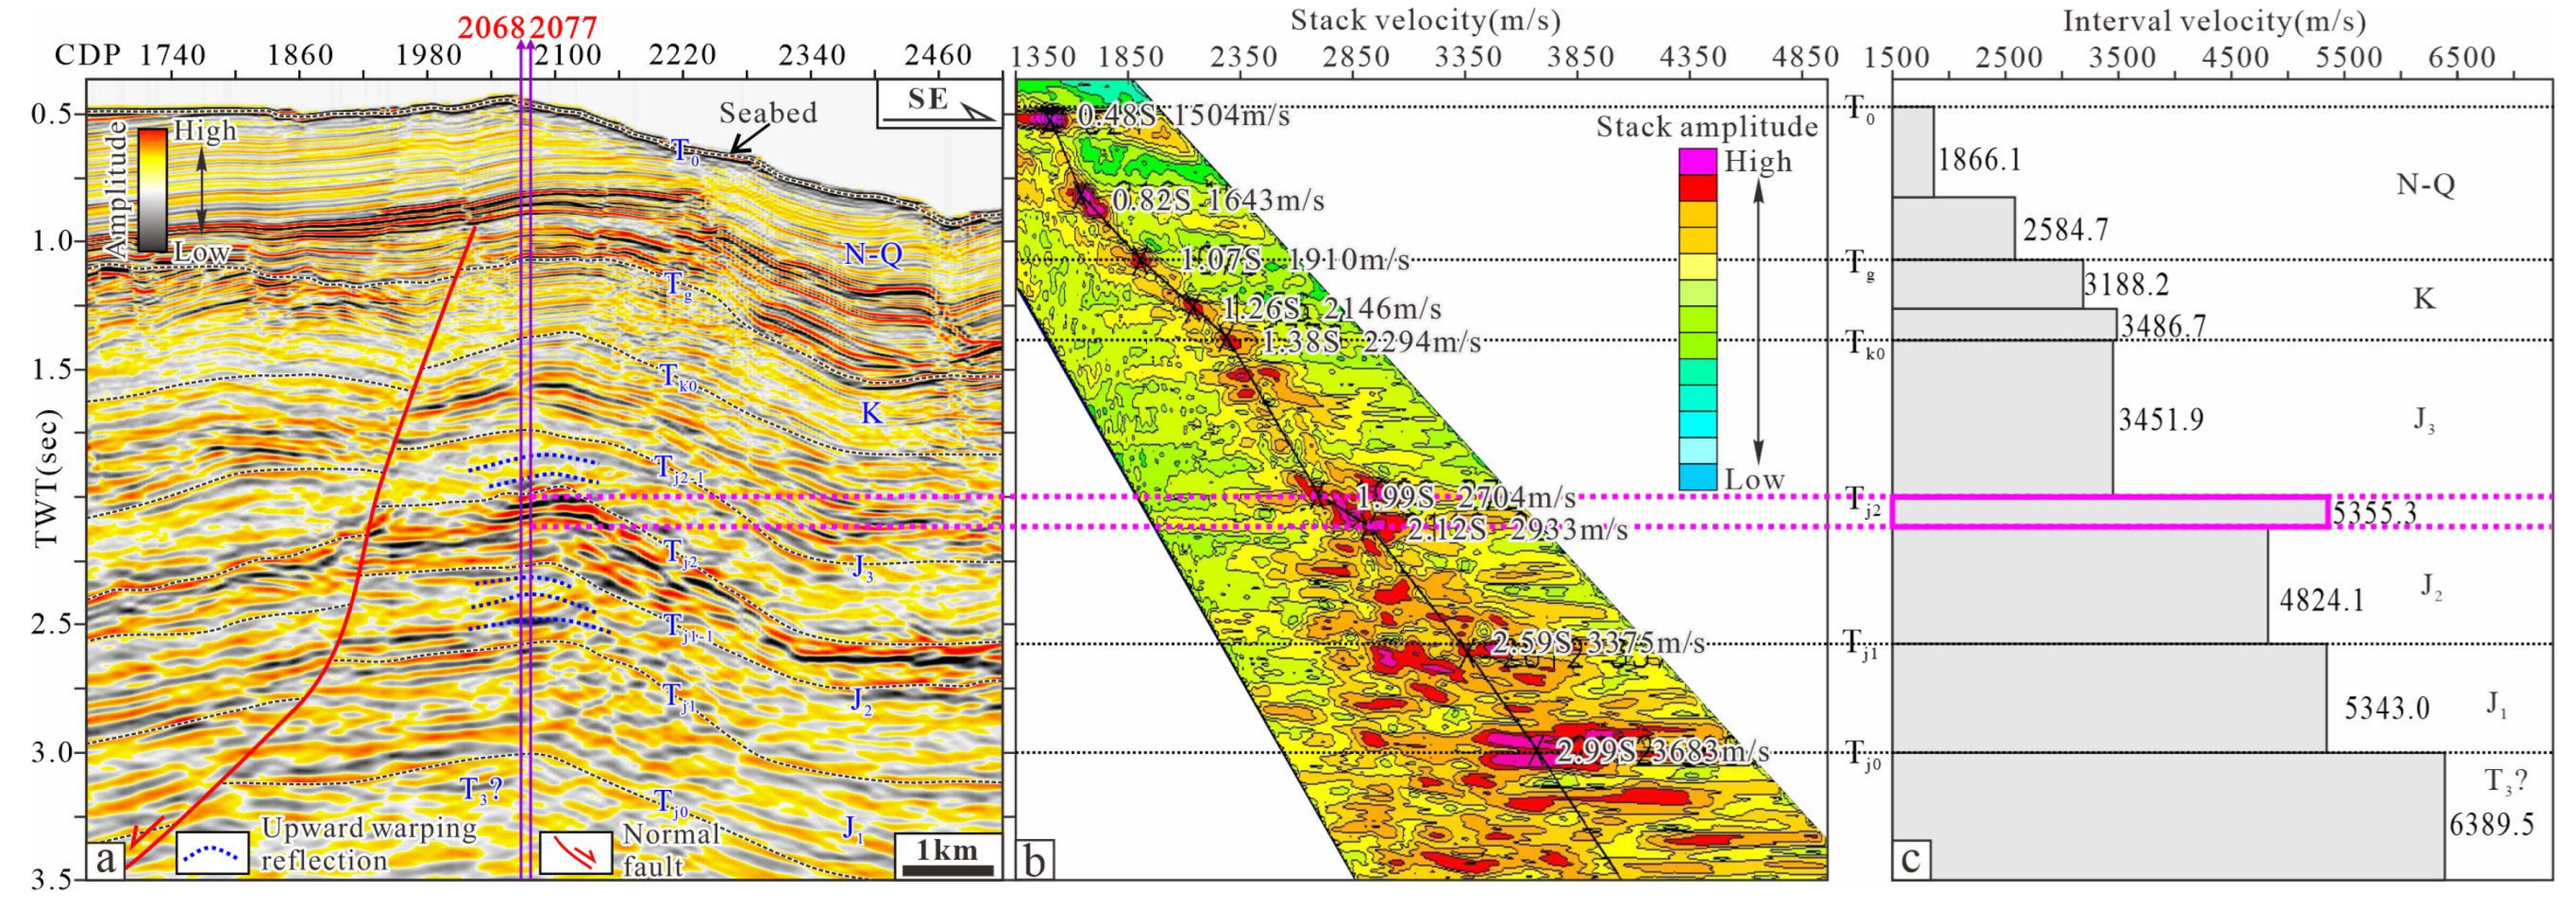
4.2. Seismic Velocity Anomaly

The reflection events above and below the reef structure display upward warping pull-up effects in the time-domain seismic sections attributed to the higher seismic wave propagation velocity within the reef and carbonate (Figure 5a). Compared with the overlying and underlying strata, the reef and carbonate exhibit stronger energy on the seismic stack velocity spectrum of CDP 2068–2077 (Figure 5b), which corresponds to high-amplitude anomalies in the seismic profile.
Furthermore, the reef and carbonate show high-velocity anomalies on the seismic interval velocity profiles (Figure 5c), with the following interval velocities: an interval velocity of 3451.9 m/s in the Upper Jurassic strata (Tk0–Tj2); a pronounced high interval velocity of 5355.3 m/s in the top part of the Middle Jurassic, which contrasts with the lower section velocity of 4824.1 m/s; an interval velocity of 5343.0 m/s in the Lower Jurassic strata (Tj1–Tj0); and an interval velocity of 6389.5 m/s in the basement. It is worth noting that the high-velocity layer at the top of the Middle Jurassic sequence is closely correlated with the seismic reflections attributed to reefs and carbonates.

4.3. Gravity and Magnetic Anomaly

Reefs and carbonate complexes exhibit unique gravity and magnetic anomaly signatures (Figure 6). The gravity and magnetic anomalies analyzed along 2D seismic profiles that traverse the quasi-3D area exhibit notable spatial variation patterns. Specifically, the Bouguer gravity anomaly displays a characteristic tripartite pattern, exhibiting an “elevated–depressed–elevated” trend from the northwest to the southeast. Conversely, the reduced-to-pole (RTP) magnetic anomaly shows a consistent decreasing trend along the same section. Quantitative analyses reveal that the reefs and carbonate deposits situated within the central local topographic high regions of the quasi-3D area correspond to positive gravity anomalies reaching +16.5 mGal, suggesting high-density characteristics. Simultaneously, the presence of low magnetic anomalies measuring about 36 nT indicates weak magnetic characteristics within these carbonate-dominated regions (Figure 6b).

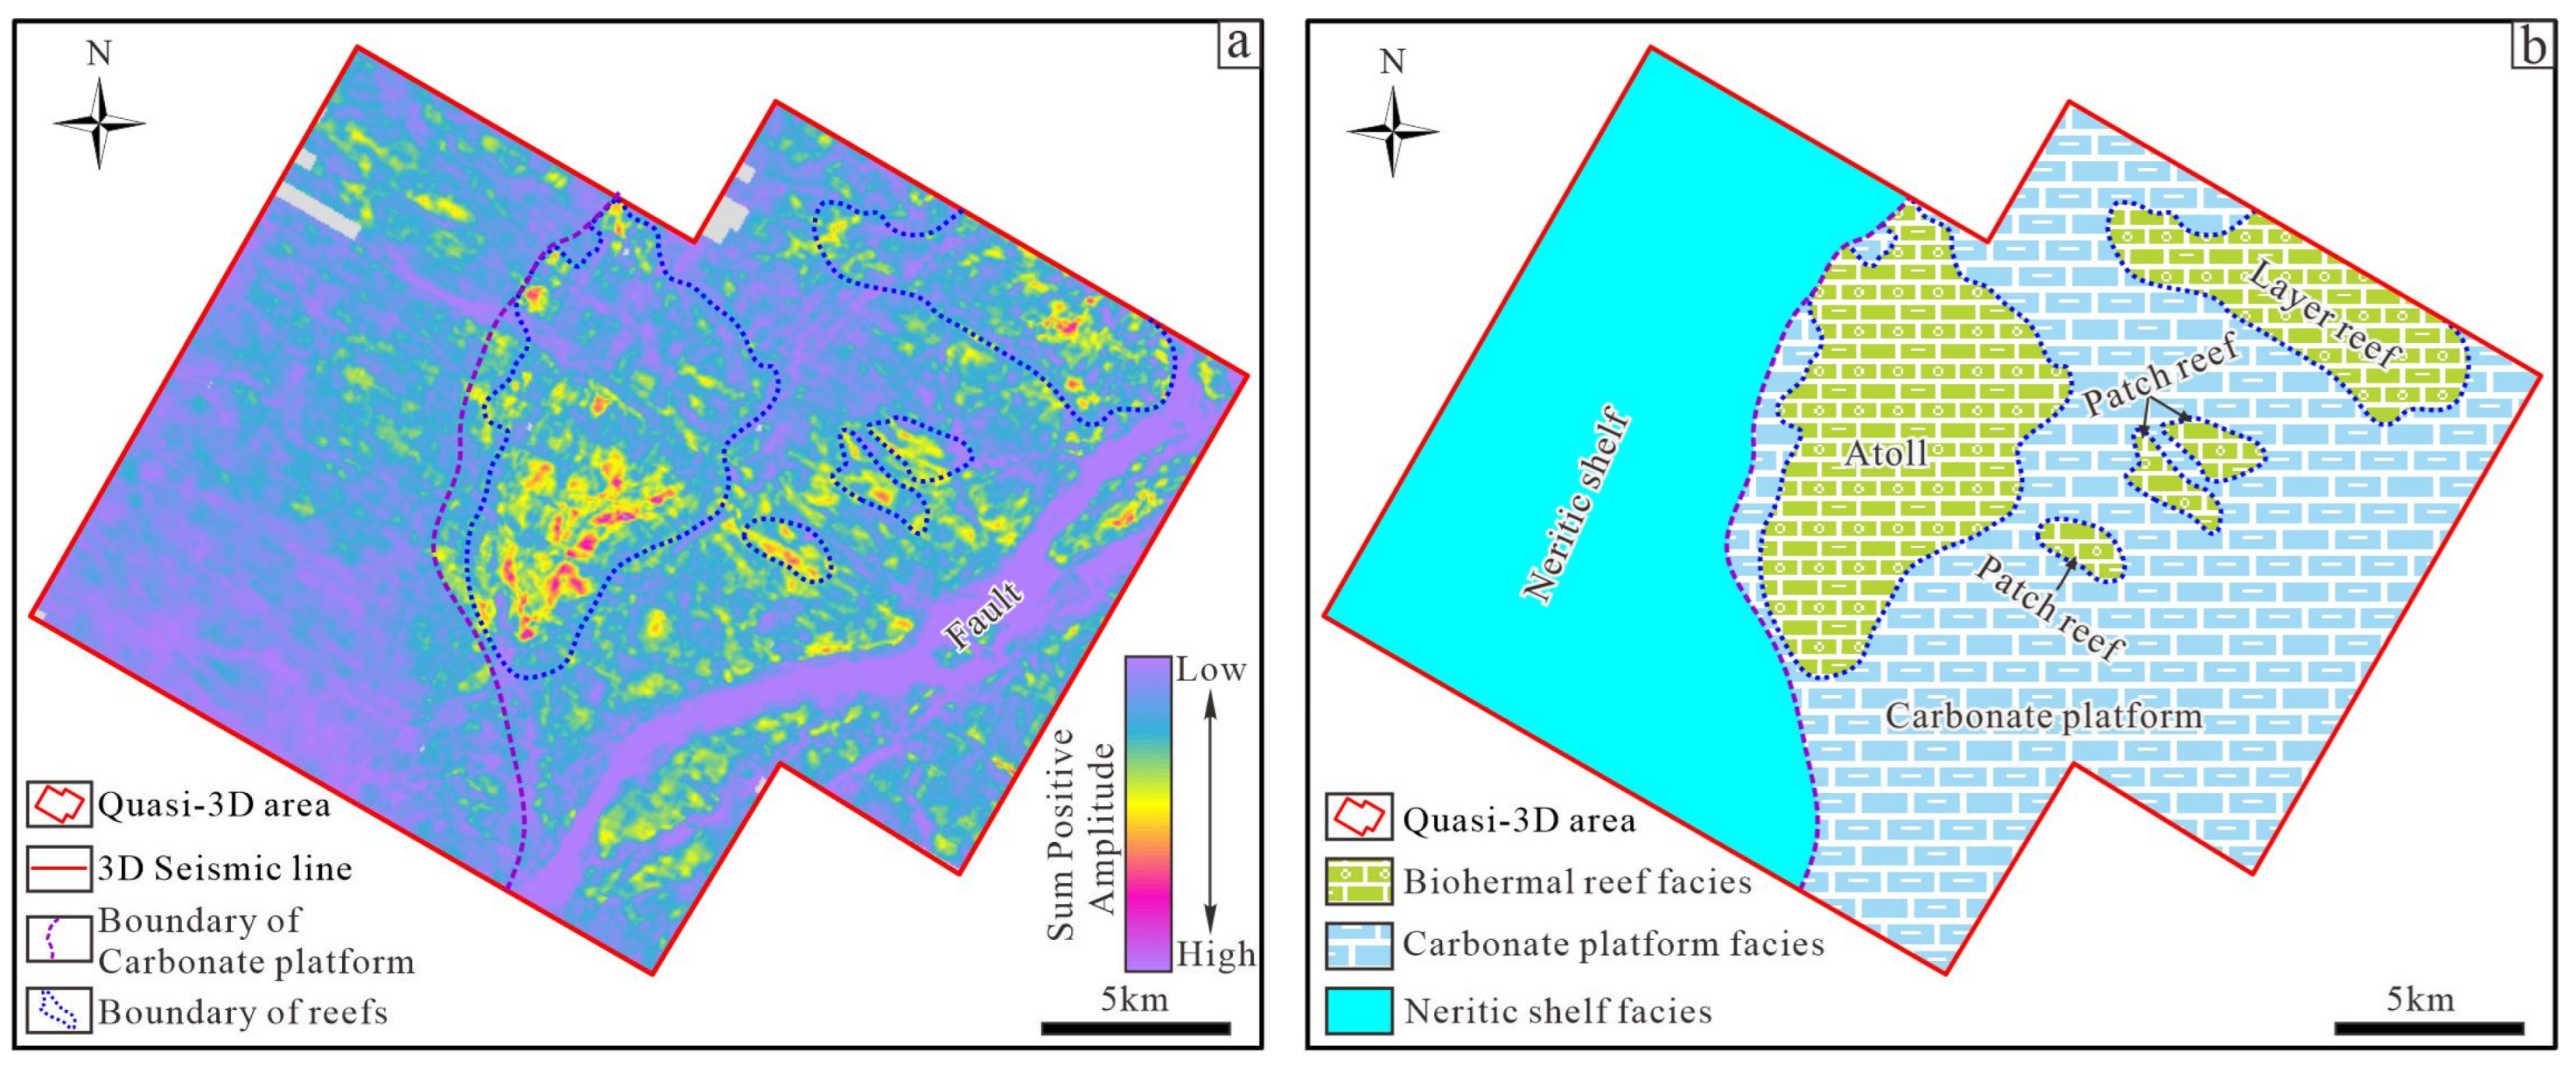
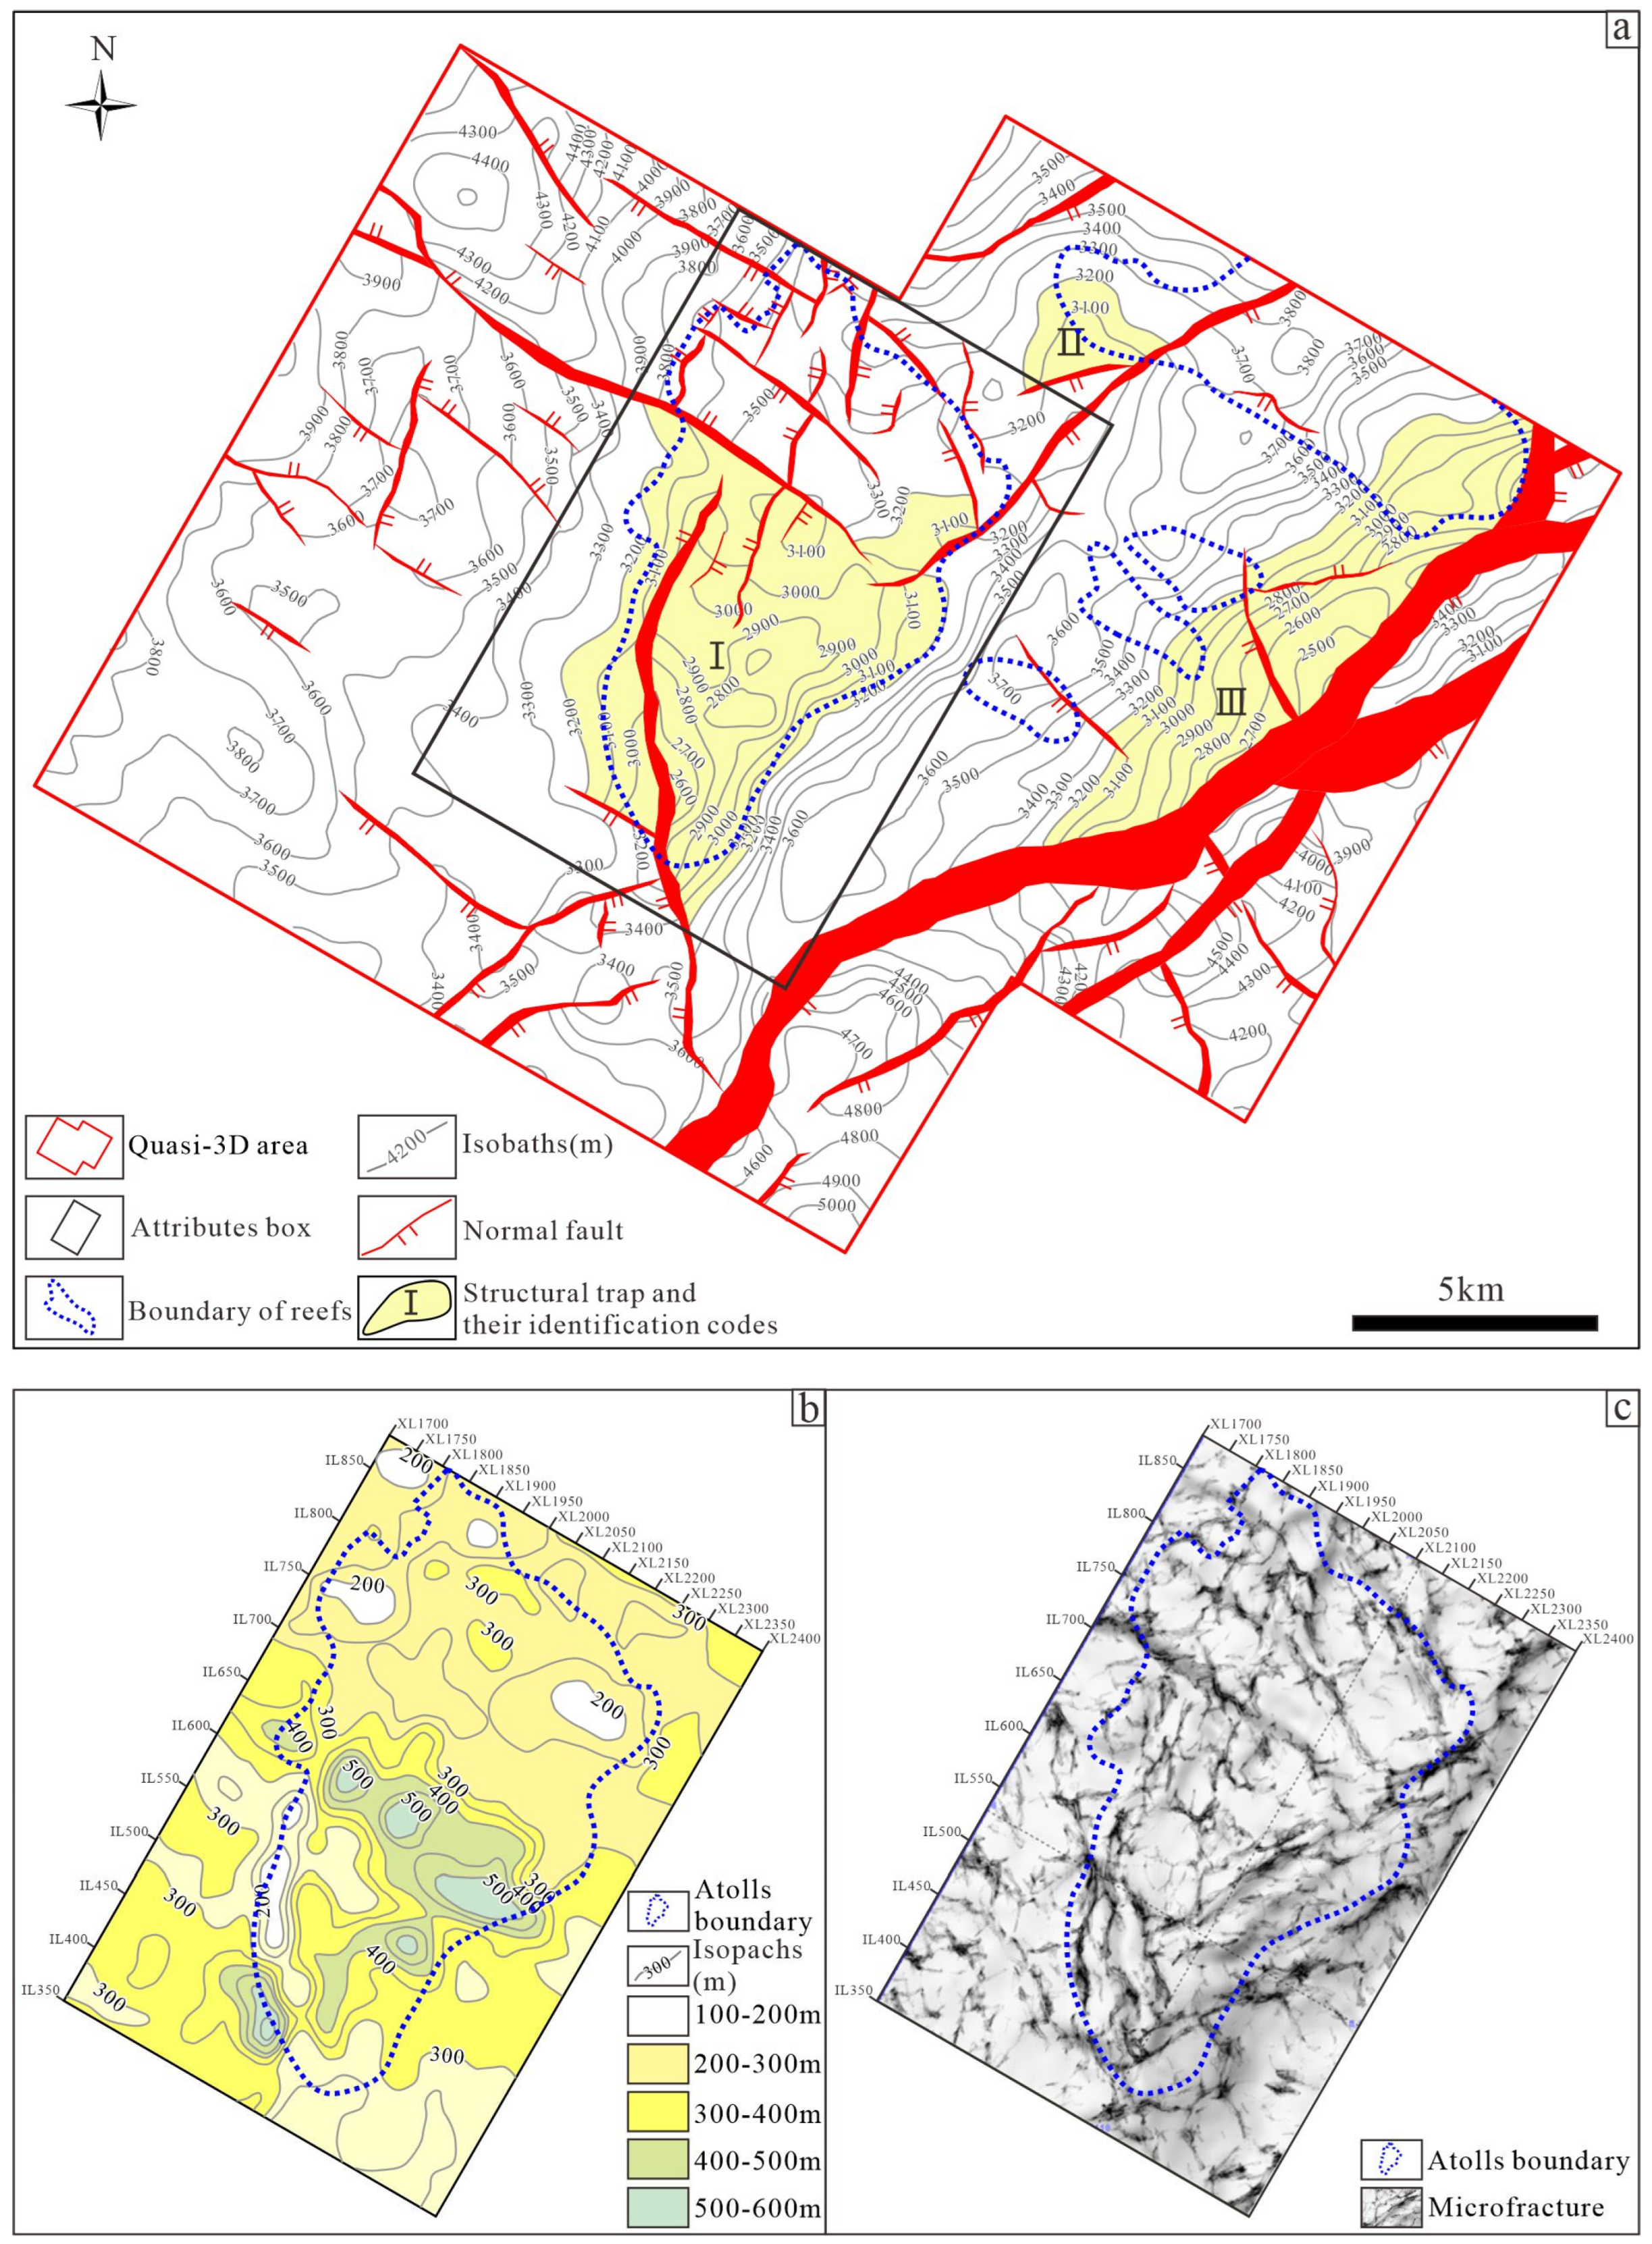
4.4. Distribution and Scale of Reefs and Carbonate Platforms

Based on an integrated analysis of seismic reflection configurations and velocity characteristics, the “sum positive amplitude” attribute can provide an effective indirect indicator for mapping the distribution of biogenic reefs and carbonate platform deposits within the upper part of the Middle Jurassic (Tj1-1–Tj2) of the study area.
The “sum positive amplitude” attribute extracted along the Tj2 boundary reveals distinct amplitude difference characteristics, which can be subdivided into two geophysical domains: an eastern high-amplitude zone and a western low-amplitude zone. These are separated by a dashed purple boundary line in Figure 7a. An integrated seismic facies analysis of corresponding seismic profiles reveals significant differences in depositional environments between these regions. In the eastern high-amplitude zone, seismic facies within the upper member of Middle Jurassic strata are characterized by a strong amplitude, moderate-to-high continuity reflections with sub-parallel or slightly chaotic configurations (Figure 3 and Figure 4). These seismic signatures are interpreted to represent carbonate platform depositional environments (Figure 7b). Conversely, the western low-amplitude area exhibits seismic facies characterized by low-amplitude, discontinuous reflections, or even blank reflections (Figure 3 and Figure 4). These features suggest the presence of shallow marine shelf facies, primarily composed of mudstone interbedded with argillaceous limestone lithologies (Figure 7b).
Localized ultra-high-amplitude anomalies have been observed within the eastern high-amplitude zone (Figure 7a). These anomalies are interpreted as indicative of various reef types that have developed on the carbonate platform, including atolls, stratiform reefs, and dispersed patch reefs (Figure 7b). Notably, atolls are primarily located in the central region of the quasi-3D survey area, covering approximately 60 km2. Stratiform reefs are mainly distributed in the northeastern area, with a mapped extent of 36 km2, although this is limited by data deficiencies. Patch reefs are concentrated in the central–eastern portion of the study area, displaying bead-like planar distribution patterns, with individual reef sizes ranging from 9 km2 to 11 km2 (Figure 7b).

5. Discussion

5.1. Identification Marks of Reefs and Carbonate Platforms

Reef and carbonate typically manifest as anomalous geological bodies within layered seismic reflections. However, multiple geological factors can generate such seismic anomalies [16,38,39]. The most commonly encountered and easily confused analog is intrusive igneous bodies, which exhibit seismic characteristics remarkably similar to those of reef complexes [40]. This includes major features such as the following: (1) strong reflection at the upper interface; (2) flank onlap configurations; (3) internal chaotic reflections; (4) convex morphology with overlying drape structures; (5) distinct velocity anomalies [12,38,40,41,42,43]. Nevertheless, igneous bodies typically exhibit more undulating top surfaces with discontinuous reflections [38,40]. In contrast, the reef complexes in our study area demonstrate continuous top reflections accompanied by characteristic paleo-topographic highs and platform–margin slump progradational reflections (Figure 3 and 4). Additionally, the reefs and carbonate platform limestones show significant high-velocity (Figure 5), high Bouguer gravity and low reduced-to-pole (RTP) magnetic anomalies (Figure 6). These attributes are distinctly dissimilar to the geophysical signatures commonly associated with igneous bodies. Concurrently, the quasi-3D area within the depression has remained largely unaffected by Late Jurassic–Cretaceous and Cenozoic magmatic activities on planar distribution patterns (Figure 1b). Based on these observations, it is inferred that the high-velocity, strong-reflection geological bodies located in the upper part of the Middle Jurassic are more likely indicative of carbonate platform and bioherm facies, rather than igneous intrusions (Figure 1b).

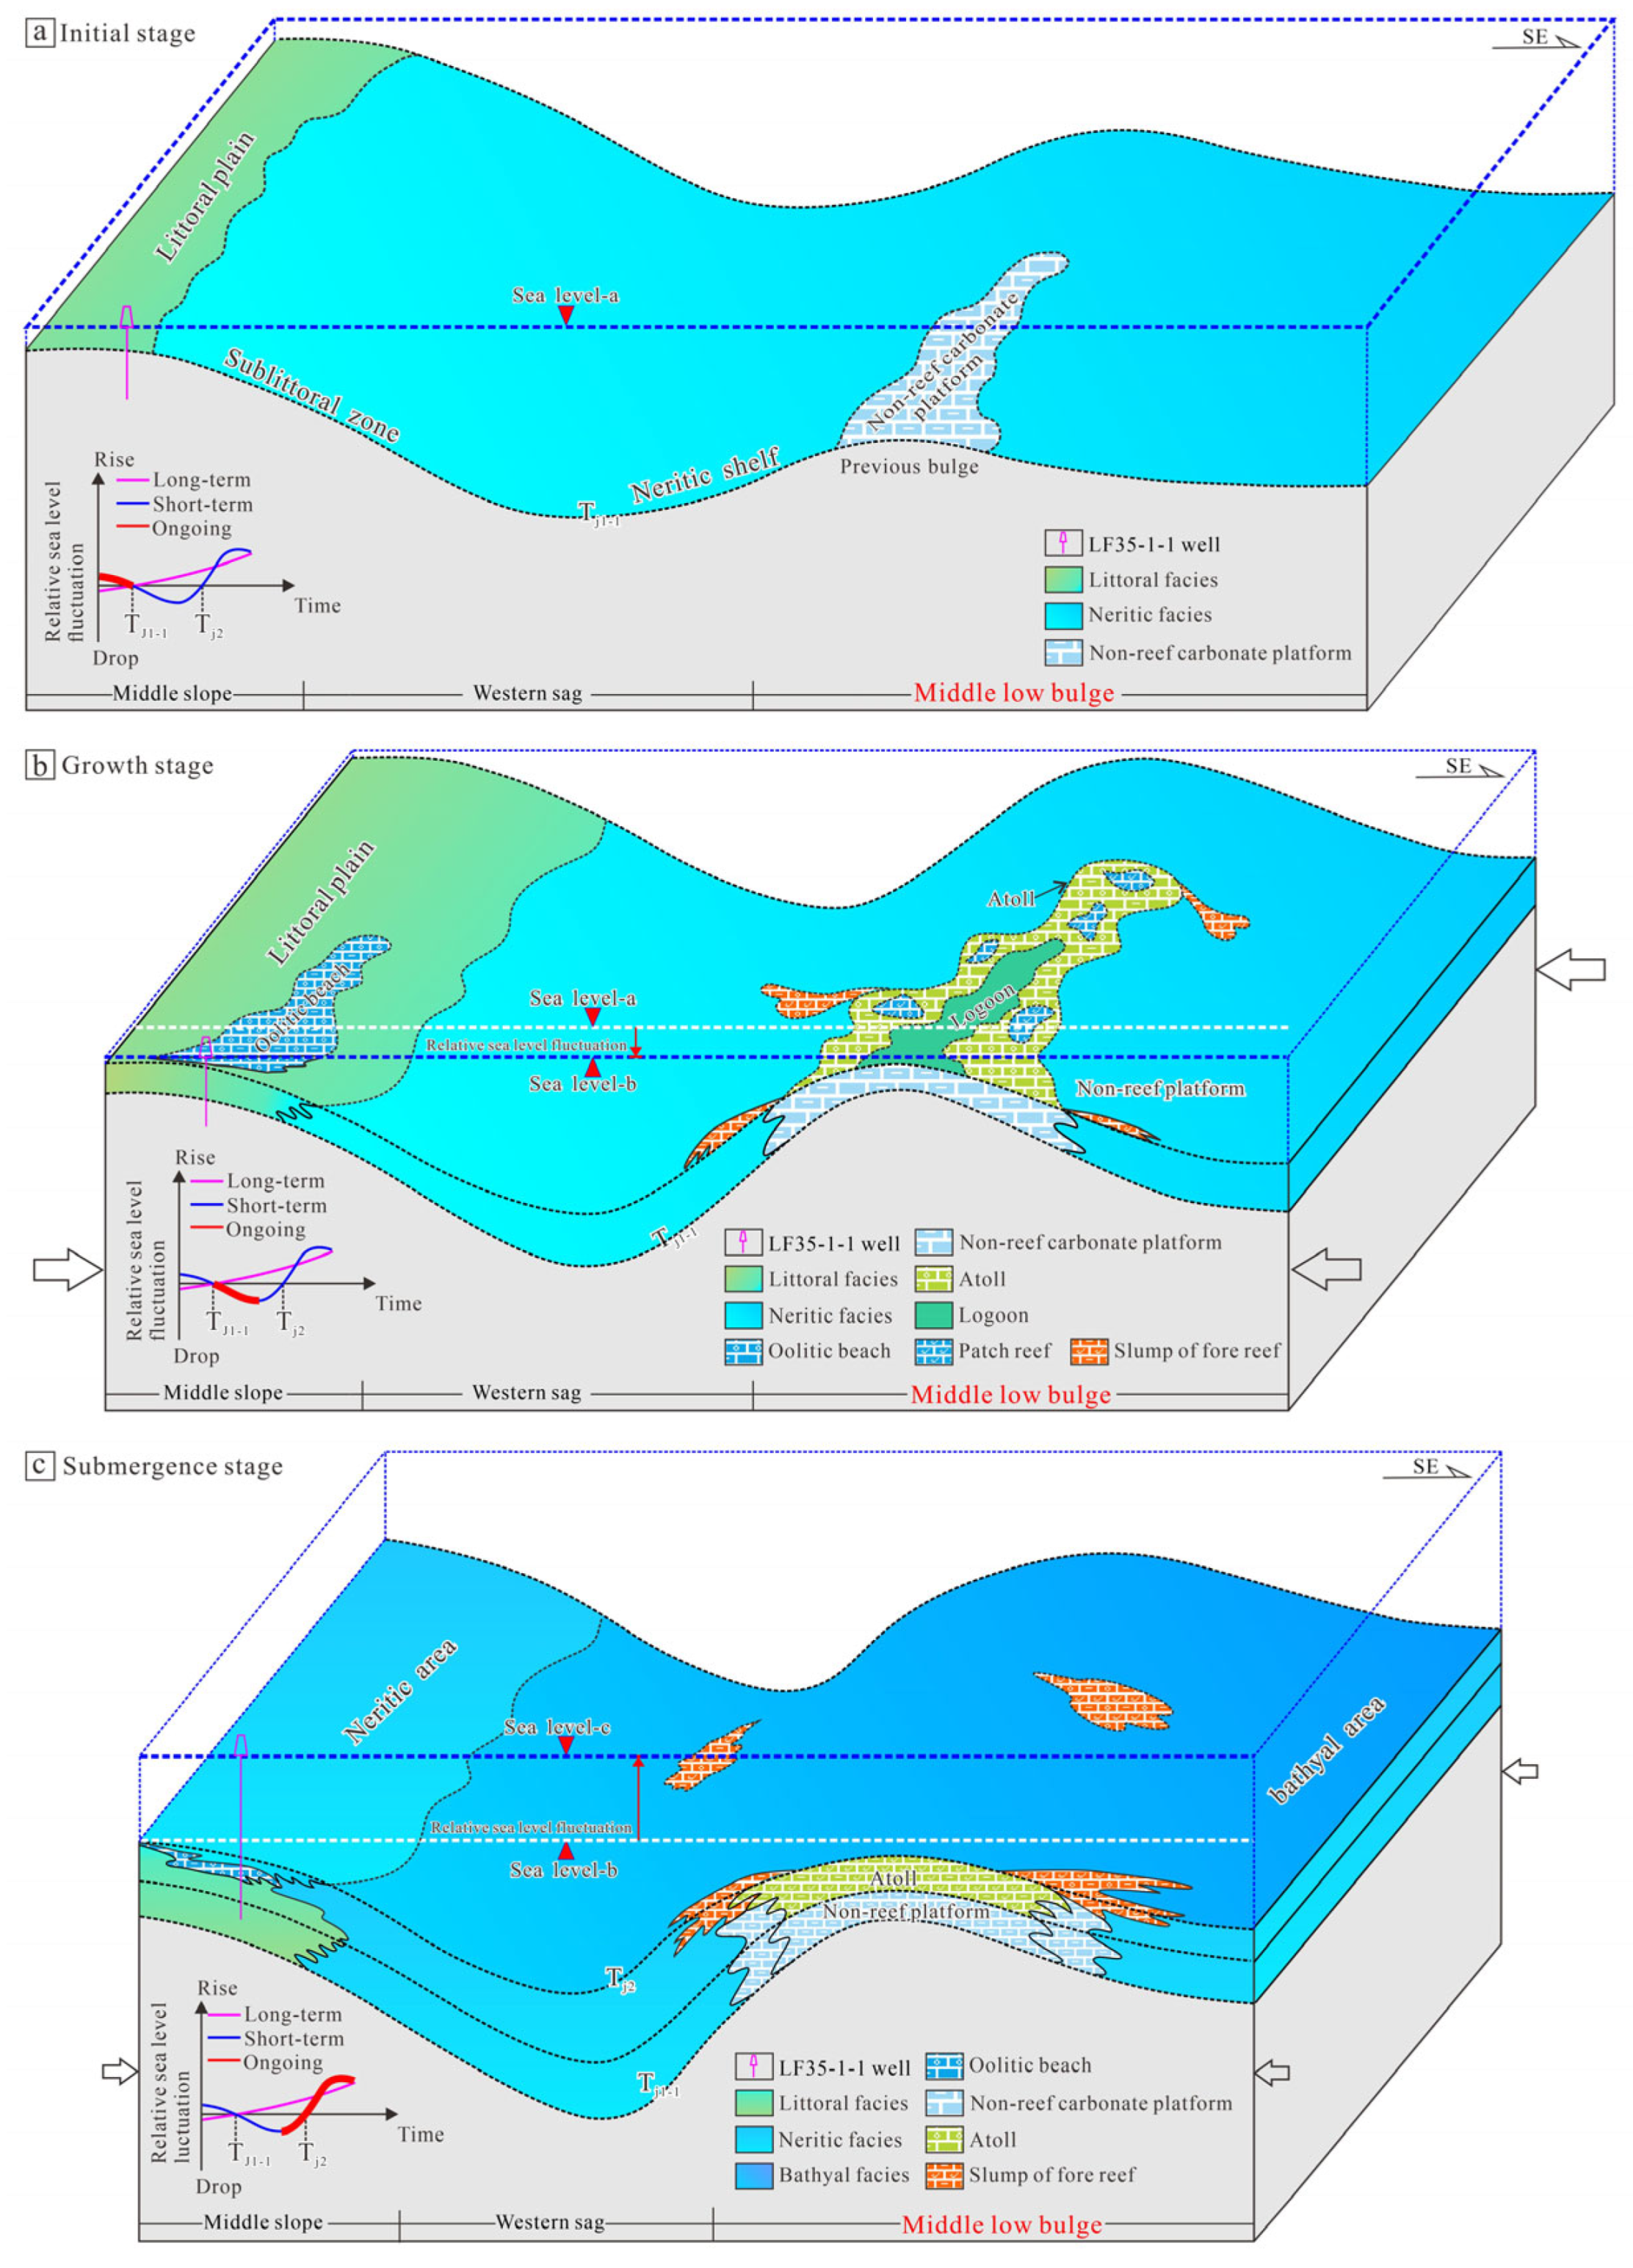
5.2. Evolution of Reefs and Carbonate Platforms

The evolution of the Paleocene isolated carbonate platform in the north-central Sirte Basin of Libya is divided into three main phases: initiation, growth, and exposure, influenced by subsidence, eustatic changes, and the pre-existing topography [44].
Similarly, the development and eventual cessation of reefs and carbonate platforms in our study area are also governed by these three factors. Notably, seismic interpretation indicates that this region transitioned directly into the submergence phase after the initial and growth stages, entirely bypassing the exposure phase. Therefore, by considering the size of atolls and fluctuations in relative sea level as critical factors, the evolutionary sequence of both atolls and carbonate platforms within our study area can be systematically categorized into three principal stages: initiation, growth, and submergence.
Variations in seismic reflection phase anomalies related to the atoll deposit system are distinctly observable on depth slices of the strata (Figure 8), serving as indirect indicators of the classification evolutionary stage of the atolls and carbonate platforms [38]. The horizontal slice within the strata interval of 2600–3300 m reveals a clear lateral zonation of sedimentary (sub)facies in the atoll complex development area (Figure 8).

5.2.1. Initiation of the Reefs and Carbonate Platforms

The 3260 m horizontal slice represents the initial stage, effectively demonstrating the morphological distribution of the early reef-base carbonate platform (Figure 8a). In the Middle Jurassic period, the study area was primarily located within a shallow marine shelf depositional environment (Figure 1b), which created conducive conditions for the initiation of carbonate platform development. During this stage, fringing carbonate platforms of relatively modest scales began to develop progressively on topographic highs, although reef-building organisms had not yet started to colonize these emerging carbonate platforms (Figure 8e,f).

5.2.2. Growth of the Reefs and Carbonate Platforms

The 3060 m horizontal slice reveals the mature developmental configuration of the atoll during the growth stage (Figure 8b). Internally, large-scale dark red-black alternating reflection patterns, characterized by moderate to strong continuity, signify chaotic seismic facies typical of biogenic framework reef cores. The green dashed enclosure within the reef is associated with weak-amplitude reflections that correspond to inter-reef lagoon deposits. The surrounding regions of the atoll display dense light red-gray reflections with low seismic amplitudes, which are indicative of sedimentation from argillaceous country rock [38] (Figure 8e,f).

5.2.3. Submergence of the Reefs and Carbonate Platforms

The 2860 m horizontal slice demonstrates the morphology of the reef top associated with the decline phase (Figure 8c). Two prominent dark red–black reflection units, situated within a matrix of dense light red–gray reflections, indicate a notable thickening of the reef cores. These reef cores are surrounded by bathyal mudstone deposits from the lower member of the Upper Jurassic, exhibiting a draped depositional pattern with upward-decreasing coverage magnitude (Figure 8e,f). These characteristics suggest that rapid relative sea-level rise triggered an environmental transition from a shallow marine shelf to a bathyal depositional regime, marking the decline of the reef and carbonate platform. Along with continued relative sea-level rise, the study area transitioned into fully bathyal depositional conditions, resulting in the total submergence of the reef system. The 2660 m horizontal slice exhibits distinctive features indicative of the submergence stage (Figure 8d), wherein light red–gray reflections represent low-amplitude seismic associated with bathyal argillaceous deposits (Figure 8e,f).

5.3. Factors Controlling the Development of the Reefs and Carbonate Platforms

Reefs and carbonate platforms typically develop in tectonically stable settings [38,39]. The primary factors controlling the formation and evolution of reefs and carbonate platforms include tectonic subsidence, fluctuations in relative sea level, pre-existing paleotopography, structural highs and the influx of terrigenous detritus [38,39,44,45,46,47,48,49,50,51]. The spatial distribution and evolutionary stages of the Mid-Jurassic reef and carbonate platform in the Chaoshan Depression demonstrate that their development was predominantly influenced by tectonic paleotopography and fluctuations in relative sea level.

5.3.1. Paleotopography

The upper member of the Middle Jurassic layers drilled in Well LF35-1-1 are made up of mudstone with terrestrial sporopollen fossils interspersed with thin layers of oolitic limestone, indicative of shallow marine environments (Figure 2) [20]. The quasi-3D study area, located about 60 km southeast of Well LF35-1-1 in the Middle Low Uplift (Figure 1b), shows that distal carbonate deposits formed during the late Middle Jurassic align with marine environmental distribution patterns [20,34]. An undulating submarine topography was formed during the Middle Jurassic period [52]. Isolated shallow-water carbonate platforms began to develop on elevated positive tectonic units far from the sources of clastic sediments, exhibiting characteristics of offshore carbonate rock. Subsequently, the pre-existing topographic high experienced additional uplifts induced by the subduction-driven compressional forces from the Paleo-Pacific Plate [19,26,28]. Various reef systems, predominantly exhibiting atoll morphologies, emerged on the pre-existing carbonate platforms. Meanwhile, bioclastic shoal facies deposits were developed along the edges of the platforms (Figure 9).

5.3.2. Relative Sea-Level Changes

LF35-1-1 has confirmed the sedimentary environment of the Mesozoic strata [27]. The long-term evolution of the Chaoshan Depression shows a relative sea-level rise from lower Middle Jurassic shallow-bathyal marine to upper Middle Jurassic shallow marine settings [20] (Figure 2). In the Well LF35-1-1, however, the lithology consists of a sequence of mudstone, limestone, and then mudstone, which developed from the bottom to the top during the Middle Jurassic period [20] (Figure 2). This indicates that there were short-term fluctuations in sea level during the Middle Jurassic, characterized by an initial decline in sea level followed by a rise (Figure 2). Initially, during the early Middle Jurassic, thick layers of clay-rich deposits formed in shallow marine environments, while a clean marine area developed away from sediment sources in the Middle Low Uplift [23]. As the late Middle Jurassic began, the relative sea level started to gradually decline, leading to the formation of littoral plain facies around Well LF35-1-1, while carbonate platforms began to accumulate on the Middle Low Uplift (Figure 9a). Secondly, as the sea level continued to fall, reef-building organisms entered a growth stage, resulting in the development of extensive reef complexes, such as atolls, lagoons, patch reefs, and reef-front slump deposits on the carbonate platform in the Middle Low Uplift (Figure 9b). Finally, a sudden and rapid rise in relative sea level during the late Middle Jurassic caused the carbonate platform to retreat to higher structural areas, leading to the drowning and degradation of reefs until they were entirely covered by deeper water deposits (Figure 9c).

5.4. Hydrocarbon Exploration Potential of Reefs

5.4.1. Potential Source Rocks Beneath the Reservoir Interval

The LF35-1-1 well encountered Middle Jurassic shallow marine dark mudstone, which is rich in organic matter, at depths of 1920–2022 m and 2120–2400 m (Figure 2). The cumulative thickness of the mudstone in these sections measures 82 m and 46 m, respectively [23,53,54]. The total organic carbon (TOC) content in the 1920–2022 m interval ranges from 0.5 wt% to 1.15 wt% (averaging 0.67 wt%), while in the 2120–2400 m interval, it ranges from 1.0 wt% to 1.48 wt% (averaging 1.32 wt%). These findings suggest that the lower stratigraphic layer has a higher organic matter content [54]. In these mudstones, the HI varies from 30 to 118.5 mg HC/g TOC, with an average value of 62.97 mg HC/g TOC. The Rock-Eval S1 + S2 values range between 0.3 and 1.71 mg HC/g, averaging 0.98 mg HC/g, and the Ro is greater than 2.0%. The kerogen is mainly Type III, with a small amount of Type II. Presently, the maturity level has progressed into the over-mature dry gas phase [23,53,54]. Although Rock-Eval Tmax test data of the Well LF35-1-1 is not available, thick laminated black mudstones in the Middle Jurassic have been assessed as moderate to good source rocks by Guang, Z. et al. (2022) and Shu, Y. et al. (2008) [23,53]. However, according to Mansour, A. and Wagreich, M. (2022) [55], a mudstone can be classified as an effective hydrocarbon source rock only if its Rock-Eval Tmax value exceeds 435 °C and its S2 value is greater than 5 mg HC/g rock.
In the quasi-3D area, weak seismic reflections measuring 600 m in thickness observed in the lower member of the Middle Jurassic (Tj1–Tj1-1) are likely interpreted to be shallow marine mudstone interspersed with argillaceous limestone. Compared to the LF35-1-1, this area is closer to the depocenter, exhibiting thicker mudstone layers, improved lithological consistency, reduced terrigenous input, and enhanced potential for source rock [23]. This study suggests that the mudstones in the area could serve as potential hydrocarbon source rocks. The upper section of the Middle Jurassic (Tj1-1–Tj2) carbonate platform and reef limestone reservoirs sit directly above these potential source rocks, allowing for hydrocarbon charging through vertical migration pathways (Figure 10).

5.4.2. Reservoir Properties of Large-Scale Reef Limestone

The atoll complexes, oriented in an NW–SE direction within the quasi-3D area, have thicknesses ranging from 100 to 600 m, with the thickest accumulations (400–600 m) located at the central portions of the reef structures (Figure 11b). These reservoirs exhibit considerable lateral continuity and potential for vertical stacking. Although primary porosity in limestone is limited, the quality of the reservoir is improved through extensive fracture and cavern systems. Seismic fissure attributes (along the Tj2 boundary ± 100 m/350 m) reveal the presence of microfractures (depicted in black in Figure 11c) in proximity to faults. This observation suggests that regions adjacent to faults are conducive to the development of secondary porosity, thereby significantly improving the physical characteristics of limestone reservoirs. The development of faults and microfractures additionally enhanced reservoir connectivity by establishing connections between reef limestone reservoirs and the underlying source rocks, thereby facilitating efficient pathways for hydrocarbon migration.

5.4.3. Mudstone Seals

In the Well LF35-1-1, the porosity of Late Jurassic mudstone is 10–12% and its maximum individual layer thickness is 30 m [52]. In the study area, the overlying strata of the reef limestone (Tj2–Tj2-1) show weak-to-blank seismic reflections (Figure 10a), which are interpreted as bathyal facies mudstone formed during a rapid transgression in the early Late Jurassic period. This argillaceous seal demonstrates a stable distribution in the quasi-3D region, with the total thickness reaching 400–600 m. It serves as a local caprock for the reef limestone reservoir with vertical sealing capacity (Figure 10).

5.4.4. Structural and Lithologic Traps

In the quasi-3D area, structural traps are well defined, with three structural closures (I, II, III) identified on the Tj2 boundary depth structure map (Figure 11a). The largest closure, Trap I, spans 42 km2 and aligns with the thickest zone of reef limestone development, creating ideal conditions for the reservoir–trap overlap (Figure 10). This vertical superimposition spatial alignment results in composite structural–lithologic traps, significantly increasing the potential for hydrocarbon accumulation through the combination of structural closure and lithologic reservoir.
The study area presents a complete and advantageous source–reservoir–seal system characterized by a “lower source, upper reservoir, and upper seal” configuration (Figure 10). The presence of high-quality Middle Jurassic source rocks, extensive reef limestone reservoirs with enhanced secondary porosity, effective local and regional argillaceous caprocks, and structurally controlled trapping mechanisms collectively create favorable conditions for significant large to medium hydrocarbon accumulations. These results highlight the considerable exploration potential within the Mesozoic reef limestone reservoirs of the Chaoshan Depression.

6. Conclusions

The seismic facies of Middle Jurassic reefs and carbonate platforms located on the Middle Low Uplift in the Chaoshan Depression are typically characterized by a high-frequency, high-amplitude, continuity, and a sub-parallel configuration, sometimes featuring weak, sub-parallel, or blank reflections. The reefs and carbonate limestone platforms show significant high-velocity characteristics, along with high Bouguer gravity and low reduced-to-pole (RTP) magnetic anomalies. Various reef systems, including atolls, stratiform reefs, and dispersed patch reefs, emerged on the local topographic highs of the early pre-existing carbonate platforms.
The vertical evolution has experienced three distinct stages delineated through seismic stratigraphic depth horizontal slices, encompassing the initiation, growth, and submergence stages. Paleotectonic topography and changes in relative sea level were the two main controlling factors, with the former influencing the formation position and spatial distribution of reefs and platforms and the latter affecting their size.
The reef limestone reservoirs within the upper member of the Middle Jurassic exhibit excellent hydrocarbon accumulation conditions. Hydrocarbons are derived from source rocks dating to the Lower Jurassic or the lower section of the Middle Jurassic period. They migrate vertically through fault systems and are subsequently stored in reef limestones within the upper member of the Middle Jurassic. The accumulation of these hydrocarbons is further enhanced by the presence of overlying bathyal mudstone caprocks that serve as seals in conjunction with tectonic uplift, which promotes the development of structural and lithologic traps. The characteristics of these reservoirs present conducive conditions for the formation of medium- to large-scale hydrocarbon deposits, thereby suggesting considerable potential for exploration.

Author Contributions

Conceptualization and methodology, M.S. and H.Y.; formal analysis, M.S., H.Y., Z.Z. and G.Z.; data curation, M.S., C.F. and G.T.; writing—original draft preparation, M.S.; writing—review and editing, M.S. and H.Y.; visualization, M.S. All authors have read and agreed to the published version of the manuscript.

Funding

This research was funded by the Guangzhou Science and Technology Planning Project the Science and Technology Program of Guangzhou (No: 2023A04J0241) and the projects of the China Geological Survey (No: DD20230318, DD20221708).

Institutional Review Board Statement

Not applicable.

Informed Consent Statement

Not applicable.

Data Availability Statement

Data are available on request from the author M.S. (danyifeixiang@126.com).

Acknowledgments

We are grateful to all colleagues who participated in seismic acquisition and processing. We thank JinFeng Ren for proofreading the manuscript.

Conflicts of Interest

The authors declare no conflicts of interest.

References

  1. Ahr, W.M. Geology of Carbonate Reservoirs: The Identification, Description and Characterization of Hydrocarbon Reservoirs in Carbonate Rocks; John Wiley & Sons: Hoboken, NJ, USA, 2008. [Google Scholar]
  2. Li, D.; Chen, H.; Xin, L.; Hong, S.; Jonathan, A.Q.; Qiu, Y. Diagenetic evolution in marine carbonate rocks based on the typical case studies: Review and perspectives. Mar. Pet. Geol. 2025, 176, 107352. [Google Scholar]
  3. Li, Y.; Kang, Z.; Xue, Z.; Zheng, S. Theories and practices of carbonate reservoirs development in China. Pet. Explor. Dev. 2018, 45, 712–722. [Google Scholar] [CrossRef]
  4. Omar, N.; Julien, M.; Jean, B.; Bertrand, M.G. Global geologic expert system and database forpredicting carbonate reservoirs from seismic: Application to the Upper Jurassic. Lead. Edge 2024, 43, 382–396. [Google Scholar]
  5. Jerzy, S.; Jan, T.; Jan, B. Seismic geomorphology of the karstified Upper Jurassic–Lower Cretaceous carbonate succession in the Carpathian Foredeep area, Poland. Mar. Pet. Geol. 2025, 174, 107331. [Google Scholar]
  6. Pomar, L.; Hallock, P. Carbonate factories: A conundrum in sedimentary geology. Earth-Sci. Rev. 2008, 87, 134–169. [Google Scholar] [CrossRef]
  7. Kiessling, W.; Flügel, E.; Golonka, J. Phanerozoic Reef Patterns. SEPM Spec. Publ. 2002, 72, 3–10. [Google Scholar]
  8. Moyra, W. Development of Equatorial Delta–Front Patch Reefs During the Neogene, Borneo. J. Sediment. Res. 2005, 75, 114–133. [Google Scholar]
  9. Zhi, G.; Ze, W.; Su, H.; Hong, W.; Ji, Y.; Ping, H. Tectonic settings of global marine carbonate giant fields and explaration significance. Nat. Gas Geosci. 2012, 23, 106–118. [Google Scholar]
  10. Wen, Z.; An, S.; Jin, Z.; Xiao, W.; Jun, L. Types, characteristics, origin and exploration significance of reef-shoal reservoirs: A case study of Tarim Basin, NW China and Sichuan Basin, SW China. Pet. Explor. Dev. 2014, 41, 257–267. [Google Scholar]
  11. Mansour, A.; Geršlova, E.; Sykorova, I.; Vöröš, D. Hydrocarbon potential and depositional paleoenvironment of a Middle Jurassic succession in the Falak-21 well, Shushan Basin, Egypt: Integrated palynological, geochemical and organic petrographic approach. Int. J. Coal Geol. 2020, 219, 103374. [Google Scholar] [CrossRef]
  12. James, H.; Peter, B.; David, H.; Xavier, J.; Valentina, Z. Seismic characterization of carbonate platforms and reservoirs: An introduction and review. Geol. Soc. Lond. Spec. Publ. 2021, 509, 1–28. [Google Scholar]
  13. Zhi, W.; Xiao, T.; Hua, G.; Zhao, W.; Rui, C.; Cheng, S.; Zheng, H.; Zuo, L.; Hai, K. Buildups and hydrocarbon accumulation of the isolated carbonate platforms in the eastern Mediterranean. Pet. Explor. Dev. 2021, 48, 323–336. [Google Scholar]
  14. Yang, F.; Hong, Q.; Gong, Z.; Ren, P. Seismic interpretation and hydrocarbon accumulations implication of the Miocene Meishan Formation reefs in southern Qiongdongnan Basin, northern South China Sea. J. Palaeogeogr. 2017, 6, 206–218. [Google Scholar]
  15. Hong, X.; Jing, S.; Jing, L.; Gang, D.; Jinqing, L.; Hong, S.; Zhen, W.; Zhi, S.; Qing, J.; Li, Z.; et al. Bioherm petroleum reservoir types and features in main sedimentary basins of the South China Sea. J. Earth Sci. 2012, 23, 828–841. [Google Scholar]
  16. Shi, W.; Sheng, Y.; Gong, Z.; Yu, M.; Li, M.; Ning, X. Seismic characteristics of a reef carbonate reservoir and implications for hydrocarbon exploration in deepwater of the Qiongdongnan Basin, northern South China Sea. Mar. Pet. Geol. 2009, 26, 817–823. [Google Scholar]
  17. Jia, G.; Xiao, X.; Shi, L.; Yi, W.; Shuang, S.; Wen, H.; Long, W.; Ji, L. Cenozoic sedimentary systems in Zengmu Basin, South China Sea. China Pet. Explor. 2016, 21, 99–107. [Google Scholar]
  18. Di, Z.; Zhen, S.; Han, C.; Yuan, Q. Mesozoic lithofacies, paleo-geography, and tectonic evolution of the South China Sea and surrounding areas. Earth Sci. Front. 2005, 12, 204–218. [Google Scholar]
  19. Chin, H.; Tung, L.; Ching, L.; Sun, C.; Jong, W.; Ching, T.; Meng, Y.; Suiu, C.; Yu, C.; Ching, H. Structural inversion in the northern South China Sea continental margin and its tectonic implications. Terr. Atmos. Ocean. Sci. 2017, 28, 891–922. [Google Scholar]
  20. Lei, S.; Hong, Y.; Hu, H.; Guo, W.; Pei, Q.; Yong, L. Petrology and depositional environments of Mesozoic strata in the Northeastern South China Sea. Geol. Rev. 2007, 2, 164–169. [Google Scholar]
  21. Yan, W.; Yan, Q.; Pin, Y.; Hong, Z.; Hai, L.; Jun, W. Seismic evidence for Mesozoic strata in the northern Nansha waters, South China Sea. Tectonophysics 2016, 677-668, 190–198. [Google Scholar]
  22. Li, Z.; Wei, Z.; Zhen, W.; Zhen, L.; Zhen, L.; Qing, S. The impact of northern South China Sea paleotectonic framework on development of Mesozoic and Cenozoic. Earth Sci. Front. 2014, 21, 254–263. [Google Scholar]
  23. Guang, Z.; Chang, F.; Yan, W.; Sheng, C.; Ming, S.; Hai, Y.; Jun, Y.; Jing, Z.; Zhong, Z. Fault bounded models of oil–Gas and gas–Hydrate accumulation in the Chaoshan Depression, the South China Sea. Front. Earth Sci. 2022, 10, 965898. [Google Scholar]
  24. Guang, Z.; Pi, S.; Chang, F.; Sheng, L.; Ming, S.; Hai, Y.; Jing, Z.; Zhong, Z. Mesozoic tectonic characteristics and exploration prospects of the Chaoshan depression in the northeastern South China Sea. Acta Geol. Sin. 2022, 96, 2896–2905. [Google Scholar]
  25. Zhong, Z.; Guang, Z.; Ming, S.; Chang, F.; Guang, T.; Hai, Y. Hydrocarbon Accumulation Analysis Based on Quasi-3D Seismic Data in the Turbulent Area of the Northern South China Sea. J. Mar. Sci. Eng. 2023, 11, 338. [Google Scholar]
  26. Ming, S.; Jin, R.; Guang, Z.; Hai, Y. Fold deformations of Mesozoic strata and their genetic mechanism in southwestern Dongsha Waters of Northern South China Sea. Geol. Rev. 2018, 64, 828–842. [Google Scholar]
  27. Chang, F.; Zhong, G.; Ming, S.; Zhen, L.; Hai, Y.; Zhong, Z. Analysis of the Thermogenic Gas Source of Natural Gas Hydrates Over the Dongsha Waters in the Northern South China Sea. Front. Earth Sci. 2022, 10, 873615. [Google Scholar]
  28. Chao, F.; Shao, X.; Jing, C.; Fang, Z.; Kui, W. Seismic constraints on a remnant Mesozoic forearc basin in the northeastern South China Sea. Gondwana Res. 2022, 102, 77–94. [Google Scholar]
  29. Hu, H.; Xiang, Z. An application of gravimetric and magnetic data in mesozoic petroleum exploration in Chaoshan sag, South China sea. China Offshore Oil Gas 2003, 17, 128–132. [Google Scholar]
  30. Pin, Y.; Yan, W.; Hong, Z.; Da, Z.; Zhong, C. Geophysical features of mud volcanoes in the waters southwest of the Dongsha Islands. Acta Oceanol. Sin. 2014, 7, 142–148. [Google Scholar]
  31. Jun, Y.; Pin, Y.; Yan, W.; Guang, Z.; Chang, C. Subsurface structures and nature of seafloor mounds in the northern South China Sea margin: Implications for Mesozoic hydrocarbon exploration. Geomorphology 2024, 445, 108933. [Google Scholar]
  32. Sheng, Y.; Yan, Q.; Ben, Z. Atlas of Geology and Geophysics of the South China Sea; China Navigation Press: Tianjing, China, 2016. (In Chinese) [Google Scholar]
  33. Chen, J. Geophysical characteristics of the Chaoshan depression and its hydrocarbon exploration potential. Prog. Geophys. 2007, 22, 147–155. [Google Scholar]
  34. Zhang, L.; Zhang, G.; Wang, L.; Xu, G.; Wang, W.; Cheng, R.; Zeng, W.; Lin, Z.; Geng, A.; Wei, Z.; et al. Mesozoic Distribution and Oil-Gas Resources Prospects in the Northern South China Sea; Geological Publishing House: Beijing, China, 2014. [Google Scholar]
  35. Wei, H.; Tian, H.; Wei, J.; Ya, X.; Bai, Z.; Di, J. An integrated geophysical study on the Mesozoic strata distribution and hydrocarbon potential in the South China Sea. J. Asian Earth Sci. 2015, 111, 31–43. [Google Scholar]
  36. Roger, H. Bouguer’s gravity corrections and the shape of the Earth. Preview 2020, 208, 39–43. [Google Scholar]
  37. Yao, L.; Dian, X.; Ming, W. Reduction to the Pole at the Geomagnetic Equator. Chin. J. Geophys. 2013, 53, 1082–1089. [Google Scholar]
  38. Bang, Z.; Xiao, D. Geological Characteristics and Geophysical Identification of Biogenic Reefs; Petroleum Industry Press: Beijing, China, 2009; pp. 150–157. [Google Scholar]
  39. Priyadarshi, C.K.; Kalachand, S. Machine learning elucidates the anatomy of buried carbonate reef from seismic reflection data. Artif. Intell. Geosci. 2023, 4, 59–67. [Google Scholar]
  40. Lennon, I.; Kurt, M. In-context interpretation: Avoiding pitfalls in misidentification of igneous bodies in seismic data. Interpretation 2018, 6, 1–51. [Google Scholar]
  41. Eberli, G.P.; Masaferro, J.L.; Sarg, J.F. Seismic Imaging of Carbonate Reservoirs and Systems. AAPG Memoir. 2004, 81, 1–9. [Google Scholar]
  42. Yan, L.; Bing, C.; Tian, X.; Shui, W.; Zhong, Q. A study and application of high-resolution methods for reef reservoir identification. Acta Geophys. 2017, 65, 907–917. [Google Scholar] [CrossRef]
  43. Anthony, P.; Jay, A. Principles of Igneous and Metamorphic Petrology; Cambridge University Press: Cambridge, UK, 2022; pp. 52–110. [Google Scholar]
  44. Muneer, A.; Abdalla, A.; Ahmad, I.; Meeloud, A.; Husamaldeen, Z.; Yousf, A. Stratigraphic architectural development and growth history of a Paleocene isolated carbonate platform, north-central Sirte Basin, Libya: Interplay of tectonics and eustasy. Results Earth Sci. 2025, 3, 100095. [Google Scholar]
  45. Wilson, J.L. Carbonate Facies in Geologic History; Springer–Verlag: New York, NY, USA, 1975; p. 471. [Google Scholar]
  46. Sarg, J.F. Carbonate Sequence Stratigraphy and Controls on Carbonate Plat form Development—Case Study from Permian of West Texas-New Mexico: ABSTRACT. AAPG Bull. 1988, 72, 1522. [Google Scholar]
  47. Schlager, W. The paradox of drowned reefs and carbonate platforms. Geol. Soc. Am. Bull. 1981, 92, 197–211. [Google Scholar] [CrossRef]
  48. Schlager, W. Drowning unconformities on carbonate platforms. In Controls on Carbonate Platform and Basin Development; Crevello, P.D., Wilson, J.L., Sarg, J.F., Read, J.F., Eds.; SEPM Society for Sedimentary Geology: Tulsa, OK, USA, 1989; pp. 15–25. [Google Scholar]
  49. Schlager, W. Carbonate Sedimentology and Sequence Stratigraphy. In SEPM Concepts in Sedimentology and Paleontology Series No. 8; SEPM Society for Sedimentary Geology: Tulsa, OK, USA, 2005; pp. 25–28. [Google Scholar]
  50. Luis, P.; Blial, H. Decoding depositional sequences in carbonate systems: Concepts vs experience. Glob. Planet. Change 2016, 146, 190–225. [Google Scholar]
  51. Juan, L.; Jonathan, S.; Chia, T.; Fiona, W.; Tatyana, G.; Maurice, T.; Philipp, T.; Brent, M.; Kieron, P.; Ingrid, I. Controls on Neogene carbonate facies and stratigraphic architecture of an isolated carbonate platform– the Caribbean Island of Bonaire. Mar. Pet. Geol. 2018, 94, 1–18. [Google Scholar]
  52. Shu, D.; Yue, Z.; Chang, L.; Zhen, Y.; Qiang, J.; Tao, W.; Jian, H.; Xuan, C. Jurassic Tectonic Revolution in China and New Interpretation of the Yanshan Movement. Acta Geol. Sin. 2007, 81, 1449–1461. [Google Scholar]
  53. Shu, Y.; Zhi, T.; Qing, H.; Jian, H. Mesozoic hydrocarbon generation history and igneous intrusion impacts in Chaoshan depression, South China sea: A case of LF35-1-1 well. China Offshore Oil Gas 2008, 20, 152–156. [Google Scholar]
  54. Hu, H.; He, S.; Xiang, Z.; Tian, J.; Shou, T. Mesozoic sediments and their petroleum geology conditions in Chaoshan sag: A discussion based on drilling results from the exploratory well LF35-1-1. China Offshore Oil Gas 2009, 21, 151–156. [Google Scholar]
  55. Mansour, A.; Wagreich, M. Earth system changes during the cooling greenhouse phase of the Late Cretaceous: Coniacian–Santonian OAE3 subevents and fundamental variations in organic carbon deposition. Earth-Sci. Rev. 2022, 229, 104022. [Google Scholar] [CrossRef]
Figure 3. Seismic reflection characteristics of atoll system and carbonate platform in the upper part of the Middle Jurassic (Tj1-1–Tj2). (a) Quasi-3D MSC reflection profile. (b) Seismic reflection and facies interpretation profile. (c) Seismic and sedimentary facies interpretation profile. See Figure 1d for the location.
Jmse 13 01025 g003
Figure 4. Seismic reflection characteristics of stratiform reefs, patch reefs, and carbonate platform in the upper part of the Middle Jurassic (Tj1-1–Tj2). (a) Quasi-3D MSC reflection profile. (b) Seismic reflection and facies interpretation profile. (c) Seismic and sedimentary facies interpretation profile. See Figure 1d for the location.
Jmse 13 01025 g004
Figure 5. Seismic velocity anomaly of the reef and carbonate. (a) Time-domain MCS reflection profile and its interpretation. See Figure 1d for the location. (b) Seismic stack velocity spectrum of CDP 2068–2077. (c) Interval velocity profiles.
Jmse 13 01025 g005
Figure 6. (a) The 2D MCS reflection profile across the quasi-3D area and its interpretation. See Figure 1d for the location. (b) The curve of the gravity and magnetic anomaly. The blue solid line represents the Bouguer gravity anomaly. ∆G-B (mGal) indicates the Bouguer gravity anomaly measured in mGal; 1 mGal = 10−5 m/s2. The red solid line represents the reduced-to-pole (RTP) magnetic anomaly. ∆T-RTP (nT) indicates the RTP magnetic anomaly measured in nT.
Jmse 13 01025 g006
Figure 7. Seismic attribute and sedimentary interpretation of the reef and carbonate platform of the upper part of the Middle Jurassic (Tj1-1–Tj2). (a) Seismic attribute of “Sum Positive Amplitude” and sedimentary boundary delineated by the amplitude anomaly. (b) Distribution pattern and scale of reefs and carbonate platforms delineated by sedimentary interpretation.
Jmse 13 01025 g007
Figure 8. Vertical evolution of atolls and carbonate platforms. Sedimentary (sub)facies boundary delineated by seismic phase anomaly marked with blue and green dashed line in the strata depth’s horizontal slice of 3260 m: (a) initial stage, 3260 m; (b) growth stage, 3060 m; (c) submergence decline stage, 2860 m; (d) entirely submerged stage, 2660 m. See Figure 1d for the grid location of the slice. See Figure 8e,f for the depth of the slice in the profiles. (e,f) show the MCS reflection profile and its interpretation. See Figure 8a for the location of the cross-profiles.
Jmse 13 01025 g008
Figure 9. Evolution model of reefs and carbonate platforms within the upper part of the Middle Jurassic. Solid red triangle symbols represent the specific position of the sea level. Red arrows (b,c) denote the trends of sea level change during the initial stage (falling) and the growth stage (rising). Hollow arrows represent compressive stress and indicate its direction of action. (a) Initial development of non-reef carbonate platforms occurred on the paleo-highs of the Middle Low Uplift concurrently with a decline in short-term relative sea level. (b) Reef–shoal facies dominated by oolitic limestone emerged at Well LF35-1-1, while reef complexes formed on the carbonate platform in the Middle Low Uplift amid a slow and steady decline in short-term relative sea level. (c) Early-stage reefs and carbonate platforms experienced decline and drowning until they were completely submerged under bathyal muddy deposits resulting from a subsequent rapid rise in sea level.
Jmse 13 01025 g009
Figure 10. (a) Quasi-3D MCS reflection profile and its interpretation. See Figure 1d for the location of the profile. (b) Prediction of structural and lithologic trap reservoir-forming model displaying elements of the local petroleum system.
Jmse 13 01025 g010
Figure 11. Structural and lithologic trap conditions of the reef within the upper part of the Middle Jurassic. These maps (ac) were compiled by the authors of this article based on quasi-3D seismic data. (a) The structural isodepth map of Tj2 shows that the structural traps and the reef development location present a good vertical superimposition relationship. (b) The thickness map shows the considerable scale of the atolls. (c) Seismic fissure attributes (along Tj2 boundary ± 100 m/350 m) show microfracture (depicted in black) development near faults.
Jmse 13 01025 g011
Disclaimer/Publisher’s Note: The statements, opinions and data contained in all publications are solely those of the individual author(s) and contributor(s) and not of MDPI and/or the editor(s). MDPI and/or the editor(s) disclaim responsibility for any injury to people or property resulting from any ideas, methods, instructions or products referred to in the content.

