Abstract
To solve the problem of the boundary condition of the electrochemical field for a cathodic protection system of a steel offshore platform jacket, a new concept for the real electrochemical boundary condition was first proposed. The new idea considers that different points on the steel surface have different surface states and different polarization processes. The new method involved using sixteen sets of measurement equipment and a small test jacket to obtain different polarization processes at different points. A new test device was designed to obtain the relationship curves of potential/current density at different points. The polarization processes at different points were obtained. We first found that all polarization processes had four stages: rapid polarization, data jumping, polarization with middle speed, and slow polarization. At the end of the measurement, the current density interval exhibited a convergence phenomenon. The fitting curve based on the endpoint of the fourth stage of each relationship curve was regarded as the real boundary condition. The boundary condition was verified by the small test jacket and the real jacket. The comparison between the calculation and the measurement proved that the boundary condition was correct. The real boundary condition based on the new method reflected the real state and polarization process of the jacket and provided the correct incoming data for electrochemical field.
1. Introduction
Cathodic protection systems based on sacrificial anodes are generally used to protect steel offshore platform jackets. Some studies [1] used numerical simulation methods such as the boundary element method (BEM) to analyze the electrochemical field of cathodic protection systems for steel offshore platform jackets. Danson [2] conducted research on the electrochemical field of the cathodic protection system of the Hutton Tension Leg platform. Adey [3,4] studied the distribution of potential and current density in the K-joints of a deep-water platform.
The basic principle of numerical simulation for cathodic protection systems of steel jackets is correct, but there is a difficult problem that needs to be solved urgently. Electrochemical boundary conditions, especially the boundary conditions of the cathode, directly affect the accuracy of numerical simulation results. Because there are uncertainties regarding the boundary conditions of steel offshore platform jackets, some previous studies directly used the polarization curves of bare steels from electrochemical workstations as boundary conditions [5]. This may be appropriate for protected objects whose surface states do not change during the process of protection (such as oil pipelines with a good 3PE coating) [6]. But the underwater zones of jackets usually have no coating, so the cathodic protection system of jackets undergoes a unique and distinct initial polarization process which is different from that of oil pipelines, ships, and oil tanks. After jackets are launched into the water, in the early stages of cathodic protection, calcium/magnesium sediments gradually accumulate on the surface of the bare steel, and the surface state of the steel changes continuously [7]. According to our previous study [8], using polarization curves from bare steel in such calculations may lead to large errors. The values of current density often reach thousands of mA/m2, far greater than the values required for cathodic protection. Therefore, ordinary polarization curves from bare steel cannot be used as boundary conditions for jackets.
Although some studies in the literature discuss the relationship between calcium/magnesium sediments and cathodic protection [9,10], very few studies discuss the measurement of boundary conditions for steel with calcium/magnesium sediments. Some studies [11,12,13,14] used dynamic potential measurement and galvanostatic charge techniques to obtain polarization curves of steel after long-term polarization at different potentials. This method assumes that while the degree of polarization varies, the surface state remains identical after initial polarization. This method is better than directly measuring polarization curves of bare steel. But in fact, the surface state also differs. This boundary condition still results in a large error of about 9%.
Sun [15] reduced the dynamic scanning speed of potentials for bare steel and allowed long intervals for the formation of calcium/magnesium sediments to obtain polarization curves that include such sediments. However, these curves only represent an approximate initial polarization process and not the final steady-state boundary conditions. De Carlo [16] used a constant current density of 214 mA/m2 to protect bare steel and form calcium/magnesium sediments on its surface. Each bare specimen was subjected to the same current density but for different durations, resulting in different surface states. Then, De Carlo used the polarization curves of these steels as boundary conditions. Although time-related factors of calcium/magnesium sediment formation are included in De Carlo’s study, in the early stages of the cathodic protection of jackets, the actual current density is not constant and changes continuously.
Because there is no reasonable method to obtain accurate boundary conditions, some researchers [17,18,19] have even attempted to derive such boundary conditions through formula derivation and empirical fitting, but the accuracy of such methods still requires further verification.
Hence, in this article, the boundary condition of the cathodic protection system of one steel offshore platform jacket is selected as the research object. Based on the analysis of the boundary condition of the cathodic protection system of the real jacket [20], the traditional understanding of the boundary conditions of jackets is improved and modified. A new method is used to obtain the real boundary condition. This new method uses sixteen sets of new measurement equipment and a small test jacket to measure the polarization process and plot different relationship curves of potential/current density at different points of the small test jacket. If the surface states are not significantly different, it can be approximately assumed that the two surface states use the same computational boundary. According to engineering experience, for the same current density, a potential difference of less than 5 mV is acceptable. All sixteen endpoints of these curves are selected as fitting points. Based on these fitting points, the curve of the real boundary condition is finally plotted. Then, the real boundary condition is applied to numerical calculations for the small test jacket. Numerical calculations and experimental tests for the small test jacket proved the reasonableness of the real boundary condition. The real boundary condition was employed in the numerical calculations for the cathodic protection systems of the steel offshore platform jacket. The values obtained from the BEM were compared with those measured by the monitoring sensors and experimental underwater measurements. The innovative approach utilizing the real boundary condition solved the most difficult problem in calculations for the electrochemical field of cathodic protection systems, thereby ensuring the accuracy of the simulation results.
2. Methods and Experiments
2.1. Improvement to the Conception of the Boundary Conditions
For the electrochemical field of cathodic protection systems, the potential distribution on the jacket’s surface must comply with the electrochemical equation and its boundary conditions.
Equation (1) is the electrochemical equation and is the potential. S1 is the first boundary condition and the potential is a constant . Since the anode polarization is usually negligible, its constant working potential can be regarded as the first boundary condition [21].
S2 is the second boundary condition, is the conductivity of seawater, is the inner normal direction of the boundary. is the relationship function of potential/current density. The second boundary condition is suitable for the cathode.
The relationship function of potential/current density is different from the polarization curve. The relationship function depends closely on the surface state, so it cannot be measured by an electrochemical workstation such as a Parstat 2273 (AMETEK, Oak Ridge, TN, USA).
In order to simulate the real surface state of the steel jacket and obtain the real boundary condition, must be converted into Equation (4):
As shown in Equation (4), some factors must be taken into account. Firstly, the most important factors are the electrical parameters which include the current density and the polarization time . Secondly, the flow velocity of seawater is another important factor. In addition, temperature , salinity and dissolved oxygen content are also the impact factors. Environmental parameters such as temperature, salinity, dissolved oxygen content and flow velocity can be easily controlled by adjusting the experimental conditions. The entire surface of the jacket can be considered in a large and uniform environment. The entire surface is composed of countless points. The electrical parameters, such as the polarization current density and the polarization time at one point, differ and are difficult to determine. When the jacket is launched into seawater, the sacrificial anodes begin to provide a protective current. Each point on the jacket’s surface is polarized from an almost identical initial surface state with a thin layer of rust. Calcium/magnesium sediments then begin to grow at each point. If the environmental parameters are identical, the current density and the polarization time at one point on the jacket’s surface restrict the growth of calcium/magnesium sediments. Conversely, the growth of calcium/magnesium sediments can adjust the cathodic protection systems, reduce the current density at one point, shorten the polarization time and reduce the total current output of the anodes. Therefore, the current density and the polarization time are usually different at different points [22]. The calcium/magnesium sediments and the surface state usually differ at different points. Once the calcium/magnesium sediments have formed, the current density required for cathodic protection can be significantly reduced. The calcium/magnesium sediments can maintain a relatively negative protection potential on the surface of the protected cathode.
The final surface state at one point is the result of a gradual accumulation process involving many tiny steps. is the integral of the current density function and the growth coefficient of the calcium/magnesium sediments to the polarization time as shown in Equation (5).
In the end, the surface state of one point remains almost unchanged, and the polarization potential and the current density remain almost constant.
The time needed to achieve a final almost constant state may be different at each point. But the parallel connection for the polarization process of each point is just the entire polarization process on the jacket’s surface.
Based on the above analysis, this paper presents a new concept for the boundary conditions of the jacket. During the polarization process of each point, there is a relationship curve of potential/current density for which the starting time is the moment when the jacket is launched into seawater and the terminal time is the moment when one point reaches an almost constant state. Once this constant state has been reached, the values of the potential and current density of one point change very little, meaning that the endpoint of the relationship curve of potential/current density at one point is constant. The fitting curve based on the endpoints of each relationship curve of potential/current density is the final and real boundary condition. The existing measurement methods begin from the same initial polarization current density, while this new method begins from different initial polarization current densities.
2.2. Experimental Measurements for the Real Boundary Conditions
2.2.1. Experimental Conditions and Parameters
One real steel offshore platform jacket with sacrificial anodes in Bohai Bay is selected as the research object for the boundary conditions.
The jacket is made of DH36 steel. The steel is composed of the following (mass ratio, %): C 0.16, Si 0.25, Mn 1.30, P < 0.25, S < 0.01, Nb 0.015~0.025, and the remainder is Fe. During the process of construction, the steel is exposed to a marine atmospheric environment for 11 months before being launched into seawater. After 11 months in the atmospheric environment, the oxide rust layer on the surface increases the surface resistance of the cathode and reduces the current density of cathodic protection which is compared with that of bare steel. The main components of the thin rust layer are , and . Data of components of the thin rust layer, based on Raman and IR methods, come from the steel seller. The local atmospheric environment is as follows: temperature, 13.7 °C; relative humidity, 73%; rainfall, 71.3 mm∙month−1; Cl− in rainwater, 0.381 mg∙m−3; SO32−, 0.4186 mg∙dm−2∙d−1 (data collected by a sensor on a square decimeter of surface area over one day); PH of rainwater, 5.6.
The material of the sacrificial anode is made of an Al-Zn-In-Sn alloy. The Al–Zn–In–Sn alloy anode is composed of the following (mass ratio, %): Zn 3.02, In 0.022, Sn 0.026, Si 0.056, Fe 0.079, Cu 0.00024 and Al 96.80.
Some parameters and information of this cathodic protection system are listed in Table 1. The potential is measured with respect to the Ag/AgCl electrode and the unit of potential is millivolts (mV) in this study. All seawater parameters came from measurements.

Table 1.
Parameters of the cathodic protection system.
2.2.2. Preparation and Calibration for Electrodes
In this paper, the measurement results are based on a large number of Ag/AgCl reference electrodes. At least twenty-five reference electrodes will be used. Sixteen of these are wire electrodes. Eight of the electrodes are cylinders with a diameter of 2 cm. One electrode is a cylinder with a diameter of 3 mm. To ensure the consistency of the results based on different reference electrodes, the electrodes must be prepared and calibrated under the same conditions. The Ag/AgCl electrodes are made from AR (Analytical Reagents, Tianjin Maisike Chemicals Co., Ltd., Tianjin, China) material with a purity of more than 99.95%. The AR material is purchased from Tianjin Maisike Chemicals Co., Ltd. in China. Before installation, the performance is tested in seawater at a temperature of 11 °C for a period of twenty-five days. Saturated Calomel electrodes are selected as the standard electrodes.
2.2.3. Experimental Devices and Measurements
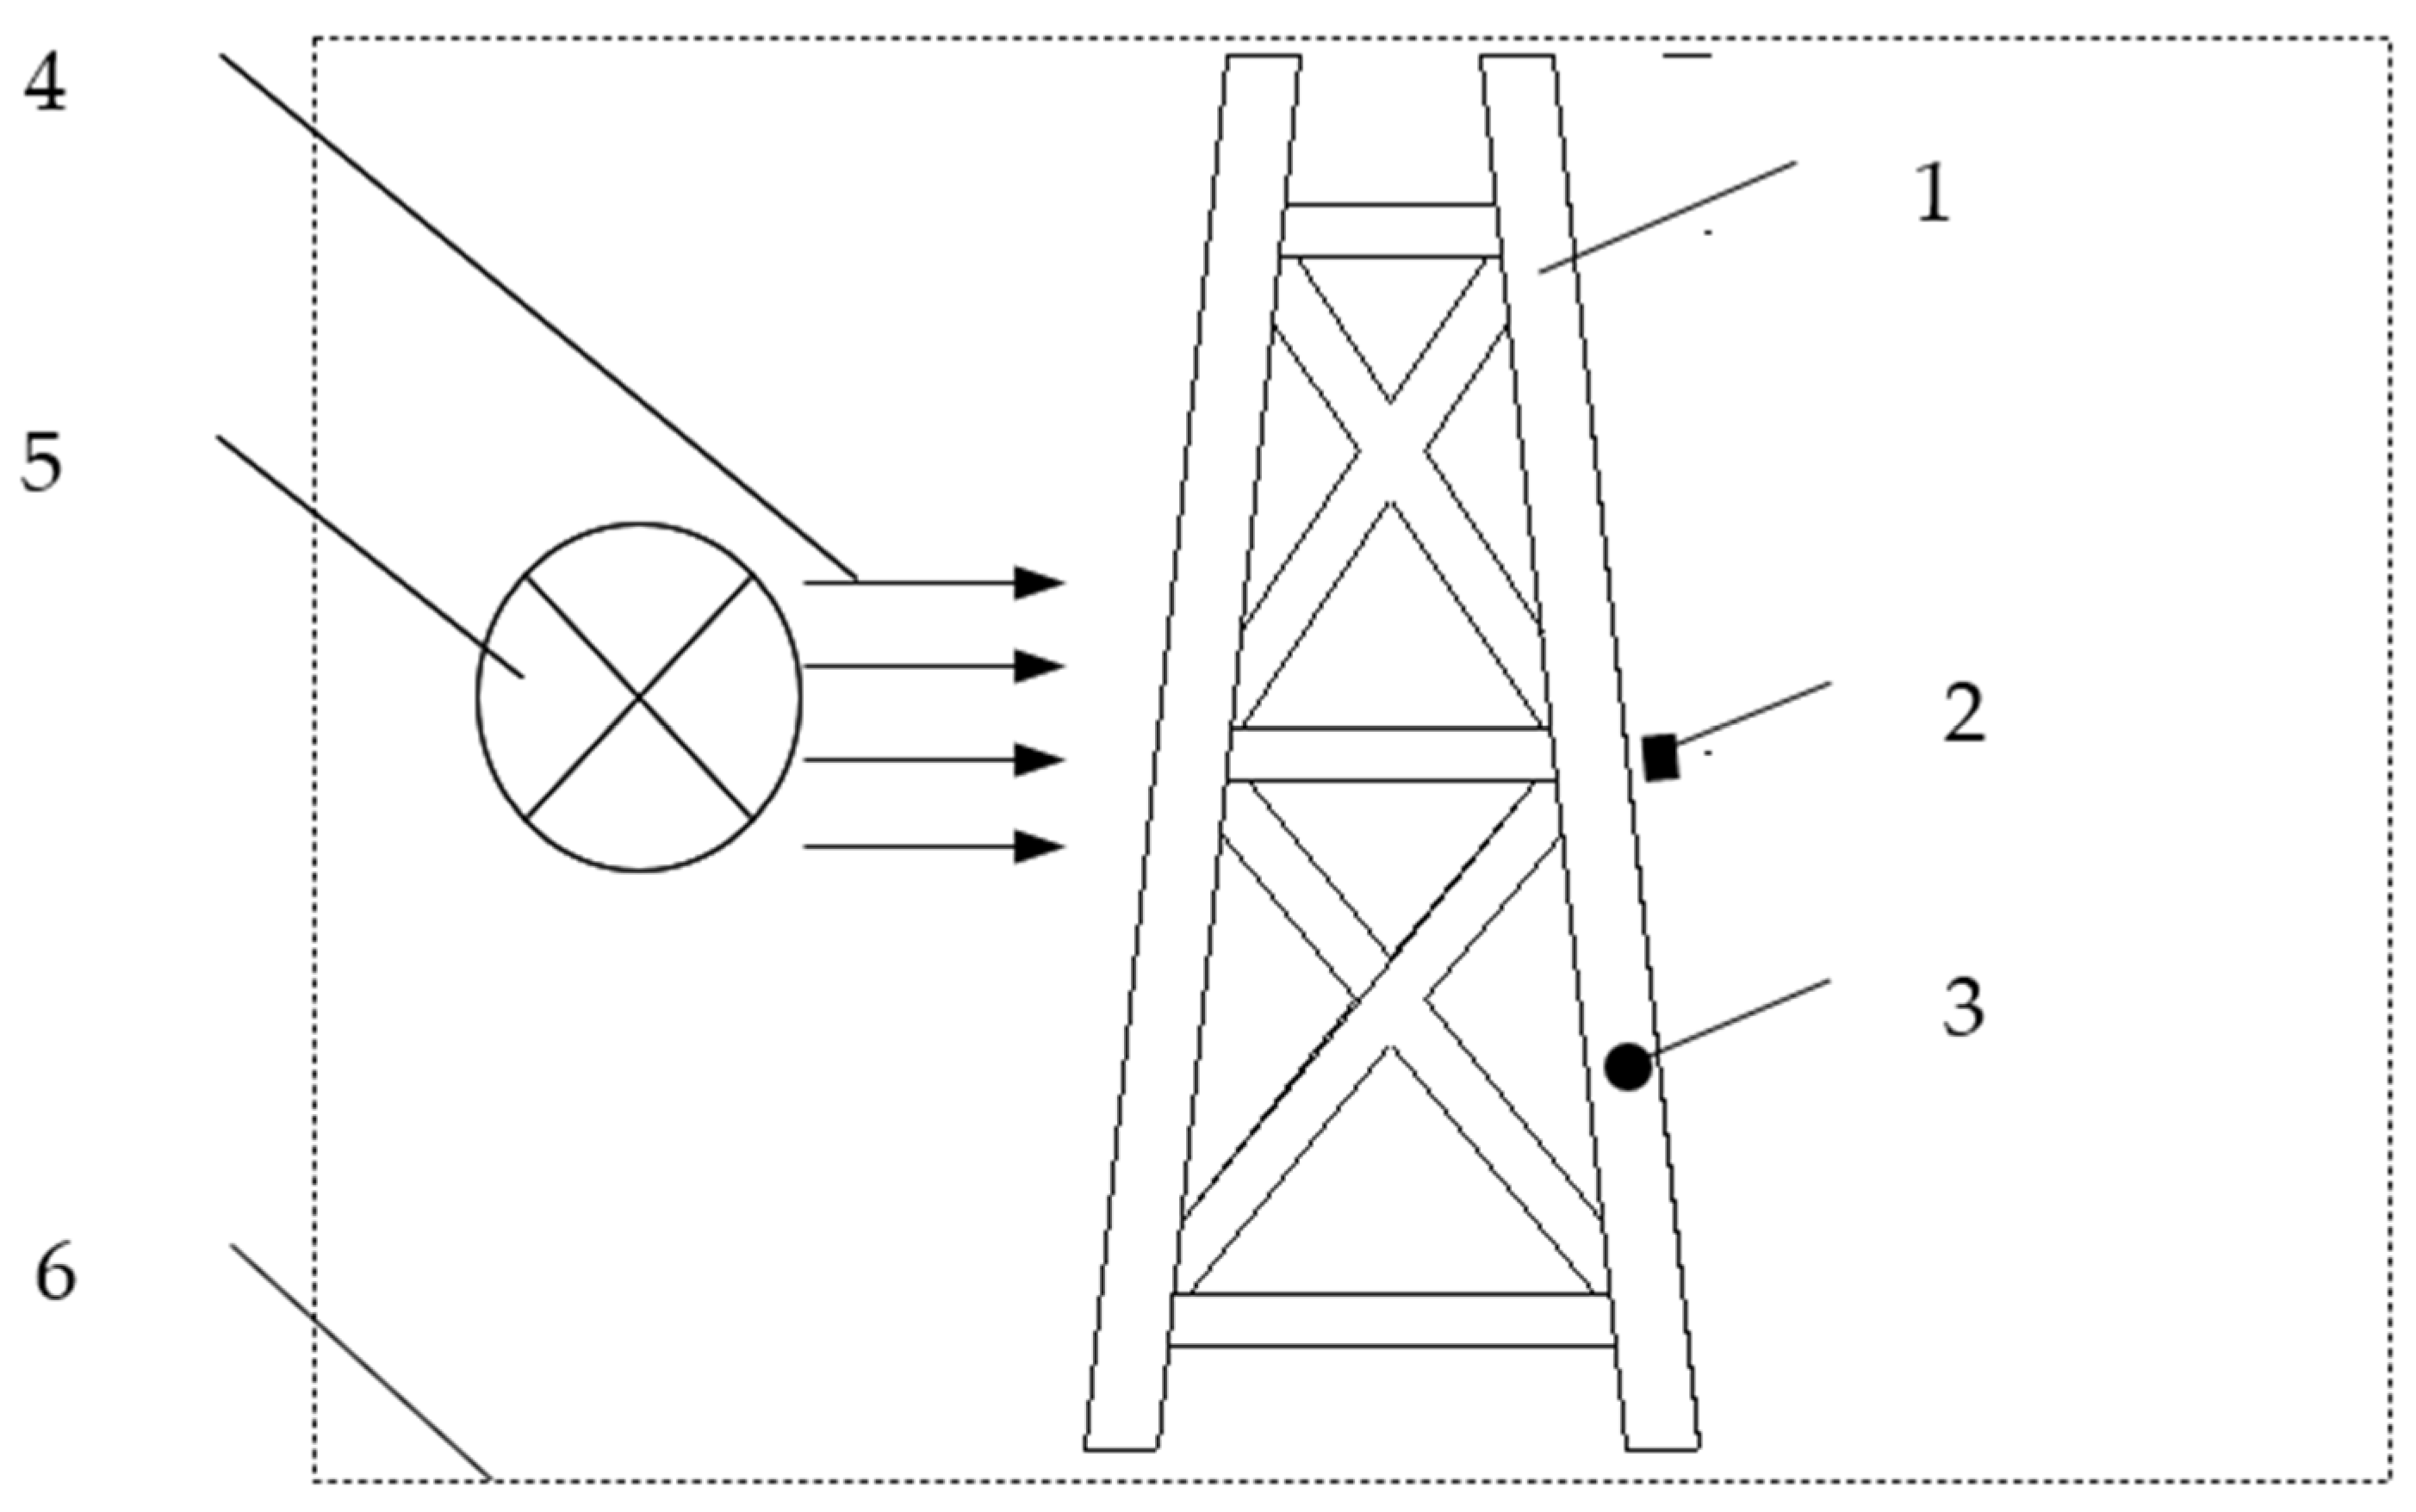
To obtain the real relationship function of potential/current density, a set of devices is designed as shown in Figure 1 according to the new concept for the boundary conditions.

Figure 1.
A small test device for electrochemical boundary conditions of jacket. 1. Jacket. 2. Anode. 3. Measurement equipment. 4. Direction of flowing seawater. 5. Equipment for generating a flow of seawater. 6. Pool.
The experiments are carried out in a large pool. One piece of equipment is used to generate a flow of seawater at 0.1 m/s. The environmental parameters of the seawater are the same as in Section 2.2.1. A small test jacket has been constructed. This device is not used to simulate the distribution of the electrochemical field of the real jacket’s cathodic protection systems, but it is used to provide the boundary function that impacts the distribution of the electrochemical field. Therefore, the structure and the shape of the jacket or anode are not necessarily the same as in the real jacket. The position of the anode does not have to be the same as in the real cathodic protection system either.
The maximum width is 0.6 m in the X direction and Y direction, and 1.6 m in the Z direction. There are two kinds of pipe diameters: Φ60 mm and Φ40 mm. Steel DH36 is used for the jacket, which is the same as the real jacket. Before entering into seawater, the small test jacket is exposed to the same atmospheric conditions for 11 months to ensure that the initial surface state matches that of the real jacket. The average construction period of this type of offshore oil platform is 11 months, so this period is simulated to achieve the closest effect.
In order to ensure that the potential and current density of the experimental device can reflect the true polarization process of the real jacket, two limiting conditions must be set. Firstly, to ensure that the shapes and the tendencies of the received boundary functions meet the requirements of the real jacket’s cathodic protection systems, the area proportion of the cathode and anode must be equal to those of the real jacket’s cathodic protection systems. Secondly, to ensure that the starting point and ending points of the function intervals meet the requirements of the real jacket’s cathodic protection systems, the test device’s initial current density intervals must include those of the real jacket’s cathodic protection systems. The scaling of the small test jacket is mainly based on the cathode’s surface area, the required current density, and the structure of the actual jacket.
According to the above two conditions, a suitable Al–Zn–In–Sn alloy-anode is installed on the test jacket to provide a cathodic protection current. The shape and dimension of this anode can be determined using Dwight’s equation.
R is the anode resistance (Ω), L is the anode length (cm), r is the approximate anode radius, and is the average resistivity (Ω. cm). The anode is a cylinder which has a length of 4 cm and a diameter of 1.5 cm. The position of this anode is shown in Figure 1.
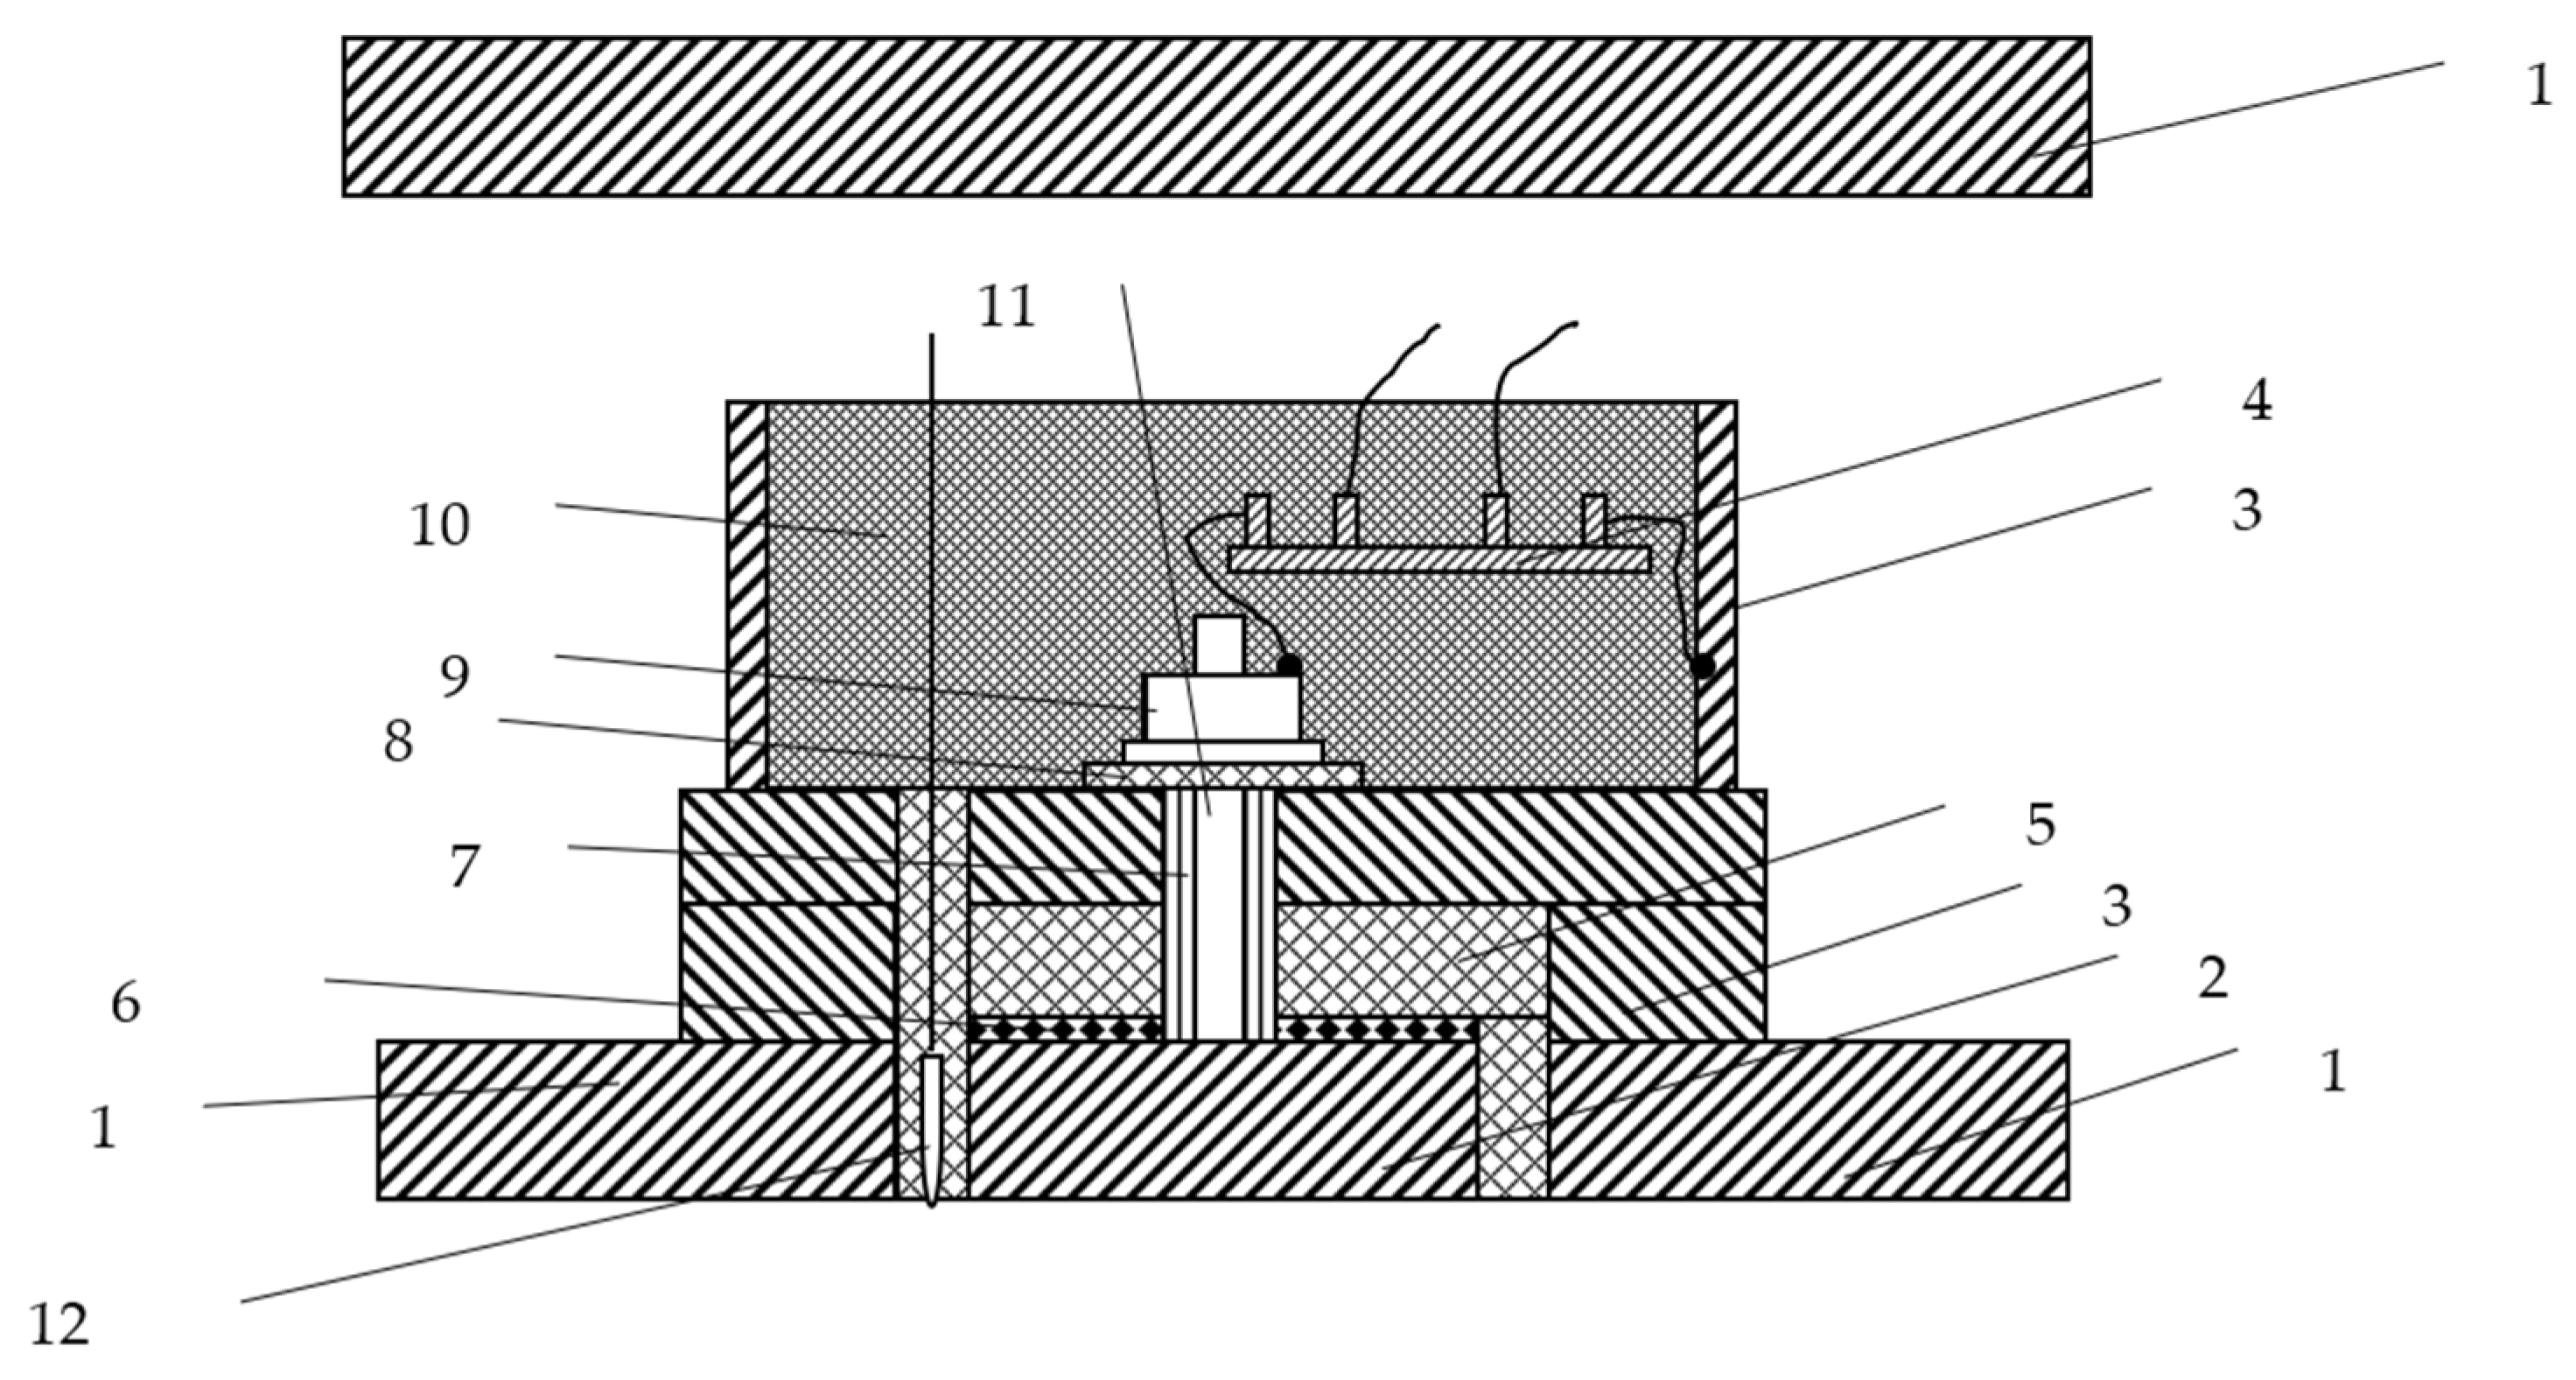
Equipment 3 in Figure 1 is a type of measurement equipment that can be used to record potential and current density data at one point. Figure 2 shows the details of measurement equipment 3. The measurement equipment and the measurement method have been authorized by a Chinese invention patent [23]. Sixteen sets of new measurement equipment, as shown in Figure 2, are installed uniformly on the test jacket.
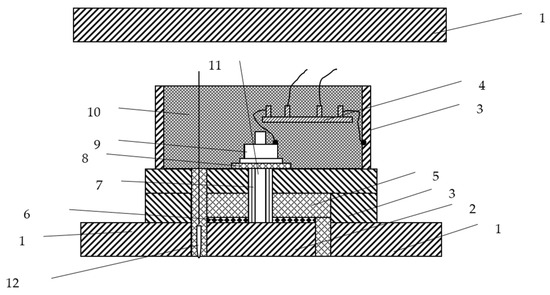
Figure 2.
Measurement equipment. 1. Test jacket. 2. Test specimen at in situ measurement point. 3. Stuffing box and base. 4. Shunt. 5. Insulating pad A. 6. Seal ring. 7. Insulating sleeve. 8. Insulating pad B. 9. Nut. 10. Epoxy resin. 11. Conductive bolt. 12. Ag/AgCl reference electrode.
This equipment can simulate the real state of a specific in situ measurement point without destroying the original current loop.
As shown in Figure 2, a test specimen is used instead of an in situ measurement point. The test specimen is prepared as follows: Firstly, the steel from the original measurement point is cut and used as the test specimen. Secondly, the steel specimen is welded together with a conductive bolt. Finally, the steel specimen is reinstalled in the original position according to the layout in Figure 2. The surface area of each test specimen is 1 cm2.
The post reference method is used to install the Ag/AgCl electrodes, which reduces the IR voltage drop in seawater. Sixteen wire electrodes are used.
The measuring unit is encapsulated by the insulation materials, and the current of cathodic protection absorbed at this point is connected to the whole structure via the bypass. A shunt is used in the bypass to obtain an accurate current density. The standard resistance value of the shunt is 0.0075 Ω. The 1.0 A and 5.0 A currents are used to test the accuracy of each standard resistance, respectively. The voltage is measured with a high precision millivoltmeter. The test results show that all the converted voltage values are 7.5 mV/A. Therefore, the standard resistance is highly precise.
The curve of potential/current density at each point is recorded by the measurement equipment. Data are recorded every two hours. The final polarization time is the time needed by the point with the slowest speed of the polarization process. The real boundary condition can then be obtained based on these curves using the new method in Section 2.1.
2.3. Verification for the Real Boundary Condition
2.3.1. Verification by the Small Test Jacket
Once the real boundary condition has been acquired, it is used to calculate the small jacket. The potential distribution is calculated using BEASY 10.0 (BEASY is a corrosion and electrochemical calculation software based on the boundary element method and developed by CM BEASY company of Southampton, UK). BEASY is the best boundary element software for calculating the cathodic protection of the oil platform jackets. It can solve the problem of complex offshore jackets. To test the correctness of the boundary condition, the final potential values at these sixteen measuring points are compared with the calculated values.
2.3.2. Verification by the Real Steel Offshore Platform Jacket
If the results of verification by the small test jacket are reasonable, the study will begin to give the potential distribution of the real offshore platform jacket. To verify the calculation accuracy for the cathodic protection system of the real jacket [24,25], eight special points are selected as monitoring points for experimental underwater measurement and installing long-term monitoring sensors. Point 1, Point 3, Point 4, Point 5, Point 6, Point 7, and Point 8 are on the surface of the jacket without interference from anodes. Point 2 is near the anodes.
During the 6-year service of this offshore platform jacket, the divers would be sent to measure the potentials during the annual routine inspection for the jacket. One electrode with a diameter of 3 mm is used. In addition, data from long-term monitoring sensors were recorded every two hours during the 6-year service. Eight electrodes with a diameter of 2 cm are used. The potential values of these eight points are compared with the calculated values. The material composition and processing technology of the measurement electrodes used by the divers and the probe electrodes used for the 6-year long-term monitoring are identical. In order to ensure accuracy, they are Ag/AgCl electrodes with different diameters.
3. Results and Discussion
3.1. Preparation and Calibration for Electrodes
The test results are shown in Figure 3. For clarity, only the curves of sixteen reference electrodes are plotted here. At the beginning of the measurement, the potentials are between 8.20 and 8.45 mV. Then, the potentials become positive. After 7 days, the potentials are between 9.20 and 9.82 mV. The maximum potential fluctuation is less than or equal to 0.58 mV. The stability of Ag/AgCl electrodes can meet the requirements of the DNV (the Norwegian Classification Society). The DNV standards are the most widely used for the underwater detection of cathodic protection in offshore jackets.
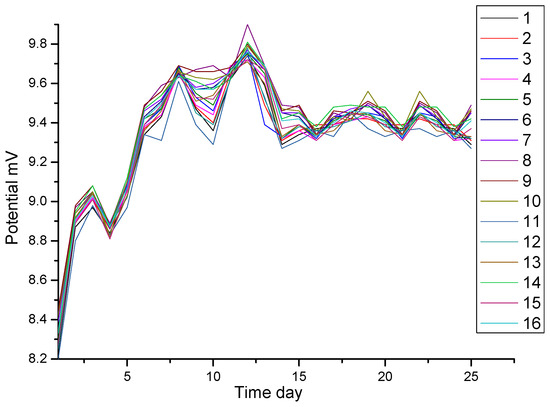
Figure 3.
Test results of potential stability of Ag/AgCl electrodes in seawater.
3.2. The Real Boundary Condition from Test
Sixteen sets of potential/time curves, sixteen sets of current/time curves and sixteen sets of potential/current density curves are received by the measurement equipment given in Section 2.2. As there are a lot of curves in one figure, this paper only shows partial curves or an enlarged section of some curves to be convenient for observation and analysis.
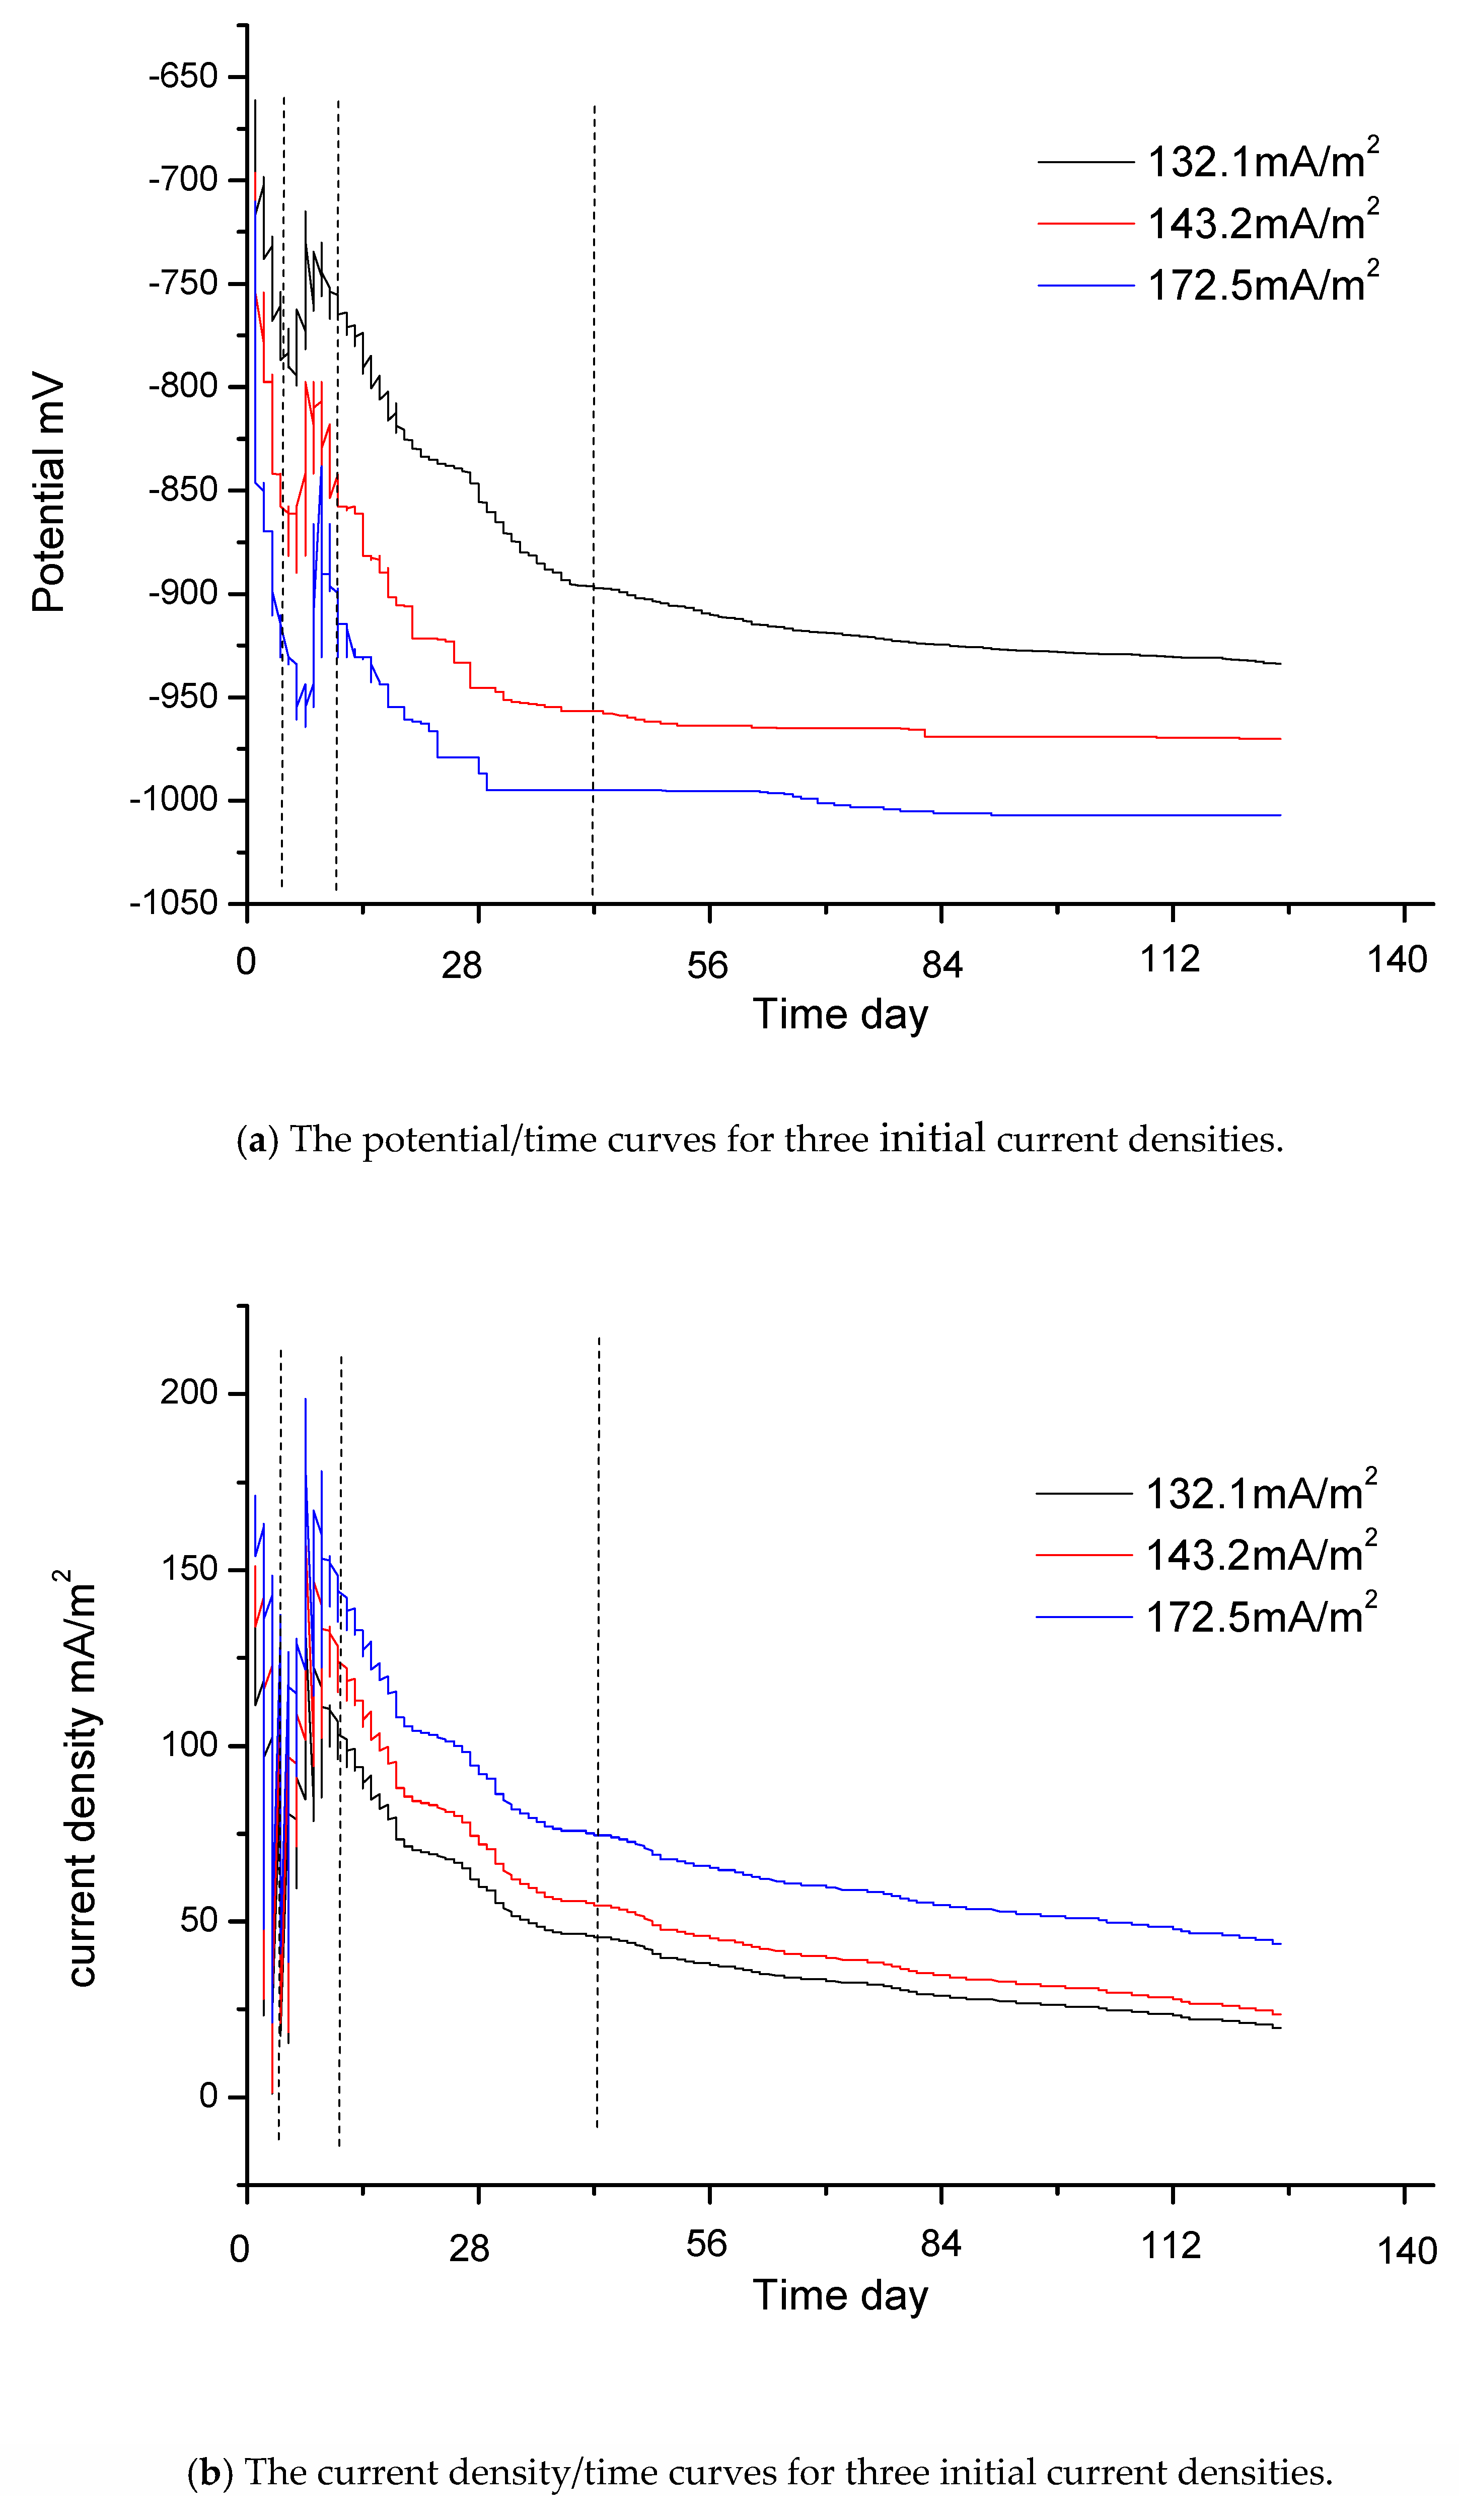
Figure 4a shows the potential/time curves for three different initial current densities: 132.1 mA/m2, 143.2 mA/m2 and 172.5 mA/m2. Figure 4b shows the current density/time curves for these three different initial current densities. Figure 4c is the potential/current density curve for which the initial current density is 132.1 mA/m2. The time interval is from day 0, when the jacket is launched into the seawater, to day 140, when the jacket reaches the final steady state. The relationship curves of potential/time and current density/time include four stages. The vertical dashed lines in Figure 4a–c indicate the four stages.

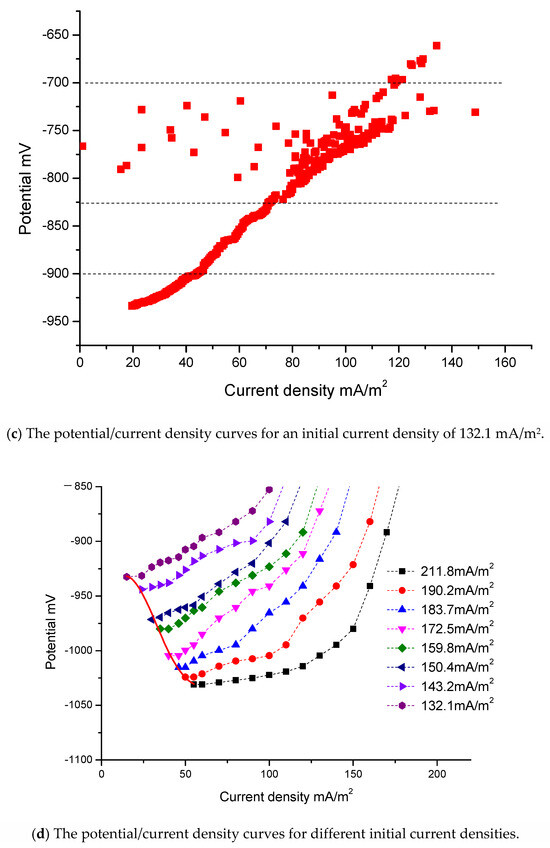
Figure 4.
The real boundary condition.
The four stages can be explained based on the reactions at the cathode [26,27].
O2 + 2H2O + 4e− → 4OH−
OH− + HCO3− → H2O + CO3−2
CO3−2 + Ca+2 → CaCO3↓
Mg+2 + 2OH− → Mg(OH)2↓
The first stage is the stage of rapid polarization. Potential data changes quickly and the slopes of these curves are relatively large. At the beginning of the measurement process, the slope of these curves is very large. The reasons for this are as follows: When the jacket is launched into seawater, there is a large driving voltage. The steel surface has only a thin layer of rust and can absorb a large current density. However, there are only limited concentrations of oxygen in seawater, which are insufficient to cut off the charge. At this stage, reaction (8) is the main reaction. The slow speed of reaction (8) affects the degree of polarization. The speed of oxygen depolarization lags far behind the current supply. Due to the large amount of charge accumulation on the steel surface, the steel is polarized rapidly. In addition, there are only a few OH− ions in the seawater at this stage, and calcium/magnesium sediments are either still in the embryonic stage or have only just begun to appear. Consequently, the curves change sharply at the beginning. The potential values become negative in Figure 4a, and the values of current density in Figure 4b become very large in a very short period of time. However, this initial process is very short and the sampling time for the instrument is also very short. Consequently, the sampling data at the first stage, as shown in Figure 4c, are very sparse.
The second stage is the stage of data jumping. As shown in Figure 4a–c, the data are irregular and jump continuously at this stage. The current density data in Figure 4b,c are particularly unstable. At this stage, a large amount of OH− ions accumulate and there are sufficient conditions for the massive growth of calcium/magnesium sediments. Reactions (9) and (10) will occur on a large scale. However, the specimen’s surface is not completely covered by calcium/magnesium sediments. The whole surface of one specimen is uneven; some areas may remain bare, while others may be partly covered by calcium/magnesium sediments. During the growth process, due to the instability of the sediments, loose sediments will have the possibility of abscission. The deposition and the abscission on the surface of one specimen will be repeated several times. Consequently, at this stage, the data of each curve jump significantly. Some potential data may become very positive in Figure 4a and some current density data may become very large in Figure 4b. Reaction (10) can reduce the concentration of OH− ions. When the right reaction products of reaction (8) reduce, the speed of reaction (8) accelerates. The increasing depolarization of oxygen may result in positive potential and the current density may increase. This may be the reason that there are some positive potential values in Figure 4a and high current density values in Figure 4b. The adhesion of calcium/magnesium sediments increases the resistance and reduces the current density. When calcium/magnesium sediments fall off, the resistance decreases and the current density increases. At the second stage, the growth of calcium/magnesium sediments on the steel surface is a repetitive and gradual process, resulting in irregular data.
The third stage is the stage of polarization with middle speed. Once most of the surfaces of the steel specimens have been covered with sediments, the steel specimens gradually enter into the stage of stable polarization again. Although calcium/magnesium sediments still grow, this process mainly increases the thickness of sediments. As a result, it becomes more and more difficult for the oxygen to reach the surface of the steel. Reactions (8), (9), (10) and (11) are all very slow. The ability of the depolarization of oxygen is weakened. Consequently, the process of polarization can be driven by a low current density. The potential of the steel gradually becomes more negative and the current density gradually decreases. However, the slopes of this stage are smaller than those of the first stage. The polarization will go towards a mild trend until the fourth stage.
The fourth stage is the stage of slow polarization. At the end of the measurement process, the slopes of these curves in Figure 4a,b are very small and these curves become almost straight lines that are parallel to the horizontal axis. At this stage, reaction (8) reaches the slowest speed. The productions of reactions (9), (10) and (11) can be neglected.
Because the initial current densities of some curves are close to those of others, some curves are very close to others. To be convenient for observation, only eight curves are shown in dashed lines in Figure 4d. The other eight curves only provide the final endpoints for fitting. The respective initial current densities of the eight curves are 211.8 mA/m2, 190.2 mA/m2, 183.7 mA/m2, 172.5 mA/m2, 159.8 mA/m2, 150.4 mA/m2, 143.2 mA/m2 and 132.1 mA/m2.
As shown in Figure 4d, if the initial current density is different, the resulting curve will also differ. If the differences between the initial current densities of the curves are much greater, it is much easier to distinguish the curves.
Fortunately, the purpose of this study is to find the end data of the curves, so the initial jumping data do not affect the final results and are not necessary to be taken into account. Therefore, the initial jumping data and some singular values form measurement can be selected and abandoned. To make this clearer, the first stage and the second stage have been deleted from Figure 4d.
These curves in Figure 4d mainly give the third stage and the fourth stage. These eight curves are almost identical in shape and trend.
At the end of polarization, the driving voltages decrease and there are better calcium/magnesium sediments. Under the conditions of low current density, a relative balance is gradually reached between the protection current density and oxygen depolarization. The slopes of the curves become gentler, and eventually, the curves will not extend any further.
The intervals of the initial current densities in Figure 4d are from 132.1 mA/m2 to 211.8 mA/m2, and there is a difference of about 80 mA/m2. As the difference in the initial current density is relatively large, the intervals between the curves in the figure are also relatively large. However, the interval of the final current density is from 15 mA/m2 to 55 mA/m2, with a difference of only about 40 mA/m2. The interval of current density has a convergence phenomenon. The values of potential at the beginning in Figure 4a have a certain relationship with the self-corrosion potential, but are not entirely equivalent to the self-corrosion potential. They have no obvious rules. The interval of final potential is from −932.4 mV to −1030.9 mV. The convergence phenomenon of the final current density is determined by the apparent resistance of the cathode. With the increase of calcium/magnesium sediments, the apparent resistance of the cathode is far greater than in the initial state, and the difference in current density due to the distance becomes negligible.
Ultimately, all specimens reach a state of relative balance, with almost no change in the current density and the potentials reaching a most negative point. Unless there is a significant disturbance, such as a change in the seawater flow velocity or the abscission of calcium/magnesium sediments, the curves will not be changed. When the curve from record data of the instruments is not extended and scattered focus points are drawn, it is thought that the curve is stable and the measurement of this curve can stop. The average value of the scattered focus points is the final endpoint value. The measurement ends when the slowest curve has stabilized.
The red solid line on the left side in Figure 4d is the curve of the boundary condition. It is a polynomial fitting curve of six squares according to the endpoints of all curves. The fitting curve only gives the interval from 15 mA/m2 to 55 mA/m2 according to the actual requirements.
Due to the formation of the calcium/magnesium sediments, the protective conditions on the steel surface are improved. At this time, even a very small change in current density can cause a large change in polarization potential. This is consistent with the real-world applications.
3.3. Verification for the Real Boundary Condition by the Small Test Jacket
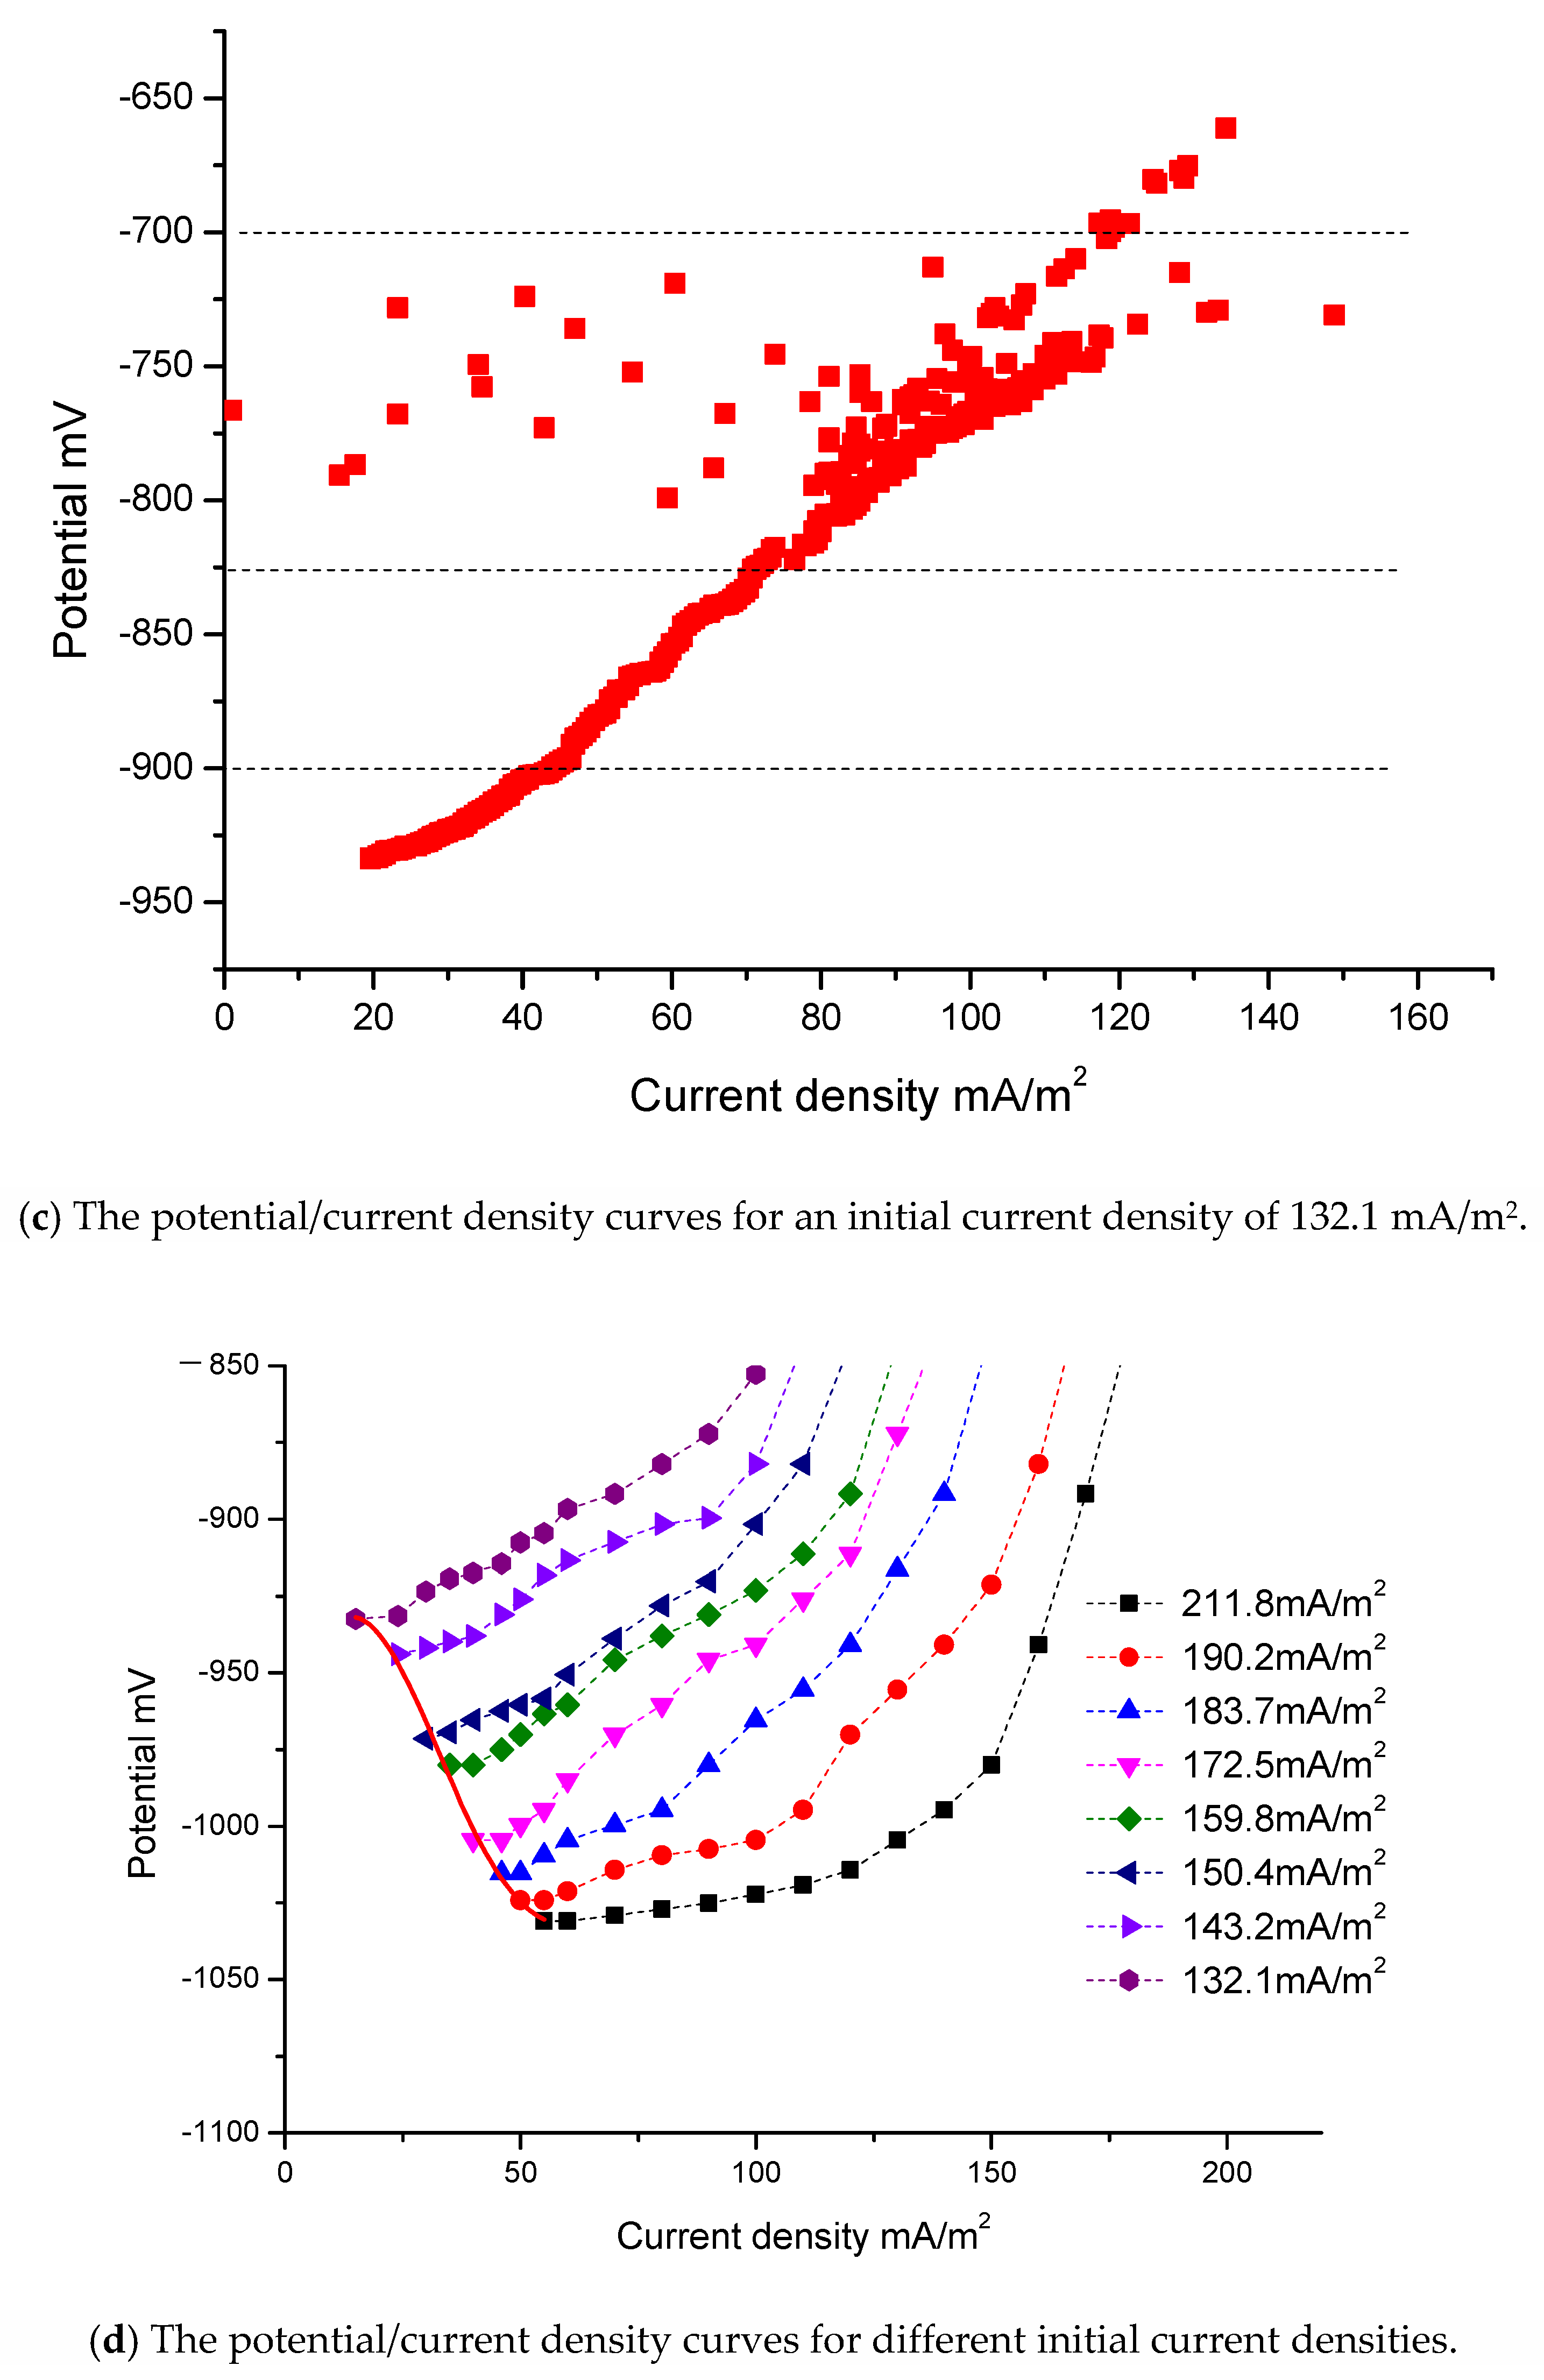
There are two Histograms in Figure 5a. One shows the calculated values of sixteen special points from the BEM, and the other shows the real values of sixteen special points from the measurement. From these two Histograms, the maximum relative error between the calculation and the measurement is 1.37%, which appears at point 1. Most of the relative error between the calculation and the measurement is less than 1%. In Figure 5b, after fitting for the values of the measurement and BEM, the variance R2 is 0.9288. The correlation is based on variance. The variance is positive and close to 1. The correlation between the BEM and the measurement is very good. Therefore, the boundary condition is correct and reasonable for the small test jacket.
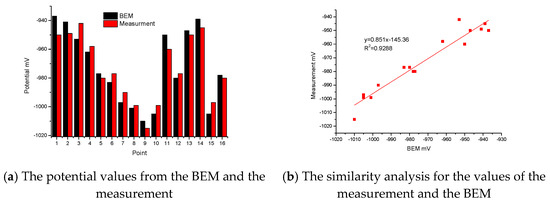
Figure 5.
Comparison of potential between BEM and measurement.
3.4. Verification for the Real Boundary Condition by the Real Jacket
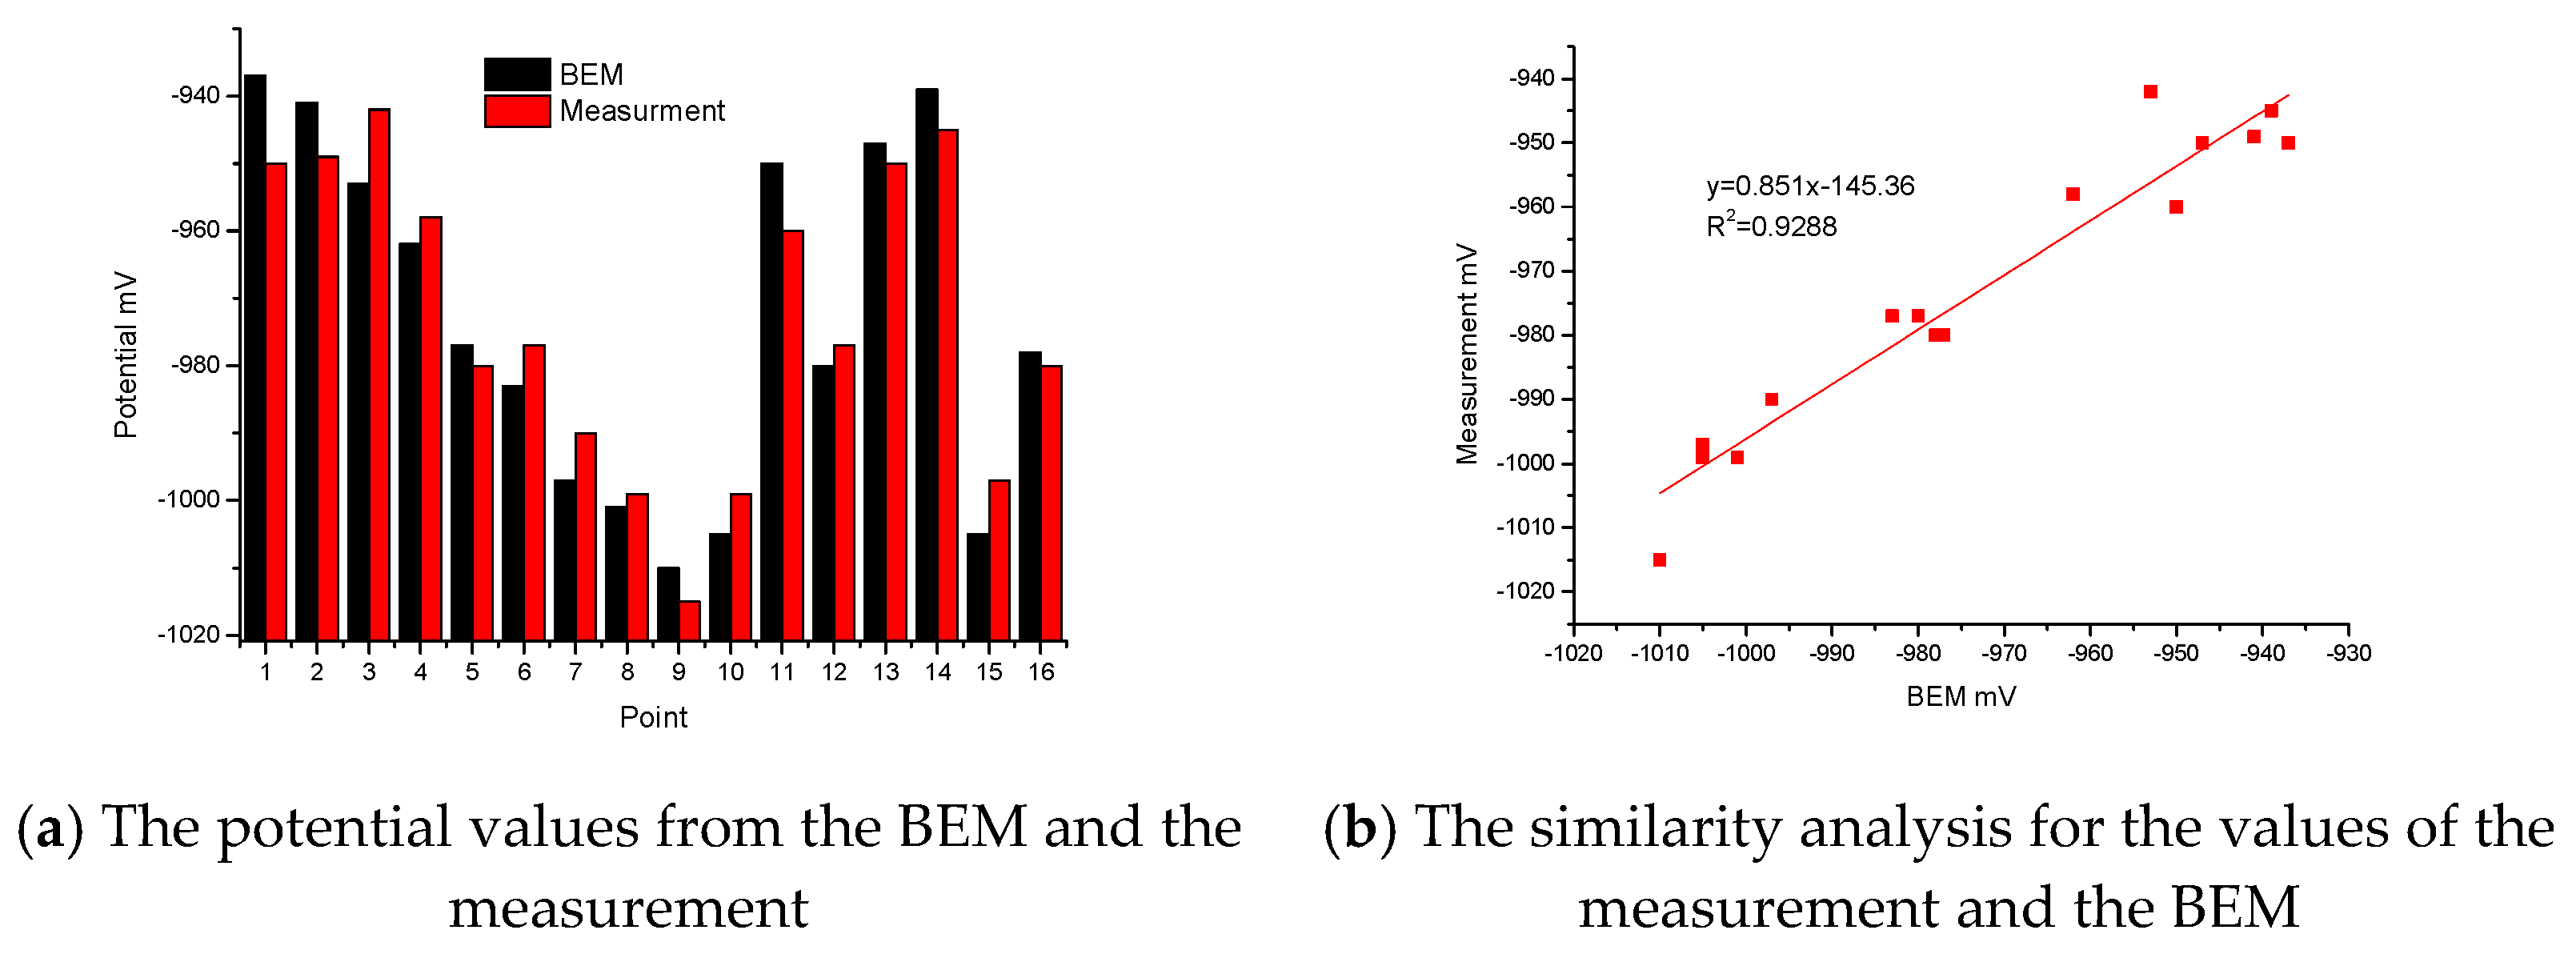
Figure 6a shows the whole potential distribution of the jacket during the maintenance period. The potential values of the jacket are between −943 mv and −1026 mV. The range of the right scale is larger than the calculated results. In order to facilitate observation, Figure 6b has been plotted. The potential values are mainly divided into three intervals: −943 mV to −956 mV, −958 mV to −972 mV and −974 mV to −1026 mV. The potential values basically are in accordance with a normal distribution. Most of the potential values are in the interval of −974 mV to −1026 mV. The peak is located at about −1000 mV. The potential values of the jacket can reach the requirements of the standard.
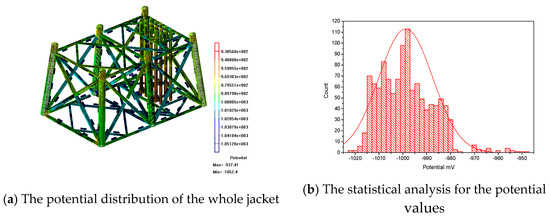
Figure 6.
The potential distribution of the real jacket.
Figure 7a shows three sets of data. The data from the measurement and monitoring are the 6-year average values. From these three Histograms, the maximum relative error between the BEM and the measurement is 0.63%, which appears at point 3, and the maximum relative error between the BEM and the monitoring is 1.23% which appears at point 8. Based on these three sets of data, it is clear that the calculated values are close to the average values of the experimental underwater measurement and the average values of the monitoring system. In Figure 7b, after fitting for the values of the measurement/BEM, the variance R2 from the measurement/BEM is 0.9787, and the correlation between the BEM and the measurement is very good. After fitting for the values of the monitoring/BEM, the variance R2 from the monitoring/BEM is 0.949, and the correlation between the BEM and the monitoring is also very good. Therefore, the boundary condition is correct and reasonable for the real jacket.
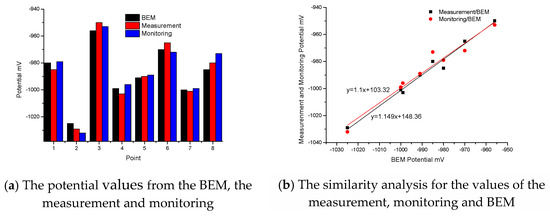
Figure 7.
Comparison of the potential values between the BEM, the measurement and monitoring.
4. Conclusions
- (1)
- This study considers that a different position has a different surface state, and the relationship curve of potential/current density at each position is not the ultimate boundary condition. The fitting curve based on the terminal points of all relationship curves of potential/current density is the ultimate boundary condition. The new conception for the boundary condition is different from traditional views.
- (2)
- All the curves at the sixteen different points include four stages: The first stage is the stage of rapid polarization, where the potential data change quickly and the slopes of these curves are relative large; the second stage is the stage of data jumping, where the data are irregular and jump continuously; the third stage is the stage with middle speed, where the slopes of these curves are gentle; the fourth stage is the stage of slow polarization, where the curves are almost close to straight lines. At the end of the measurement, the interval of current density has a convergence phenomenon.
- (3)
- During verification for the real boundary condition, the maximum potential error between the calculation and measurement of the test jacket is 1.37%. The maximum error between the calculation and measurement of the real jacket is 0.63%, and the maximum error between the calculation and monitoring of the real jacket is 1.23%. Furthermore, the correlation between the real values and calculated values is very good, and the new conception and method for the real boundary condition is correct and reasonable.
- (4)
- The new concept for the real boundary condition in numerical simulation of the cathodic protection system of the offshore platform jackets can be applied to numerical simulation for other offshore structures without a coating, such as the steel piles of wharfs.
Author Contributions
Writing—original draft, Z.W.; methodology, J.Z.; writing—review and editing, H.L.; conceptualization, B.H.; supervision, B.H.; project administration, H.L. All authors have read and agreed to the published version of the manuscript.
Funding
This research was funded by the Major Basic Research Project of Natural Science Foundation of Shandong Province, China (No. ZR2023ZD31), and the National Natural Science Foundation of China (No. 42076043).
Data Availability Statement
The data presented in this study are available on request from the corresponding author.
Conflicts of Interest
Authors Zaifeng Wang and Haishan Liu were employed by the company China National Offshore Oil Corporation. The remaining authors declare that the research was conducted in the absence of any commercial or financial relationships that could be construed as a potential conflict of interest.
References
- Rodopoulos, D.C.; Gortsas, T.V.; Tsinopoulos, S.V.; Polyzos, D. ACA/BEM for solving large-scale cathodic protection problems. Eng. Anal. Bound. Elem. 2019, 106, 139–148. [Google Scholar] [CrossRef]
- Danson, D.J.; Warne, M.A. Current density/voltage calculations using boundary element techniques. In Proceedings of the NACE Conference, Los Angeles, CA, USA, 18 April 1983. [Google Scholar]
- Adey, R.A.; Niku, S.M.; Brebbia, C.A.; Finnegan, J. Computer Aided Design of Cathodic Protection Systems. Presented at the International Conference on Boundary Element Methods in Engineering, Lake Como, Italy, 24–27 September 1985. [Google Scholar]
- Adey, R.A.; Brebbia, C.A.; Niku, S.M. Applications of Boundary Elements in Corrosion Engineering. In Topics in Boundary Element Research; Brebbia, C.A., Ed.; Springer: Berlin/Heidelberg, Germany, 1990; Volume 7. [Google Scholar]
- Wang, X.; Hou, B.; Li, Y. Boundary element method for the cathodic protection in sea mud. Mar. Sci. 2006, 30, 62–64. [Google Scholar]
- Brichau, F.; Deconinck, J. A numerical model for cathodic protection of buried pipes. Corrosion 1994, 50, 39–49. [Google Scholar] [CrossRef]
- Song, J.; Lan, Z.; Wang, Z.; Ji, J. Cathodic protection desgin and cathodic protection prodution films in seawater. Corros. Prot. 2010, 31, 265–267. [Google Scholar]
- Lan, Z.; Wang, X.; Hou, B.; Wang, Z.; Song, J.; Chen, S. Simulation of sacrificial anode protection for steel platform using boundary element method. Eng. Anal. Bound. Elem. 2012, 36, 903–906. [Google Scholar] [CrossRef]
- Fan, F.; Song, J.; Li, C.; Du, M. Effect of flow velocity on cathodic protection of DH36 steel in seawater. J. Chin. Soc. Corros. Prot. 2014, 34, 550–557. [Google Scholar]
- Fischer, K.P.; Finnegan, J.E. Calcareous Deposits: Calcium and Magnesium Ion Concentration; Corrosion/89; NACE: Houston, TX, USA, 1989; p. 581. [Google Scholar]
- Wang, A.; Du, M.; Wang, Q.; Cao, S.; Sun, J. Construction of Three-Dimensional Finite Element Model for Complicated Cathodic Protection System. Electrochemistry 2007, 13, 360–366. [Google Scholar] [CrossRef]
- Wang, A.; Du, M.; Lu, C.; Cao, S.; Wang, Q. Finite element method for an offshore platform with complex nodes with a protection system. Period. Ocean. Nuniversity China 2007, 37, 129–134. [Google Scholar]
- Ji, J.; Du, M.; Wang, Q.; Liu, F.; Sun, J. The ascertainment of boundary condition for numerical value calculation in cathodic protection of simulation submarine pipeline. Trnsactions Ocean. Limnol. 2008, 3, 85–92. [Google Scholar]
- Cao, S.; Wang, Q.; Zhang, M. Numerical modelling for offshore platform Cathodic protection local system. Chin. J. Oceanol. Limnol. 1995, 13, 247–252. [Google Scholar]
- Sun, K.; Peng, Q.; Xu, X.; Zhang, M. Effect of scan rate polarization curve measurement on numerical simulation of cathodic protection. Mater. Prot. 2014, 47, 62–64. [Google Scholar]
- De Carlo, E.A. Computer Aided Cathodic Protection Design Technique for Complex Offshore Structures; Paper No. 165, Corrosion/82; AMPP: Houston, TX, USA, 1982. [Google Scholar]
- Douglas, P.R.; Mark, E.O. A mathematical model for the cathodic protection of tank bottoms. Corros. Sci. 2005, 47, 849–868. [Google Scholar]
- Hassanein, A.M.; Glass, G.K.; Buenfeld, N.R. Protection current distribution in reinforced concrete cathodic protection systems. Cem. Concr. Compos 2002, 24, 159–167. [Google Scholar] [CrossRef]
- Du, Y.; Zhang, G. The Effect of Soil Resistivity on Cathodic Protection. Potential Distribution Outside of Tank Bottom. J. Petrochem. Univ. 2007, 20, 81–84. [Google Scholar]
- NACE Standard RP0176 (Latest Revision); Corrosion Control of Steel Fixed Offshore Platforms Associated with Petroleum Production. NACE International: Houston, TX, USA, 1976.
- Jiang, K.; Du, Y.; Lu, M.; Dong, L. Selection of Boundary Conditions of Anodes in Numerical Simulation of Cathodic Protection System. Corros. Sci. Prot. Technol. 2013, 25, 287–292. [Google Scholar]
- Zhang, W.; Wang, X.; Li, H.; Lin, Z.; Chen, Z. The Influence of Rust Layers on Calcareous Deposits’ Performance and Protection Current Density in the Cathodic Protection Process. Coatings 2024, 14, 1015. [Google Scholar] [CrossRef]
- Wang, Z.; Lan, Z.; Liu, Y.; Yang, S. Device for Acquiring Relationship Between Cathode Protection Potential on Specific Part of Marine Structure and Current Intensity. CN201110394665, 18 September 2013. [Google Scholar]
- Wang, Z.; Hou, B.; Zhang, J.; Wang, X.; Lan, Z. Optimization of sacrificial anodes for One Offshore Jacket. Mater. Perform. 2016, 55, 20–24. [Google Scholar] [CrossRef]
- Wang, Z.; Hou, B.; Zhang, J.; Song, J.; Chen, S.; Wang, X.; Lan, Z. Numerical Analysis for Cathodic Protection System of One Complex Deep Water Oil Platform Jacket. J. Balk. Tribol. Assoc. 2016, 22, 4849–4863. [Google Scholar]
- Hu, J.; Wang, P.; Deng, P.; Geng, B.; Zeng, J.; Hu, X. A Study of the EH36 Surface Sediment Layer under Joint Protection from Seawater Electrolysis Antifouling and Impressed Current Cathode Protection (ICCP) in a Marine Environment. J. Mar. Sci. Eng. 2024, 12, 1155. [Google Scholar] [CrossRef]
- Ren, J.; Wang, Z.; Xu, W.; Li, Y.; Sun, W. Research Progress of Calcium and Magnesium Deposits Under Marine Steel Structure Cathodic Protection. Mater. Prot. 2020, 53, 126–131. [Google Scholar]


Disclaimer/Publisher’s Note: The statements, opinions and data contained in all publications are solely those of the individual author(s) and contributor(s) and not of MDPI and/or the editor(s). MDPI and/or the editor(s) disclaim responsibility for any injury to people or property resulting from any ideas, methods, instructions or products referred to in the content. |
© 2025 by the authors. Licensee MDPI, Basel, Switzerland. This article is an open access article distributed under the terms and conditions of the Creative Commons Attribution (CC BY) license (https://creativecommons.org/licenses/by/4.0/).