1. Introduction
The economic loss caused by the storm surge hazard is much higher than that caused by any other marine disaster in China, the loss from the severe storm surge hazard being the highest [
1]. Zhejiang Province is one of the regions most severely affected by storm surge disasters in China’s coastal areas, primarily dominated by typhoon-induced storm surges. Historically, Zhejiang has experienced multiple catastrophic typhoon storm surge events, which have significantly impacted the socio-economic conditions of its coastal regions. According to statistics, from 1949 to 2020, a total of 46 typhoons made landfall in Zhejiang Province, averaging 0.6 per year; there were 136 notable typhoon storm surge processes, averaging 2 per year. Research by Sun et al. [
2] and Weisse et al. [
3] indicates that factors such as temperature changes and rising sea levels have led to an increasing trend in both the frequency and intensity of typhoons making landfall in China. Consequently, storm surge disasters along the Zhejiang coast are also on the rise, particularly in the southern coastal areas of Zhejiang. A statistical study of storm surge magnitude makes it possible to determine the severity, and therefore better forecast and prevent losses [
4]. Accurately assessing the risk of typhoons and their associated storm surges is of great significance for disaster prevention and mitigation efforts in Zhejiang Province and the nation as a whole.
To address the limitations of limited sample sizes and data quality in typhoon hazard analysis, the international scientific community has developed a stochastic simulation framework integrating three key components. Firstly, stochastic typhoon modeling generates synthetic cyclones with plausible meteorological parameters. Secondly, a coupled storm surge numerical model simulates inundation dynamics for each synthetic event by resolving hydrodynamic interactions between wind fields, atmospheric pressure, and coastal topography. Thirdly, probabilistic frequency analysis using extreme value theory estimates storm surge heights at specified return periods. This integrated approach systematically addresses the challenges of empirical data scarcity while quantifying uncertainties in hazard assessment.
The stochastic modeling of tropical cyclones has evolved through key methodological innovations. Russell [
5] pioneered the sector-annulus model for synthetic cyclone generation in the Gulf of Mexico, subsequently applying it to typhoon wind speed estimation within the basin. Building upon this foundation, Shapiro [
6] enhanced the methodology by integrating a bespoke typhoon wind field model, enabling cross-regional typhoon hazard assessments with demonstrated predictive skill across diverse geographical regimes. Li and Duan [
7] achieved comparable advancements in their research on coastal typhoon risks by employing a similar stochastic framework. A paradigm shift occurred in 2000 with the development of the full-track stochastic typhoon model by Vickery et al. [
8]. They discretized the Atlantic basin into spatially homogeneous grids and conducted multivariate regression analyses on historical track parameters (e.g., genesis location, translation speed, central pressure) to derive empirical track algorithms for propagation and intensification. This approach has since undergone numerous refinements. Mudd et al. [
9] conducted IPCC RCP8.5 scenario-driven hurricane simulations. Rosowsky et al. [
10] applied Bayesian calibration to empirical track models to enhance the representation of intensity decay after landfall.
Storm surge forecasting has been predominantly conducted through three methodological paradigms: traditional empirical approaches, numerical modeling techniques, and contemporary artificial intelligence-driven solutions. Traditional empirical methods demonstrate inherent limitations due to their susceptibility to subjective interpretation and stochastic error propagation. Numerical modeling approaches, though physically rigorous, impose prohibitive computational demands that constrain operational implementation [
11]. To address these critical challenges, neural network architectures have emerged as transformative tools for typhoon-induced storm surge prediction, leveraging their exceptional capacity to model complex nonlinear relationships between meteorological forcing and hydrodynamic responses. This paradigm shift has achieved dual objectives: enhanced prediction accuracy and significant computational efficiency gains. Lee T L et al. [
12] applied the artificial neural network to predict short-term typhoon surges in order to overcome the problem of exclusivity and nonlinear relationships. Based on Random Forest (RF), Wang [
13] applied an assessment model to evaluate regional flood hazard risk. Zhu et al. [
14] pioneered a machine learning framework through Random Forest regression analysis of 98 historical typhoon events (1989–2018) across China’s southeastern coastal regions (Guangdong, Fujian, Zhejiang). Their data-driven model demonstrated robust predictive capability for maximum surge elevation estimation, with validation errors within 15% of field observations. In parallel innovation, Miao et al. [
15] developed a Long Short-Term Memory (LSTM) neural network specifically optimized for Xiamen Harbor surge dynamics. Systematic comparison with conventional approaches (BP neural networks, support vector machine, and linear regression) revealed the LSTM architecture’s superior performance in short-term forecasting (RMSE reduction > 32%), establishing a new benchmark for operational early warning systems. Tian et al. [
16] employed LSTM, Convolutional Neural Networks (CNNs), and Informer Deep Learning (DL) models for forecasting storm surges over the next 1 h, 3 h, 6 h, 12 h, and 18 h. Sun et al. [
17] used the Res-U-Net structure neural network to predict the storm surge process of typhoons in the Pearl River Estuary and achieved good prediction results.
Substantial scholarly efforts have been devoted to storm surge hazard analysis. Jia et al. [
18] investigated the development of a kriging surrogate model for storm surge prediction utilizing an existing database of high-fidelity, synthetic storms. Zhang [
19] developed a refined multi-scale risk identification framework for typhoon storm surge disasters in Wenzhou by integrating ENVI (5.5)-based remote sensing interpretation, GIS spatial analytics, SPSS (IBM SPSS Statistics 25) statistical modeling, and BP neural networks. Wang et al. [
20] and Li et al. [
21] evaluated the risk of storm surge disasters using the ADCIRC-SWAN (Advanced Circulation Model–Simulating Waves Nearshore) coupled model. Li et al. [
22] established a life loss risk assessment model for coastal city storm surge composite floods based on hydrodynamic models and Copula functions. Guo et al. [
23] collected long-term tidal data from 13 representative hydrological stations along Zhejiang’s coastal zone to systematically analyze the spatial heterogeneity characteristics of storm surge hazards in Zhejiang Province. Yu et al. [
24] employed a two-dimensional Copula joint probability function to construct a vine-structured probability distribution model for compound disaster encounter combinations. Scholars such as Rizzi et al. [
25] and Wang et al. [
26] constructed a risk assessment index system from different perspectives and evaluated the risk of storm surge disasters.
In recent years, AI forecasting models have shown significant application potential in the field of rapid storm surge forecasting due to their efficient modeling capabilities and real-time computing advantages. In terms of data-driven methods, Xie et al. [
27] first applied ConvLSTM to storm surge inundation forecasting in the Pearl River Estuary, achieving autoregressive prediction of sea surface height fields through historical typhoon datasets, reducing RMSE by 23% compared with traditional methods. Qin et al. [
28] developed an ANN-MIMO model integrating multivariate inputs such as wind speed and atmospheric pressure, achieving a 6 h forecast error < 15 cm along China’s southeastern coast. For multi-model coupling, Su et al. [
17] proposed a regional hierarchical forecasting framework: first generating high-resolution simulation data via ADCIRC-SWAN, then training neural networks for rapid inference, improving computational efficiency by 40-fold. Gharehtoragh et al. [
29] developed a climate change proxy model incorporating terrain evolution data, maintaining 85% confidence in century-scale storm surge predictions. Regarding hybrid methods with enhanced physical constraints, Zhu et al. [
30] demonstrated in Bohai Sea case studies that Physics-Informed Neural Networks (PINNs) embedded with Navier–Stokes equations reduced extreme storm surge forecast bias by 34%.
The prediction of extreme wind speeds or water-level sequences predominantly relies on the fitting of extreme value distributions. In typhoon hazard assessment, the most widely adopted extreme value distributions include the Gumbel distribution (Type I), Fréchet distribution (Type II), and Weibull distribution (Type III). Guo et al. [
31] conducted a systematic comparative analysis of these parametric models in typhoon-induced storm surge studies along China’s southeastern coast. Notably, the empirical distribution function constructed solely from raw observational data without prior assumptions about wind speed distribution tail behavior demonstrated superior applicability for large-sample hydrological scenarios. Early research paradigms predominantly favored the Fréchet distribution for modeling typhoon maximum wind speed sequences. However, seminal work by Simiu and Filliben [
32] challenged this convention, statistically verifying that the Gumbel distribution provides a more robust fit for extreme wind speed characterization. Subsequent advancements by Simiu and Heckert [
33] revealed that under the Peak Over Threshold (POT) framework, the Generalized Pareto Distribution (GPD) outperforms traditional extreme value distributions in extreme wind speed estimation, particularly for heavy-tailed datasets. Georgios et al. [
34] provided a comparison between the generalized extreme value (GEV) distribution and the metastatistical extreme value distribution (MEVD) on their ability to predict “unseen” upper-tail quantiles of storm surge along the US coastline and showed that predictions from the MEVD are more robust with less variability in error. While the empirical distribution function maintains broad applicability across diverse scenarios, the selection of parametric extreme value distribution models remains critical, as it directly governs the predictive accuracy of extreme wind speed quantiles in typhoon risk modeling.
Previous studies by these scholars reveal that most researchers have treated typhoon and storm surge hazard analyses as separate processes. Lin [
35] employed conventional numerical models for typhoon-induced storm surge forecasting. Based on our numerical simulation experience, simulating the storm surge process for a single typhoon using the ADCIRC model takes approximately 30 min under 64 CPU cores. Therefore, numerical simulations for tens of thousands of synthetic typhoons would require prohibitive computational resources. In contrast, Yao [
36] utilized the Tropical Cyclone Risk Model (TCRM) to generate extensive synthetic typhoon events. They conducted numerical simulations for a limited number of typhoons to obtain storm surge heights. Then they used these simulation results to establish training samples for neural network models, ultimately developing neural network-based surge forecasting systems. Nevertheless, Yao [
36] did not conduct probabilistic hazard analyses for typhoons or storm surges. Moreover, as numerical model outputs inherently deviate from in situ water level observations, neural network models trained on such simulation-derived data risk amplifying systematic prediction biases. Building upon the methodology, this study selects Zhejiang Province, depicted in
Figure 1, as the target region, employs TCRM to generate synthetic typhoon events, and uses historical observed water level data from the Collection of Storm Surge Disasters Historical Data in China as neural network training samples for storm surge forecasting. Multiple neural network architectures, including LSTM, BP, Support Vector Machine (SVM), and Random Forest (RF), are evaluated through cross-validation to identify the optimal predictive model. Subsequently, the extreme wind speed sequence derived from the YM wind field model and the extreme surge height sequence predicted by the RF model are fitted using the empirical, Gumbel, Weibull, and GPD extreme value distributions. The optimal distribution, selected through Kolmogorov–Smirnov goodness-of-fit tests, is applied to estimate extreme wind speeds and surge heights across 10- to 200-year return periods at four representative coastal stations in Zhejiang Province. These findings provide statistically robust references for disaster management authorities in resilience planning and infrastructure protection decision-making.
3. Result Analysis
3.1. Construction of Virtual Typhoons
The TCRM model’s original input dataset originates from historical typhoon track records in the International Best Track Archive for Climate Stewardship (IBTRACS). TCRM generates statistically representative synthetic typhoon events across intensity categories by systematically expanding the sample library through stochastic resampling. While IBTRACS serves as TCRM’s foundational dataset, we identified two critical limitations: temporal obsolescence, as IBTRACS used by TCRM is limited to global typhoon track data spanning 1848–2009 and insufficient geographic resolution for localized applications. Given IBTRACS’s global coverage, its granularity proves suboptimal for regional-scale analyses. Our study focuses on typhoon storm surge-prone coastal zones in Zhejiang Province, necessitating higher spatial precision. To mitigate these limitations, we upgraded the typhoon database by replacing the original 1848–2009 IBTRACS dataset with the CMA Best Track Dataset (1949–2022) from the Tropical Cyclone Data Center, thereby enhancing typhoon simulation accuracy through regionally calibrated historical records.
The configuration process for TCRM is illustrated in
Figure 6, which involves five sequential steps. Firstly, input parameters including typhoon identifier, time sequence, longitude, latitude, and central pressure are selected. Secondly, the output path for synthetic simulation results is defined. Thirdly, taking the Wenzhou station as a case study, the domain is set as a rectangular region spanning 115° E–126° E and 23° N–34° N. Fourthly, to conserve computational resources, a 100-year simulation period is adopted for comparative experiments between the CMA Best Track Dataset and the IBTRACS dataset. Finally, return periods of 10, 30, 50, 100, and 200 years are configured, with wind speed units set to m/s.
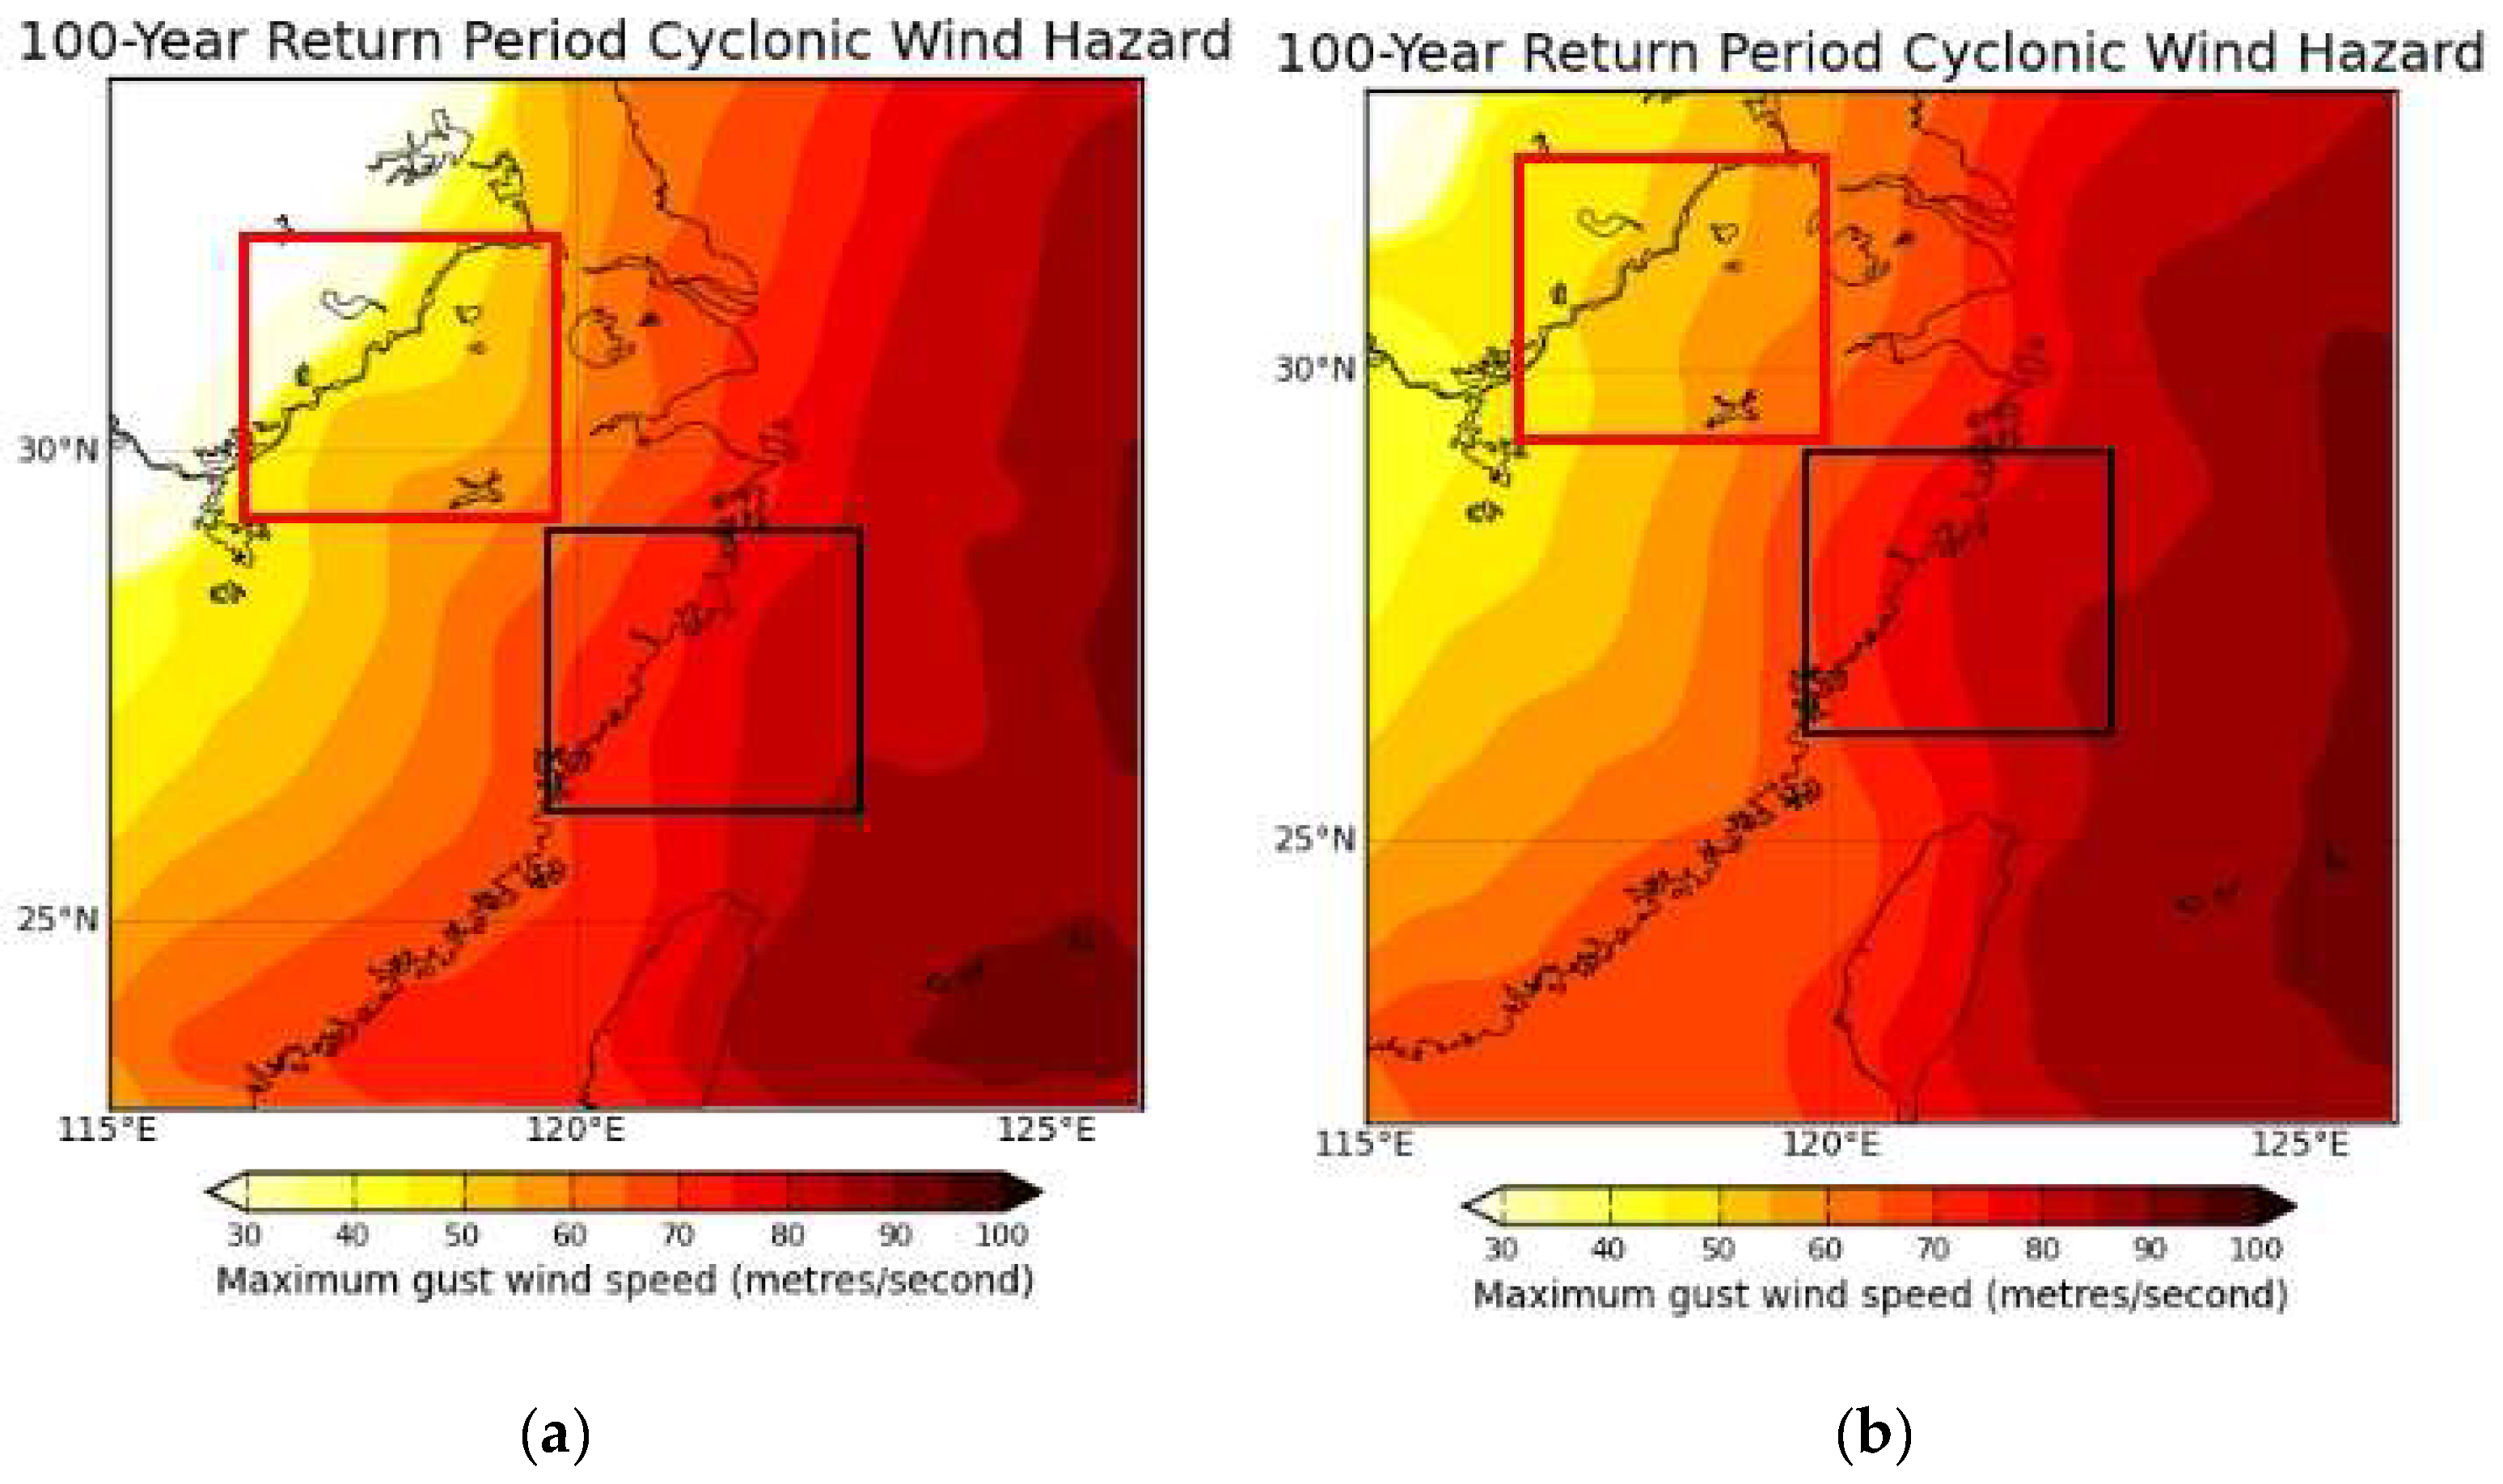
To investigate the impact of different input datasets (IBTRACS vs. CMA Best Track Dataset) on typhoon hazard analysis, we conducted parallel simulations using the IBTRACS dataset as input under identical configuration parameters. This generated synthetic typhoon events based on IBTRACS, enabling direct comparison with results derived from the CMA Best Track Dataset. For the 100-year return period,
Figure 7a,b display the extreme wind speed distributions near Wenzhou simulated using the IBTRACS and CMA datasets, respectively. The black and red bounding boxes highlight the nearshore region of Zhejiang Province to emphasize spatial differences in wind speed magnitudes. Within this delineated zone, the CMA dataset produces systematically higher extreme wind speeds than IBTRACS across both coastal and inland areas of Zhejiang. Further quantitative comparison of return period wind speeds at Wenzhou Station, in
Figure 8, reveals that the CMA dataset yields marginally higher maximum wind speeds across all tested return periods (10–100 years). These results suggest that the CMA Best Track Dataset provides more conservative estimates of typhoon wind speed hazards, reflecting its enhanced practical relevance for regional disaster prevention and mitigation planning.
Building upon the aforementioned 100-year return period results and comparative analysis, this study further presents 1000-year simulation outcomes, accompanied by systematic validation of typhoon initiation points and key parameters. The TCRM model generates an extensive ensemble of intensity-stratified synthetic typhoon events with statistically homogeneous spatial distributions, providing comprehensive typhoon track datasets essential for coastal typhoon hazard characterization. This methodology establishes a robust data foundation for typhoon risk quantification and storm surge hazard modeling. Accordingly, we implemented TCRM to develop a 1000-year synthetic typhoon catalog for the Northwest Pacific basin, containing 27,899 computationally generated events. The spatiotemporal distributions of track trajectories and corresponding intensity metrics are presented in
Figure 9.
To rigorously assess the statistical consistency between synthetic and historical typhoon characteristics, we validated the genesis locations of the 1000-year synthetic typhoons generated by TCRM. This validation framework involves examination of typhoon genesis locations and typhoon key parameters, including central pressure and maximum sustained wind speed. The methodology employs comparative analysis of genesis location distributions between historical and synthetic typhoons, complemented by statistical comparison of frequency distributions for central pressure and 2 min averaged maximum wind speeds near the typhoon center. As shown in
Figure 10, we compared the spatial distributions of historical (blue) and synthetic (red) typhoon genesis locations. The visualization reveals strong spatial consistency in clustering patterns, with both datasets exhibiting high-density genesis zones clustered within the 10° N–25° N latitudinal band. This spatial alignment statistically validates TCRM’s capability to reproduce observed genesis location characteristics in synthetic typhoon generation.
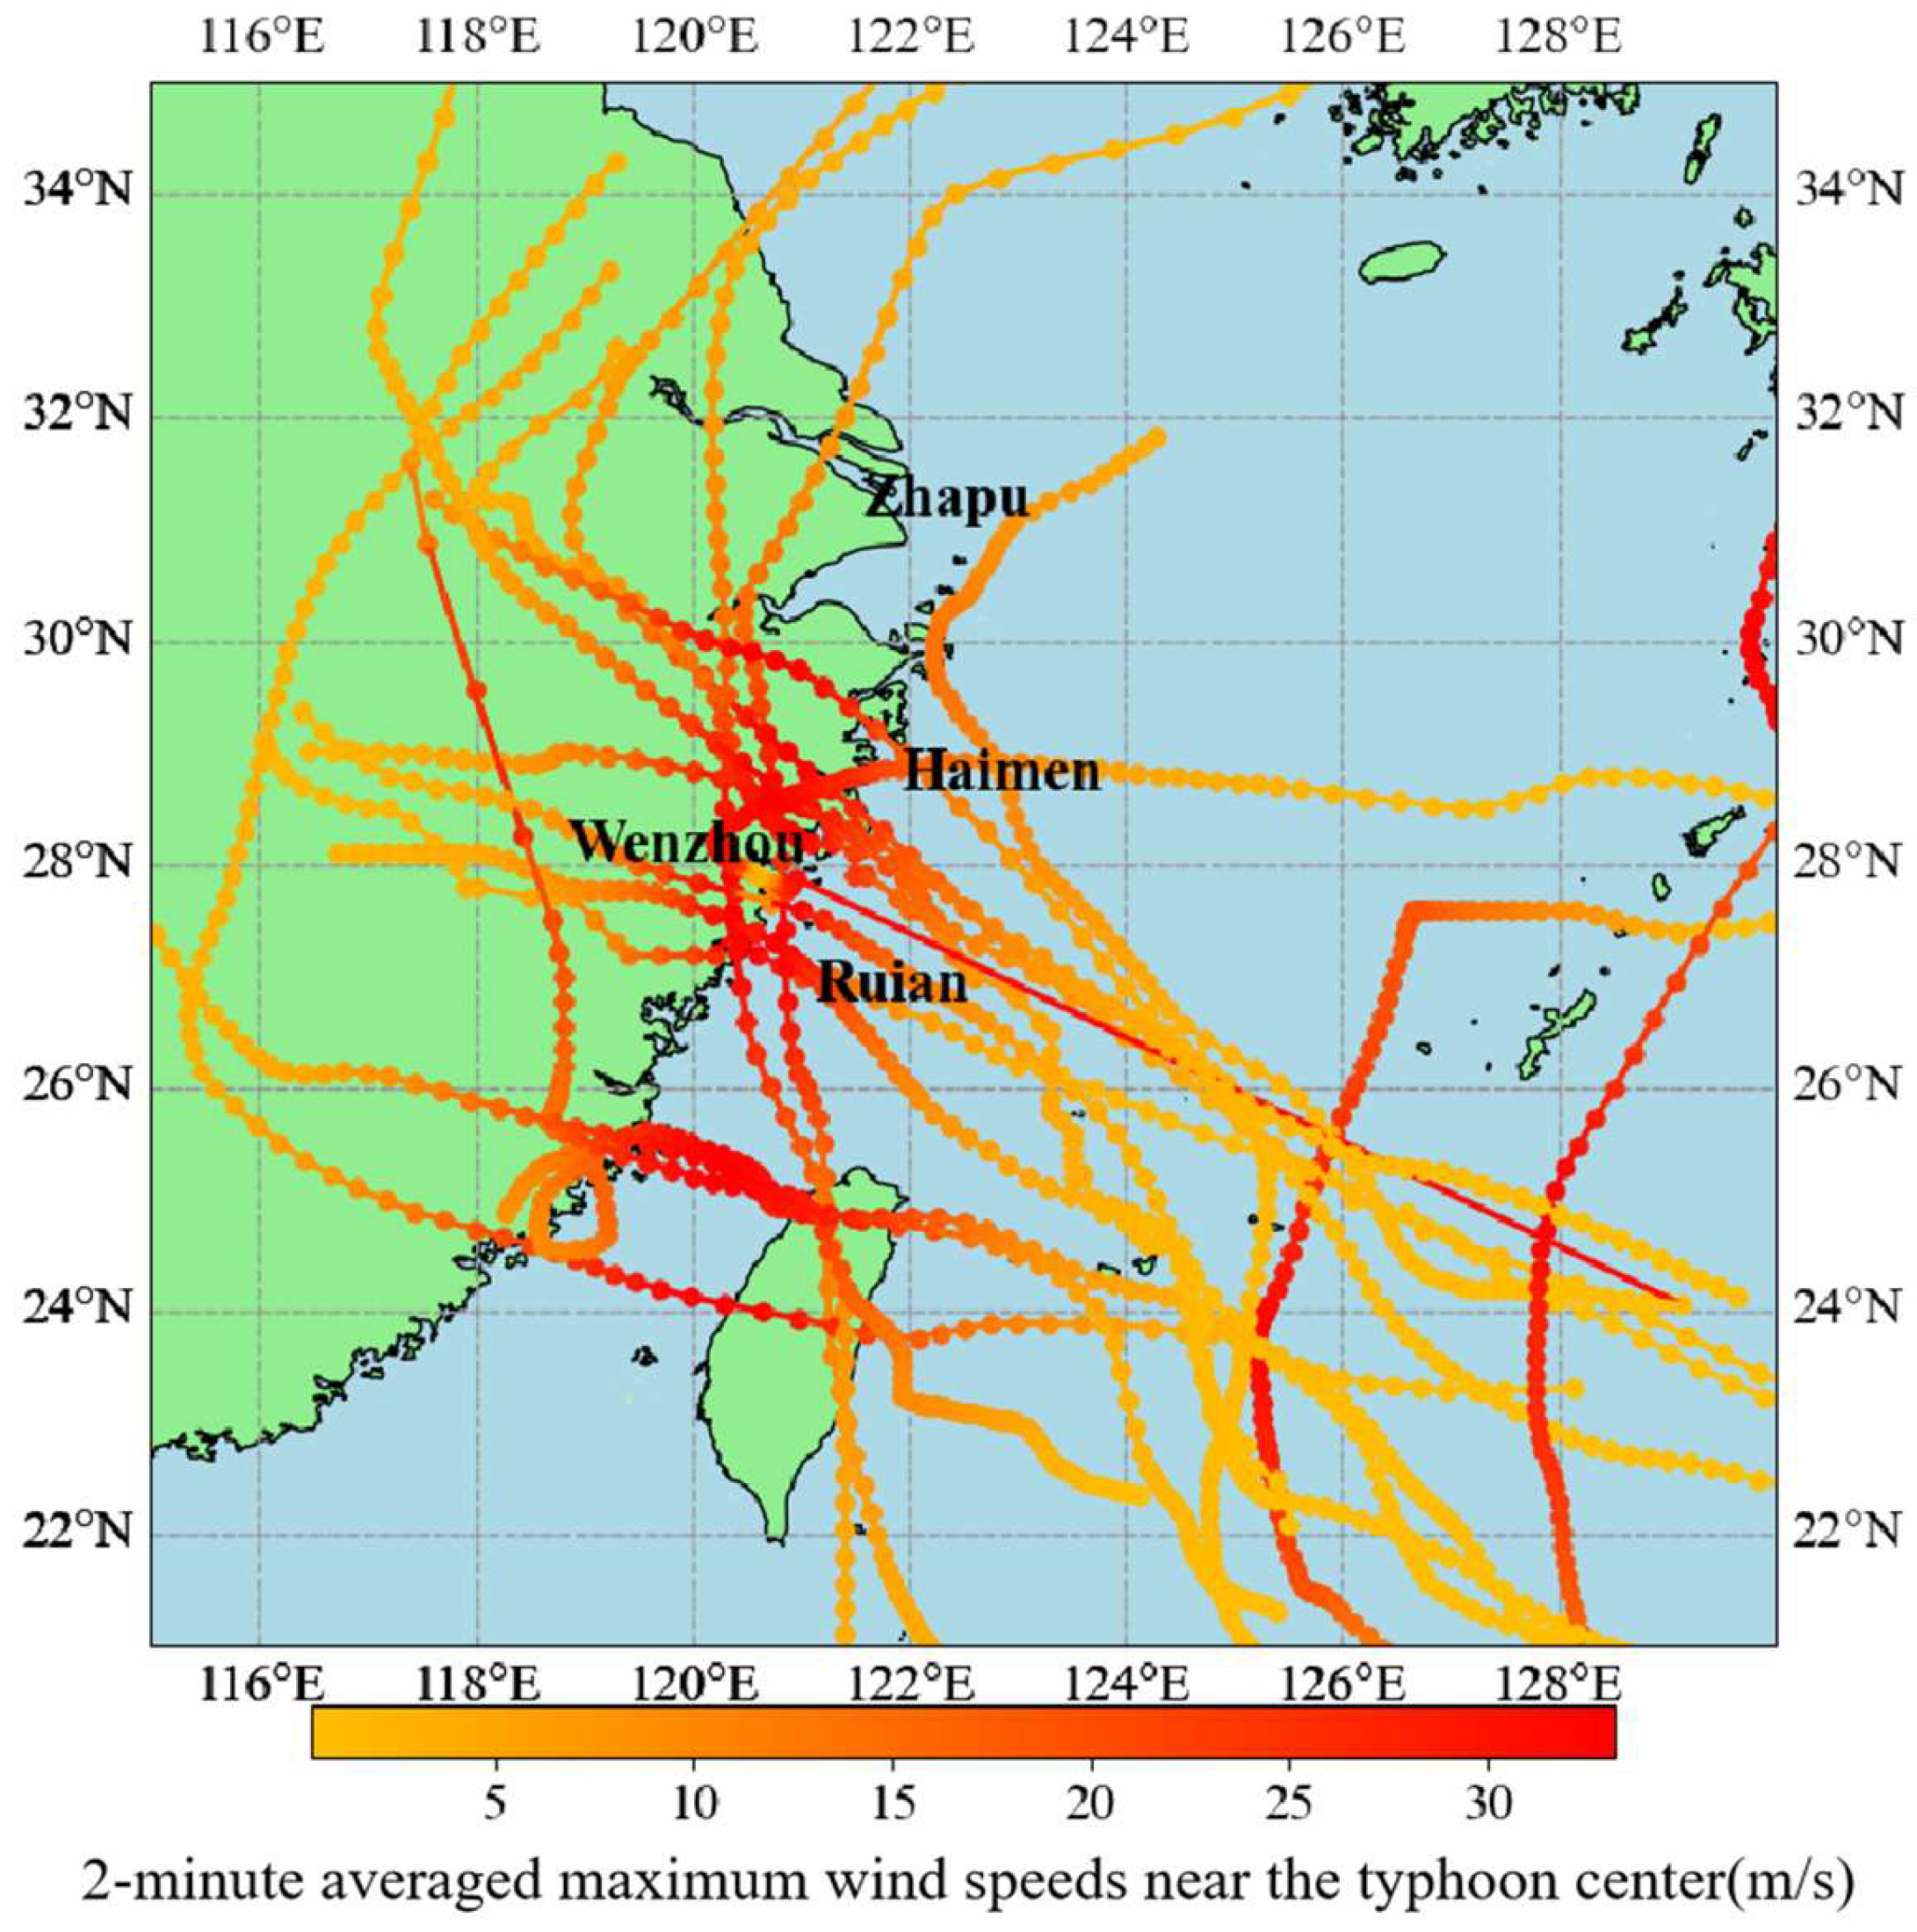
To conduct a storm surge hazard assessment along the Zhejiang coast, this analysis needs to extract synthetic typhoon events that affect this region from the generated 1000-year virtual typhoon event set. A rectangular domain encompassing four representative coastal stations—Haimen, Ruian, Wenzhou, and Zhapu—was shown in
Figure 1, geographically bounded by 119° E–125° E and 26° N–32° N. From the comprehensive 1000-year synthetic typhoon catalog, 1294 events passing through this domain were identified. Each one is characterized by a temporal resolution of 1 h, forming the typhoon subset impacting Zhejiang’s coastal zone. The spatial trajectories of these selected typhoons are visualized in
Figure 11. This refined dataset will serve as the basis for subsequent typhoon wind field calculations and storm surge modeling, enabling probabilistic hazard characterization across the study area.
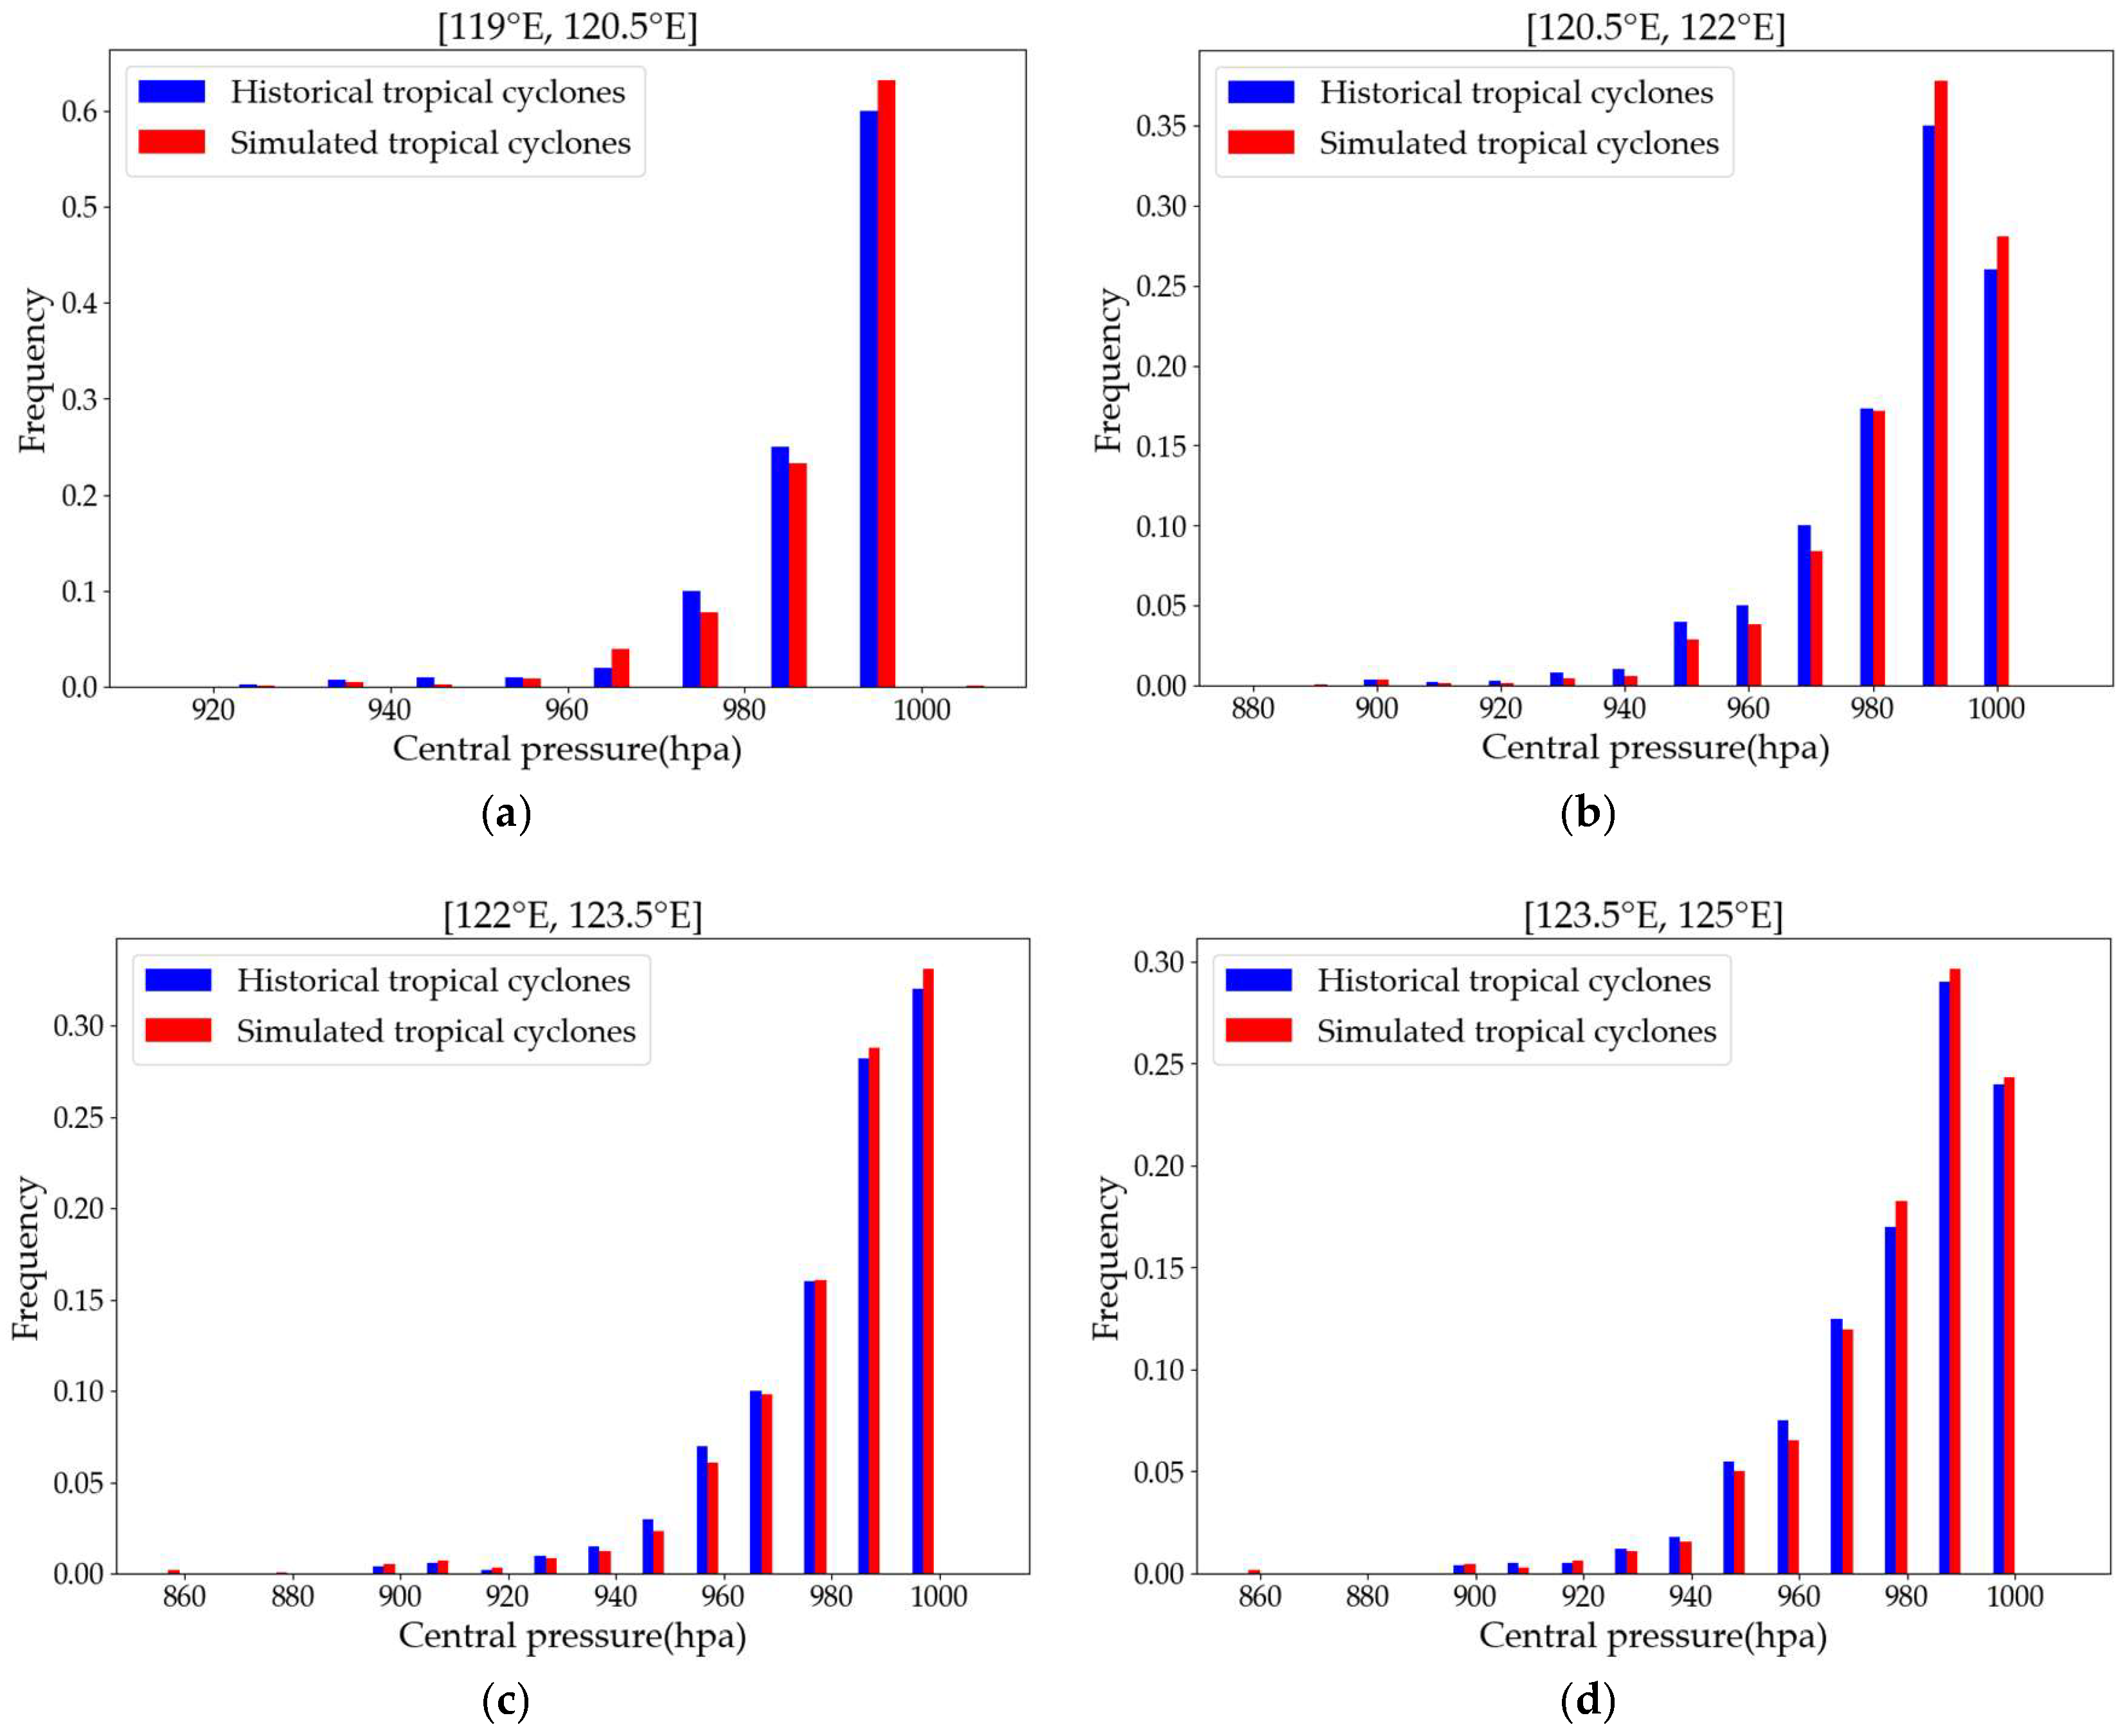
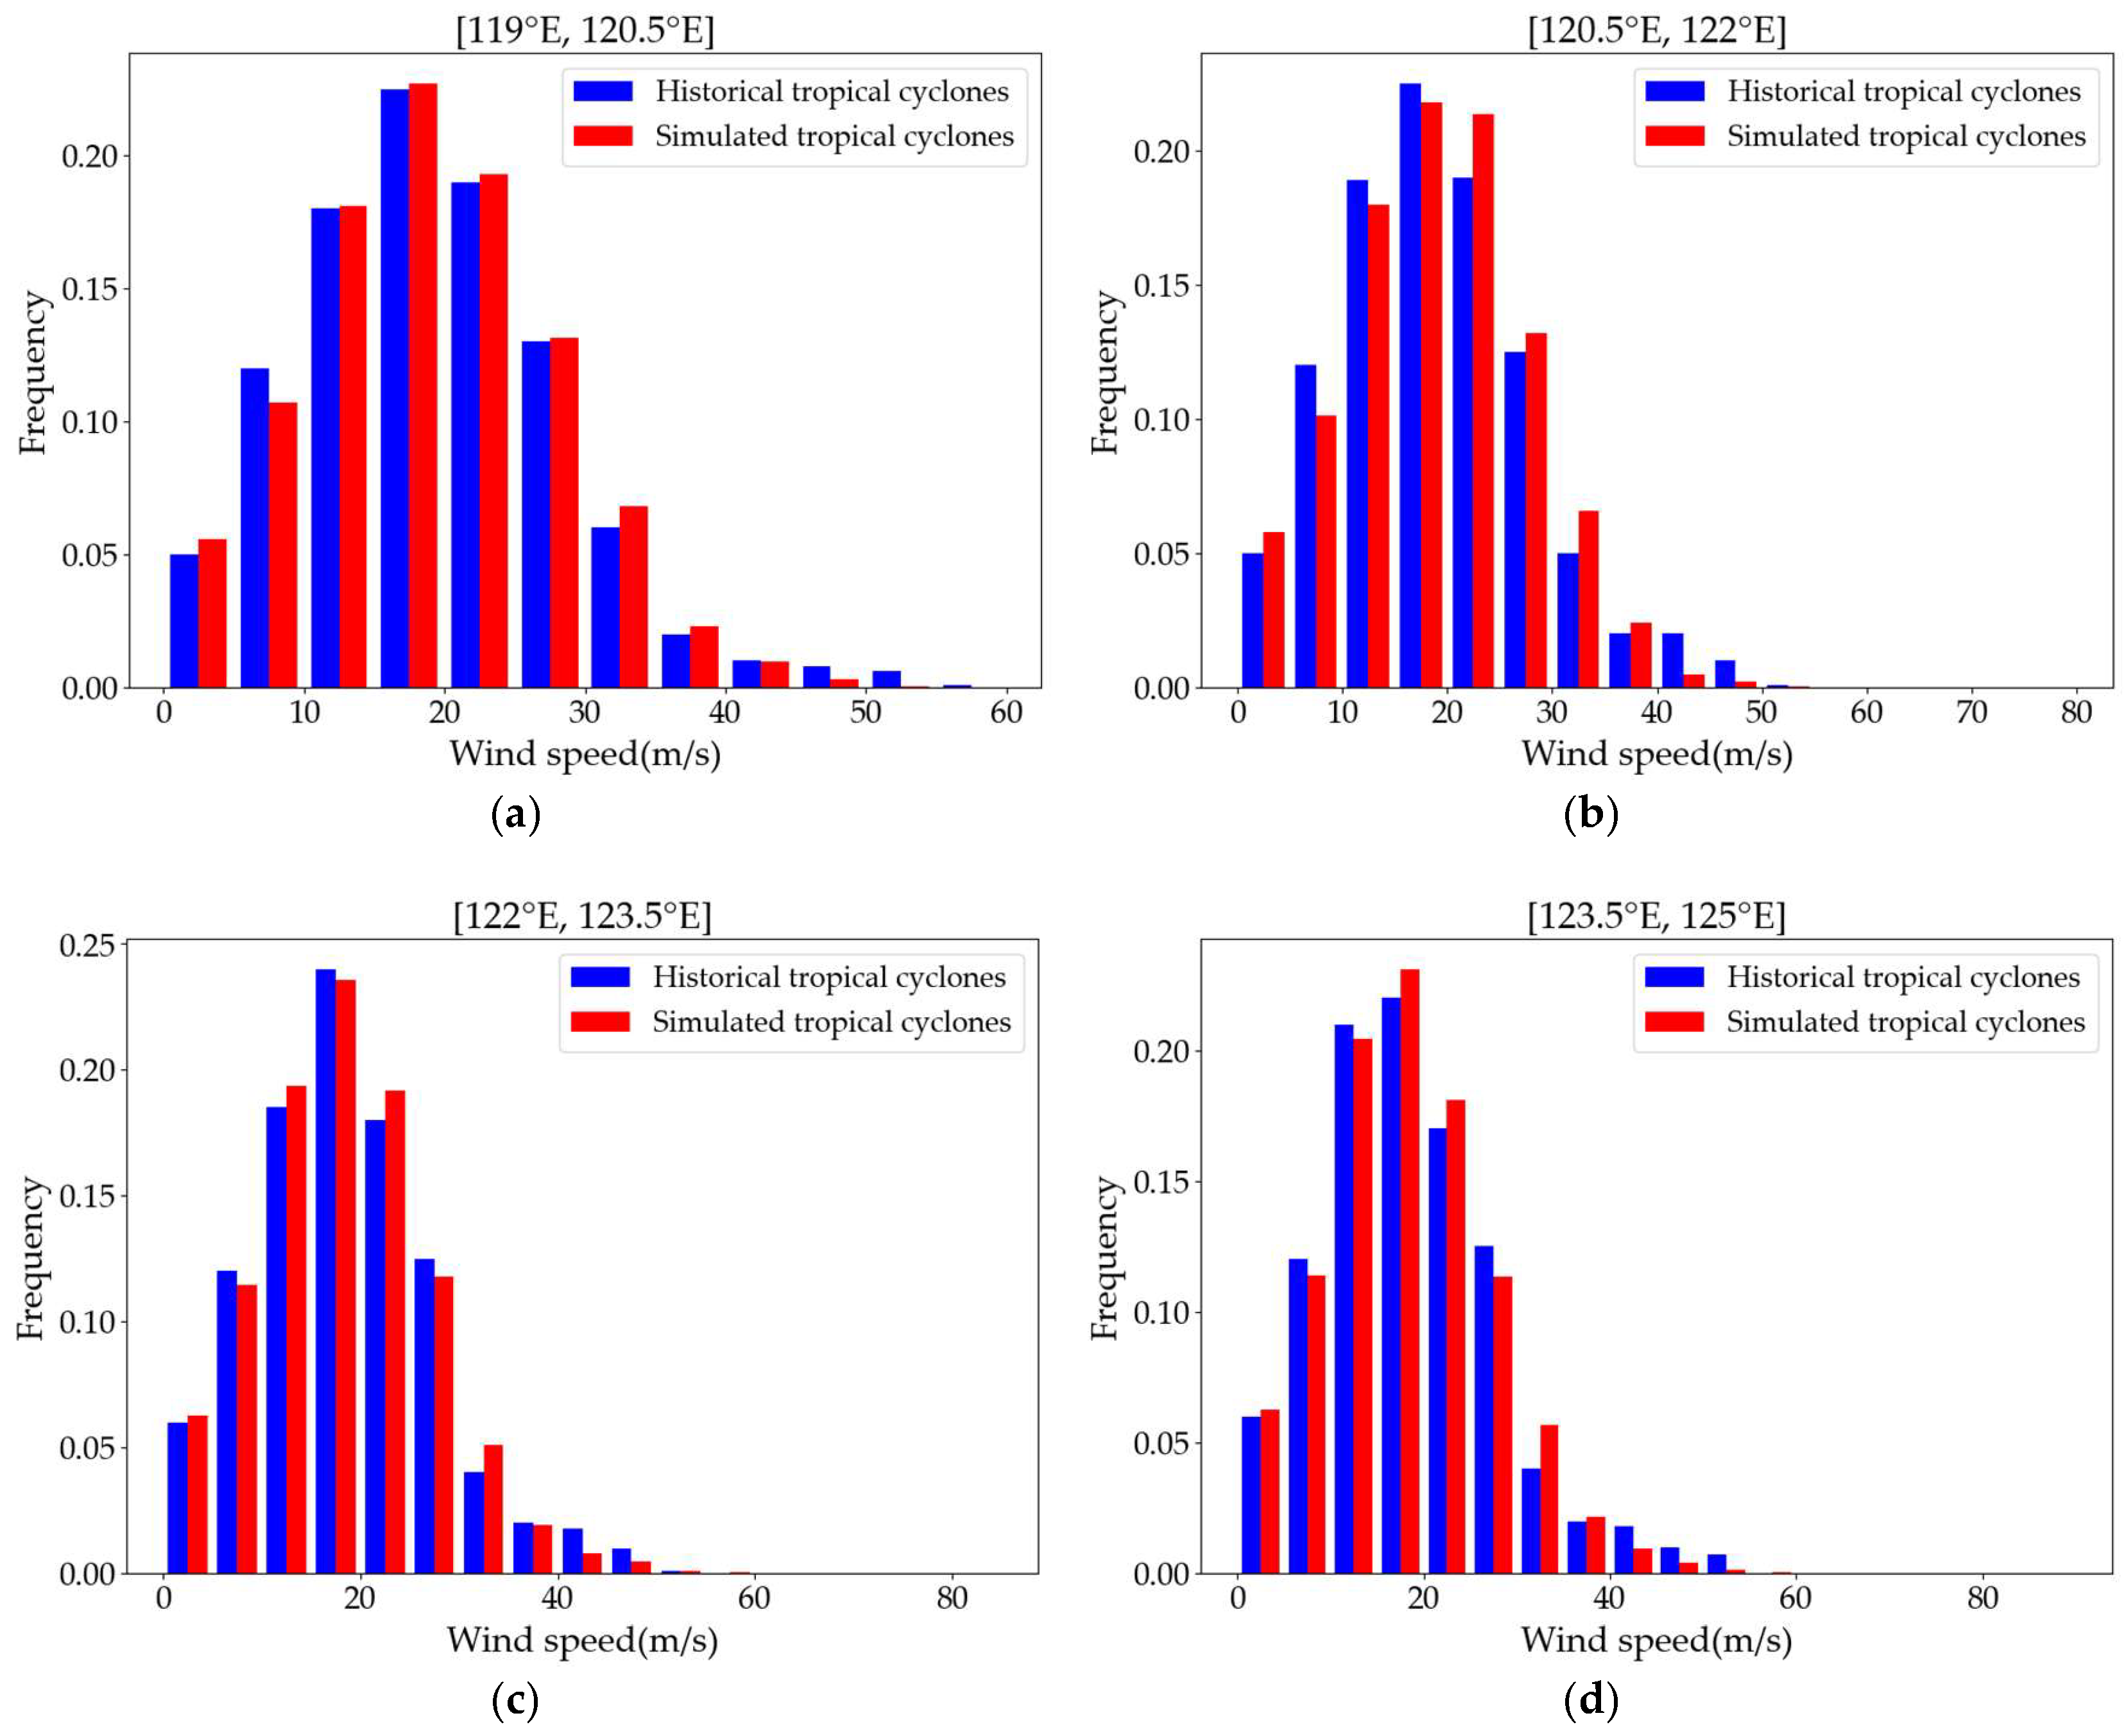
To systematically validate the statistical consistency of typhoon parameters between synthetic and historical events, we divided the rectangular domain in
Figure 1 into four 1.5°-resolution subregions, i.e., [119° E, 120.5° E], [120.5° E, 122° E], [122° E, 123.5° E], and [123.5° E, 125° E]. Subsequent analysis compared the frequency distributions of central pressure and 2 min averaged maximum wind speeds near the typhoon center between historical and synthetic typhoon events across these subregions, as shown in
Figure 12 and
Figure 13.
Figure 12a–d presents the frequency distributions of central pressure for the four subregions, where blue histograms represent the results of historical typhoon events and red histograms denote synthetic counterparts. The results reveal strong statistical agreement in central pressure between synthetic and historical datasets across all subregions.
Figure 13a–d shows the frequency distributions of typhoon 2 min averaged maximum wind speeds near the typhoon center across the four subregions, with blue histograms denoting the statistical results of historical typhoon events and red histograms representing synthetic counterparts. Mirroring the central pressure analysis, the statistical frequency distributions of 2 min averaged maximum wind speeds near the typhoon center between synthetic and historical typhoon datasets demonstrate strong statistical alignment across all subregions.
These systematic comparisons collectively validate that the 1000-year synthetic typhoon catalog generated through TCRM achieves statistically robust simulations of tropical cyclone climatology—including genesis patterns, trajectory characteristics, and intensity metrics—specifically calibrated for Zhejiang Province’s coastal regions.
3.2. Machine Learning-Based Forecasting of Storm Surge Height
Storm surge forecasting methodologies primarily encompass empirical, numerical, and machine learning approaches. Given the inherent limitations of empirical forecasting (substantial predictive uncertainties) and the high computational costs of numerical modeling, this study employs machine learning techniques for storm surge prediction. The core objective of our machine learning framework is to leverage typhoon-related parameters for predicting site-specific surge elevations, enabling efficient simulation of synthetic typhoon-induced storm surges at targeted coastal stations. This approach systematically expands storm surge datasets while substantially lowering computational demands compared with conventional numerical modeling, particularly for large synthetic typhoon catalogs, thereby supporting probabilistic surge hazard analysis. Focusing on four representative coastal stations in Zhejiang Province, Haimen, Ruian, Wenzhou, and Zhapu, we developed station-specific machine learning models using historical typhoon parameters as inputs and observed surge heights as outputs. To rigorously assess model performance across architectures, four machine learning methods, i.e., RF, BPNN, LSTM, and SVR, were implemented for comparative performance analysis at each station, aiming to identify optimal predictive frameworks.
3.2.1. Data Preparation
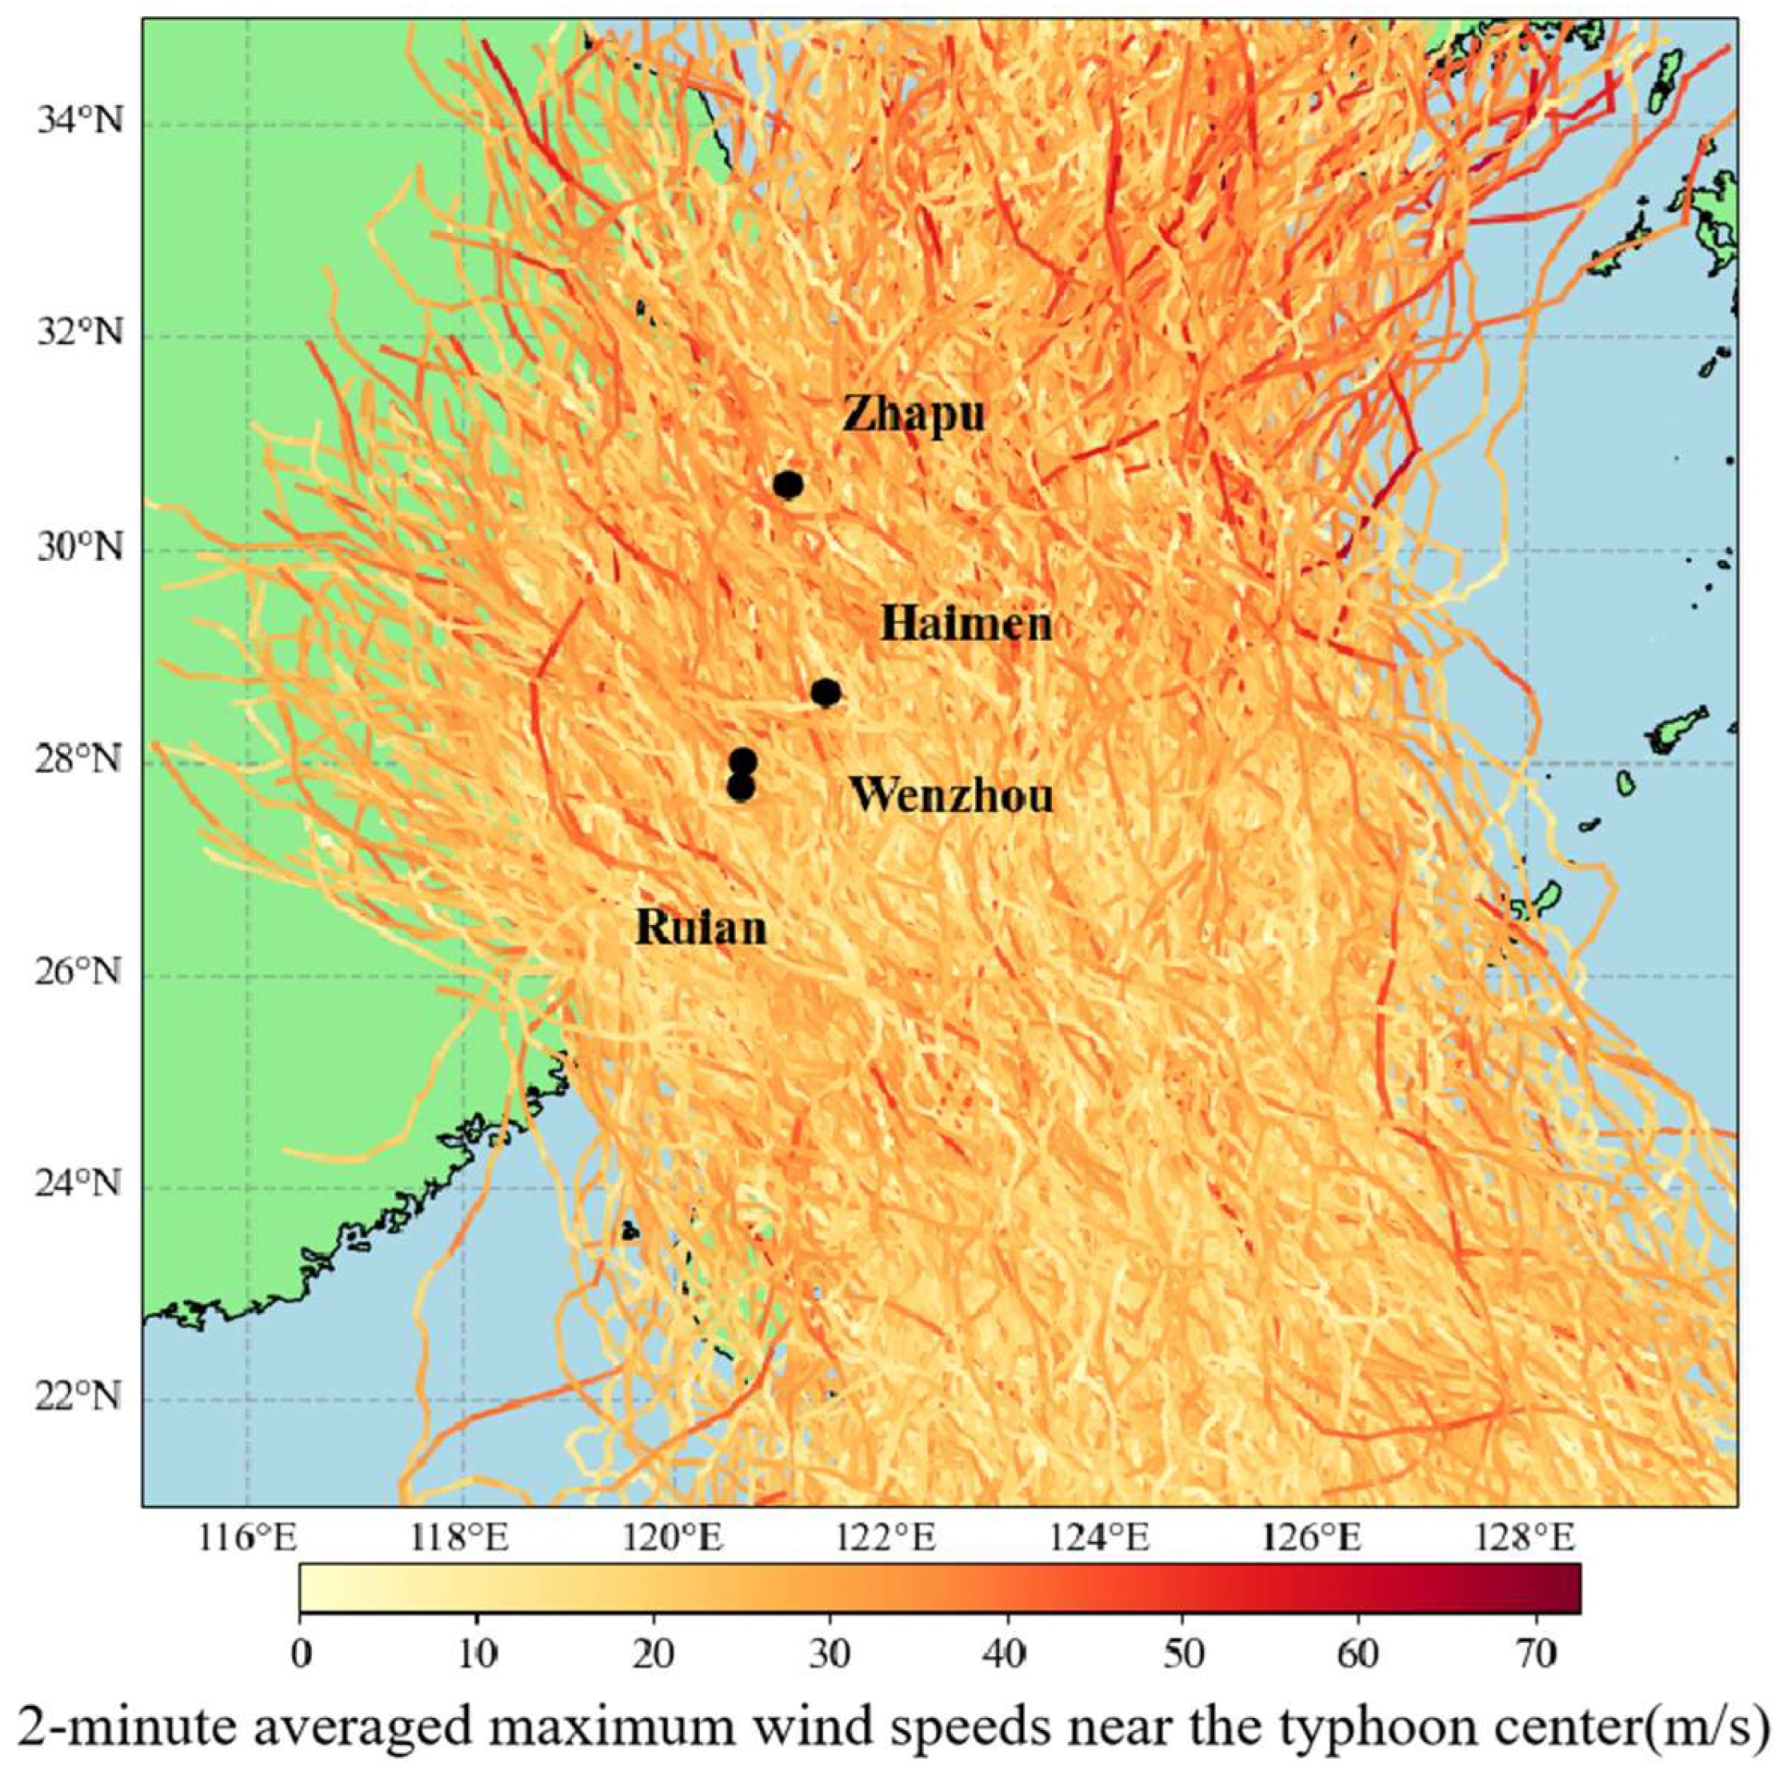
To establish hourly resolution storm surge forecasting models for the four target stations, we constructed historical hourly typhoon track data paired with corresponding storm surge height. The hourly storm surge heights were sourced from the Collection of Storm Surge Disasters Historical Data in China, ensuring data authenticity and observational validity. Corresponding typhoon track data were obtained from the Wenzhou Typhoon Website (
https://m.wztf121.com, accessed on 20 February 2024), which provides 1 h temporal resolution, a notable enhancement compared with the 6 h resolution of the CMA track dataset. Based on storm surge statistics from the Collection of Storm Surge Disasters Historical Data in China, 36 typhoon tracks impacting the four study stations were selected, as shown in
Figure 14. We summarized the typhoon track data for each station, and the statistical results are presented in
Table 2.
3.2.2. Input Parameter Experiment
Sensitivity experiments were conducted on the model’s input parameters. The selection of input parameters represents a critical step in model construction. Building on prior research, Yao [
36] utilized typhoon eye coordinates (longitude (
lon) and latitude (
lat)), maximum wind speed (
vmax), translational speed (
vT), central pressure (
pcentral), and radius of maximum winds (
Rmax) as inputs to develop an LSTM-based storm surge model for the northern South China Sea. Following this methodological framework, we initially adopted identical parameters for our typhoon-induced storm surge forecasting model. However, as historical typhoon track datasets lack two essential parameters, translational speed and radius of maximum winds, these values were derived computationally using Equations (23) and (24) [
49].
In Equation (23),
denotes the latitude difference between two consecutive timesteps;
represents the longitude difference between two consecutive timesteps; and
β is a latitude-dependent parameter, referring to Wang [
50]. In Equation (24),
corresponds to the difference between the central pressure and the standard atmospheric pressure.
Following Yao [
36], we developed an LSTM model with identical architecture, a two-layer neural network containing 10 neurons per hidden layer. The dataset was partitioned into training (80%) and testing (20%) subsets, corresponding to seven typhoon events per station for model training and two events for validation. To optimize training efficiency, gradient descent algorithms were implemented to iteratively update network weights and biases, progressively minimizing the loss function value. Concurrent test set monitoring was employed to mitigate overfitting risks. Prior to model training, raw data underwent Z-score normalization to standardize input distributions, with the normalization formula for each feature defined in Equation (25),
In Equation (25), μ represents the mean value of the feature, while σ denotes its standard deviation.
To evaluate the performance of the predictive model, we selected the correlation coefficient (
CC) between model predictions and observed values as the evaluation metric. Its computational formula is given in Equation (26),
In Equation (26), x represents the sample size, and and denote two sets of sampling points for the i-th indexed data, while and indicate the mean values of predicted and observed values, respectively.
Based on the aforementioned LSTM model and input parameters, the correlation coefficient (
CC) between predicted and observed storm surge heights for the test sets at Haimen, Ruian, Wenzhou, and Zhapu stations were 0.71, 0.70, 0.77, and 0.60, respectively. These evaluation results indicate that the neural network model constructed with these input parameters exhibits limited predictive capability. This limitation likely stems from input parameters and typhoon intrinsic characteristics, which act as teleconnection factors that are insufficient to fully resolve localized surge dynamics. To improve forecasting accuracy, we proposed augmenting the model with localized environmental drivers, specifically wind fields and pressure fields. Consequently, the YM wind field model was employed to calculate site-specific pressure and wind speed values. Zonal (
u) and meridional (
v) wind speed components were further derived through Equation (27) and Equation (28), respectively.
In Equations (27) and (28), represents the azimuth angle between the observation point and the typhoon center, denotes the radial wind speed component, direction from the typhoon center outward, and indicates the tangential wind speed component, which is the direction tangential to the typhoon’s circular motion.
To differentiate the effects of distinct input parameters on the results, we designated the teleconnection input parameters as Test1 (referring to Yao [
36]), while the experiment incorporating local factors, i.e., site-specific zonal (
u) and meridional (
v) wind speed and pressure
p, is termed Test2. Additionally, we implemented Test3, which combines both local factors and teleconnection parameters as inputs. Using the CC as the evaluation metric, the performance for all three experimental configurations is summarized in
Table 3.
Comparative analysis of
Table 3 demonstrates that integrating localized environmental drivers with teleconnection parameters as input features achieves optimal predictive performance. Consequently, the selected optimal input parameter combination comprises typhoon eye coordinates (
lon,
lat), maximum wind speed (
vmax), translational speed (
vT), central pressure (
pcentral), radius of maximum winds (
Rmax), site-specific wind speed components (zonal (
u) and meridional (
v) wind speed and site-specific pressure
p). These parameters form the input dataset for machine learning model of storm surge heights forecasting.
3.2.3. Model Comparison Experiments
As shown in
Table 4, while the LSTM model demonstrates relatively satisfactory predictive performance, its results remain suboptimal. To explore potential improvements, we further implemented three additional machine learning models, BP model, RF model, and SVR model, aiming to identify a superior forecasting model through comparative analysis.
For the BP, RF, and SVR models, we maintained consistency with the LSTM model’s data partitioning methodology, applying the identical 80%:20% training–test split ratio to ensure comparability of model performance. The BP model employs a Z-score for data standardization. Its architecture comprises an input layer, a first hidden layer (64 neurons, ReLU activation), a second hidden layer (32 neurons, ReLU activation), and an output layer (1 neuron). During compilation, the model uses mean squared error (MSE) as the loss function with the Adam optimizer, trained over 100 epochs with a batch size of 32.
The RF model similarly applies Z-score for data standardization and maintains an 8:2 dataset split. In the RF model, 100 decision trees are configured, fixing the random seed at 42. The predicted values of the training set, the predicted values of the test set, and the actual observed values are subjected to inverse standardization. The results after inverse standardization are used for calculating error metrics and conducting visual analysis to ensure that the model output has physical significance.
The SVR model is implemented with a Radial Basis Function (RBF) kernel, and we set the hyperparameters to
C = 100,
γ = 0.1, and
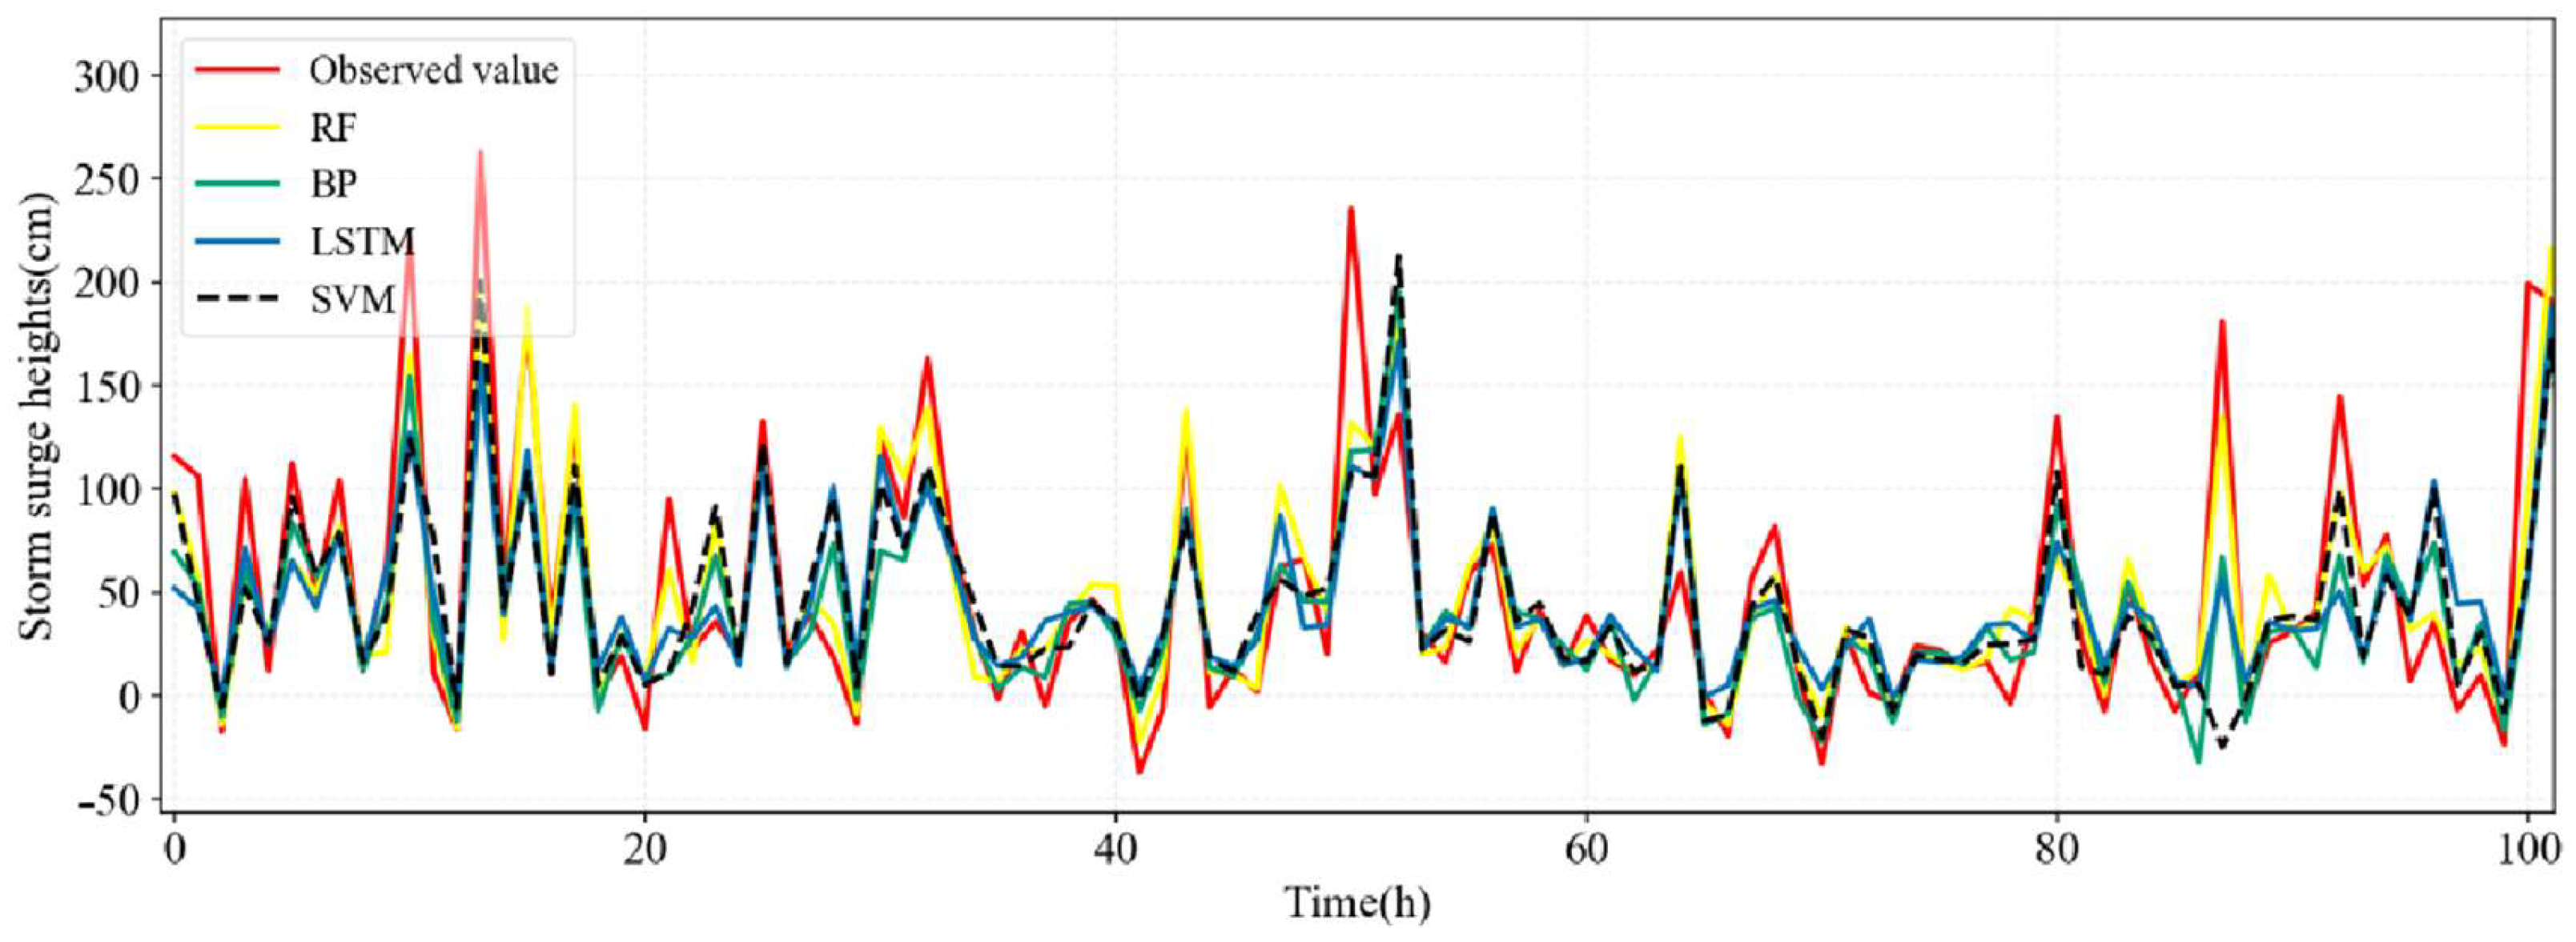
ϵ = 0.1. Input features and targets are standardized to eliminate unit discrepancies during training, followed by inverse standardization of predictions. Taking Wenzhou Station as an example, we compared the predicted and observed values of all four models, namely LSTM, BP, BF, and SVR, on the training and test sets, as shown in
Figure 15 and
Figure 16.
Based on the predictive results obtained from the four machine learning models, the correlation coefficients between observed and predicted values in the test sets are summarized in
Table 4. Analysis of
Table 4 reveals significant variations in training outcomes across different machine learning models for the four stations. Overall, the RF model demonstrates superior predictive performance compared with the BP, LSTM, and SVR models. The SVR model exhibits the poorest performance, with test set correlation coefficients ranging from 0.72 to 0.82. Conversely, the RF model achieves optimal performance, yielding correlation coefficients exceeding 0.85 and peaking at 0.93. To assess the generalization capability of the machine learning model, we performed cross-validation by alternating typhoon samples in the training and test sets. Taking Zhapu Station as an example, the last row of
Table 4 provides the correlation coefficients of prediction results after replacing the test set typhoon samples. The minimal variation in correlation coefficients before and after data substitution demonstrates the model’s robust generalization ability. Similar patterns were observed across other stations, though not explicitly illustrated here due to space limitations. Consequently, the RF model is ultimately selected as the optimal model for storm surge height prediction for four stations.
3.3. Extraction of Extreme Wind Speeds and Extreme Storm Surge Heights
To assess typhoon and storm surge hazards in Zhejiang Province, 375 typhoon events impacting the region were extracted from the 1000-year synthetic typhoon catalog generated by TCRM in
Section 3.1. Using the optimal RF forecasting model of storm surge identified in
Section 3.2, we simulated storm surge elevations at Haimen, Ruian, Wenzhou, and Zhapu coastal stations. Partial surge elevation results for Wenzhou station are shown in
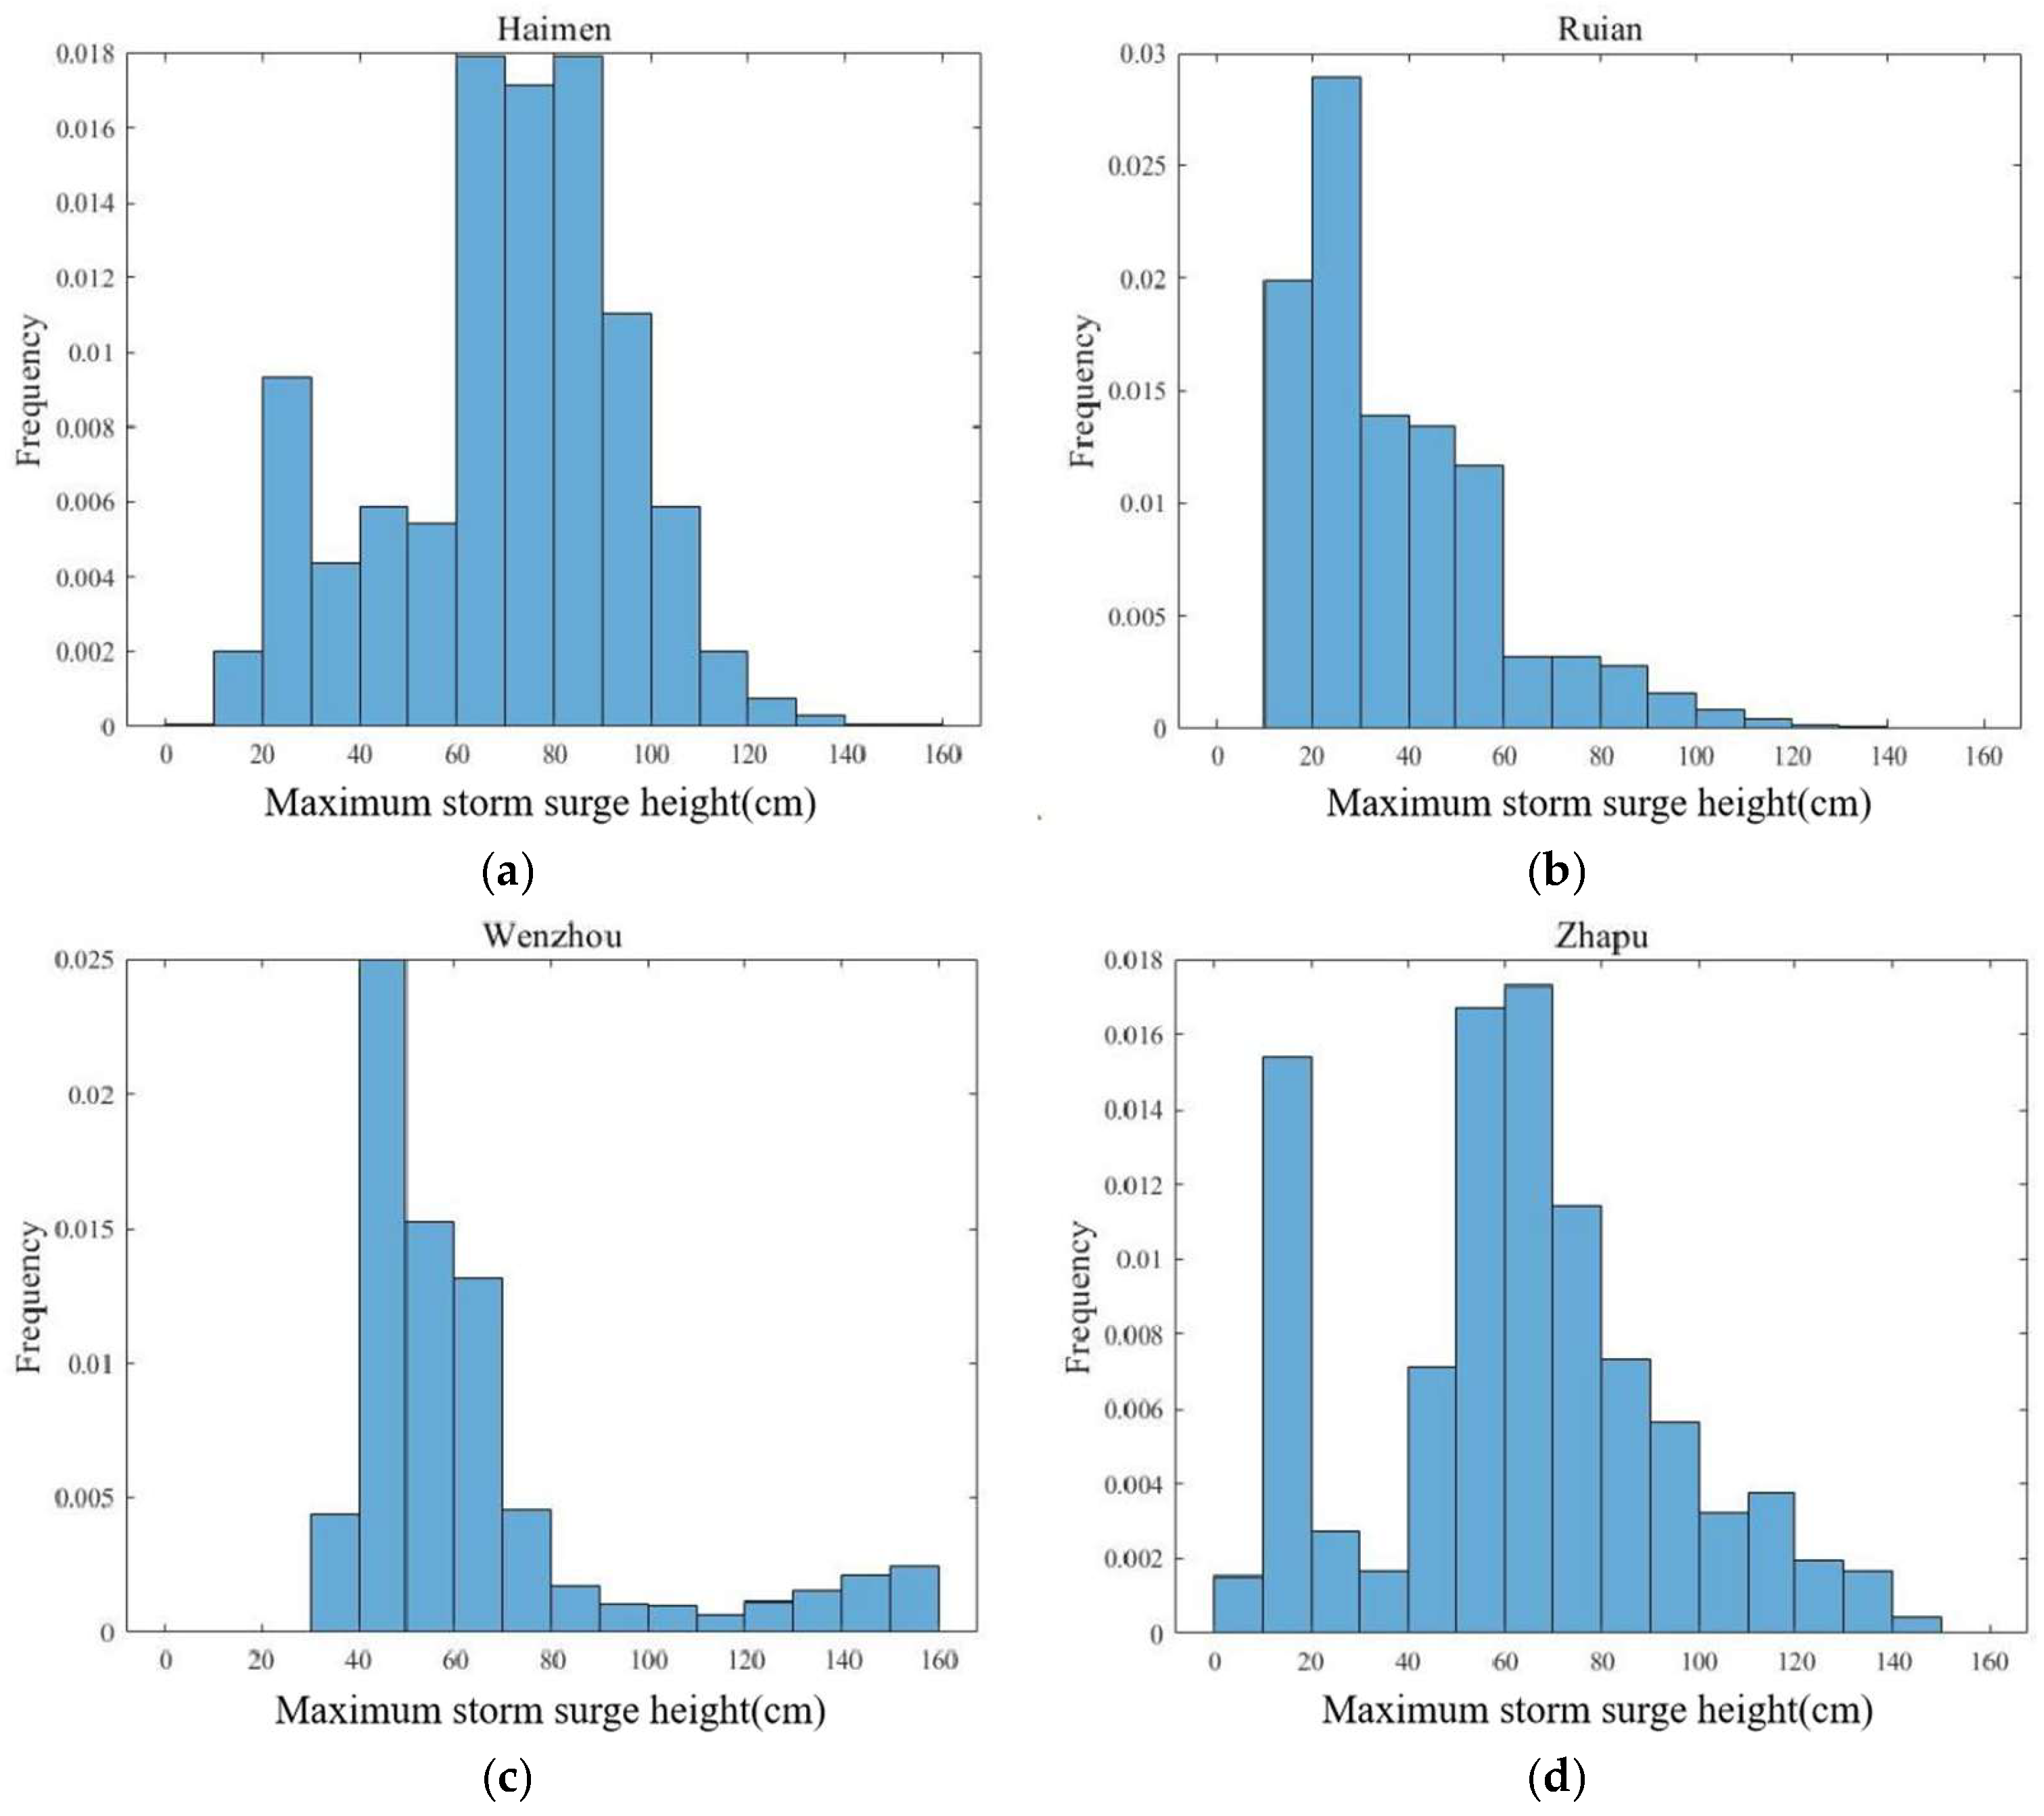
Figure 17, with maximum surge elevations reaching 250 cm. We systematically extracted the maximum surge height and maximum wind speed induced by each typhoon event at Haimen, Ruian, Wenzhou, and Zhapu stations, establishing extreme surge height and wind speed sequences. Since line charts inadequately capture statistical distributions, we present the frequency distribution histograms of the extreme surge height sequences for all 375 storm surge events at each station, as shown in
Figure 18. The histograms reveal that maximum surge elevations occur at extremely low frequencies across all stations, indicating that while extreme surge events have low probabilities of occurrence, their potential impacts could be severe. Notably, Wenzhou station exhibits higher surge magnitudes compared with other stations, underscoring the need for prioritized attention to its maximum surge scenarios. The mode of storm surge elevation differs markedly between stations. Haimen Station exhibits a modal surge in the 60–80 cm range, Ruian Station in the 20–40 cm range, and both Wenzhou and Zhapu stations in the 50–100 cm range. These variations reflect distinct typhoon-induced surge characteristics across locations.
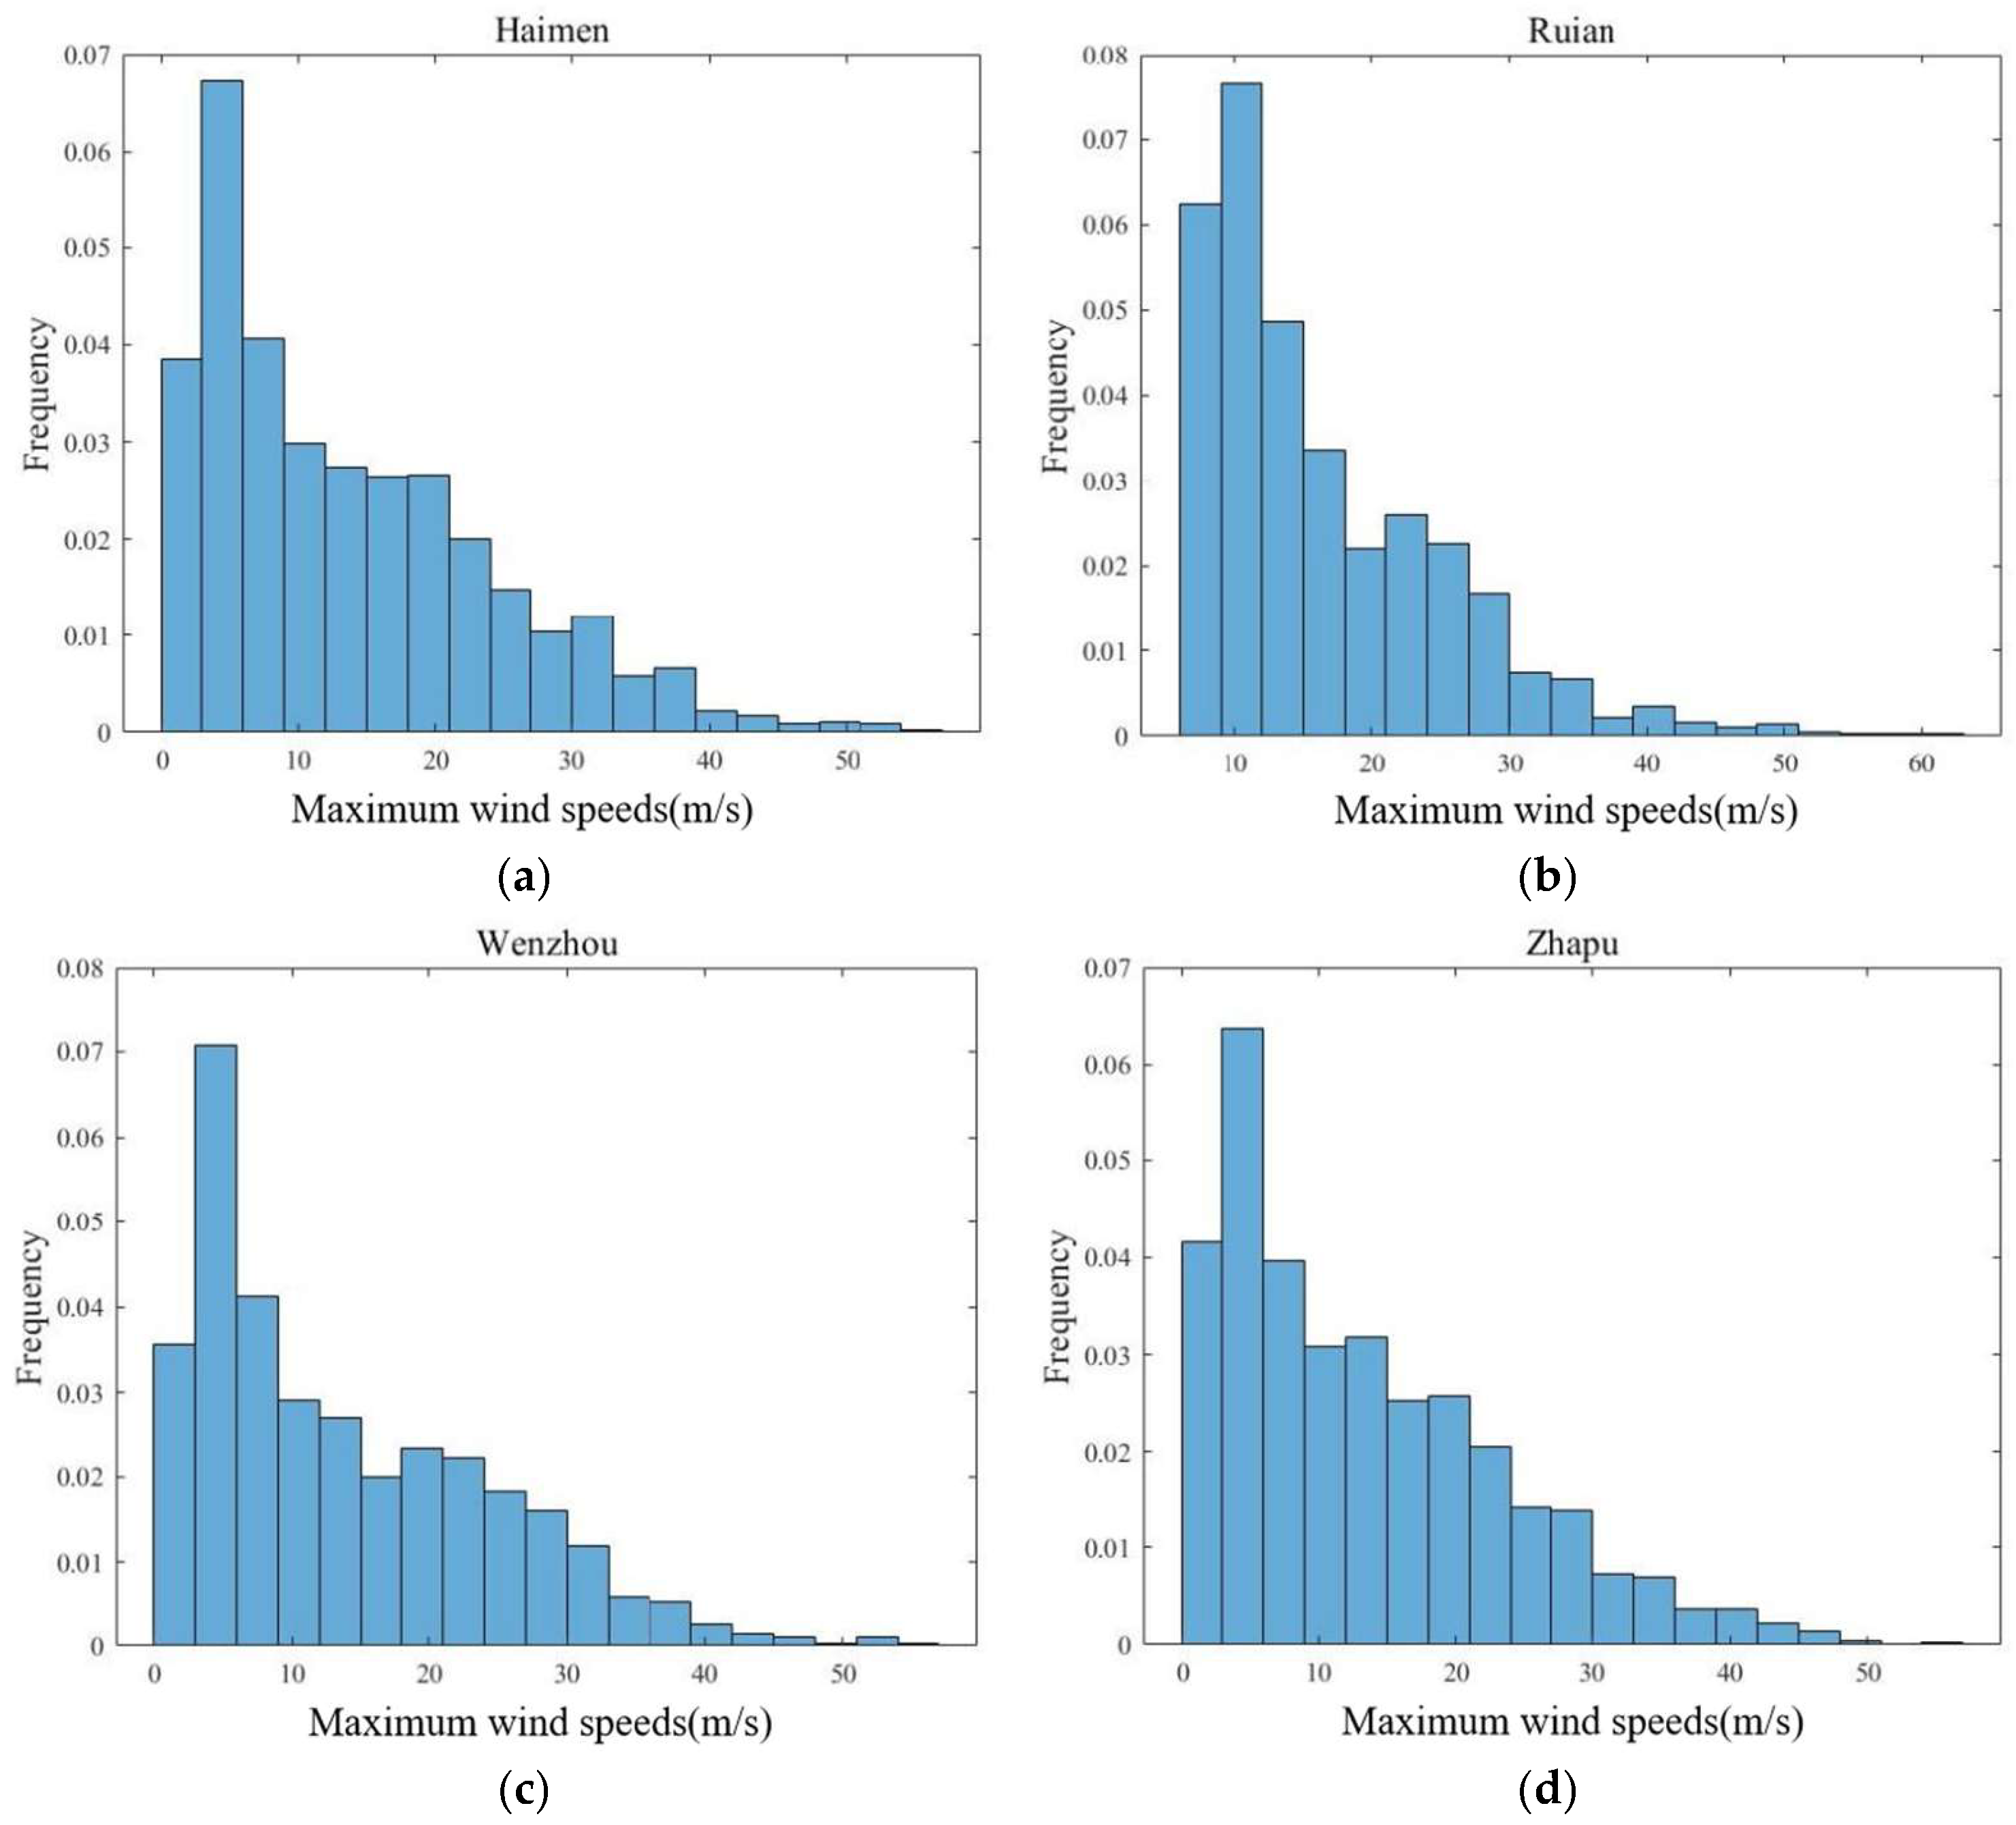
In addition to storm surge hazard assessment, we also quantitatively evaluated typhoon wind hazards by computing wind speeds at four coastal stations for all 375 synthetic typhoons using the YM wind field model. Extreme wind speed sequences were derived by extracting the maximum wind speed generated at each station by each typhoon, and their frequency distribution histograms are presented in
Figure 19. The results indicate that the extreme wind speeds (50–60 m/s) exhibit consistently low occurrence frequencies at all stations, confirming the meteorological rarity of extreme wind events. Statistical analysis reveals that modal wind speeds cluster uniformly in the 5–10 m/s range at all stations, confirming low-intensity winds as the predominant condition during typhoons. This distinct pattern underscores a critical feature of typhoon-induced wind speed distributions along Zhejiang’s coast: although sustained winds of 5–10 m/s exhibit relatively low destructive potential, their persistent prevalence demands proactive planning to address compounding infrastructural and environmental impacts over time.
3.4. Typhoon and Storm Surge Hazard Analysis
Extreme surge height and wind speed sequences serve as the foundational dataset enabling the prediction of extreme wind speeds and extreme surge heights for different return periods at each station through the extreme value distribution model. In this analytical framework, this study applied four extremal distributions, empirical distribution, Weibull distribution, Gumbel distribution, and Generalized Pareto Distribution (GPD), to fit the extracted extreme surge and wind speed sequences.
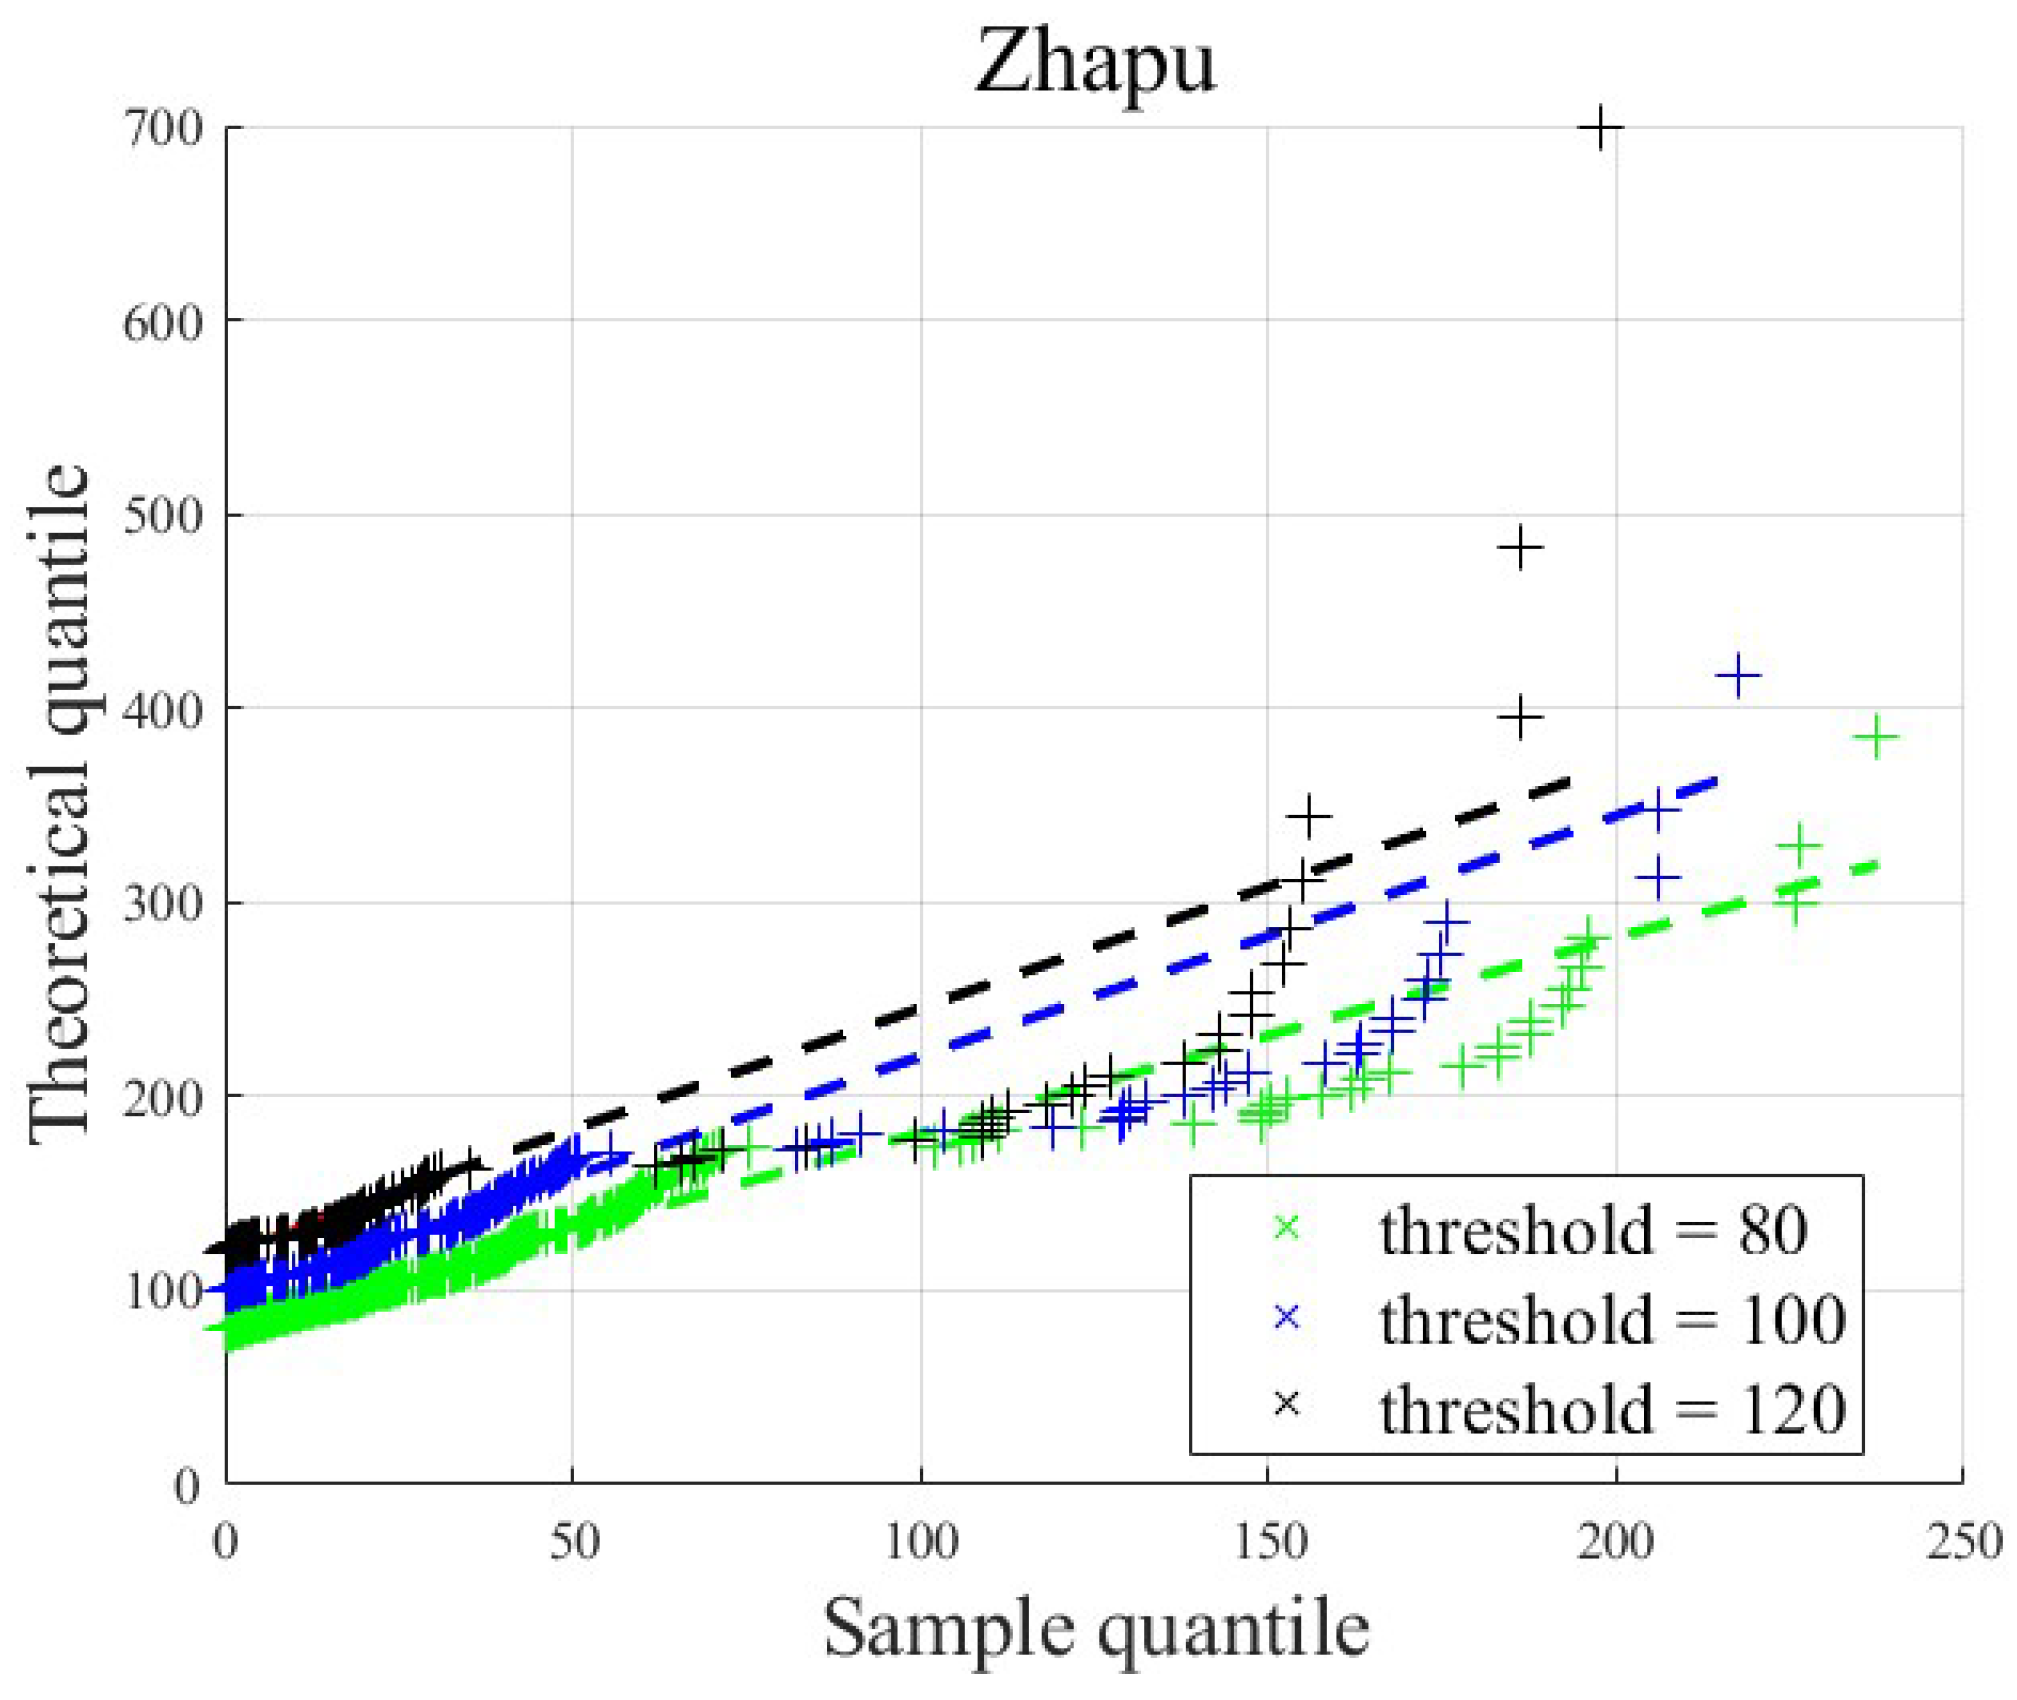
The determination of the threshold is critical for the GPD. We evaluated the GPD fitting performance using Quantile–Quantile (Q-Q) plots and accepted a candidate threshold if it resulted in a marked improvement in goodness-of-fit. Q-Q plots provide a visual assessment of the goodness-of-fit between theoretical and empirical distributions. Taking the extreme water level fitting at Zhapu Station as an example, candidate thresholds of 80 cm, 100 cm, and 120 cm were tested. As shown in
Figure 20, the Q-Q plot for the 80 cm threshold demonstrates the most superior fit. Consequently, the optimal threshold for GPD fitting of extreme water levels at Zhapu Station was determined to be 80 cm. The same methodology was applied to determine the GPD fitting thresholds for other stations and extreme wind speeds. Detailed descriptions are omitted here for brevity.
The statistical goodness-of-fit for the Weibull, Gumbel, and GPD distributions was evaluated using the Kolmogorov–Smirnov (KS) test under a significance level of 0.05, with detailed test results presented in
Table 5 and
Table 6. In
Table 5 and
Table 6, the H value is either 0 or 1. When H = 0, it indicates that the difference between the sample distribution and the theoretical distribution is not statistically significant, i.e., the data conform to the specified distribution. When H = 1, it indicates that the difference between the sample distribution and the theoretical distribution is statistically significant, i.e., the data do not conform to the specified distribution. If the
p-value is less than the set significance level of 0.05, the data do not conform to the distribution; if it is greater than 0.05, the data conform to the specified distribution.
The KS test results documented in
Table 5 and
Table 6 reveal consistent limitations of conventional distributions in modeling extremes. For both storm surge heights and typhoon wind speeds, the Weibull and Gumbel distributions demonstrate statistically inadequate performance, with hypothesis test outcomes H = 1, P ≈ 0 confirming significant deviations from empirical distributions. This contrasts sharply with the superior capability demonstrated by the threshold-exceeding approach. The GPD, specifically designed for modeling the heavy-tailed portion, achieves significantly better fit quality across both typhoon wind speeds and storm surge heights.
Visual validation through
Figure 21 reinforces this finding: the optimized alignment between GPD-derived theoretical curves and observed frequency distributions at Haimen, Ruian, Wenzhou, Zhapu coastal stations confirms the model’s robust performance in characterizing extreme wind speeds.
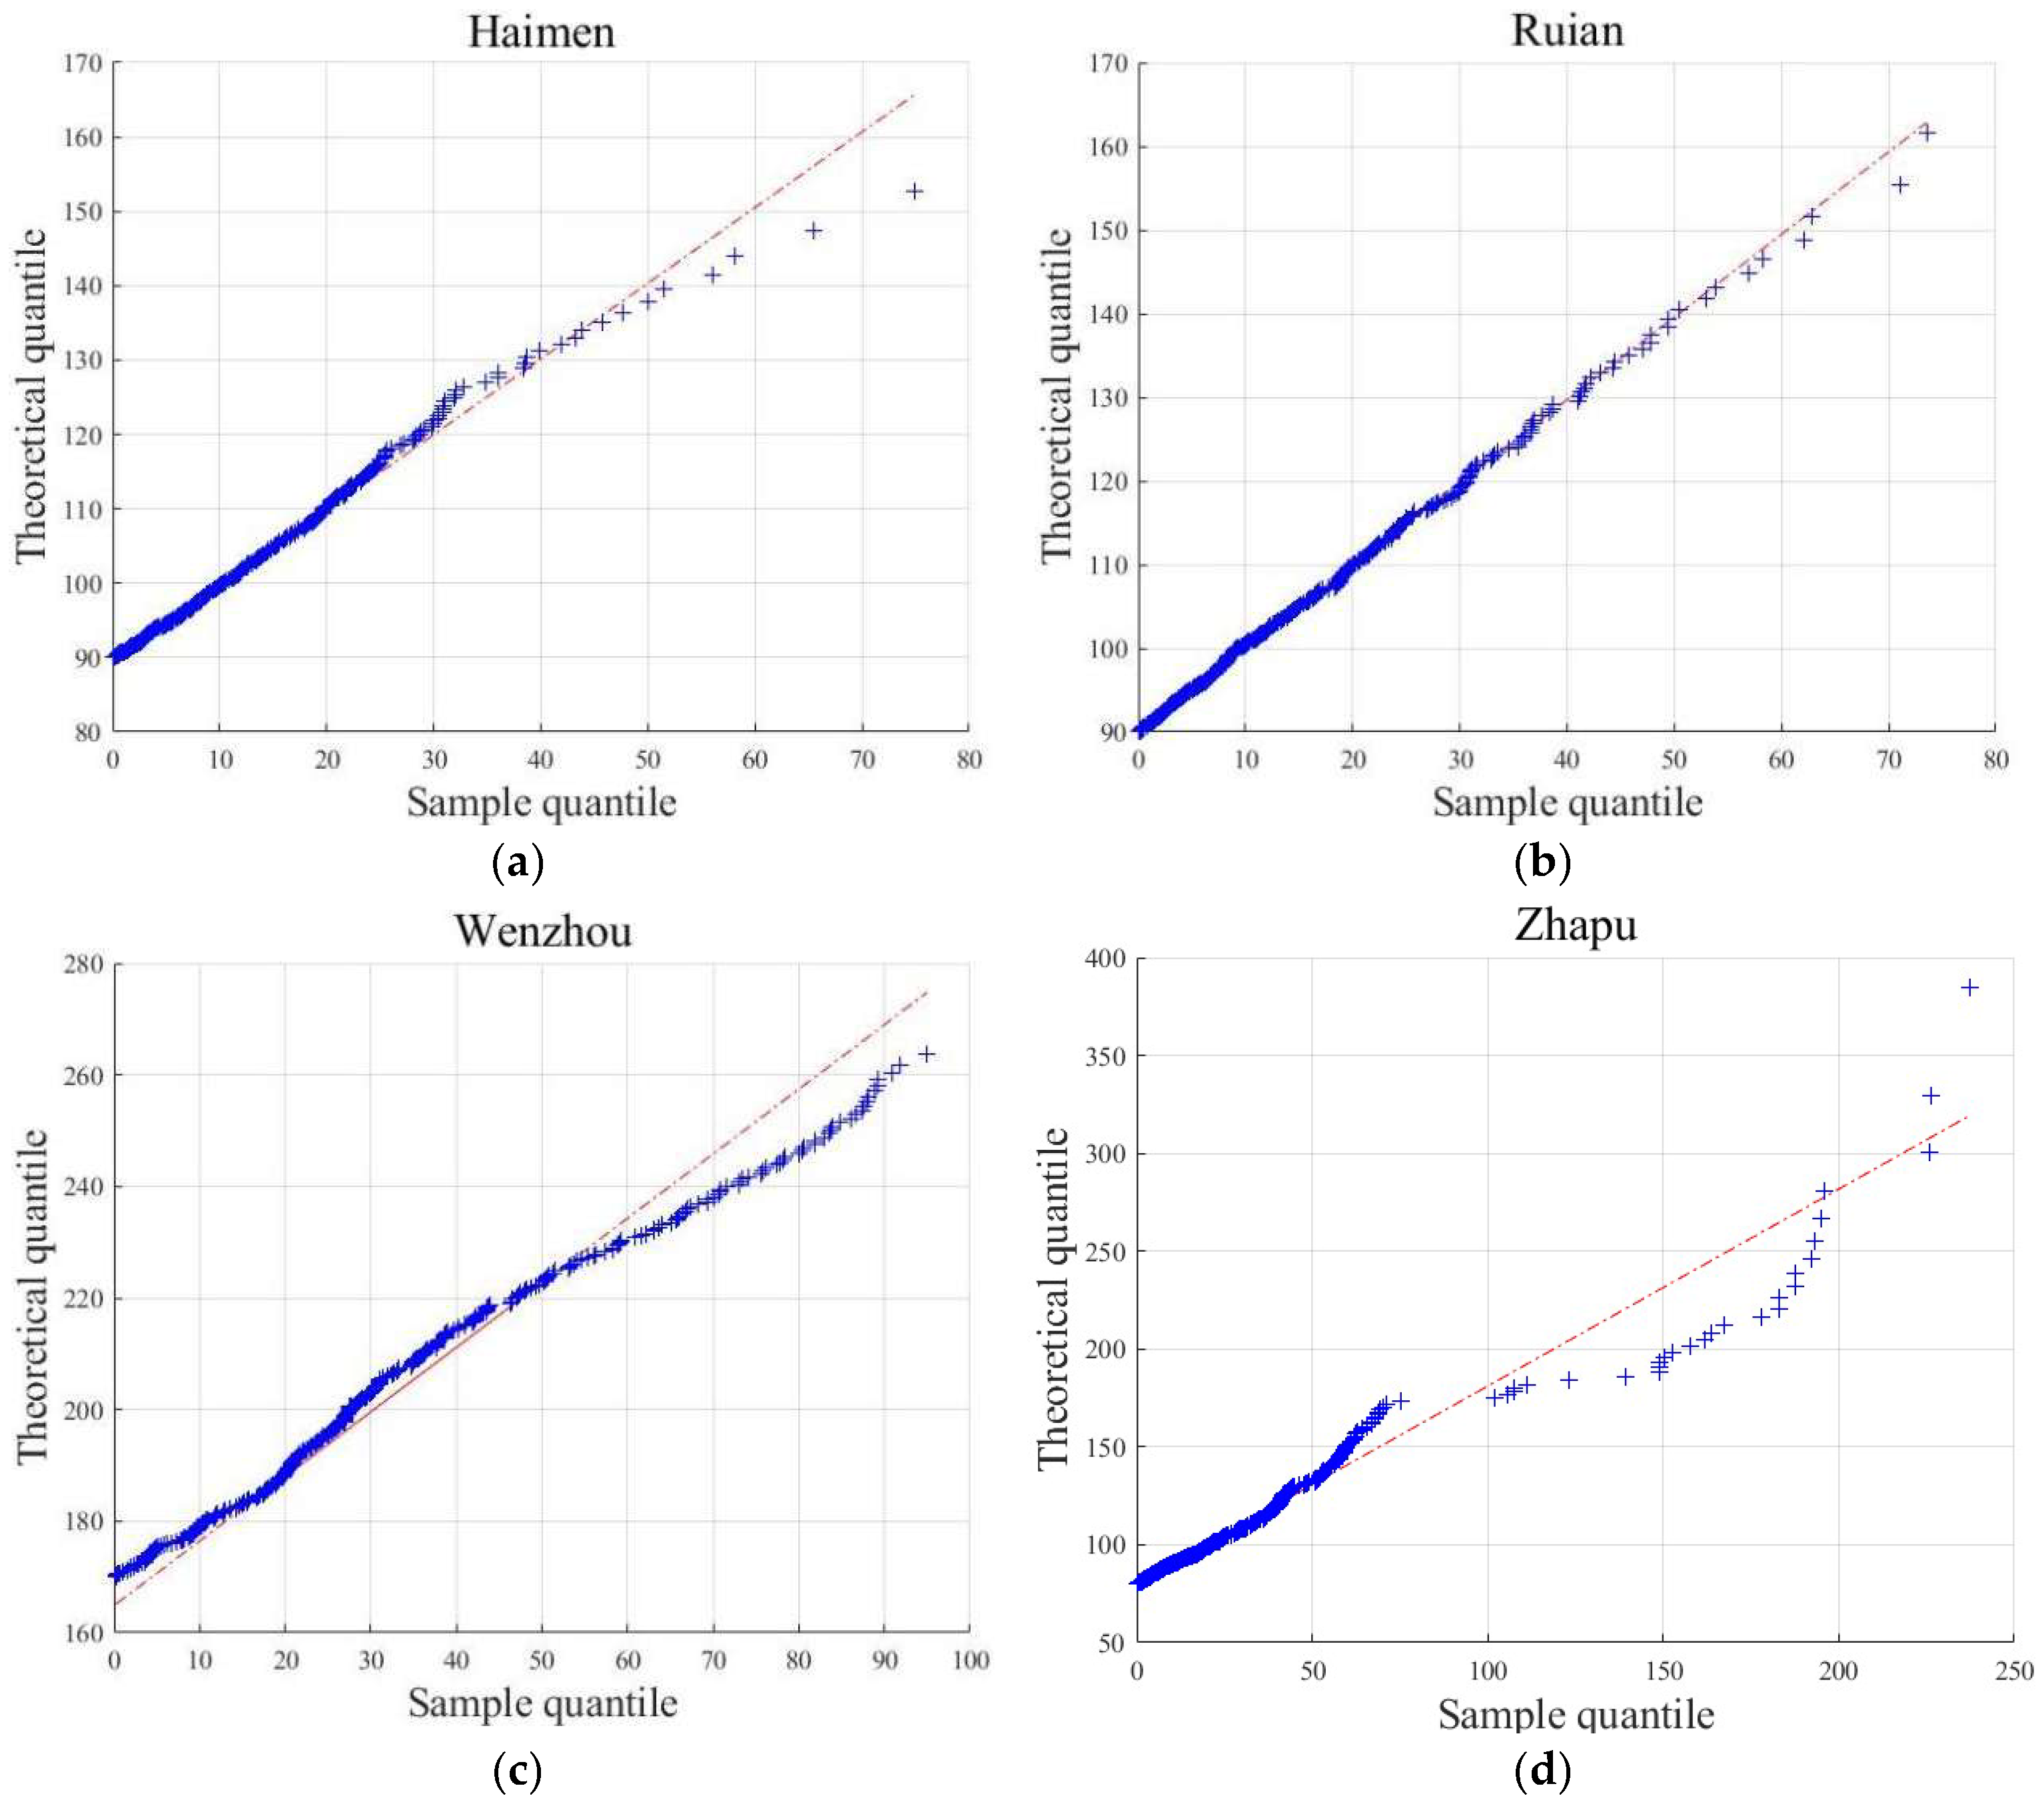
To evaluate the GPD fitting performance for extreme storm surge elevations at the Haimen, Ruian, Wenzhou, and Zhapu stations, we constructed corresponding Q-Q plots as shown in
Figure 22. As demonstrated in
Table 6 and
Figure 22, the GPD exhibits robust fitting performance for extreme storm surge heights at Haimen, Ruian, and Wenzhou stations, but demonstrates reduced congruence at Zhapu Station. This discrepancy originates from the empirical frequency distribution at Zhapu departing from heavy-tailed characteristics, manifested through insufficient exceedance data above the threshold and insufficient concentration of peak surge observations.
Based on these findings, we adopted the GPD as the optimal distribution for modeling extreme typhoon wind speeds at all four stations of Haimen, Ruian, Wenzhou, Zhapu and extreme storm surge elevations at the Haimen, Ruian, and Wenzhou stations, while prioritizing empirical distribution selection for extreme surge heights at Zhapu Station.
Based on the calibrated extreme value distributions, we quantitatively estimated extreme wind speeds and surge heights corresponding to 10-, 30-, 50-, 100-, and 200-year return periods at all stations. These estimates were derived using return period formulas associated with the empirical distribution, Weibull distribution, Gumbel distribution, and GPD, as defined in Equations (9), (11), (13), and (15), respectively. The predicted maximum wind speeds and maximum surge heights for different return periods at the four stations are presented in
Table 7 and
Table 8, respectively.
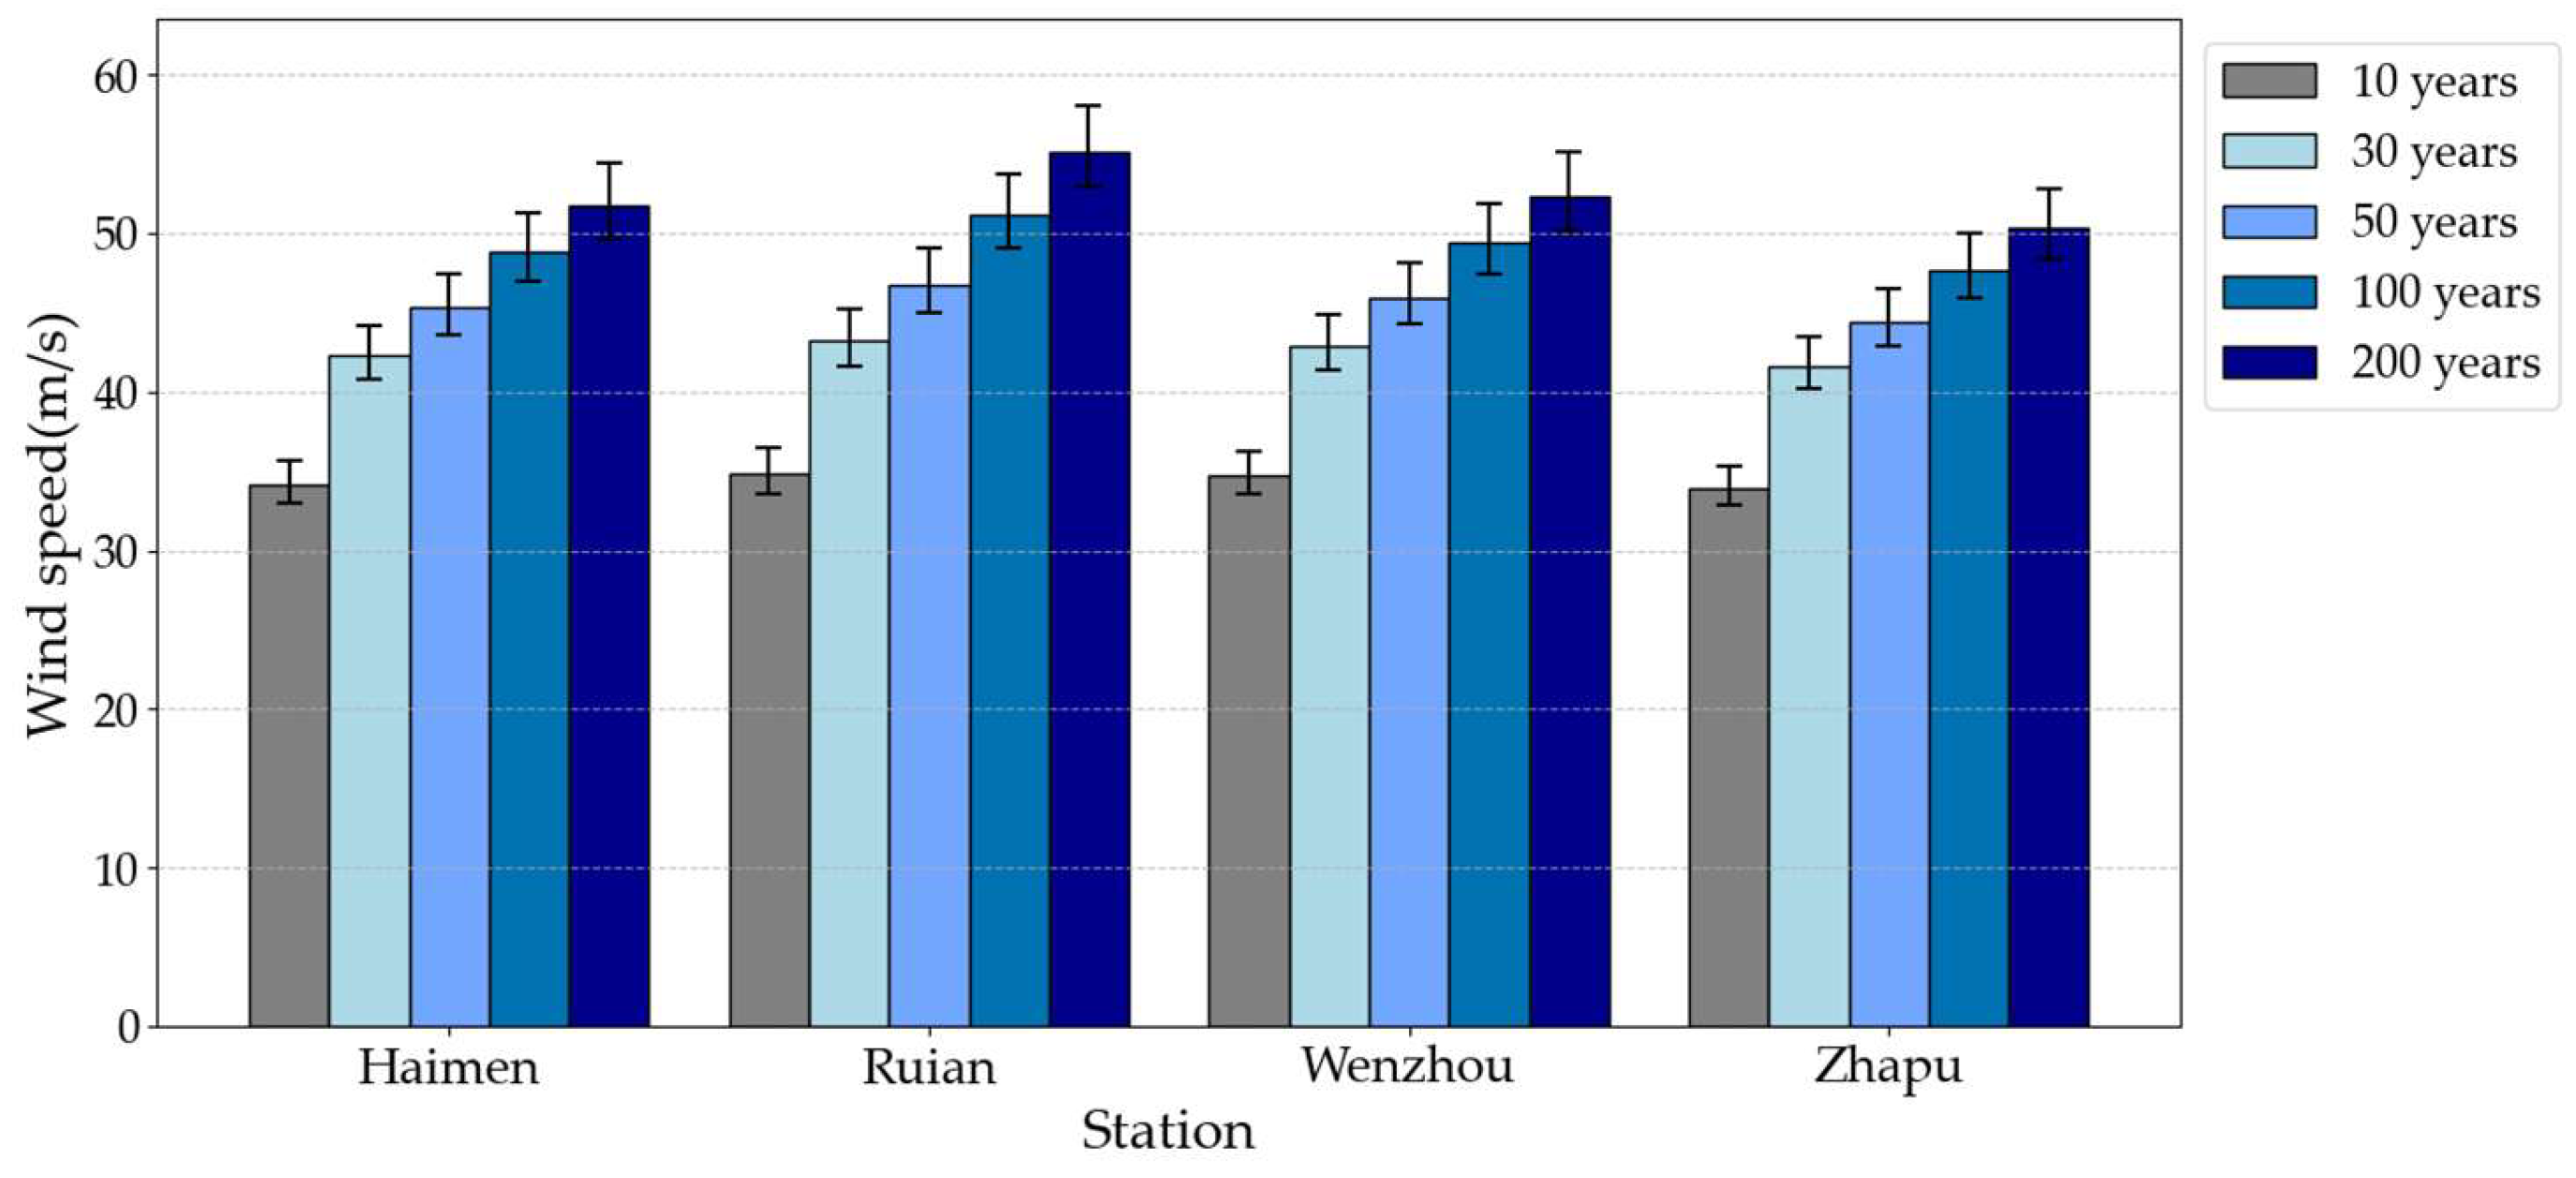
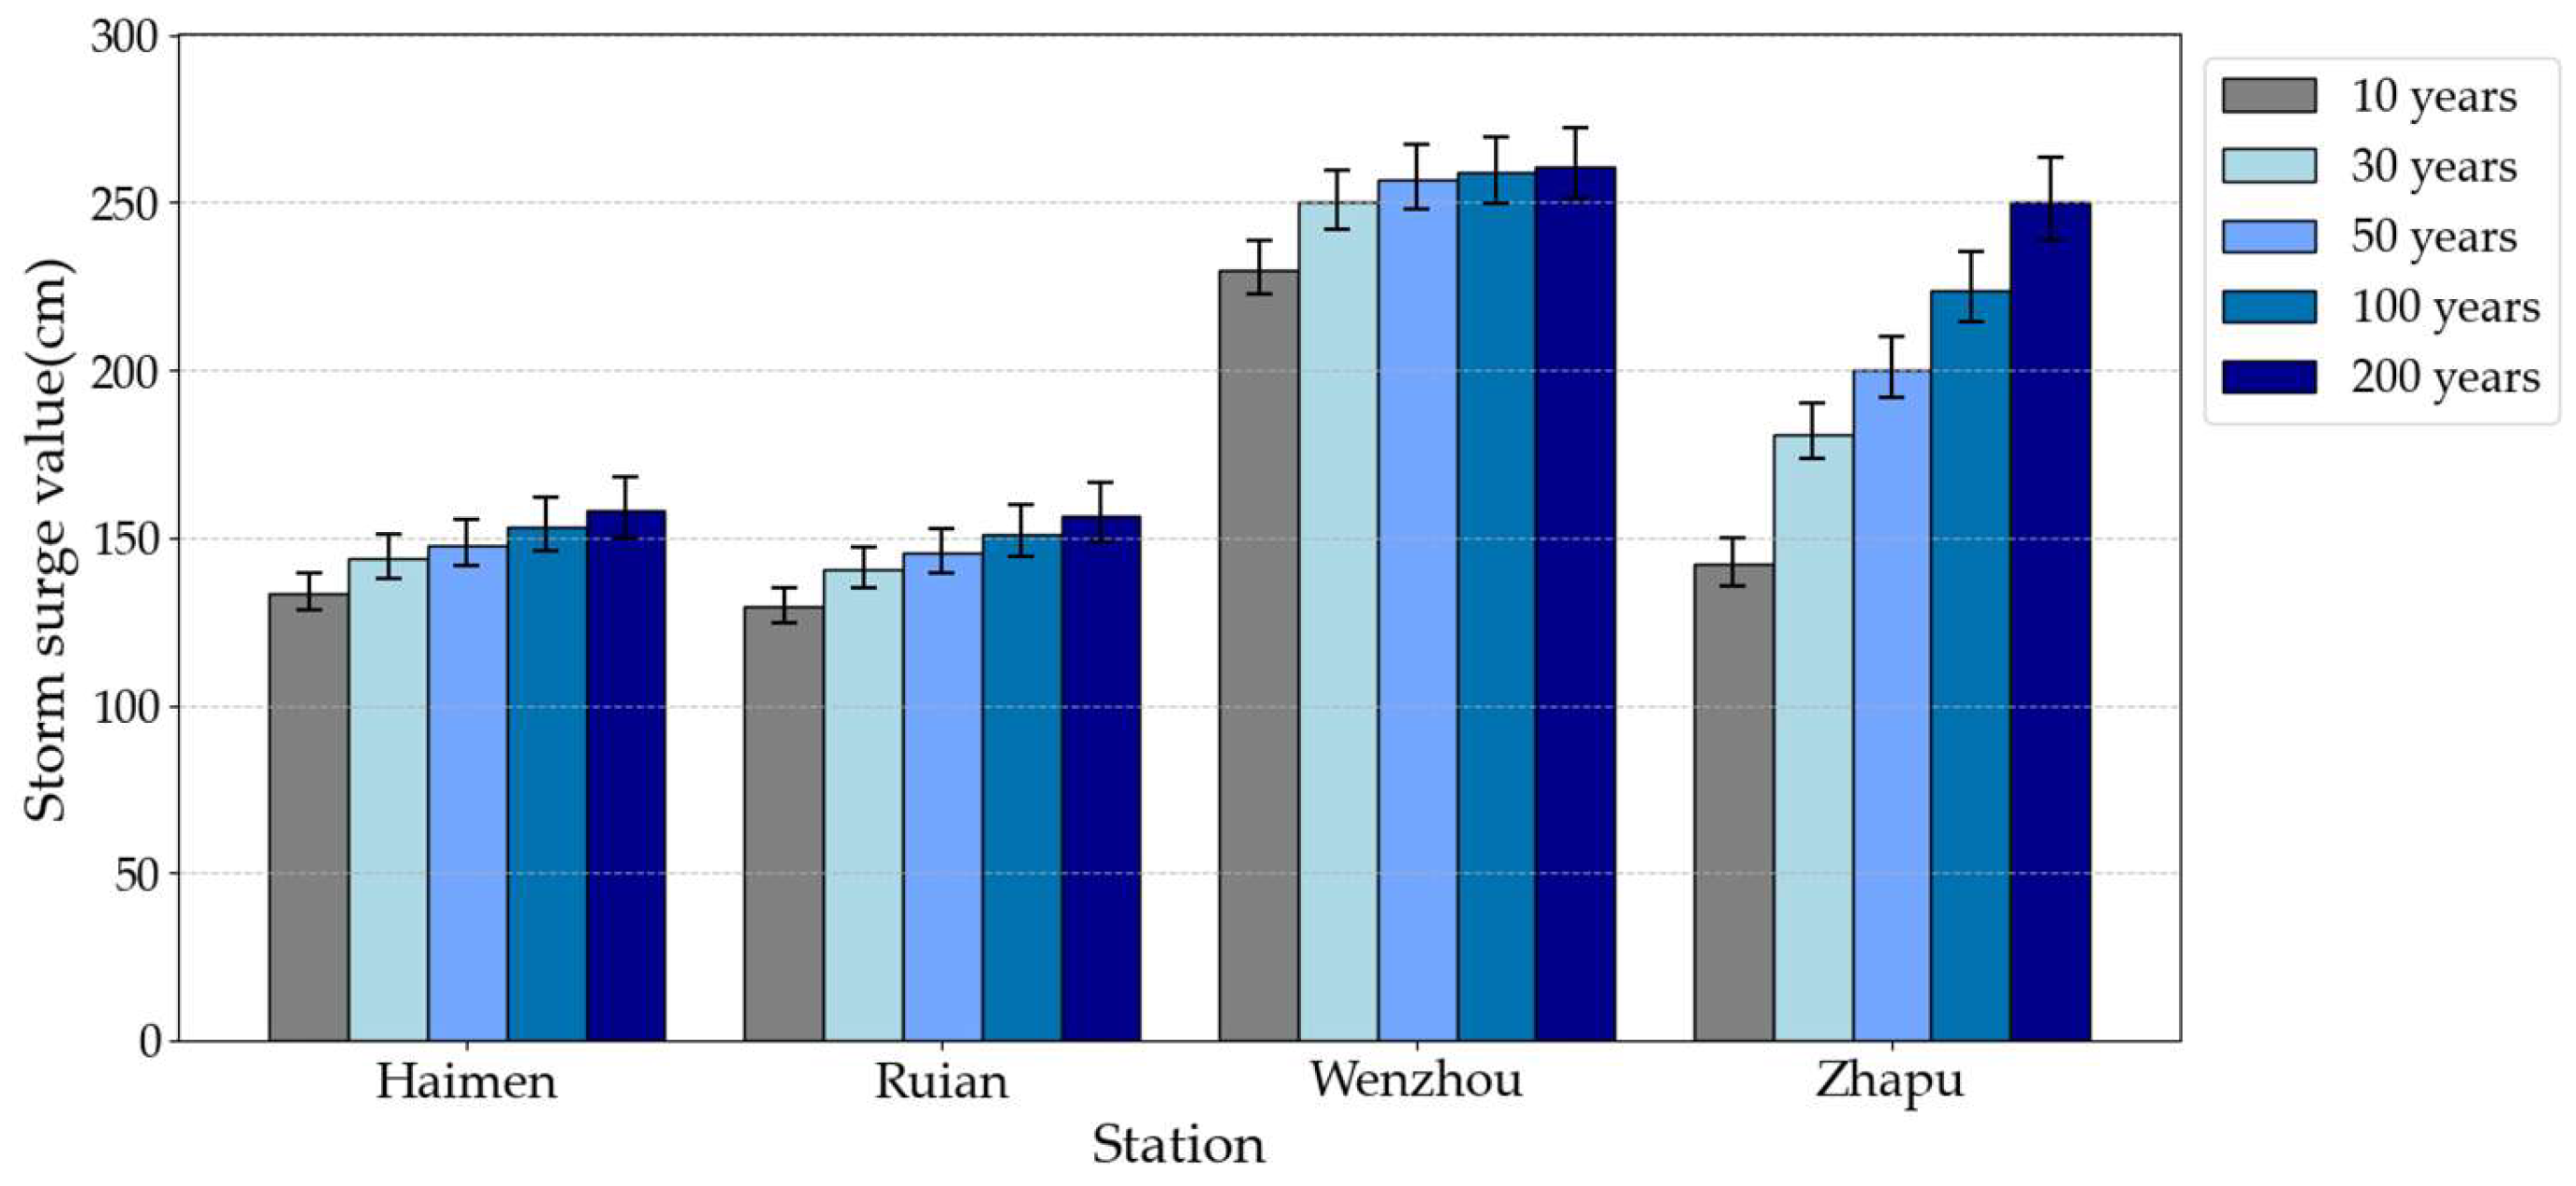
To more intuitively demonstrate variations in extreme wind speeds and storm surge heights across different return periods and stations, we constructed corresponding bar charts with 95% confidence intervals, as shown in
Figure 23 and
Figure 24. The narrower confidence intervals indicate that the return period estimates derived from the extreme value distribution adopted in this study exhibit enhanced stability.
As evidenced by
Table 7 and
Figure 23, wind speeds at all four stations demonstrate a systematic progression with extended return periods. For example, Haimen station documents wind speeds escalating from 34.17 m/s (10-year) to 51.81 m/s (200-year return period). This pattern quantitatively confirms the probability escalation of extreme meteorological events and their associated wind intensity amplification over multi-decadal timescales. Spatial analysis reveals marked inter-station divergence. Ruian station maintains relatively higher return period wind speeds, persistently surpassing Haimen and Zhapu stations throughout all investigated return intervals, while Wenzhou station achieves near-parity with Ruian’s values at defined recurrence epochs. These variations mechanistically originate from site-specific geographical determinants, encompassing the locational influence within typhoon trajectory corridors, the modulatory influence of mesoscale topography on wind field dynamics, and coupling effects between coastal geomorphology and marine processes. Illustratively, Ruian’s elevated wind susceptibility may reflect dual controls from typhoon pathway convergence zones and terrain-induced acceleration phenomena.
As revealed in
Table 8 and
Figure 24, storm surge heights at all four stations demonstrate hydrodynamic progression with elevated return periods. At Wenzhou station, the surge height climbs from 230.09 cm (10-year) to 261.30 cm (200-year return period), exemplifying the intensification of storm surge impacts under extreme meteorological forcing. This hydrodynamic progression quantitatively demonstrates that extreme-event water level anomalies become geophysically amplified, thereby escalating coastal inundation risks. Inter-station comparative analysis reveals distinct surge response regimes. Wenzhou station maintains the highest surge elevations across the four stations, while Zhapu station exhibits lower baseline surges but disproportionate escalation rates at multi-century return intervals. This spatial dichotomy primarily derives from site-specific oceanographic–topographic coupling. Wenzhou’s enhanced surge susceptibility stems from typhoon-optimized bathymetric configurations and nearshore resonance effects, whereas Zhapu’s nonlinear response pattern arises from estuarine funneling effects and tidal current modulation, which suppress low-intensity surges but trigger amplification thresholds under extreme forcing conditions.
Synthesis of multi-return period extreme surge heights and wind speeds reveals spatiotemporal heterogeneity in typhoon-induced storm surge impacts along Zhejiang’s coastline. This spatial differentiation necessitates systematic integration of site-specific parameters in storm surge hazard mitigation planning, particularly for infrastructure hardening and community-scale emergency preparedness. Fundamentally, the geospatial risk stratification between stations—with Ruian/Wenzhou exhibiting peak intensities versus Zhapu’s threshold-dependent escalation—demands differentiated engineering solutions ranging from typhoon-resilient building codes to estuarine floodgate retrofitting. These findings collectively establish that probabilistic hazard mapping based on station-specific extreme value distributions operationalizes coastal resilience planning across Zhejiang’s diverse littoral environments. The methodology framework, integrating synthetic typhoon modeling with multi-distribution frequency analysis, provides actionable intelligence for optimizing seawall design standards, calibrating early warning systems, and prioritizing coastal zone investments.
4. Summary and Prospects
4.1. Summary
This study integrates the TCRM model for typhoon generation with machine learning-based storm surge forecasting to analyze typhoon and storm surge hazards at Haimen, Ruian, Wenzhou, and Zhapu coastal stations in Zhejiang Province. Key findings are summarized as follows.
Firstly, for the traditional TCRM model, replacing the global IBTrACS tropical cyclone database (1848–2009) with the CMA best-track dataset (1949–2022) resulted in increased typhoon hazard levels predicted for Zhejiang’s coastal areas. The updated TCRM model was used to generate a synthetic typhoon event catalog for the western North Pacific over a 1000-year period. Secondly, based on historical typhoon track data from the Wenzhou Typhoon Network, storm surge height data from the Collection of Storm Surge Disasters Historical Data in China, and machine learning models, this study established storm surge forecasting models for the Haimen, Ruian, Wenzhou, and Zhapu stations. Sensitivity experiments on LSTM input parameters showed that models incorporating both teleconnection and local factors achieved optimal training and testing performance. Evaluations of LSTM, BP, SVR, and RF models demonstrated RF as the optimal model for all four stations. Thirdly, using selected synthetic typhoon events impacting Zhejiang Province from the 1000-year synthetic typhoon catalog, combined with the storm surge forecasting model and YM wind field model, we obtained extreme wind speed sequences and extreme surge height sequences for the four stations. Finally, four extreme value distributions, i.e., empirical, Weibull, Gumbel, and GPD distributions, were applied to fit the extreme wind speed and surge height sequences. Goodness-of-fit tests confirmed that GPD effectively models extreme wind speeds at all four stations and extreme surge elevations at Haimen, Ruian, and Zhapu, while the empirical distribution best fit extreme surge heights at Zhapu. Using these optimal distributions, we calculated 10-, 50-, 100-, and 200-year return period extreme wind speeds and surge heights for all stations, providing critical references for disaster management authorities.
4.2. Prospects
While machine learning represents a nascent research frontier in storm surge prediction, the absence of standardized methodological frameworks or consensus-driven evaluation metrics persists, with current methodologies remaining contingent upon investigator-specific empirical adaptations. Notwithstanding these developmental challenges, paradigm-shifting theoretical breakthroughs in this field could catalyze transformative progress in data-intensive surge forecasting systems.
Although the return period predictions of typhoon wind speed and storm surge for several stations in Zhejiang Province presented in this article have regional limitations, the idea of integrating the TCRM model and machine learning model for typhoon storm surge hazard analysis proposed in this article can be applied to other regions in the world to provide a theoretical reference for the analysis of corresponding typhoon and storm surge disasters.
While this study establishes a foundational framework for typhoon-induced storm surge hazard analysis in Zhejiang Province, several knowledge gaps merit rigorous investigation. Specifically, future research should quantify how parametric variations in typhoon tracks and intensities modulate station-specific surge responses, while advancing predictive frameworks for storm surge genesis and spatiotemporal evolution. Furthermore, data-model fusion strategies integrating multi-source observations with ensemble modeling techniques could substantially enhance hazard assessment precision. Critical infrastructure limitations persist: Zhejiang’s coastal zone currently lacks a domain-specific parametric storm database—a systemic constraint compounded by regional disparities in research frameworks—which fundamentally constrains machine learning’s operational capacity in local surge prediction. Consequently, developing geospatially optimized storm surge repositories for high-risk littoral systems represents an urgent scientific priority.
Therefore, our ongoing research efforts will focus on advancing typhoon and storm surge disaster analysis through three strategic initiatives:
- (1)
Enhanced Stochastic Typhoon Modeling: Implementing state-of-the-art empirical track simulation methods to upgrade the TCRM model, particularly refining its capacity to capture nonlinear path deviations and intensity fluctuations;
- (2)
AI-Driven Storm Surge Forecasting: Developing advanced machine learning architectures (e.g., physics-informed neural operators) to achieve high-precision, extended-lead-time predictions of regional storm surge dynamics, with particular emphasis on coastal bathymetry–topography interactions;
- (3)
Multivariate Hazard Risk Assessment: Optimizing extreme value distribution models while establishing high-dimensional joint probability distributions to enable coupled forecasting of wind–surge–wave compound hazards, incorporating copula theory to address dependence structures among multivariate extremes.


