Abstract
The amendment to MARPOL Annex VI, which limits the sulfur content in marine fuels to a maximum of 0.5 wt.%, came into effect in January 2020. This includes reducing sulfur oxide (SOX) emissions and establishing nitrogen oxide (NOX) emission standards (Tiers I, II, and III) based on the ship’s engine type and construction date. Furthermore, the regulations require oil tankers to control volatile organic compound (VOC) emissions and prohibit the installation of new equipment containing ozone-depleting substances. After a four-year exploration phase, global shipping companies still lack consistent evaluation criteria for the selection and use of alternative fuels, resulting in divergence across the industry. According to the latest data, methanol can reduce NOX, SOX, and particulate matter (PM) emissions by approximately 80%, 99%, and 95%, respectively, compared to traditional heavy fuel oil. Furthermore, green methanol has the potential for near-zero greenhouse gas emissions and can meet the stringent standards of Emission Control Areas. Therefore, this study adopts a cost-benefit analysis method to evaluate the feasibility and implementation benefits of two promising strategies: methanol dual fuel and very low-sulfur fuel oil (VLSFO). A 6600-TEU container ship was selected as a representative case, and the evaluation was conducted by replacing an older ship with a newly built one. The reductions in total pollutants and CO2-equivalent emissions of the container ship, as well as the cost-effectiveness of each specific strategy, were calculated. This study found that, in the first five years of operation, the total incremental cost of Vessel A, which uses 100% VLSFO, will be significantly lower than that of Vessel B, which uses a blend of 30% e-methanol + 70% VLSFO as fuel. Furthermore, compared to a scenario without any improvement strategies, the total incremental cost for Vessels A and B will increase by 69.90% and 178.15%, respectively, over five years. Vessel B effectively reduced the total greenhouse gas emission equivalent (CO2e) of CO2, CH4, and N2O by 24.72% over five years, while Vessel A reduced the CO2e amount by 12.18%. Furthermore, the cost-benefit ratio (CBR) based on total pollutant emission reduction is higher for Vessel A than for Vessel B within five years of operation. However, in terms of the cost-effectiveness of CO2e emission reduction, the CBR of Vessel A becomes lower than Vessel B after 4.7 years of operation. Therefore, Vessel A’s strategy should be considered a short-term option for reducing CO2e within 4.7 years, whereas the strategy of Vessel B is more suitable as a long-term solution for more than 4.7 years.
1. Introduction
Over 90% of the global merchandise trade volume is transported by sea, highlighting the crucial role of maritime shipping in international trade. However, the contribution of ships to air pollution and climate change cannot be ignored. Maritime transport is the most energy-efficient mode of freight transport in terms of energy consumption per ton-kilometer (tkm) [1]. As the volume of goods transported by sea increases, the amount of fossil fuel consumed by merchant ships rises rapidly, leading to substantial greenhouse gas emissions. The maritime industry consumes approximately 330 million tons of marine fuel annually [2], with the largest portion (77%) being heavy fuel oil (HFO), which is considered a low-grade fuel. Merchant ships contribute approximately 3% to 6% of global carbon dioxide (CO2), 14% to 31% of nitrogen oxides (NOX), and 4% to 9% of sulfur oxides (SOX) emissions [3], indicating that ships are also a major source of environmental pollution.
In 2020, the global commercial shipping fleet grew by 3% to 99,800 vessels, reaching a capacity of 2.13 billion deadweight tons by January 2021 [4]. With the rapid growth of global trade, the total greenhouse gas emissions from shipping increased by 9.6% from 977 million tons in 2012 to 1076 million tons in 2018 [5]. The maritime industry accounts for 2% to 3% of global annual greenhouse gas emissions [6]. According to the International Maritime Organization (IMO) forecast for 2050, the amount of CO2 emissions from marine transportation will account for 15% of global CO2 emissions [7]. In response, the IMO adopted the Initial Strategy on the Reduction of Greenhouse Gas Emissions from Ships (MEPC.304 (72)) in April 2018. This initial strategy defines the goals, tools, and guiding principles for shipping decarbonization, aiming to reduce CO2 emissions intensity from shipping activities by 40% by 2030 and 70% by 2050, compared to 2008 levels. In June 2021, the IMO’s Marine Environment Protection Committee (MEPC) adopted amendments to Annex VI of the International Convention for the Prevention of Pollution from Ships (MARPOL) at its 76th session (MEPC 76), requiring ships to reduce their greenhouse gas emissions. These amendments incorporate both technical and operational approaches to improve the energy efficiency of ships and support future greenhouse gas reduction measures. The new content includes dual energy efficiency requirements: the Energy Efficiency Existing Ship Index (EEXI) and the Carbon Intensity Indicator (CII), both aiming to further reduce emissions from ship engines. Greenhouse gas emission reductions can be achieved through various operational measures, such as improving engine efficiency, reducing hull resistance (through hull design and maintenance), limiting speed, and optimizing voyage planning.
As a follow-up to the 2018 strategy, the 75th MEPC proposed 44 emission reduction technologies [8] in the IMO’s 2020 Fourth Final Report on the Reduction of Greenhouse Gas Emissions from Ships (MEPC 75/7/15) [8]. Detailed energy-saving technologies are shown in Table 1.

Table 1.
Feasible energy-saving technologies assessed by IMO.
In response to stricter IMO carbon regulations and the 2050 net-zero goal, the maritime industry is exploring diverse energy-saving and alternative energy options. Biofuels are seen as a promising choice for their renewability and potential carbon neutrality. The IEA Bioenergy Task 39 [8] report states that although biofuels comprised only 0.5% of marine fuels in 2024, the market is growing rapidly, driven by IMO regulations and port-level policies. For example, the Port of Singapore bunkered 660,000 tons of B24 biofuel blend in 2024, demonstrating tangible progress in industry adoption [9].
Nuclear power, especially Small Modular Reactors (SMRs), is drawing interest as a zero-emission option for large vessels. Mature SMRs could offer clean, long-range power, though safety and policy issues remain [10].
Wave energy is also recognized as a stable marine renewable source. According to the Pacific Northwest National Laboratory (PNNL), it can supplement power for ports or offshore facilities and help cut carbon, with environmental impacts already assessed [11].
A simulation of a 40 m ferry in the Strait of Messina using solar panels showed that solar power could save €500,000 vs. diesel and €400,000 vs. electric options, while cutting emissions. The study notes that grid-powered electric ferries are not truly zero-emission, whereas solar energy offers strong environmental and economic benefits for short-range maritime use [12]. However, relevant studies also indicate that the application of solar energy on large, ocean-going vessels faces significant challenges, including limited installation area, weather dependency, and insufficient energy density [13]. Existing technologies and operational measures are not sufficient to achieve the expectations set by the IMO [14]. As energy efficiency requirements become increasingly stringent over time, most of the existing global fleet will not be able to meet new EEXI requirements. Shipbroking firm Simpson Spence Young released a report in 2021 that less than 25% of bulk carriers and tankers comply with the regulations [14]. Previous research shows speed reduction leads to reductions in carbon emissions, carbon intensity, and CII penalties, with greater reductions observed for larger ships [15]. Considering the need to reduce SOx, NOx, and CO2 emissions, alternative marine fuels have been identified as promising solutions to achieve medium- and long-term goals [16]. Especially after the IMO’s initial strategy to reduce greenhouse gas emissions from ships, switching to alternative fuels and energy has become a pressing need for many shipping companies [17]. These cleaner alternative marine fuels and energy sources include LNG, liquefied biogas (LBG), hydrogen, ammonia, methanol, ethanol, hydrotreated vegetable oil, fuel cells, nuclear power, wind power, solar power, electricity, etc. [18,19]. Regardless of the alternative fuel selected by shipping companies, it should be noted that the cost of renewable fuels will be higher than current fuel prices [20].
To achieve net-zero emissions by 2050, the use of alternative fuels is considered the fastest and most effective solution. Considering the technical feasibility and cost of current alternative fuels, methanol is regarded as a more suitable alternative, attracting shipowners to invest in methanol-dual-fueled ships. However, the economic and environmental impacts of methanol have not yet been evaluated objectively and fairly, and there is a lack of conclusive evidence regarding its cost-effectiveness in the literature. Therefore, this study aims to investigate the impacts of methanol dual-fuel vessels on cost (including OPEX (operating expenditure costs and CAPEX (capital expenditure costs)), pollutant emission reduction, greenhouse gas reduction, and cost-effectiveness.
The potential of cleaner alternative fuels in the maritime sector has been comprehensively reviewed, including maritime transport using cleaner alternative fuels [21], two decades of clean alternative marine fuels [22], technical and legal regulations for alternative marine fuels and renewable energy systems [23], safe use of ammonia fuel cells in the maritime industry [24], decarbonization of the shipping industry [25], the potential of liquid biofuels in reducing ship emissions [26], lifecycle comparison of maritime alternative fuels in terms of energy and cost [27], and challenges and opportunities for marine alternative fuel propulsion [28]. The current attention has been given to IGF (The International Code of Safety for Ships Using Gases or Other Low-flashpoint Fuels) code revisions and STCW’s (International Convention on Standards of Training Certification and Watchkeeping for Seafarers) maritime education and crew training aspects [29].
Alternative fuels are essential to meet regulations, with LNG as an early focus. However, LNG storage complicates ship design. Methanol, as a liquid at room temperature, is easier to handle and safer, with simpler storage and a higher flash point, despite its lower heating value [30]. In a study comparing various ship alternative fuels, including low-sulfur fuel oil, LNG, batteries, methanol, hydrogen, and ammonia, Petrychenko et al. [31] found that while low-sulfur fuel oil is expensive, it remains cheaper than liquid LNG, and converting ships to use it is relatively simple. Using LNG, however, would require significant modifications to fuel systems, reducing profitability. Comparatively, methanol may be the most promising short-term alternative fuel [31]. Hydrogen, ammonia, and methanol are promising maritime fuels. Hydrogen is zero-emission but costly and hard to store. Ammonia is carbon-free with good energy density but needs better handling. Methanol fits current systems, and green versions are vital for cutting emissions. However, all remain expensive and not yet fully mature [32].
Korean researchers assessed Well-to-Wake emissions for LNG, ammonia, methanol, and biofuels on a 75,000-dwt tanker. They found biofuels and CCS-based ammonia suitable short- to mid-term options, while e-methanol and e-ammonia are best for the long term. Blending green and fossil fuels may balance cost and emissions [33].
Parris et al. [29] reported that methanol offers several environmental benefits, including a 95% reduction in CO2 emissions, an 80% reduction in NOX emissions, and the complete elimination of SOX and PM emissions. It can also be utilized in existing infrastructure with minimal retrofitting costs, has a global annual production capacity of approximately 90 million tons, and benefits from an established supply chain. However, methanol presents some limitations, including its lower energy density (approximately 23% less than conventional fuels), which necessitates more frequent refueling. Its low ignition point and special safety measures also pose challenges. Specialized refueling and storage facilities will need to be developed. As the demand for environmentally sustainable shipping grows, methanol is becoming a prominent subject of research and practical application. Despite these advantages, the global production and supply chain for green methanol is still underdeveloped and requires rapid expansion to support its practical application [34]. Renewable methanol (e-methanol) has a promising future, with an estimated payback period of about three years. As environmental regulations become more stringent, e-methanol is expected to become more competitive [30].
Methanol is a flammable liquid that ignites easily and can explode under certain conditions. Its vapor is heavier than air and may accumulate in low or enclosed areas, posing explosion risks. External heat causes rapid vaporization, increasing danger. Methanol is also highly toxic—small exposures can cause blindness, and ingestion can be fatal.
Avoid swallowing methanol, inhaling its vapor, or entering spill areas. It can enter the bloodstream through the skin, so contact should be avoided. Methanol remains flammable even when fully dissolved in water. As methanol is a chemical solvent, it is imperative to use suitable containers for storage and transportation [30]. The physical properties of methanol are listed in Table 2.
Table 2.
Physical properties of methanol.
According to the IMO’s MSC.1/Circ 1621 circular, if methanol is used as fuel, the engine room and fuel compartment should have an approved fixed fire extinguishing system and a fire extinguishing agent suitable for extinguishing methanol fires. Fridell et al. [35] used a ferry sailing between Gothenburg in Sweden and Kiel in Germany as the research target. The results indicated that using methanol as fuel and marine diesel as pilot fuel in dual-fuel ship engines reduced exhaust gas and particulate matter emissions. From the perspective of emissions, the pollutant emission value of methanol is generally lower than that of traditional marine fuel oil, but the NOX emission must be treated to meet the Tier III NOX emission requirements [35]. It is noted that, compared with HFO, methanol could reduce the emissions of pollutants such as SOx, NOX, and PM by 99%, 60%, and 95%, respectively. Badger et al. [8] investigated the environmental and cost-effective performance of methanol under actual routes using lifecycle assessment.
Yin et al. [36] noted methanol’s similarity to diesel in combustion and storage, making it adaptable to existing engines with modifications or dual-fuel systems. However, methanol has lower energy density, requiring more fuel or frequent bunkering. Its corrosiveness demands resistant materials. Regulatory gaps also exist, as current rules target HFO and diesel. The EU and IMO have begun to ensure methanol’s safe use onboard. The storage and safety aspects of methanol are listed in Table 3.
Table 3.
Storage, bunkering, handling, and safety considerations for methanol.
Green methanol offers strong carbon reduction potential but remains costly, limiting its adoption in shipping. Blending it with low-sulfur fuel oil (VLSFO) may improve cost-effectiveness. This study compares the economic and environmental performance of using 30% green methanol + 70% VLSFO versus 100% VLSFO, aiming to support shipowners in reducing emissions while managing costs. A cost-benefit analysis will evaluate feasibility, along with an assessment of technical challenges. Gore et al. [39] used the Net Present Value (NPV) method to evaluate the cost-effectiveness of LNG, methanol, green hydrogen, and green ammonia. Priyanto et al. [40] also applied the NPV method to assess the potential of methanol as an alternative marine fuel for domestic shipping in Indonesia. However, since the NPV method cannot reflect the relative effectiveness of different pollution control measures, its practicality as an evaluation method is limited.
According to the statistic report “Number of container ships on order from H2 2022 to 2025, by vessel size and year of delivery, among the 335 container ships scheduled for delivery in 2024, the largest number of container ships will be those with a capacity of 3000~7999 TEU, totaling 120 ships (approximately 36%), as shown in Figure 1.
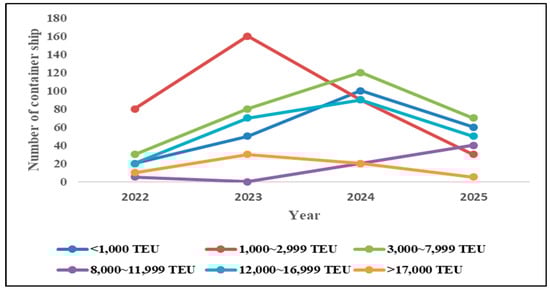
Figure 1.
Number of container ships on order from H2 2022 to 2025 by vessel size and year of delivery. Plotted by the authors based on [41].
The 5500–6500 TEU containers are suitable for various routes and can quickly adapt their operational strategies to changes in market demand. Therefore, this study selected 6600 TEU newbuilding A-ships (using 100% VLSFO) and B-ships (30% electric methanol + 70% VLSFO) as the research targets to align with current practices.
Container Vessel A and Container Vessel B, both with capacities of 6600 TEU, were selected as the most appropriate targets for this study, and the cost-benefit ratio method was used for the assessment. Based on the study’s findings, recommendations can be provided to the shipping industry regarding fuel use amid the global trend of energy conservation and emission reduction, helping the stakeholders to strike a balance between emission reduction and cost control.
While existing literature has established preliminary evaluation models for the application of green alternative fuels, a research gap remains due to the limited systematic exploration of multi-fuel strategy comparisons and carbon tax policy orientations. Bivariate sensitivity analysis was then applied to examine the critical thresholds for changes in economic and environmental benefits. This study contributes to informing fuel transition strategy decisions for both industry and policymakers. Its key contributions include the inclusion, for the first time, of different methanol types and co-combustion strategies (e.g., VLSFO + methanol) in a cost-benefit ratio comparison and sensitivity analysis.
2. Development of Marine Methanol Fuel and Its Application in Today’s Shipping Industry
The discussion of methanol as a marine fuel can be traced back to around 20 years ago. At that time, the shipping industry widely used HFO as the primary fuel for ships. However, the combustion of HFO produces large amounts of sulfur oxides (SOx) and PM, which have serious impacts on the environment and human health. In areas with dense ports and waterways, these pollutants have significantly deteriorated air quality, and the incidence of lung cancer and other respiratory diseases among residents has noticeably increased. This situation prompted governments and international organizations to seek cleaner alternative fuels to reduce the negative environmental impact of the shipping industry.
To address the environmental problems caused by the combustion of HFO, the European Union launched a research program in 2006 focused on methanol as a marine fuel [42]. This program aimed to assess the feasibility of methanol as a marine fuel and to develop relevant technical and regulatory frameworks. The research covered improvements in engine technology, the design of fuel supply and storage systems, and the development and revision of related regulations.
Furthermore, the emissions from methanol combustion differ from those of conventional fuels, necessitating corresponding adjustments to emission standards. The following sections discuss the definition and types of methanol, methanol dual-fuel engine technology, bunkering port facility requirements, and current applications in the maritime sector.
2.1. Types and Advantages of Methanol as Fuel
Methanol (CH3OH), also known as methyl alcohol or “wood alcohol” due to its historical production from the dry distillation of wood, is a colorless, transparent liquid with a pungent odor. It has a boiling point of 64.6 °C and remains in a liquid state at room temperature. As a fuel, methanol burns to form water and small amounts of carbon dioxide and nitrogen dioxide, with almost no PM. Engines running on methanol also burn more completely and produce almost no carbon deposits. According to the different raw materials and production processes used, methanol can be classified into brown, gray, blue, and green methanol. Among these, brown, gray, and blue methanol are considered nonrenewable methanol, while green methanol is renewable. The definitions and production routes are provided in Table 4.
Table 4.
Types and production routes of methanol.
According to the International Renewable Energy Agency (IEA), E-Fuel is a fuel obtained or synthesized from hydrogen produced by water electrolysis. Hydrogen, the core component of E-Fuel, must be derived from a low- or zero-carbon electricity supply. In addition, other essential elements of E-fuel must also be effectively treated or processed. Methanol produced in this way is considered an E-fuel or E-methanol [43]. Hydrogen and e-methanol are key to achieving EU Net Zero Emission Targets [44]. Therefore, this study utilized electro-methanol as an alternative fuel for evaluation. The estimated production cost of e-methanol is strongly influenced by the cost of renewable hydrogen and assumptions related to carbon pricing. Currently, the production cost of renewable hydrogen is estimated to range from €3 to €10 per kilogram, primarily depending on the capital cost of electrolysis equipment and the levelized cost of renewable electricity. If large-scale deployment is realized, the cost of the electrolysis tanks is expected to decline [44]. At present, the price of methanol derived from electricity is estimated to be between 800 and 1500 € per ton, while the price of fossil methanol is significantly lower, at around 350 to 500 € per ton [45].
Methanol is a colorless, water-soluble liquid with a mild alcoholic odor and has the highest elemental hydrogen-to-carbon ratio among all liquid fuels under normal ambient conditions. Therefore, it can serve as a key energy carrier and an alternative fuel. Like ammonia, methanol is a low-viscosity fuel with low heating value (approximately 40% of diesel) and flammability characteristics, which means more fuel is required to achieve the same power output. Diesel pilot fuel is typically used to maintain stable engine operation. Methanol can be used in both diesel and gasoline engines, and its efficiency is similar to that of other current dual-fuel engines. Its inherently stable nature fuel allows it to be stored at room temperature and ambient pressure, resulting in a long storage life. This makes methanol well-suited for use as a marine fuel, given its compatibility with existing fuel storage infrastructure. However, methanol also presents certain drawbacks. The advantages, disadvantages, and characteristics of methanol as an alternative fuel for maritime shipping are summarized in Table 5.
Table 5.
Advantages, disadvantages, and characteristics of methanol as a marine alternative fuel.
As shown in Table 4, the International Renewable Energy Agency categorizes hydrogen types based on the technology and methods used. Hydrogen generated through electricity generated from renewable energy sources is referred to as green hydrogen. Green hydrogen is low-carbon hydrogen and the only form considered renewable. Hydrogen produced from fossil fuels with greenhouse gas mitigation measures—such as the use of carbon capture equipment—is classified as blue hydrogen. Although blue hydrogen is low-carbon, it is considered nonrenewable due to its fossil fuel origin. In contrast, hydrogen produced from fossil fuels without emission reduction measures is considered brown hydrogen or gray hydrogen, both of which are high-carbon and nonrenewable. Therefore, methanol produced from green hydrogen and renewable CO2 is called e-methanol. Currently, biomethanol—methanol derived from biomass—is the most economical renewable methanol option, supported by the wide availability of biomass resources. However, biomass availability may not be sufficient to meet future global methanol demand. Therefore, e-methanol produced directly from carbon dioxide and hydrogen holds great potential, as it is not constrained by feedstock limitations like biomass.
2.2. Methanol Dual-Fuel Engine Technology
Internal combustion engines convert the chemical energy of fuel into mechanical energy through fuel combustion. In addition to the basic properties of the fuel, the combustion compatibility of the fuel is crucial for high engine efficiency and low emissions. There are three main ignition methods for internal combustion engines: compression ignition (ci), spark ignition (si), and homogenous charge compression ignition (hcci). In addition to these three main combustion strategies, three other intermediate combustion strategies are suitable for methanol combustion in diesel engines: dual-fuel combustion, direct injection spark ignition, reactivity-controlled compression ignition, and partially premixed combustion (PPC) [46]. Among these, the dual-fuel combustion strategy is more suitable for methanol fuel. This method uses two different fuels: diesel (with a higher cetane number and a lower octane number as the pilot fuel) and methanol (high-octane fuel) as the main fuel. Methanol can be injected into the intake manifold port or directly into the cylinder. Then, diesel is injected into the methanol-air mixture in the cylinder, which is compressed and ignited. The dual-fuel combustion strategy is characterized by the fact that the amount of pilot fuel used to ignite the methanol-air mixture can be as low as 1–2% of the total fuel. The ignition timing is determined by the diesel injection timing, while the methanol-air mixture is burned through flame propagation, similar to an SI engine. In practical applications, the main engine manufacturer, MAN Energy Solutions, provides methanol dual-fuel engines, which have been successfully operated on several ships. The dual-fuel engine launched by Wärtsilä uses methanol and offers high efficiency and low emissions.
2.3. Facility Requirements for Methanol Bunkering Ports
As a sustainable alternative fuel, methanol has gained attention due to its environmental benefits and lower emission levels. However, despite its many advantages, the promotion and application of methanol as a marine alternative fuel still face several challenges, particularly in the construction and operation of bunkering ports. First, methanol storage and transportation require specialized equipment and technologies. As a low flash point fuel, methanol storage facilities must meet higher safety standards, including stringent fire and leak prevention measures. This requires port operators to make costly infrastructure upgrades or new construction to safely store and supply methanol.
Only a few ports worldwide, such as Rotterdam, Gothenburg, Zhoushan, and Ulsan, offer methanol bunkering services [47]. This limited supply network restricts the operational range of methanol-fueled ships, reducing the incentive for shipowners on nonfixed routes to switch to methanol fuel. The supply chain of methanol is also a challenge. The production and distribution of methanol require reliable raw materials and manufacturing facilities. Although methanol can be produced from various feedstocks, including natural gas and renewable resources, global methanol production and distribution networks are not yet fully established, which affects its popularity as a marine fuel. Confronted with these challenges, some ports have taken action. For instance, the Port of Rotterdam not only provides methanol bunkering but is also actively expanding its sustainable fuel supply capacity, including investing in the construction of new green methanol production facilities [48]. These efforts demonstrate the commitment of some leading ports to promote methanol as a ship fuel and their leadership in the field of sustainable shipping.
As methanol is in a liquid state at room temperature, the main methods of ship refueling with liquid fuel have been experimentally proven to apply to methanol refueling. The following are the current methanol refueling modes [49]:
- Truck-to-Ship (TTS): Using road tankers to refuel methanol from trucks to ships
- Ship-to-Ship (STS): Methanol is transported to the receiving vessel by another methanol vessel or barge moored at the wharf
- Port-to-ship (PTS): Using pipelines or hoses to connect onshore storage tanks to ships for methanol refueling
- Portable tanks: Transporting methanol in portable tanks and refueling from the tanks to the ship
Among these, truck-to-ship is the most common bunkering method. Most large vessels are bunkered through ship-to-ship, as demonstrated by the methanol ship-to-ship bunkering trial conducted in Rotterdam in May 2021. For wharf-to-ship bunkering, special attention must be given to the compatibility of pipeline size and delivery pressure with ship equipment, while portable tanks are used for bunkering small quantities of methanol [49].
2.4. Application of Methanol in the Current Maritime Sector
Currently, LNG and methanol are two alternative fuels that the shipping industry is experimenting with to meet the greenhouse gas emission requirements of the IMO. In terms of storage, methanol fuel is easier to manage, requires less storage space, and incurs lower costs. Additionally, it produces less carbon dioxide, generally resulting in lower costs than other fuels [50]. However, the carbon dioxide emissions from methanol vary depending on how it is produced and transported. Brown methanol, derived from fossil fuels, emits more carbon dioxide over its life cycle than diesel, making green methanol the preferred option for decarbonization. Since the molecular structure is the same for gray, brown, blue, or green methanol, blending methanol types offers a practical pathway for transitioning from conventional to renewable marine fuels. The adoption of low-carbon and carbon-neutral fuels poses greater challenges for long-haul and medium-haul ships than for smaller vessels. Fuels with lower energy content than marine diesel oil (MDO), such as LNG and methanol, require the redesign of ship engines. LNG fuel requires approximately three to four times the space of MDO, while methanol fuel requires about twice as much.
Global research and development on methanol fuel are actively progressing. Compared with LNG, methanol has lower CO2 emissions [50]. Moreover, using LNG as a marine alternative fuel presents issues such as methane leakage, prompting an increasing number of shipping companies to choose methanol as their primary alternative fuel [30]. When evaluating alternative fuels, it is essential to consider their CO2 emissions throughout the entire life cycle, as lifecycle assessment is a key factor in evaluating fuel sources under the Well-to-Wheel approach. The Maersk Group has stated that it “will not use LNG as a marine fuel because of the problem of methane slip” [51]. Instead, they favor methanol as their preferred choice. In recent years, there has been an increase in new ship orders for methanol-fueled vessels, particularly in the container shipping sector. Maersk has ordered 19 methanol dual-fuel container ships, COSCO Shipping has ordered 12 methanol dual-fuel container ships, and CMA CGM has also ordered six methanol dual-fuel container ships According to the latest data from DNV’s Alternative Fuels Insight platform, 20% of newbuilding ship orders in the past 12 months were for ships that can use alternative fuels, with methanol accounting for approximately 9%, LNG for 8%, and LPG for 3%. In March 2024, COSCO Shipping Heavy Industry Co., Ltd. officially signed a contract for the methanol dual-fuel retrofitting of two 13,800 TEU and two 20,000 TEU existing container ships—marking the world’s first dual-fuel retrofitting project involving MAN main engines and WÄRTSILÄ auxiliary engines [52].
However, while gray methanol produced from natural gas is readily available, its CO2 emissions over the life cycle are not significantly reduced. In contrast, blue methanol—produced using blue hydrogen and carbon capture and storage (CCS)—can significantly reduce CO2 emissions. Nevertheless, the current supply of blue and green methanol remains limited, with less than 500,000 tons available in 2022 and relatively higher production costs [53]. Currently, methanol is more expensive than diesel, and its adoption depends on the type of methanol used, its price, and the proportion of energy it provides. Although methanol fuel costs are slightly higher, they should be evaluated within the context of the current regulatory environment. Ships that fail to meet the CII and EEXI targets will be prohibited from continuing operations. Therefore, the additional cost of such alternative fuels must be weighed against current fossil fuel prices, the cost of building new, more efficient ships, and the potential financial losses from forced decommissioning. When derived from fossil fuels, methanol offers limited carbon reduction potential as a marine fuel. In contrast, green methanol faces challenges such as water-dissociating costs and resistance to its widespread adoption. Whether methanol will become the optimal fuel for carbon neutrality remains uncertain. Nevertheless, methanol will certainly provide greater environmental benefits. Once its safety is well understood and the regulatory environment is fully developed, replacing traditional marine fuel with methanol fuel will become a key strategy for transforming and upgrading the shipping industry.
2.5. Future Development Trends of Methanol
The biggest challenge in producing methanol from carbon dioxide and hydrogen lies in cost, particularly due to the energy-intensive process of obtaining hydrogen through electrolysis. Therefore, reducing electricity costs and the cost of carbon dioxide acquisition represents the most important challenge. According to statistics from Methanol Market Services Asia, the use of methanol has been increasing annually, and it is widely used in chemical raw materials and fuels. With the promotion of policies to reduce greenhouse gas emissions, carbon-containing methanol—traditionally produced from fossil fuels such as natural gas—is gradually shifting toward production through biomass or other more environmentally friendly methods. GENA Solutions Oy (GENA) pointed out that the current production of renewable methanol is still low, with an estimated output of 500,000 tons in 2022. Currently, renewable methanol is mainly biomethanol, but with policy support and technological advancements, its production is expected to reach 19.7 million tons by 2029, and the production of e-methanol will also increase significantly [54]. Meanwhile, a report in September 2024 indicated that among the 192 renewable and low-carbon methanol plants and projects globally, 105 were e-methanol plants and projects (accounting for 53%), with a total production capacity of 17.0 tons, 73 were biomethanol plants and projects (accounting for 38%), with a total production capacity of 12.3 tons, and 14 were low-carbon methanol plants and projects (accounting for 9%), with a total production capacity of 8.1 tons [54].
For investment in the entire industrial chain, including the development of related technologies, infrastructure construction, and deployment, a certain scale must be reached to achieve benefits. Methanol can be used in ship engines and as an important chemical product. Currently, gray and blue methanol dominate the market, and green methanol is expected to replace them in the future [38].
While electro-methanol presents a low-carbon and environmentally promising alternative fuel, its practical implementation encounters several key challenges. Firstly, methanol’s low flash point (approximately 12 °C), high volatility, and toxicity necessitate specialized designs and stringent operation, storage, and fire suppression management protocols. For instance, methanol fires are difficult to extinguish with water and can reignite even after appearing to be extinguished. Therefore, alcohol-compatible foam extinguishing agents must be used and continuously applied [45].
Furthermore, methanol is absorbed through the skin and is toxic to humans. Operators require professional training to prevent skin contact or vapor inhalation. Through MSC.1/Circ.1621, the IMO has established safety equipment and infrastructure requirements for ships using methanol fuel, including fixed fire extinguishing systems and ventilation monitoring. Moreover, given the low energy density of e-methanol (approximately 15.8 GJ per cubic meter, significantly lower than diesel’s 36.6 GJ), a greater fuel volume is required to achieve the same voyage range. This may reduce container loading capacity and increase refueling frequency, placing a greater burden on infrastructure [31]. In conclusion, while methanol can utilize existing storage and transportation infrastructure, modifications to the fuel system are still necessary, along with enhanced material corrosion resistance and adjustments to the main engine design to accommodate its combustion properties [30,31].
2.6. Test Ship Specifications
Container ships are typically operated on fixed schedules with high operational frequency. This makes them ideal candidates for evaluating the benefits and feasibility of dual-fuel systems. Compared to the other two major ship types (bulk carriers and tankers), container ships provide more stable data and performance indicators for analyzing fuel efficiency and emission reductions. Using them as a case study for dual-fuel ships can serve as a demonstration for the entire shipping industry. Successful cases can encourage more ships to consider switching to dual-fuel or other environmentally friendly options. Meanwhile, although only 20% of global ships are engaged in ocean shipping, they account for 80% of fuel demand [55].
Among the 335 container ships expected to be delivered in 2024, container ships with 3000~7999 TEU account for the largest proportion, about 36% [41]. Therefore, this study intends to take a 6600 TEU container ship (referred to as Ship M in this article), operated by one of the world’s top 10 container shipping companies and sailing on the transpacific route between the United States and the West, as the research object. The advantages and disadvantages, implementation difficulties, and challenges of the dual-fuel engine strategy will be comprehensively evaluated. Moreover, the cost-effectiveness values of various feasible strategies are calculated and compared to provide shipping companies with a basis for decision-making and adoption. The container ship sails on the US West Coast route. Each voyage is 42 days, and there are eight voyages a year. The main engine’s nominal power is 70,020 PS (51,485 kW) at 90.8 rpm. The detailed specifications of the ship are displayed in Table 6.
Table 6.
Particulars of container vessel M.
The US West Coast route of Vessel M in this study starts from Qingdao port in China, proceeds eastward through the ports of Ningbo and Shanghai, passes Busan in South Korea, continues to Prince Rupert port in Canada and Tacoma port in the USA, and then returns to Qingdao. The average voyage distance is approximately 11,504 nautical miles, as shown in Table 7.
Table 7.
Distances between calling ports of vessel M (NM).
3. Cost-Effectiveness Calculation Method
The voyage of ships on international routes can be divided into three parts: first, from the wharf of the starting port to the open sea; then, full-speed sailing in the open sea; and finally, from the open sea to the destination port. In the second stage, the full-speed sailing stage, the ship’s main engine usually runs at a fixed economic speed, and the speed is not adjusted unless there is an emergency. Therefore, the ship uses dual fuel at this stage.
As container ships mainly rely on regular shipping routes as their biggest advantage, using any alternative fuel should not reduce their output horsepower or affect their speed. Ocean-going container ships originally used high-sulfur fuel oil (HSFO). To comply with IMO policies to reduce ship pollutant emissions and use low-sulfur fuel, increasing the methanol content in diesel from 10% to 30% significantly reduces NO, CO, and HC emissions by 65%, 68%, and 56% [56,57]. Therefore, this study explored two feasible strategies: using 100% very low-sulfur fuel oil (VLSFO) and 30% E-methanol + 70% VLSFO blended fuel co-firing. As shown in Table 8.
Table 8.
Feasible strategies to be explored in this study.
However, since it is necessary to compare the cost-effectiveness of 100% VLSFO and 30% E-methanol + 70% VLSFO co-firing, the total amount of fuel replaced by alternative fuels with different heating values also differs. According to the 2022 Guidelines on the Method of Calculation of the Attained Energy Efficiency Design Index (EEDI) for New Ships [58], the heating values of commonly used marine fuels and conversion factors are presented in Table 9.
Table 9.
Heating value and conversion factor of common marine fuels.
As shown in Table 9, the carbon emission factor of methanol is only 43.6% of that of VLSFO, indicating the lowest carbon emission potential. However, its heating value is also the lowest, at only half that of VLSFO. Therefore, although methanol has a low carbon content—leading to its low heating value—more methanol needs to be consumed to obtain the same energy, which may result in no significant reduction in total carbon emissions while increasing the volume required for its fuel storage tanks.
3.1. Definition and Estimation of Total Incremental Cost Items
The definition of “cost” is “the economic value of resources consumed in the production and sale of a certain type and quantity of products, measured in monetary terms” [60]. Therefore, this study refers to the expenses required to implement a certain coping strategy. There are four commonly used cost calculation methods: (1) levelized cost of energy (LCOE), (2) total system costing, (3) activity-based costing (ABC), and (4) incremental costing.
In the last method, only the increased cost is calculated after the implementation of the pollution control strategy. It is mainly used to compare the cost differences between different pollution control strategies, allowing decision-makers to choose a more suitable control strategy under varying conditions.
The incremental cost calculation method is suitable for short-term decision-making. It can quickly assess the cost impact of new or changed plans, and the calculation is relatively simple and easy to understand. It mainly evaluates the cost differences between different pollution control measures. Therefore, this study adopted “incremental costing” [61] to estimate and compare the increased costs required for implementing different coping strategies. The calculation methods for total incremental cost, pollutant emission reduction, and cost-effectiveness ratio of annual sailing operations are explained in this section.
Factors influencing shipping companies’ choice of methanol as a marine fuel include equipment costs for retrofitting or newly building dual-fuel diesel engines, price differences between VLSFO, methanol, and HSFO, fuel or methanol consumption required for ship navigation, and cargo space loss caused by installing methanol fuel tanks. Fuel consumption depends on factors such as the performance of the ship’s main engine, ship size, main engine type, full-speed sailing time and distance, and climate. Because the cost items for implementing the two strategies differ slightly, they are divided into two major categories: CAPEX and OPEX. The total cost is obtained by adding CAPEX and OPEX. The CAPEX and OPEX cost items of Vessels A and B are listed in Table 10.
Table 10.
Cost items for implementing Vessel A and Vessel B.
3.1.1. Calculation Method of the Total Incremental Cost of Using a 100% VLSFO Strategy
The total incremental cost of the VLSFO strategy includes two major items, CAPEX and OPEX, as shown in Equation (1):
(Total incremental cost)VLSFO = CAPEXVLSFO + OPEXVLSFO
In this equation, the price per TEU required to build a new container ship decreases as the size of the container ship increases [63]. This study examined a 6600-TEU container ship; therefore, the cost per TEU is calculated at 13,912.16 USD [63]. The OPEXVLSFO calculation method is shown in Equation (2), which includes the cost difference between very low-sulfur fuel oil (VLSFO) and high-sulfur fuel oil (HSFO), fuel additive costs, and VLSFO surcharges. Since the VLSFO strategy involves replacing HSFO with VLSFO, the resulting fuel cost increase represents the incremental cost.
where d = Cost of very low-sulfur fuel oil (USD/year) − Cost of high-sulfur fuel oil (USD/year), e = Fuel additive cost, f = Very low-sulfur fuel oil surcharge revenue (USD/year).
OPEXVLSFO = d + e − f
In the above equation, the price of VLSFO fluctuates with international crude oil prices and marine fuel prices. Thus, shipping companies typically forecast future oil prices based on reliable maritime consulting information. Accordingly, this study adopted oil price forecasts provided by the International Monetary Fund and the US Energy Information Administration for evaluation [64]. Additionally, according to the Ship & Bunker website, the price of VLSFO is approximately 23% higher than that of crude oil per ton [65]; Based on this, the study estimated the VLSFO price from 2024 to 2028 using the annual prices of HSFO and VLSFO (USD/ton) over the five years following the implementation of the coping strategy, as shown in Table 11.
Table 11.
VLSFO, HFO, and Methanol Price Forecast 2024–2028 (Unit: USD/Ton).
In Equation (2), the yearly fuel cost (USD/year) of using VLSFO for a round-trip voyage on the North American route by Vessel A is calculated using Equation (3):
where g = Fuel consumption rate (g/kWh), h = Very low-sulfur fuel oil price (USD/ton), i = Full-speed sailing time (hour/year), j = Main engine output power (kW).
d = g × h × i × j × 10−6
In addition, the cost of item e in Equation (2), fuel additives, arises because VLSFO significantly reduces the sulfur content in the fuel to decrease SOx emissions in exhaust gases. However, sulfur also plays a lubricating role in the moving parts of engines. Therefore, the sulfur content of the fuel is reduced from 3.5 wt.% to 0.5 wt.%, it is necessary to address the problem of insufficient lubricity of VLSFO for the moving metal parts of the main engine, resulting in wear and tear of the cylinder liner and leakage loss. The use of lubricity additives is an effective way to mitigate this problem. For example, adding 3% biodiesel to fuel can improve the lubrication performance of metal parts compared to HSFO [66,67]. Therefore, this study used biodiesel as the cost of low-sulfur fuel oil additives. According to the April 2024 report by the Alternative Fuels Data Center (US Department of Energy), the price of biodiesel is 4.57 USD/gallon, which is approximately 1207.3 USD/ton [68]. However, with the gradual maturation and advancement of biodiesel production technology, its price is expected to decrease annually. This study assumed that the price of biodiesel will decrease by 5% annually.
In Equation (2), the low-sulfur fuel surcharge (LSS) refers to an additional charge on maritime transport costs. Because the use of VLSFO increases transportation costs, shipping companies charge shippers (or cargo owners) an additional fee in addition to the shipping fee. This fee varies from company to company and is calculated differently depending on the shipping route. Generally speaking, it varies according to the port of export and the size of the container, ranging from 13 to 42 USD/TEU. This study used the Shanghai Containerized Freight Index (SFCI) to calculate freight rates. The shipping quotations already include LSS, so no additional calculations were made.
3.1.2. Calculation Method of Total Incremental Cost Using the Strategy of 30% E-Methanol + 70% VLSFO
Vessel B adopted the methanol dual-fuel vessel strategy, and one of the important factors affecting the attractiveness of this strategy to shipping companies is the price difference between VLSFO and e-methanol. The calculation formula for the total incremental cost of this strategy is shown in Equation (4):
(Total incremental cost)DF = OPEXDF + CAPEXDF
In the above equation, the subscript DF represents the strategy of Vessel B using 30% e-methanol + 70% VLSFO as the dual fuel. According to a study conducted by the Maersk Mc-Kinney Møller Center for Zero Carbon Shipping in 2022, CAPEXDF indicates that building a new dual-fuel vessel will incur 11% more capital expenditure than a dedicated diesel vessel [62]. Therefore, multiplying the amount of CAPEXVLSFO in Equation (1) by 111% gives CAPEXDF.
According to Table 10, the OPEX of Strategy DF includes the fuel prices of VLSFO and e-methanol, the lost cabin space cost of arranging methanol fuel tank equipment, IGF crew training costs and crew salaries, the increased fuel price difference for methanol fuel consumption, and increased maintenance costs.
According to a 2023 report by the Methanol Institute, methanol production capacity is expected to increase fivefold to 500 million tons globally by 2050, of which 80% will be carbon-neutral e-methanol and biomethanol [54]. Therefore, this study focused on carbon-neutral e-methanol as the primary methanol fuel. The price of e-methanol was based on a 2024 report by Arthur D. Little, one of the world’s oldest and leading management consulting firms, which stated that the current price of e-methanol is approximately 1700 USD/ton and is expected to drop to 900~1200 USD/ton by 2027 [69]. This study employed interpolation to calculate the estimated price of e-methanol from 2024 to 2028. Due to the lower heating value of methanol, approximately 2.4 tons of methanol are required to produce the same heating value as 1 ton of VLSFO. Therefore, this study used the same power output as Vessel A as the baseline to avoid delays caused by reduced power and adjusted the required tonnage of methanol accordingly.
The calculation method of OPEXDF is shown in Equation (5):
OPEXDF = tt + uu + vv + ww + xx + yy
- tt = Fuel price of methanol dual-fuel vessel—Fuel price of high-sulfur fuel oil
- uu = DF equipment maintenance cost
- vv = Lost cabin space cost for additional methanol fuel tank equipment volume required,
- ww = Crew salary premium cost for operating dual-fuel equipment
- xx = Premium of about 2% higher operating cost of methanol fuel engine than conventional fuel due to the complexity of the dual-fuel system
- yy = Bunker adjustment factor
In the above equation, the fuel price difference required for Vessel B to use DF for round-trip voyages between Asia and America within one year is calculated using Equation (6):
r = Methanol fuel price (USD/ton).
tt = [(g × i × j × 10−6 × 0.3 × 2.4 × r) + (g × i × j × 10−6 × 0.7 × h)] − High-sulfur fuel costs (USD/year)
Additionally, the calculation methods for other operating costs in Equation (5) are explained as follows:
- DF equipment maintenance cost: Dual-fuel engines have more components than single-fuel engines, which may increase maintenance costs by up to 7% [54].
- Cargo space loss cost due to DF equipment installation: The volume of methanol fuel storage tanks is approximately 2.4 times that of fuel oil tanks [54]. As shown in Table 6, the fuel oil tank of Vessel M is 980.43 m3. Therefore, the cargo space loss of Vessel B equipped with the DF fuel tank is estimated to be approximately 18 TEU. According to the SFCI [70], the average container freight rates on the US West Coast route (Route of China-Europe Service Loop) from 2009 to 2023 are shown in Figure 2. The outbreak of COVID-19 in 2020, global port congestion in 2021, and the Russia–Ukraine war from early 2022 to the present have caused an abnormal rise in container freight rates. Therefore, in this study, after excluding the freight rates from 2020 to 2022, the average annual container freight rate on the US route in the most recent five years is used as the freight rate for Vessel B from the first to the fifth year after the dual-fuel engine is put into operation, to estimate the freight loss caused by the occupation of container berths by methanol storage tanks due to the adoption of DF fuel by Vessel B.
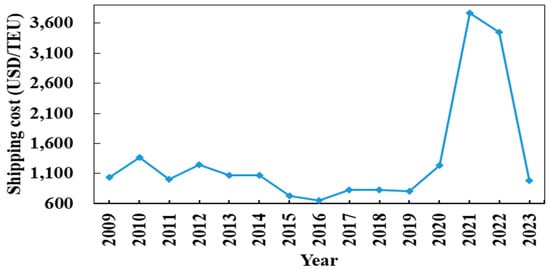 Figure 2. Twenty-foot container shipping price in 2009–2023 through the US West Coast route. Source: Compiled by the authors from [70].
As shown in Figure 2, the container freight rate is based on a single trip (Asia–US West Coast). Each voyage consists of two round trips. Therefore, the cargo hold loss cost must be multiplied by 2, as shown in Equation (7):
where vv = annual cargo hold cost loss after installing methanol storage tank equipment (USD/year). δ = unit container freight rate (USD/TEU), pp = number of voyages/years, multiplied by 0.3 in Equation (7), because Vessel B uses 30% green methanol.
vv = 18 × δ × pp × 2 × 0.3
- 3.
- Crew salary cost premium for operating DF engine equipment: Due to the relatively high safety requirements for the bunkering, storage, and use of green methanol fuel, in addition to the necessary and sufficient basic safety training, the crew of DF fuel-powered ships must also undergo IGF Code professional special training. This is to meet the new requirements introduced by technological changes and to reduce casualties and safety accidents caused by human factors. Therefore, the crew salary of DF-fueled ships is estimated to be 7% higher than that of ordinary merchant ships [54]. Based on the author’s years of service experience as a chief officer on large container vessels, crew salaries vary depending on factors such as rank, ship route, and seniority. The supply and demand in the crew labor market and the nationality of the crew members also influence salary levels. Therefore, this study adopted the International Seafarer Salary Table published by the Shanghai Shipping Exchange on 30 July 2024, as the basis for calculation [71]. A minimum configuration of 16 personnel for general merchant ships was assumed. The calculation of the crew salary cost premium is shown in Equation (8):Crew salary cost premium for operating DF equipment (USD/month) = (Captain and Chief Engineer total 2 persons × 10,000 USD/person-month + Chief Officer and Second Engineer total 2 persons × 6000 USD/person-month + Second Officer and Third Engineer total 4 persons × 5000 USD/month + Class C crew total 8 persons × 3000 USD/person-month) × Salary premium rate (7%) × 12 months
- 4.
- Premium cost of increased fuel consumption for methanol fuel: Vessel B used a 70% VLSFO + 30% green methanol dual-fuel engine. According to the test results of 19 dual-fuel methanol two-stroke engines with reliable operating hours exceeding 145,000 h, collected by Waterfront Shipping Canada, if methanol is used as one of the fuels in a dual-fuel engine, the operating cost of the methanol fuel engine is about 2% higher than that of traditional fuel due to the more complex dual-fuel system [54]. Therefore, this study used 2% as the fuel consumption premium for methanol dual-fuel ships.
- 5.
- Bunker adjustment factor: Since the DF ship used 30% e-methanol + 70% VLSFO as fuel, the bunker adjustment factor was estimated at 70% of the VLSFO usage.
3.2. Calculation Method of Pollutant Emission
This study investigated the emission reduction of various pollutants caused by two container ships, Vessel A and Vessel B, using two different fuels: neat VLSFO and methanol + VLSFO dual fuel, in response to the low-sulfur fuel oil regulation in IMO’s MARPOL Protocol. The greenhouse gas emissions regulated by the IMO mainly include the following gases: carbon dioxide (CO2), methane (CH4), nitrous oxide (N2O), and fluorinated gases (including HFCs, PFCs, and SF6). According to data from the International Energy Agency and IMO, CO2 is the primary greenhouse gas emitted by the global shipping industry, whereas fluorinated gases, despite having a very high global warming potential, have very low emissions.
Furthermore, CO2 is not the only greenhouse gas emitted during combustion. Depending on the raw materials and fuel use methods, methane (CH4) and nitrous oxide (N2O) may also be emitted. Therefore, considering the 100-year global warming potential (GWP100), the impact of different greenhouse gases is normalized and expressed in grams of carbon dioxide equivalent (CO2e) to enable a unified comparison of the relative global warming impact of different gases. According to previous studies, the global warming potentials of CO2, CH4, and N2O are 1:25:298 [72]. Therefore, this study utilized this ratio to convert the greenhouse gas pollutants emitted by Vessels A and B into CO2e to calculate the pollution abatement for cost-effectiveness analysis.
According to the data, the Well-To-Tank (WTT) carbon footprint of e-methanol primarily depends on the sources of renewable electricity and carbon used in the production of e-methanol [44,45]. When both renewable hydrogen and CO2 are produced from zero-carbon sources like wind power and DAC (Direct Air Capture), the WTT carbon emissions can be reduced to below 1.0–1.8 kg CO2e/kg methanol. This figure is significantly lower than that of conventional methanol produced from natural gas or coal (which can reach 2.6–3.2 kg CO2e/kg), demonstrating the substantial carbon reduction potential of electro-methanol across its entire lifecycle.
The annual emission of a certain pollutant from burning HSFO is estimated using Equation (9):
Annual emission of a certain pollutant (tons/year) = HSFO emission coefficient (g/kWh) × Ship main engine horsepower (kW) × Full-speed sailing time (hour/year) × 10−6
The emission coefficient in the above formula represents the emission amount (g) of different pollutants per unit horsepower (kW) and operating hours (hour) of the diesel main engine. The value varies with the use of different fuels, such as HSFO, VLSFO, and methanol. Table 12 shows the emission coefficients of different pollutants for HSFO, VLSFO, and methanol.
Table 12.
Comparison of emission coefficients (g/kWh) of different pollutants emitted from the combustion of HSFO, VLSFO, and e-methanol.
In Equation (9), the full-speed sailing time is 6500 h/year, and the ship’s main engine horsepower is 51,485 kW. Using Vessels A and B, the pollutant emissions of ships can be reduced, so the annual reduction (tons/year) of a certain pollutant emission can be calculated using Equation (10):
Pollutant emission reduction (tons/year) = Annual pollutant emission using HSFO fuel (tons/year) − [VLSFO emission coefficients (g/kWh) × Ship main engine horsepower (kW) × Full-speed sailing time (hour/year) × 10−6]
The above equation calculates the annual emission (tons/year) of a certain pollutant using HSFO fuel (Equation (9)). To calculate the pollutant emission reduction of Vessel B, the VLSFO emission factor (g/kWh) in Equation (10) is replaced with the emission coefficients (g/kWh) of 30% methanol + 70% VLSFO co-firing.
The total pollutant emission reduction and the total pollutant emission reduction rate over 5 years when switching to different fuels are expressed by Equations (11) and (12), respectively:
Total pollutant emission reduction in five years = Total pollutant emission in five years using HSFO − Total pollutant emission in five years after using a certain alternative fuel
Five-year total pollutant emission reduction rate (%) = Total pollutant emission reduction in five years after using a certain alternative fuel/Total pollutant emission in five years using HSFO × 100%
As engine operating hours increase, the emission coefficients of various pollutants will gradually increase. This is because the engine’s exhaust gas after-treatment system will gradually deteriorate with increasing operating hours, and the increasing wear and tear of the engine’s reciprocating components will also increase pollutant emission factors. The degradation rate of each pollutant differs. When predicting and estimating the pollutant emissions over the next 5 years, it is necessary to consider the situation in which the emission coefficient gradually increases as the exhaust gas after-treatment system deteriorates annually. This study used the California port ship emission deterioration factor [72] to correct the emission coefficients of various pollutants for Vessel A and Vessel B over the next five years, as shown in Table 13, and calculated the emission amount of each pollutant in the next five years, as shown in Equation (13).
Annual emission of a certain pollutant (tons/year) = [1 + (Engine deterioration factor) Serviceyears] × First-year emission coefficient (g/kWh) × Ship main engine horsepower (kW) × Full-speed sailing time (hour/year) × 10−6 tons/g
Table 13.
Deterioration factors of various emissions from marine engines. Unit: %/year.
3.3. Cost-Benefit Analysis (CBA) Method
CBA is a decision-making method that identifies multiple solutions to achieve a specific strategic goal, calculates the additional costs and potential benefits of each solution, and finally compares the cost-effectiveness ratios and other evaluation outcomes of these solutions. The goal is to find the best decision that maximizes the benefits at the lowest cost. This study used CBA to compare the cost-effectiveness values of Vessel A and Vessel B to determine which fuel is more operationally advantageous for Vessel A and Vessel B in container ship operations on the US West Coast route.
The benefit defined in this study is either the total emission reduction of greenhouse gas pollutants or CO2e tons/year after fuel replacement. The formula for calculating the Cost-Benefit Ratio (CBR) of implementing a certain strategy is as follows (Equation (14)):
CBR (Cost-Benefit Ratio) = Total emissions reduction of pollutants or CO2e (tons)/Total incremental cost required (kUSD)
This study evaluated and compared fuel strategies with competitive advantages based on emission reduction of total pollutants or CO2e (tons) and total incremental cost. A higher CBR indicates that the fuel used has higher cost-effectiveness, meaning that this type of fuel has a larger total pollutant emission reduction under the same total incremental cost expenditure, making it more suitable as a priority promotion strategy.
3.4. Sensitivity Analysis
A review of the literature on cost-benefit analysis reveals that a wide range of costs and benefits are included in the evaluation of different response strategies, and the estimation methods used for the same items may also vary. Since different strategies cover different areas, the availability of information is often limited by time, budget, and feasibility. In addition, due to the characteristics of the maritime industry, it is often more difficult to collect and obtain data than land and air transport, making these differences unavoidable. Therefore, the uncertainty of the cost-benefit analysis can only be reduced by identifying the objectives and contents of the strategy, incorporating the relevant costs and benefits as far as possible, and examining the impacts of the relevant parameters with sensitivity analyses. Therefore, in this case, assumptions were set for a number of parameters in the cost-benefit analysis. In this study, a two-factor sensitivity analysis was conducted for the key parameters: changes in international oil prices and pollutant emission reductions, to examine the impacts of changes in the context on the results of the analyses through changes in the values of the parameters. The results of the analyses are shown in Table 14.
Table 14.
Sensitivity analysis of average international crude oil prices and vessel A’s pollutant emission reduction.
The results of the sensitivity analysis are shown in Table 13, where the benefit-cost ratio of the Vessel A strategy with 100% VLSFO is higher when the average international crude oil price is lower or when the average pollutant emission reductions are higher. Vessel B shows the same trend, as it uses 70% VLSFO.
When analyzing the sensitivity of the new building cost and the price of methanol to the effect of pollutant emission reduction, the other OPEX variables were averaged to emphasize the sensitivity of this parameter to the effect of pollutant emission reduction. The results are shown in Table 15 and Table 16:
Table 15.
Sensitivity analysis of shipbuilding price to pollution emission reduction for vessel B.
Table 16.
Sensitivity analysis of e-methanol prices to pollution emission reductions from vessel B.
The results of the sensitivity analysis between the cost of ship construction and the reduction in pollution emissions are presented in Table 15. As the ship construction cost increases or the average pollutant emission reduction decreases, Vessel B may even have a CBR of less than 1 (gray area).
Table 16 shows that the CBR increases significantly as the methanol price (USD/ton) decreases. When the average price of methanol is higher or the average emission reduction is lower, Vessel B may even have a CBR of less than 1 (gray block).
4. Results and Discussion
4.1. Comparison of Total Incremental Costs for Different Strategies
The total incremental cost of Vessel A is calculated according to Equation (1). Additionally, since this study aims to explore the cost-effectiveness of different fuels over the next five years, the sum-of-the-years’-digits method [76] was used to amortize the CAPEX of Vessels A and B to calculate the annual CAPEX. The calculation results for the various incremental costs from year 1 to year 5 are presented in Table 17.
Table 17.
Incremental costs of vessel A.
As shown in Table 17, the total incremental cost of Vessel A over the five years is 73,658 kUSD. If the fuel is not replaced and HSFO continues to be used, the total fuel cost per year can be calculated using Equation (3), with the five-year total amounting to 82,612 kUSD. Additionally, if the old ship continues in operation, its construction cost amortization will be calculated based on the price of a newly built ship during the 6th to 10th years, resulting in a five-year total of 22,763 kUSD. Therefore, if no strategy is used, the total five-year cost will be 105,375 kUSD. A comparison of the two strategies shows that building Vessel A with a diesel engine and using 100% VLSFO as fuel in the next five years (2024–2028) would result in a 69.9% increase in total expenditures compared to building a new ship but continuing to use HSFO.
The total incremental cost of Vessel B is calculated according to Equation (4), with the cargo space loss cost determined using Equation (7). Vessel B occupies 18 TEU berths after the installation of the methanol storage tank. The average freight rate of each berth (USD/TEU) is based on the data in Figure 2. In addition, Vessel B completes one voyage for approximately 42 days, making 8 voyages per year, allowing for the deduction of the annual cargo space loss cost. Other OPEX components include fuel price difference between low-sulfur fuel oil and biomethanol compared to HSFO, lost cabin space cost for methanol fuel tank installation, IGF crew training and salary costs, a premium of approximately 2% higher operating cost for methanol fuel engines compared to conventional fuel, a 7% increase in maintenance costs for dual-fuel engine equipment due to its greater complexity [30], and bunker adjustment factors. After calculating each incremental cost, the total incremental cost of operating Vessel B for each year is summarized in Table 18.
Table 18.
Total incremental cost of vessel B. Unit: kUSD.
As shown in Table 18, the largest incremental costs for Vessel B are associated with the construction of methanol dual-fuel engine equipment, the premium for dual-fuel ships, and fuel premium costs. However, as the years of operation increase, the premium cost of new ship construction decreases annually, and the price of e-methanol is expected to decrease over time due to advancements in manufacturing technologies. Consequently, the price difference between HSFOs is projected to decrease. As a result, the total incremental cost of Vessel B exhibited a gradual downward trend starting from the first year. This trend is attributed to the progressive reduction in the total annual cost driven by the anticipated decline in e-methanol prices.
The estimated total incremental cost of adopting Vessel B over the next five years is 187,728 kUSD. Based on the comparison in Table 17 and Table 18, if Vessel B with a methanol dual-fuel engine is selected to replace the old ship, and 70% VLSFO + 30% e-methanol is used as ship fuel in the next 5 years (2024–2028), the total cost will increase by 178.15% compared to continuing with the conventional strategy.
The incremental cost of Vessel A over five years primarily results from the premium of VLSFO and HSFO, while Vessel B incurs additional costs for constructing dual-fuel ships and paying the premium cost for e-methanol. Therefore, the total incremental cost of Vessel B is substantially higher than that of Vessel A. Specifically, the total incremental cost of Vessel A increased by 69.9% over five years.
4.2. Comparison of Pollutant Emission Reduction for Different Strategies
Pollutant emission reduction associated with different strategies is a critical component of cost-benefit analysis. This section presents the results following the implementation of various strategies. The pollutant emission reduction for Vessel A using 100% VLSFO was calculated using Equation (10). Given that the main engine power of the ship under consideration is 51,485 kW and the full-speed sailing time is 6500 h/year, the results of the emission reduction for Vessel A in the first year are presented in Table 19.
Table 19.
Pollutant emission reduction of vessel A in the first year.
Table 19 shows that the first-year emission reductions of CO2, SOx, and NOX after switching from HSFO to VLSFO are 24,764 tons, 3273 tons, and 1124 tons, respectively, with emission reduction rates of 12.2%, 95.0%, and 19.9%, respectively. VLSFO significantly reduces SOx emissions compared to HSFO, making it a commonly used emission reduction strategy in current practice.
The pollutant emission reduction of Vessel B using 70% VLSFO + 30% e-methanol is calculated using Equation (10), and the results of Vessel B’s first-year emission reduction are shown in Table 20.
Table 20.
Pollutant emission reduction of vessel B in the first year.
From Table 20, Vessel B is effective in reducing the emissions of pollutants such as SOx, NOx, CO2, and CH4, lowering emissions by 3324 tons, 2207 tons, 49,835 tons, and 2 tons, respectively, with reduction rates of 96.51%, 39.02%, 24.53%, and 63.60%. The emission reductions for CO2 and NOx under the Vessel B strategy are 2 times and 1.8 times greater, respectively, compared to those emissions under Vessel A, which uses 100% VLSFO. The emission reduction effects result from functional degradation over time, leading to a yearly decrease in the emission reduction of these pollutants. The degradation rate of each pollutant varies slightly; therefore, when estimating pollutant emissions, it is necessary to first determine the annual pollutant emission coefficient after degradation. Thus, the emission reduction of each pollutant for Vessels A and B decreases each year, as shown in Table 21.
Table 21.
Total pollutant emission reduction of Vessel A and Vessel B in the next 5 years. Unit: tons.
Table 21 shows that the total pollutant emission reduction for Vessel B in the fifth year is 28,934 tons greater than that of Vessel A. Using the total pollutant emissions from operating with HSFO for five years as the baseline (i.e., a total of 1117,568 tons), the total pollutant emission reduction of DF ships using 30% green methanol over the 5-year implementation period is significantly higher than that of Vessel A using neat 100% VLSFO. The total pollutant emission reductions for Vessels B and A reached 26.21% and 13.88% of the baseline, respectively.
Currently, international carbon pricing methods are based on carbon dioxide equivalent CO2e [77]. Based on the operating characteristics of the shipping industry, the IMO currently includes only CO2, CH4, and N2O as the three greenhouse gases subject to regulation. In previous studies, the global warming potentials of CO2, CH4, and N2O are 1:25:298, respectively. Therefore, this study converted the pollutants from Vessels A and B into CO2e according to their warming potential ratio. The changes in total emissions, total pollutant emission reductions, and emission reduction ratios for the three pollutants regulated by IMO are presented in Table 22.
Table 22.
Total greenhouse gas emission reduction equivalent (CO2e) and total greenhouse gas emission reduction rate (%) of Vessel A and Vessel B in five years.
As shown in Table 22, Vessel B effectively reduced the total equivalent emissions of CO2, CH4, and N2O (i.e., CO2e by 24.72%) over five years, while Vessel A achieved a 12.18% reduction in CO2e. Therefore, to reduce greenhouse gas emissions, ships using 100% VLSFO can only achieve half of that of dual-fuel ships using 30% e-methanol. This demonstrates the potential of methanol as an alternative marine fuel for reducing air pollutants and greenhouse gas emissions, a result consistent with [34].
4.3. Comparison of CBR
CBR refers to the benefit of pollutant emission reduction relative to the incremental cost that shipping companies incur when adopting a specific mitigation strategy, as defined in Equation (14). A higher CBR represents a strategy that is more suitable for priority adoption.
In the first year of replacing old ships with newly built ships using different fuels, Vessel B’s CBR value is lower than that of Vessel A. However, the difference between the two CBR values gradually narrows. As the equipment cost for Vessel B’s newly built ship decreases year by year, Figure 3 shows that by the fifth year of using different fuels, Vessel B’s CBR value has approached that of Vessel A’s. This indicates that, in terms of total pollutant emission reduction, Vessel A’s CBR remains higher than that of Vessel B in the first five years of the strategy, although the gap decreases over time.
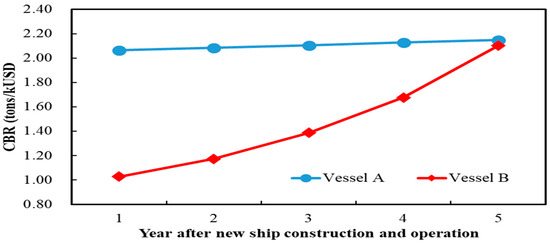
Figure 3.
Cost-benefit ratios (CBR) based on the benefit of total pollutant emission reduction for vessel A and vessel B.
To further understand the impact of international carbon emission regulations and carbon pricing standards on shipping companies’ strategic choices, the three greenhouse gases currently regulated by the IMO—CO2, CH4, and N2O—were converted into CO2e using a weighting of 1:25:298, and the CBR is shown in Figure 4. After 4.7 years of using different fuels, the trend reversed; that is, the CBR value of Vessel B became higher than that of Vessel A, and the gap in the CBR value widened each year. By the fifth year, the difference in the CBR values between the two strategies reached 0.08, as shown in Figure 4.
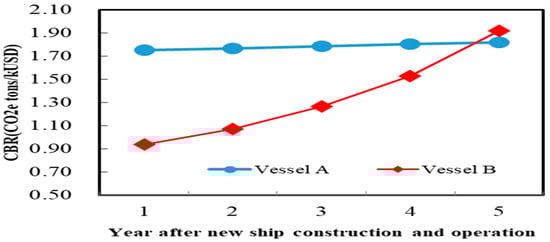
Figure 4.
Cost-benefit ratio (CBR) based on the benefit of CO2e emission reduction for vessel A and vessel B.
In terms of cost-effectiveness, if shipping companies choose to build new ships with dedicated diesel engines to replace existing old ships (Vessel A plan) and use VLSFO as an alternative fuel, the cost-effectiveness in the first 4.7 years is higher, which means that under the same total incremental cost, the benefit of pollutant emission reduction is greater. Thus, using VLSFO in the first 4.7 years has an advantage in implementation. However, the Vessel B plan, which builds methanol dual-fuel engines to replace existing old ships and uses 30% e-methanol co-firing, has a higher CBR than the former. It is speculated that this may be due to the decreasing price of e-methanol as its production matures, and at the same time, the initial investment in new shipbuilding-related expenses is amortized over time, resulting in a decline in its total incremental cost. In addition, methanol fuel significantly reduces ship pollutant emissions, resulting in a rapid increase in its cost-effectiveness value. This study presents a comparative analysis of Vessel A (using 100% VLSFO) and Vessel B (using 30% electro-methanol + 70% VLSFO). Despite Vessel B’s significantly higher total incremental costs in the first five years—primarily due to the higher price of electro-methanol, increased capital expenditure (CAPEX) for dual-fuel engine equipment, and cargo loss resulting from fuel tank space requirements—its carbon reduction performance is markedly superior to Vessel A. This aligns with the IMO’s policy objective of achieving net-zero emissions by 2050, suggesting that methanol is a viable option in long-term fleet fuel transition strategies.
From an economic standpoint, Vessel A exhibits a superior CBR initially, making it a more suitable option for shipping companies prioritizing short-term cost management. However, the analysis also reveals that the CBR crossover point occurs after 4.7 years, indicating that Vessel B achieves a lower cost per ton of carbon reduction thereafter, thus becoming more appealing to long-term operators. This aligns with the overall trend assessment regarding the long-term economic potential and emission-reduction capabilities of alternative fuels, including methanol.
Therefore, this study infers that methanol dual-fuel ships are more suitable for replacing HSFO as a marine alternative fuel and are suitable as a medium-to-long-term strategy to comply with the IMO’s VLSFO regulations while using VLSFO as fuel is more suitable as a short-term strategy.
Concurrently, this study incorporated sensitivity analysis to examine the influence of key parameter variations on the cost-benefit outcomes. The results indicate that ship construction costs and e-methanol prices are the most sensitive variables for the Vessel B strategy. When shipbuilding costs decrease or the e-methanol price falls from USD 4500/ton to USD 1700/ton, the CBR improves substantially, reaching a maximum of 1.91, which is demonstrably superior to the conventional VLSFO strategy. Regarding emission reduction, Vessel B can reduce CO2e emissions by up to 24.72% within five years, twice that of Vessel A, highlighting its superior long-term environmental benefits. Despite existing price and supply challenges, green methanol is increasingly being adopted and tested by major shipping companies such as Maersk and COSCO, indicating a concurrent increase in its technological maturity and industry acceptance.
Moreover, previous studies suggested that while LNG benefits from a mature market and higher energy density, its low-temperature storage requirements and methane slip issues lead to less consistent greenhouse gas emission control compared to methanol and also result in significant infrastructure retrofit costs. In comparison, methanol exhibits superior storage properties as a liquid at room temperature and poses lower operational risks, rendering it particularly suitable for retrofitting existing main engines and facilitating port fuel conversion, thus indicating higher technical and economic feasibility. Although ammonia presents potential as a zero-carbon fuel, previous assessments indicate that its toxicity and ignition control issues remain unresolved, hindering its commercialization. Conversely, methanol (particularly Green methanol and Biomethanol) has seen practical application in various container ship types and widespread adoption by shipping companies such as Maersk, CMA CGM, and COSCO, demonstrating its technical and operational feasibility and potential for broader implementation.
Regarding economic benefits, it is inferred that methanol offers advantages over emerging fuels like hydrogen and ammonia, with a shorter cost recovery period (approximately 3–6 years) and easier integration with existing infrastructure. Furthermore, methanol provides a more favorable balance between lifecycle carbon emissions and energy density compared to purely electric or hydrogen fuel systems, aiding in compliance with regulations such as EEXI and CII. This study also highlights the practical advantages of methanol over LNG and hydrogen fuel. For instance, methanol can be stored at ambient temperature and pressure, eliminating the need for cryogenic or high-pressure equipment. This simplifies bunkering operations and reduces port infrastructure modification costs, thereby enhancing its adoption potential.
However, the widespread adoption of methanol faces challenges, including an insufficient supply of green methanol, safety concerns related to its toxicity and flammability, and an underdeveloped global bunkering infrastructure. In the future, policy incentives, infrastructure investment, and international cooperation should be actively pursued to overcome these bottlenecks and promote methanol as a mainstream alternative fuel.
5. Conclusions
The IMO revised its strategy in 2023, aiming for international shipping to achieve net-zero greenhouse gas emissions by 2050 or sooner. To meet these targets, shipping companies must retrofit existing ships or invest in new builds, necessitating a thorough evaluation of alternative fuel technologies and development trends. Among the promising options, green methanol dual-fuel vessels have gained attention, with increasing orders reflecting their potential.
Given the long renewal cycles of shipping fleets, transitioning to alternative fuels has become a crucial strategy. Fuel selection depends on factors such as availability, cost, technological maturity, and compatibility with existing infrastructure. This study employed a Cost-Benefit Analysis (CBA) method in a case study of a 6600 TEU container ship to evaluate the CAPEX, OPEX, and total incremental costs associated with various strategies, highlighting their relative cost-effectiveness.
The findings indicate that while both VLSFO and e-methanol dual-fuel strategies face uncertainties related to fuel price fluctuations, e-methanol dual-fuel strategies require significantly higher initial investments. Over five years, the total incremental costs for VLSFO and e-methanol strategies increased by 69.9% and 178.15%, respectively, compared to the cumulative overall costs of a vessel using HSFO without any strategy. For companies operating older fleets or without plans for new builds, continuing with low-sulfur fuel oil is a more practical choice.
From an environmental perspective, methanol dual-fuel vessels demonstrate superior pollution abatement compared to VLSFO strategies. While SOx emission reductions are comparable, e-methanol dual-fuel vessels achieve significantly greater reductions in CO2 and NOX emissions—approximately two and 1.8 times higher, respectively. This underscores their effectiveness in mitigating pollutant emissions.
In terms of cost-effectiveness, the study identified a pivotal shift in favor of methanol dual-fuel strategies around the fifth year of operation, with CBR increasingly favoring this approach over time. When greenhouse gas emissions are converted to CO2-equivalents, the turning point advances to 4.7 years, further highlighting methanol’s advantages for sustainable development.
This study further explored the impact of key cost and benefit parameters–such as international crude oil prices, pollution emission reduction, shipbuilding costs, and e-methanol prices–on the CBR through bivariate sensitivity analysis. The results indicate that, for both conventional ships (Vessel A) and dual-fuel ships (Vessel B), the CBR increases significantly with greater pollution reduction or lower crude oil/methanol prices. Particularly in the Vessel B scenario, the CBR can exceed 1.7 when shipbuilding costs decrease to USD 10,000,000 or the e-methanol price falls to USD 1700/ton, indicating significant cost-effectiveness potential. Conversely, if fuel prices are high or pollution reduction is limited, the CBR may fall below 1, indicating financial infeasibility. This analysis demonstrates that the economic viability of Vessel B is highly dependent on policy incentives, technological advancements, and the extent of environmental benefits realized. It also highlights the need for cost-support mechanisms to accompany alternative fuel promotion policies to enhance investment incentives.
The analytical model developed in this study can be adapted to a wide range of fleet and route conditions, providing valuable guidance to maritime fleet managers and shipowners in optimizing sustainable investment decisions in the context of green shipping. This study used a 6600 TEU container ship operating on a fixed route as a case study. While possessing practical representativeness, the results may be limited in their applicability due to variations in ship type, route, or operational model. Secondly, several parameters (such as fuel prices, carbon prices, and shipbuilding costs) are estimated based on literature and industry forecasts. Actual market volatility may impact the accuracy of the cost-benefit analysis. Furthermore, greenhouse gas emission reduction data are primarily derived from theoretical coefficients and publicly available reports. The absence of empirical data from actual shipboard testing suggests potential for enhanced precision.
Future research should expand the analysis to include various ship types and routes, incorporating empirical data and policy scenario simulations to enhance the generalizability and practical relevance of the findings. Further investigation is warranted into the specific impact of methanol fuel application in ships on the performance metrics of various carbon reduction indicators (e.g., EEXI, EEDI, and CII) promoted by the IMO. Given methanol’s relatively low carbon content and efficient combustion, increasing its utilization rate could allow ships to achieve improved carbon intensity ratings, thereby mitigating operational risks and regulatory burdens. Furthermore, simulations can be extended to encompass various routes, ship types, and operational models to analyze the contribution of methanol fuel to energy-saving design and operational efficiency.
Concurrently, with the ongoing expansion of carbon taxes (such as the EU ETS) and carbon border adjustment mechanisms (CBAM) to include the maritime sector, future research should also examine the sensitivity of fuel selection to fluctuations in carbon prices. This includes evaluating the cost-effectiveness and payback period of methanol fuel under varying carbon tax scenarios, providing a practical basis for decision-making, and facilitating the development of a more comprehensive and adaptable ship fuel transition strategy.
Author Contributions
Conceptualization, C.-Y.L.; methodology, C.-Y.L.; formal analysis, P.-C.W.; investigation, P.-C.W.; data curation, P.-C.W.; writing—original draft preparation, C.-Y.L. and P.-C.W.; writing—review and editing, C.-Y.L.; supervision, C.-Y.L.; project administration, C.-Y.L. All authors have read and agreed to the published version of the manuscript.
Funding
This research was funded by the National Council of Science and Technology, Taiwan, under the contract number NCST 110-2221-E-055-MY2.
Data Availability Statement
The data presented in this study are contained within this article.
Acknowledgments
The authors would like to gratefully acknowledge the financial support from the National Council of Science and Technology, Taiwan.
Conflicts of Interest
The authors declare no conflicts of interest.
References
- Teter, J.; Tattini, J.; Petropoulos, A. Tracking Transport 2020—Analysis; IEA: Paris, France, 2020. [Google Scholar]
- Kass, M.D.; Abdullah, Z.; Biddy, M.J.; Drennan, C.; Haq, Z.; Hawkins, T.; Jones, S.; Holliday, J.; Longman, D.E.; Menter, S. Understanding the Opportunities of Biofuels for Marine Shipping; Oak Ridge National Lab. (ORNL): Oak Ridge, TN, USA, 2018. Available online: https://info.ornl.gov/sites/publications/Files/pub120597.pdf (accessed on 22 February 2025).
- Muhammad, S.; Long, X. China’s seaborne oil import and shipping emissions: The prospect of belt and road initiative. Mar. Pollut. Bull. 2020, 158, 111422. [Google Scholar] [CrossRef]
- UNCTAD. Review of Maritime Transport 2021; UNCTAD: Geneva, Switzerland, 2021; Available online: https://unctad.org/system/files/official-document/rmt2021_en_0.pdf (accessed on 19 February 2025).
- Faber, J.; Hanayama, S.; Zhang, S.; Pereda, P.; Comer, B.; Hauerhof, E.; van der Loeff, W.S.; Smith, T.; Zhang, Y.; Kosaka, H. Reduction of GHG emissions from ships—Fourth IMO GHG study 2020—Final report. IMO MEPC 2020, 75, 15. Available online: https://greenvoyage2050.imo.org/wp-content/uploads/2021/07/Fourth-IMO-GHG-Study-2020-Full-report-and-annexes_compressed.pdf (accessed on 1 February 2025).
- Halff, A.; Younes, L.; Boersma, T. The likely implications of the new IMO standards on the shipping industry. Energy Policy 2019, 126, 277–286. [Google Scholar] [CrossRef]
- Serra, P.; Fancello, G. Towards the IMO’s GHG goals: A critical overview of the perspectives and challenges of the main options for decarbonizing international shipping. Sustainability 2020, 12, 3220. [Google Scholar] [CrossRef]
- Badger, N.; Boylu, R.; Ilojianya, V.; Erguvan, M.; Amini, S. A cradle-to-gate life cycle assessment of green methanol production using direct air capture. Energy Adv. 2024, 3, 2311–2327. [Google Scholar] [CrossRef]
- Bauner, D. Lowering Hinders for Maritime Biofuels. 2025. Available online: https://www.ieabioenergy.com/wp-content/uploads/2025/04/IEA-Bioenergy-TCP-Task-39-T3-Maritime-Biofuel-Hinders-Report-revised.pdf (accessed on 19 March 2025).
- Patel, H.; Segovia, J.; Sofiadi, D.; Laursen, R.; Diacakis, M.; Hirdaris, S.; Dowling, M.; Alda, S.; Benedetti, L.; Carvalho, F. Potenial Use of Nuclear Power for Shipping. 2024. Available online: https://www.naucher.com/wp-content/uploads/2024/12/EMSA.pdf (accessed on 31 March 2025).
- Sriram, A. New Report Provides Update on Environmental Effects of Marine Renewable Energy. 2024. Available online: https://www.pnnl.gov/publications/new-report-provides-update-environmental-effects-marine-renewable-energy (accessed on 30 April 2025).
- Zito, T.; Park, C.; Jeong, B. Life cycle assessment and economic benefits of a solar assisted short route ferry operating in the Strait of Messina. J. Int. Marit. Saf. Environ. Aff. Shipp. 2022, 6, 24–38. [Google Scholar] [CrossRef]
- Petrychenko, O.; Levinskyi, M.; Goolak, S.; Lukoševičius, V. Prospects of Solar Energy in the Context of Greening Maritime Transport. Sustainability 2025, 17, 2141. [Google Scholar] [CrossRef]
- Richardson, M. Mid-Year Outlook 2021, London, United Kingdom. 2021. Available online: https://www.handybulk.com/simpson-spence-young-ssy/ (accessed on 1 April 2025).
- Sun, L.; Wang, X.; Lu, Y.; Hu, Z. Assessment of ship speed, operational carbon intensity indicator penalty and charterer profit of time charter ships. Heliyon 2023, 9, e20719. [Google Scholar] [CrossRef]
- Brynolf, S.; Magnusson, M.; Fridell, E.; Andersson, K. Compliance possibilities for the future ECA regulations through the use of abatement technologies or change of fuels. Transp. Res. Part D Transp. Environ. 2014, 28, 6–18. [Google Scholar] [CrossRef]
- IMO. Initial Imo Strategy on Reduction of GHG Emissions from Ships. 2018. Available online: https://wwwcdn.imo.org/localresources/en/OurWork/Environment/Documents/Resolution%20MEPC.304(72)_E.pdf (accessed on 16 October 2024).
- Santos, V.A.D.; da Silva, P.P.; Serrano, L.M.V. The maritime sector and its problematic decarbonization: A systematic review of the contribution of alternative fuels. Energies 2022, 15, 3571. [Google Scholar] [CrossRef]
- Wang, Y.; Wright, L.A. A comparative review of alternative fuels for the maritime sector: Economic, technology, and policy challenges for clean energy implementation. World 2021, 2, 456–481. [Google Scholar] [CrossRef]
- Al-Enazi, A.; Okonkwo, E.C.; Bicer, Y.; Al-Ansari, T. A review of cleaner alternative fuels for maritime transportation. Energy Rep. 2021, 7, 1962–1985. [Google Scholar] [CrossRef]
- Ampah, J.D.; Yusuf, A.A.; Afrane, S.; Jin, C.; Liu, H. Reviewing two decades of cleaner alternative marine fuels: Towards IMO’s decarbonization of the maritime transport sector. J. Clean. Prod. 2021, 320, 128871. [Google Scholar] [CrossRef]
- Kołakowski, P.; Gil, M.; Wróbel, K.; Ho, Y.-S. State of play in technology and legal framework of alternative marine fuels and renewable energy systems: A bibliometric analysis. Marit. Policy Manag. 2022, 49, 236–260. [Google Scholar] [CrossRef]
- Cheliotis, M.; Boulougouris, E.; Trivyza, N.L.; Theotokatos, G.; Livanos, G.; Mantalos, G.; Stubos, A.; Stamatakis, E.; Venetsanos, A. Review on the safe use of ammonia fuel cells in the maritime industry. Energies 2021, 14, 3023. [Google Scholar] [CrossRef]
- Mallouppas, G.; Yfantis, E.A. Decarbonization in shipping industry: A review of research, technology development, and innovation proposals. J. Mar. Sci. Eng. 2021, 9, 415. [Google Scholar] [CrossRef]
- Zhou, Y.; Pavlenko, N.; Rutherford, D.; Osipova, L.; Comer, B.; Bates, J.; Bleuanus, S.; Bradshaw, J.; Kaas, M.; Lauer, P. The potential of liquid biofuels in reducing ship emissions. Int. Counc. Clean Transp. 2020, 1, 31. [Google Scholar] [CrossRef][Green Version]
- Law, L.C.; Foscoli, B.; Mastorakos, E.; Evans, S. A comparison of alternative fuels for shipping in terms of lifecycle energy and cost. Energies 2021, 14, 8502. [Google Scholar] [CrossRef]
- Chiong, M.-C.; Kang, H.-S.; Shaharuddin, N.M.R.; Mat, S.; Quen, L.K.; Ten, K.-H.; Ong, M.C. Challenges and opportunities of marine propulsion with alternative fuels. Renew. Sustain. Energy Rev. 2021, 149, 111397. [Google Scholar] [CrossRef]
- Inal, O.B.; Dere, C.; Zincir, B.; Deniz, C. Hybrid propulsion and alternative fuels education in the course of decarbonised shipping. Aust. J. Marit. Ocean. Aff. 2022, 14, 97–113. [Google Scholar] [CrossRef]
- Parris, D.; Spinthiropoulos, K.; Ragazou, K.; Giovou, A.; Tsanaktsidis, C. Methanol, a Plugin Marine Fuel for Green House Gas Reduction—A Review. Energies 2024, 17, 605. [Google Scholar] [CrossRef]
- Petrychenko, O.; Levinskyi, M.; Prytula, D.; Vynohradova, A. Fuel options for the future: A comparative overview of properties and prospects. Transp. Syst. Technol. 2023, 41, 96–106. [Google Scholar] [CrossRef]
- Osman, A.I.; Nasr, M.; Lichtfouse, E.; Farghali, M.; Rooney, D.W. Hydrogen, ammonia and methanol for marine transportation. Environ. Chem. Lett. 2024, 22, 2151–2158. [Google Scholar] [CrossRef]
- Lee, H.; Lee, J.; Roh, G.; Lee, S.; Choung, C.; Kang, H. Comparative life cycle assessments and economic analyses of alternative marine fuels: Insights for practical strategies. Sustainability 2024, 16, 2114. [Google Scholar] [CrossRef]
- Methanol Institute. Methanol Technical Data Sheet; Methanol Institute: Singapore, 2016; Available online: https://www.methanol.org/wp-content/uploads/2016/06/Methanol-Technical-Data-Sheet.pdf (accessed on 3 April 2025).
- Wang, Y.; Xiao, X.; Ji, Y. A Review of LCA Studies on Marine Alternative Fuels: Fuels, Methodology, Case Studies, and Recommendations. J. Mar. Sci. Eng. 2025, 13, 196. [Google Scholar] [CrossRef]
- Fridell, E.; Salberg, H.; Salo, K. Measurements of emissions to air from a marine engine fueled by methanol. J. Mar. Sci. Appl. 2021, 20, 138–143. [Google Scholar] [CrossRef]
- Yin, X.; Li, W.; Duan, H.; Duan, Q.; Kou, H.; Wang, Y.; Yang, B.; Zeng, K. A comparative study on operating range and combustion characteristics of methanol/diesel dual direct injection engine with different methanol injection timings. Fuel 2023, 334, 126646. [Google Scholar] [CrossRef]
- M.S. Committee (Maritime Safety Committee). International Code of Safety for Ships Using Gases or Other Low-Flashpoint Fuels (IGF Code), International Maritime Organization (IMO). 2016. Available online: https://www.imo.org/en/OurWork/Safety/Pages/IGF-Code.aspx (accessed on 5 April 2025).
- Kang, S. Innovation Outlook: Renewable Methanol; International Renewable Energy Agency: Masdar City, Abu Dhabi, 2021; Available online: https://www.irena.org/Publications/2021/Jan/Innovation-Outlook-Renewable-Methanol (accessed on 1 April 2025).
- Gore, K.; Rigot-Müller, P.; Coughlan, J. Cost assessment of alternative fuels for maritime transportation in Ireland. Transp. Res. Part D: Transp. Environ. 2022, 110, 103416. [Google Scholar] [CrossRef]
- Priyanto, E.; Olcer, A.; Dalaklis, D.; Ballini, F. The potential of methanol as an alternative marine fuel for Indonesian domestic shipping. Int. J. Marit. Eng. 2020, 162. [Google Scholar] [CrossRef]
- Statista. Number of Container Ships on Order from H2 2022 to 2025, by Vessel Size and Year of Delivery. 2025. Available online: https://www.statista.com/statistics/1345327/number-of-container-ships-in-global-orderbook-by-size/ (accessed on 3 March 2025).
- Ellis, J.; Tanneberger, K. Study on the use of ethyl and methyl alcohol as alternative fuels in shipping. Eur. Marit. Saf. Agency 2015, 46, 1–38. Available online: https://www.maritimecyprus.com/wp-content/uploads/2016/06/emsa-study-alternative-fuels-in-shippings-1.pdf (accessed on 19 March 2025).
- International Energy Agency. The Role of E-Fuels in Decarbonising Transport; International Energy Agency: New York City, NY, USA, 2024; Available online: https://iea.blob.core.windows.net/assets/a24ed363-523f-421b-b34f-0df6a58b2e12/TheRoleofE-fuelsinDecarbonisingTransport.pdf (accessed on 11 March 2025).
- Alamia, A.; Partoon, B.; Rattigan, E.; Andresen, G.B. Optimizing hydrogen and e-methanol production through Power-to-X integration in biogas plants. Energy Convers. Manag. 2024, 322, 119175. [Google Scholar] [CrossRef]
- Hamelinck, C.; Bunse, M. Carbon Footprint of Methanol, Gear Up. 2022. Available online: https://www.methanol.org/wp-content/uploads/2022/01/Carbon-Footprint-of-Methanol-studio-Gear-Up-Full-Presentation.pdf (accessed on 20 March 2025).
- Zincir, B.; Deniz, C. Methanol as a Fuel for Marine Diesel Engines, Alcohol as an Alternative Fuel for Internal Combustion Engines; Springer: Berlin/Heidelberg, Germany, 2021; pp. 45–85. Available online: https://link.springer.com/book/10.1007/978-981-16-0931-2 (accessed on 14 March 2025).
- Chambers, S. Just 10 Sites Worldwide Have Methanol Bunkering Facilities. 2024. Available online: https://splash247.com/just-10-sites-worldwide-have-methanol-bunkering-facilities/ (accessed on 1 October 2024).
- Pekic, S. Gidara Energy Sets Up Advanced Methanol Rotterdam Facility. 2022. Available online: https://www.offshore-energy.biz/gidara-energy-sets-up-advanced-methanol-rotterdam-facility/ (accessed on 1 October 2024).
- Ellis, J.; Ólafsson, M.; Olsson, T.; Dolan, G.; Yalcin, A.; Jonkers, P.; Copin, M. Report on Methanol Supply, Bunkering Guidelines, and Infrastructure; European’s Horizon: Bremen, Germany, 2021; Available online: https://www.fastwater.eu/images/fastwater/news/FASTWATER_D71.pdf (accessed on 8 April 2025).
- Sun, L.; Wang, X.; Hu, Z.; Liu, W.; Ning, Z. Carbon reduction and cost control of container shipping in response to the European Union Emission Trading System. Environ. Sci. Pollut. Res. 2024, 31, 21172–21188. [Google Scholar] [CrossRef] [PubMed]
- Kristiansen, T.; Condrup, M.G. Former Maersk Exec Warned Strongly Against LNG Three Years Ago. 2024. Available online: https://shippingwatch.com/carriers/Container/article17347717.ece (accessed on 16 October 2024).
- COSCO SHIPPING Holdings Co. Ltd. 2023 ANNUAL REPORT, Shanghai P.R.C. 2023. Available online: https://www.hkexnews.hk/listedco/listconews/sehk/2024/0419/2024041900368.pdf (accessed on 2 April 2025).
- Roussanoglou, N. Methanol: A Strong Candidate for Green Marine Fuel of the Future? 2023. Available online: https://www.hellenicshippingnews.com/methanol-a-strong-candidate-for-green-marine-fuel-of-the-future/ (accessed on 6 October 2024).
- Gena. Renewable Methanol Update. 2024. Available online: https://www.genasolutions.com/analysis_and_insights/6 (accessed on 25 October 2024).
- Marquez, C.; Deign, J. Marine Methanol: Future-Proof Shipping Fuel; Methanol Institute: Alexandria, VA, USA, 2023; Available online: https://www.methanol.org/wp-content/uploads/2023/05/Marine_Methanol_Report_Methanol_Institute_May_2023.pdf (accessed on 3 April 2025).
- Soni, D.K.; Gupta, R. Numerical investigation of emission reduction techniques applied on methanol blended diesel engine. Alex. Eng. J. 2016, 55, 1867–1879. [Google Scholar] [CrossRef]
- Soni, D.K.; Gupta, R. Optimization of methanol powered diesel engine: A CFD approach. Appl. Therm. Eng. 2016, 106, 390–398. [Google Scholar] [CrossRef]
- MEPC. Guidelines on the Method of Calculation of the Attained Energy Efficiency Design Index (EEDI) for New Ships; Marine Environment Protection Committee: Brussels, Belgium, 2022; Available online: https://wwwcdn.imo.org/localresources/en/KnowledgeCentre/IndexofIMOResolutions/MEPCDocuments/MEPC.364%2879%29.pdf (accessed on 3 April 2025).
- ISO 8217:2024; Petroleum Products—Fuels (Class F)—Specifications of Marine Fuels. ISO: Geneva, Switzerland, 2024.
- Cooper, R.; Kaplan, R.S. How cost accounting distorts product costs. Strateg. Financ. 1988, 69, 20. Available online: https://coin.wne.uw.edu.pl/pmodzelewski/How%20cost%20accounting%20distorts%20product%20costs.pdf (accessed on 3 April 2025).
- Kodera, S.; Morita, H.; Kiyosue, A.; Ando, J.; Takura, T.; Komuro, I. Cost-effectiveness of PCSK9 inhibitor plus statin in patients with triple-vessel coronary artery disease in Japan. Circ. J. 2018, 82, 2602–2608. [Google Scholar] [CrossRef] [PubMed]
- Hansen, C.R. Preparing Container Vessels for Conversion to Green Fuels; Maersk Mc-Kinney Moller Center: Copenhagen Denmark, 2022; Available online: https://cms.zerocarbonshipping.com/media/uploads/publications/Preparing-Container-Vessels-for-Conversion-to-Green-Fuels.pdf (accessed on 11 April 2025).
- Murray, W. Economies of scale in container ship costs. In North America’s Premier International Shipping Conference; CMA Shipping: Marseille, France, 2016. [Google Scholar]
- KNOEMA, Crude Oil Price Forecast: 2021, 2022 and Long Term to 2050. 2024. Available online: https://opendataforafrica.org/yxptpab/crude-oil-price-forecast-2018-2019-and-long-term-to-2030 (accessed on 19 August 2024).
- Bunker, S. World Bunker Prices. 2024. Available online: https://shipandbunker.com/prices (accessed on 30 July 2024).
- Kalam, M.; Masjuki, H.; Cho, H.M.; Mosarof, M.; Mahmud, M.I.; Chowdhury, M.A.; Zulkifli, N. Influences of thermal stability, and lubrication performance of biodegradable oil as an engine oil for improving the efficiency of heavy duty diesel engine. Fuel 2017, 196, 36–46. [Google Scholar] [CrossRef]
- Muñoz, M.; Moreno, F.; Monné, C.; Morea, J.; Terradillos, J. Biodiesel improves lubricity of new low sulphur diesel fuels. Renew. Energy 2011, 36, 2918–2924. [Google Scholar] [CrossRef]
- Bourbon, E. Clean Cities and Communities Alternative Fuel Price Report; U.S. Department of Energy: Washington, DC, USA, 2024. Available online: https://afdc.energy.gov/files/u/publication/alternative_fuel_price_report_april_2024.pdf?2d6513fb43 (accessed on 12 March 2025).
- Ito, Y.; Chow, D.; Uchiyama, T.; Cheng, W.; Carlomagno, P.; Milanese, S.; Decadri, S. Cleaner Seas: Mitigating Maritime Emissions; Arthut Little: Boston, MA, USA, 2024; Available online: https://www.adlittle.com/sites/default/files/viewpoints/ADL_Cleaner_seas_2024.pdf (accessed on 22 March 2025).
- Shanghai Shipping Exchange. Shanghai Containerized Freight Index. 2024. Available online: https://www.macromicro.me/charts/26692/zhong-guo-yun-jia-zhi-shu (accessed on 22 August 2024).
- Shanghai Shipping Exchange. China Crew’s Remuneration Index. 2024. Available online: https://www.sse.net.cn/index/singleIndex?indexType=ccri (accessed on 22 August 2024).
- Maloberti, L.; Adami, G.; Figari, M.; Zaccone, R. Evaluating alternative fuels and power systems for marine hybrid propulsion. Adv. Marit. Technol. Eng. 2024, 2, 45. [Google Scholar] [CrossRef]
- Ji, C.; El-Halwagi, M.M. A data-driven study of IMO compliant fuel emissions with consideration of black carbon aerosols. Ocean. Eng. 2020, 218, 108241. [Google Scholar] [CrossRef]
- Nasser, M.A.; Elgohary, M.M.; Abdelnaby, M.; Shouman, M.R. Environmental and Economic Performance Investigation of Natural Gas and Methanol as a Marine Alternative Fuel. 2022. Available online: https://assets-eu.researchsquare.com/files/rs-1947354/v1/70a1fc89-31fd-463b-b944-c8764d8d1508.pdf?c=1669652396 (accessed on 1 March 2025).
- California Climate Investments. Emissions Estimation Methodology for Commercial Harbor Craft Operating in California. 2012. Available online: https://ww2.arb.ca.gov/sites/default/files/barcu/regact/2007/chc07/appb.pdf (accessed on 21 March 2025).
- Moldanová, J.; Fridell, E.; Popovicheva, O.; Demirdjian, B.; Tishkova, V.; Faccinetto, A.; Focsa, C. Characterisation of particulate matter and gaseous emissions from a large ship diesel engine. Atmos. Environ. 2009, 43, 2632–2641. [Google Scholar] [CrossRef]
- Agnolucci, P.; Fischer, C.; Heine, D.; de Oca Leon, M.M.; Pryor, J.; Patroni, K.; Hallegatte, S. Measuring Total Carbon Pricing. World Bank Res. Obs. 2024, 39, 227–258. [Google Scholar] [CrossRef]


Disclaimer/Publisher’s Note: The statements, opinions and data contained in all publications are solely those of the individual author(s) and contributor(s) and not of MDPI and/or the editor(s). MDPI and/or the editor(s) disclaim responsibility for any injury to people or property resulting from any ideas, methods, instructions or products referred to in the content. |
© 2025 by the authors. Licensee MDPI, Basel, Switzerland. This article is an open access article distributed under the terms and conditions of the Creative Commons Attribution (CC BY) license (https://creativecommons.org/licenses/by/4.0/).