Article

Study on the Suppression of Tip Leakage Vortex in Axial Flow Pumps Based on Circumferential Grooving in the Rotor Chamber

Research Center of Fluid Machinery Engineering and Technology, Jiangsu University, Zhenjiang 212013, China
*
Author to whom correspondence should be addressed.
J. Mar. Sci. Eng. 2025, 13(5), 972; https://doi.org/10.3390/jmse13050972 (registering DOI)
Submission received: 17 April 2025 / Revised: 14 May 2025 / Accepted: 16 May 2025 / Published: 17 May 2025
(This article belongs to the Section Ocean Engineering)

Abstract

:
The stability of axial flow pumps is significantly affected by the tip leakage vortex (TLV), which is generated through the entrainment of the main flow. This study explores the effects of circumferential grooving in the rotor chamber on the tip leakage vortex of an axial flow pump by using the SST k-ω turbulence model. Numerical results were validated with prototype pump experiments. At the design condition, circumferential grooves positioned near the blade leading edge enhance both the pump’s efficiency and head. Grooves implemented at the mid-chord to trailing-edge regions are relatively close to those of the prototype pump. The implementation of grooves at both leading and trailing regions resulted in significantly degraded performance compared to the other two cases. However, at reduced flow rates, grooving in the rotor chamber leads to a decline in performance. Grooves positioned near the blade’s leading edge interfere with the ingress of the TLV into the suction side, suppressing vortex formation. Vortex structures and low-pressure regions are closer to the blade, reducing flow instability. In contrast, grooving in the middle and rear rotor chamber induces instability in the tip region. These findings offer theoretical guidance for suppressing the TLV and enhancing the stability of axial flow pumps.

1. Introduction

Axial flow pumps, characterized by high flow rates, low head, and high efficiency, are widely used in large and medium-sized water diversion projects, marine propulsion systems, and deep-sea energy utilization [1]. Owing to the unavoidable clearance between the impeller and the rotor chamber, when the blades work on the fluid medium, the pressure difference existing between the blade’s working side and the non-working side causes the formation of the TLV. This tip leakage flow forms a tip leakage vortex on the suction side through entrainment with the main flow, blocking the flow passage and causing hydraulic losses. In severe cases, the TLV can provoke vortex cavitation, which subsequently results in atypical vibrations and noise in the axial flow pump [2,3].
Tip leakage flow disrupts the flow field structure, leading to significant energy losses in hydraulic machinery and reducing the stable operating range. Drawing from a comprehensive understanding of the mechanisms governing tip leakage flow and the development of the TLV [4,5,6], researchers have suggested various approaches to enhance the leakage flow conditions in the tip region by addressing the blade tip and the end wall of the rotor chamber. These techniques can alleviate the negative impacts associated with blockage caused by the TLV, thereby enhancing the operational stability of axial pumps. In terms of blade tip treatment, complex structures can be arranged in the plane of the blade tip to manage or interrupt the tip leakage flow, aiming to suppress its generation and development. Choi et al. [7] demonstrated that the grooves located on the internal surface of the casing can significantly suppress the tip clearance flow. Huang et al. [8] arranged spherical dimple configurations on the surface of the blade tip. The vortex structures inside the spherical dimples can reduce the velocity gradient and hinder the turbulent burst process within the boundary layer. They can also reduce burst intensity and increase frictional resistance. Consequently, the TLV is significantly weakened in terms of intensity and scale. Wang et al. [9] explored how a wavy blade tip design influences the lowering of the TLV. This configuration enhances the resistance faced by the tip leakage flow as it traverses the tip clearance by augmenting the vertical wall shear stress at the blade tip. As a result, the large-scale TLV is fragmented into smaller-scale vortices, which gradually dissipate. Huang et al. [10] created curved converging holes in proximity to the blade tip, where a portion of the fluid driven by differential pressure formed localized jets through the curved holes. These jets interact with the vortex formations on the blade’s non-working side, inhibiting the growth of the vortex and the occurrence of cavitation.
The research on the mitigation of the TLV based on the treatment of the rotor chamber end wall was first proposed and effectively applied in compressors. Depending on their suppression mechanisms, these methods primarily encompass two directions: active suppression and passive suppression. In terms of active suppression, Wang et al. [11] utilized jet actuation at the end wall of the rotor chamber to improve the aerodynamic efficiency of axial-flow compressors. Taghavi Zenouz et al. [12] and Geng et al. [13] mitigated the excess leakage flow at the blade’s leading edge through air injection at the blade tip. Wilke et al. [14] initiated their investigation from passive suppression techniques, examining the inhibition of TLV formation and evolution in compressors through circumferential grooving of the runner chamber. Khaleghi H et al. [15] improved the compressor’s stable operating margin by adopting a recirculating end wall structure, which can redirect TLVs and recirculating flows from the downstream channel into a recirculation channel and eject them upstream, thereby suppressing TLV development and improving the flow configuration within the tip area. Hwang et al. [16] mitigated unstable gap flow by using axial grooves, which function by drawing in leakage flow and reverse flow. However, this also led to a reduction in compressor efficiency. Research on improving the operational stability of hydraulic machinery through rotor chamber wall treatment methods is relatively recent, and current studies mainly focus on passive control. Kurokawa et al. [17] implemented a spoke (J-groove) control strategy, circumferentially positioning shallow grooves on the rotor chamber wall to manipulate mainstream angular momentum and suppress unstable flows. Goltz I et al. [18,19] mitigated the circumferential flow and decreased the angle of attack at the impeller inlet during low flow scenarios by incorporating slots into the inlet pipe, thus enhancing the performance curve of the axial flow pump by alleviating the “hump” phenomenon. Zhou X et al. [20] explored the application of axial grooves in mitigating TLV in axial flow pumps. Their findings demonstrated that the suction and jetting effects within these grooves effectively weakened the interference between the tip leakage flow and the main stream. Additionally, they mitigated the pressure fluctuations generated by vortices in the vicinity of the blade tip. Taghavi et al. [21] examined the suppression effect of circumferential grooves on a solid casing in axial compressors, analyzing how the position of these grooves influences the compressor’s stability margin. However, methods that control the stability of hydraulic machinery may also lead to a decrease in operational efficiency. In the context of the requirement for “high efficiency, high speed, and stability” in axial flow pumps, the challenges posed by the TLV and the cavitation of leakage vortices are becoming increasingly significant. Also, the successful application of the aforementioned techniques still requires further exploration.
The control of tip flow in blade-type fluid machinery represents a current challenge and research hotspot. The majority of related studies focused on turbine machinery, such as compressors, while relatively few investigations have been conducted on hydraulic machinery using liquid as the medium, particularly axial-flow pumps. Under conditions of low flow rate and small cavitation number, the tip leakage vortex (TLV) may induce cavitation. This study focuses specifically on the effects of TLV on performance and internal flow characteristics; therefore, cavitation phenomena are not addressed here. This paper investigates a scaled version of the TJ04-ZL-02 axial flow pump utilized in the South-to-North Water Diversion Project, in which the diameter of the impeller is 200 mm. This study employs a numerical analysis with the SST k-ω turbulence model, delving into how different placements and alignments of circumferential grooves impact the TLV in an axial flow pump. The aim is to dissect the effect of groove positioning and their count on the pump’s tip leakage vortex, shedding light on the intricacies that lead to changes in tip leakage flow and the resultant intricate vortex formations. This research establishes a theoretical basis for mitigating the TLV and achieving stable operation in axial flow pumps.

2. Materials and Methods

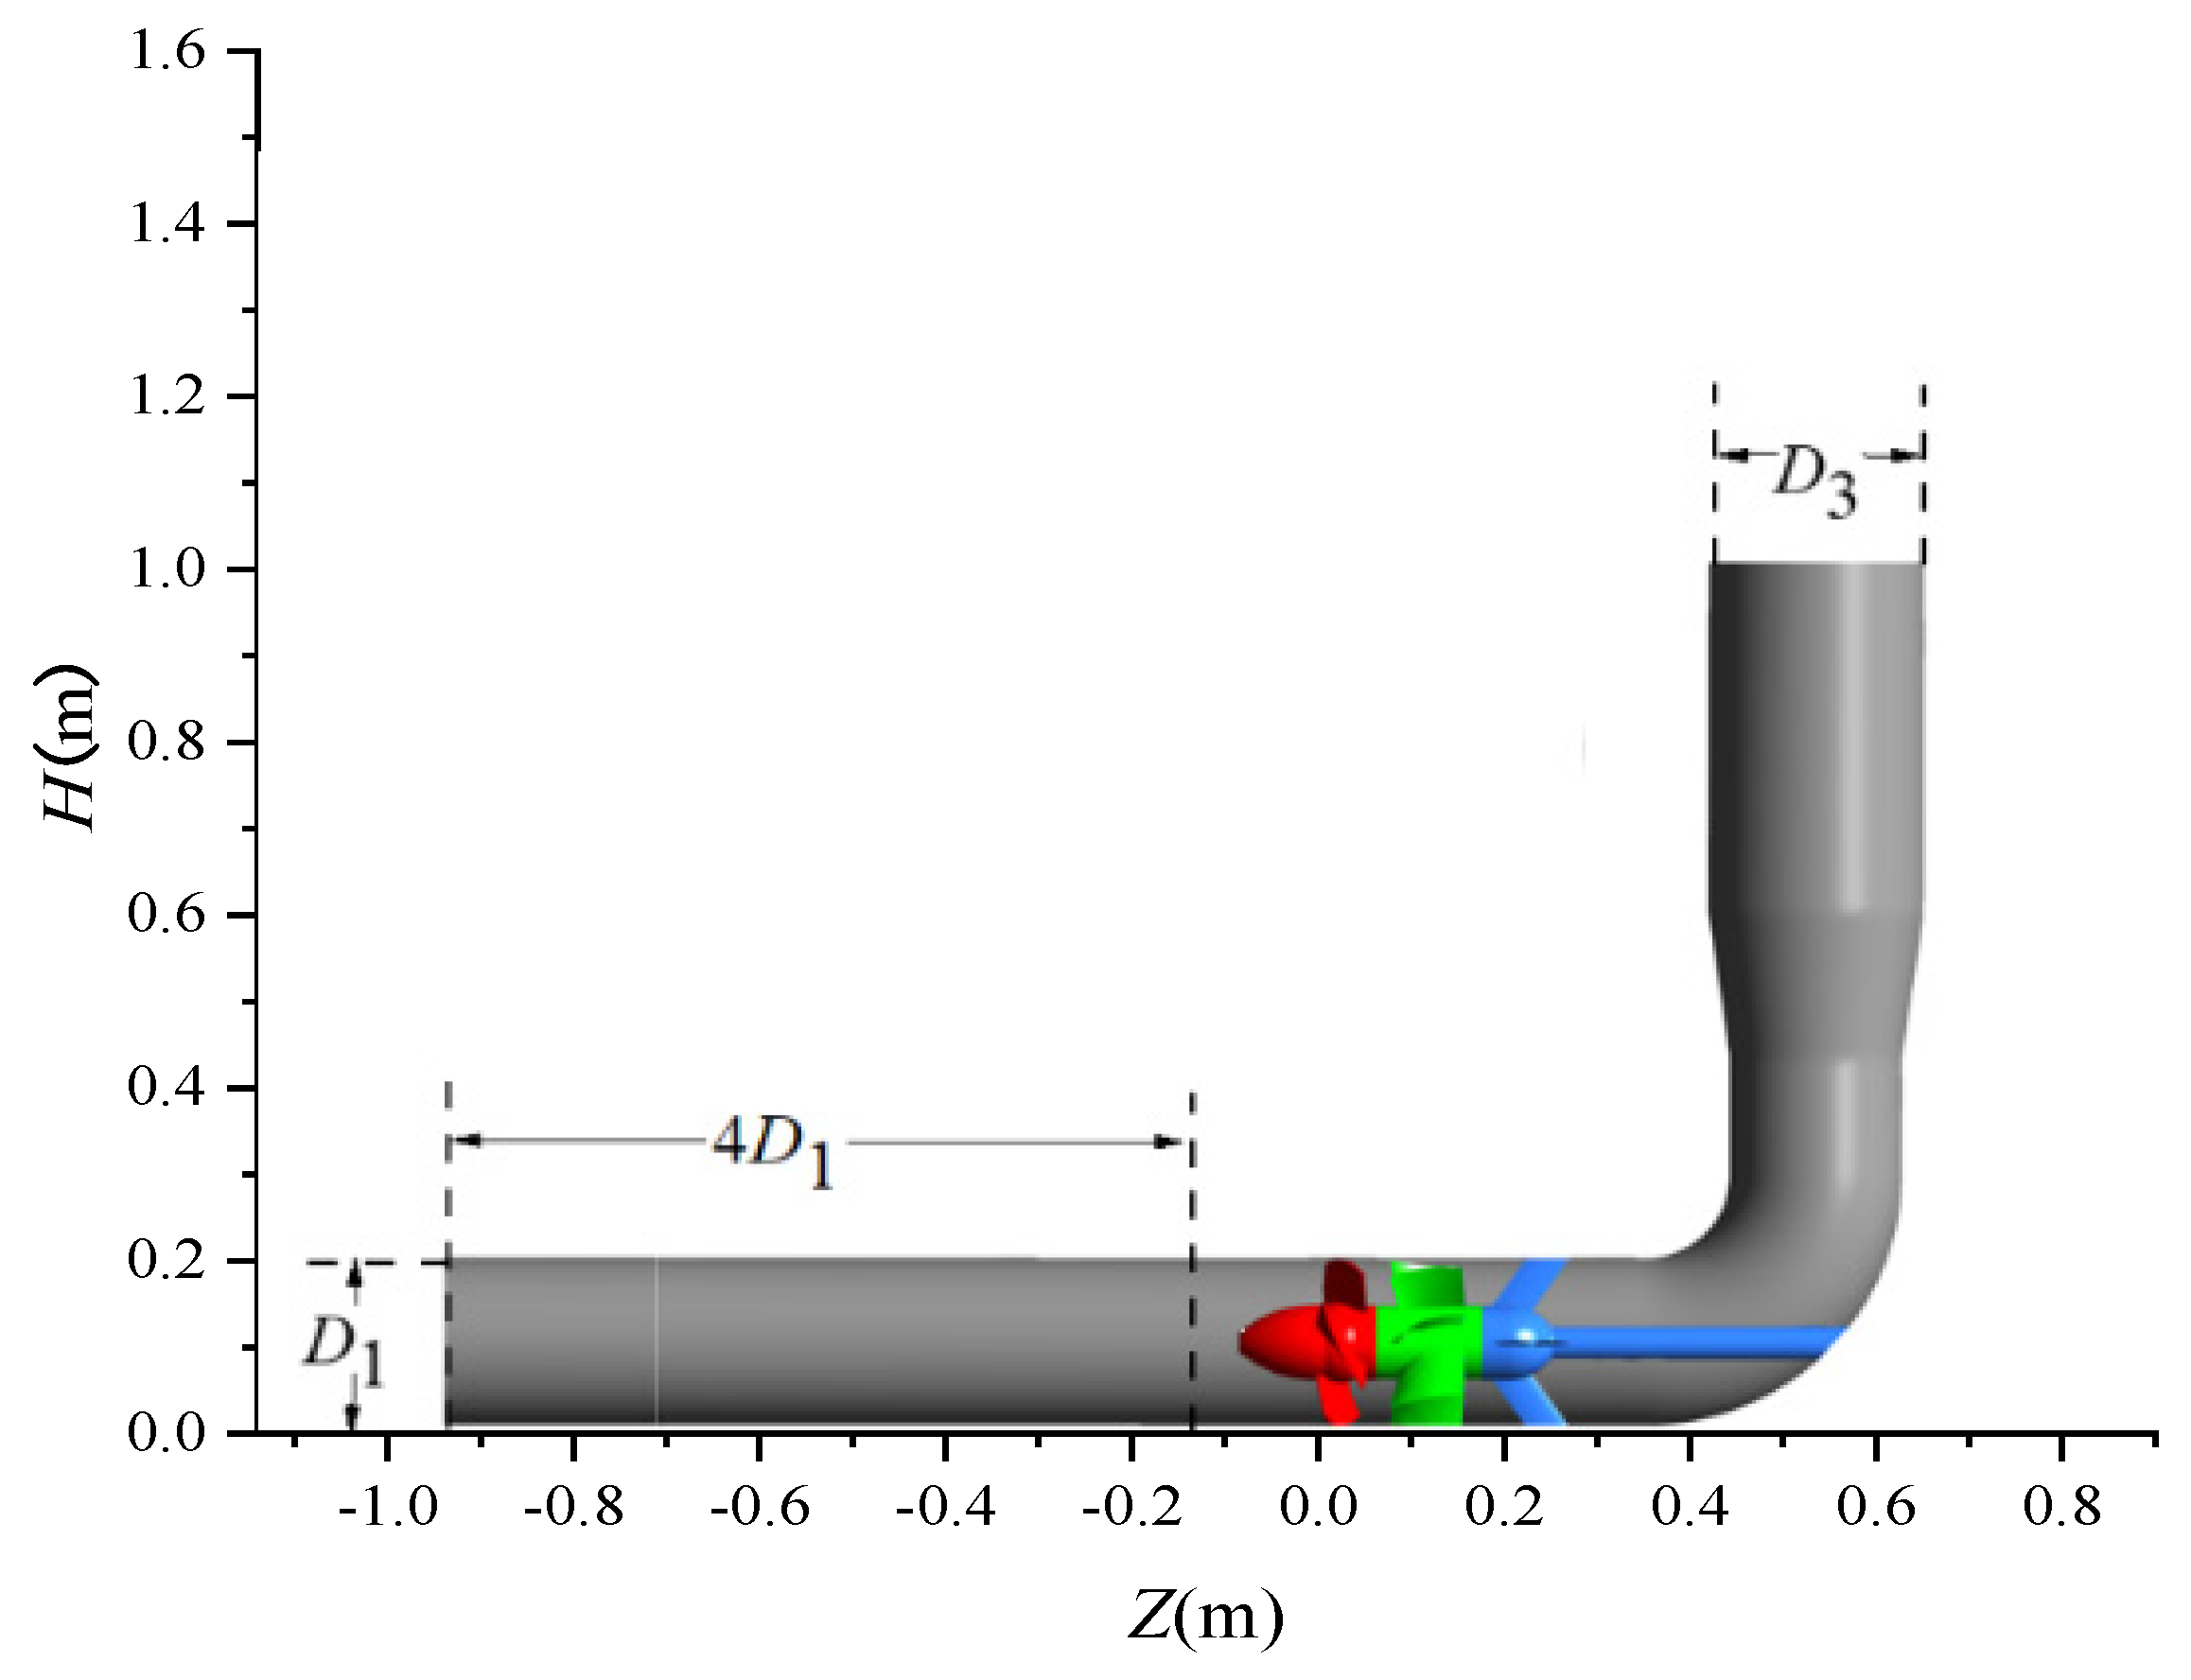
2.1. Geometric Model

The research centers on a scaled version of the TJ04-ZL-02 axial flow pump utilized in the South-to-North Water Diversion Project. Based on the blade parameters of the model pump and the geometric parameters of the entire flow passage, three-dimensional models of the impeller blades and diffusers were established. A comprehensive flow field calculation model was also developed. Figure 1 illustrates the main computational area for the axial flow pump model, including the inlet section, impeller, diffuser, ribs, elbow, and outlet section. Table 1 provides an overview of the primary parameters associated with the model pump.

2.2. Turbulence Model

This analysis employs the SST k-ω turbulence model, as presented by Menter [22]. To get a handle on how turbulent shear stress moves around, this approach blends the Standard k-ω and Standard k-ε models. Near the wall, it leans on the Standard k-ε model, but switches to the Standard k-ω model further out. The SST k-ω model is quite sharp at capturing the swirling action of turbulence and how flow separates. It has been successfully utilized in the internal fluid dynamics of pumps and pump stations [23]. The SST k-ω turbulence model consists of two transport equations: one addressing turbulent kinetic energy (k) and another for the specific dissipation rate (ω).
Turbulent kinetic energy k equation:
ρ k t + ρ U j k x j = ρ τ i j U i x j β ρ k ω + x j μ + σ k μ t k x j
Turbulent frequency ω equation:
ρ ω t + ρ U j ω x j = ρ τ i j U i x j ρ α μ t β ρ ω 2 + 2 1 F 1 ρ σ ω 2 ω k x i ω x i + x j μ + σ ω 1 μ t ω x j
Turbulent viscosity νt equation:
ν t = a 1 k max a 1 ω , S F 2 = μ t ρ
Blending function F1:
F 1 = tanh min max k β ω y , 500 μ y 2 ω ρ , 4 ρ σ ω 2 k C D k ω y 2 4
Blending function F2:
F 2 = tanh max 2 k β ω y , 500 μ ρ y 2 ω 2
In these equations, S is a constant value representing the strain rate.
C D k ω = max 2 ρ σ ω 2 1 ω k x i ω x i , 10 10
α = α 1 F 1 + α 2 1 F 1
In these equations, the primary parameter values are presented in Table 2.

2.3. Grid Generation and Numerical Settings

This study employs ANSYS-ICEM 2023R1 for the generation of structured hexahedral grids. The impeller fluid domain utilizes a J/O-type topological structure. A total of 30 grid nodes are arranged within the 0.5 mm clearance at the blade tip. To enhance the numerical simulation accuracy in the tip region, the grid near the impeller rim is refined proportionally. An O-type topological structure surrounds the boundary layer near the wall, with further refinement aimed at enhancing the grid quality near the blade surface. Figure 2 illustrates the computational mesh for the flow field’s domain, showcasing the locally refined grids within the impeller’s boundary layer and the tip clearance region.
To meet the accuracy requirements of the calculations, this study conducts a grid independence analysis for the computational model of the pump device. Six distinct grid setups (A–F), featuring variable grid counts, are utilized to computationally determine the H and η of the model pump under the designed flow rate conditions. Figure 3 illustrates the computational outcomes, revealing that both the H and η of grid configurations A–C rise in tandem with the grid count. When the mesh number increases to Case C, the computed performance of the model pump stabilizes. Therefore, considering both computational accuracy and resource efficiency, Case C, with approximately 10.67 million mesh elements, was selected for numerical calculations. Figure 4 illustrates the y+ distribution across both the blade surface and the walls of the runner chamber. This configuration ticks all the boxes in terms of grid calculation requirements for the SST k-ω turbulence model in the vicinity of the wall.
In ANSYS CFX CFD 2023R1 software, a complete implicit coupling technique is applied for simulating the flow dynamics within the axial flow pump. The finite volume method with pressure and velocity based on co-located grids is used for solving the equations. The convection components are discretized with a high-resolution scheme, whereas the diffusion components are discretized using a central difference approach. The physical conditions are as follows: the temperature, T, is set at 300 K; the density of the medium, ρ, is 1000 kg/m3; the entrance boundary is set up to simulate a total pressure environment, with a turbulence level of 5%; the boundary condition for the flow rate is set at the exit, with its value corresponding to the target flow rate Q; the impeller region is positioned within a coordinate system that undergoes rotation, characterized by a rotational velocity of 1450 (r/min); the rim wall is designated as a stationary boundary, possessing an opposing rotational velocity relative to the impeller; the interfaces of the hydraulic components are configured with a GGI connection mode; the boundary separating the rotating and stationary sections within the impeller zone is configured as a Frozen Rotor interface; boundary conditions to prevent slippage are utilized to simulate the remaining solid walls; and the criterion for determining the convergence of the calculations is established as RMS = 1 × 10⁻⁶.

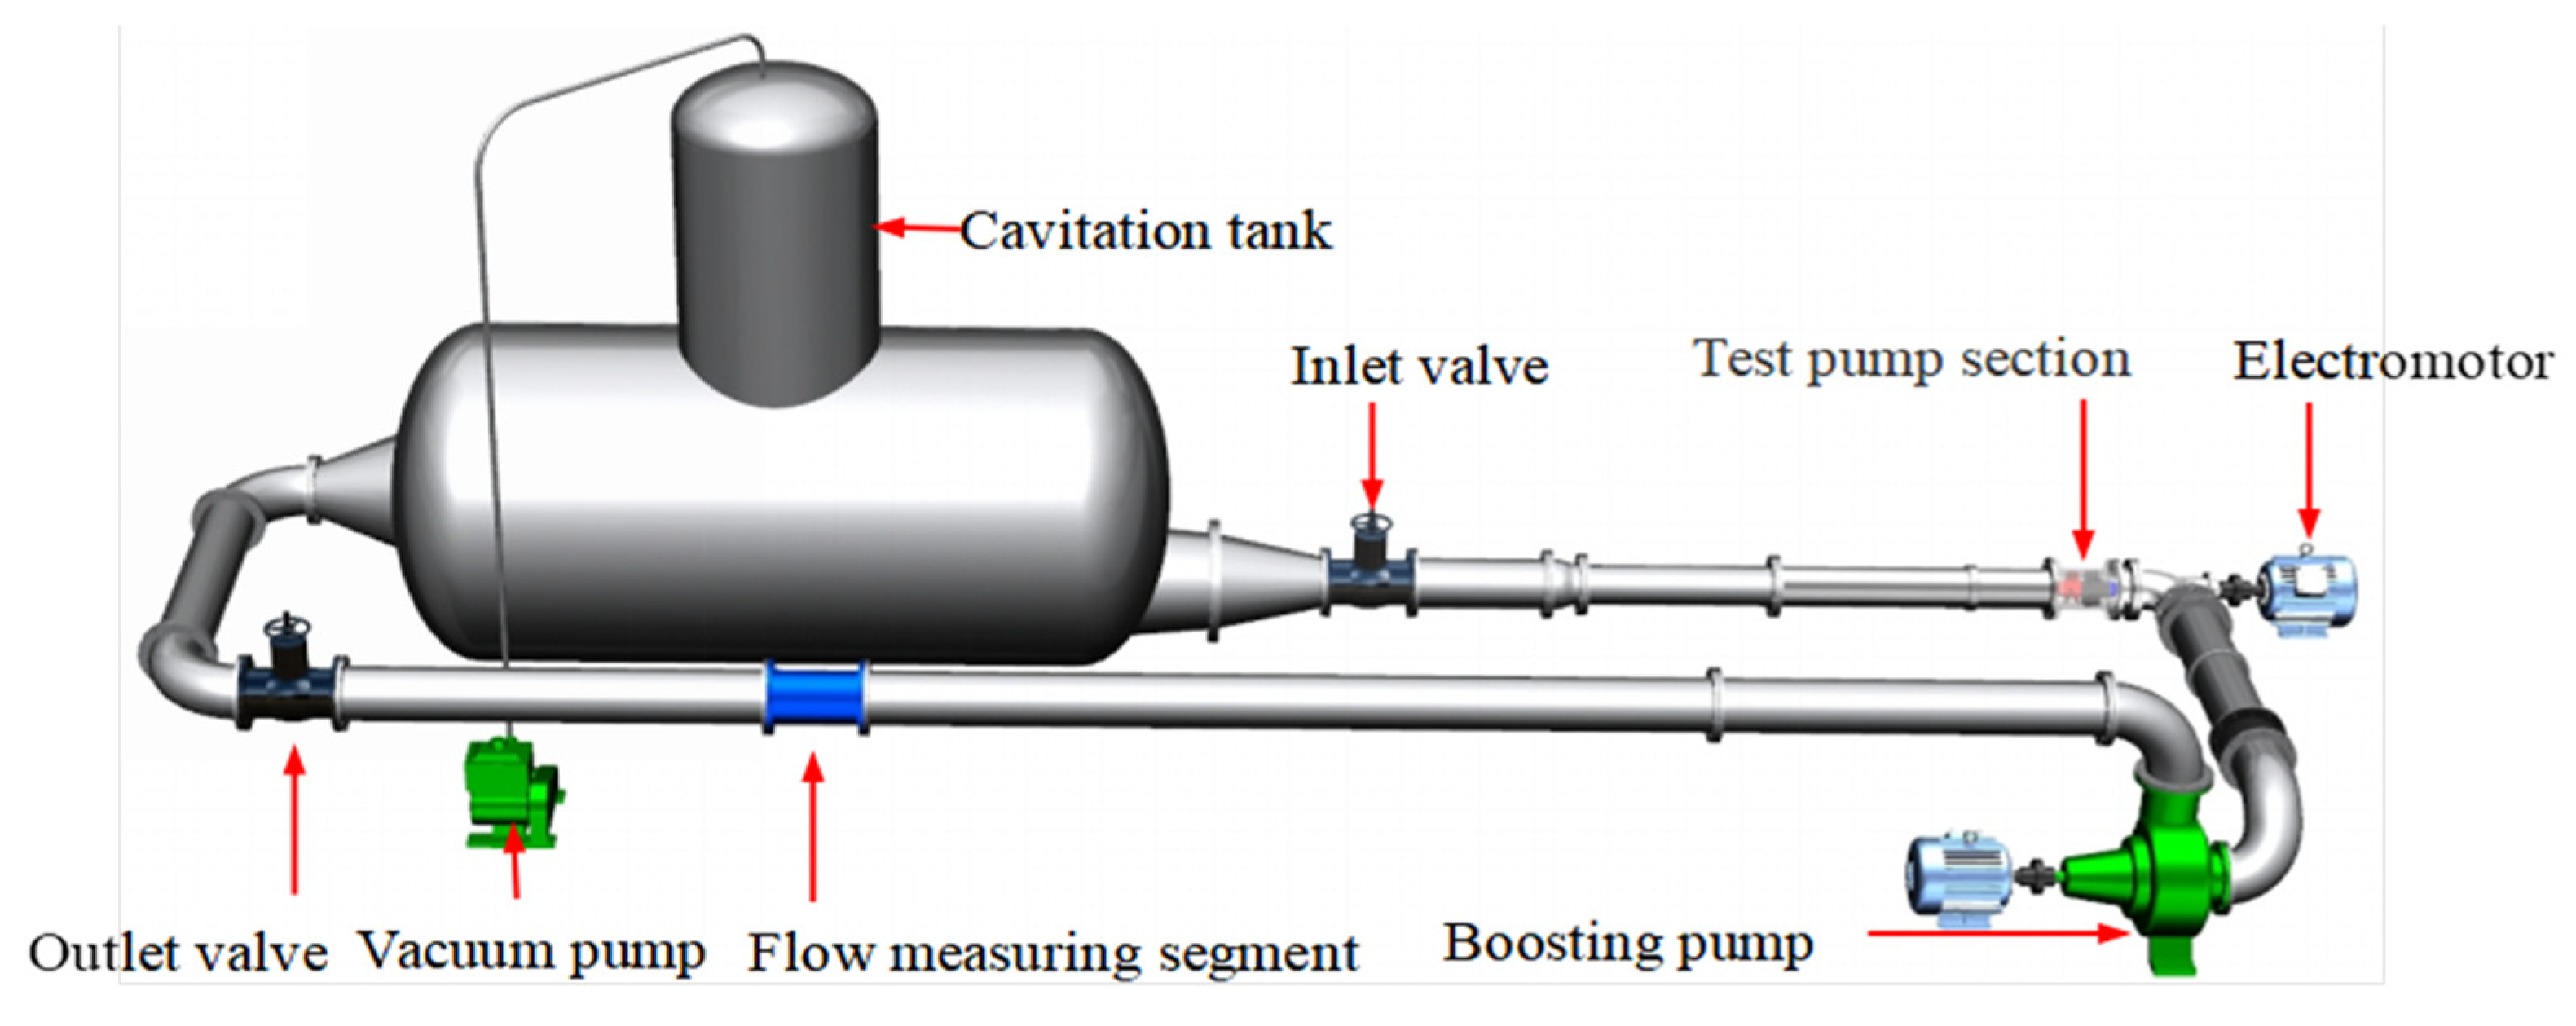
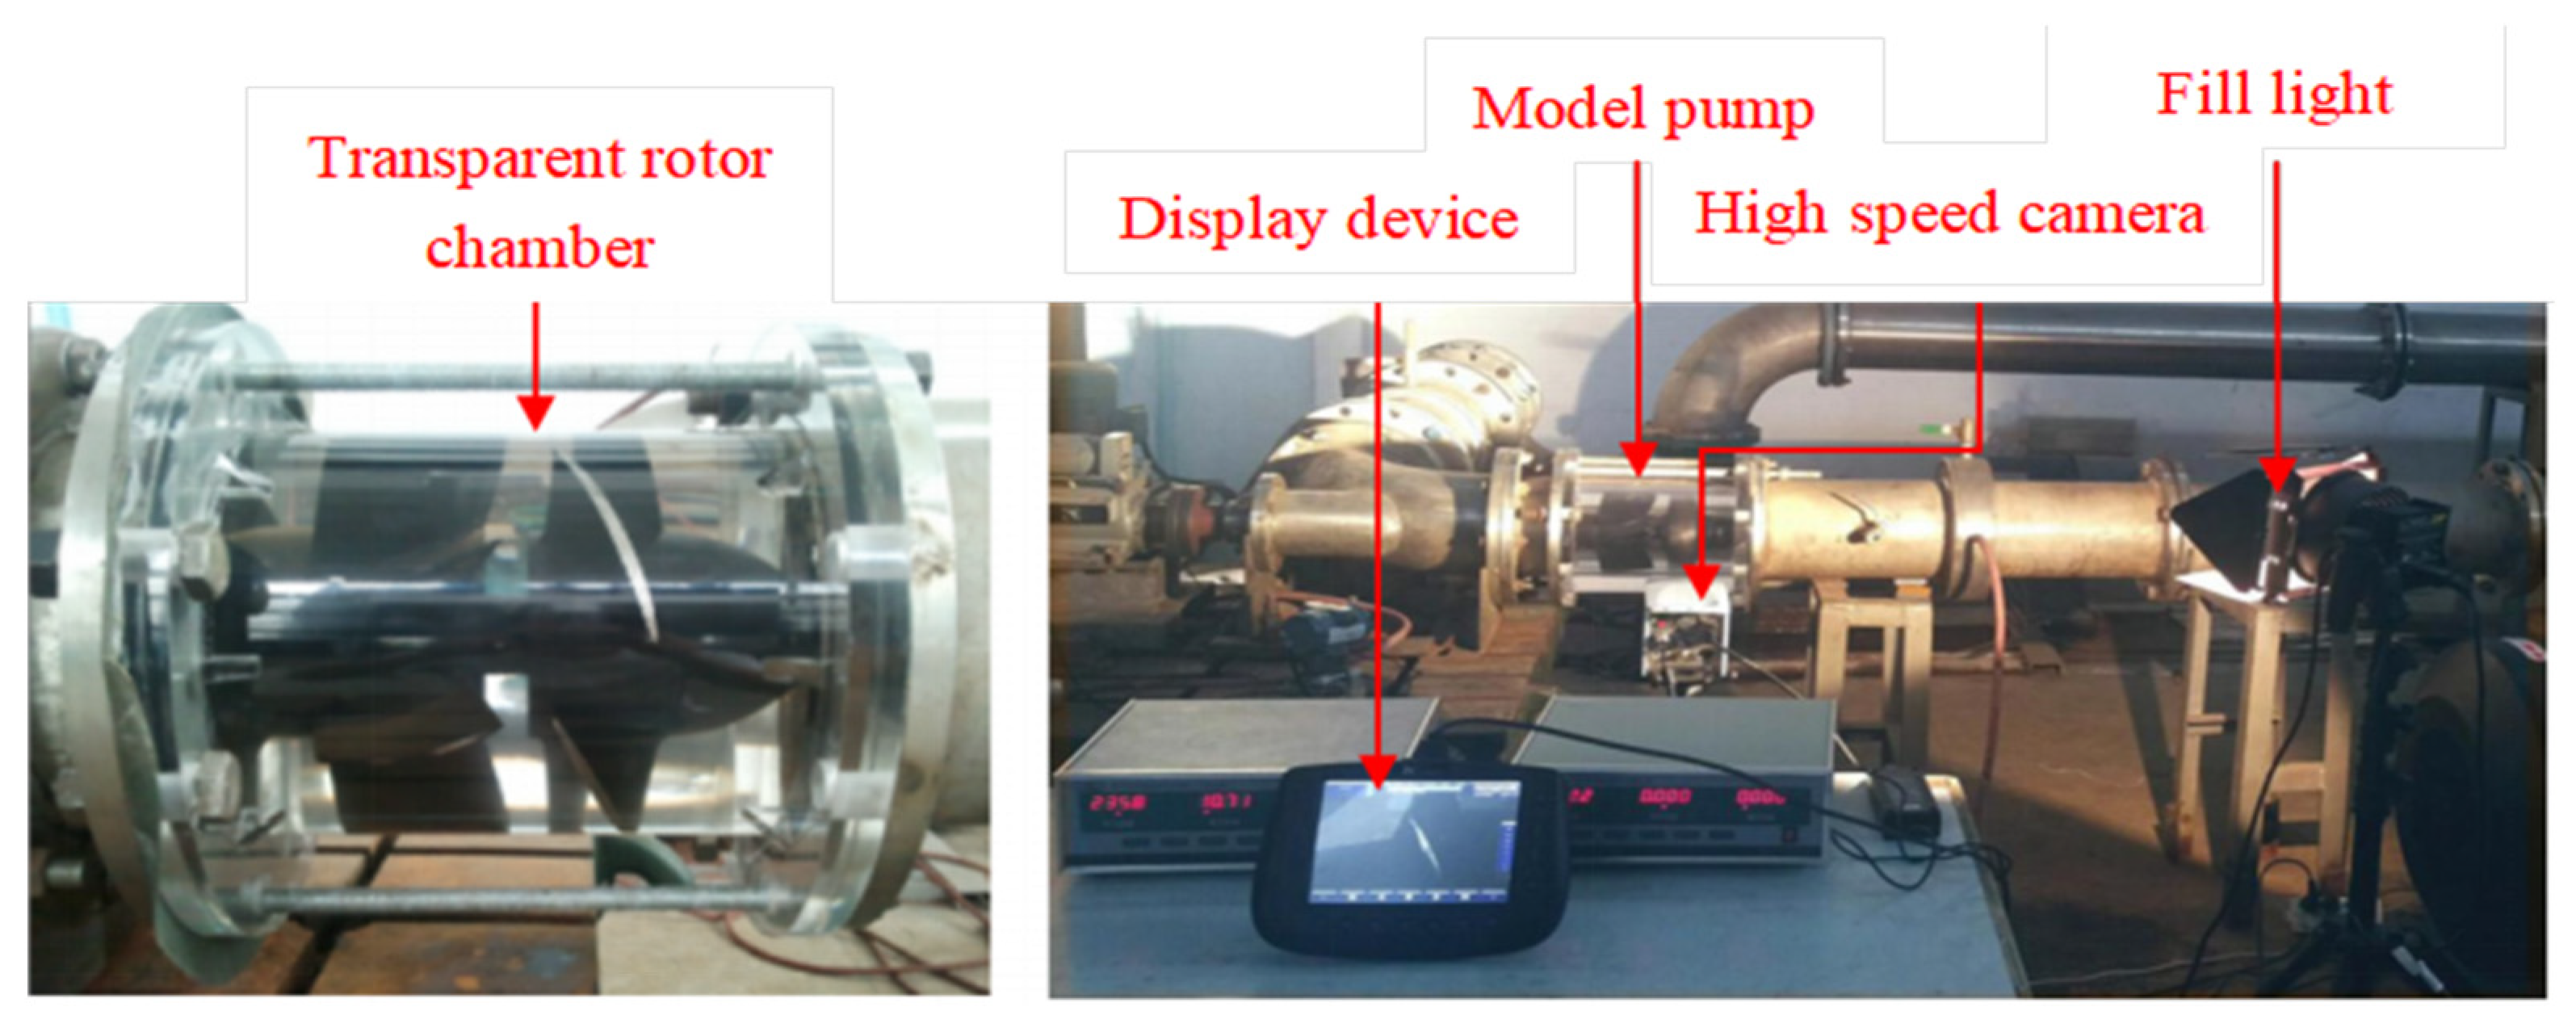
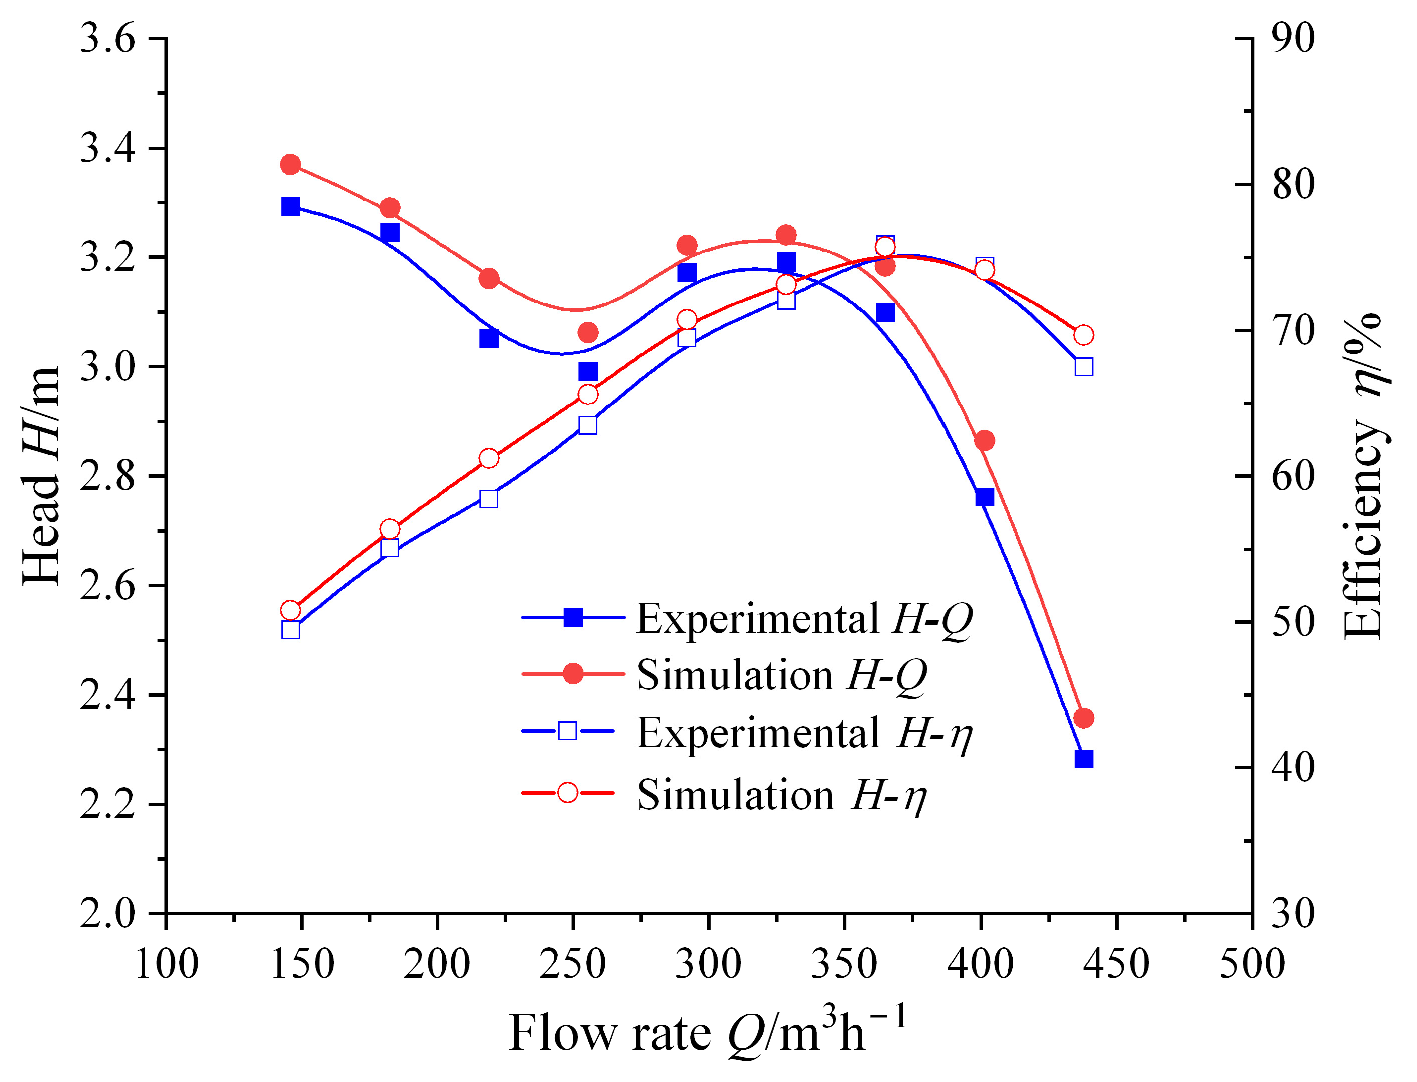
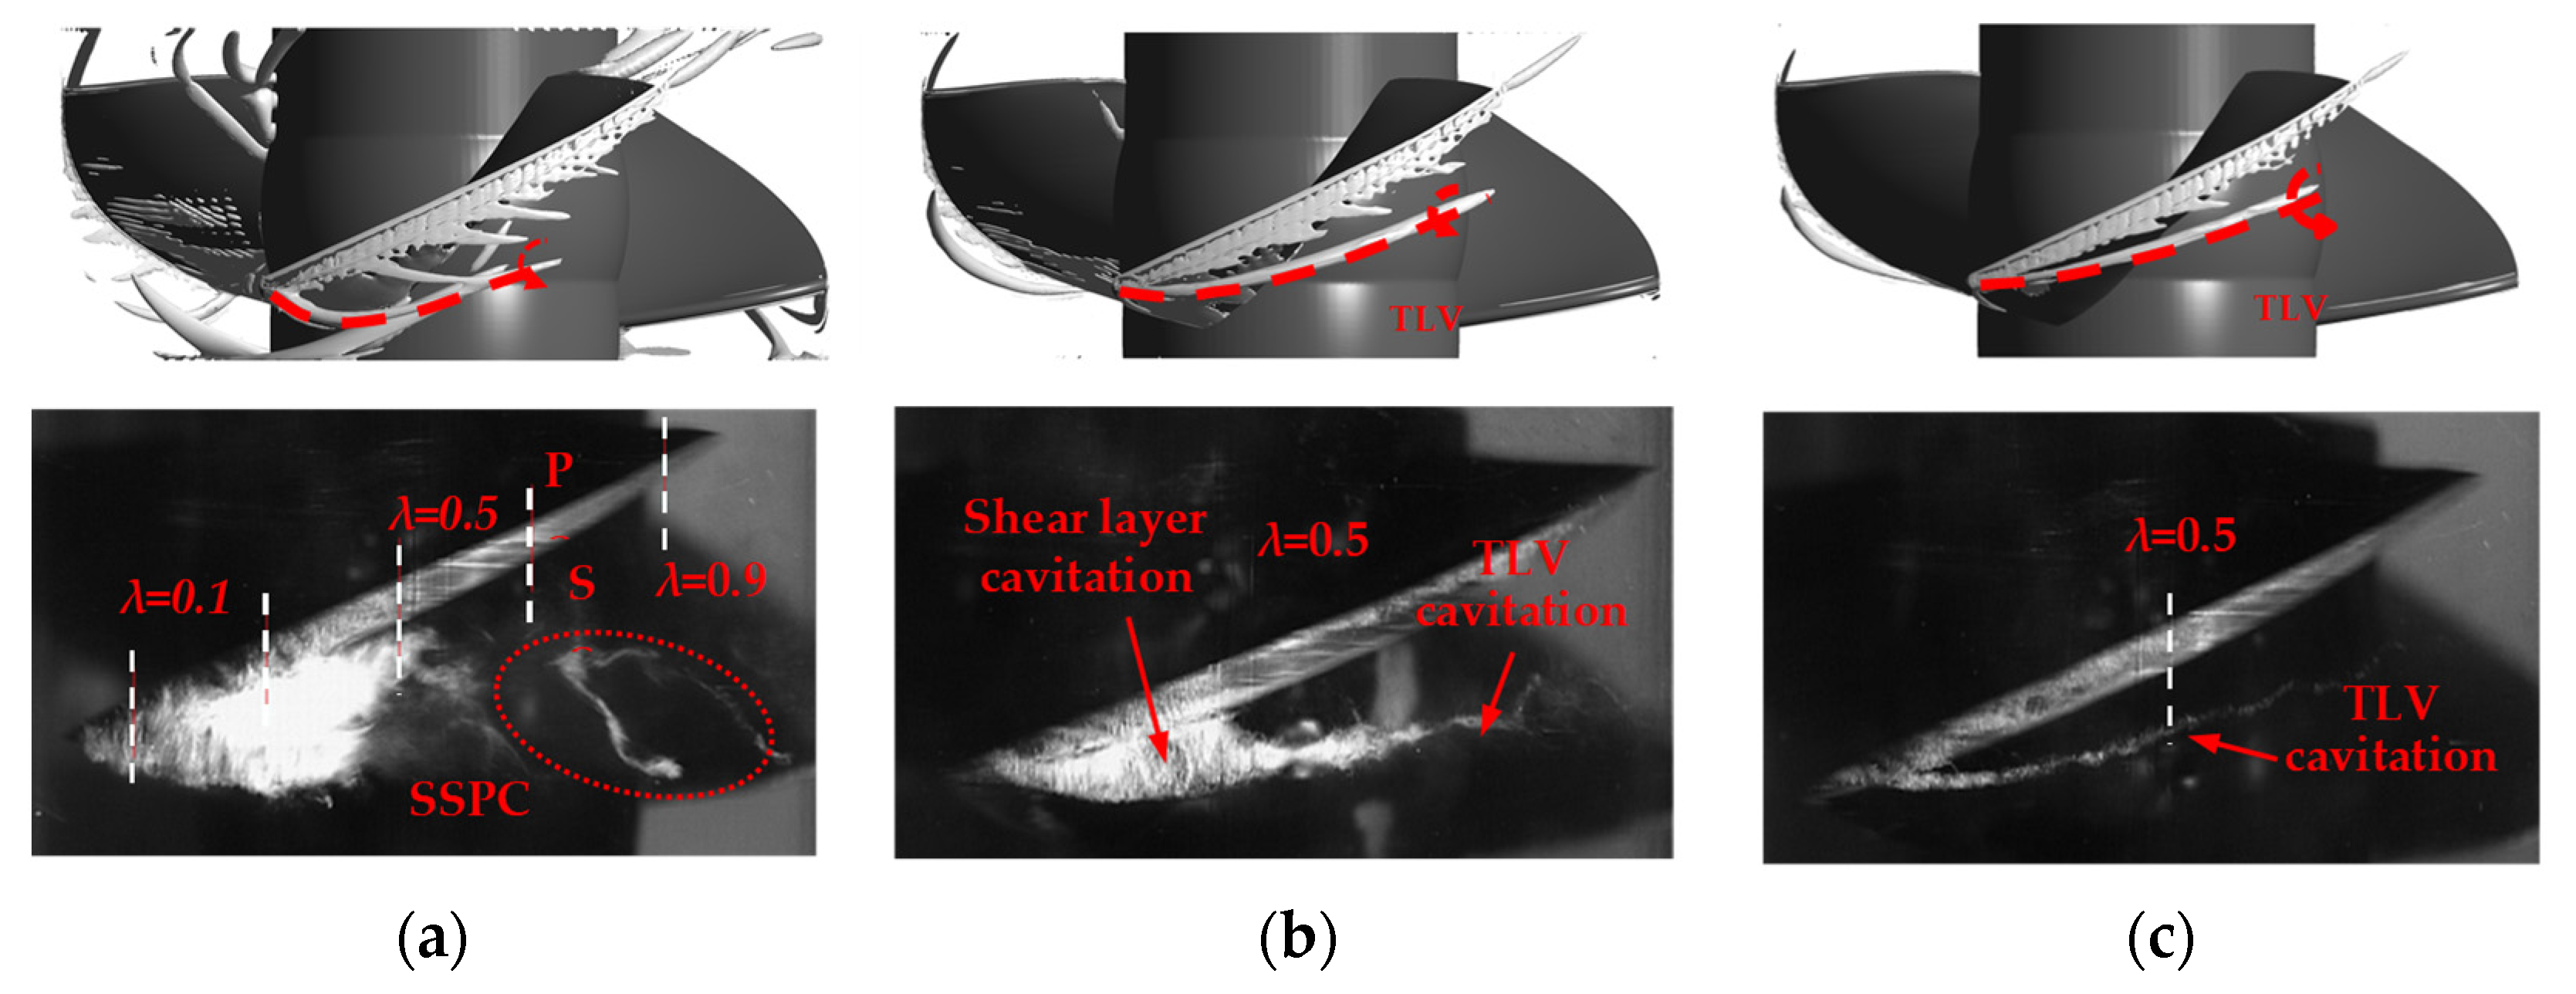
2.4. Comparison Between Numerical and Experimental Results

The model pump’s performance and high-speed imaging validated the numerical simulation accuracy. As depicted in Figure 5, both the performance evaluation of the prototype impeller and the high-speed imaging test were carried out on the identical axial flow pump testing circuit. The main equipment includes a motor, torque meter, booster pump, turbine flowmeter, flow control valve, cavitation tank, and model pump section. Figure 6 illustrates the arrangement of the high-speed imaging experiment. To minimize experimental error, a fully transparent acrylic rotating chamber was used in this high-speed photography experiment. The i-SPEED3 camera, designed for rapid imagery recording, was deployed to document images. The sampling frequency was set to 4000 Hz. Previous experimental studies conducted an uncertainty analysis [24]. In the experimental evaluations of performance, the flow rate (Q), head (H), and torque (T) parameters were assessed at a 95% statistical confidence. The intervals were 365.75 ± 0.89, 3.53 ± 0.01, and 234.12 ± 0.50.
A numerical simulation was performed on the prototype pump utilizing the previously mentioned configurations, and the derivation of performance curves are depicted in Figure 7. The Q-H and Q-η curves match well with the experimental results. The prototype pump used in this study exhibits a hump region. Upon entering this region, complex turbulent vortex flows occur within the pump. The interaction among tip leakage vortices, backflow vortices, and stall vortices significantly affects the performance of the pump [19]. The Q-H curve exhibits a slight deviation, where the computationally derived head exceeds the experimentally obtained head under identical flow conditions. The maximum error occurs at Q = 219 m3/h, with an error value of ΔH = 0.11 m (approximately 3.67% of the calculated head). In the Q-η curve analysis, at the specified design flow rate, our numerical findings closely mirror the actual experimental results, showcasing an impressive 2.79% error margin at the most. The creation of the TLV core within an axial flow pump is a consequence of the intricate dance between the tip leakage flow and the main flow, culminating in a pressure dip zone, as referenced in [25]. In this study, to capture the morphology of the TLV, the pressure was decreased in the vortex core’s low-pressure area, thereby inducing cavitation. The trajectories of the TLV and the morphology of tip cavitation are depicted in Figure 8, which illustrates these phenomena under flow conditions corresponding to Q/Qopt ratios of 0.8, 1.0, and 1.2. The trajectories of the TLV were discerned under various flow rates through the application of the swirling strength (SS) methodology. In the context of this research, the chord coefficient is denoted as λ, which is calculated by dividing s by c. Here, s represents the fraction of the chord length, measured from the leading edge, and c represents the total chord length, that is, the distance from the leading edge to the trailing edge. At Q/Qopt = 0.8, the computational outcomes indicate that the TLV originates at the leading edge of the blade tip and propagates in a rearward direction. As the chord coefficient increases, secondary small-scale TLV structures continuously form and gradually decrease in size. Experimental images show that tip leakage flow and its induced low-pressure area form cavitation. The cavitation phenomena, which encompass TLV cavitation, shear layer cavitation, clearance cavitation, etc., all come together to form a triangular cavitation cloud. From this cloud, it has been noted that suction-side-perpendicular cavitating vortices, or SSPCVs, tend to break away from its rear edge. The flow passage exhibits a prominent TLV structure, as evidenced by both numerical simulations and experimental observations, when the flow rate reaches Q/Qopt of 1.0. With shifts in the inflow angle, the angle between the tip leakage vortex (TLV) and the blade gets smaller compared to when Q/Qopt = 0.8, and we see fewer secondary TLV structures forming. When the flow rate climbs to Q/Qopt = 1.2, this angle shrinks even further. Numerically, the TLV morphology lines up better with what we have seen in experiments. All this points to the fact that the numerical calculation method we used in this study is highly reliable.

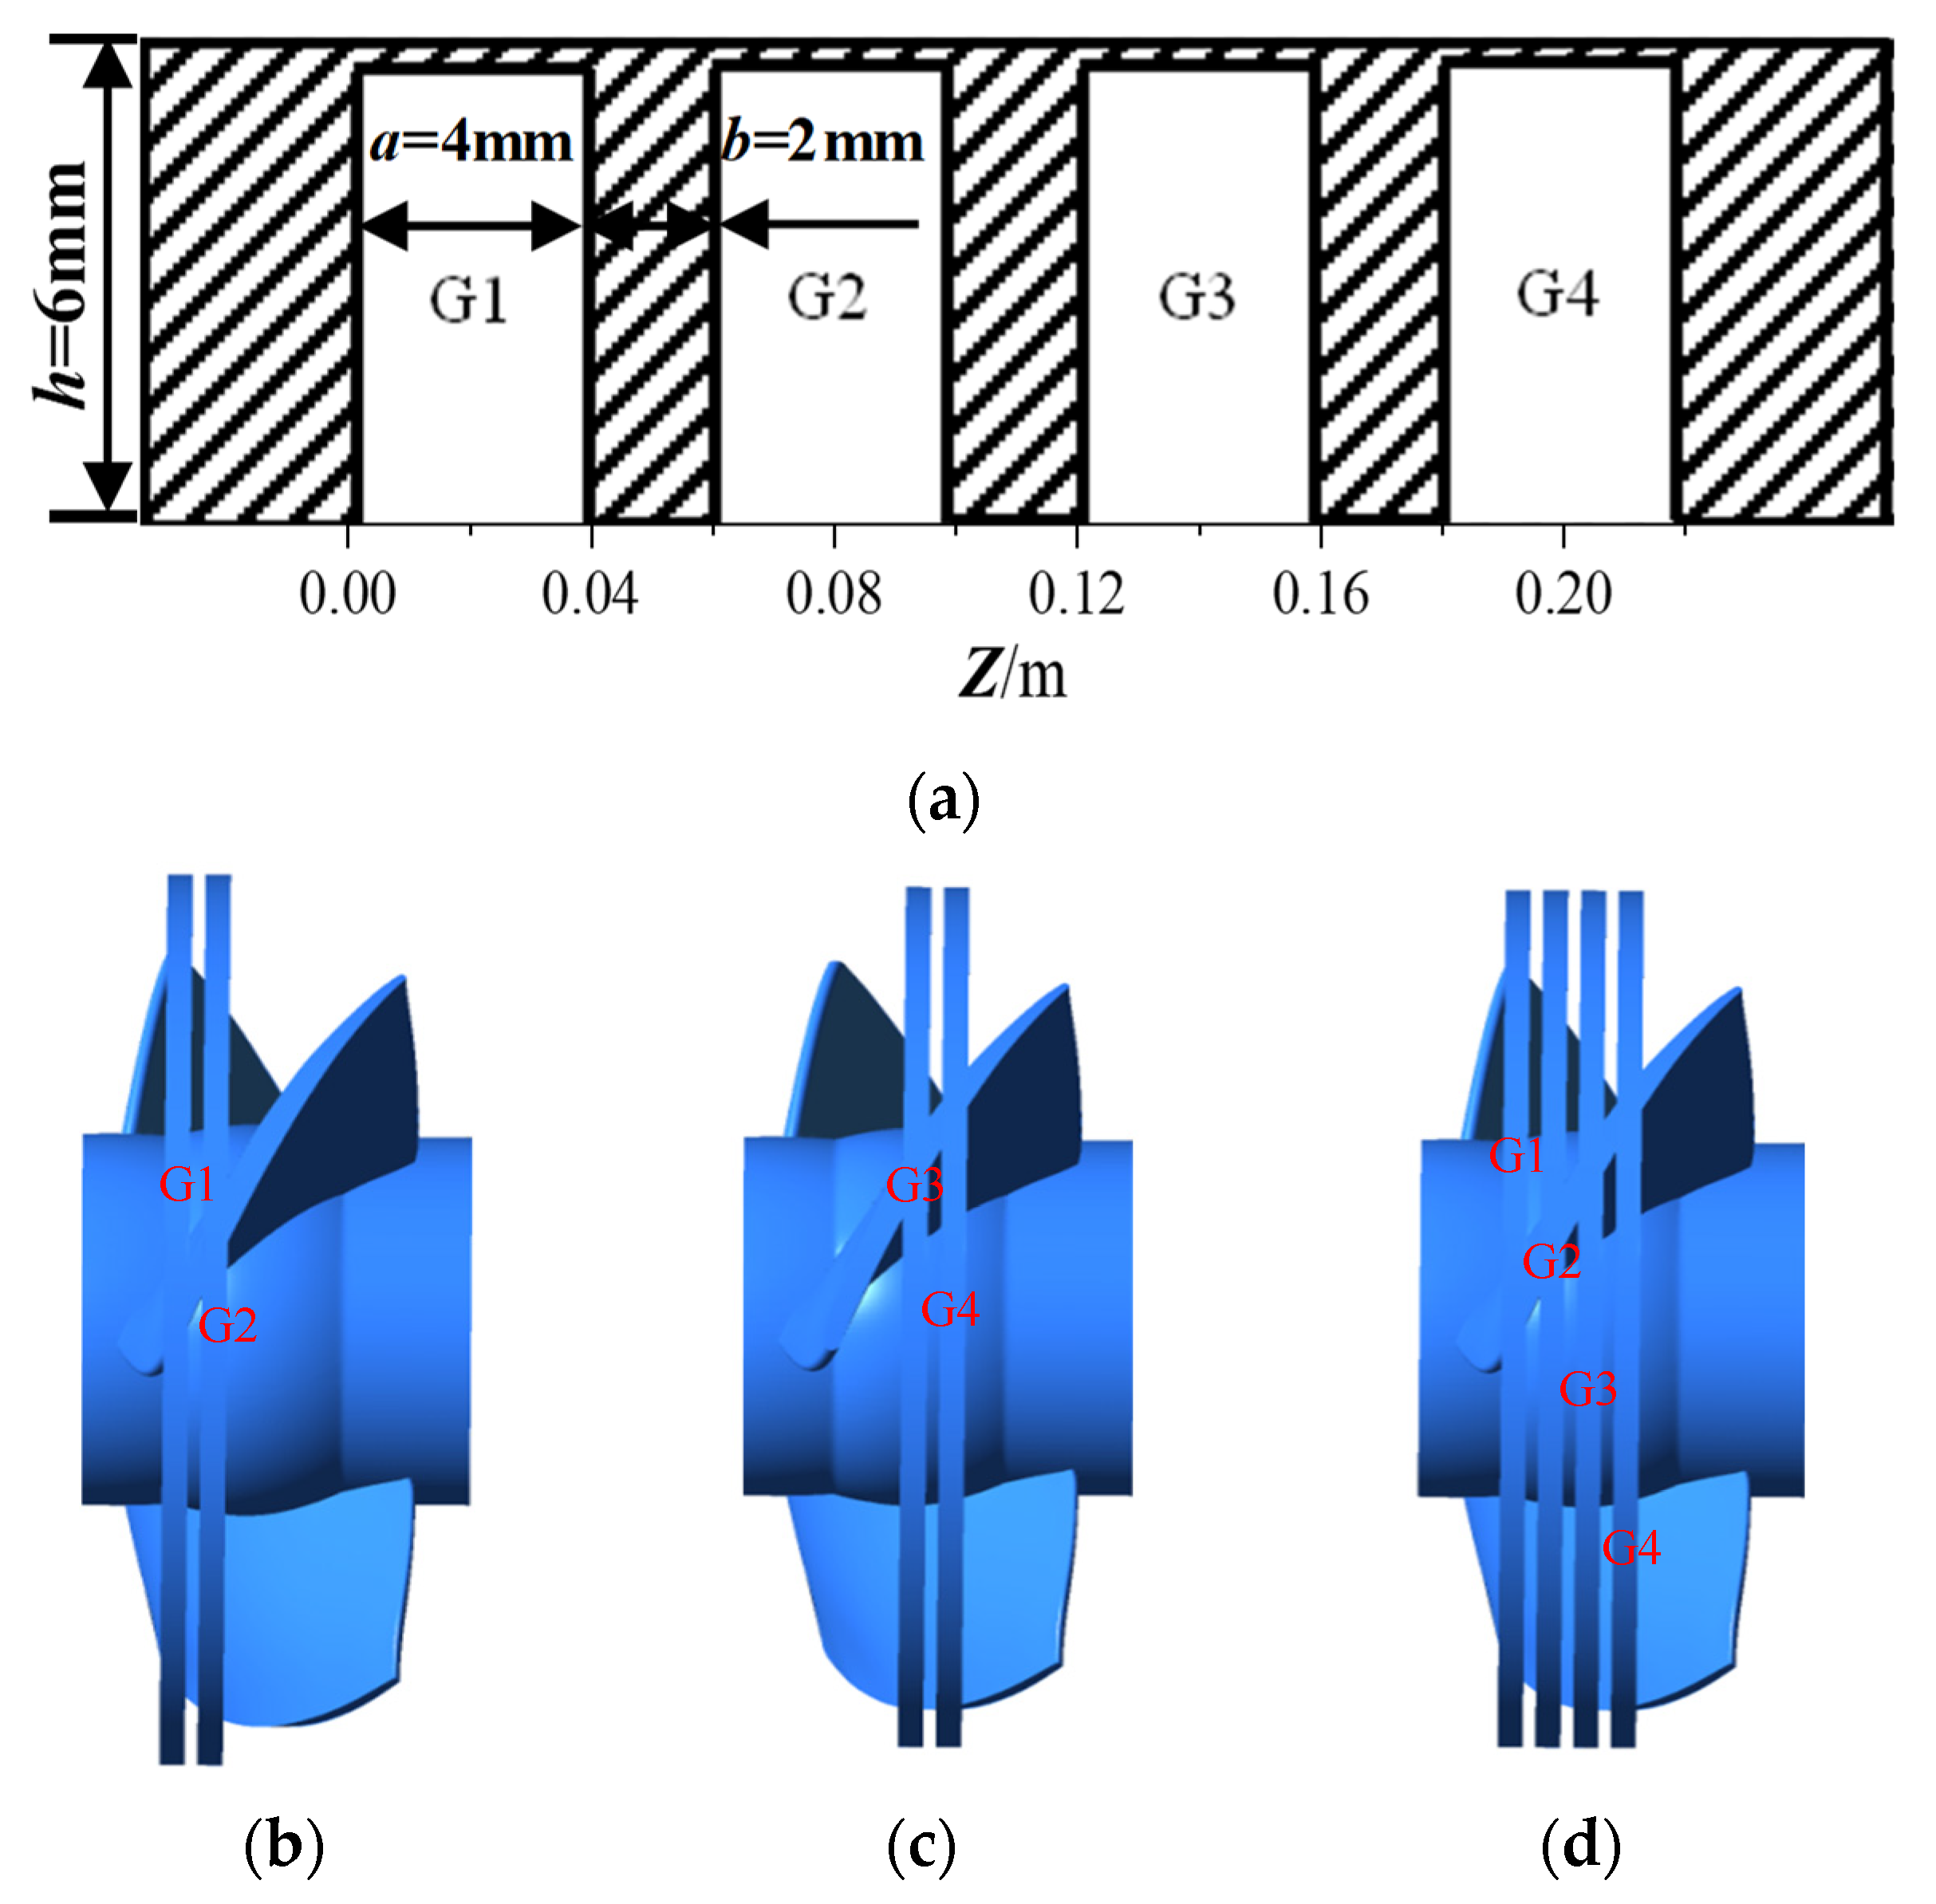
2.5. Grooving Case for the Rotor Chamber of an Axial Flow Pump

In this research, the axial flow pump model is outlined in Section 2.1. Circumferential grooves are strategically positioned on the internal wall surface of the rotor chamber, with variations in their locations. By reviewing relevant literature and referencing the circumferential groove treatment method of axial compressors [26,27], the 2D schematic of the circumferential grooves is shown in Figure 9a. Starting from Z = 0.00 m, the grooves are numbered G1, G2, G3, and G4, with a groove width of a = 4 mm, depth of h = 6 mm, and spacing of b = 2 mm. As shown in Figure 9b–d, this study selects three different groove combination cases for numerical calculation: Case A combines G1 and G2, Case B combines G3 and G4, and Case C combines G1, G2, G3, and G4.

3. Results and Discussion

3.1. Energy Characteristics of Different Grooving Cases

The comparison of the performance curves Q-H and Q-η for three different circumferential groove combinations and the prototype pump is shown in Figure 10. The model pump’s design flow rate does not alter the presence of circumferential grooves at the blade tips. When the flow rate exceeds the design condition, the Q-H curve of the Case B is relatively close to that of the prototype pump, with Case A exhibiting a slightly higher head than the prototype pump and Case C showing a lower head. As the flow rate decreases, each grooving case approaches the near-stall conditions. Compared to the prototype pump, the head reduction is more pronounced in each case, with Case C showing a significantly lower head than the other two cases. The Q-η curves indicate that Case A shows an increase in efficiency at the design flow rate. Case B is relatively close to that of the prototype pump, while Case C is significantly lower than the prototype pump. At the low flow condition range, the efficiency of Cases A, B, and C was lower than the prototype pump. Particularly for Case C, the pump efficiency decreases significantly, with the maximum deviation of 9.3% occurring at Q = 292 m3/h.

3.2. Flow Field Analysis at the Blade Tip for Various Groove Configurations

The trajectories of the TLV reflect the effect of circumferential grooves at different positions in the rotor chamber on the shape of the TLV. As shown in Figure 11, the tip leakage flow patterns are depicted for the original pump design and three grooved variations, all operating at the intended flow rate. According to Straka et al. [28], the creation of the TLV is a complex interplay between the tip leakage flow from the blades and the suction effect of the main flow. In Figure 11a, we can see the TLV structure emerge at the blade’s leading edge and then snake its way towards the suction side, following a distinct angle path. When it is reinforced by secondary leakage flow, it continuously rotates and sucks within the flow passage [29]. In Case A, the locations of G1 and G2 are positioned at the foremost section of the blade, specifically at its leading edge. Under the influence of the circumferential grooves in the rotor chamber, the starting position of the TLV moves backward to approximately λ = 0.4, where it has a higher flow velocity. As shown in Figure 11b, during the backward extension of the TLV, the decrease in the rotational intensity of the tip leakage flow is notable. In Case B, the positioning of G3 and G4 is at the midpoint of the blade’s chord, and they exert no influence on the initiation site of the TLV structure. Figure 11c illustrates that the formation of the TLV structure at the blade’s front is triggered by the tip leakage flow, which creates a substantial leakage vortex trail trailing behind the passage. However, the presence of G3 and G4 disrupts this flow, resulting in only minor secondary leakage vortices forming. This, in turn, limits the amplification of the TLV by secondary leakage flow. This will result in minimal changes in the scale of the TLV structure as it develops within the flow passage, and a reduction in its rotational strength. In Case C, the simultaneous presence of G1, G2, G3, and G4 significantly influences the tip leakage flow from the leading edge of the blade to the chord length range of λ = 0.7. Although tip leakage flow still occurs afterward, its velocity is relatively low. Consequently, the TLV is weaker and dissipates within the flow passage quickly.
Previous studies have shown that tip leakage flow is driven by the pressure difference between the pressure side and the suction side [30]. Figure 12 presents the static pressure load distribution on the blade at 99% of the blade height in the rotor tip region under different flow rates. The pressure coefficient is defined as P* = 2 P/ρU2, where P represents the instantaneous static pressure, ρ denotes the fluid density, and U′ is the linear velocity of the blade tip. Under consistent operating conditions, the top half of the figure illustrates the static pressure distribution curve on the pressure side, and conversely, the bottom half shows the static pressure distribution curve on the suction side. The chord length coefficient ranges from λ = 0.0 to λ = 1.0, signifying the progression from the blade’s leading edge all the way to its trailing edge. Figure 12a displays the pressure coefficient distribution at the blade tip of the original pump. It is evident that the overall pressure distribution curve is relatively smooth. When the chord length coefficient rises across various operational scenarios, the pressure differential at the blade edge diminishes progressively, leading to a concurrent decrease in the magnitude of the leakage flow at the blade tip. This finding aligns with the pattern depicted in Figure 11a, where the leakage velocity at the blade edge diminishes as the chord length coefficient climbs. In Figure 12b, the load distribution for Case A at the blade tip exhibits notable dips in static pressure near the leading edge. During low-flow conditions, the pressure on the blade’s pressure side holds steady, whereas the static pressure on the suction side sees dramatic shifts, influenced by the grooves around the circumference. In scenarios involving extensive design modifications and high flow rates, we observe irregularities in both the pressure and intake sides. The frequency of these peaks and valleys aligns with the count of the circumferential grooves. This irregularity spans from λ = 0.0 to λ = 0.4, subsequently affecting the starting point of the tip leakage vortex (TLV). In Case B, pressure fluctuations corresponding to the number of circumferential grooves were also observed. These fluctuations are primarily characterized by significant variations in the static pressure distributions on the suction side, occurring within the range of λ = 0.3 to λ = 0.7. In Case C, we notice four distinct fluctuations, stretching from the tip of the blade all the way to λ = 0.7. These fluctuations in large-scale static pressure are quite substantial, severely limiting the development of tip leakage flow.
Figure 13 showcases the pressure distribution contours at 99% of the blade height for the prototype pump and various circumferential groove cases under operating conditions of 1.2 Qopt, 1.0 Qopt, and 0.6 Qopt. The shaded areas indicate the positions and numbers of the circumferential grooves. The black dotted arrow indicates the trajectory of TLV. Under 1.2 Qopt flow condition, a distinct tip leakage vortex (TLV) trajectory is evident in the low-pressure region on the suction side of the blade. As the flow rate decreases, the low-pressure region on the suction side gradually expands. The trajectory of TLV and the blade angle also progressively increase. The shape of the low-pressure region at the blade tip is affected by the circumferential grooves. In Case A, under the conditions of 1.2 Qopt and 1.0 Qopt, the low-pressure region at the leading edge on the pressure side is reduced, with the low-pressure area primarily located between the two grooves and in the region following G2. As the blade tip is unaffected by the grooves after the middle of the blade chord, the TLV low-pressure trajectory remains visible. In the 0.6 Qopt condition, the angle between the TLV and the blade becomes larger for the variation of the inflow angle. Figure 8a illustrates a reduced TLV length, effectively wiping out the distinct TLV path once the circumferential grooves at the leading edge take hold. In Case B, the grooves’ impact on the low-pressure zone at the blade tip is most pronounced in the middle section of the blade’s tip. The TLV near the leading edge remains unaffected under different flow conditions, especially under low flow conditions, where only minor variations in the suction side pressure field occur near the two grooves. Under the conditions of 1.2 Qopt and 1.0 Qopt, the circumferential grooves partially disrupt the structure of the TLV within the flow passage. In Case C, the pressure field at the blade tip under different flow rates shows that the extent of the low-pressure region decreases under the influence of the circumferential grooves and primarily follows the distribution of the grooves. Moreover, no distinct TLV low-pressure regions are present across all flow conditions.
To get a handle on how circumferential grooves in the rotor chamber impact flow in the axial pump’s blade tip region, this research digs into flow patterns at various points along the blade chord. Figure 14 illustrates the vorticity distribution at different chord length sections under a flow condition of 1.0 Qopt. Sections S0–S7 represent axial cuts at λ values 0.0 to 0.7, in 0.1 increments. In the prototype pump, vorticity is primarily distributed in the tip gap, the shear layer [31], and the TLV structure region on the suction side of the blade across different sections. Additionally, there is a certain distribution near the wall of the blade. In Figure 14a, the vorticity in the gap is relatively high. Previous studies have found that this region is also where tip cavitation is most easily observed [30]. The red dash-line depicts the shape of the TLV vortex configuration. The S1 section highlights a clear vortex pattern within the tip leakage and primary flow structures. As the chord length coefficient increases, the vortex scale in sections S1 to S7 gradually increases, while the vorticity values decrease. After grooving the rotor chamber, the grooves notably disrupt the vorticity pattern at the blade tip area. In Case A, the distribution of the high vorticity region in the gap across sections S0 to S7 is influenced by the grooving, resulting in a reduction in the axial distribution within the suction side passage, which develops towards the SS wall. High-vorticity regions appear within the grooves, with vortex structures present in both G1 and G2 at the S0. Additionally, vortices are primarily generated within G2 at the S1 and S2. When λ > 0.4, the circumferential grooves are situated away from the blade’s edge, which in turn permits the high-vorticity zone within the gap to slowly regain its balance. Concurrently, on the suction side passage, the TLV structure starts to take shape. No vortex regions with concentrated vorticity are formed in sections S4 to S6, while a large-scale TLV core region begins to appear in section S7. However, it is closer to the SS surface of the blade, so its impact on the flow within the passage is significantly reduced. In Case B, circumferential grooves between S0 and S3 reside in the blade’s pressure-side channel, minimally impacting tip leakage. Also, the vorticity distribution is similar to that of the prototype pump. In sections S4 to S7, the grooves gradually interfere with the vorticity field in the gap. However, at this point, the circumferential grooves primarily affect the leakage flow in the mid to rear section of the blade tip, interfering with the inception and development of the secondary TLV structure and weakening the vorticity transport of the main TLV structure. The TLV structure generated from the leading edge continues to develop backward within the passage, as shown in Figure 11c. In sections S5 to S7, the shear layer is disrupted. Meanwhile, another region with high vorticity appears near the wall. In Case C, the leakage flow in the gap across sections S0 to S6 is interfered with by the circumferential grooves, making it difficult for vortex structures to form in the passage and interact with the main flow. The high vorticity regions are more dispersed, leading to easier dissipation within the passage.
The velocity distribution in the blade tip region can clearly illustrate the entry of the tip leakage flow into the suction side and its interaction with the main stream. Figure 15 presents the axial velocity distribution in the blade tip region for the prototype pump and various grooving cases across different sections. As depicted in Figure 15a, the axial velocity profiles of the original pump across sections S1 to S3 reveal a clear trend. A negative Vz value signifies that the tip leakage flow jets out from the pressure side and makes its way into the suction side. It is in the highlighted area that this leakage slams into the primary flow, giving rise to a TLV structure. Then, it gradually moves away from the blade in the passage, thereby increasing its influence range. The axial influence ranges in the S1 to S3 sections are ΔZ = 0.065, 0.090, and 0.115, respectively. In Case A, the influence of the circumferential grooves on the tip flow field is primarily near the leading edge of the blade. Thus, sections S1 to S3 are selected for analysis as shown in Figure 14b. Compared to the prototype pump, G1 and G2 suppress the entry of tip leakage flow into the suction side near the leading edge of the blade. In the S1 section, the leakage flow is essentially trapped within the blade tip gap by G1, which nips any chance of a TLV forming on the suction side right in the bud. Moving on to the S2 section, you can see the tip leakage flow actually taking shape at Z = 0.06 m due to the influence of G2. After entering the suction side, it is affected by G1, leading to a significant reduction in both its intensity and influence range compared to the prototype pump. In the S3 section, the tip leakage flow is primarily influenced by G2, with a range similar to that in the S2 section. In Case B, the influence of the circumferential grooves on the tip flow field is mainly in the middle to rear part of the blade tip. Therefore, sections S4 to S6 are selected for analysis. In the S4 section, G3 first interferes with the tip leakage flow, resulting in the emergence of a flow with a negative axial velocity at Z = 0.12 m within the blade tip gap. It continues to develop and interact with the main stream after entering the suction side near the rotor chamber wall. In the S5 section, due to the influence of G3 and G4, there is no longer a significant flow with negative axial velocity within the gap. However, a small area of negative values still exists near the suction side rotor chamber wall. At the blade’s edge, circumferential grooves expand the radial reach of tip leakage. This phenomenon is more pronounced in the S6 section, where the radial interference range of the tip leakage flow expands to r* = 0.97. Case C includes G1, G2, G3, and G4, facilitating a comparative analysis of sections S1 to S6. The blade tip gap in these six sections is affected by the circumferential grooves. In sections S1 and S2, the tip leakage flow is suppressed by the circumferential grooves, resulting in negligible impact on the SS side. At λ = 0.3, a small area of negative values appears near the suction side of the blade tip, primarily between G1 and G2. As the chord length coefficient increases, a TLV vortex region gradually emerges on the SS side. At this point, the TLV vortex structure primarily influences the flow field radially near the blade wall.
During the process of the blade tip leakage flow entering the adjacent passage through a narrow gap, it forms a shear layer due to the action of shear stress. It appears as a band of low pressure within the gap in the pressure contour plot. When the leakage flow enters the adjacent flow passage, it interacts with the main stream to form a TLV, resulting in an elliptical low-pressure region. When the pressure of the TLV structure is below the saturation vapor pressure, cavitation can be induced [32]. Figure 16 illustrates the pressure gradient within the blade tip zone for various chord lengths, with the specific sections detailed in Figure 15. Take a gander at Figure 16a, where the area of low pressure linked to the TLV in the prototype pump grows wider and has a more pronounced impact as the chord length ratio is bumped up. In the S1 section, the low-pressure region of the TLV ranges approximately from −0.015 < Z < 0.010 and 0.99 < r* < 1.00; in the S2 section, it ranges from −0.020 < Z < 0.015 and 0.98 < r* < 1.00; and in the S3 section, it ranges from −0.035 < Z < 0.025 and 0.975 < r* < 1.00. In Case A, by the influence of G1 and G2, the range of the low-pressure region on the SS side in the S1 to S3 sections is significantly reduced, with the elliptical low-pressure region caused by the TLV vortex structure being disrupted. Particularly, in the S1 section, the low-pressure distribution exists only near the rotor chamber wall on the SS side. The low-pressure regions in the S2 and S3 sections develop radially near the SS wall, extending their influence range to r* = 0.98 and r* = 0.97, respectively. In Case B, G3 and G4 interfere with the blade tip flow in the S4 to S6 sections. However, large-scale elliptical low-pressure regions induced by the TLV still exist in different sections. In the S6 segment, beyond the TLV’s low-pressure area, a second substantial low-pressure zone crops up near the SS boundary, which dramatically hampers the flow through the passage. In Case C, the TLV vortex structures are suppressed across different chord length sections, resulting in the absence of significant low-pressure regions with noticeable vortex suction. In the S1 to S3 sections, the range of the low-pressure region on the SS side is reduced compared to the prototype pump. In the S4 to S6 sections, due to the influence of the circumferential grooves, there are more dispersed large-scale low-pressure regions on the SS side, leading to a deterioration of the flow field near the blade tip.
The vortex swirling strength (SS) can be used to identify the TLV vortex structure within the flow passage. Figure 17 shows swirling strength and velocity vector distributions in the different cross-sections of the tip region. In the S1~S3 sections of the prototype pump, there is a distinct area of high swirling strength on the suction side. The velocity vectors reveal an elliptical vortex pattern in this zone, implying it constitutes the core of the TLV. In Case B, with G1 and G2 in the rotor chamber, the concentration areas of swirling strength on the suction side exhibit irregular shapes and are closer to the blade in various sections compared to the prototype pump. In Case C, the elliptical concentration areas of swirling strength within the S4~S6 sections still exist. Their distribution scale corresponds to the TLV structure, increasing with the chord length coefficient. Between the TLV structure and the blade, there are also dispersed concentration areas of small-scale vortex intensity, indicating a relatively turbulent flow field. In Case C, the swirling strength distribution in the S1~S3 sections is similar to that in Case A, with concentrations only near the suction surface, and large-scale vortex structures in G3 and G4 causing flow losses. As the chord length coefficient rises, the rotor chamber’s circumferential groove interferes with the blade tip’s mid-to-rear TLV formation, while it also causes the formation of dispersed vortex intensity concentration areas in the suction side flow passage.

4. Conclusions

Using the SST k-ω turbulence model, numerical simulations were performed for the prototype pump, as well as for various cases involving rotor chamber grooving. The accuracy of the simulation results was validated by comparing the performance of the prototype pump and high-speed photography experiments. The maximum error values of the Q-H and Q-η curves under different flow conditions were ΔH = 0.11 m and Δη = 2.79%, respectively. The numerical calculations demonstrated a satisfactory alignment between the TLV trajectories and the high-velocity regions.
(1)
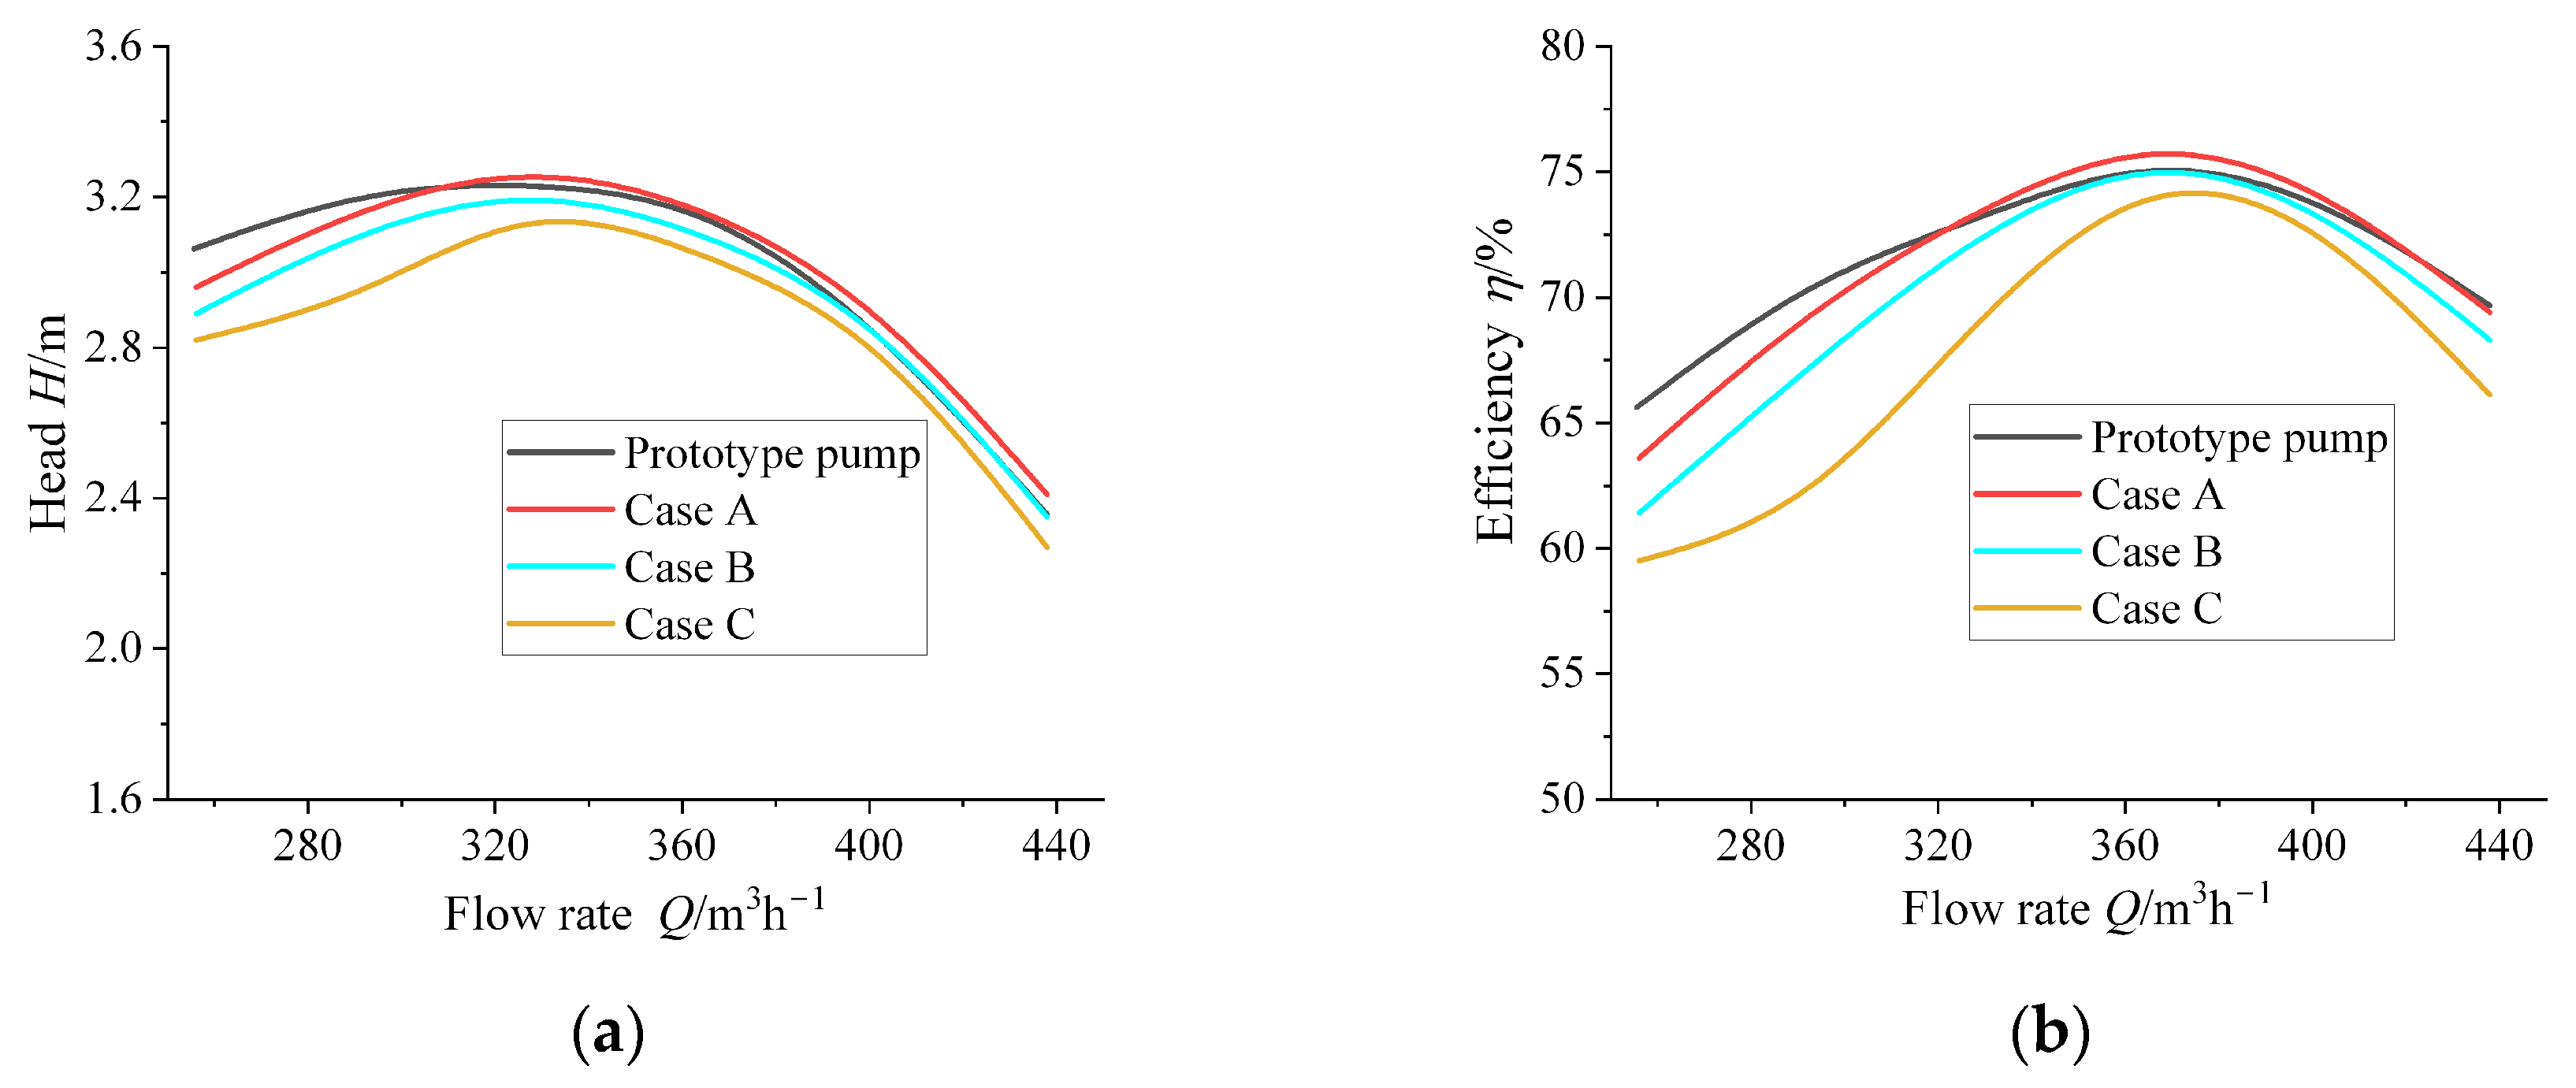
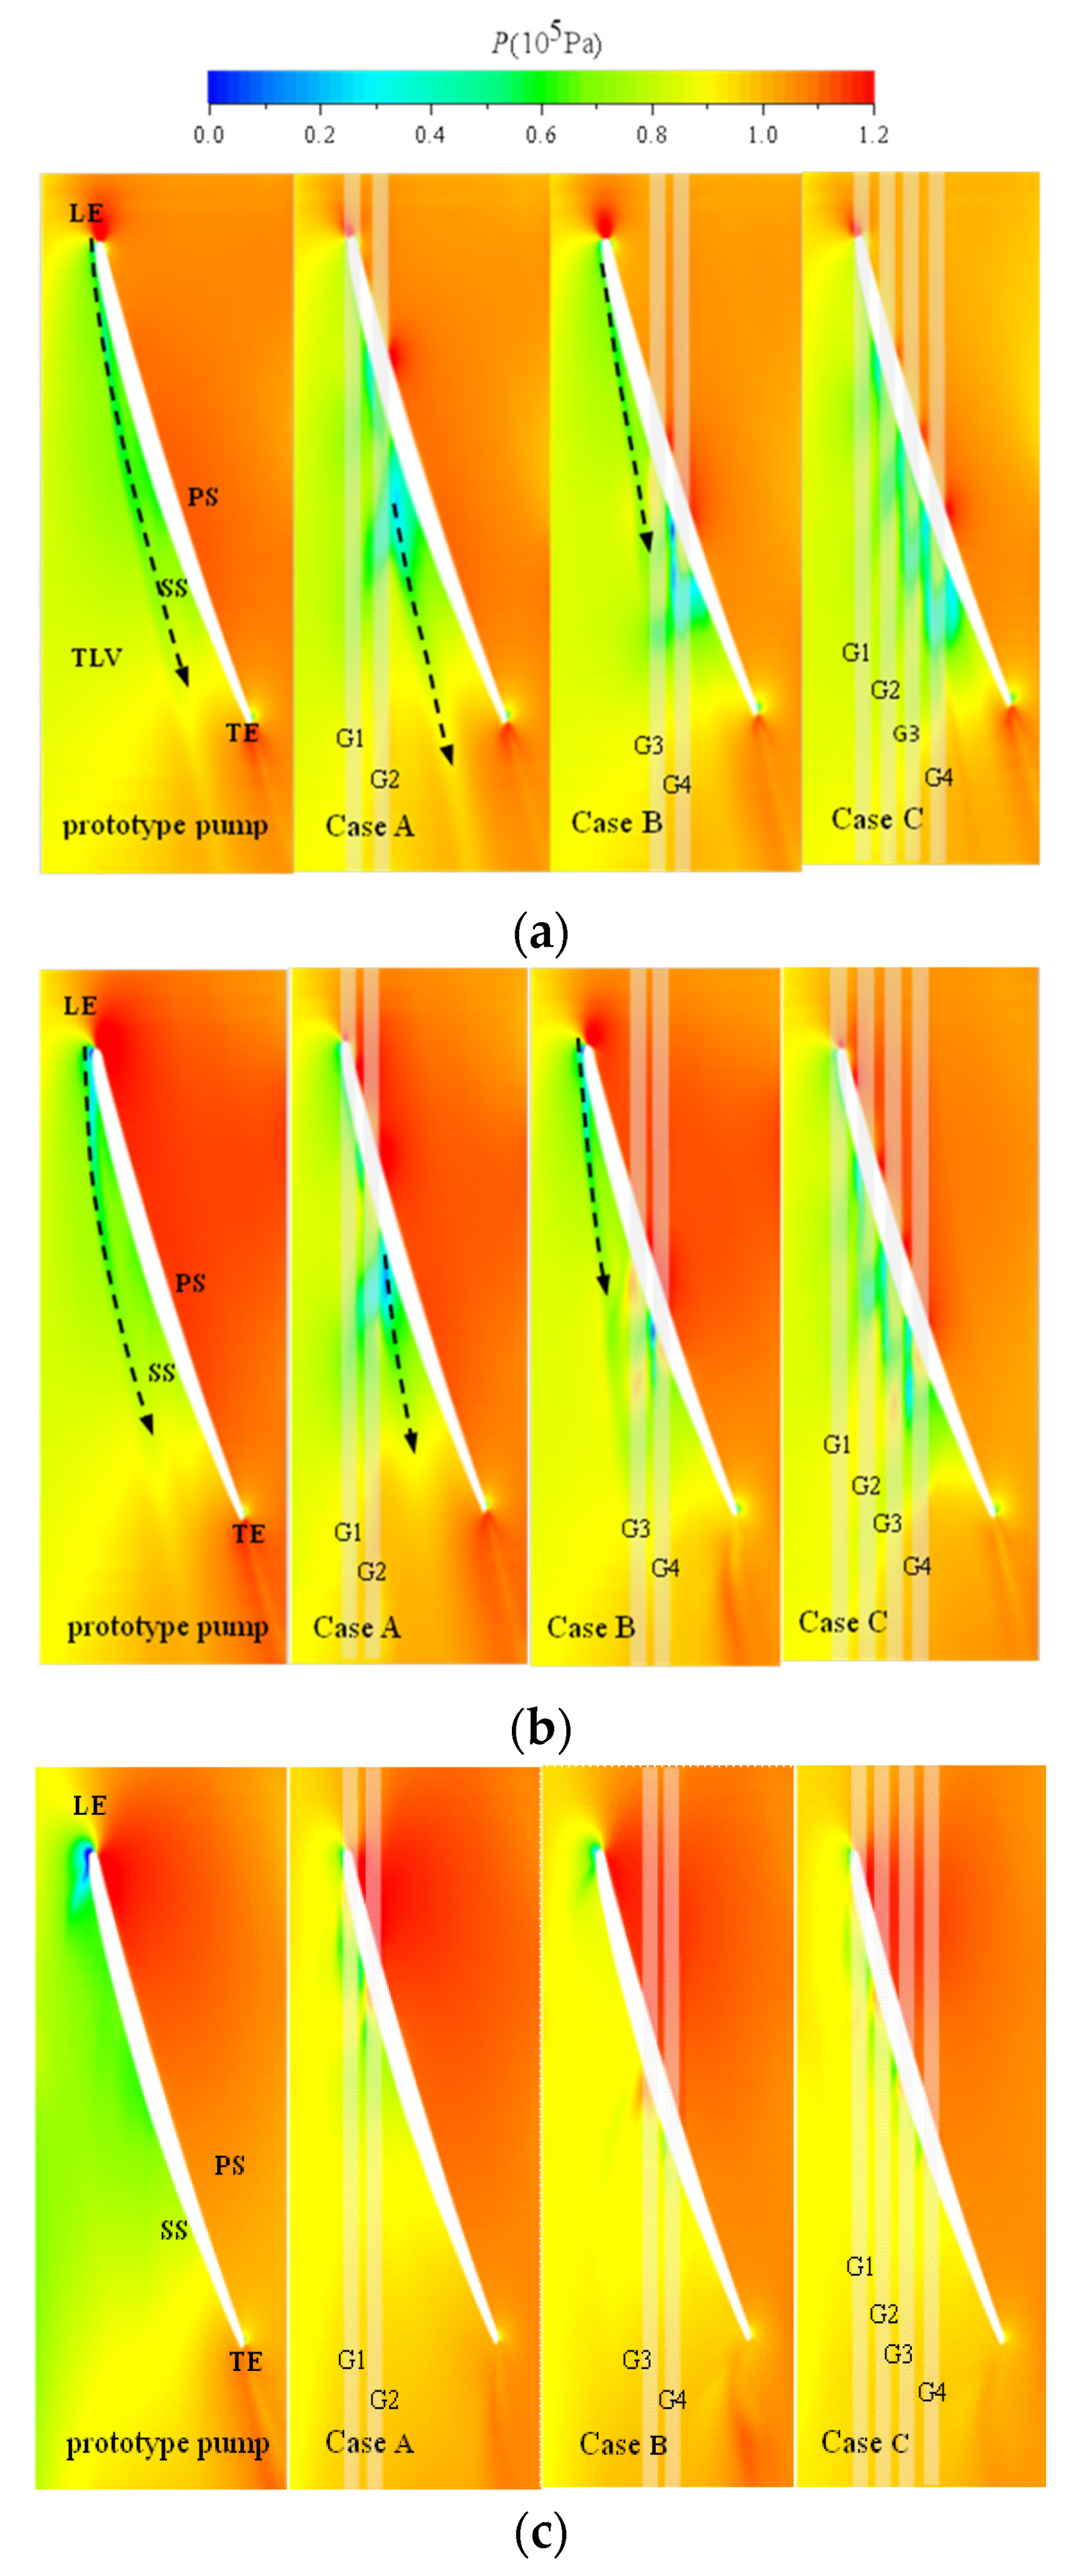
The numerical simulations exhibited a strong correlation between the TLV trajectories and the images captured by high-speed photography. At the design operating points, Case A enhanced the pump’s efficacy at elevated flow rates, with individual case heads akin to those of the prototype unit. Particularly, Case C exhibits significantly lower head and efficiency compared to the other cases.
(2)
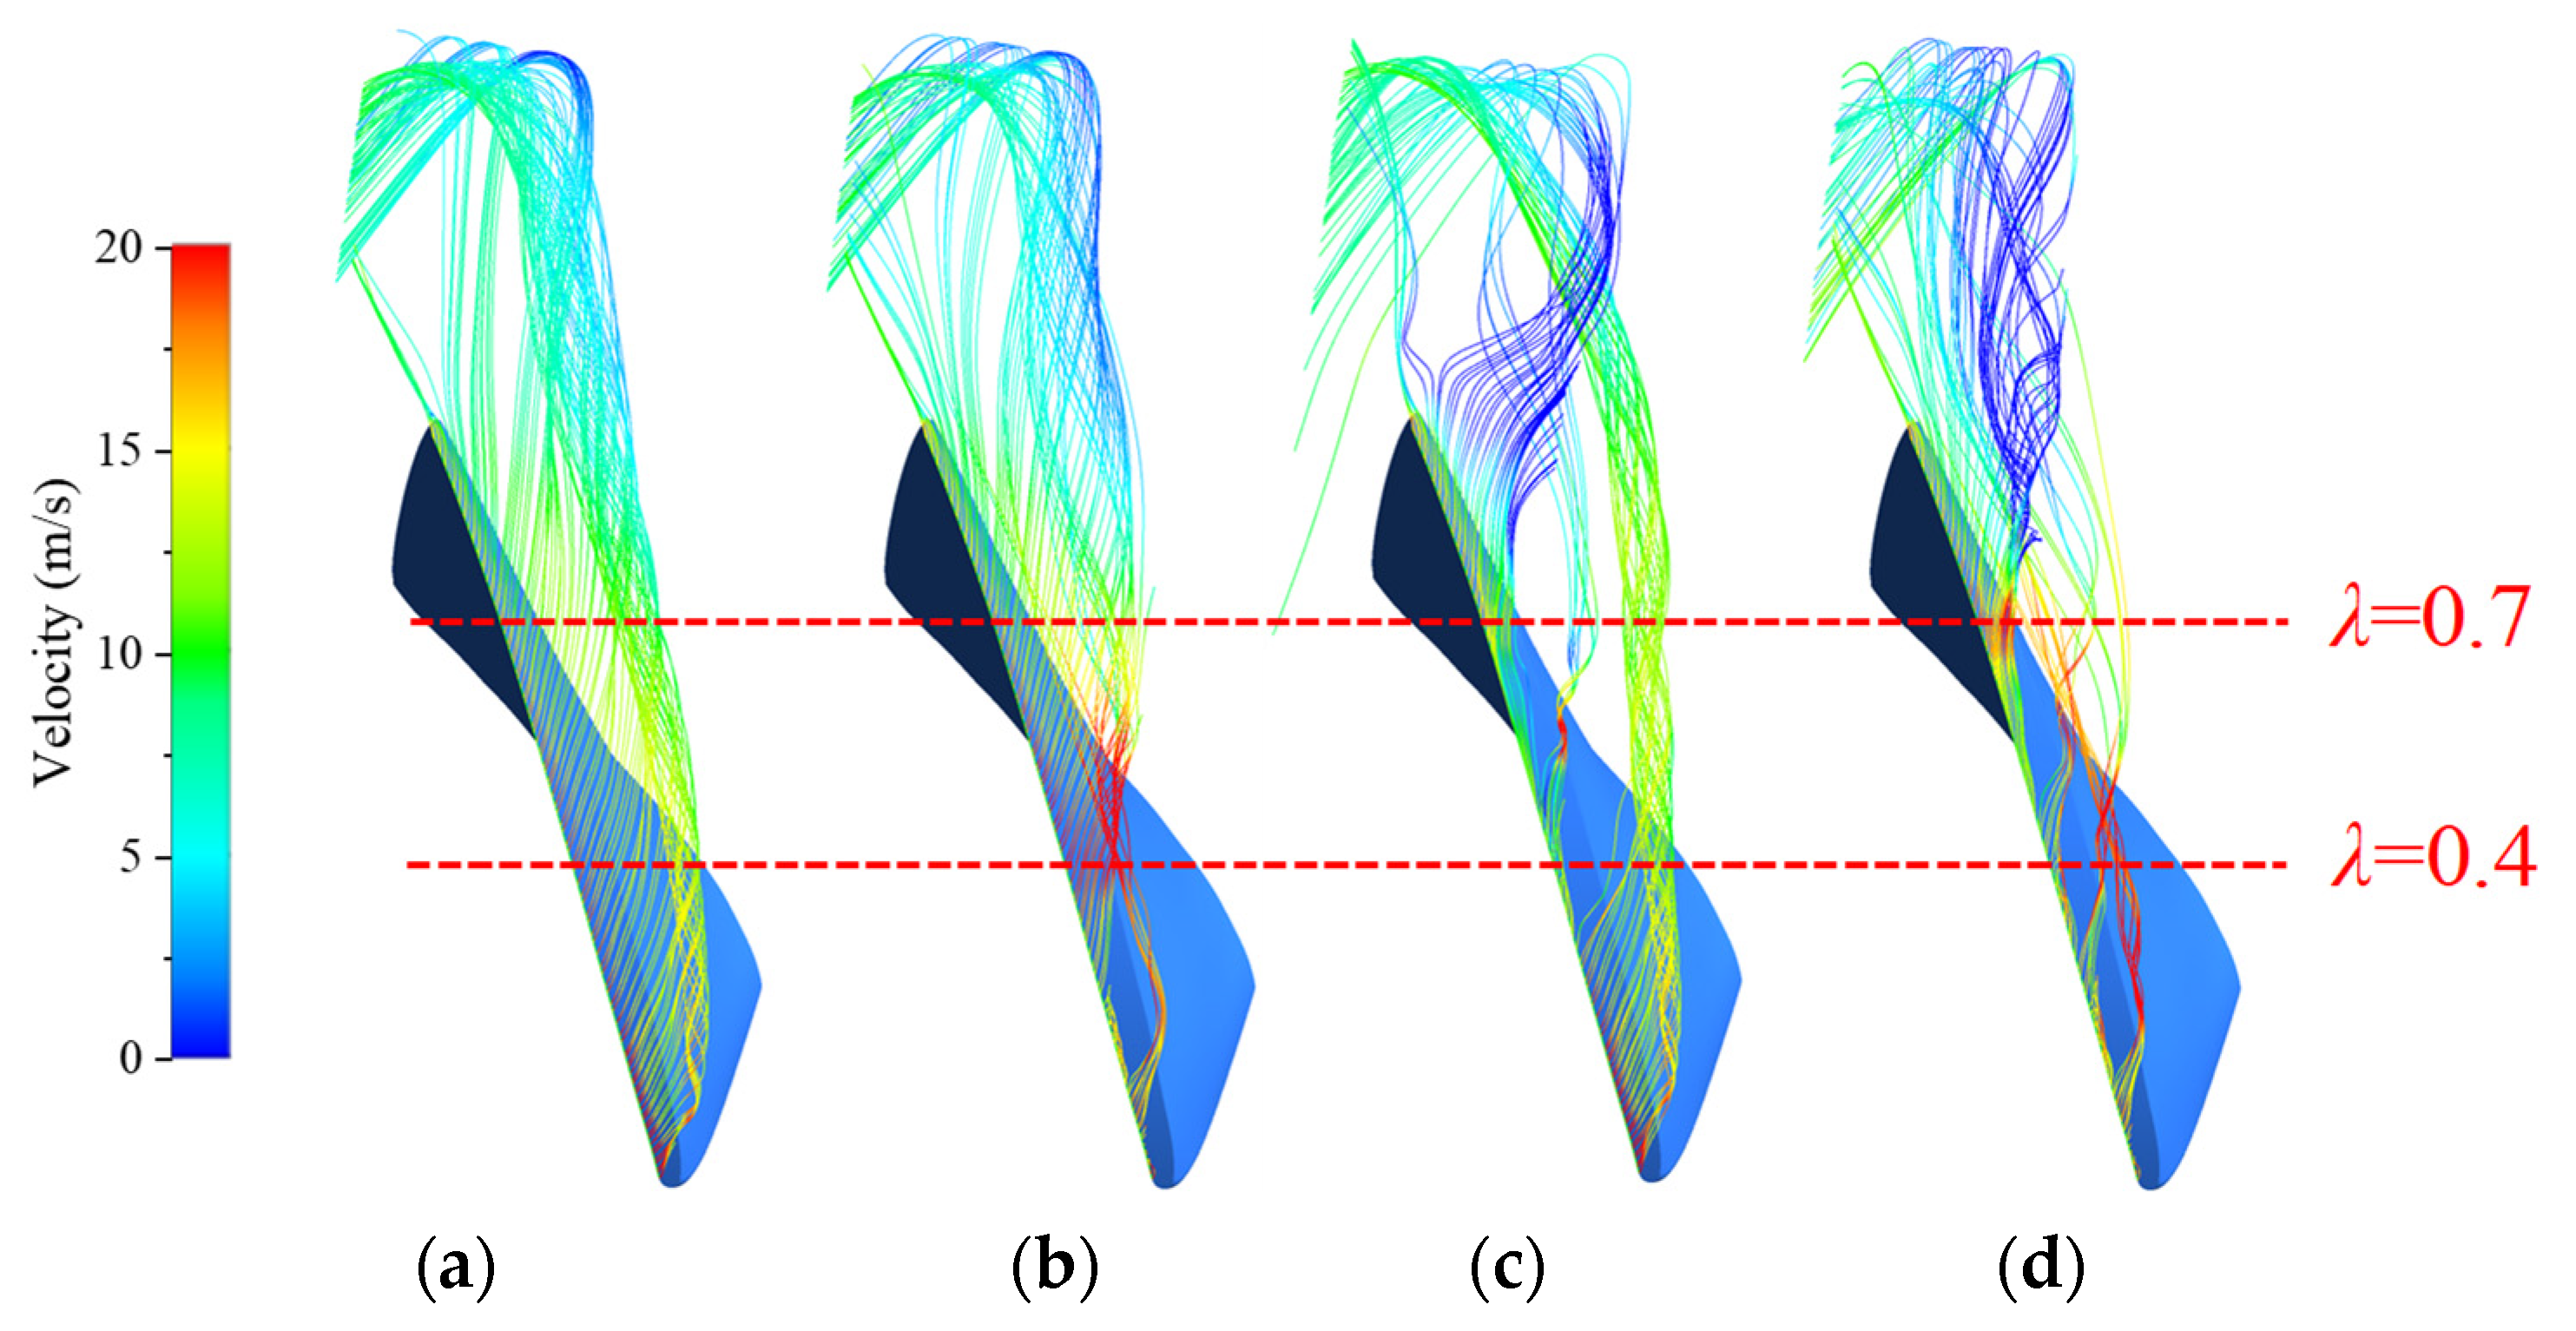
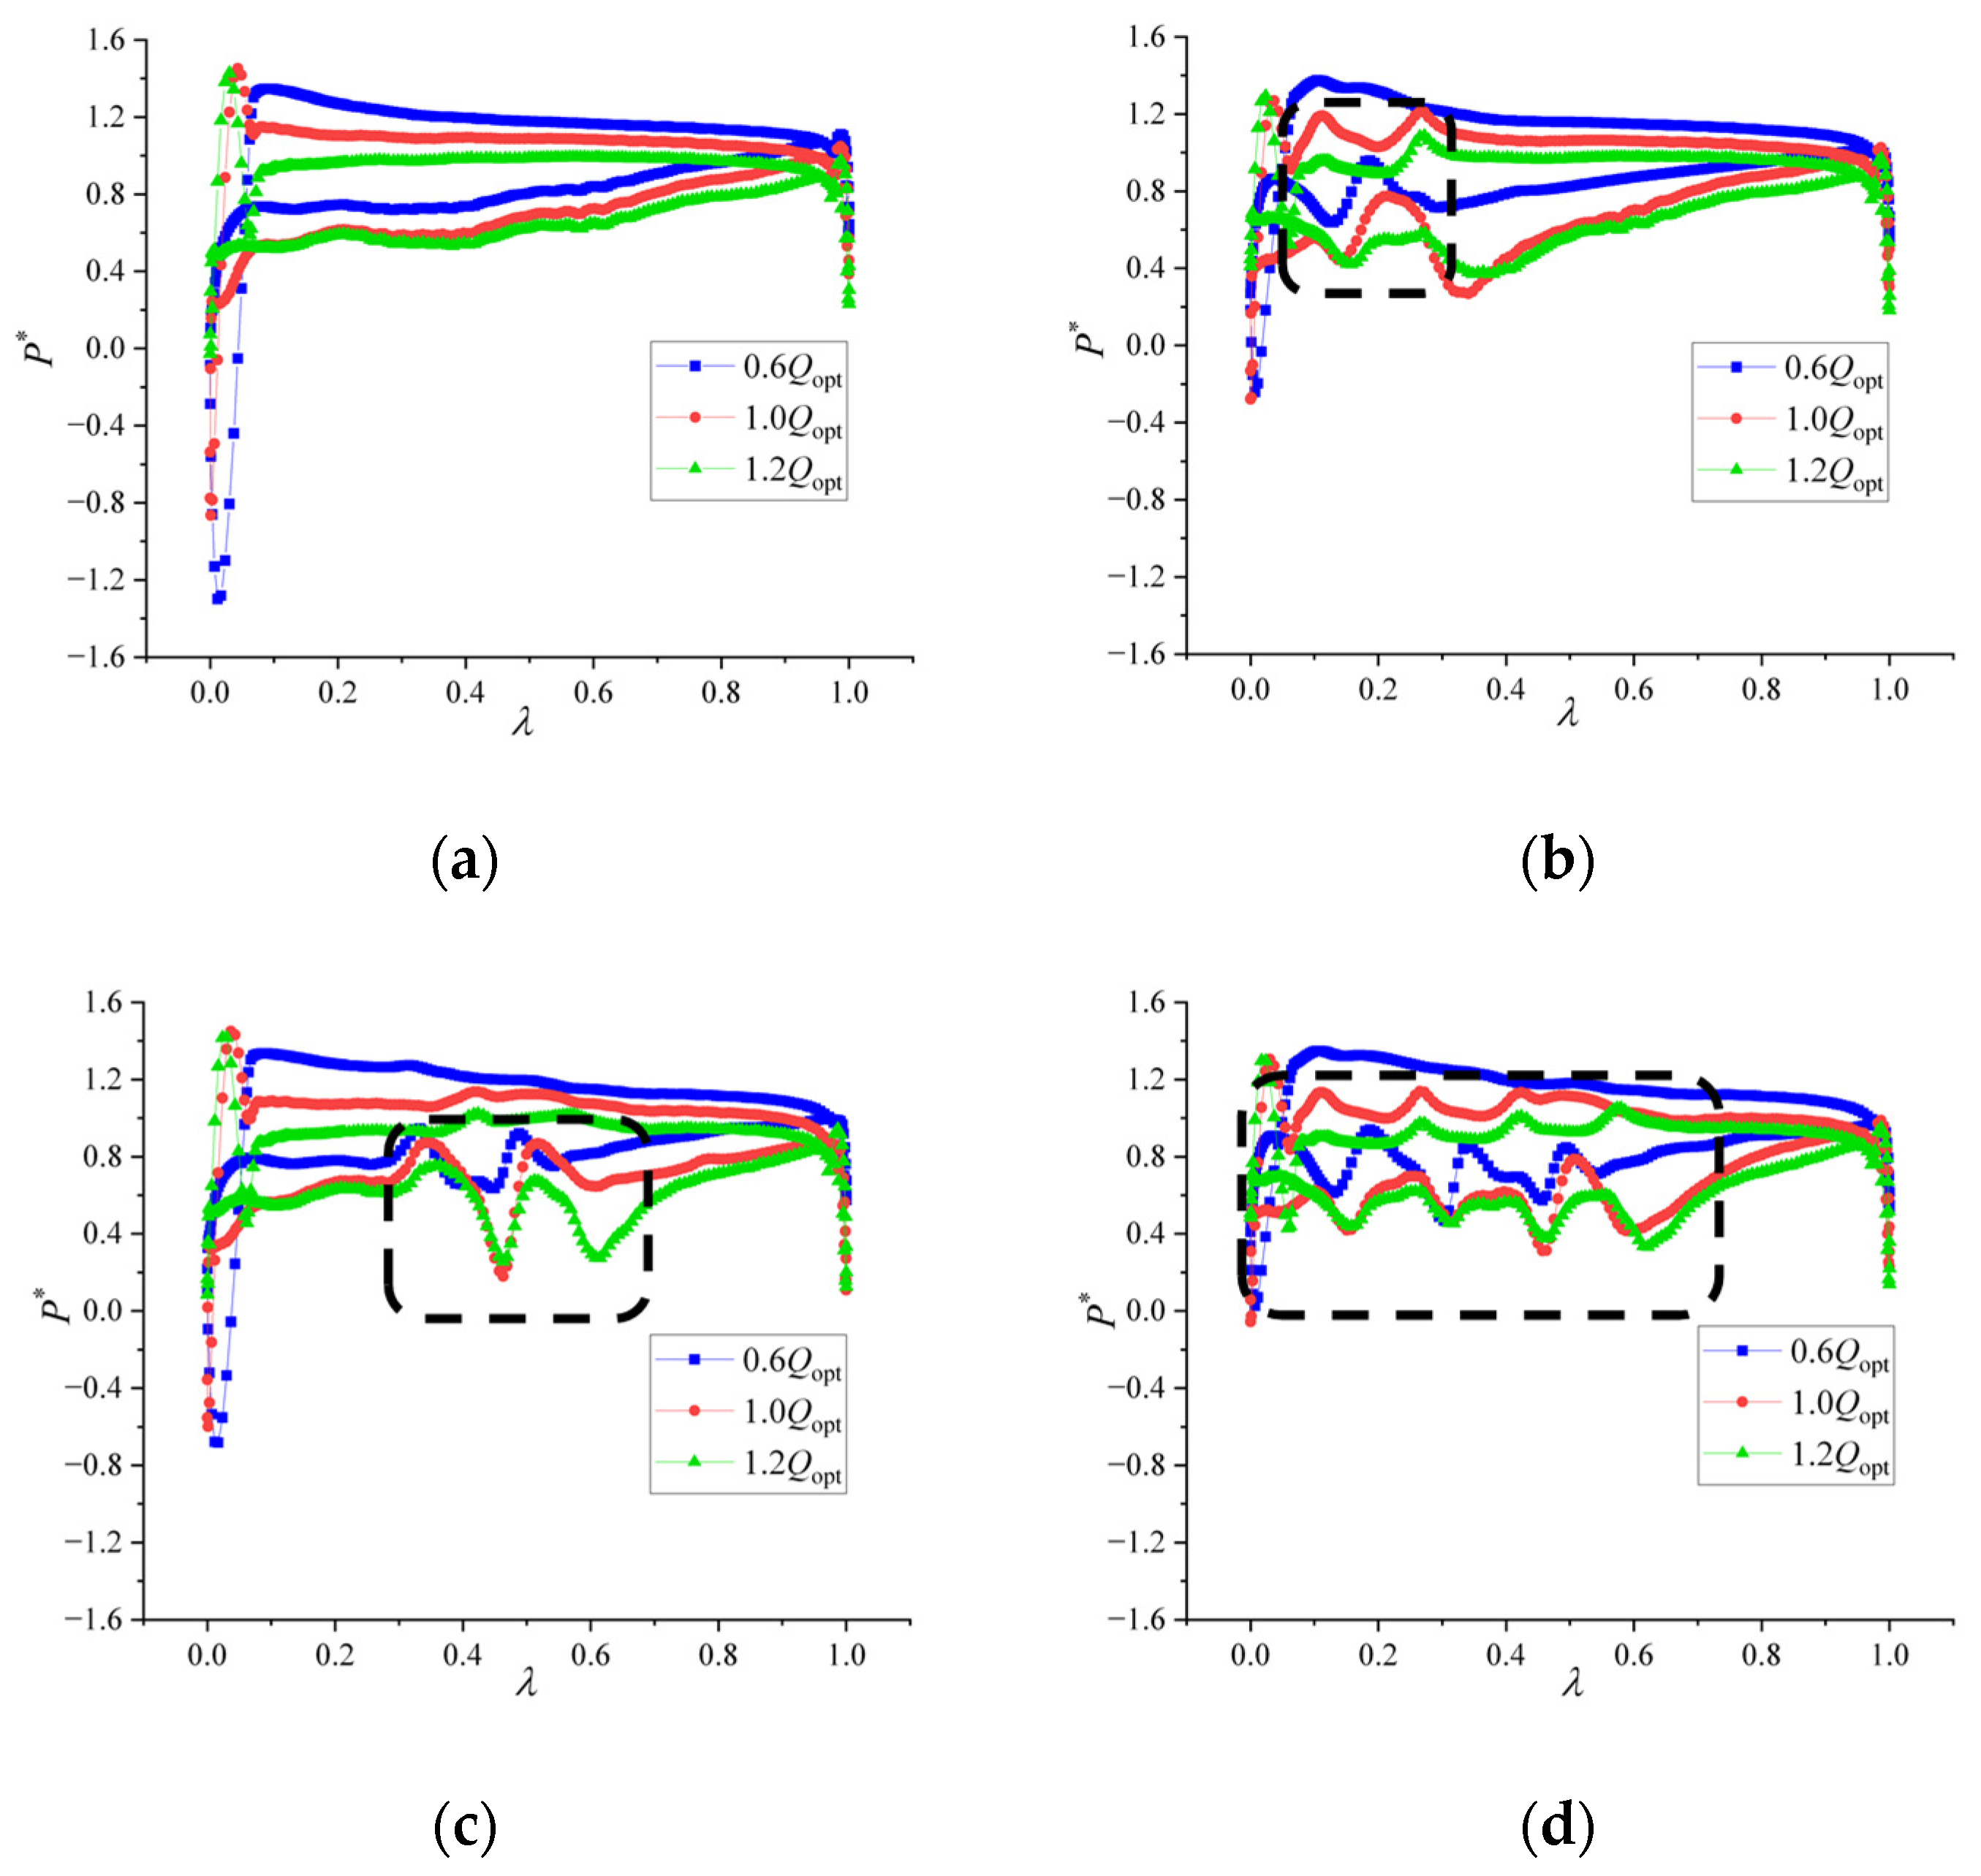
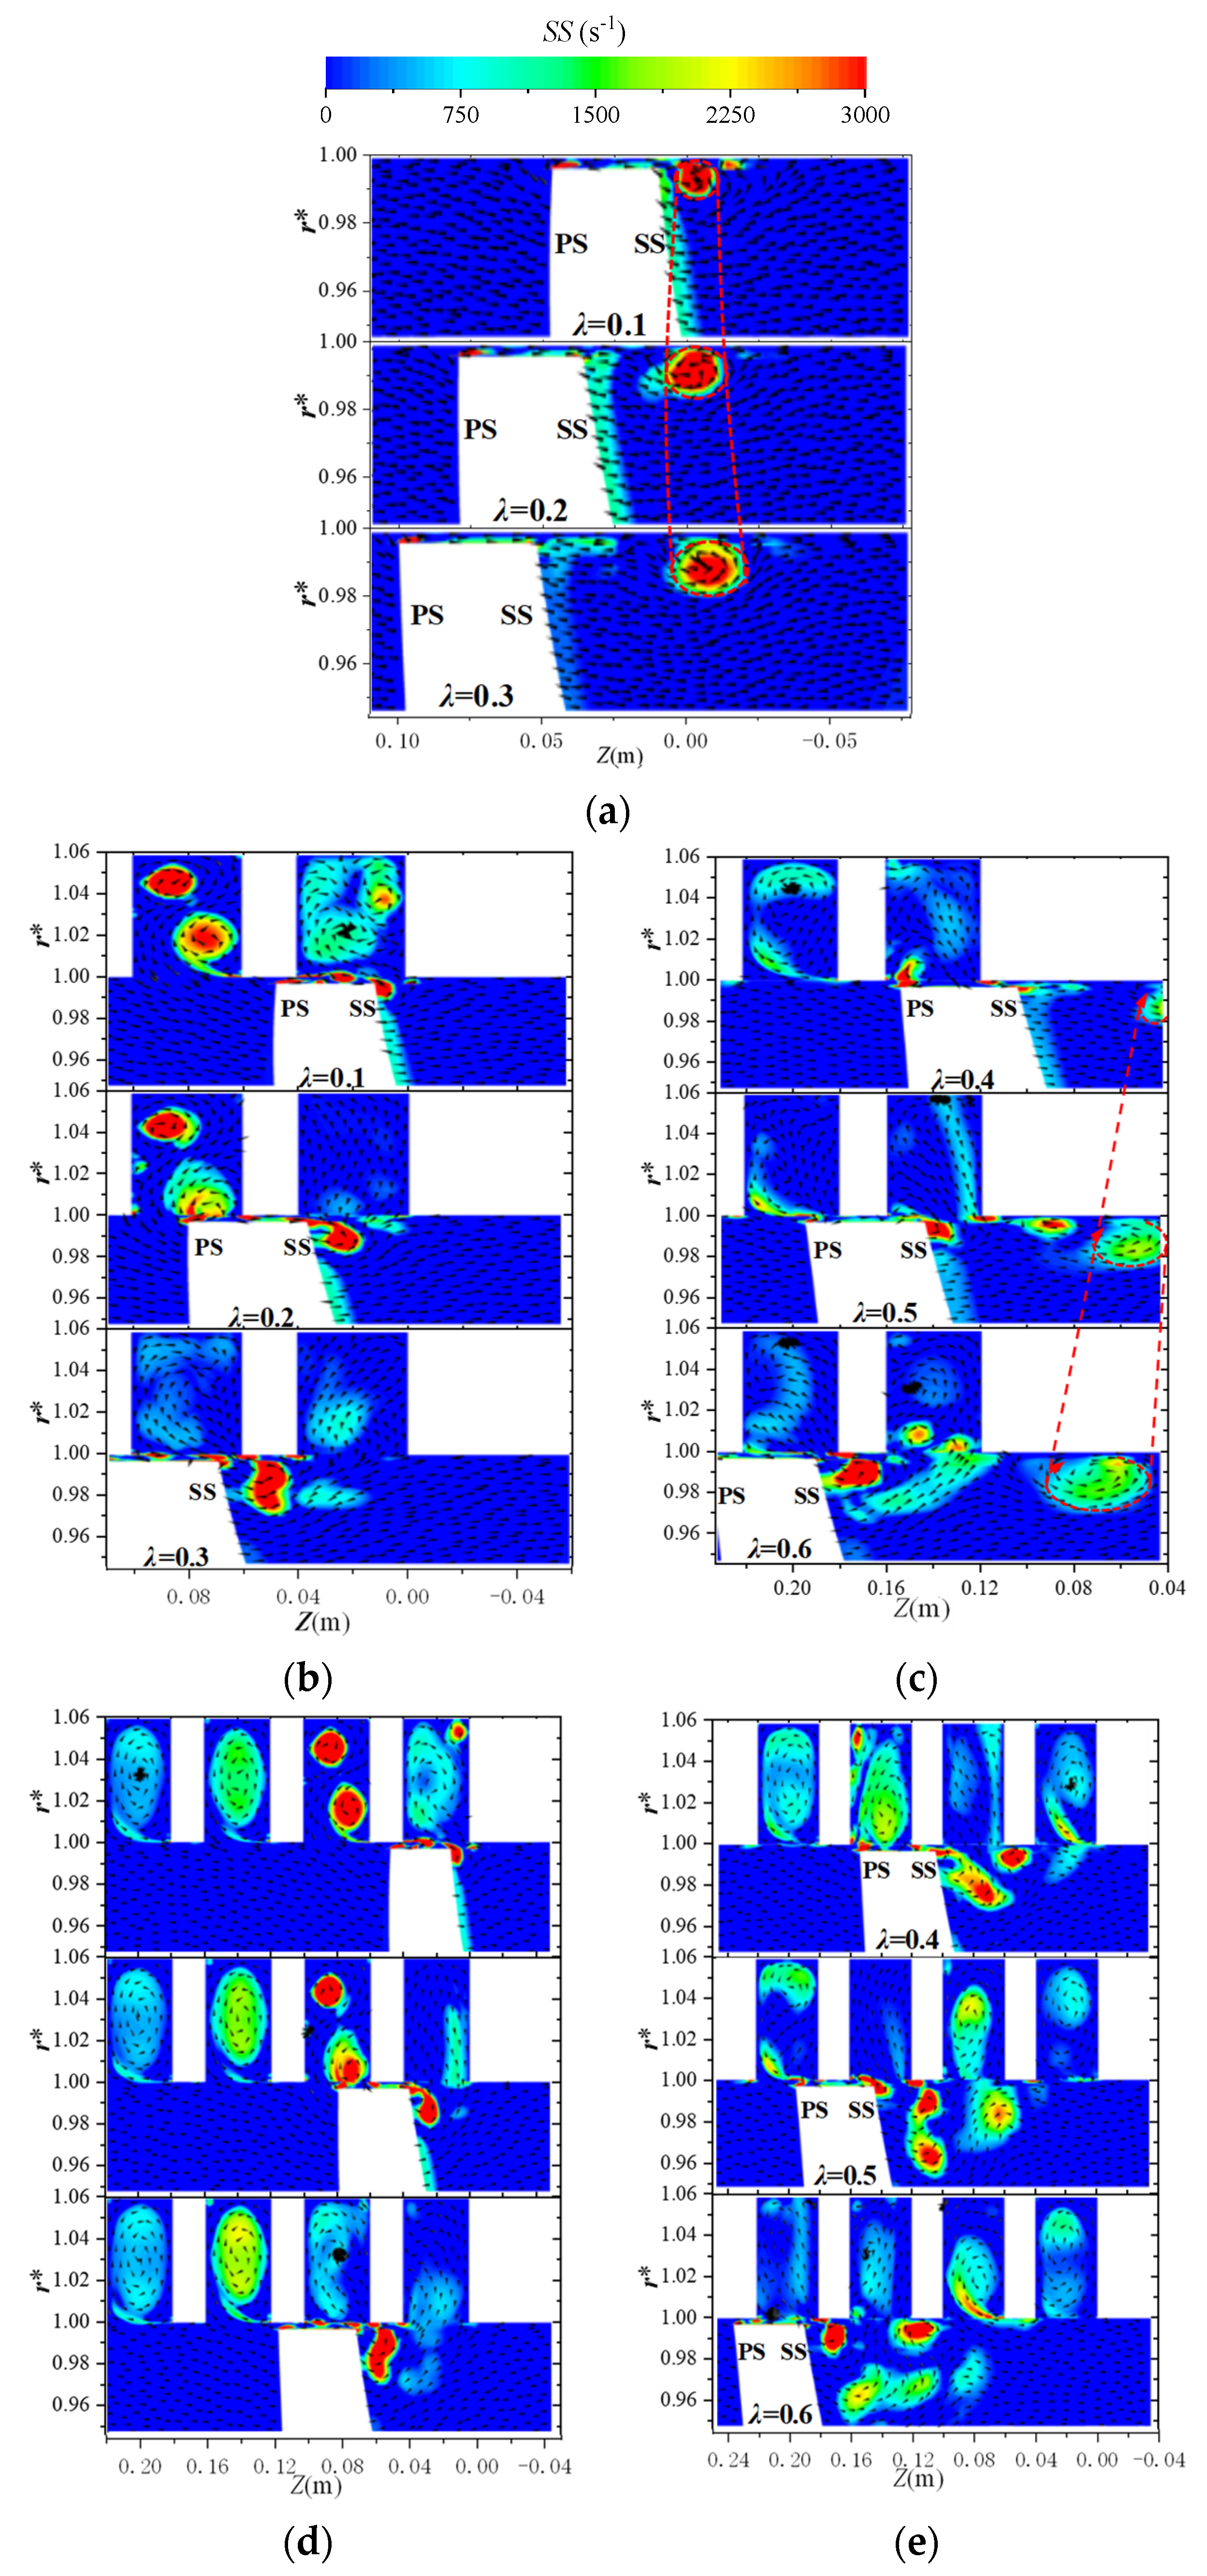
In Case A, the G1 and G2 primarily influenced the blade tip leading edge region (λ = 0.0–0.4), altering the initial position of the TLV. In Case B, G3 and G4 mainly interfered with the secondary leakage flow in the mid-to-rear portion of the blade tip (λ = 0.3–0.7), without affecting the TLV inception at the leading edge. In Case C, G1–G4 collectively modified the tip leakage flow (λ = 0.0–0.7). Although tip leakage flow still occurred subsequently, its velocity was significantly reduced, resulting in weaker TLV formation that rapidly dissipated within the flow passage.
(3)
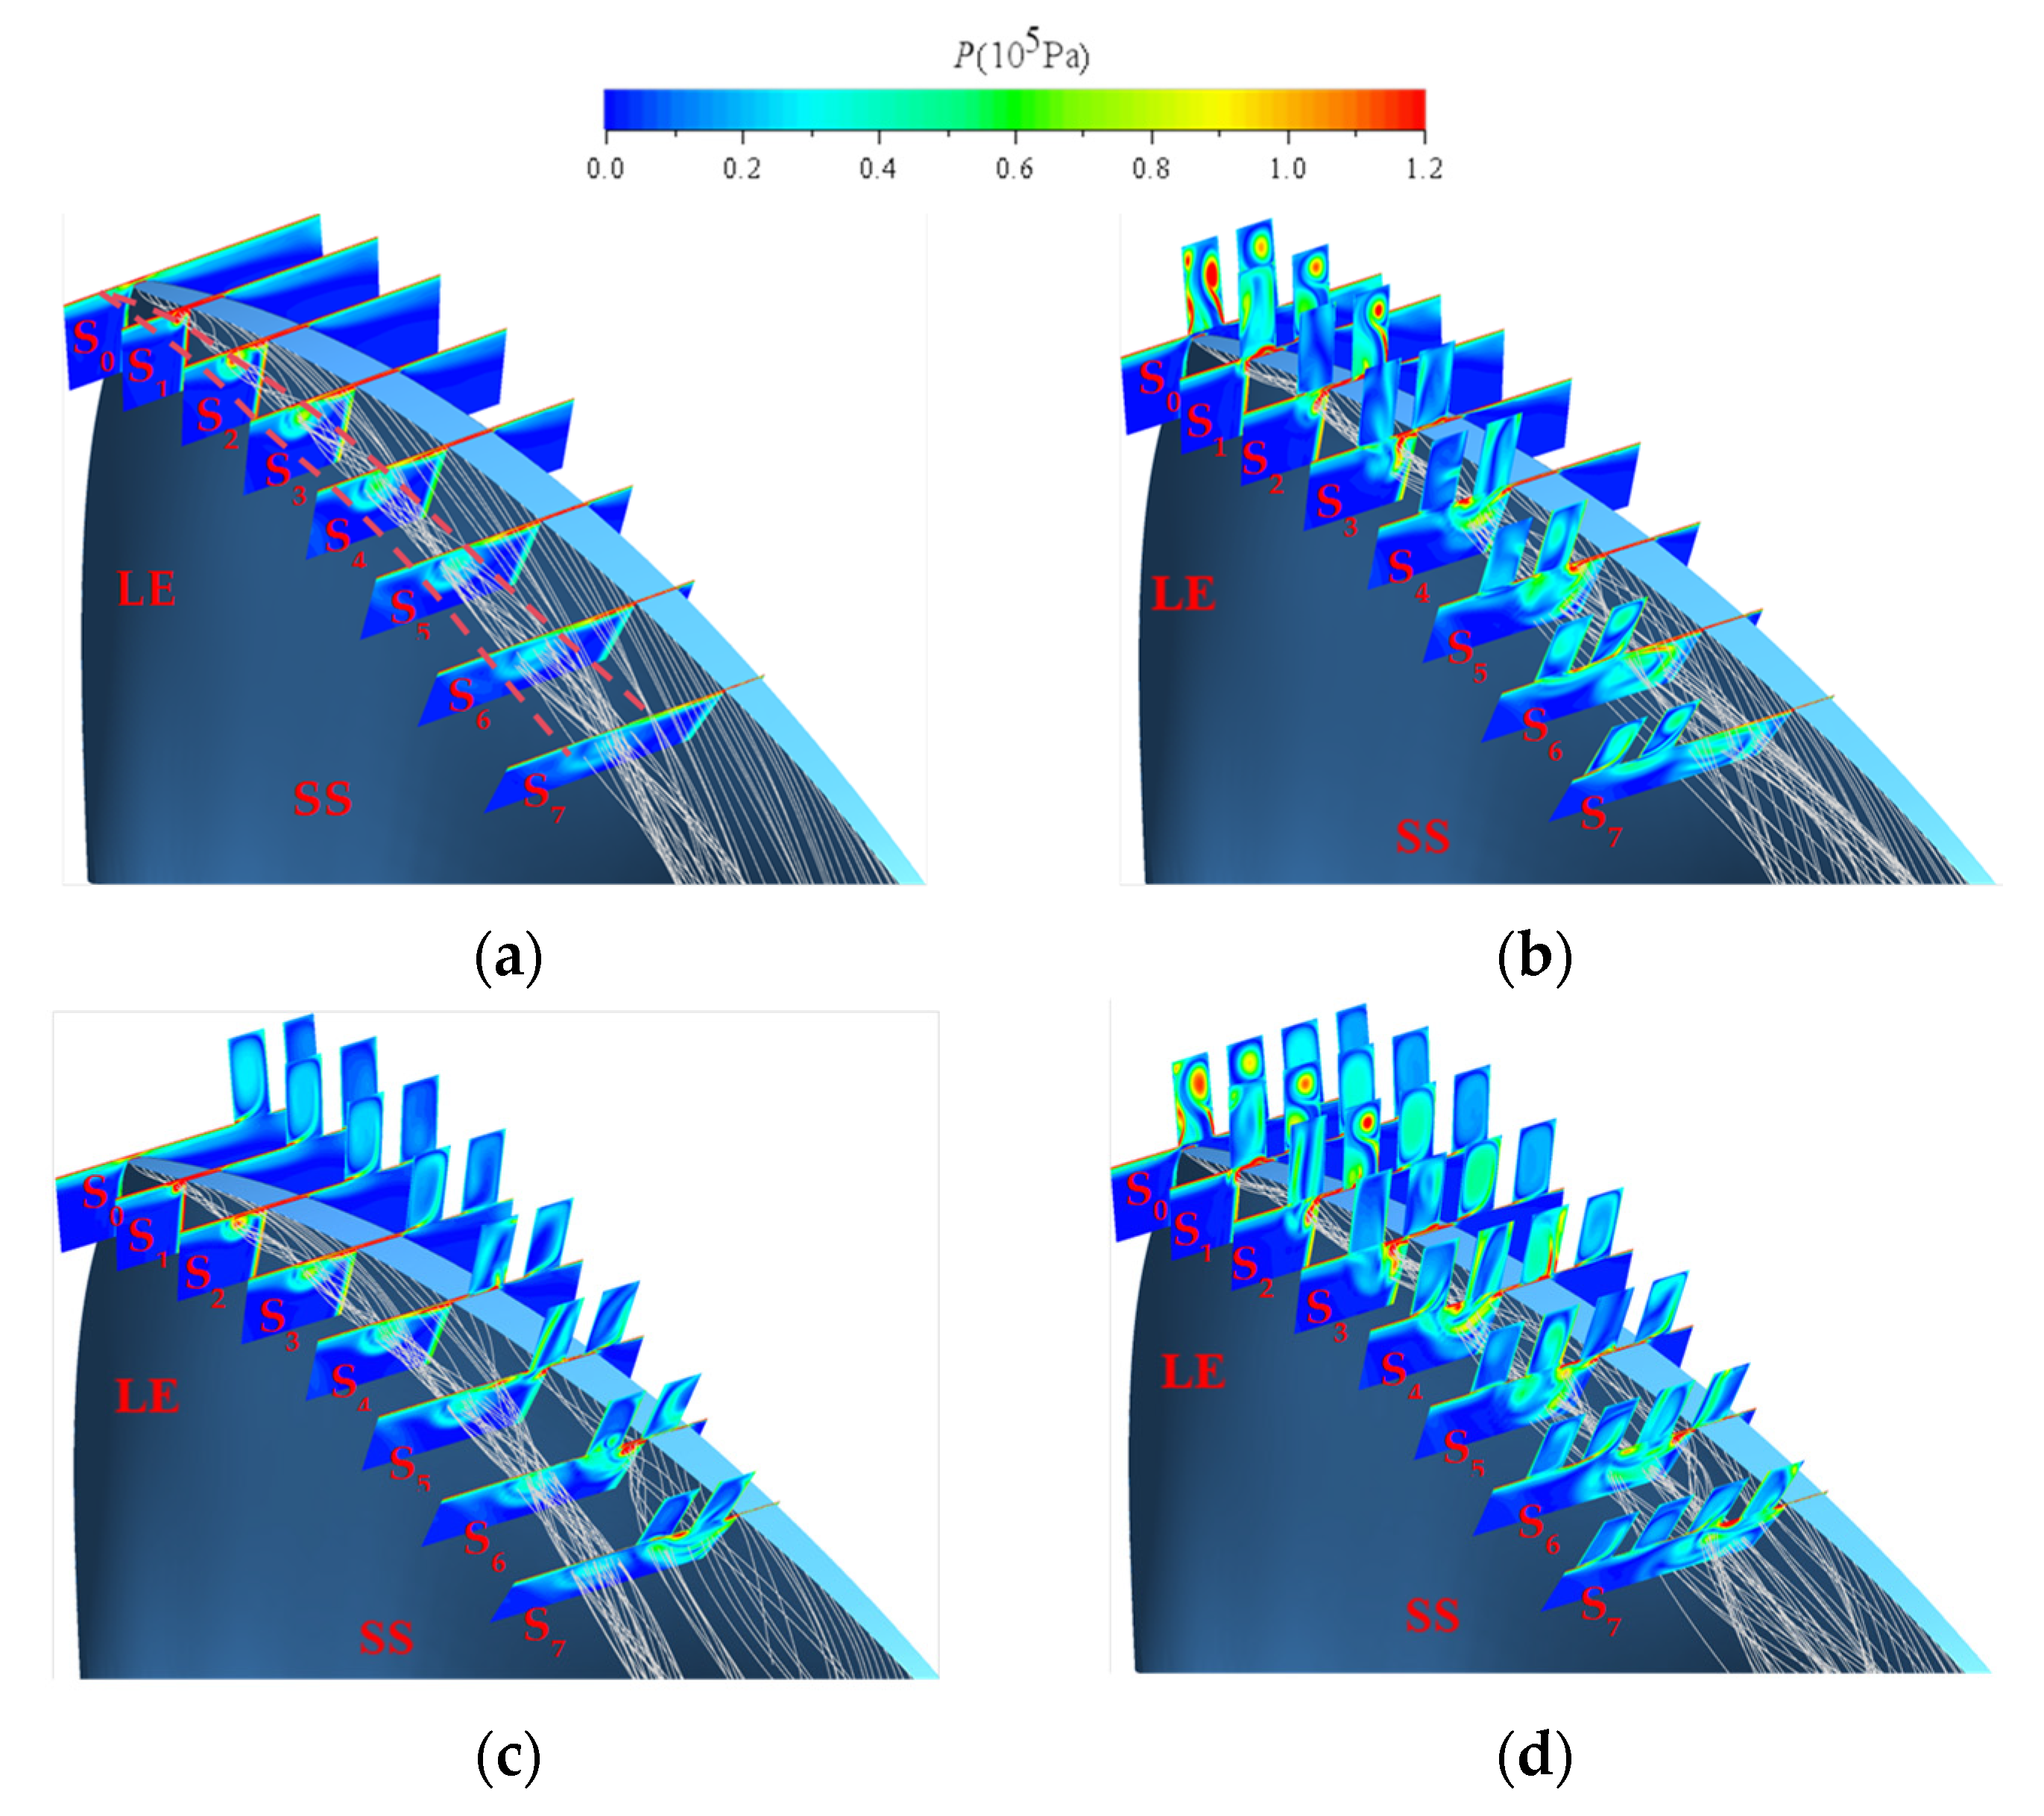
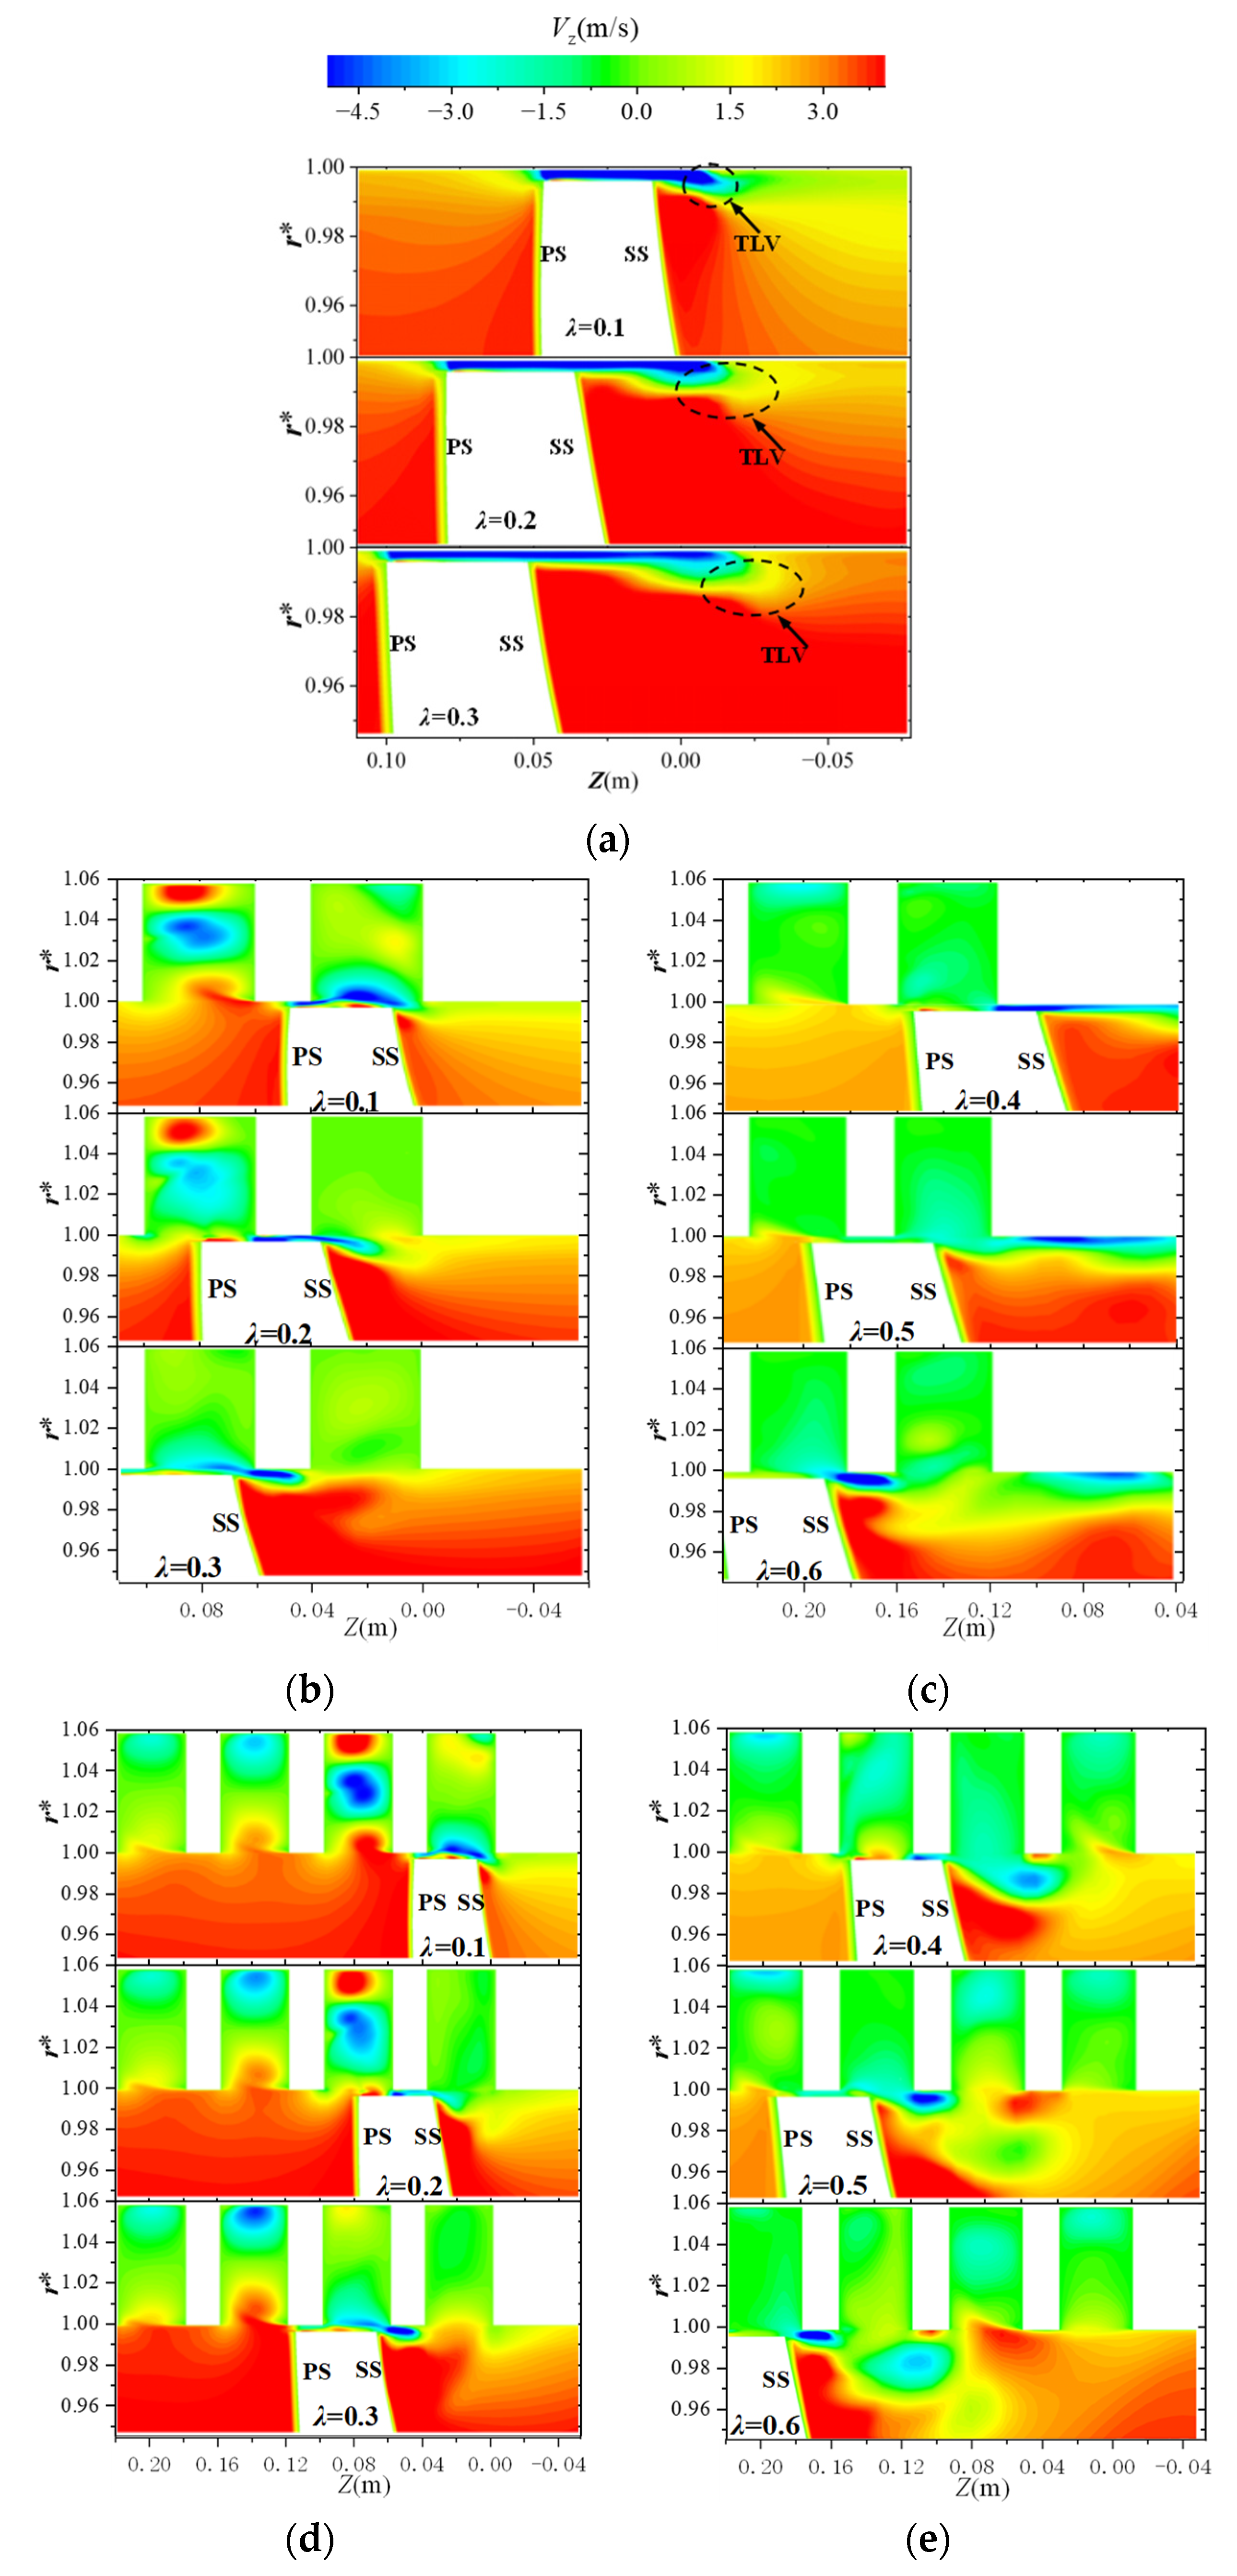
An in-depth look at the flow dynamics at the blade tip across diverse situations shows that the grooves situated near the leading edge of the blade tip within the runner cavity play a key role in affecting both the tip leakage flow and the main stream’s entrainment process. The formation of the TLV is effectively quelled, thanks to the close proximity of the vortex and the low-pressure zone to the blade’s edge. This setup minimizes the vortex’s interference with the flow through the passage. The presence of grooving in the middle-to-rear portion of the blade tip introduces a degree of interference with the tip leakage flow, simultaneously contributing to flow instability within the tip region.

Author Contributions

Conceptualization, H.W., D.Z. and X.S.; Methodology, H.W.; Software, H.W.; Formal analysis, H.W. and X.S.; Resources, D.Z.; Data curation, X.S., C.N. and G.Y.; Writing—original draft, H.W.; Writing—review & editing, H.W.; Supervision, D.Z. and X.S.; Project administration, D.Z. and X.S. All authors have read and agreed to the published version of the manuscript.

Funding

This research was funded by the National Natural Science Foundation of China, grant numbers 52425903 and 52409117; the Jiangsu Province Science Foundation for Youths, grant number BK20230540; and the Natural Science Foundation of the Jiangsu Higher Education Institutions of China, grant number 23KJB570001.

Data Availability Statement

The original contributions presented in this study are included in the article. Further inquiries can be directed to the corresponding author.

Conflicts of Interest

The authors declare no conflict of interest.

Nomenclature

Symbols
D1Diameter of inlet pipe (m)
ZNumber of impeller blades
D2Diameter of impeller (m)
ZdNumber of diffuser blades
nDesign rotating speed
QoptDesign flow rate (m3/s)
HDelivery head (m)
τTip clearance (m)
vzAxial velocity (m/s)
rRadius (m)
y+Non-dimensional distance from the wall
Abbreviations
TLVTip leakage vortex
SSPCVSuction-side-perpendicular cavitating vortices

References

  1. Luo, X.; Ji, B.; Tsujimoto, Y. A review of cavitation in hydraulic machinery. J. Hydrodyn. 2016, 28, 335–358. [Google Scholar] [CrossRef]
  2. Zhang, R.; Chen, H. Numerical analysis of cavitation within slanted axial-flow pump. J. Hydrodyn. 2013, 25, 663–672. [Google Scholar] [CrossRef]
  3. Fei, Z.; Zhang, R.; Xu, H.; Feng, J.; Mu, T.; Chen, Y. Energy performance and flow characteristics of a slanted axial-flow pump under cavitation conditions. Phys. Fluids 2022, 34, 035121. [Google Scholar] [CrossRef]
  4. Wu, H.; Tan, D.; Miorini, R.L. Three-dimensional flow structures and associated turbulence in the tip region of a water jet pump rotor blade. Exp. Fluids 2011, 51, 1721–1737. [Google Scholar] [CrossRef]
  5. Miorini, R.L.; Tan, D.; Wu, H. Three-Dimensional Structure and Turbulence Within the Tip Leakage Vortex of an Axial Water jet Pump. In Proceedings of the ASME-JSME-KSME Joint Fluids Engineering Conference, Hamamatsu, Japan, 24–29 July 2011; pp. 271–281. [Google Scholar]
  6. Liu, Y.; Tan, L. Spatial-Temporal Evolution of Tip Leakage Vortex in a Mixed-Flow Pump with Tip Clearance. J. Fluids Eng. 2019, 141, 081–302. [Google Scholar] [CrossRef]
  7. Choi, M. Effects of Circumferential Casing Grooves on the Performance of a Transonic Axial Compressor. Int. J. Turbo Jet-Engines 2015, 32, 361. [Google Scholar] [CrossRef]
  8. Huang, Y.; Zhang, D.; Li, Y. Numerical investigations of the vortex suppression in the tip leakage flow of a hydrofoil via bionic geometries. In Proceedings of the Thirty-First National Symposium Hydrodynamics, Xiamen, China, 31 October–2 November 2020; p. 6. [Google Scholar]
  9. Wang, L.; Luo, X.; Feng, J. Method of bionic wavy tip on vortex and cavitation suppression of a hydrofoil in tidal energy. Ocean. Eng. 2023, 278, 114–499. [Google Scholar] [CrossRef]
  10. Huang, Y.; Zhang, D.; Wang, F. Vortex suppression of the tip leakage flow over a NACA0009 hydrofoil via a passive jet induced by the double-control-hole. Ocean. Eng. 2021, 237, 109–647. [Google Scholar] [CrossRef]
  11. Wang, G.; Chu, W.; Zhang, H.; Guo, Z. Parametric study on active flow control of a transonic axial compressor rotor using endwall synthetic jet. Proc. Inst. Mech. Eng. Part G J. Aerosp. Eng. 2022, 236, 2031–2043. [Google Scholar] [CrossRef]
  12. Taghavi, Z.; Behbahani, M. Improvement of aerodynamic performance of a low speed axial compressor rotor blade row through air injection. Aerosp. Sci. Technol. 2018, 72, 409–417. [Google Scholar] [CrossRef]
  13. Geng, S.; Zhang, H.; Chen, J.; Huang, W. Numerical study on the response of tip leakage flow unsteadiness to micro tip injection in a low- speed isolated compressor rotor. In Proceedings of the ASME Turbo Expo 2007: Power for Land, Sea, and Air, ASME 2007-GT-27729, Montreal, QC, Canada, 4–7 June 2007. [Google Scholar]
  14. Wilke, I.; Kau, H.-P. A numerical investigation of the influence of casing treatments on the tip leakage flow in a HPC front stage. In Proceedings of the ASME Turbo Expo: Power for Land, Sea, and Air, Amsterdam, The Netherlands, 3–6 June 2002; pp. 1155–1165. [Google Scholar]
  15. Khaleghi, H. Effect of discrete endwall recirculation on the stability of a high-speed compressor rotor. Aerosp. Sci. Technol. 2014, 37, 130–137. [Google Scholar] [CrossRef]
  16. Hwang, Y.; Kang, S. Numerical study on the effects of casing treatment on unsteadiness of tip leakage flow in an axial compressor. In Proceedings of the ASME Turbo Expo 2012: Turbine Technical Conference and Exposition, Copenhagen, Denmark, 11–15 June 2012; American Society of Mechanical Engineers: New York, NY, USA, 2012; Volume 44748, pp. 2501–2511. [Google Scholar]
  17. Kurokawa, J. J-groove technique for suppressing various anomalous flow phenomena in turbomachines. Int. J. Fluid Mach. Syst. 2011, 4, 1–13. [Google Scholar] [CrossRef]
  18. Goltz, I.; Kosyna, G.; Stark, U.; Saathoff, H.; Bross, S. Stall inception phenomena in a single-stage axial-flow pump. J. Power Energy 2003, 217, 471–479. [Google Scholar] [CrossRef]
  19. Goltz, I.; Kosyna, G.; Delgado, A. Eliminating the head instability of an axial-flow pump using axial grooves. Proc. Inst. Mech. Eng. Part A J. Power Energy 2012, 227, 206–215. [Google Scholar] [CrossRef]
  20. Zhou, X.; Zhao, Q.; Cui, W.; Xu, J. Investigation on axial effect of slot casing treatment in a transonic compressor. Appl. Therm. Eng. 2017, 126, 53–69. [Google Scholar] [CrossRef]
  21. Taghavi-Zenouz, R.; Abbasi, S. Alleviation of spike stall in axial compressors utilizing grooved casing treatment. Chin. J. Aeronaut. 2015, 123, 649–658. [Google Scholar] [CrossRef]
  22. Menter, F.R. Two-equation eddy-viscosity turbulence models for engineering applications. J. Sci. Comput. 1986, 1, 3–51. [Google Scholar] [CrossRef]
  23. Qian, Z.; Wu, P.; Guo, Z.; Huai, W. Numerical simulation of air entrainment and suppression in pump sump. Sci. China Technol. Sci. 2016, 59, 1847–1855. [Google Scholar] [CrossRef]
  24. Shen, X.; Zhang, D.; Xu, B.; Jin, Y.; Shi, W. Experimental investigation of the transient patterns and pressure evolution of tip leakage vortex and induced-vortices cavitation in an axial flow pump. J. Fluids Eng. 2020, 142, 101–206. [Google Scholar]
  25. Kan, K.; Li, H.; Chen, H.; Gong, Y.; Li, T.; Shen, L. Effects of Clearance and Operating Conditions on Tip Leakage Vortex-Induced Energy Loss in an Axial-Flow Pump Using Entropy Production Method. Fluids Eng. 2023, 145, 031201. [Google Scholar] [CrossRef]
  26. Muller, M.W.; Schiffer, H.-P.; Hah, C. Effect of Circumferential Grooves on the Aerodynamic Performance of an Axial Single-Stage Transonic Compressor. In Proceedings of the ASME Turbo Expo: Power for Land, Sea, & Air, ASME GT2007-27365, Montreal, QC, Canada, 14–17 May 2007. [Google Scholar]
  27. Houghton, T.; Day, I. Stability enhancement by casing grooves: The importance of stall inception mechanism and solidity. J. Turbomach. 2012, 134, 021003. [Google Scholar] [CrossRef]
  28. Straka, W.A.; Farrell, K.J. The effect of spatial wandering on experimental laser velocimeter measurements of the end-wall vortices in an axial-flow pump. Exp. Fluids 1992, 13, 163–170. [Google Scholar] [CrossRef]
  29. Zhang, H.; Zang, J.; Zhang, D.; Shi, W.; Shen, J. Analysis of the formation mechanism of secondary tip leakage vortex (S-TLV) in an axial flow pump. Machines 2022, 10, 41. [Google Scholar] [CrossRef]
  30. Shen, X.; Zhang, D.; Xu, B.; Wu, H.; Wang, P.; Shi, W. Comparative study of tip leakage vortex trajectory and cavitation in an axial flow pump with various tip clearances. J. Mech. Sci. Technol. 2022, 36, 1289–1302. [Google Scholar] [CrossRef]
  31. Zhang, D.; Shi, L.; Shi, W.; Zhao, R.; Wang, H.; van Esch, B.P.M. Numerical analysis of unsteady tip leakage vortex cavitation cloud and unstable suction-side-perpendicular cavitating vortices in an axial flow pump. Int. J. Multiph. Flow 2015, 77, 244–259. [Google Scholar] [CrossRef]
  32. Shen, X.; Zhao, X.; Xu, B.; Zhang, D.; Yang, G.; Shi, W.; van Esch, B.P.M. Unsteady characteristics of tip leakage vortex structure and dynamics in an axial flow pump. Ocean. Eng. 2022, 266, 112–850. [Google Scholar] [CrossRef]
Figure 1. Computational domain of the axial flow pump.
Jmse 13 00972 g001
Figure 2. Grid generation of main computational domains.
Jmse 13 00972 g002
Figure 3. Results of the mesh independence analysis.
Jmse 13 00972 g003
Figure 4. Distributions of y+ on the blade surfaces and runner chamber wall: (a) pressure surface; (b) suction surface; (c) rotor chamber.
Jmse 13 00972 g004
Figure 5. Schematics of axial (mixed) flow pump test loop.
Jmse 13 00972 g005
Figure 6. High-speed photography.
Jmse 13 00972 g006
Figure 7. Analysis of performance curves from both numerical simulations and experimental outcomes.
Jmse 13 00972 g007
Figure 8. Comparison of numerically simulated TLV cloud cavitation patterns with experimental results under different operating states: (a) Q/Qopt = 0.8; (b)Q/Qopt = 1.0; (c) Q/Qopt = 1.2.
Jmse 13 00972 g008
Figure 9. Schematic diagram of blade tip circumference grooving case: (a) Axial position of circumferential grooves in the rotor chamber: (b) Case A; (c) Case B; (d) Case C.
Jmse 13 00972 g009
Figure 10. Performance curves of prototype pump and three grooving cases: (a) Q-H; (b) Q-η.
Jmse 13 00972 g010
Figure 11. Tip leakage flow trajectory with different grooves on the runner chamber wall: (a) Prototype pump; (b) Case A; (c) Case B; (d) Case C.
Jmse 13 00972 g011
Figure 12. Surface pressure distribution across various runner chamber groove cases: (a) Prototype pump; (b) Case A; (c) Case B; (d) Case C.
Jmse 13 00972 g012
Figure 13. Tip pressure distribution under different flow rates: (a) 1.2 Qopt; (b) 1.0 Qopt; (c) 0.6 Qopt.
Jmse 13 00972 g013
Figure 14. Distributions of the vorticity of different chord length sections at 1.0 Qopt condition: (a) Prototype pump; (b) Case A; (c) Case B; (d) Case C.
Jmse 13 00972 g014
Figure 15. Distributions of axial velocity in the tip region at different chord length sections: (a) Prototype pump: S1~S3; (b) Case A: S1~S3; (c) Case B: S4~S6; (d) Case C: S1~S3; (e) Case C: S4~S6.
Jmse 13 00972 g015
Figure 16. Distributions of pressure in the tip region at different chord length sections: (a) Prototype pump: S1~S3; (b) Case A: S1~S3; (c) Case B: S4~S6; (d) Case C: S1~S3; (e) Case C: S4~S6.
Jmse 13 00972 g016
Figure 17. Distributions of the swirling strength and the velocity vector at different chord length sections: (a) Prototype pump: S1~S3; (b) Case A: S1~S3; (c) Case B: S4~S6; (d) Case C: S1~S3; (e) Case C: S4~S6.
Jmse 13 00972 g017
Table 1. Main design parameters of the model pump.
Main ParametersValues
Inlet diameter D1201 mm
Number of impeller blades Z3
Impeller diameter D2200 mm
Number of diffuser blades Zd7
Design rotating speed n1450 r/min
Design flow rate Qopt365 m3/h
Design head H3.02 m
Tip clearance τ0.5 mm
Blade height h54.5 mm
Table 2. Main parameters in these equations.
ParametersValues
β * 0.09
a10.31
α15/9
α20.44
β13/40
β20.0828
σ10.85
σω10.85
σk21
σω21
Disclaimer/Publisher’s Note: The statements, opinions and data contained in all publications are solely those of the individual author(s) and contributor(s) and not of MDPI and/or the editor(s). MDPI and/or the editor(s) disclaim responsibility for any injury to people or property resulting from any ideas, methods, instructions or products referred to in the content.

