Article

Hydrodynamic Analysis of Combined Offshore Wind Turbine and Net Cage Under Finite-Depth Waves

1
Key Laboratory of Far-Shore Wind Power Technology of Zhejiang Province, Hangzhou 311122, China
2
Power China Huadong Engineering Corporation Limited, Hangzhou 311122, China
3
Navigation College, Dalian Maritime University, Dalian 116026, China
4
State Key Laboratory of Coastal and Offshore Engineering, Dalian University of Technology, Dalian 116024, China
*
Author to whom correspondence should be addressed.
J. Mar. Sci. Eng. 2025, 13(5), 924; https://doi.org/10.3390/jmse13050924
Submission received: 21 March 2025 / Revised: 28 April 2025 / Accepted: 29 April 2025 / Published: 8 May 2025
(This article belongs to the Section Ocean Engineering)

Abstract

:
Offshore wind turbines are subjected to long-term wave loads, which shorten their service life. Marine aquaculture cages are common structures in the ocean engineering field. Therefore, investigating the hydrodynamic characteristics of combined wind turbine and cage facilities under wave loads is crucial. This study employs a porous medium model to analyze the hydrodynamic behavior of a fixed wind turbine base integrated with cages under finite-depth wave conditions. First, the transmission coefficients of waves passing through cages at different positions were examined under varying cage solidity conditions. The results indicate that the cages minimally affect wave height in regions close to the cage group. Subsequently, the wave forces acting on the fixed wind turbine base behind the cages were analyzed under different solidity and wave height conditions. The variation curves of the drag coefficient and inertia coefficient were obtained for solidity values ranging from 0.3 to 0.6 and Keulegan–Carpenter (KC) numbers between 1 and 4.

1. Introduction

Wave action on offshore pile-supported wind turbines is a common ocean environmental dynamic load. Reducing wave loads on offshore wind turbines has been a research focus for scholars worldwide. China’s offshore aquaculture net cage industry currently features low intensification and scattered small-scale operations. With the increasing application of deep-water aquaculture net cages and offshore wind turbines, and the national emphasis on integrating marine economic development with ecological protection, offshore wind power projects urgently need to seek complementary advantages and integration with marine ranching and deep-sea aquaculture. More researchers are focusing on studying combined structures of offshore wind turbines and aquaculture net cages. This integration can improve production efficiency by leveraging wind turbines for reliable mooring support and net cages for wave damping and dissipation. Combined wind turbine and net cage systems enhance management and comprehensive benefits [1].
China’s deep-sea aquaculture has developed over nearly 40 years, establishing a diversified technological system. In terms of equipment development, domestically developed systems such as the bottom-sitting ‘Changjing No. 1’ (130 m in circumference), the semi-submersible ‘Dehai No. 1’ (designed to withstand typhoons), and the fully submersible ‘Deep Blue No. 1’ (for aquaculture in the Yellow Sea cold water mass) have achieved breakthroughs, with single-cage aquaculture water volume exceeding 70,000 cubic meters and an operating depth of up to 60 m. High-density polyethylene (HDPE) gravity cages account for over 95% of the market [2,3]. Copper alloy netting has become a recent research focus due to its superior anti-biofouling properties compared to traditional polymers, as biofouling can increase resistance by 30–50% [4,5]. In contrast, countries in Europe, the United States, and Japan have entered the industrialization stage. Norway’s ‘Ocean Farm 1’ (250,000 cubic meters of water volume) and the ‘Jostein Albert’ aquaculture vessel (400,000 cubic meters of water volume) employ truss structures and external turret mooring systems, capable of withstanding Category 12 typhoons, and integrate AI algorithms for fully automated feeding [6,7,8,9]. The European Union has established standards covering structural design and environmental assessment, while the global cage database established by the Norwegian University of Science and Technology provides important references for the industry [10,11]. In the fields of hydrodynamics and intelligent management, domestic scholars have proposed a quasi-static analysis model, significantly improving the efficiency of fatigue life prediction through the virtual displacement principle and fluid mechanics screen model. It has been found that water flow velocity significantly affects fatigue life [12,13,14,15]. Experimental studies show that biofouling increases the drag coefficient of cages by 3.3–7.7 times and the inertial coefficient by 5.0–10.8 times, with significant differences in flow field blocking effects depending on the type of fouling [16,17,18,19,20]. Numerical simulations have revealed the vortex shedding patterns of cruciform cylinders in oscillatory flow, indicating that node effects significantly enhance the overall drag and inertial coefficients [2]. In recent years, artificial intelligence has also been applied to the engineering field of marine aquaculture. In terms of intelligent management, China’s training data volume for domestic AI decision-making models is only one-fifth that of Norway, with its fault warning accuracy being 15–20% lower [21]. However, machine learning technology has been applied to predict structural stress in cages, with errors below 5% [22,23]. Norway’s AquaOptima digital twin system enables full lifecycle management of cages, promoting the development of full-industry chain simulation technology [7]. Recent research has focused on the following three main directions: structural innovation (such as bionic cages and composite material cages), the integration of clean energy (floating photovoltaic panels reducing energy consumption by over 30%), and intelligent upgrades (digital twin technology enabling full lifecycle management) [24,25,26,27]. Norwegian scholars have also found that increasing the porosity of spherical cages reduces wave excitation forces but enhances damping coefficients, providing theoretical support for stability optimization under extreme sea conditions [28,29]. Overall, technological innovation and policy coordination are driving deep-sea aquaculture to become a strategic direction for ensuring food security and expanding marine space.
Offshore aquaculture cages are mainly distributed in coastal areas with water depths typically ranging from 5 to 30 m. Due to the large-scale construction of monopile wind turbines in nearshore waters, the available marine space has tended to become saturated. Therefore, it is imperative to explore reasonable layout schemes for the structural facilities of wind turbines and cages in waters with a depth of 5 to 30 m. Currently, there is relatively little international research on combined structures of offshore monopile wind turbines and aquaculture cages, and reference materials applicable to engineering practice are extremely limited. Thus, this paper further investigates the effects of wave action on the wave forces and surrounding wave fields of combined wind turbine and net cage facilities in finite water depths. Key factors include net cage solidity, wave period, and wave steepness. The OpenFOAM v12 and porous media approach were used to simulate the flow field around aquaculture cages and wind turbine structures under wave action. An optimal mesh generation strategy for the netting model was obtained through grid independence analysis, and the accuracy of the model was verified by comparing it with the results of physical model experiments. This study focused on investigating the wave field characteristics around circular cage clusters under different wave conditions and their effects on the loads on wind turbine foundations. The results provide a foundation for future research on combined wind turbine and net cage facilities.

2. Methods

This study employs the open-source CFD software OpenFOAM, based on the finite volume method, for the hydrodynamic analysis of combined aquaculture net cage and offshore wind turbine facilities. OpenFOAM is a C++-based CFD package with multiple solvers for various fluid mechanics problems, or custom solvers/tools can be developed. It includes pre- and post-processing interfaces, ensuring consistent data transfer across different computing environments.

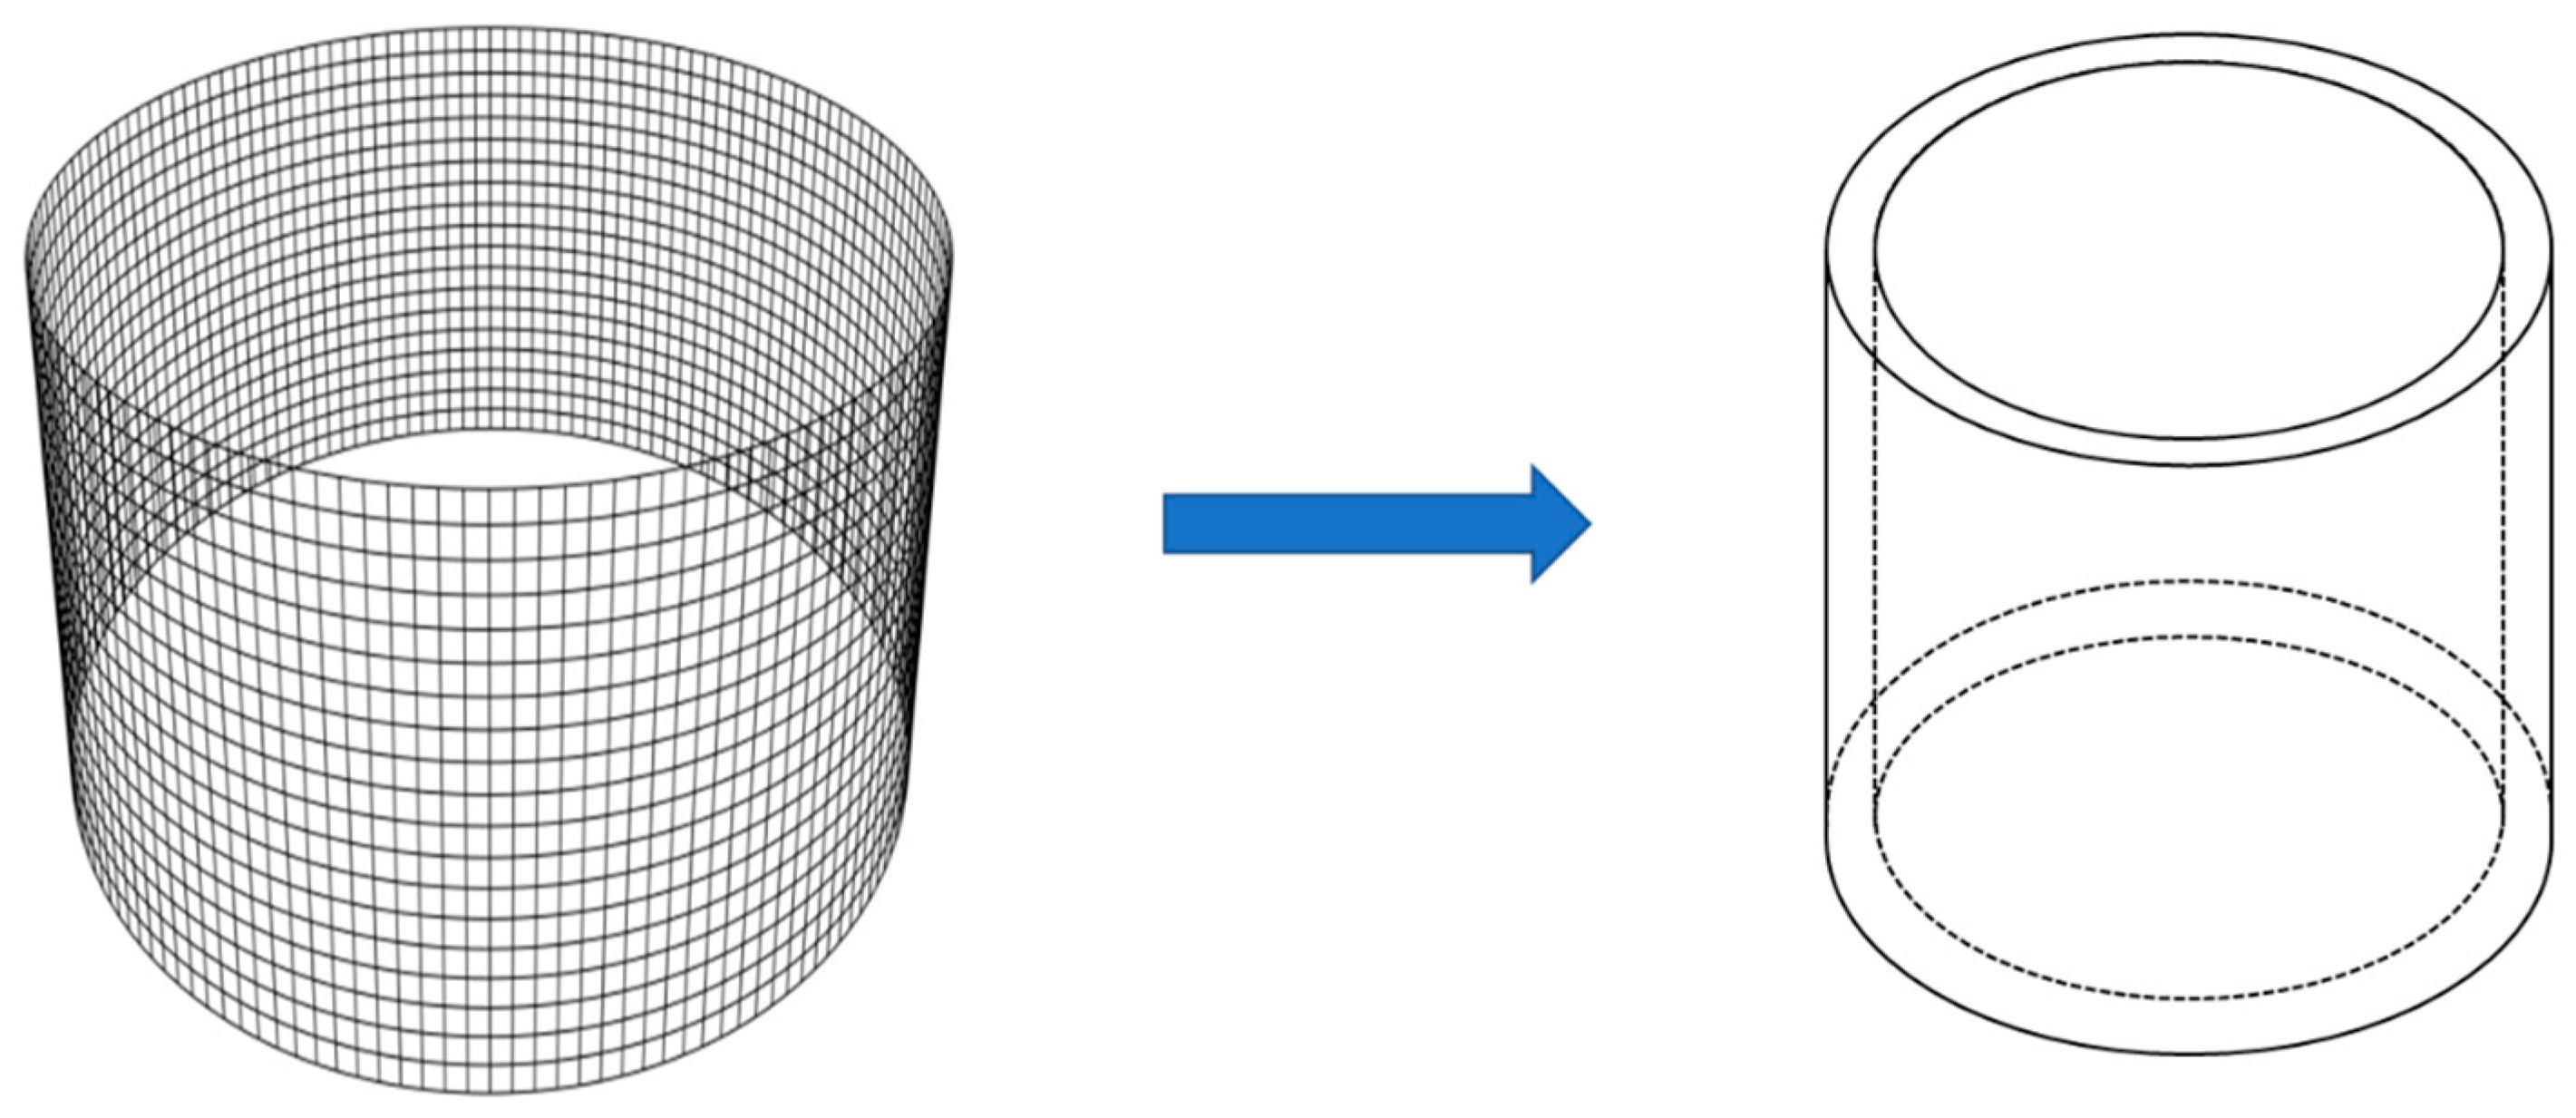
2.1. Porous Medium Model

A porous medium model was used to simulate the influence of net cages on surrounding wave fields and analyze the effects on nearby wind turbine foundations. The porous medium model for marine aquaculture cages involves several key assumptions to simplify fluid–structure interaction analysis, as follows:
(1) Continuum representation: The discrete net structure is treated as a homogeneous, continuous medium rather than resolving individual filaments or meshes. This ignores microscale details (e.g., exact shape of net nodes, individual thread deformations) and focuses on averaged macroscopic properties like net solidity.
(2) Negligible solid skeleton deformation: The model assumes that the net’s structural deformation (stretching and bending) under fluid forces is negligible. It treats the cage as a rigid or quasi-rigid framework, even though real nets may exhibit flexibility. This simplifies the mechanical equilibrium by ignoring dynamic structural responses.
(3) Uniform porosity and permeability: The net’s porosity (fraction of void space) and permeability (fluid flow resistance) are assumed to be uniform across the cage volume. Variations due in node intersections or mesh density changes are overlooked, assuming isotropy or orthogonal anisotropy (e.g., different flow resistances along axial/radial directions).
(4) Volume-averaged flow: Fluid flow through the net is described using Darcy-like or Forchheimer-type equations, which average velocity and pressure over the representative elementary volume (REV). The effect of individual threads (e.g., drag on filaments) is lumped into bulk resistance coefficients, ignoring local flow disturbances around nodes or mesh edges.
(5) Hydrodynamic force simplification: Forces exerted by water on the net are modeled via empirical drag/lift coefficients based on the net solidity, rather than resolving viscous interactions at the filament scale. Node geometry (e.g., thickness, shape) is assumed to have no impact on overall drag, focusing solely on the macroscopic porosity effect.
These assumptions balance computational tractability with engineering accuracy, making the model suitable for large-scale simulations of cage hydrodynamics (e.g., wave/current loads) while sacrificing microscale structural fidelity. Previous studies on netting and net cage flow fields have successfully used this approach [30]. This paper simplifies circular net cages into cylindrical porous media (Figure 1).
The fluid governing equation for its application is as follows:
ρ t + ρ u i x i = 0
ρ u i t + ρ u i u j x j = P x i + ρ g i + x j ( μ + μ t ) ( u i x j + u j x i ) + S i
where μ is the dynamic viscosity of the fluid, μ t is the eddy viscosity, k represents the turbulent kinetic energy, p is the pressure, u i is the velocity component, g i is the gravitational acceleration, i and j represent the coordinate components, t is the time, ρ is the density of the fluid, and S i is the source term of the momentum equation.
In the fluid region, outside the porous medium, S i = 0 , and inside the porous medium, S i , is given as follows:
S i = 1 2 ρ C i j | u | u
C i j = ( C n 0 0 0 C t 0 0 0 C t )
where u is the velocity vector of water particles, C n is the normal resistance coefficient, C t is the tangential resistance coefficient, and C i j represents the porous medium coefficient matrix.
The flow resistance acting on the porous medium region is as follows:
F = S i λ A
where λ is the thickness of the porous medium region, A is the area of the porous medium region, and the direction of the force (F) is opposite to the direction of the water flow.
By substituting Equation (3) into Equation (5), the expression of drag force ( F d ) and lift force ( F l ) on the net can be obtained:
F d = 1 2 ρ λ A C n | u | u
F l = 1 2 ρ λ A C t | u | u
The porous medium coefficient ( C n and C t ) in Equations (6) and (7) can be obtained through physical model experiments. In addition, lift and drag force can also be obtained by Morison’s equation:
F d = 1 2 ρ A C d | u | u
F l = 1 2 ρ A C l | u | u
where the drag coefficient ( C d ) and lift coefficient ( C l ) can be obtained by the empirical formula.

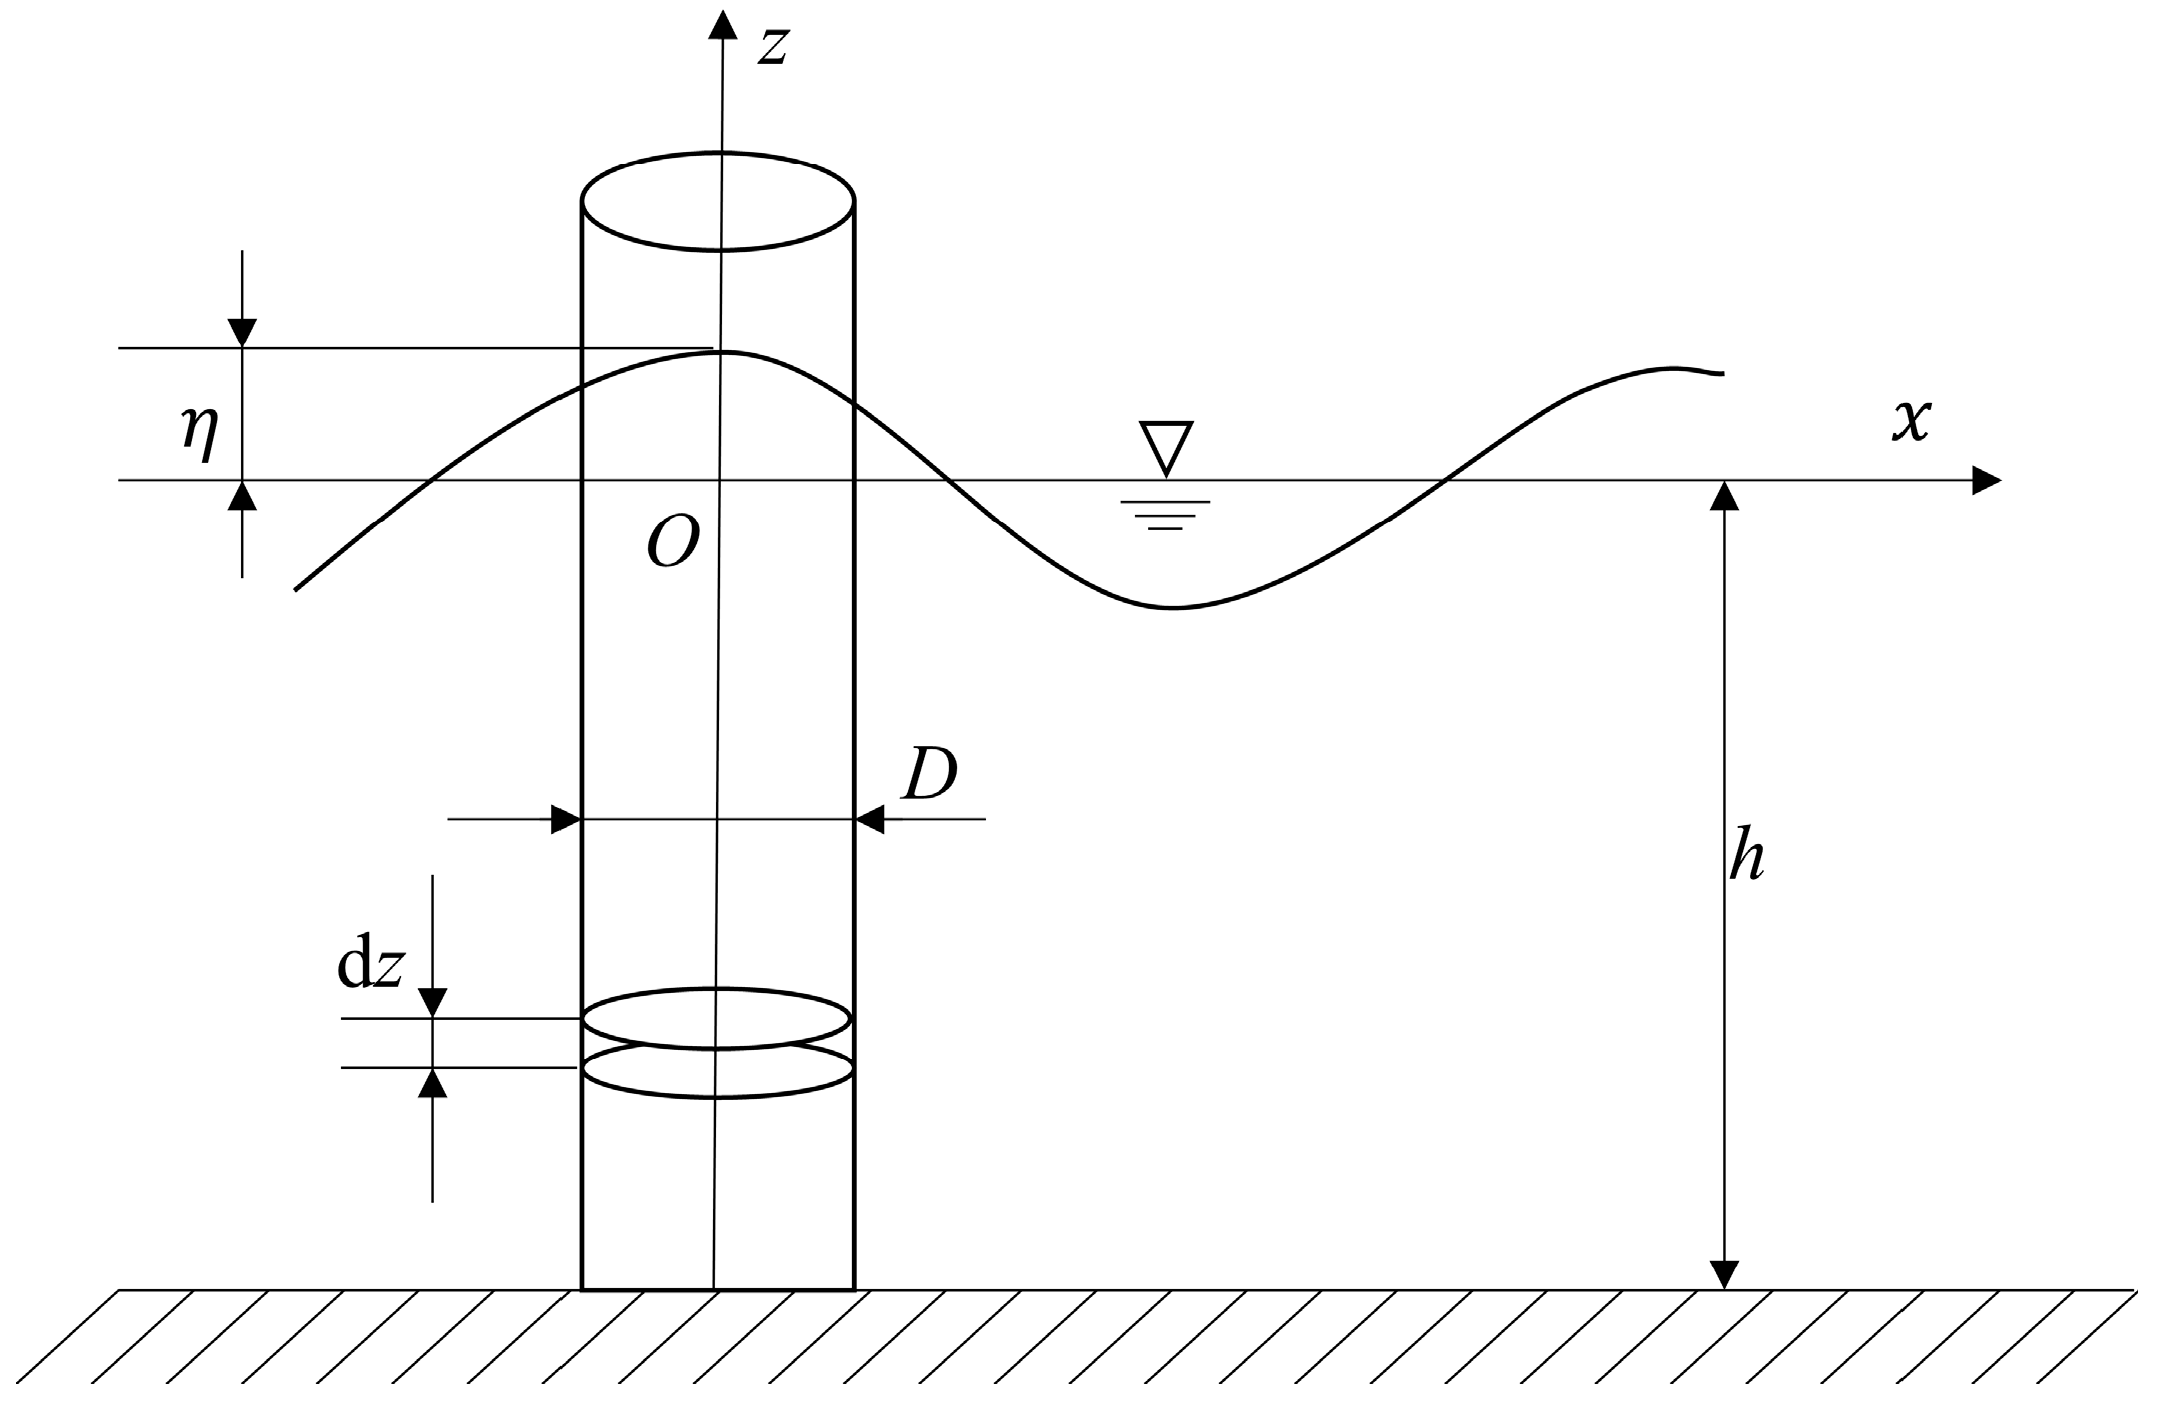
2.2. Morison’s Equation

The wind turbine model and wave conditions satisfy the small-diameter criterion (D/L ≤ 0.15, L refers to wavelength). Thus, Morison’s equation is used to calculate wave forces on the foundation. For small-diameter piles, wave forces include inertial force F i and drag force F d :
F i = f i Z = C m ρ π D 2 4 u t Z
f i = C m ρ π D 2 4 u t
F d = f d Z = C d ρ 2 D u | u | Z
f d = C d ρ 2 D u | u |
f H = f i + f d = C m ρ π D 2 4 u t + C d ρ 2 D u | u |
The total wave force per unit height on the pile is f H = f i + f d , where D is the pile diameter and u is the horizontal velocity of water particles. Using the coordinate system shown in Figure 2, the wave force on a pile segment of height dz can be given as follows:
d F H = f H d z = C m ρ π D 2 4 u t d z + C d ρ 2 D u | u | d z
The total force on the entire pile is obtained by integrating Equation (15) from the seabed to the free surface:
F H = h η C d ρ 2 D u | u | d z + h η C m ρ π D 2 4 u t d z
Stokes second-order wave theory is used, with horizontal velocity u and free surface elevation η given by:
u = A ω [ cosh k ( z + h ) sinh k h c o s θ + 3 4 A k cosh 2 k ( z + h ) sin h 4 k h cos 2 θ ]
η = A [ A k 2 sinh 2 k h + cos θ ]
where θ = k x ω t and k = 2π/L.

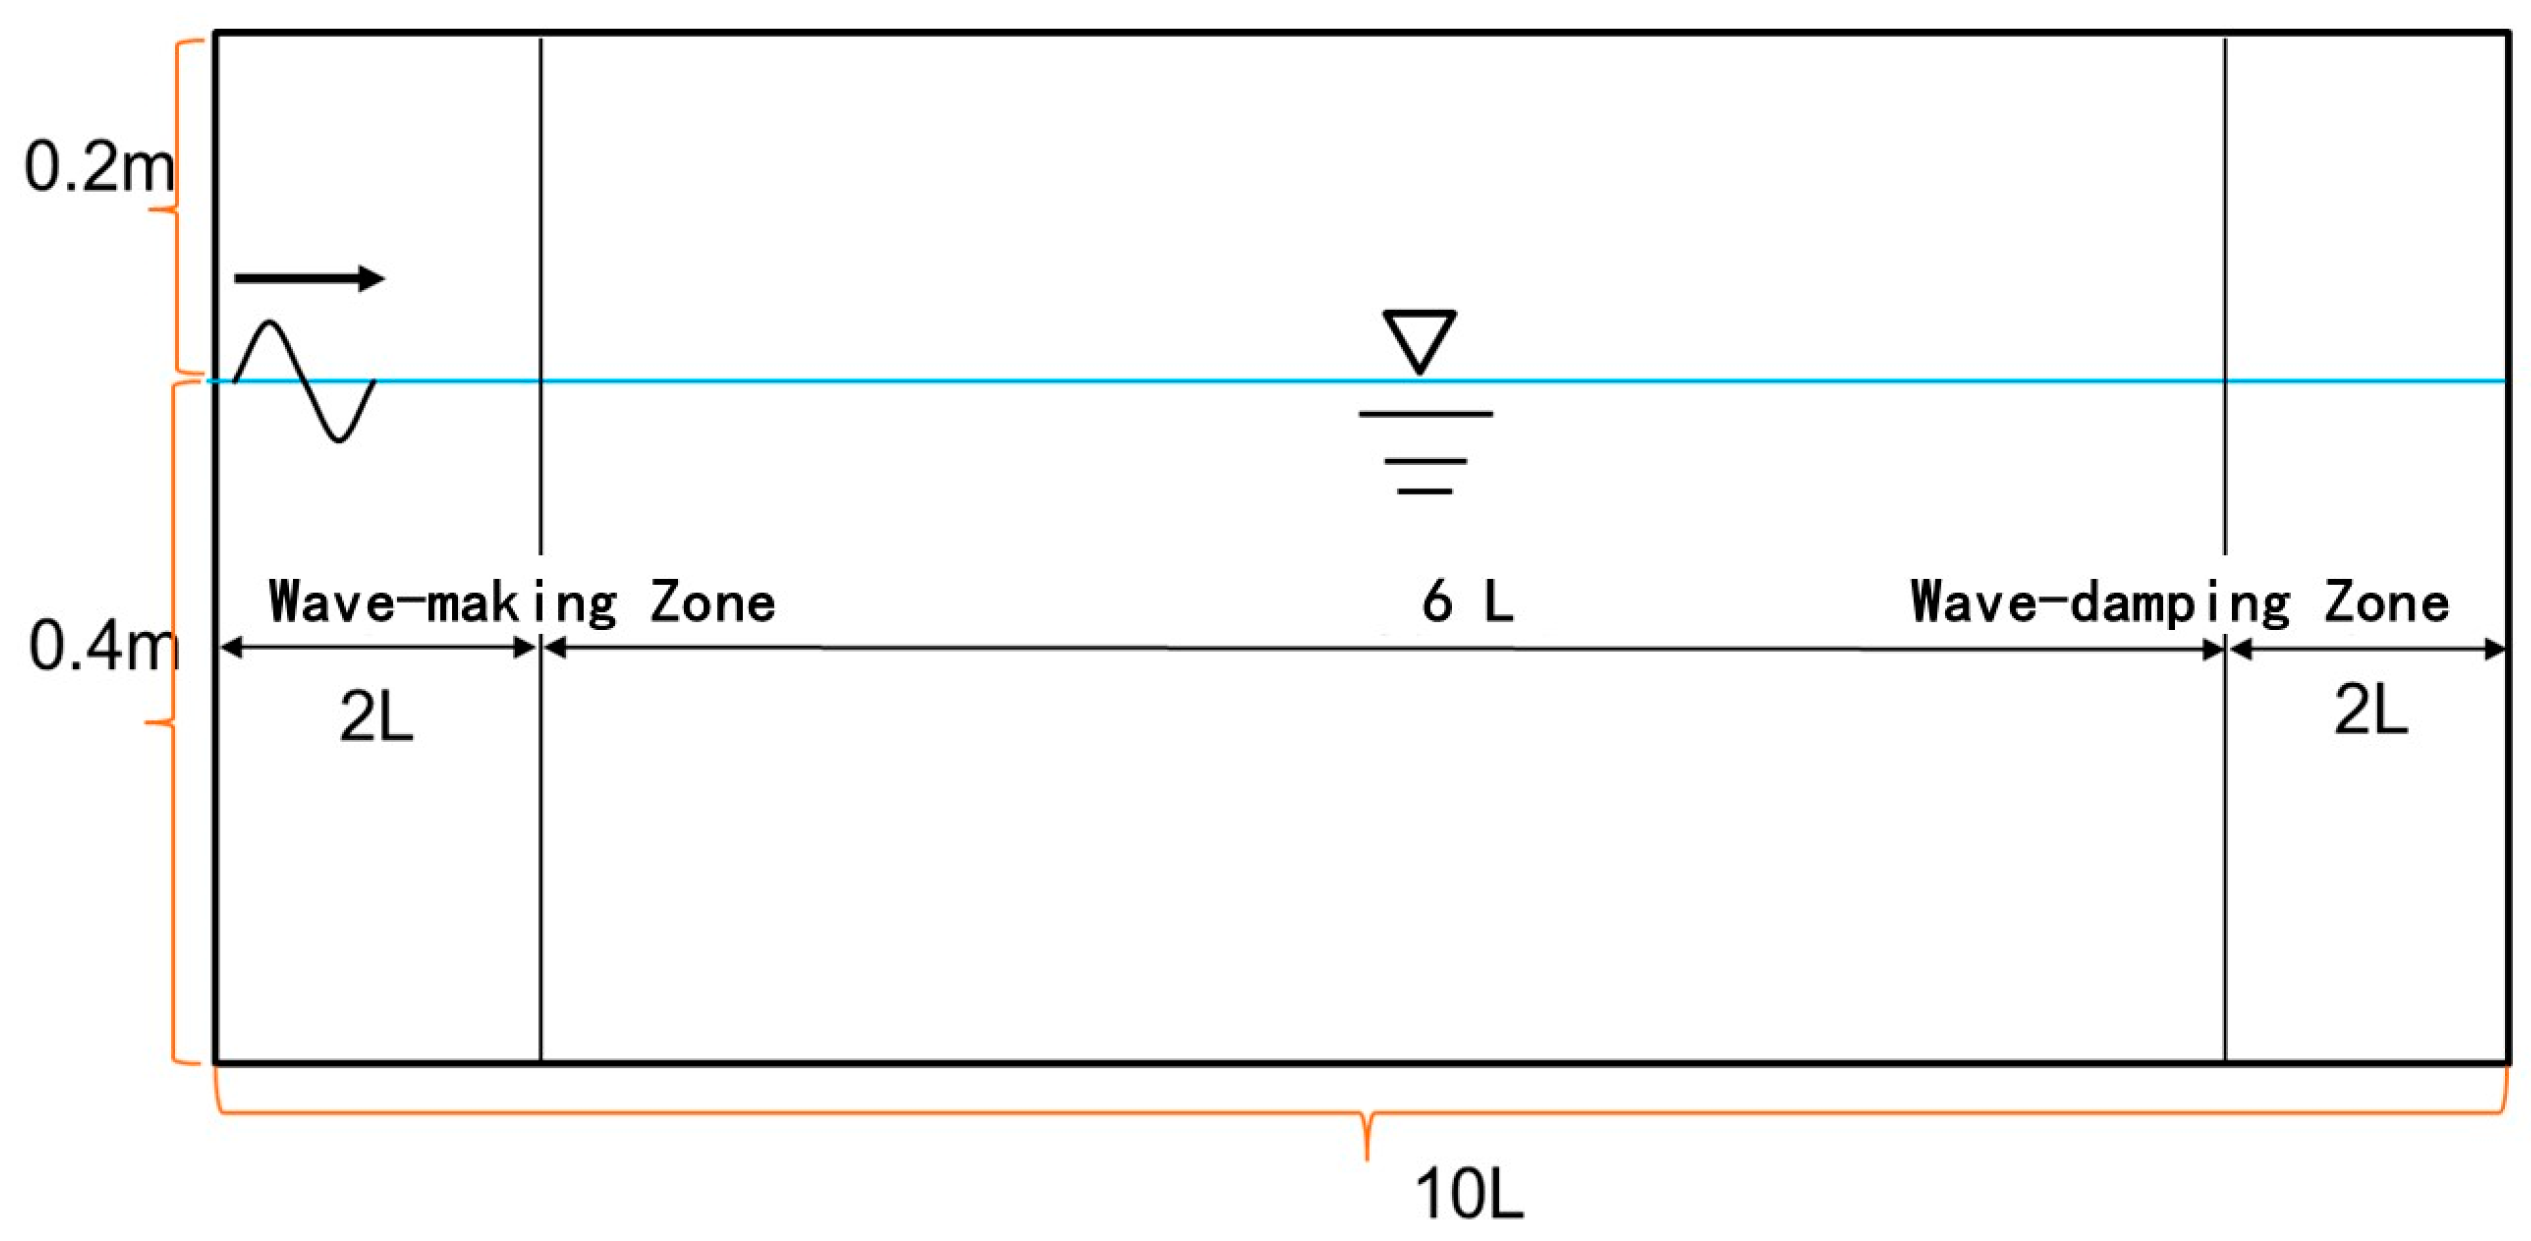
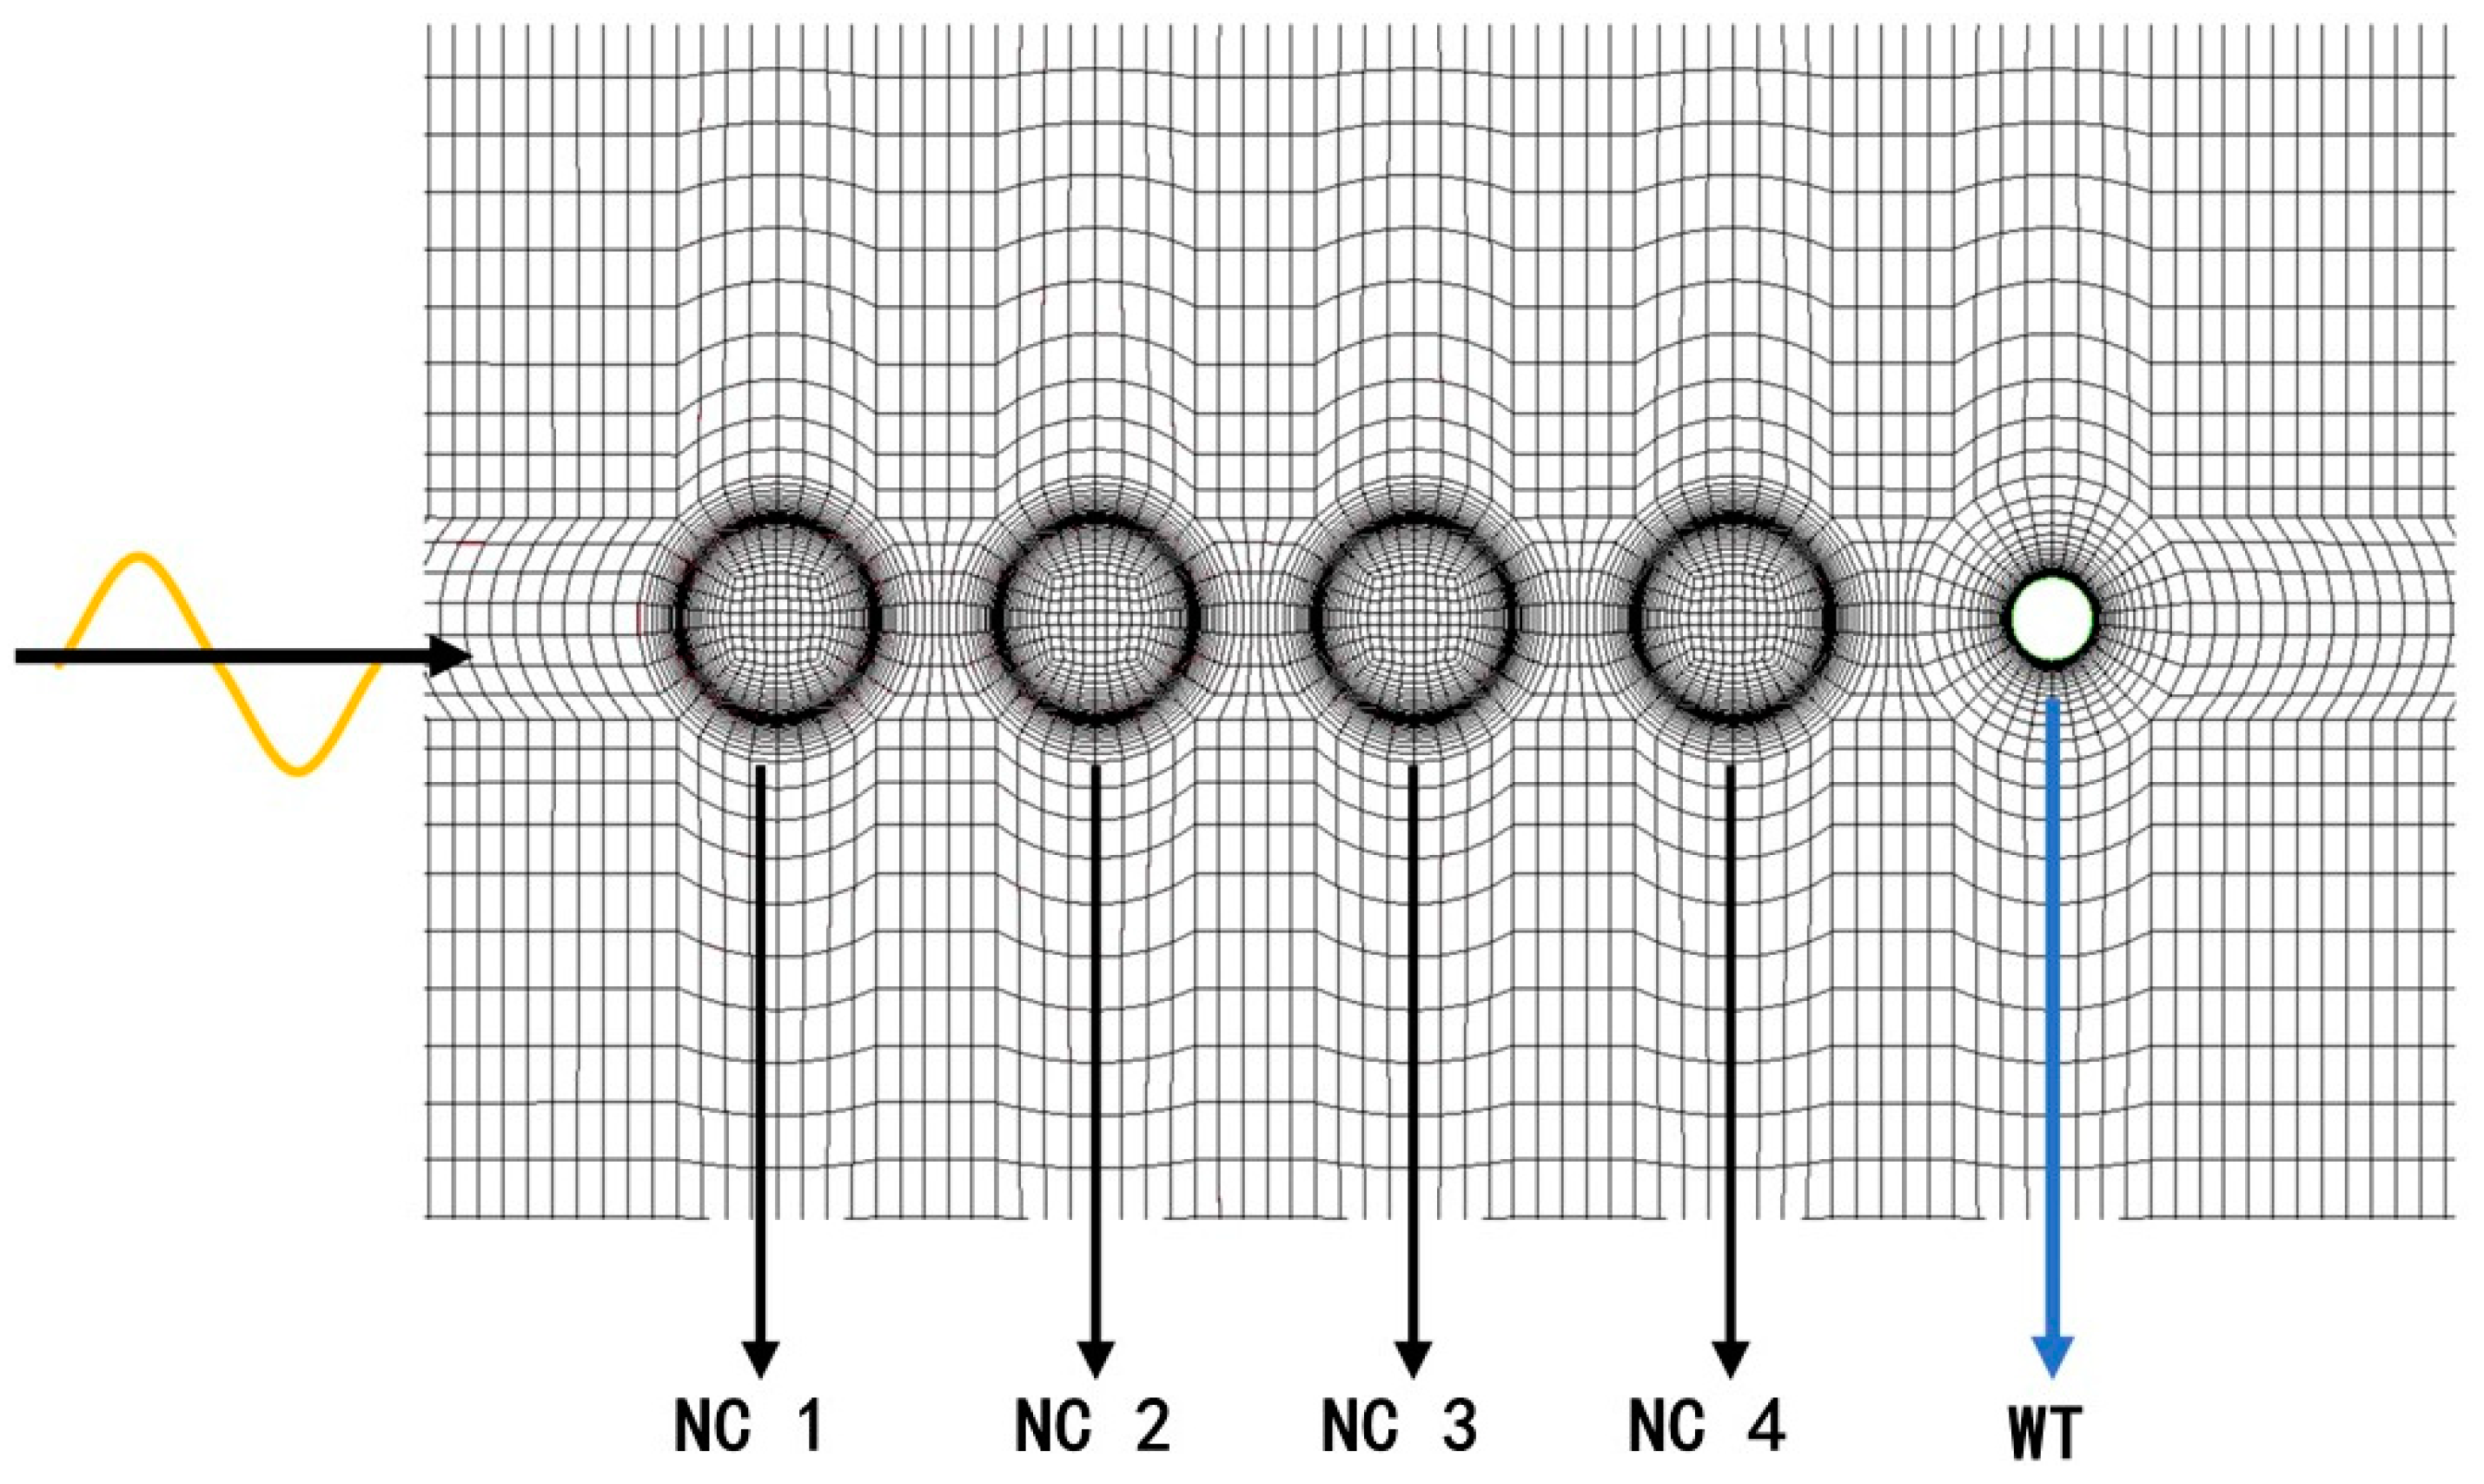
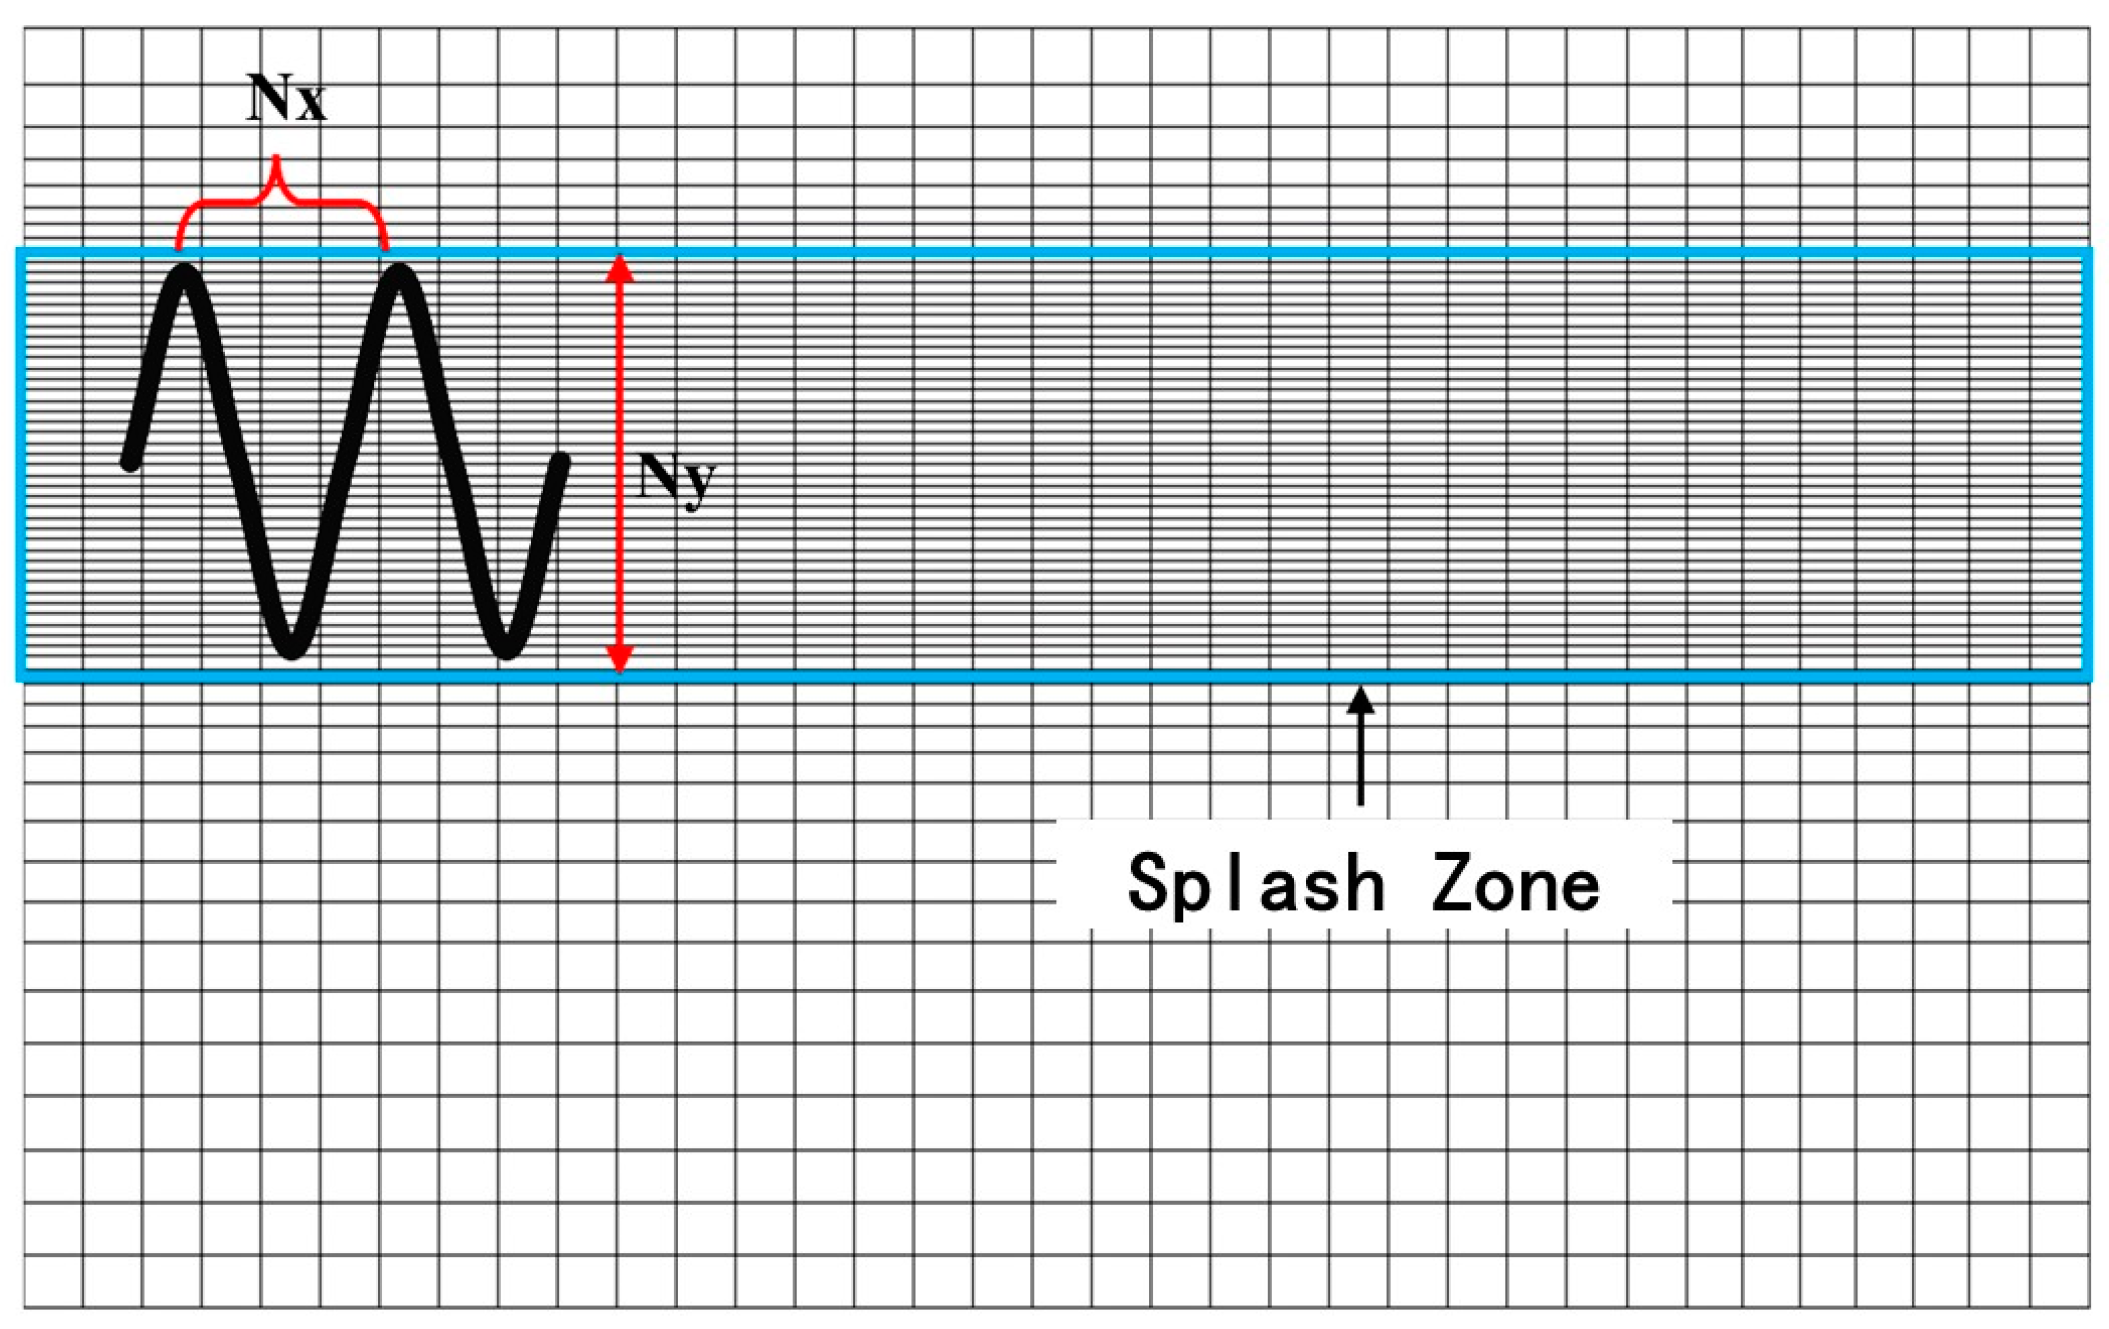
2.3. Flow Field Calculation Model

LES directly resolves large-scale turbulent structures and models small-scale turbulence, offering higher accuracy and reliability than Reynolds-Averaged Navier–Stokes (RANS) methods while being more computationally efficient than the direct numerical simulation (DNS). Thus, LES is adopted and time-step is constrained (Courant number < 0.5) to ensure accurate vortex transport.
A 1:50 scale numerical flume was built (Figure 3) as follows: length 13 m, width 0.45 m, height 0.6 m, water depth 0.4 m. Based on the results of our previous experimental studies, the influence of the Reynolds number on the hydrodynamic characteristics of the cage structure is negligible under wave action [10]. Thus, the Froude scaling law is adopted to achieve dynamic similarity. The fluid parameters are selected as follows: the density of water is 1000 kg/m3, the dynamic viscosity of fluid is 1.0 × 10⁻⁶ m2/s, and the gravity acceleration is 9.8 m/s2. A wave-making zone (2 L) and wave-damping zone (2 L) were included. The scale ratio of 1:50 for the numerical model aims to balance the efficiency of numerical calculations. Moreover, dimensionless processing was adopted in the results analysis to ensure that the numerical simulation results have a certain degree of generalizability.
The diameter of the cage is 0.254 m, the height of the cage is 0.3 m, and the net cages are fixed to seafloor. The diameter of the wind turbine base is 0.1 m. The center distance of the cage is 0.4 m, and the four cages are evenly distributed. The wind turbine base is 0.4 m away from the cage. The grid division around the cage and the wind turbine is shown in Figure 4. The maximum grid is 0.03 m, the mesh is encrypted in the area around the net coat and the fan, and the minimum grid is 0.001 m. The wave propagation direction grid of the whole tank is evenly distributed. The vertical grid is evenly distributed within the splash zone. Away from the splash zone, it gradually becomes sparser, with an expansion rate of 1.2, as shown in Figure 5.
Generally, the accuracy of the numerical results improves with higher grid quality and quantity. However, this is accompanied by increased computational time. Therefore, we aim to select reasonable grid numbers through grid convergence verification. For clarity in the subsequent sections, two variables, Nx and Ny, are defined as follows (see Figure 5):
  • Nx: Number of grids per wavelength in the wave propagation direction (along the wavelength);
  • Ny: Number of grids per wave height in the y-direction (wave height direction) within the splash zone.
The wave parameters are set as follows: wave height = 0.04 m, period = 1 s. A relaxation zone (length = 1.5–2 times the wavelength) is placed between 0 m and 3 m in the flume to maintain the ideal wave profile. A damping zone (length = 3 m) is installed at the flume’s rear to absorb waves. Six Nx cases (Nx = 30, 40, 60, 80, 100, and 120) and four Ny cases (Ny = 5, 10, 20, and 30) are tested.
A comparison of the wave height and their amplitude spectrums simulated with different grids in the vertical direction (splash zone) is shown in Figure 6. To control variables, Nx is uniformly set to 40. Ny is assigned values of 5, 10, 15, and 20, respectively. As illustrated in the figure, the accuracy improves with an increase in grid resolution. However, higher grid density typically results in longer computational time and elevated computational costs. Balancing computational efficiency and accuracy, Ny = 10 is ultimately selected.
Under the conditions of Ny = 10 and t = 20 s, the simulation results for different grid numbers in the wave propagation direction are shown in Figure 7. The results indicate that when the grid number in the wave propagation direction exceeds 80, the wave height simulation results achieve convergence. Therefore, when balancing computational cost and wave attenuation, Nx = 80 is selected as the optimal grid number in the wave propagation direction.

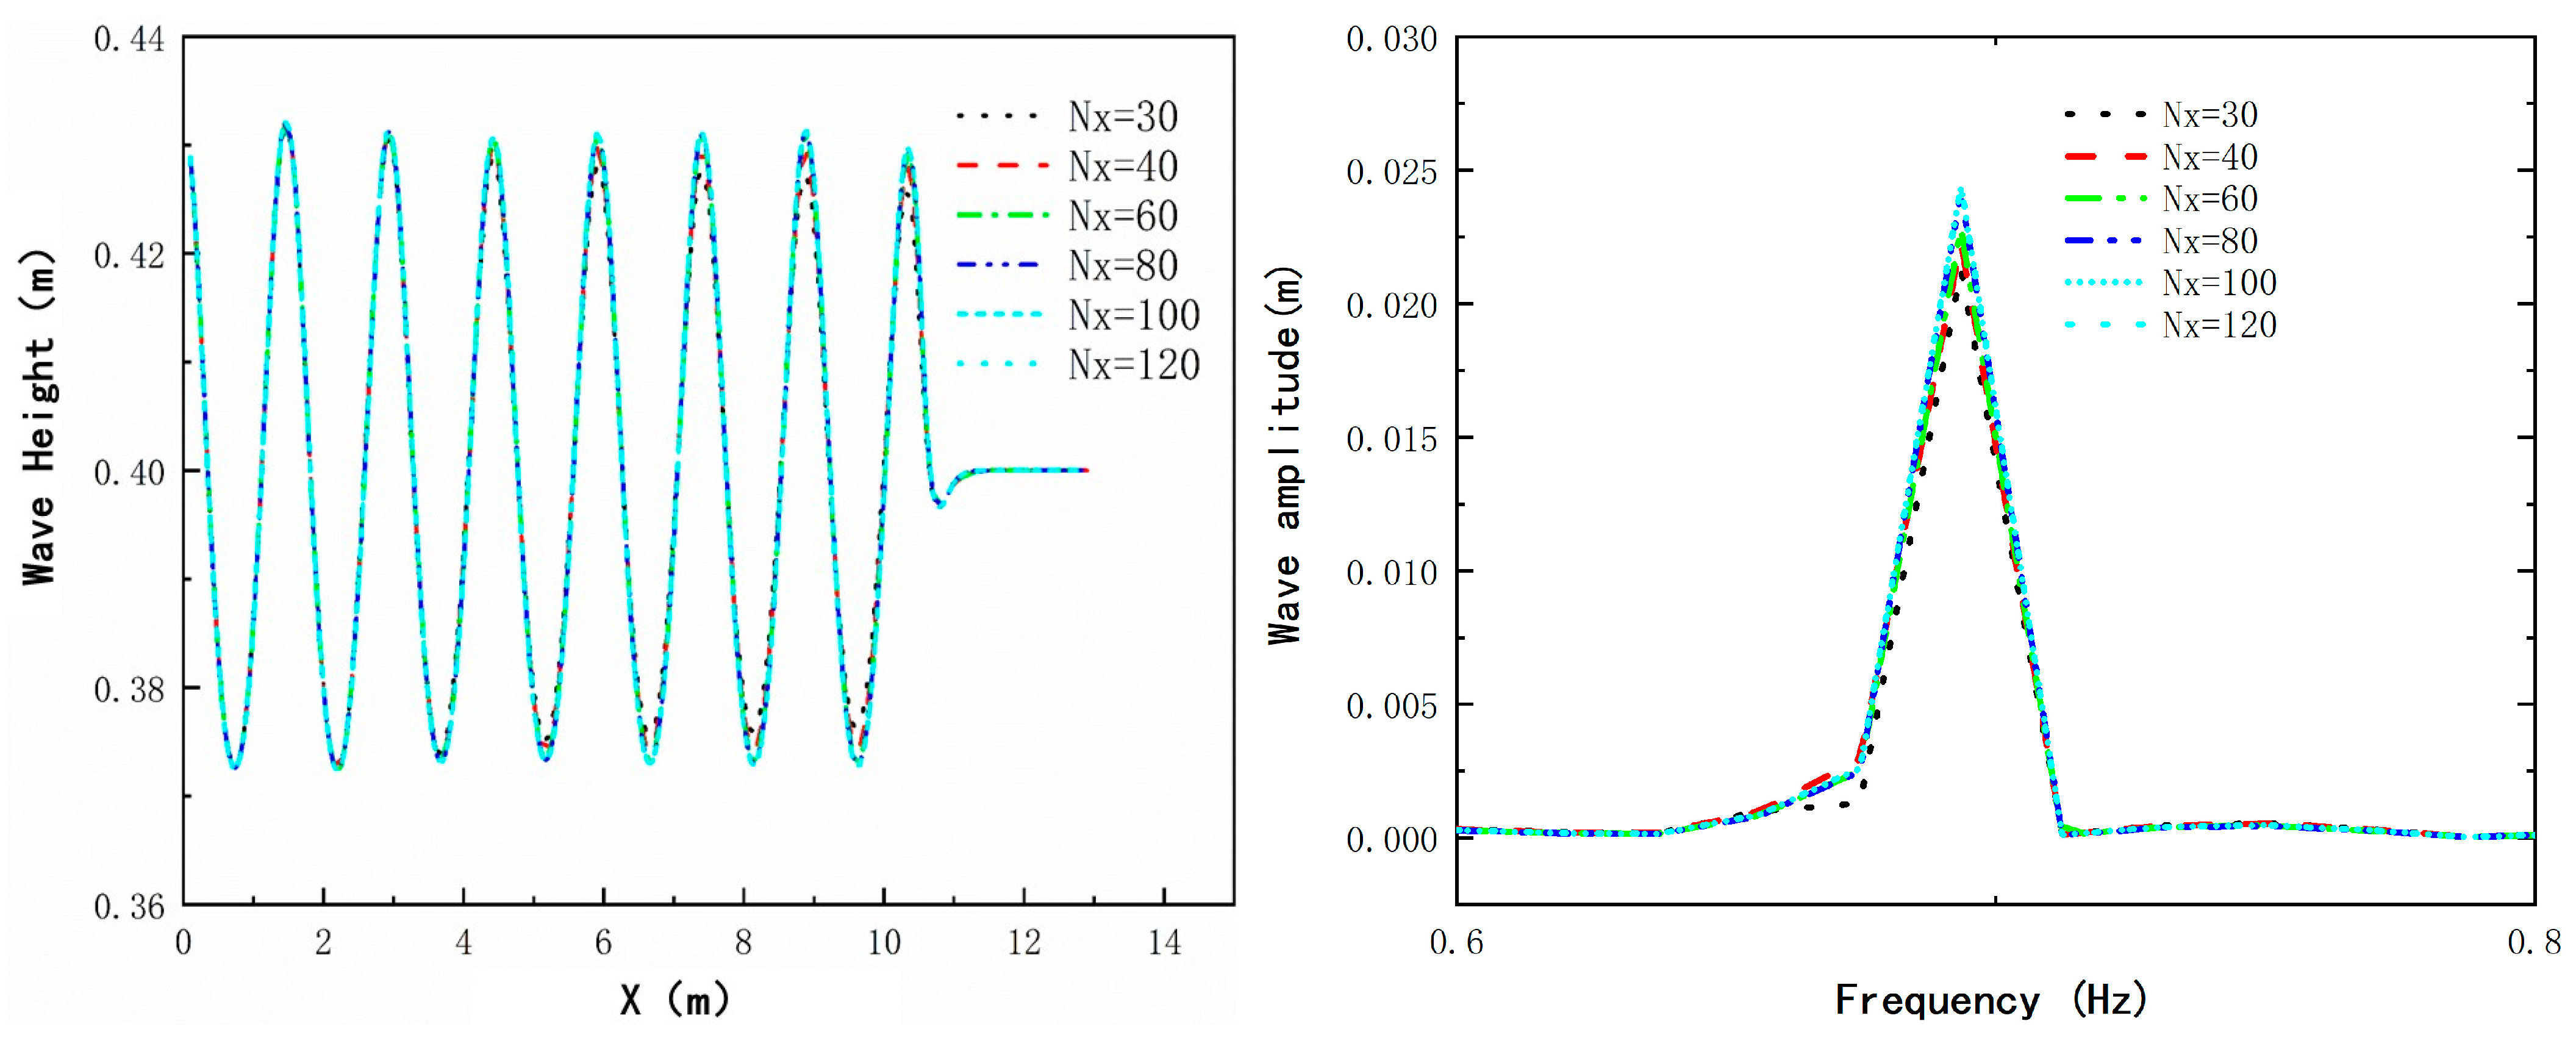
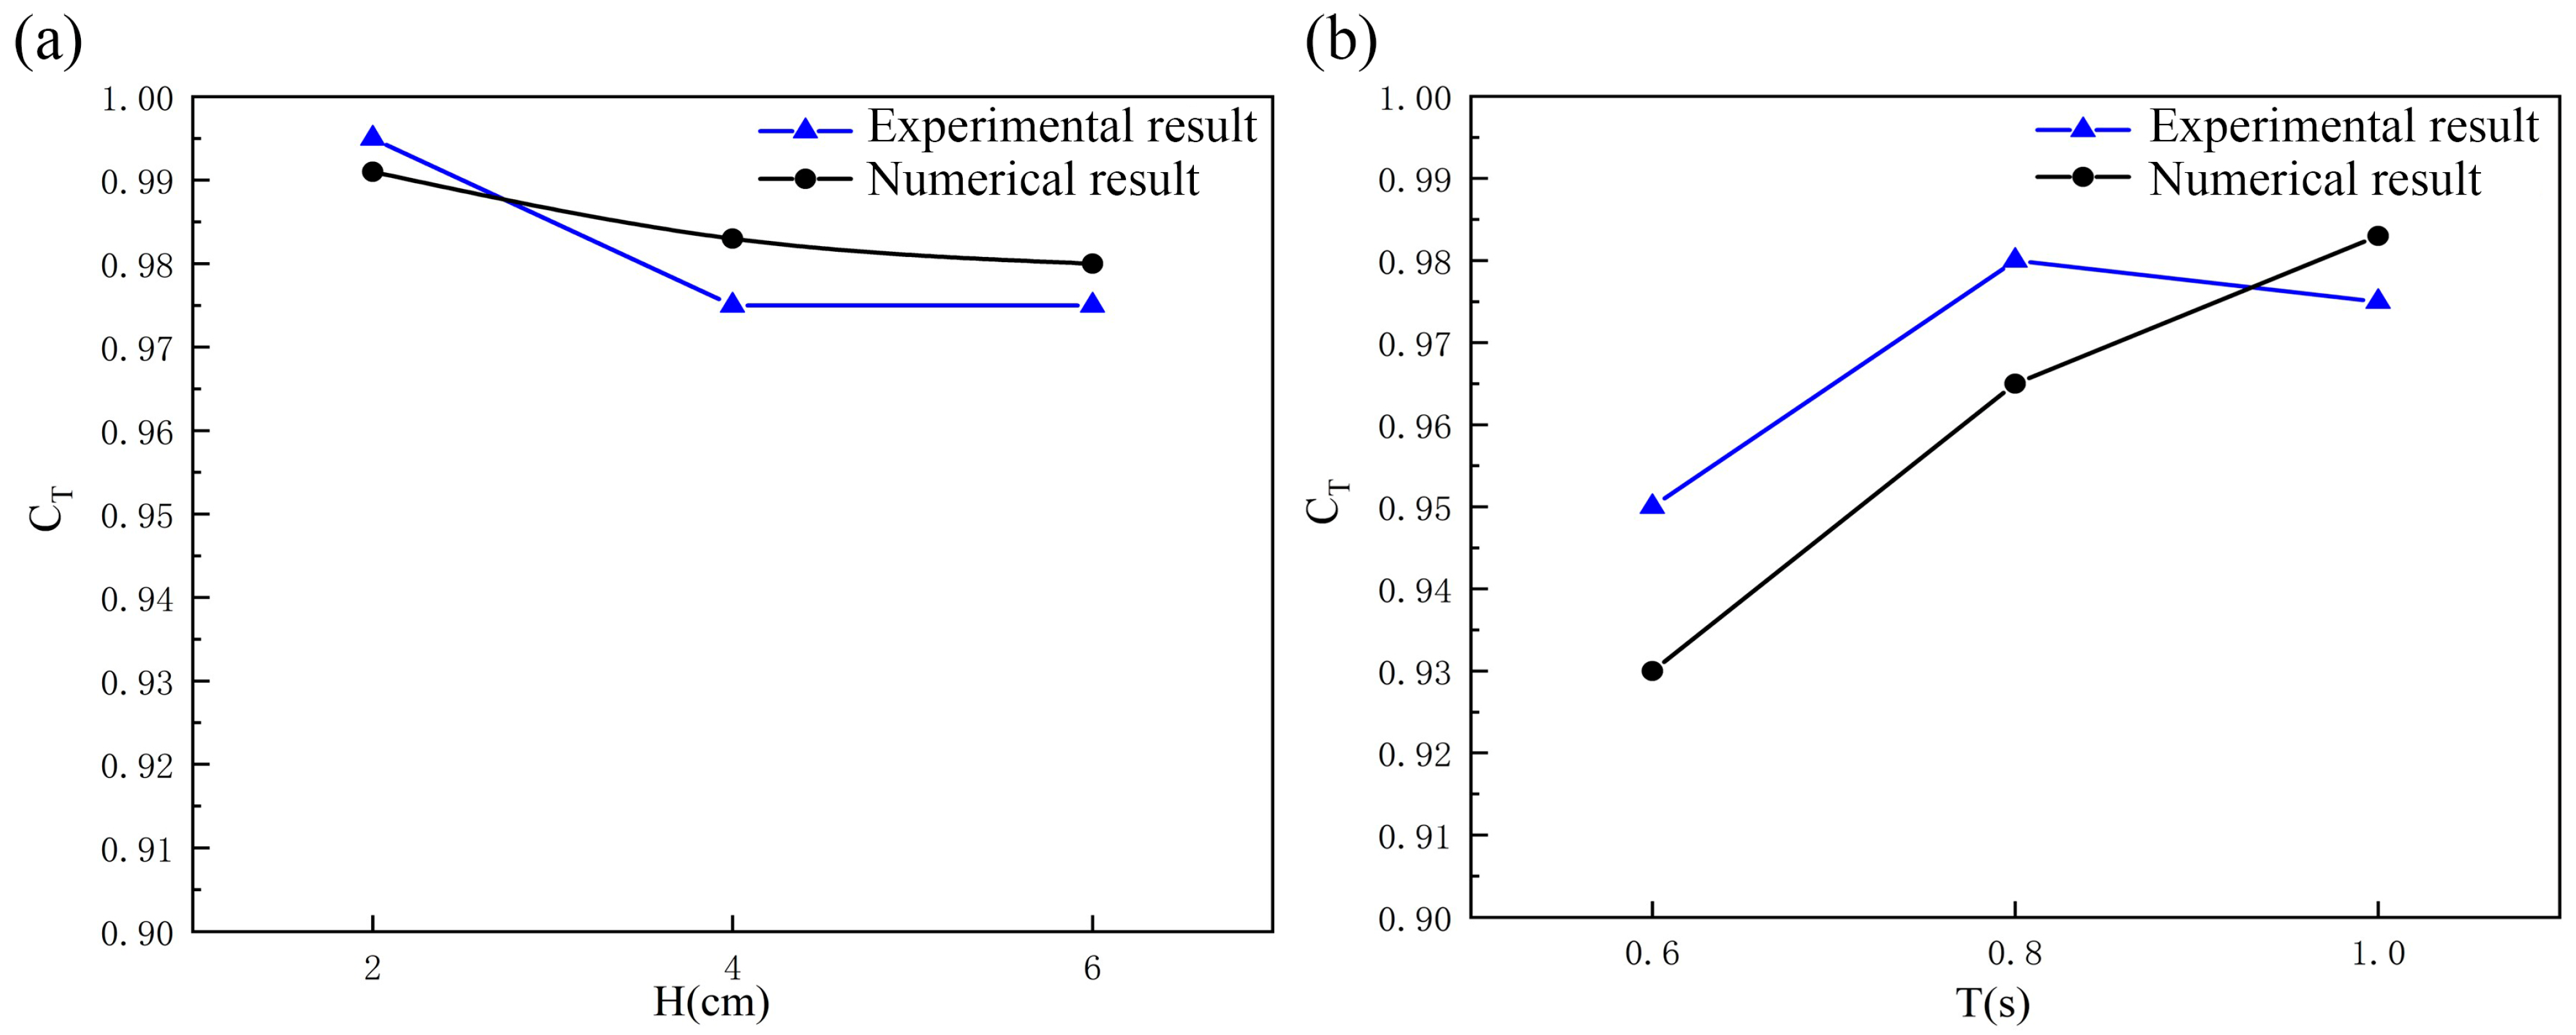
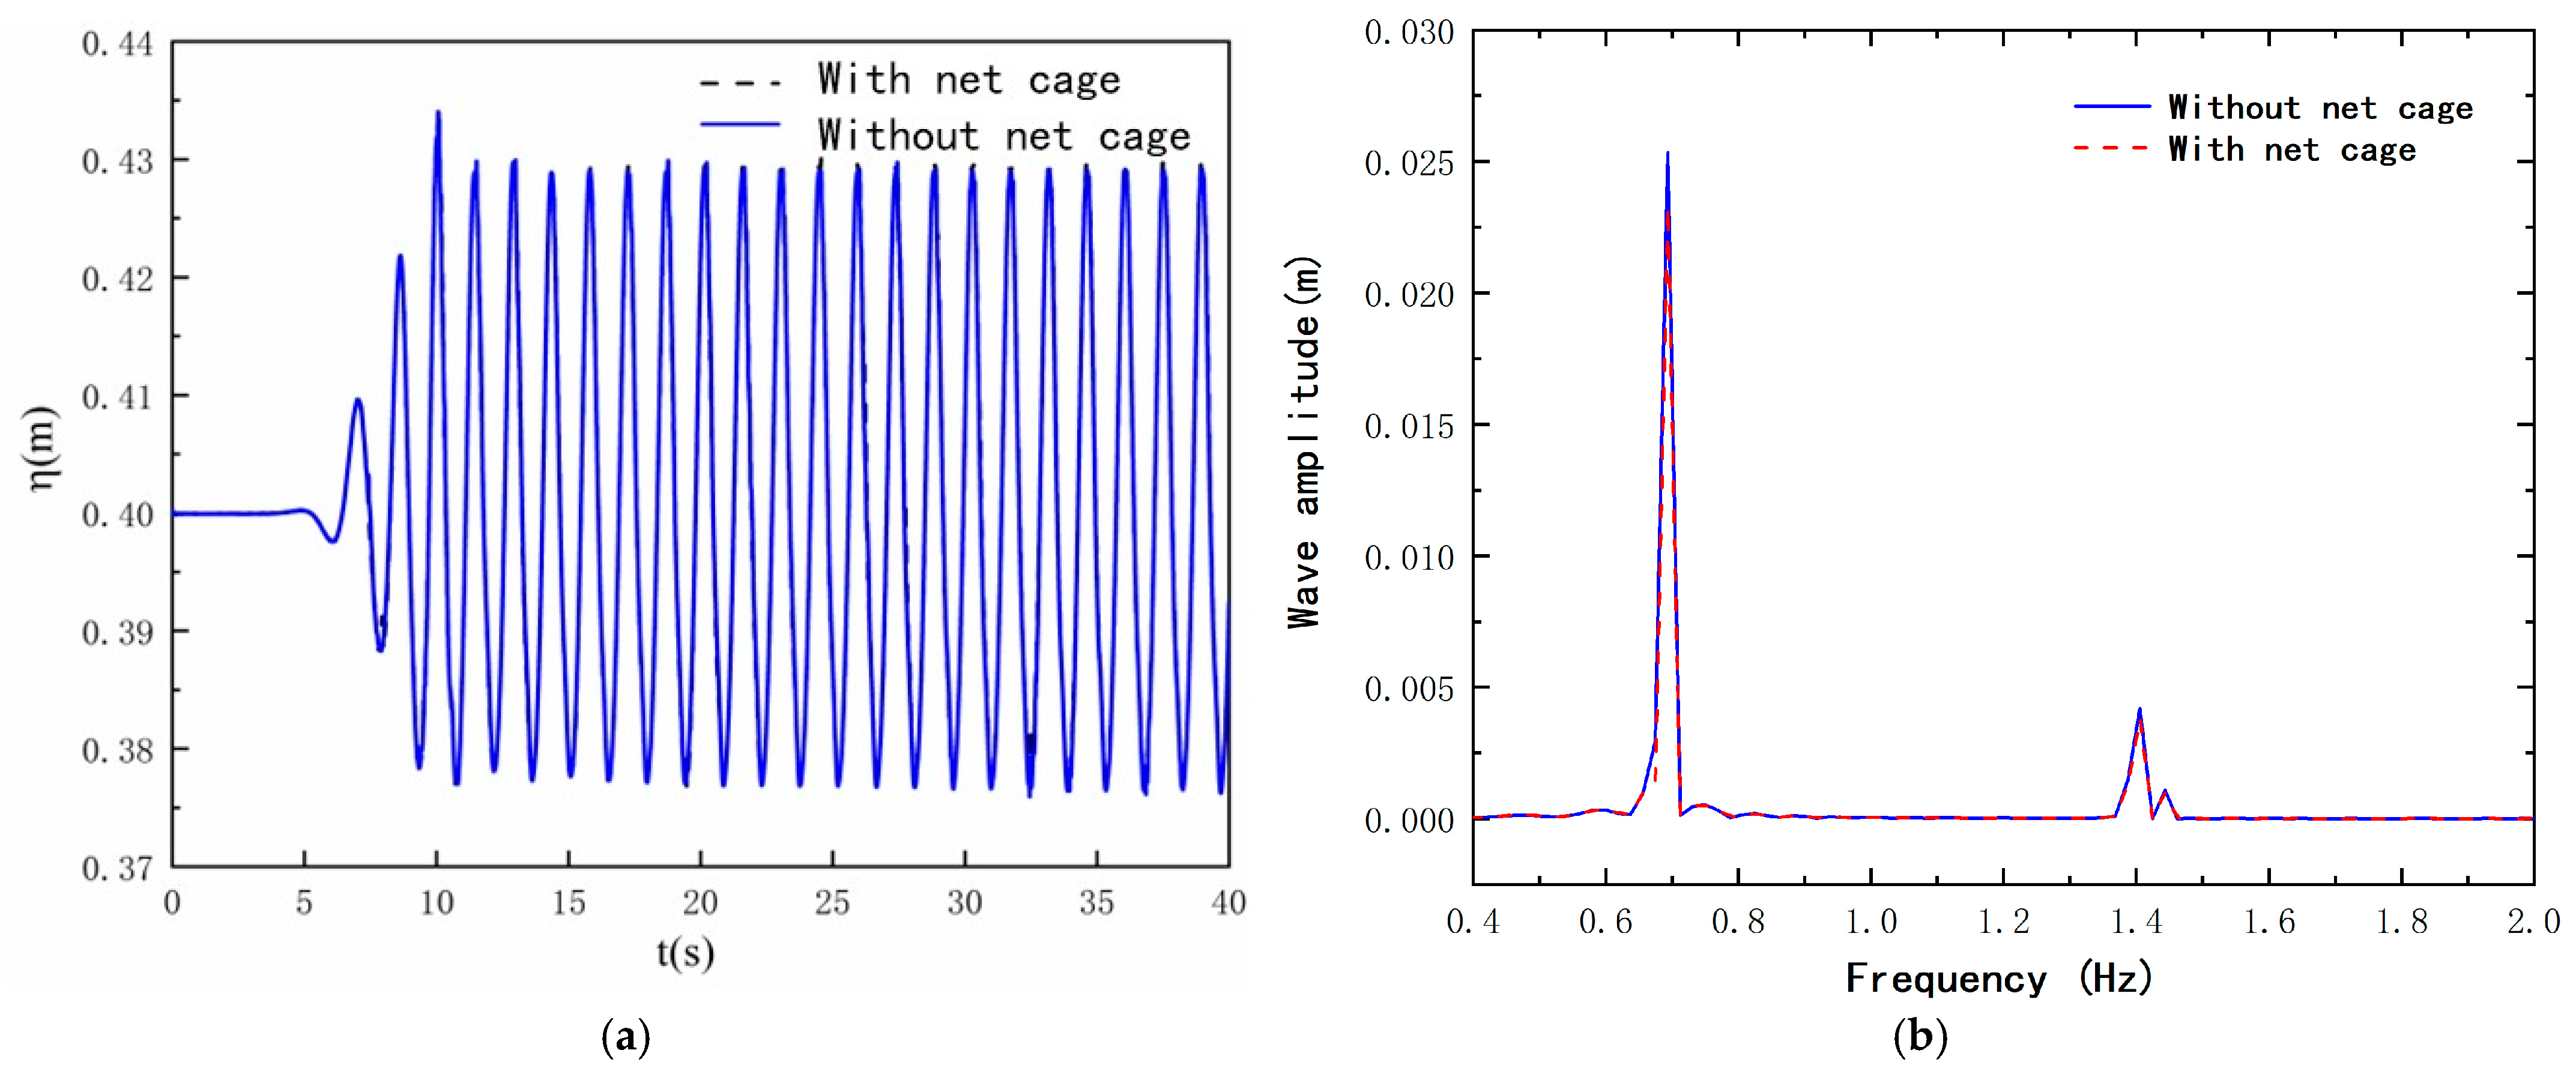
2.4. Numerical Model Validation

The relevant parameters of the net cage model in this research are consistent with those in Bi et al.’s paper [31]. The numerical model validation in this study is completed by performing numerical calculations on the wave fields around cages for different wave periods at H = 4 cm and different wave heights at T = 1.0 s and comparing the results with the physical model experimental values from Chun-Wei Bi et al. The results are shown in Figure 8. Measurement points were set up 1.3 m downstream from the center of the first cage. Under different wave conditions, the simulated wave transmission coefficient (CT) downstream of a single cage shows minimal differences from the corresponding experimental values, with the maximum relative error not exceeding 2%. As the number of cages increases, the transmission coefficient exhibits a decreasing trend, and the error between the numerical simulations and experimental results gradually decreases to less than 1%. Therefore, it can be concluded that the numerical model used in this paper has high accuracy.

3. Results and Discussion

To investigate the hydrodynamic characteristics around the wind turbine foundation under finite water depth conditions with varying solidity conditions and wave heights, the following two sets of working conditions are established:
  • Condition 1: identical wave parameters but different solidity conditions (see Table 1);
  • Condition 2: identical solidity conditions and wave period but varying wave heights (see Table 2).
Both conditions share a constant water depth of 0.4 m.

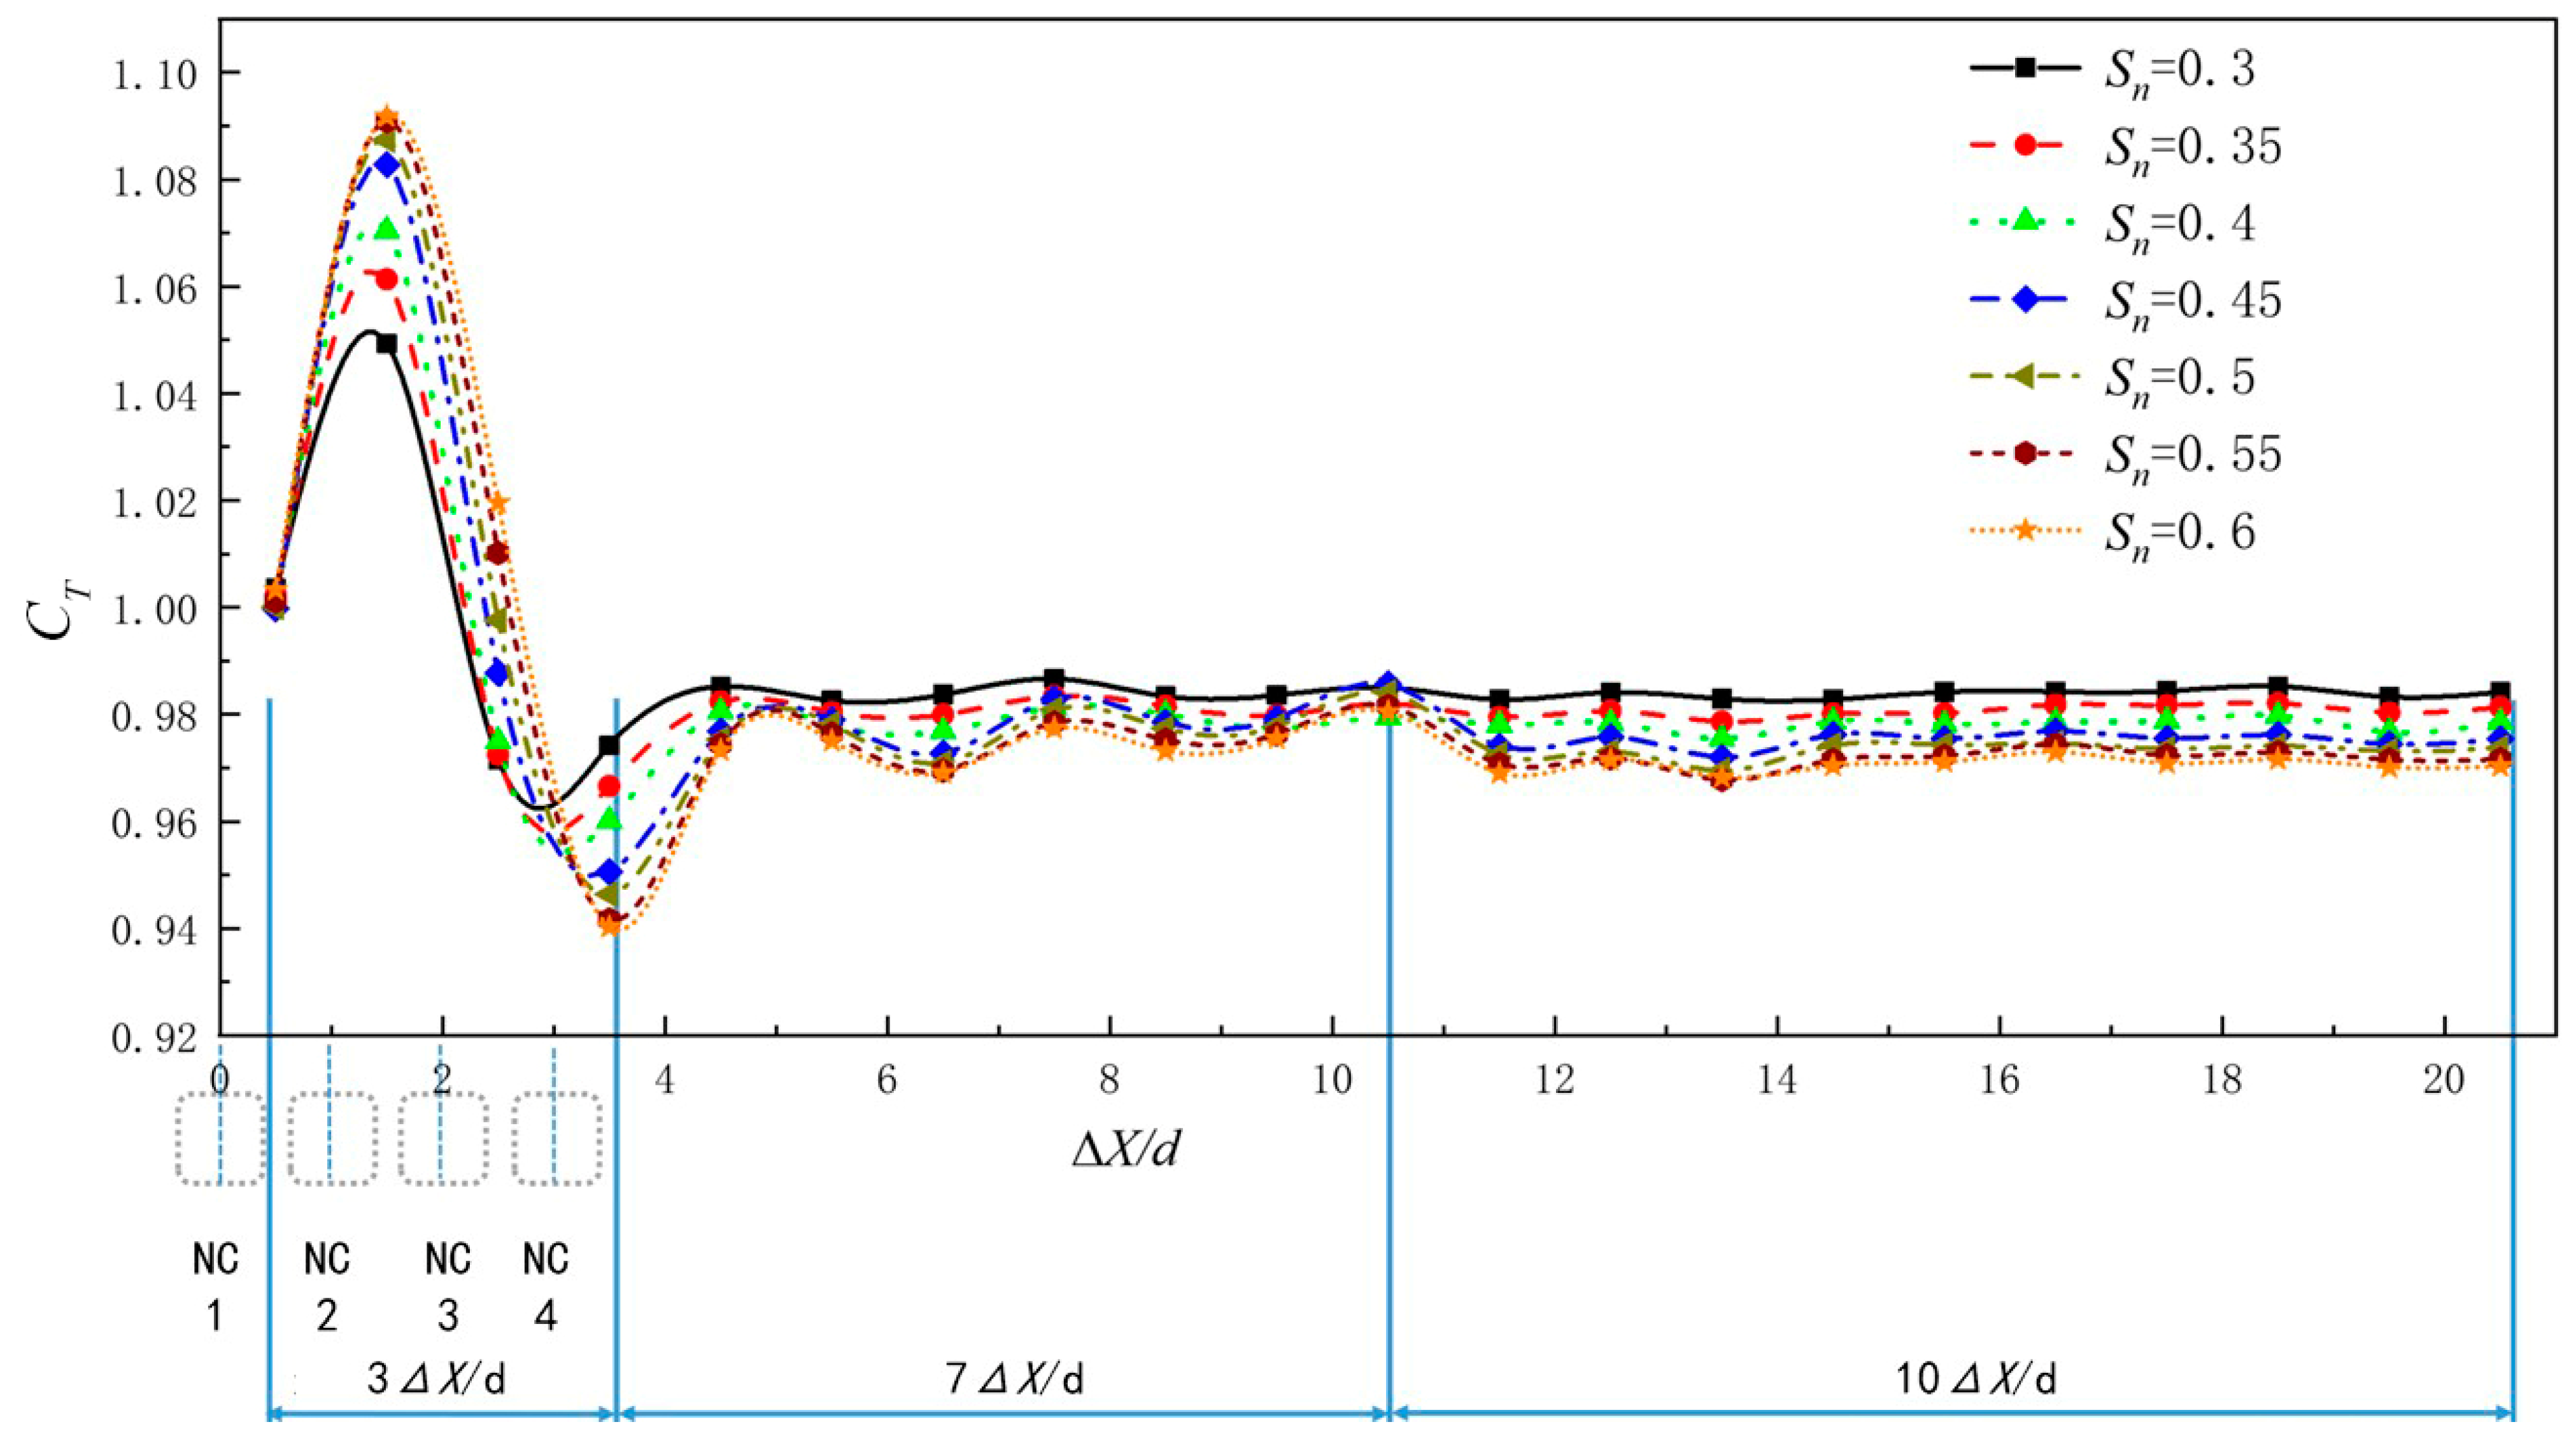
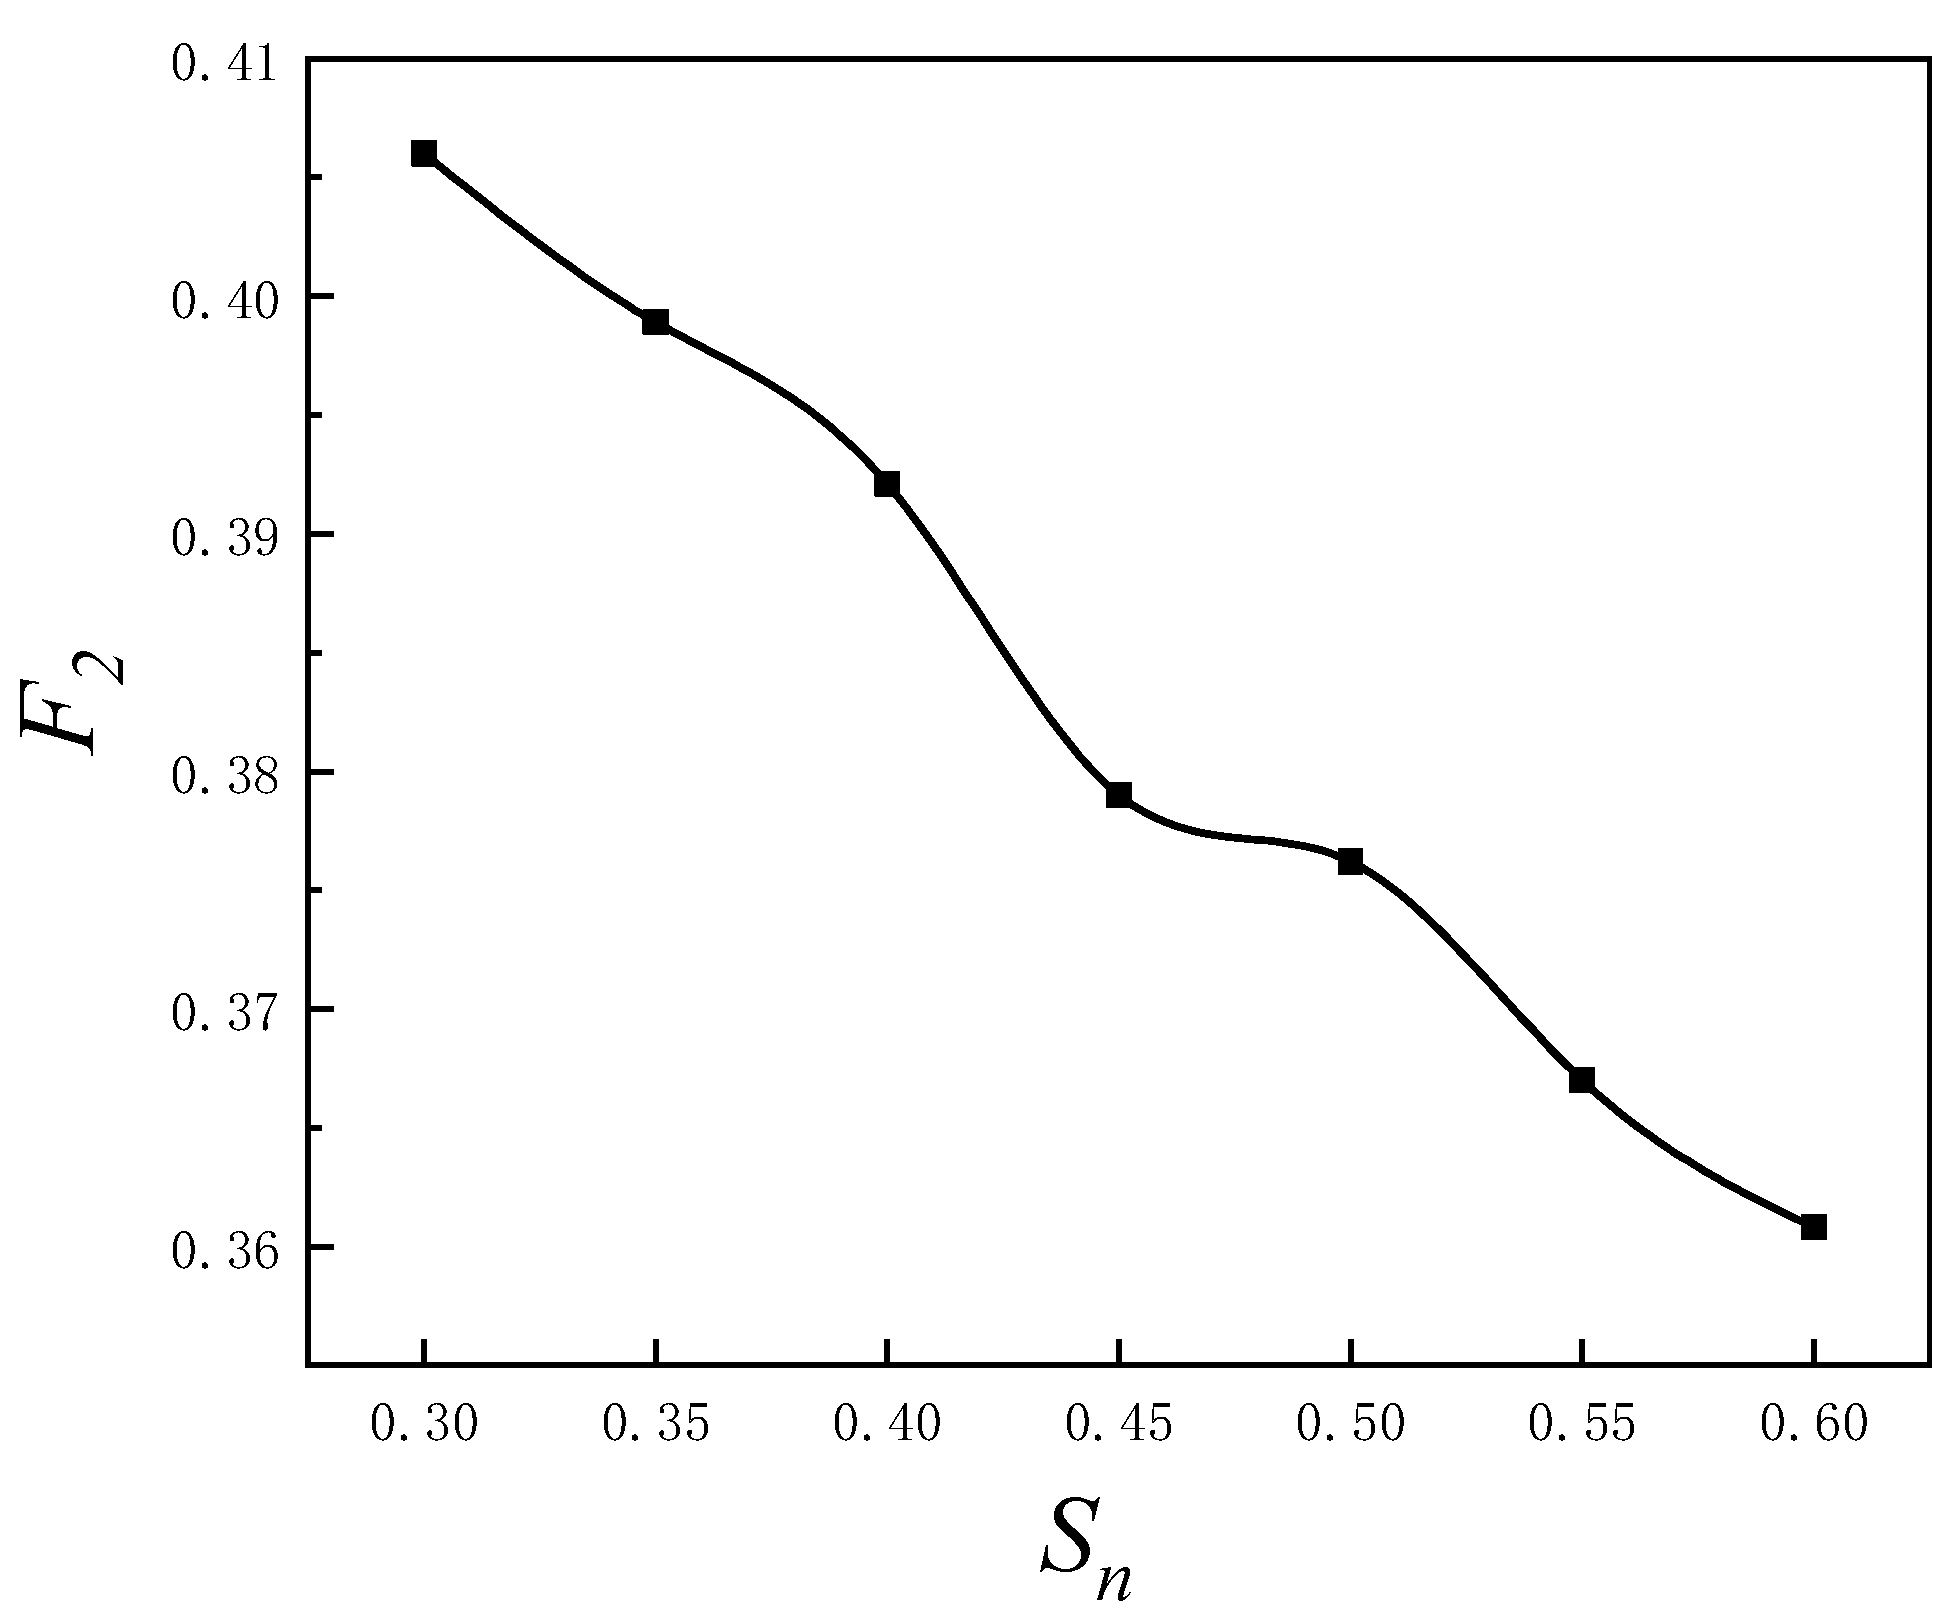
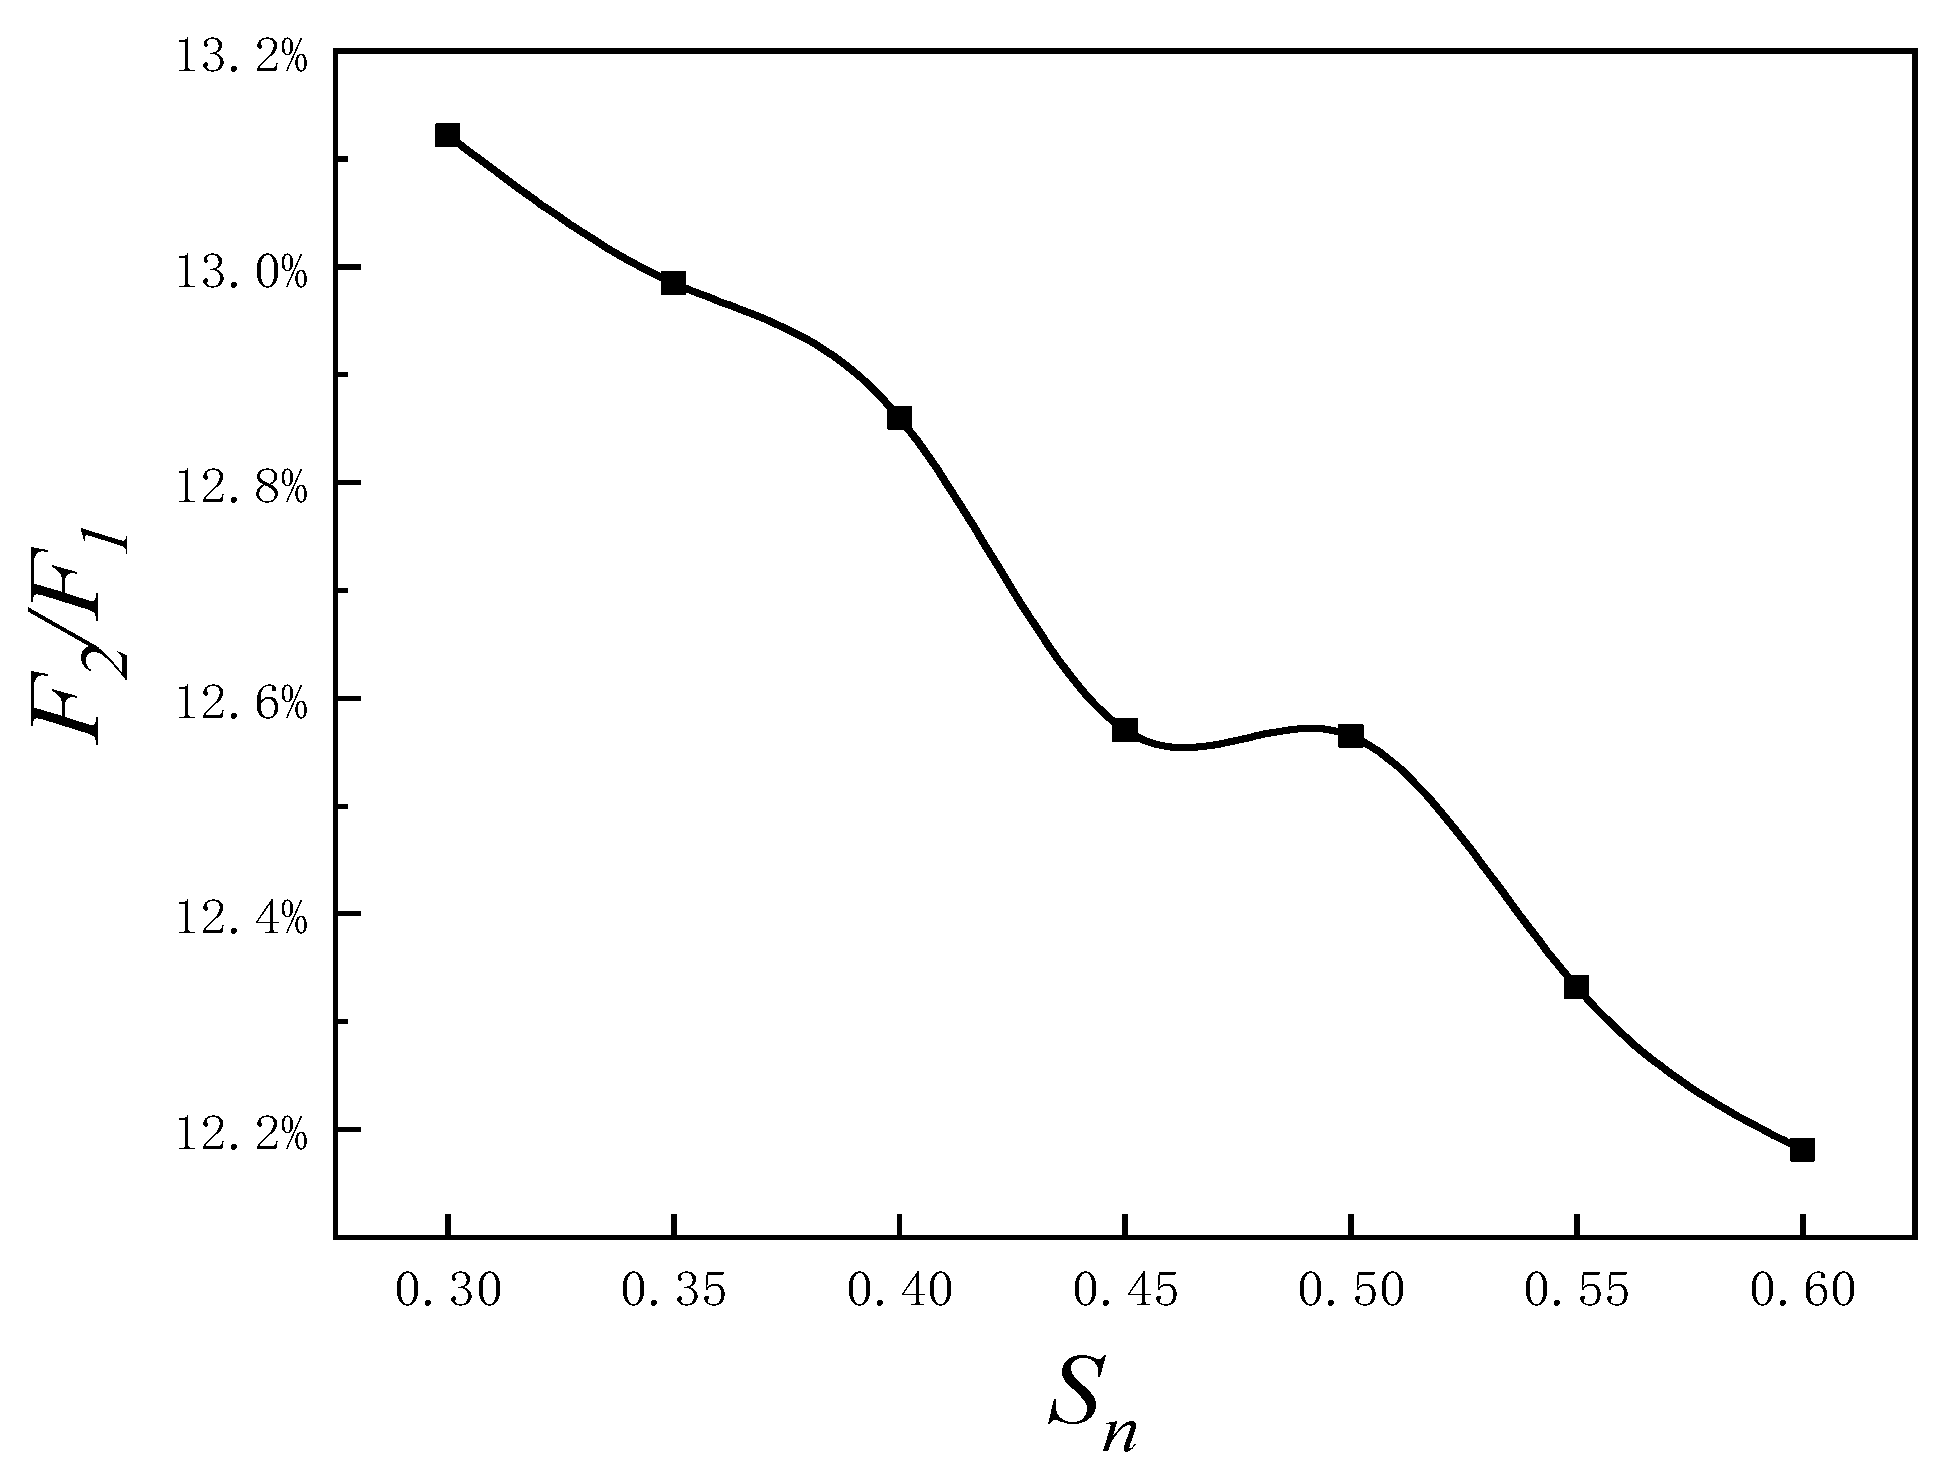
3.1. Influence of Net Solidity on Waves

To investigate the impact of net solidity on wave dynamics, numerical simulations were conducted in a wave flume containing only cages (without the turbine). Here, ΔX denotes the distance between the measurement point and the first cage in the wave propagation direction, while d represents the center-to-center spacing between adjacent cages. To evaluate the wave attenuation effect of the cages, the transmission coefficient CT (CT = HT/HI, where HT is the transmitted wave height and HI is the incident wave height) after waves pass through four cages was measured and plotted against solidity conditions, as shown in Figure 9. It has been found that the transmission coefficient CT increases significantly with higher solidity Sn in the cage array. After passing through the cage array, higher solidity Sn leads to a more rapid decrease in CT.
When waves encounter cylindrical structures in the ocean, significant changes occur on the free surface around the cylinder. A portion of the waves is obstructed by the cylinder, leading to rapid upward flow along its surface. The maximum vertical distance between the peak water level and the still water surface during this process is defined as the wave run-up R. For offshore platforms, excessive wave run-up can cause green water on the deck (overtopping) and generate intense slamming loads on the platform’s base, potentially resulting in structural damage. Therefore, comprehensive analysis of wave run-up is critical in engineering design.
Conversely, setting the platform deck too high also poses challenges. Excessive deck elevation increases construction costs and compromises the platform’s overall stability. Thus, investigating wave run-up around wind turbine foundations holds significant practical value. As shown in Figure 10, a secondary wave peak is observed on the windward side of the turbine foundation. However, the installation of cages reduces both the maximum wave amplitude and the secondary peak intensity. Additionally, the wave surface stabilizes after 20 s, suggesting that subsequent numerical calculations should focus on this steady-state phase for improved accuracy.
Figure 11 illustrates the wave run-up (R) around the wind turbine foundation under varying solidity conditions. The wave run-up is calculated using the steady-state wave surface data after 20 s. It has been found that, at α = 180 ° (upwave direction) for Sn = 0.3 to 0.5, the wave run-up at the upwave side of the foundation is the highest among all measurement points. At the same solidity conditions, the second-highest run-up occurs at α = 0 ° (downwave direction, equivalent to α = 360 ° ). For Sn > 0.55, the previous trend no longer holds. The wave run-up at the upwave direction ( α = 180 ° ) ceases to be at maximum and instead increases with higher Sn. On the other hand, the lowest wave run-up is observed within α = [45 ° , 90 ° ] and α = [270 ° , 315 ° ]. These regions are recommended for placing critical equipment and support structures on the foundation to minimize wave impact on the platform.
Figure 12 shows the variation curve of the average wave run-up R ¯ at all eight measurement points around the wind turbine foundation with cage solidity conditions in this numerical simulation. The results demonstrate that, as Sn increases, R ¯ across the eight points gradually decreases. This indicates that higher solidity benefits the fixed wind turbine foundation near the cages. Over time, biofouling (marine organism attachment) on aquaculture cages inevitably increases their effective solidity. While this phenomenon is typically detrimental to standalone cages, in the combined turbine–cage system, it paradoxically enhances the hydrodynamic performance of the turbine foundation. These findings are in a good position to validate the combination of aquaculture cages and OWTs.

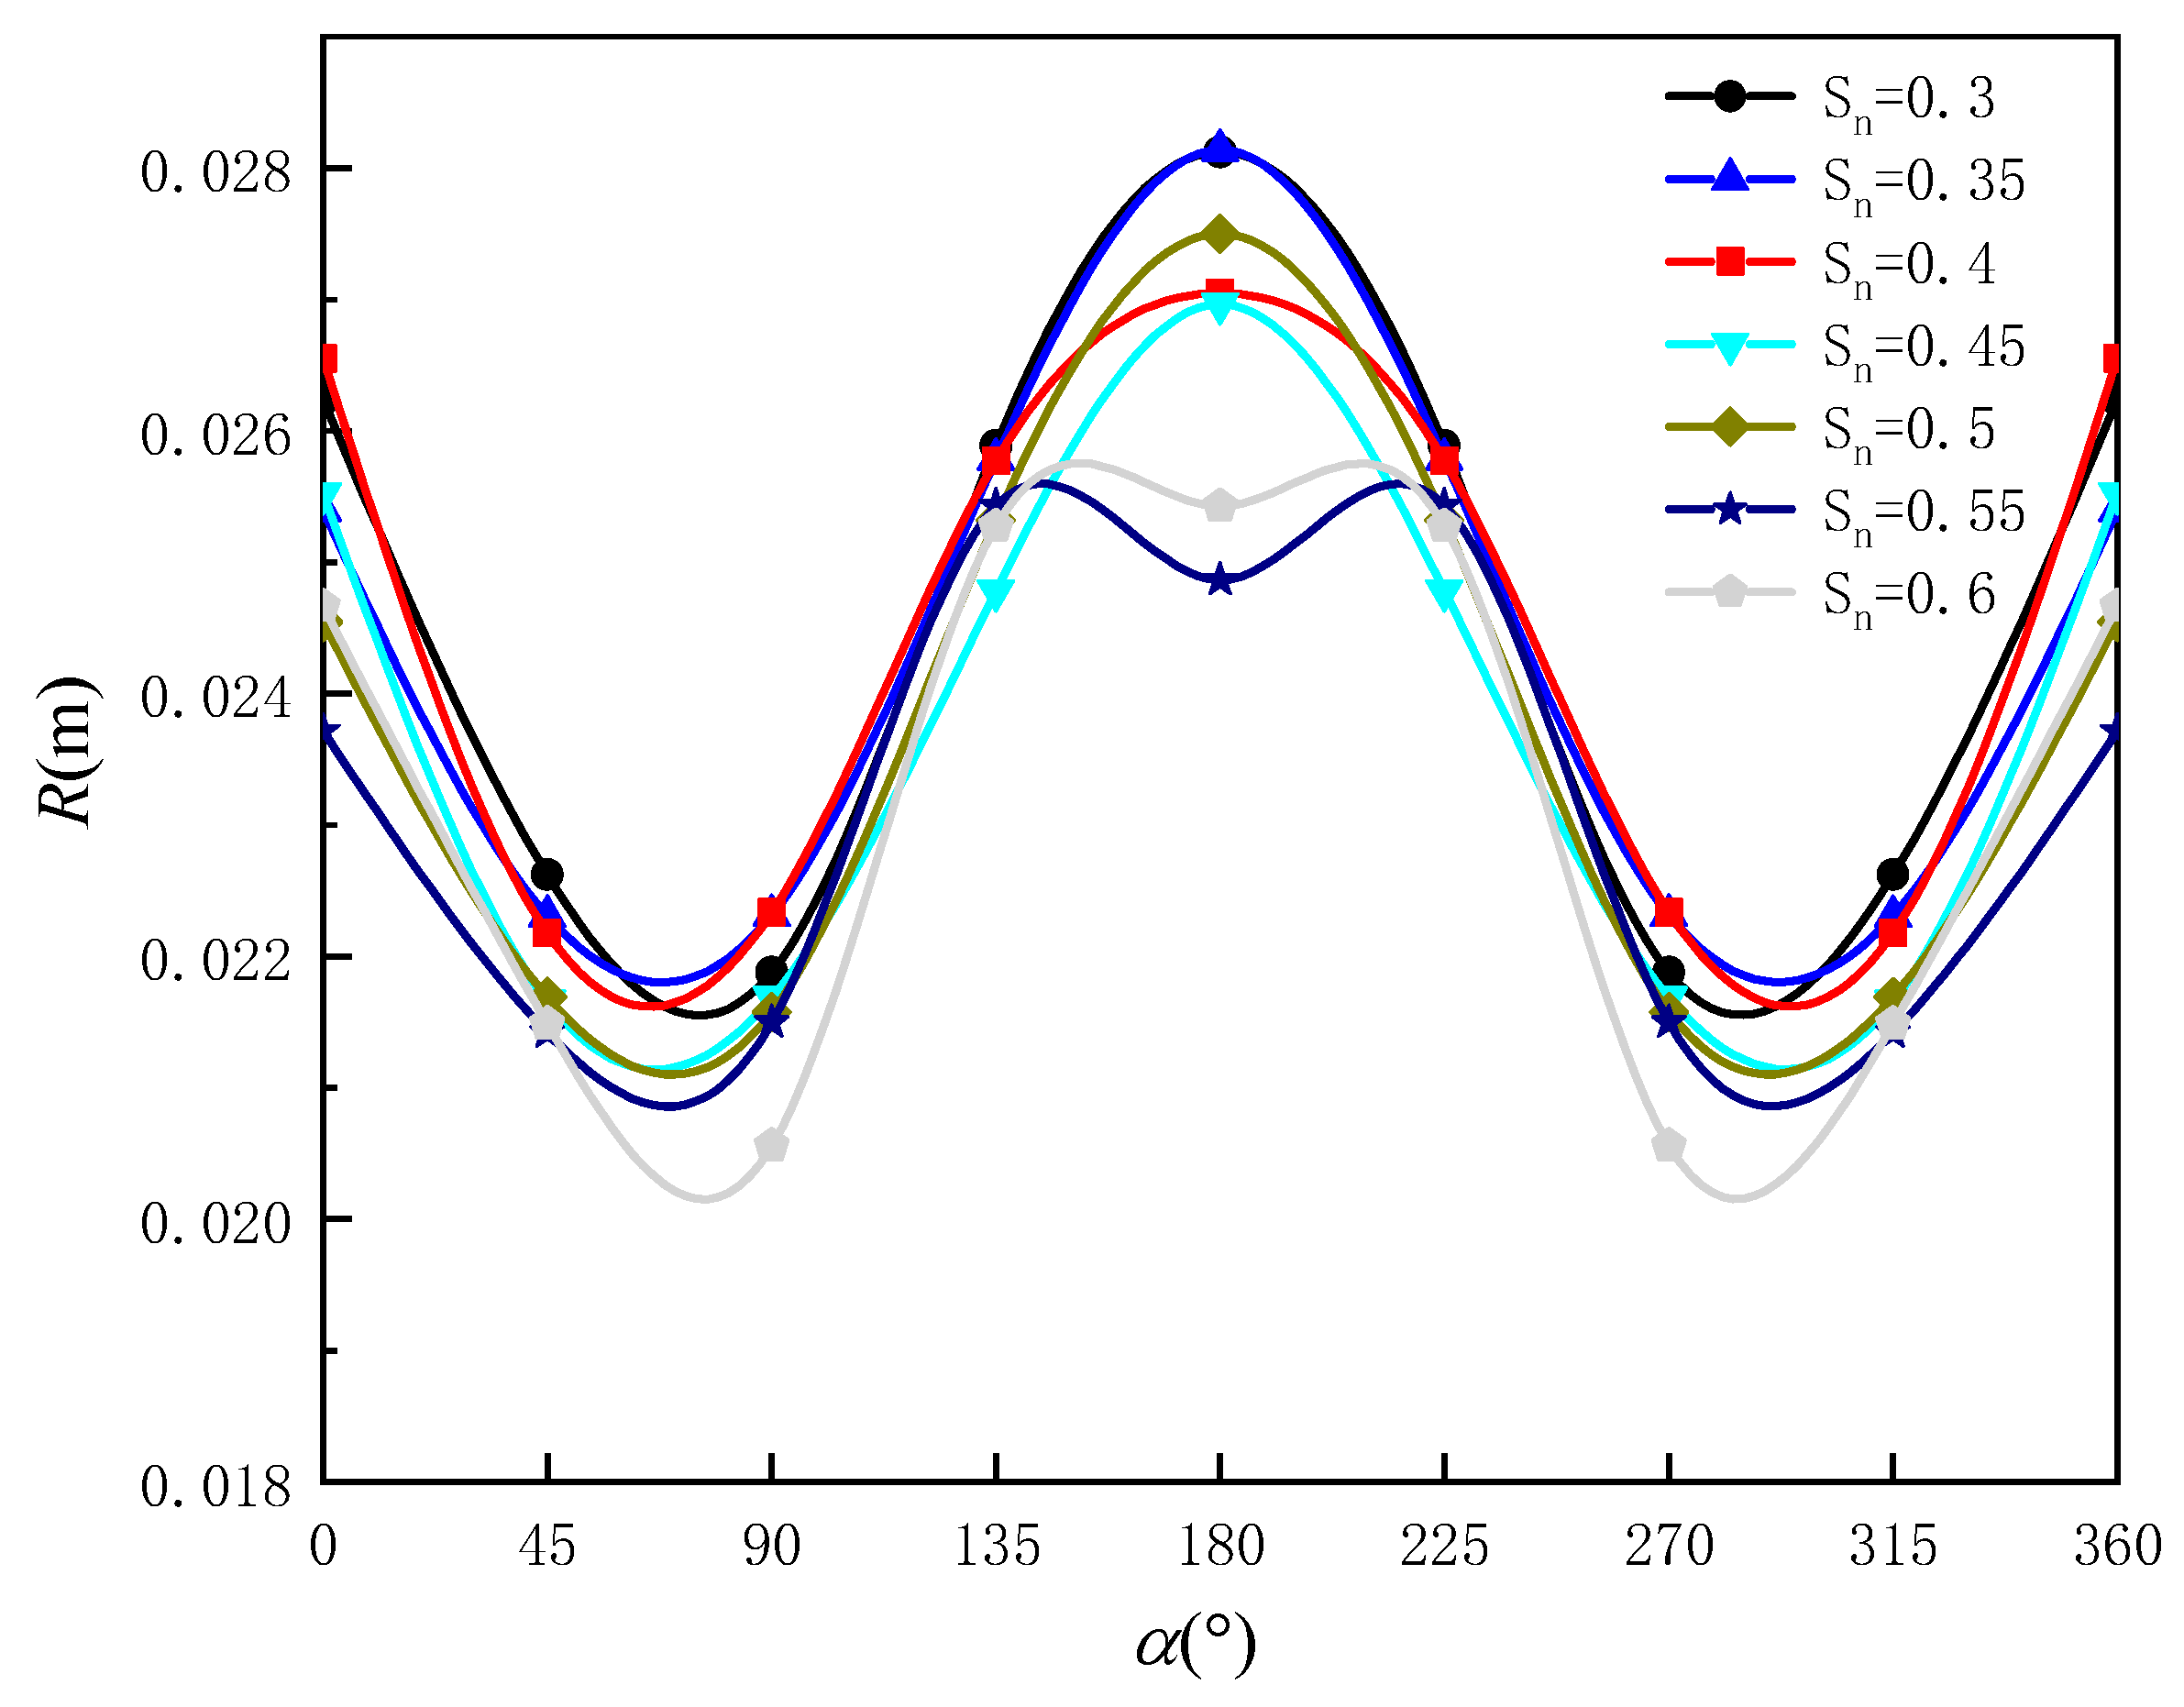
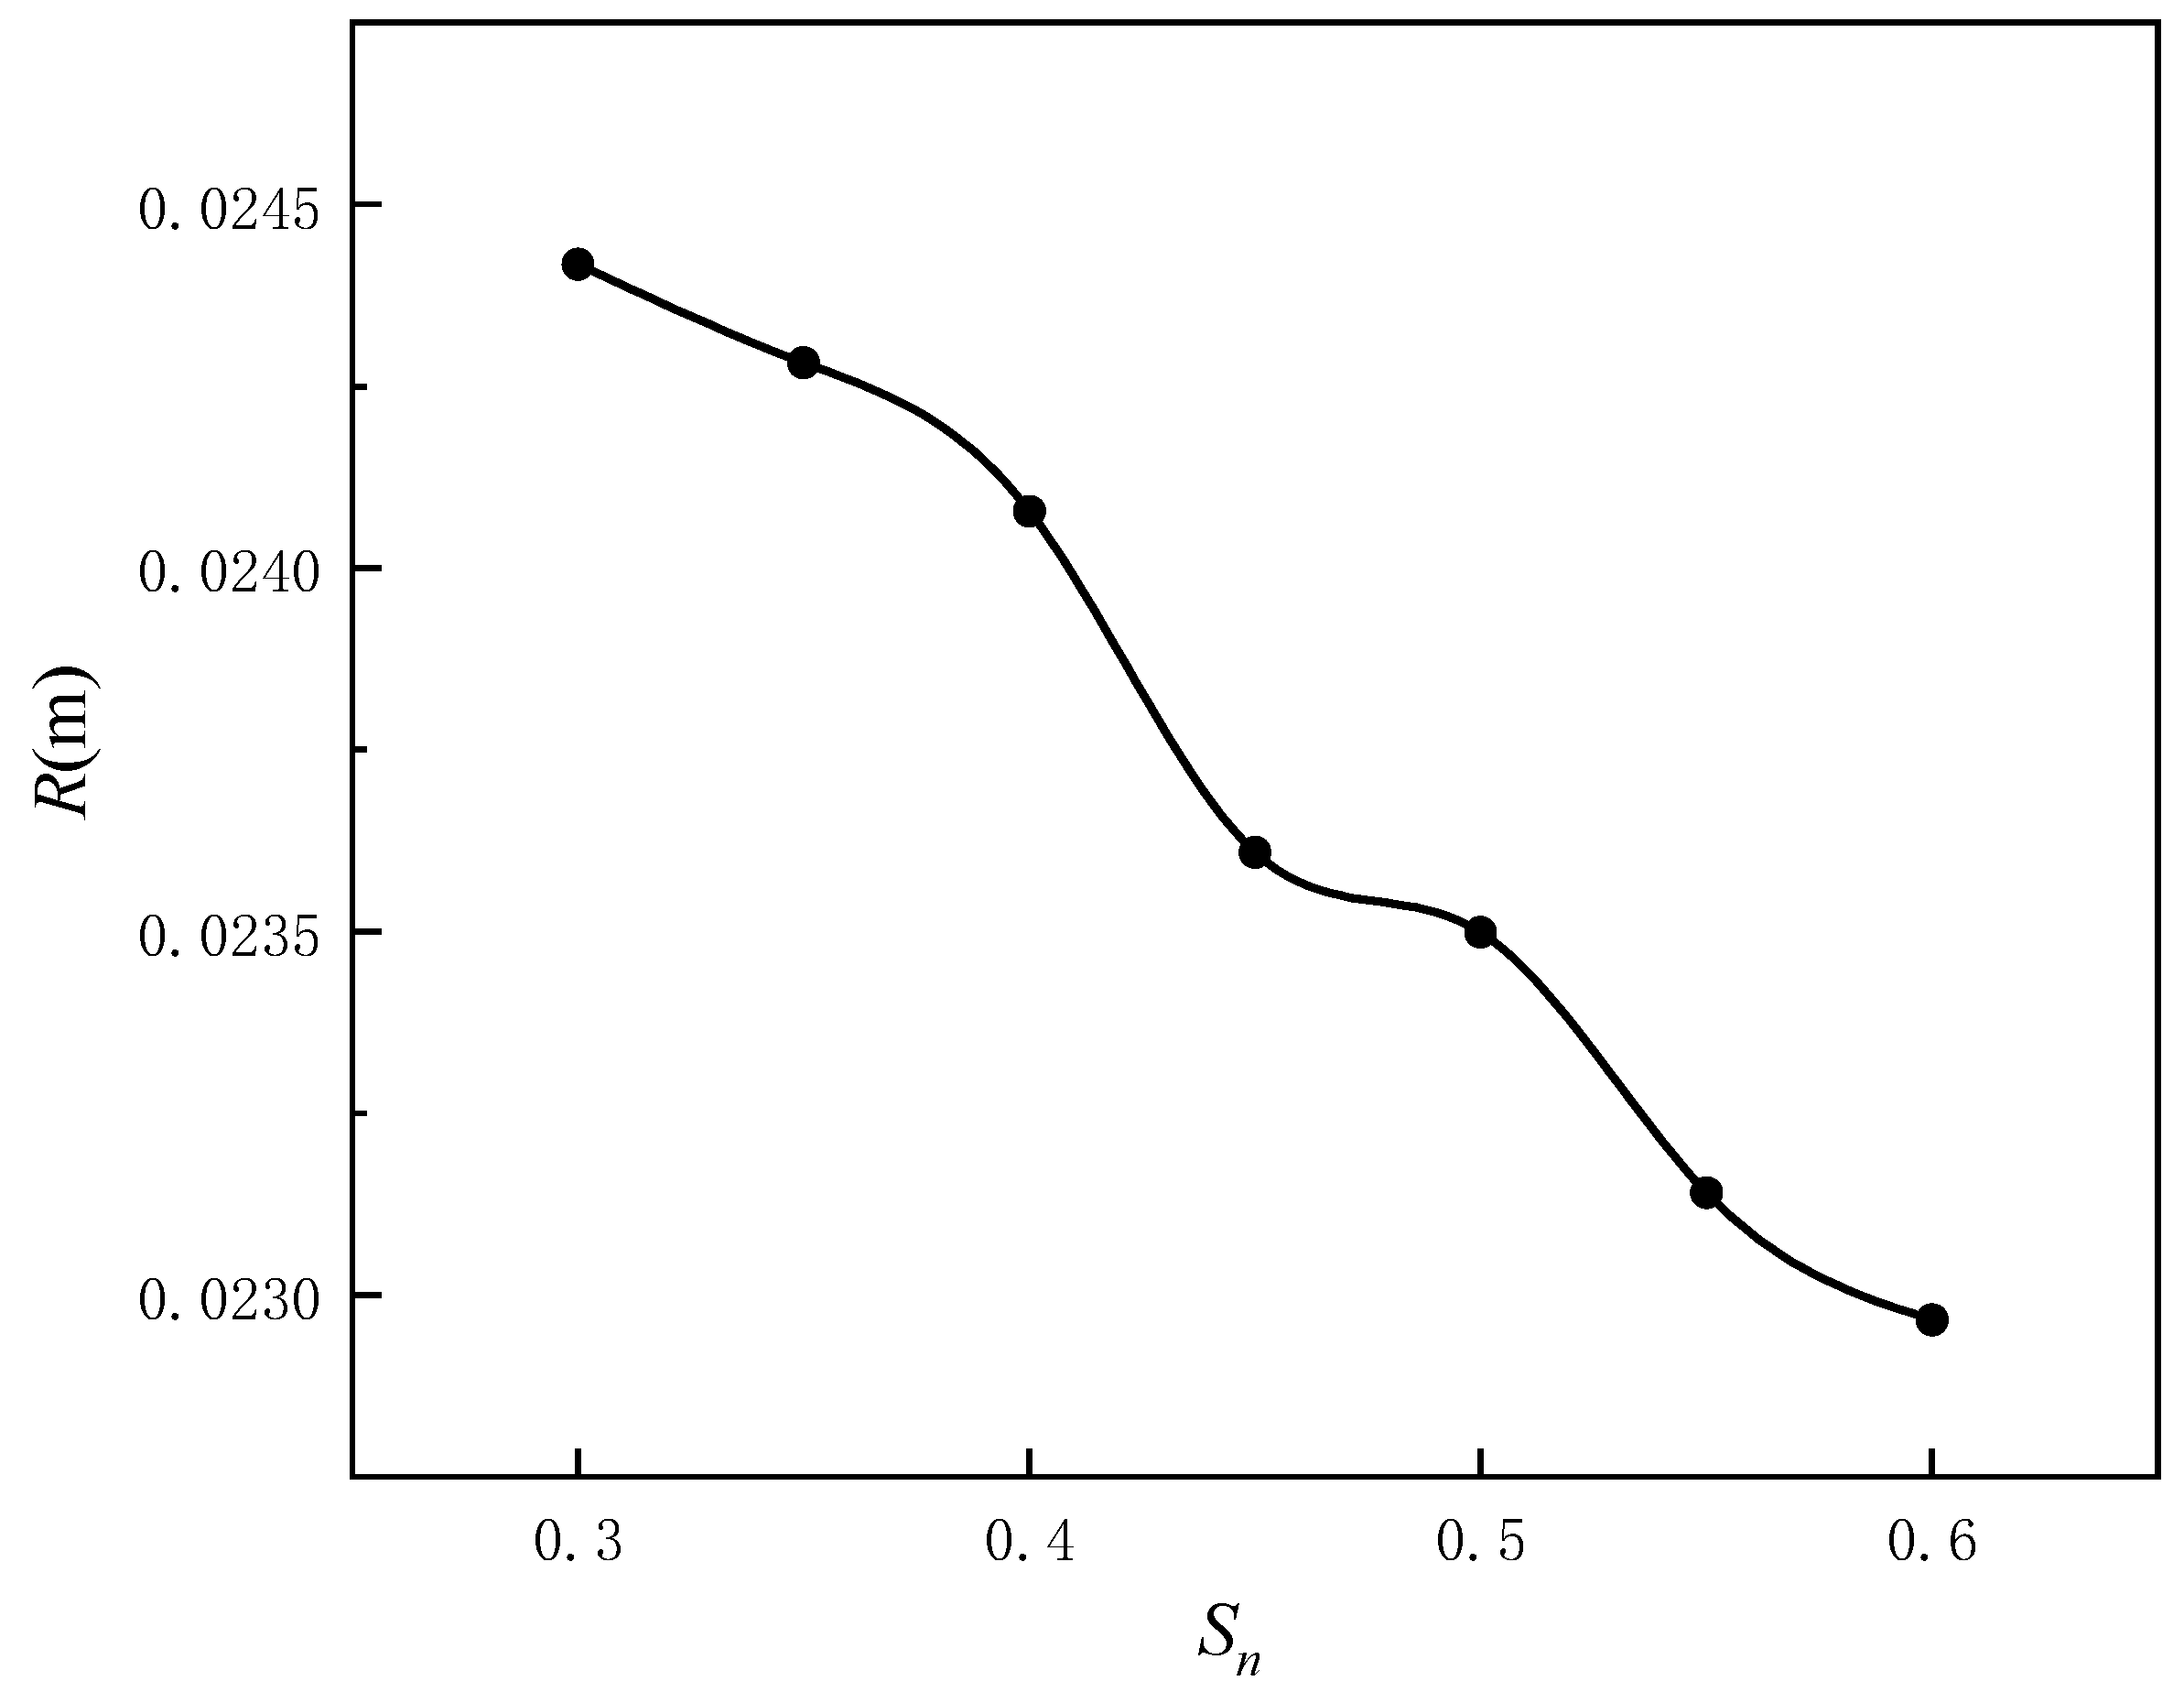
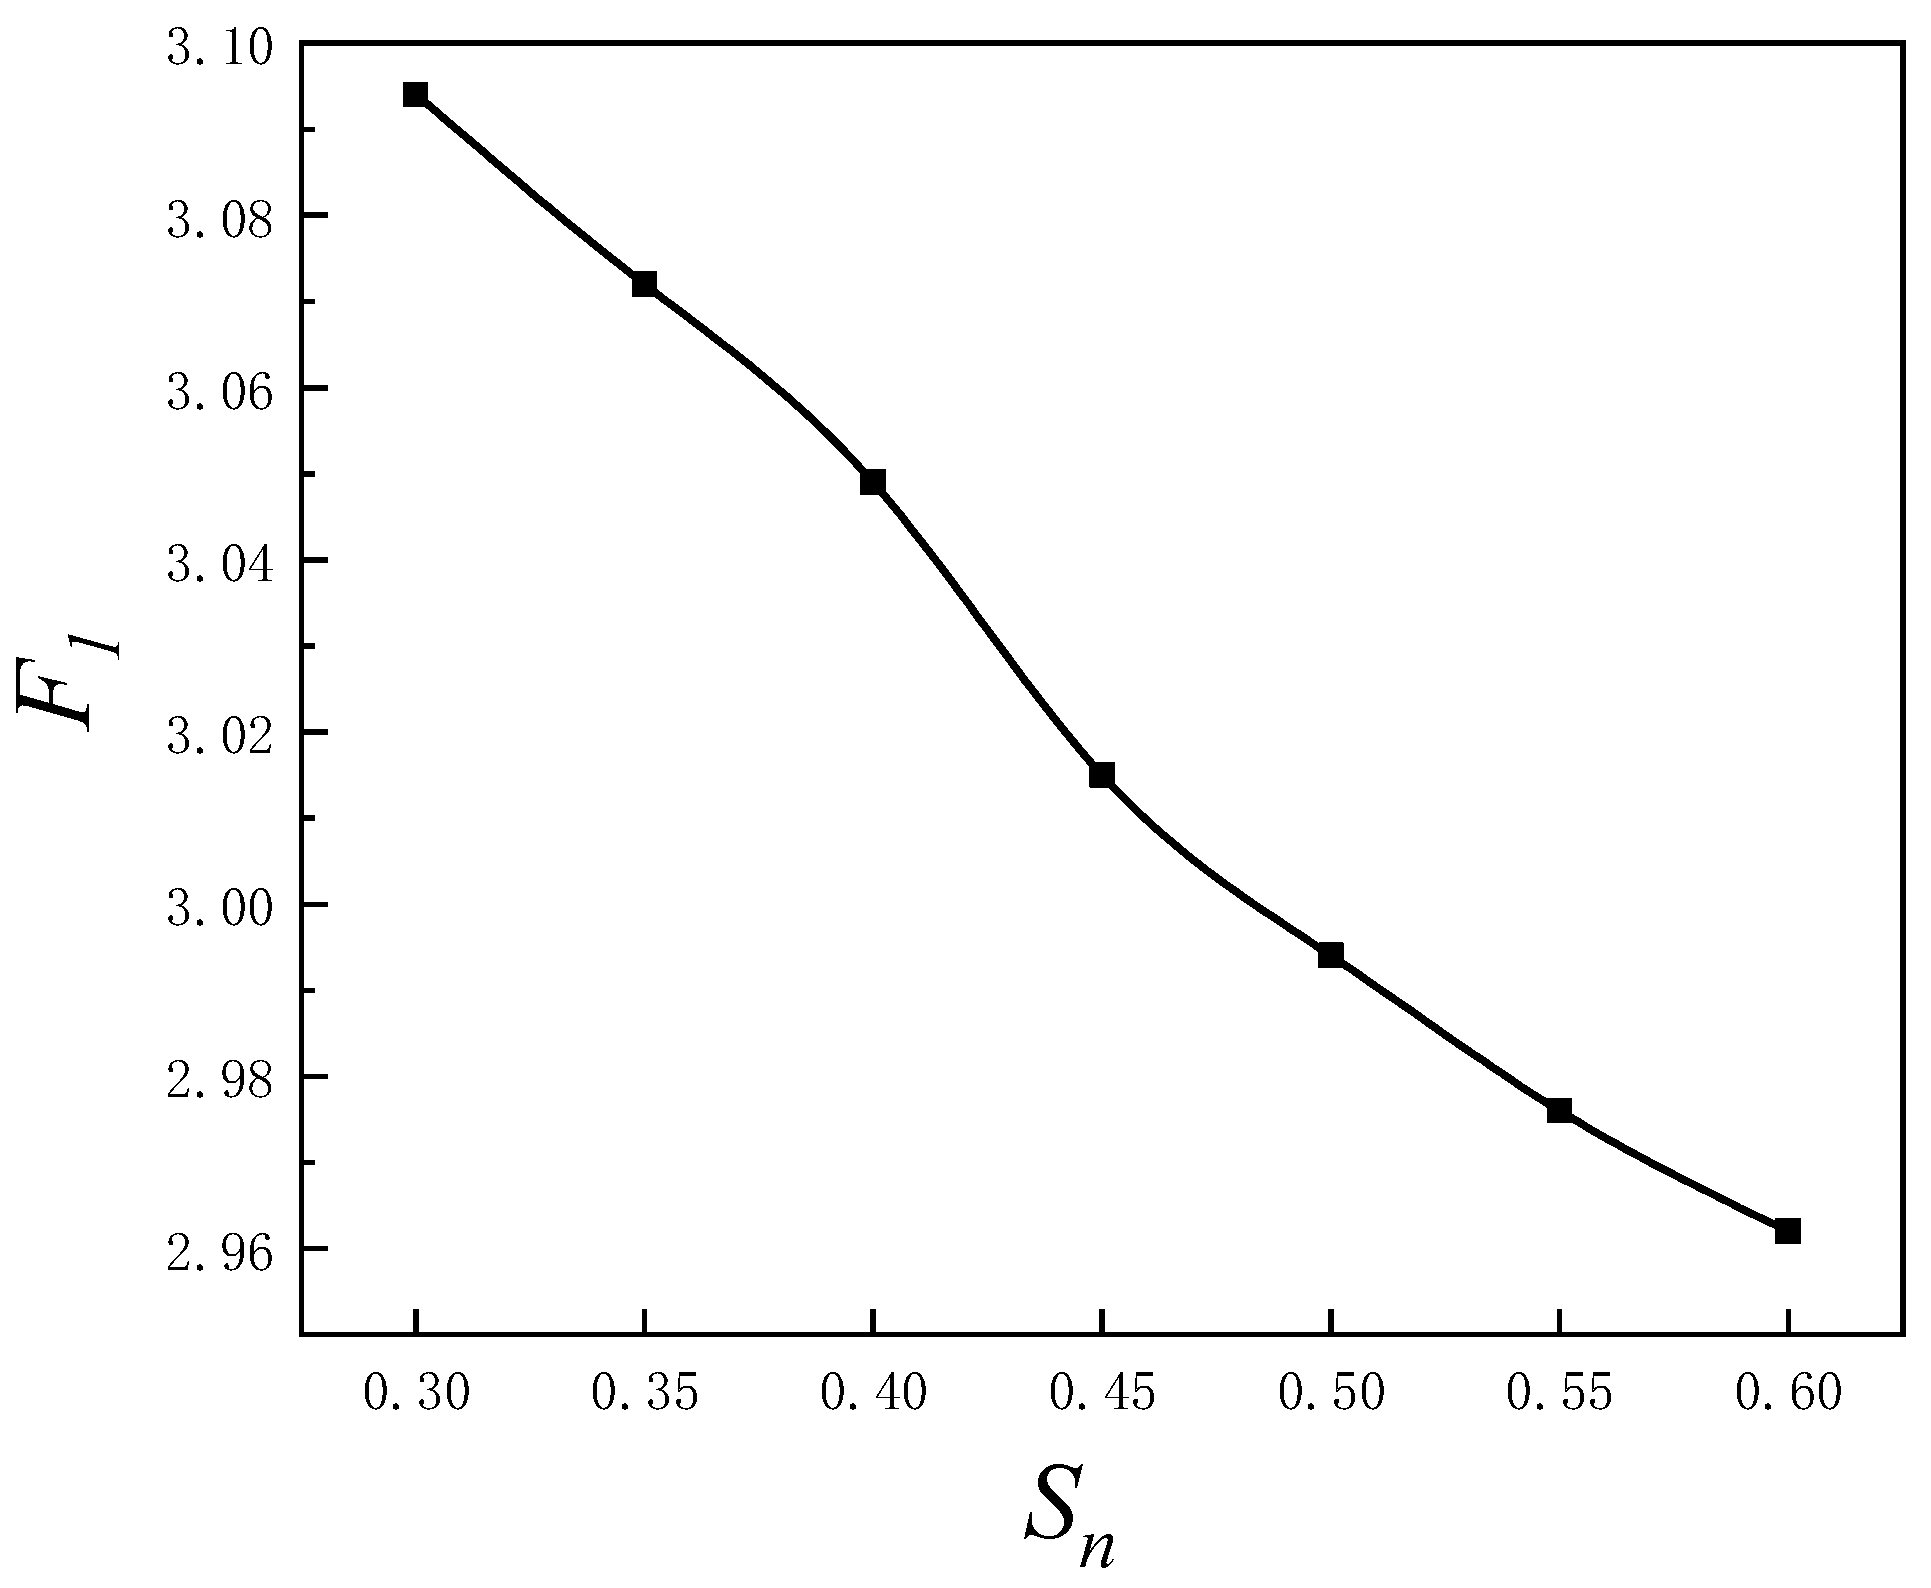
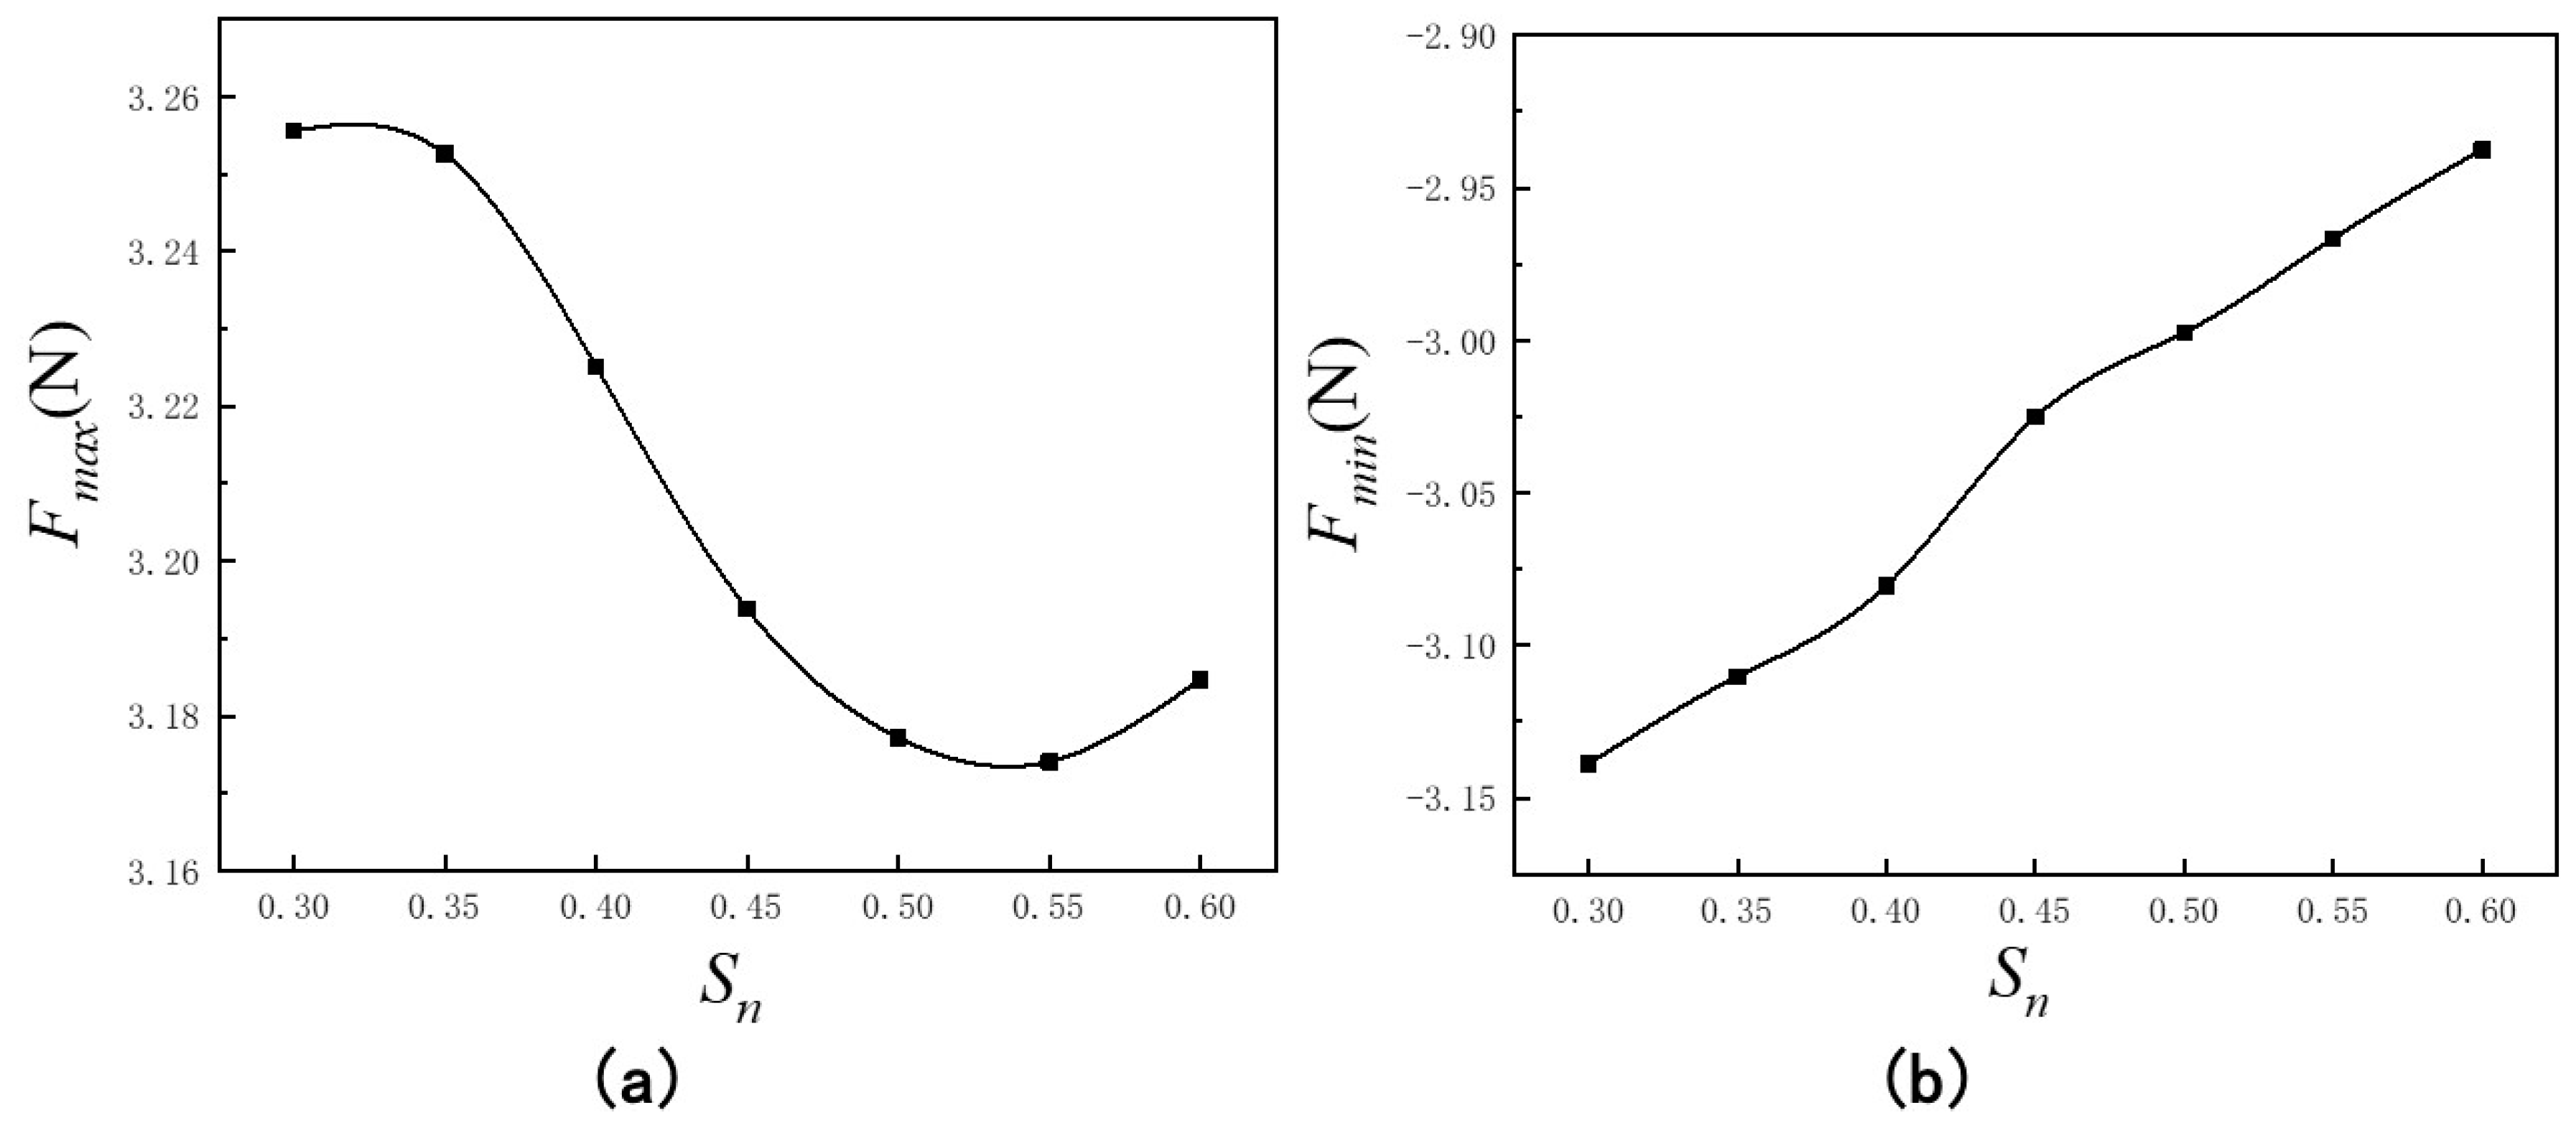
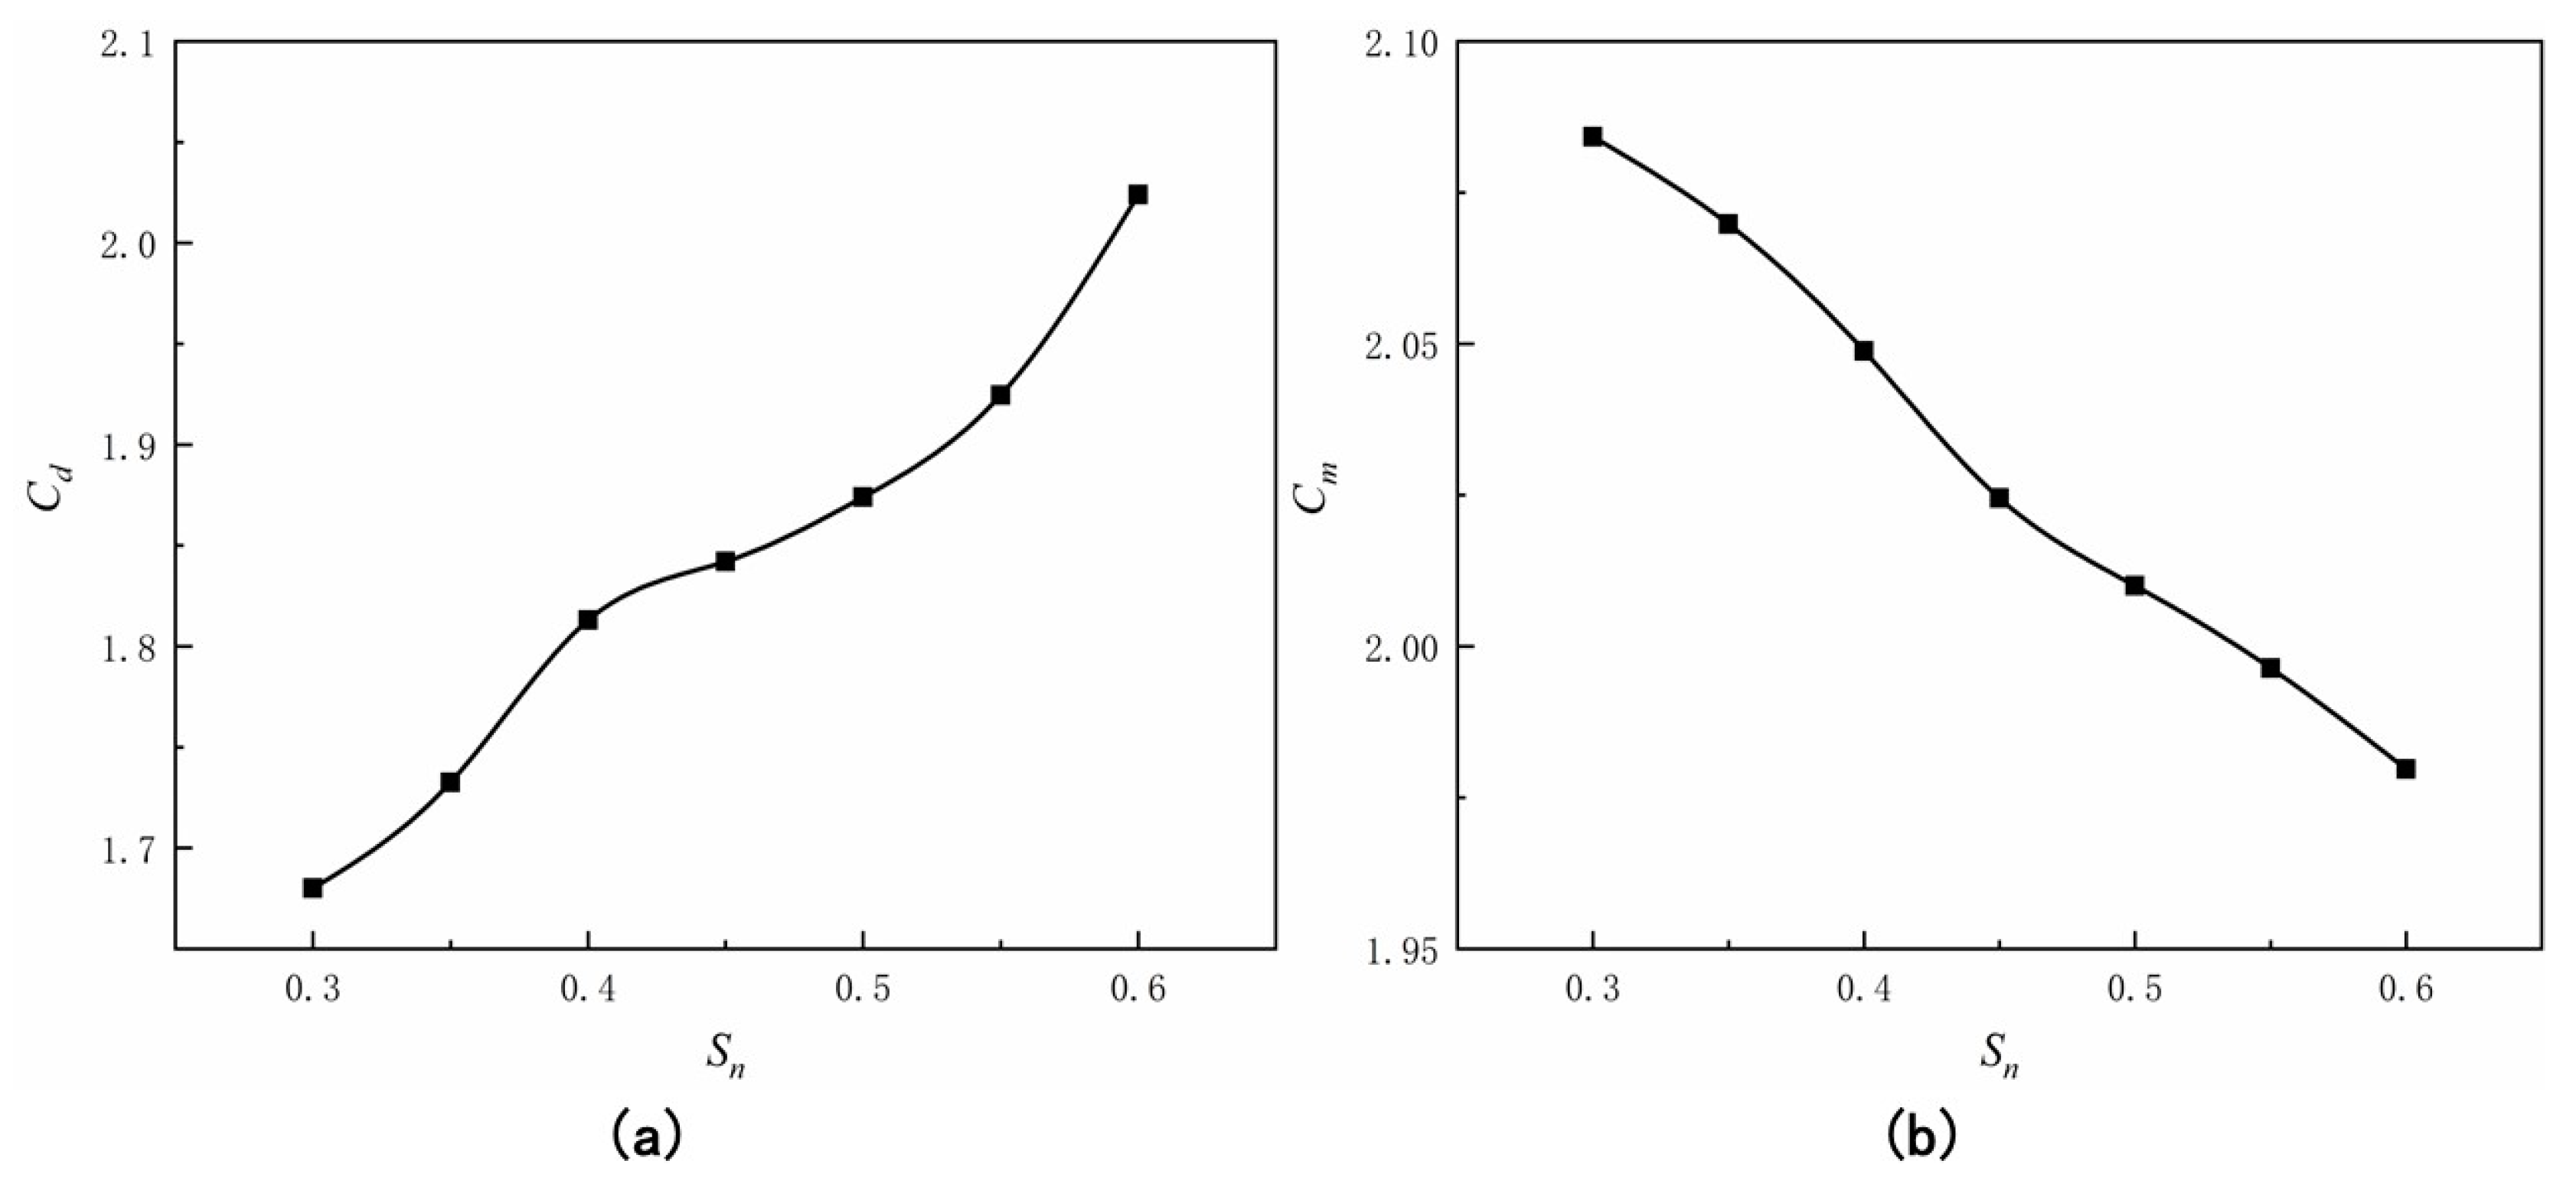
3.2. Influence of Net Solidity on Hydrodynamic Forces of the Turbine Foundation

The wave-induced forces on the turbine foundation primarily consist of first-order wave forces (wave force at the fundamental frequency, F1) and second-order wave forces (wave force at twice the fundamental frequency, F2). This section analyzes the impact of net solidity Sn on these forces. Figure 13 illustrates the variation of first-order wave forces with Sn. The results show that, as Sn increases, the first-order forces on the turbine foundation located behind the cage array gradually decrease.
Figure 14 presents the second-order wave forces as a function of Sn. For Sn between 0.3 and 0.6, the second-order forces diminish with increasing solidity. Figure 15 displays the ratio of second-order to first-order forces versus Sn, which aligns with the trend observed in Figure 14. These findings indicate that higher Sn reduces the nonlinearity of horizontal wave loads on the turbine foundation in the combined turbine–cage system.
Figure 16a shows the variation of the maximum horizontal wave force (peak positive force) with Sn. When Sn increases from 0.3 to 0.55, the maximum force decreases gradually, reaching its minimum at Sn = 0.55. However, for Sn > 0.55, the force unexpectedly increases. The reduction in maximum force between Sn = 0.3 and Sn = 0.55 is marginal, at only 2.5%. On the other hand, Figure 16b depicts the minimum horizontal wave force (peak negative force) versus Sn. The absolute value of the minimum force decreases with higher Sn, similar to the trend for the maximum force. The overall variation in peak forces (both maximum and minimum) is limited, with a total reduction of 6.4% across the tested Sn range.
The above results prove that the limited sensitivity of wave forces to Sn may stem from the permeable nature of cages and their relatively large dimensions compared to the turbine foundation. Only a small fraction of wave energy is dissipated after passing through the cages, resulting in minor changes to the peak horizontal forces acting on the foundation. It can be seen that increasing Sn effectively reduces nonlinear wave load components but has a limited impact on peak horizontal forces. The combined turbine–cage system demonstrates robustness against variations in net solidity, supporting its practical feasibility.
In this study, the Keulegan–Carpenter (KC) number for the wind turbine foundation is defined as KC = U m a x T d , where U m a x represents the maximum horizontal velocity below the wave surface, T is the wave period, and d is the diameter of the foundation. Figure 17 shows the variation of the drag coefficient Cd and inertia coefficient Cm for the turbine foundation with Sn. As indicated in Figure 9, the transmission coefficient CT at this position is minimal (0.95), implying wave height (H) attenuation does not exceed 5%. Given the minor attenuation, the theoretical wave forces were calculated using the unattenuated wave height, and the measured forces were combined with least squares fitting to determine Cd and Cm. The results in Figure 16 reveal that Cd increases with higher Sn, while Cm decreases.

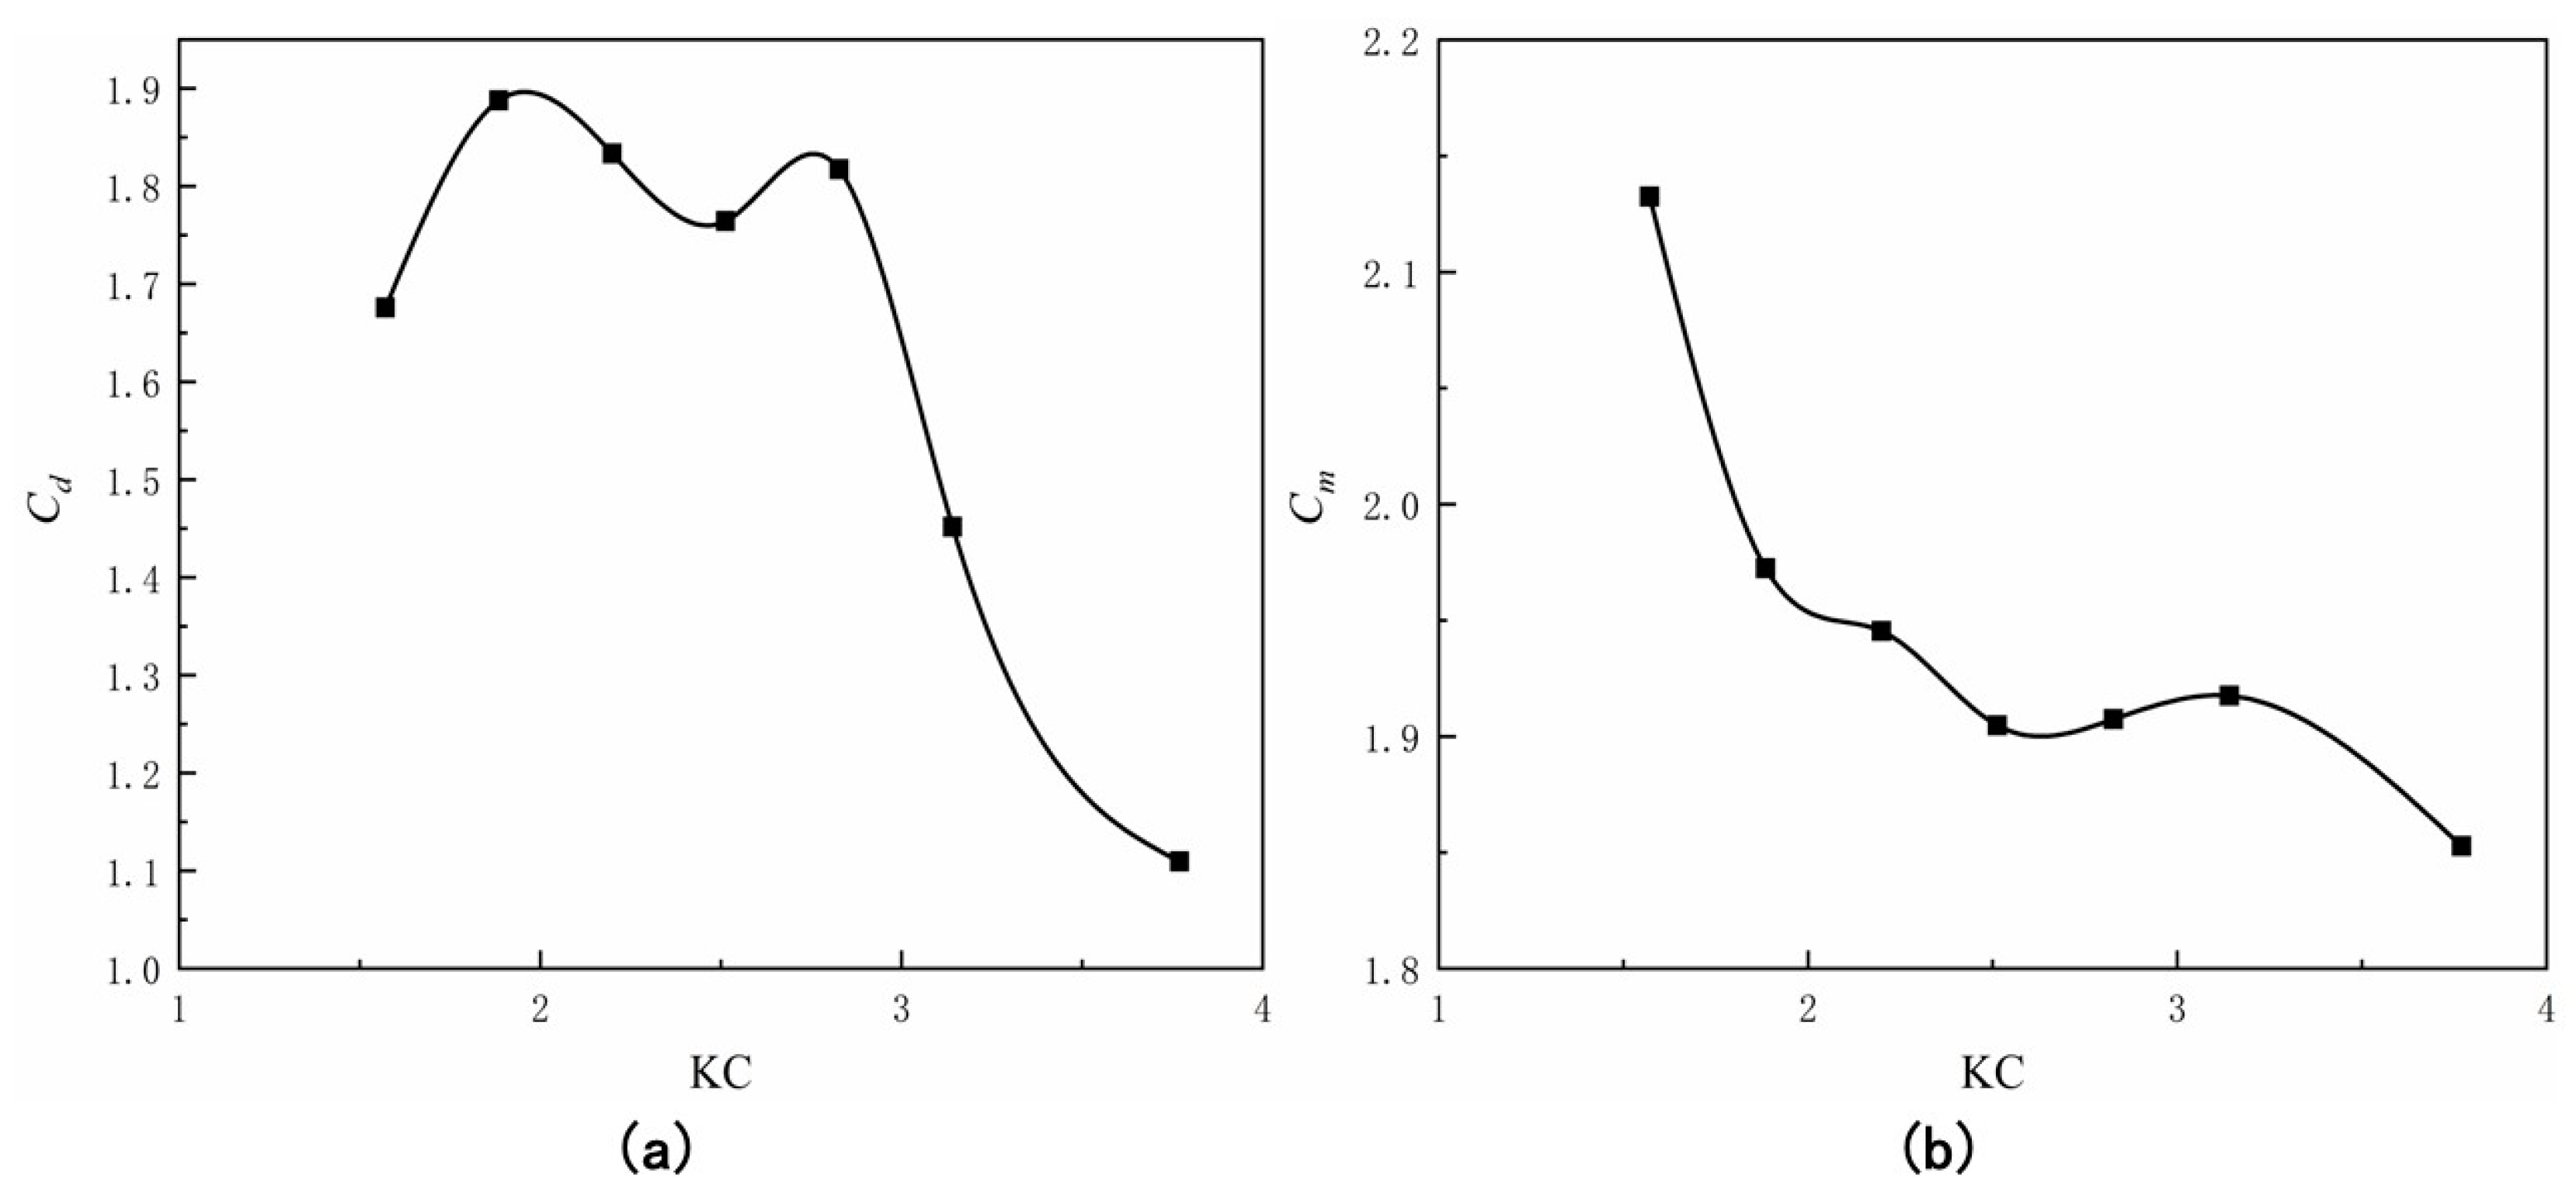
3.3. Influence of KC on Hydrodynamic Forces of the Turbine Foundation

Figure 18 illustrates the variation of Cd and Cm with the KC number for the turbine foundation at Sn = 0.5 and T = 1.4479 s under varying wave heights (see Table 2). The overall trend shows an initial increase in Cd, followed by a plateau, and then a gradual decrease. For KC < 1.7, Cd rises with increasing KC. At KC = 1.7–2.7, Cd stabilizes near its maximum value. For KC > 2.7, Cd declines sharply. However, the inertia coefficient Cm exhibits a distinct three-phase behavior. For KC < 2.5, Cm decreases rapidly with rising KC. At KC = 2.5–3.2, Cm remains relatively stable. For KC > 3.2, Cm resumes a gradual decline. The observed phenomena can be attributed to the following mechanisms: At low KC numbers, the flow field is dominated by inertial forces, and the velocity variation occurs over a longer time scale. Thus, the drag coefficient (Cd) increases with rising flow velocity, while the inertia coefficient (Cm) decreases rapidly due to reduced dominance of acceleration effects. With KC further increasing, turbulence intensifies around the turbine foundation, leading to stronger energy dissipation. It causes a decline in Cd (as turbulent mixing reduces steady drag forces) and a further reduction in Cm (as inertial effects are overshadowed by turbulent kinetic energy). The transition from inertial dominance to turbulence-driven energy loss governs the inverse relationship between KC number and force coefficients. This behavior aligns with classical fluid–structure interaction principles for bluff bodies in oscillatory flows.

4. Conclusions

The hydrodynamic characteristics of a fixed offshore wind turbine foundation integrated with aquaculture cages under finite-depth wave action were investigated using a porous media model in numerical simulation software. The numerical model in this study was validated by grid convergence analysis and physical experimental comparisons, thereby ensuring the computational efficiency and accuracy of the grid-based simulations. This study focused on the influence of cage solidity conditions on wave run-up around the turbine and horizontal wave forces. The key conclusions are as follows:
(1) Within the cage array, the transmission coefficient CT occasionally exceeds 1, likely due to wave reflection and local standing wave effects. Near the cage group (ΔX/d < 3), CT decreases rapidly with distance, indicating strong wave attenuation. Higher net solidity (Sn) significantly reduces wave energy in the vicinity of the cages, demonstrating that increased Sn effectively dampens the surrounding wave field.
(2) At Sn = 0.55, the maximum wave run-up R no longer occurs in the upwave direction (α = 180°) for the monopile, suggesting a critical solidity threshold. At Sn = 0.6, the maximum wave run-up R at α = 180° for the monopile decreases by 9.6% compared to the case at Sn = 0.6. In addition, the wave run-up at α = 180° becomes comparable to adjacent measurement points (α = 45–90°, 270–315°), flattening the spatial distribution of R. Increasing Sn reduces the average wave run-up around the turbine foundation, enhancing structural safety.
(3) Higher Sn weakens the nonlinearity of horizontal wave forces, reducing both first-order (fundamental frequency) and second-order (double frequency) forces. Negative horizontal forces (minimum values) decrease monotonically with Sn. The maximum positive horizontal force decreases initially with Sn, reaches a minimum at Sn = 0.55, and then increases for Sn > 0.55. This nonlinear reversal may arise from turbulent flow separation or vortex shedding occurring in the monopile.
(4) The drag coefficient Cd for the turbine foundation increases with Sn, while Cm decreases, reflecting enhanced drag dominance and reduced inertial effects at higher solidity. Cd initially rises with KC, stabilizes at KC = 1.7–2.7, and declines sharply at KC > 2.7. Cm decreases rapidly at KC < 2.5, plateaus at KC = 2.5–3.2, and resumes decreasing at KC > 3.2. This trend aligns with the transition from inertia-dominated to turbulence-dominated flow regimes.

Author Contributions

Conceptualization, B.W. and M.T.; methodology, Z.J.; software, M.T.; validation, B.W., M.T., and G.D.; investigation, M.T.; writing—original draft preparation, Z.J.; writing—review and editing, M.T. All authors have read and agreed to the published version of the manuscript.

Funding

This research was financially supported by the National Natural Science Foundation of China (Grant No. W2411038 and 52101303).

Data Availability Statement

The raw data supporting the conclusions of this article will be made available by the authors upon request.

Conflicts of Interest

Author Bin Wang was employed by the company PowerChina Huadong Engineering Corporation Limited. The remaining authors declare that the research was conducted in the absence of any commercial or financial relationships that could be construed as a potential conflict of interest.

References

  1. Zheng, X.; Lei, Y. Stochastic Response Analysis for a Floating Offshore Wind Turbine Integrated with a Steel Fish Farming Cage. Appl. Sci. 2018, 8, 1229. [Google Scholar] [CrossRef]
  2. Guo, Z.C.; Dong, G.H.; Zheng, Z.J. Numerical study of flow regimes and force characteristics for cruciform cylinder in oscillatory flow. Ocean. Eng. 2023, 290, 116223. [Google Scholar] [CrossRef]
  3. Balash, C.; Colbourne, B.; Bose, N.; Raman-Nair, W. Aquaculture Net Drag Force and Added Mass. Aquac. Eng. 2009, 41, 14–21. [Google Scholar] [CrossRef]
  4. Wang, T.Y.; Xu, T.J.; Wang, S.; Dong, G.H.; Yan, L.H. Hydrodynamic analysis of the combined structure of offshore monopile wind turbine foundation and aquaculture cage. Ocean. Eng. 2023, 287 Pt 1, 115796. [Google Scholar] [CrossRef]
  5. Liu, Z.; Soares, C.G. Numerical study of rope materials of the mooring system for gravity cages. Ocean. Eng. 2024, 298, 9. [Google Scholar] [CrossRef]
  6. Gansel, L.C.; Plew, D.R.; Endresen, P.C.; Olsen, A.I.; Misimi, E.; Guenther, J.; Jensen, Ø. Drag of Clean and Fouled Net Panels—Measurements and Parameterization of Fouling. PLoS ONE 2015, 10, e0131051. [Google Scholar] [CrossRef] [PubMed]
  7. Hu, Y.; Ji, H.; Liu, J.; Huang, C.; Huang, Z.; Zhang, Y.; Lei, J.; Chen, W.; Dong, Q.; Chen, C. Comparative analysis of dynamic and structural responses of three floating offshore wind turbine foundations. Ocean. Eng. 2025, 320, 120252. [Google Scholar] [CrossRef]
  8. Cheng, H.; Li, L.; Ong, M.C. Comparative study of five commonly used gravity type fish cages under pure current conditions. Ocean. Eng. 2022, 250, 110977. [Google Scholar] [CrossRef]
  9. Martin, A.B.H. A Lagrangian approach for the coupled simulation of fixed net structures in a Eulerian fluid model. J. Fluids Struct. 2020, 94, 102962. [Google Scholar] [CrossRef]
  10. Dong, G.H.; Tang, M.F.; Xu, T.J.; Bi, C.W.; Guo, W.J. Experimental analysis of the hydrodynamic force on the net panel in wave. Appl. Ocean. Res. 2019, 87, 233–246. [Google Scholar] [CrossRef]
  11. Bi, C.W.; Chen, Q.P.; Zhao, Y.P.; Su, H.; Wang, X.Y. Experimental investigation on the hydrodynamic performance of plane nets fouled by hydroids in waves. Ocean. Eng. 2020, 213, 107839. [Google Scholar] [CrossRef]
  12. Liu, Z.; Xu, H.; Soares, C.G. Experimental study on the mooring forces and motions of a fish cage under regular waves. Ocean. Eng. 2023, 280, 11. [Google Scholar] [CrossRef]
  13. Chen, Q.P.; Ma, C.; Zhao, Y.P.; Bi, C.W.; Liu, H.F. Hydrodynamics of focused waves acting on netting that extends above the mean sea level. Ocean. Eng. 2024, 309 Pt 1, 8. [Google Scholar] [CrossRef]
  14. Cheng, H.; Ong, M.C.; Li, L.; Chen, H. Development of a coupling algorithm for fluid-structure interaction analysis of submerged aquaculture nets. Ocean. Eng. 2022, 243, 110208. [Google Scholar] [CrossRef]
  15. Liu, H.F.; Zhao, T.H.; Liu, Y. Investigation on dynamic performance of semi-submersible aquaculture platform in two mooring forms. Ocean. Eng. 2024, 297, 14. [Google Scholar] [CrossRef]
  16. Bi, C.W.; Zhao, Y.P.; Dong, G.H.; Wu, Z.M.; Zhang, Y.; Xu, T.J. Drag on and flow through the hydroid-fouled nets in currents. Ocean. Eng. 2022, 161, 195–204. [Google Scholar] [CrossRef]
  17. Xie, M.; Li, S.; Mu, Y.; Wei, Y.; Xu, T.; Sun, Z.; Yuan, C. Experimental investigation on the mooring dynamics of the flexible trash intercept net under wave-current combined actions. Ocean. Eng. 2023, 268, 113544. [Google Scholar] [CrossRef]
  18. Hu, Y.; Yang, J.; Baniotopoulos, C.; Wang, X.; Deng, X. Dynamic analysis of offshore steel wind turbine towers subjected to wind, wave and current loading during construction. Ocean. Eng. 2020, 216, 108084. [Google Scholar] [CrossRef]
  19. Ma, C.; Bi, C.W.; Xu, Z.; Zhao, Y.P. Dynamic behaviors of a hinged multi-body floating aquaculture platform under regular waves. Ocean. Eng. 2022, 243, 110278. [Google Scholar] [CrossRef]
  20. Liu, Z.; Soares, C.G. Sensitivity analysis of the cage volume and mooring forces for a gravity cage subjected to current and waves. Ocean. Eng. 2023, 287 Pt 1, 115715. [Google Scholar] [CrossRef]
  21. Bannister, J.; Sievers, M.; Bush, F.; Bloecher, N. Biofouling in marine aquaculture: A review of recent research and developments. Biofouling 2019, 35, 631–648. [Google Scholar] [CrossRef]
  22. Zhao, Y.P.; Bi, C.W.; Sun, X.X.; Dong, G.H. A Prediction on Structural Stress and Deformation of Fish Cage in Waves Using Machine-Learning Method. Aquac. Eng. 2019, 85, 15–21. [Google Scholar] [CrossRef]
  23. Bi, C.W.; Zhao, Y.P.; Sun, X.X.; Zhang, Y.; Guo, Z.X.; Wang, B.; Dong, G.H. An efficient artificial neural network model to predict the structural failure of high-density polyethylene offshore net cages in typhoon waves. Ocean. Eng. 2020, 196, 106793. [Google Scholar] [CrossRef]
  24. Shi, W.; Zeng, X.; Feng, X.; Shao, Y.; Li, X. Numerical study of higher-harmonic wave loads and runup on monopiles with and without ice-breaking cones based on a phase-inversion method. Ocean. Eng. 2023, 267, 113221. [Google Scholar] [CrossRef]
  25. Tang, H.J.; Yeh, P.H.; Huang, C.C.; Yang, R.Y. Numerical study of the mooring system failure of aquaculture net cages under irregular waves and current. Ocean. Eng. 2020, 216, 108110. [Google Scholar] [CrossRef]
  26. Bi, C.W.; Ma, C.; Zhao, Y.P.; Xin, L.X. Physical model experimental study on the motion responses of a multi-module aquaculture platform. Ocean. Eng. 2021, 239, 109862. [Google Scholar] [CrossRef]
  27. Fan, Z.; Liang, Y.H.; Yun-Peng, Z. Review of the research on the hydrodynamics of fishing cage nets. Ocean. Eng. 2023, 276, 114192. [Google Scholar] [CrossRef]
  28. Klebert, P.; Su, B. Turbulence and flow field alterations inside a fish sea cage and its wake. Appl. Ocean. Res. 2020, 98, 102113. [Google Scholar] [CrossRef]
  29. Gharechae, A.; Ketabdari, M.J. Semi-analytical study of wave interaction with a submerged permeable sphere applied on a spherical aquaculture cage. Ocean. Eng. 2023, 272, 113839. [Google Scholar] [CrossRef]
  30. Patursson, Ø.; Swift, M.R.; Tsukrov, I.; Simonsen, K.; Baldwin, K.; Fredriksson, D.W.; Celikkol, B. Development of a porous media model with application to flow through and around a net panel. Ocean. Eng. 2010, 37, 314–324. [Google Scholar] [CrossRef]
  31. Bi, C.W.; Zhao, Y.P.; Dong, G.H.; Cui, Y.; Gui, F.K. Experimental and numerical investigation on the damping effect of net cages in waves. J. Fluids Struct. 2015, 55, 122–138. [Google Scholar] [CrossRef]
Figure 1. Schematic diagram of transforming a circular cage into a porous medium model.
Jmse 13 00924 g001
Figure 2. Schematic diagram of coordinate system for the calculation of wave force.
Jmse 13 00924 g002
Figure 3. Size diagram of the numerical flume.
Jmse 13 00924 g003
Figure 4. Grid division around the net cages (NC) and wind turbine (WT).
Jmse 13 00924 g004
Figure 5. Grid division diagram of the water tank.
Jmse 13 00924 g005
Figure 6. Comparison of grid selection in vertical direction (splash zone).
Jmse 13 00924 g006
Figure 7. Wave surface curve at 20 s for different grid numbers in wave propagation direction.
Jmse 13 00924 g007
Figure 8. The numerical simulation results of wave transmission coefficient CT downstream of the cage model are compared with the experimental results: (a) different wave heights at T = 1.0 s, (b) different wave periods at H = 4 cm.
Jmse 13 00924 g008
Figure 9. Transmission coefficient curves at different positions when different compactness is selected.
Jmse 13 00924 g009
Figure 10. (a) Wave duration curve and (b) its amplitude spectrums at the cylindrical wave-facing surface.
Jmse 13 00924 g010
Figure 11. Wave run-up around the wind turbine foundation for different solidity conditions.
Jmse 13 00924 g011
Figure 12. Curve of the average wave run-up around the wind turbine foundation.
Jmse 13 00924 g012
Figure 13. Variation of first-order wave forces on the turbine foundation with Sn.
Jmse 13 00924 g013
Figure 14. Variation of second-order wave forces on the turbine foundation with Sn.
Jmse 13 00924 g014
Figure 15. The ratio of second-order to first-order forces versus Sn.
Jmse 13 00924 g015
Figure 16. Variation of (a) maximum horizontal wave force and (b) minimum horizontal wave force with Sn.
Jmse 13 00924 g016
Figure 17. Variation of (a) the drag coefficient Cd and (b) the inertia coefficient Cm for the turbine foundation with Sn.
Jmse 13 00924 g017
Figure 18. Variation of (a) Cd and (b) Cm with KC number for the turbine foundation at Sn = 0.5.
Jmse 13 00924 g018
Table 1. Condition 1: identical wave parameters but different solidity conditions.
SnWave Height (m)Wave Length (m)Wave Steepness (H/L)Period (s)h/L
0.300.052.50.021.44790.16
0.35
0.40
0.45
0.50
0.55
0.60
Table 2. Condition 2: identical solidity conditions and wave period but varying wave heights.
SnWave Height (m)Wave Length (m)Wave Steepness (H/L)Period (s)h/L
0.30.050.250.0201.44790.16
0.060.024
0.070.028
0.080.032
0.090.036
0.100.040
0.120.048
Disclaimer/Publisher’s Note: The statements, opinions and data contained in all publications are solely those of the individual author(s) and contributor(s) and not of MDPI and/or the editor(s). MDPI and/or the editor(s) disclaim responsibility for any injury to people or property resulting from any ideas, methods, instructions or products referred to in the content.

