Abstract
The Miocene Hanjiang Formation (HJF) is a remarkable exploration target in the Pearl River Mouth Basin (PRMB). However, challenges such as bias in current sequence stratigraphic schemes, limitations in high-resolution stratigraphic schemes, and incomplete understanding of genetic mechanisms may present obstacles for refining hydrocarbon exploration strategies. This study integrates gamma ray (GR) logging data, lithological variations, sequence stratigraphy, and cyclostratigraphy to delineate connections between sequence stratigraphy and astronomical forcing. The analysis utilizes gamma-ray logging data from boreholes LFA (1250–1960 m) and LFB (1070–1955 m) in the HJF. We constructed an absolute astronomical time scale anchored at the HJF’s top boundary (10.221 ± 0.4 Ma), identifying 6 third-order sequences through detailed analysis. Notably, 18 long-eccentricity cycles (405 kyr) and distinctive 1.2-Myr obliquity modulation signals were detected in the stratigraphic record. Our study demonstrates distinct connection between third-order sequence boundaries and the 1.2-Myr obliquity cycles, congruent with both global eustatic sea-level fluctuations and regional sea-level changes in the PRMB. The integration of cyclostratigraphic methods with sequence stratigraphic analysis proves particularly valuable for objective stratigraphic subdivision and understanding third-order sequence evolution in the divergent continental margin settings of the South China Sea. This approach enhances temporal resolution on a regional scale while revealing astronomical forcing mechanisms governing sedimentary cyclicity.
1. Introduction
In geology, sequence stratigraphy is the discipline that subdivides and links sedimentary rock formations into units bounded by unconformities across various scales and interprets these units in terms of relative sea-level changes. Since its inception, this discipline has become an indispensable tool in guiding hydrocarbon exploration in continental margins and basins [1,2,3]. The allogenic processes controlled by tectonics [4,5] and climate [6,7] and the autogenic processes [8,9] were thought to play key roles in the development of sequence stratigraphy. Of all the factors influencing depositional sequences, astronomical forcing has attracted significant scholarly attention in recent years [6,7,10,11,12]. This is primarily because changes in Earth’s orbital eccentricity, obliquity, and precession govern solar radiation distribution, which, in turn, drives climatic changes. These climatic changes play a crucial role in regulating eustatic sea-level fluctuations as well as sediment generation and deposition [3,10].
Stratigraphic packages which accommodation space fluctuations associated with sea-level changes are categorized into six hierarchical orders based on the amplitude of sea-level change and duration of the stratigraphic archive [1,2,11,12,13]. The duration of different scales varies widely, with first-order sequences spanning tens hundreds of millions of years, while sixth-order sequences last for only tens of thousands of years. The development of first- and second-order stratigraphic sequences are controlled by tectonic processes, while fourth-, fifth-, and sixth-order stratigraphic sequences are caused by climate and ice-volume change, which are, in turn, strongly modulated by Earth’s orbital parameters [6,11,12]. Fourth-order sequences are associated with the 405-kyr-long eccentricity cycle, fifth-order sequences correlate with the ~100-kyr-short eccentricity cycle, and sixth-order sequences are linked to the ~40 kyr-obliquity cycle alongside the ~20-kyr precession cycle [7,11]. Despite the historical debate over the mechanism of third-order sequences (e.g., climate-driven glacio-eustasy vs. tectonics [1,14,15]), a growing body of research suggests that third-order sequences may be predominantly governed by long-term astronomical cycles in the Cenozoic and Mesozoic era, i.e., 1.2-Myr obliquity cycles during the Cenozoic and 2.4-Myr eccentricity cycles during the Mesozoic [7,12,16].
According to the obtained basic geological data, the traditional methodologies for stratigraphic sequence division can be systematically categorized into the following methods [3]: field outcrop-core observation, well logging analysis, paleontological analysis, geochemical analysis, and integrated application of the aforementioned methods. Notably, well-logging analysis gained predominant adoption in petroleum exploration due to the scarcity of core samples and outcrop data, contrasted with the relative abundance of well logging records [3]. The well-logging analysis primarily encompasses three analytical techniques: wavelet transform [17], INPEFA (Integrated Prediction Error Filter Analysis) [18], and Gamma Deviation Log (GDL) methods [19], all of which have been substantiated as reliable approaches for sequence stratigraphy analysis. Gamma ray (GR) logging especially serves as a useful paleoclimate proxy by quantifying variations in uranium (U), potassium (K), and thorium (Th) concentrations within sedimentary strata. These elements are primarily hosted in clay minerals (Th, K) and organic matter (U), making GR values sensitive to changes in lithology and depositional environments [10,20]. High GR values correlate with clay-rich sediments and organic matter under humid and warm climates and/or high sea-level conditions. Conversely, low GR numerical values reflect reduced clay content and increased siltstone/sandstone deposition under cold-aridification climates and/or low sea-level conditions [12,21,22]. The variation of GR is closely tied to astronomical eccentricity cycles. That is, high GR numerical values (humid and warm climate states) align with elevated 405-kyr eccentricity which amplify seasonality, while low GR values (arid and cool climate states) correspond to decreased astronomical eccentricity [12,23]. Therefore, GR logging provides a high-resolution archive for reconstructing paleoclimate evolution and stratigraphic sequences. Its sensitivity to orbital-scale climate variability makes it a perfect proxy for the integrated analyses of cyclostratigraphy and sequence stratigraphy in our study area.
The Pearl River Mouth Basin (PRMB), a major oil-gas rich sedimentary basin in the north part of South China Sea (SCS), holds estimated oil and gas reserves of approximately 8.5 × 10⁹ tons (or ~62.3 billion barrels) [24]. The middle Miocene Hanjiang Formation (HJF) stands out as a critical hydrocarbon-producing formation within the PRMB [24]. While extensive tectonic traps have been documented to date, current exploration strategies are progressively transitioning toward lithologic trap targeting [25]. Consequently, advancing the sequence stratigraphic understanding of the HJF is of great importance. Nonetheless, despite robust evidence supporting the influence of astronomical cycles on third-, fourth-, fifth-, and sixth-order sequences, only a limited number of studies [12,26] have systematically applied astronomical cycles to objectively delineate sequences across multiple wells in this area.
Existing subdivision schemes for third-order sequences within the HJF are controversial, resulting in conflicting schemes [12,27,28,29,30]. This bias primarily stems from discrepancies in the interpretation of sequence duration between different researchers and the identifying unconformable surfaces on seismic data, particularly in the central areas of sedimentary basins. While sequence boundaries are readily identified by unconformities along basin margins, their identification in basin centers is problematic, as these boundaries manifest as conformable surfaces [3,4]. This identificational difficulty, coupled with the inherent resolution limitations of seismic images, has hindered the consistent subdivision of third-order sequences—especially in offshore study areas—and adds to the controversy on the subdivision of third-order stratigraphic sequences. Overall, the absence of a standardized third-order stratigraphic sequence scheme for the HJF has two main constraints. Firstly, it hinders the grasp of the processes and duration of sequence formation. Secondly, it restricts the evaluation of hydrocarbon plays within this sequence stratigraphic interval.
Owing to the current chronostratigraphic work [12,31], a roust astronomical timescale (ATS) has been constructed for the HJF. Here, we build upon current research by conducting detailed cyclostratigraphic and sequence stratigraphic analyses on two boreholes. Our objectives are to (1) validate a definitive ATS for the HJF, and (2) delineate third-order stratigraphic sequence for the HJF using cyclostratigraphic methods, cross-validating these results with conventional sequence stratigraphic approaches.
2. Geological Setting
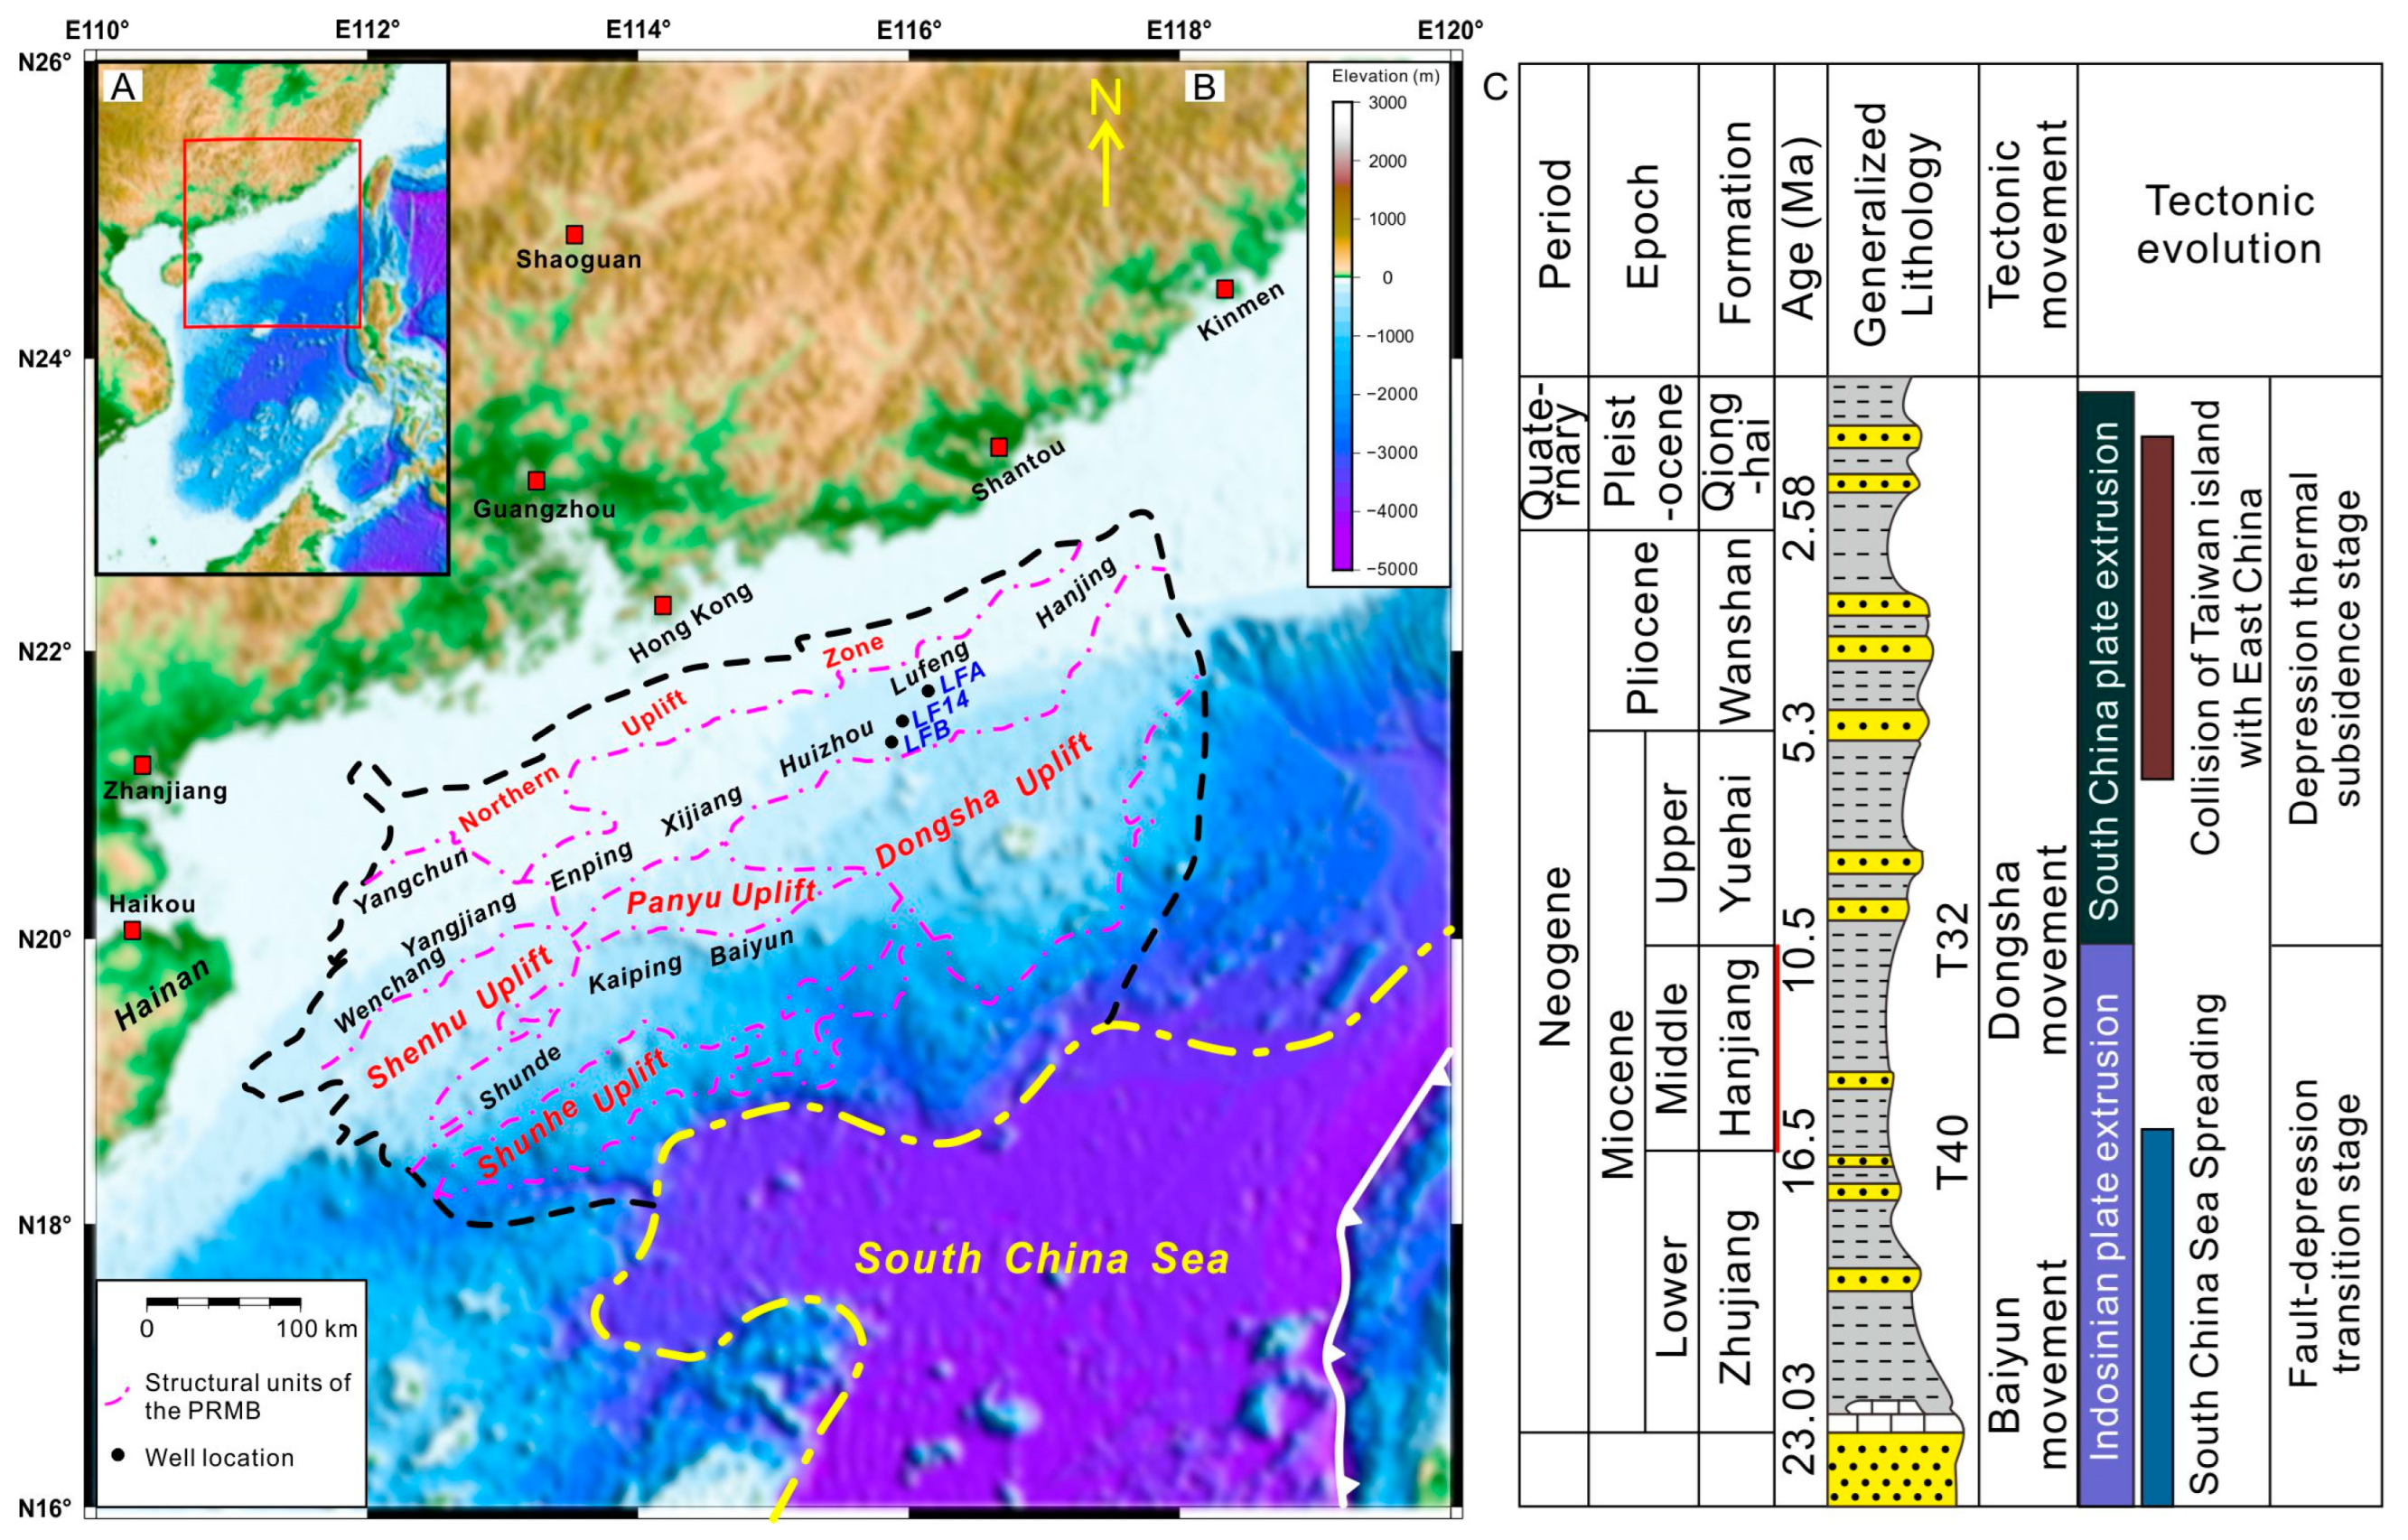
The PRMB is situated on the north part of the divergent continental margin of SCS (Figure 1), where interactions between the Pacific, Indian, and Eurasian plates had a substantial influence on its evolution [32]. Covering an area of 17.5 × 10⁴ km2, the PRMB is commonly subdivided into several structural units, including the northern uplift area, the northern depression area, the central uplift area, the central depression area, the southern uplift area, and the southern depression area [28,33]. Within this context, the LF14, LFA, and LFB boreholes, situated in the Lufeng Depression in the north of the PRMB, serve as important study sites for elucidating the stratigraphic evolution of the region. The three wells are not affected by faults, and the tectonic activity remained relatively stable during the Hanjiang Formation period, as evidenced by nearby seismic profile (e.g., see Figure 8 in [33]).
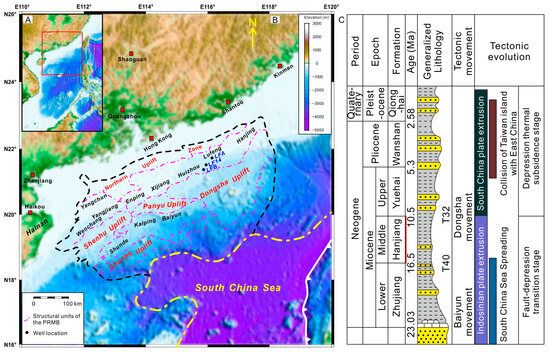
Figure 1.
Location map of the South China Sea (A) and the study area (B) which includes the structural units and the location of the studied boreholes (modified from [12]). (C) The general stratigraphic column and key tectonic events in our study area (modified from [32]). Note that the names in black are the names of individual depressions, the names in red are the names of individual uplift zones.
The Cenozoic tectonic history of the PRMB is characterized by a three-stage evolution. The first is the rift stage from the Paleocene to the early Oligocene, which is characterized by extensional processes that created accommodation space and initiated basin formation. This phase is followed by the fault-depression transition stage during the late Oligocene, marking a shift in the basin’s development. Finally, from the early Miocene to the present, the basin has experienced the depression thermal subsidence stage, during which it has seen relative tectonic quiescence interspersed with localized uplift and subsidence events [33,34,35]. Within the post-rift phase, the Miocene HJF represents a key formation associated with the depression-subsidence phase. This formation is characterized by relatively stable depositional conditions that facilitated the accumulation of a mainly sedimentary succession. The HJF, which typically ranges in thickness from 500 to 1100 m, is made of predominantly dark mudstone interbedded with sandstone and gravelly sandstone. These lithologies were accumulated in deltaic and shallow shelf settings [28,33].
Stratigraphically, the HJF is positioned between the underlying Zhujiang Formation and the overlying Yuehai Formation (Figure 1C). The HJF has been the focus of extensive stratigraphic studies, particularly in the context of hydrocarbon exploration. Sequence stratigraphic analyses in the basin have traditionally relied on an integrated approach that combines 3D seismic interpretation, well-based lithofacies analysis, and biostratigraphic data. In this area, two distinct sequence boundaries (T40 and T32 boundaries) have been identified, each corresponding to key seismic reflection horizons. The T40 and T32 boundaries are coincident with the bottom of the HJF (~16.5 Ma in [36]) and the bottom of the Yuehai Formation (~10.5 Ma in [33]), respectively; in addition, they are also the second-order sequence boundaries [28,33].
3. Materials and Methods
3.1. Wireline-Logging Gamma Ray Series
This study chooses the GR series from LFA and LFB boreholes for time-series analysis and sequence stratigraphic analysis. Borehole LFA covers a depth range of 1250–1960 m (thickness of 710 m) and has an average GR series sampling spacing of 0.125 m. Comparatively, Borehole LFB covers a depth range of 1070–1955 m (thickness of 885 m) and has an average GR series sampling spacing of 0.1 m. These GR logging data were acquired by the China National Offshore Oil Corporation (CNOOC) through continuous downhole logging operations.
3.2. Sequence Stratigraphic Subdivision
GR logging data provide extensive quantitative insights into subsurface geology and have been widely applied in delineating stratigraphic sequences and identifying key sequence boundaries. However, the inherent complexity of subsurface strata often makes the untuned GR curves hard to decipher stratigraphic sequences directly. To overcome this limitation, we utilize the wavelet transform methods and INPEFA to detect the important characteristics and trends of lithological and environmental changes, and sequence development. Wavelet transformation and INPEFA analysis were performed using Matlab R2020b wavelet analyzer Toolbox and the CycloLog 3.2 software [18], respectively.
We utilized the wavelet transformation to isolate depth-frequency attributes and identify the cyclic patterns in the data [17]. The Morlet wavelet exhibits a high degree of sensitivity to fine-scale stratigraphic cyclicity [33,37]. When applied to wireline log data, this method reveals distinct spectral energy distributions along the depth axis that correlate with lithological changes. Analyzing these data at multiple wavelet frequencies enhances subsurface characterization. For quantitative analysis, a scale parameter “a” is introduced, which represents both the time span of the observed window and the periodic component of the data. As “a” increases, the wavelength of sedimentary cyclicity also ascends [33,37]. To visualize multi-scale information, various wavelet coefficient curves are extracted (see Figure 2). The oscillations in these curves facilitate the identification of sequence stratigraphic interfaces and boundaries. Additionally, the wavelet transform energy spectra use color variations to indicate energy levels corresponding to lithological variations. High frequencies, shown in red, indicate high-energy sandy deposits, while low frequencies, depicted in blue, reflect low-energy, finer-grained sediments such as mudstones. Shifts between these energy levels signal changes in sediment stacking and help delineate major sequence boundaries [33,37].
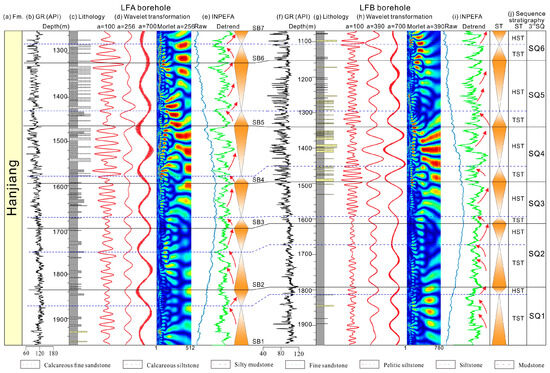
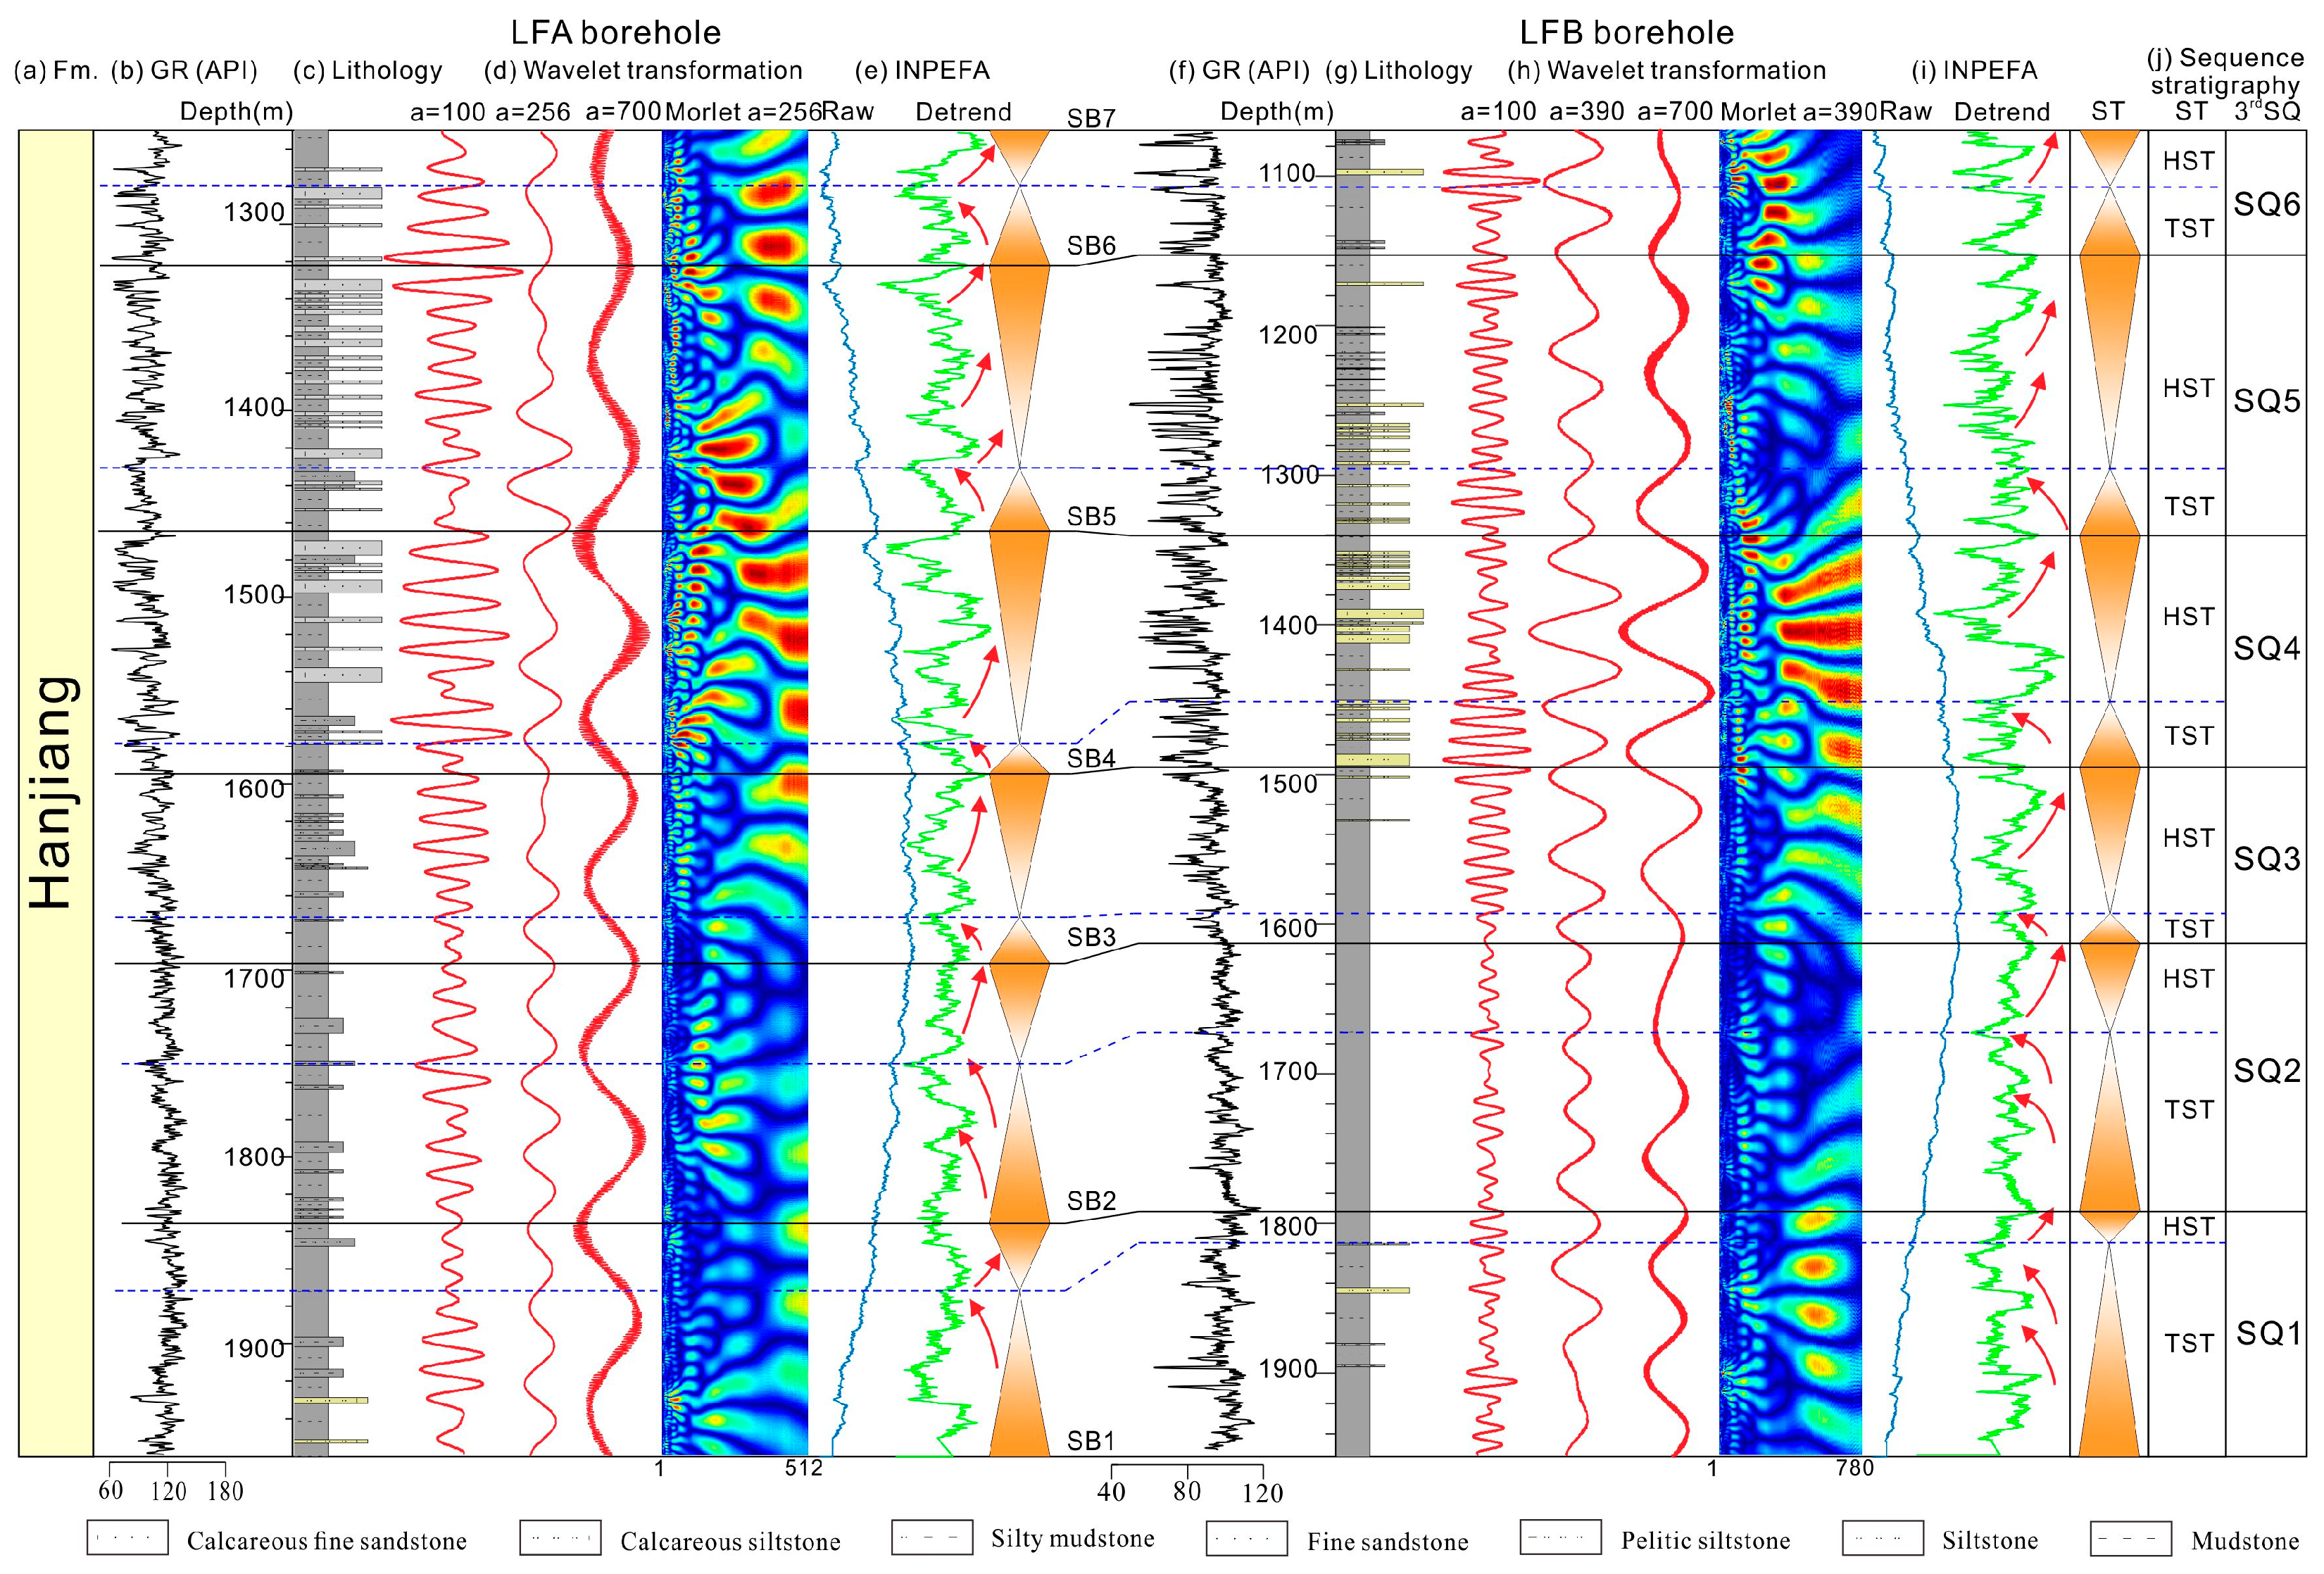
Figure 2.
Sequence stratigraphic subdivision in the HJF of the LFA and LFB boreholes. (a) Formation of the LFA and LFB boreholes. (b) The untuned GR data in the LFA borehole. (c) Lithological column in the LFA borehole. (d) Wavelet transform analysis in the LFA borehole. (e) The raw and detrended INPEFA curves in the LFA borehole. (f) The untuned GR logging data in the LFB borehole. (g) Lithological column in the LFB borehole. (h) Wavelet transform analysis in the LFB borehole. (i) The Raw and detrended INPEFA curves in the LFB borehole. (j) Sequence stratigraphic scheme by traditional methods for this study. Note that the scale setting (“a”) in the wavelet coefficient is provided in the corresponding curves, the blue dotted lines represent the maximum flooding surface. Abbreviations: SB: sequence boundary, ST: system tracts, TST: transgressive system tracts, HST: highstand system tracts, 3rd SQ: third-order sequence.
The INPEFA curves are derived through a two-stage computational procedure. The first stage involves Prediction Error Filter Analysis (PEFA), and the second stage involves Maximum Entropy Spectral Analysis (MESA). For a comprehensive description of the method, see [18]. The INPEFA approach is characterized by trends and turning points of the INPEFA curves within the GR series. These trends and turning points correspond to lithological interfaces (e.g., sedimentary environment boundaries) and sedimentary styles, respectively. The bottom of a positive INPEFA trend signifies a probable facies transition from sand-rich depositional settings to relatively mud-rich environments, which may be explained as a flooding surface in suitable depositional contexts. Conversely, the bottom of a negative trend demarcates a probable sediment influx, typically overlying a regional erosion surface.
3.3. Time-Series Methods
To enhance the detectability of astronomical signals, while suppressing low frequency that are not associated with orbital forcing, we removed secular variations utilizing the LOWESS (Locally Weighted Scatterplot Smoothing) method with less a 10% weighted mean [38]. A preliminary assessment of potential sedimentation rate variations influencing the spectral features of the series was conducted through a moving-window-based evolutive Fast Fourier Transformation (FFT) spectral analysis [39]. The subsequent quantitative evaluation of sedimentation rate variability employed two complementary methodologies: (1) the Correlation Coefficient (COCO) means for suitable sedimentation rate determination, and (2) the evolutionary COCO (eCOCO) technique for dynamic sedimentation rate tracking [40]. These approaches quantify spectral coherence between the proxy series and theoretical astronomical solutions across abundant sedimentation rates, with eCOCO incorporating a moving-window implementation to resolve stratigraphic rate changes. Both methods incorporate Monte Carlo simulations (2000 iterations) to test significance against a null hypothesis of random spectral similarity [40]. Functionally analogous to the average spectral misfit method [41], COCO-based techniques have gained broad adoption in cyclostratigraphy due to their methodological versatility [12,42].
We utilized the 2π multi-taper method (MTM) [43] to identify the cycles potentially linked to orbital forcing. Then, we performed a robust autoregressive (AR) red noise model to estimate the MTM spectral confidence. Subsequently, we abstracted the long (405 kyr) and short (100 kyr) eccentricity cycles recognized in MTM through Gaussian bandpass filtering. Given that 405-kyr eccentricity metronome is the steadiest astronomical cycle over Phanerozoic timescales, it can be used as the primary tuning period for constructing ATS [44,45]. Integrating COCO/eCOCO-derived sedimentation rates with recent absolute anchors [12,31], we developed an ATS through orbital tuning to the La2004 405-kyr eccentricity model [44]. These analytical procedures were implemented using the Acycle v2.8 software [46].
4. Results
4.1. Sequence Stratigraphic Analyses Results
According to the integrated analyses of the wavelet transform and INPEFA from LFA and LFB wells (Figure 2) for the HJF, we obtained seven discrete third-order sequence boundaries (designated as SB1 through SB7) and six distinct flooding surfaces, leading to the formation being subdivided into six third-order sequences (numbered sequentially from SQ1 to SQ6). The identified main sequence boundaries in the HJF were consistent with the regional seismic markers (T40 and T32), as put forward by the CNOOC.
SB1 and SB7 are second-order stratigraphic sequence boundaries, which distinguish the HJF from other stratigraphic interfaces. The SB1 interface corresponds to the bottom T40 boundary of the HJF, featured by: (1) strong seismic reflectivity and unconformity, and (2) serving as a tectono-sedimentary transition surface marking the second-order sequence boundary [12,28]. The INPEFA curve at the T40 interface exhibits a distinct positive trend. SB7 corresponds to the top boundary of the HJF and is associated with a regional unconformity corresponding to T32. By analyzing the wavelet transformation of the GR curve and processing the INPEFA curve, five third-order sequence boundaries (SB2–SB6) were further identified within the HJF. These boundaries were identified based on amplitude changes in the GR series, turning points on the INPEFA curve, and energy transitions in the wavelet spectrum.
In this study, we computed the low-, medium-, and high-frequency wavelet coefficient curves, which exhibited strong correspondence with the third-order sequence boundaries. For example, in the LFB well, the amplitude width and waveform changes of the high-frequency wavelet coefficient curve (a = 700) indicated that every two waveform corresponds to a third-order sequence. The six third-order wavelet spectra, from bottom to top, exhibit patterns of weak-medium, medium-weak, weak-medium, strong, medium-weak, and weak energy, which closely align with the energy spectra from well LFA.
Building upon this analysis, the maximum flooding surfaces for all six sequences were further identified. These sequences were subsequently divided into 12 system tracts. In both the original INPEFA curve and the detrended INPEFA curve, the positive turning points correspond to third-order sequence boundaries, while the negative turning points are associated with maximum flooding surfaces. Notably, the maximum flooding surfaces align with the mudstone-rich intervals of the HJF, representing the maximum flooding surface of the second-order sequence.
4.2. Cyclostratigraphy
4.2.1. Power Spectral Analysis
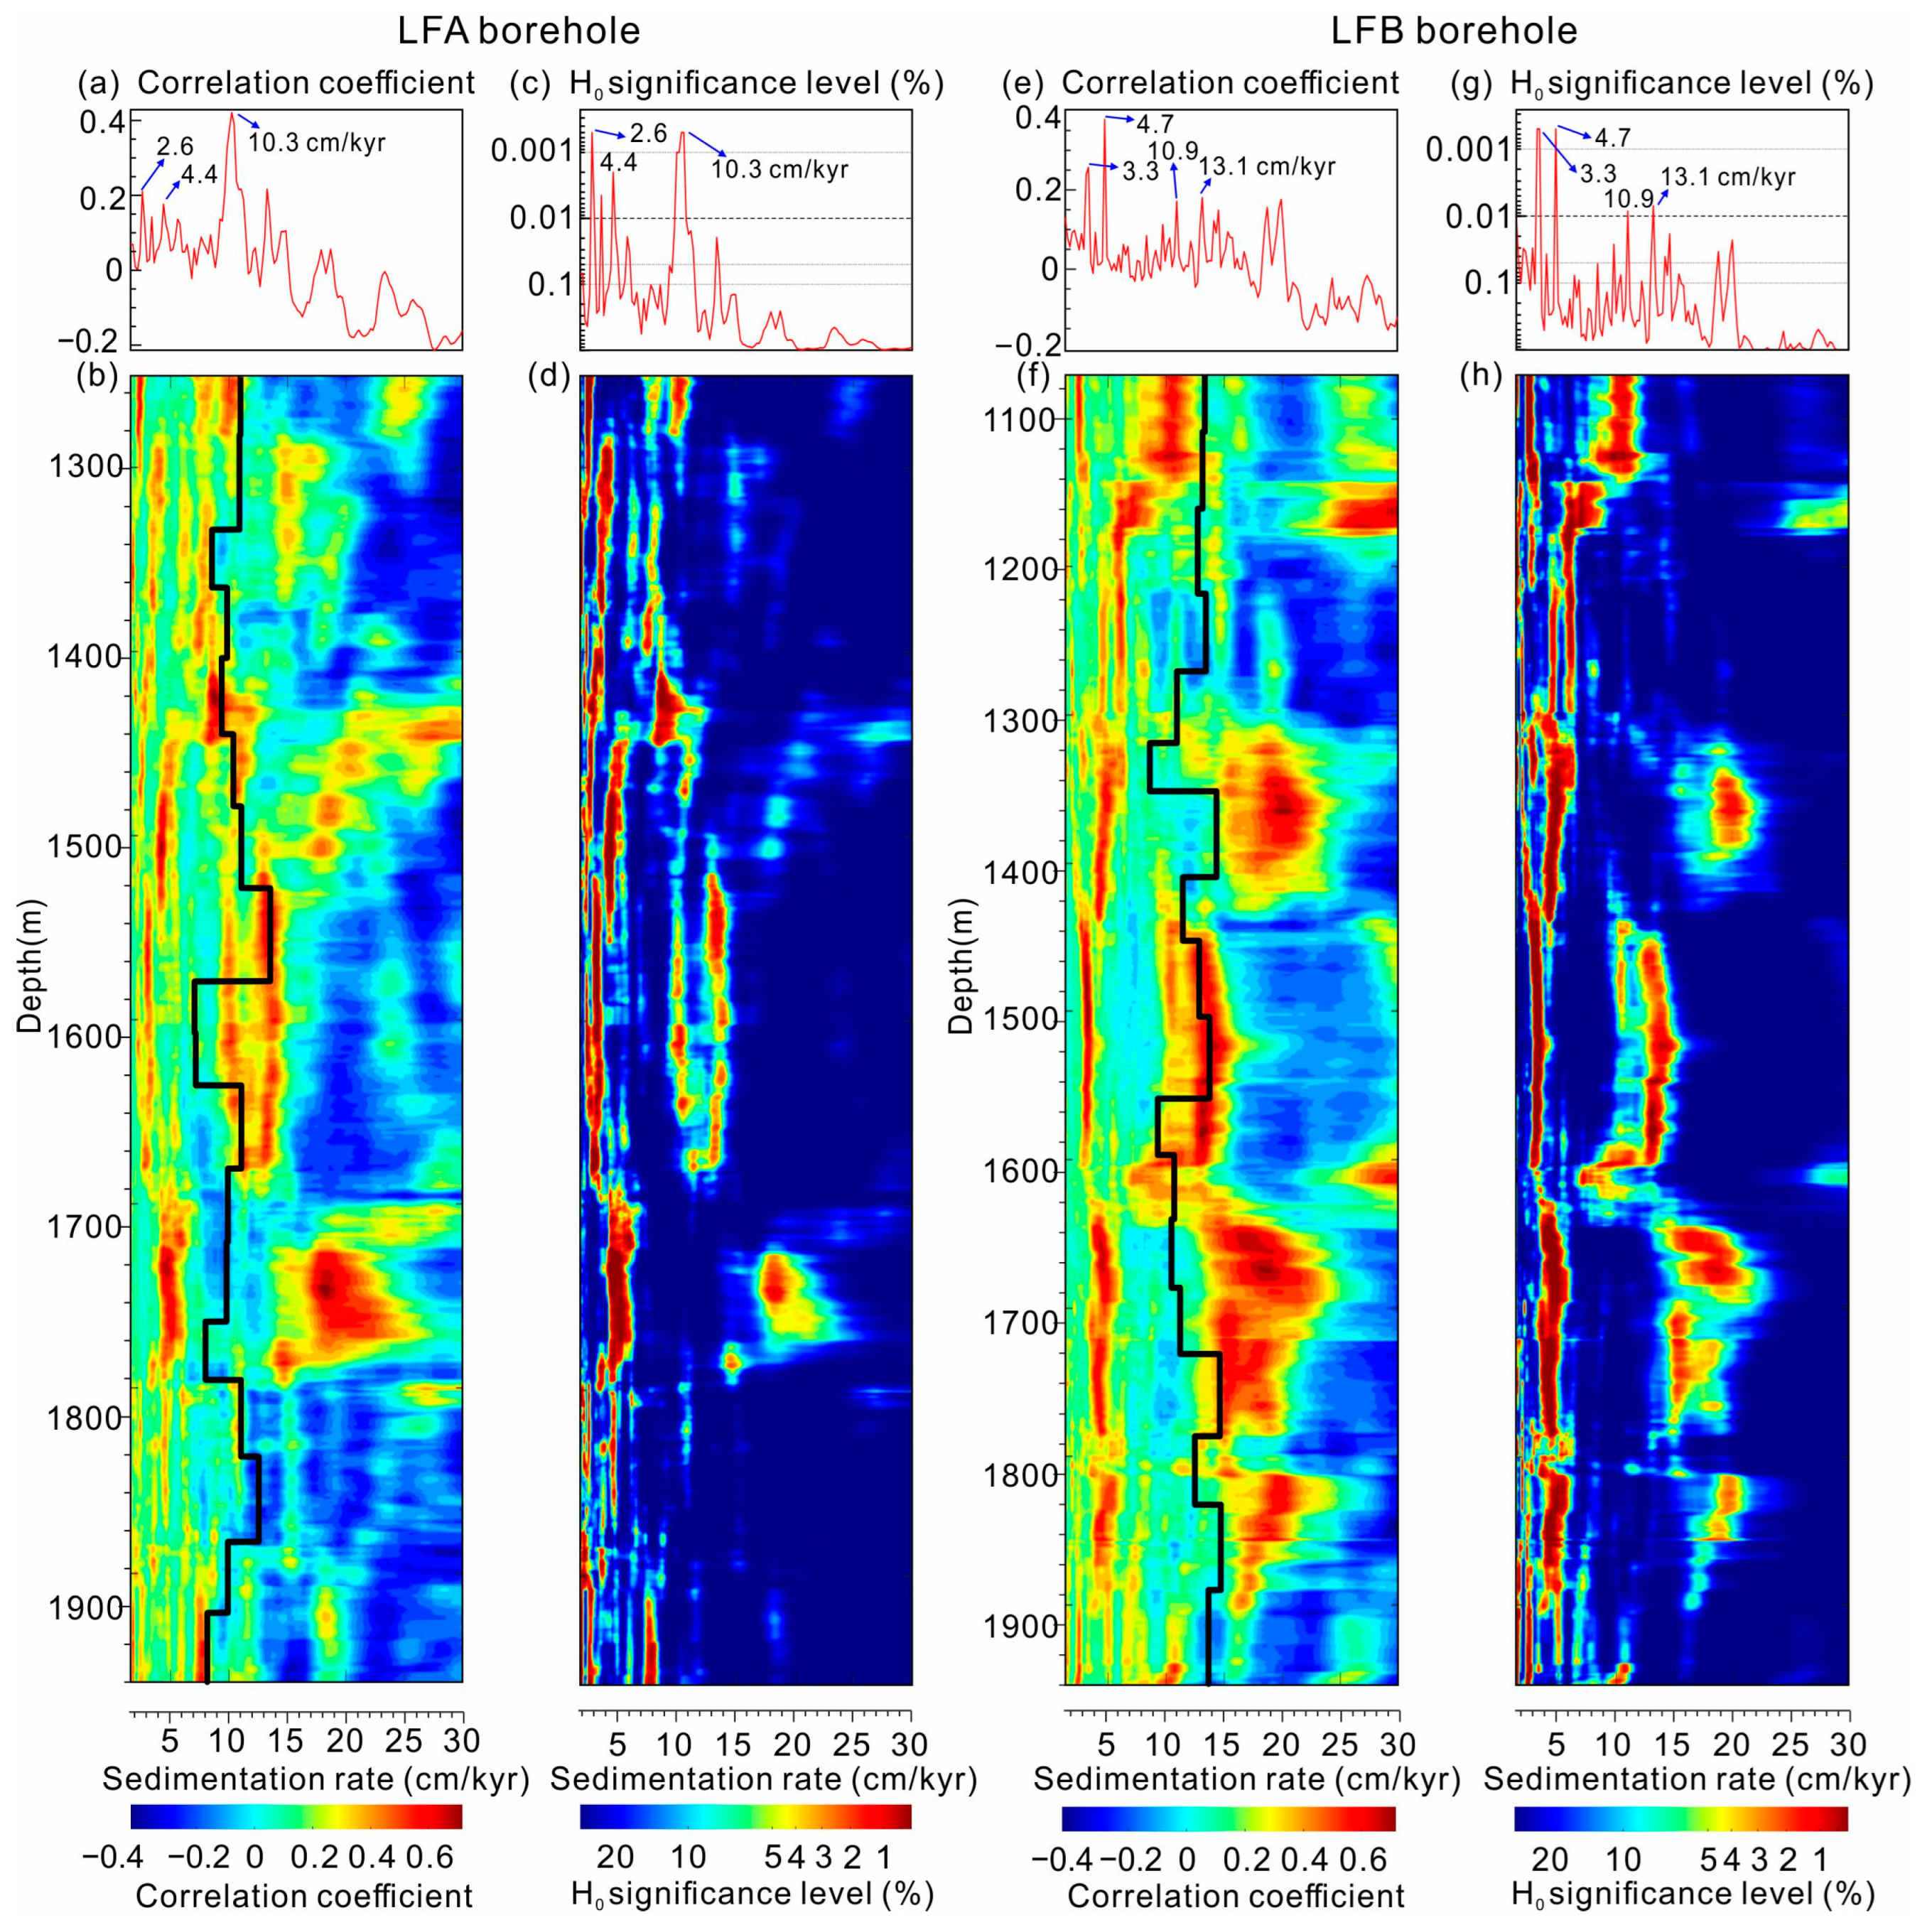
The variation in GR values across the studied boreholes corresponds closely with lithological changes (Figure 2c,g). High GR values are indicative of mudstone, while low GR values reflect sandstone (Figure 2c,g). COCO analysis of the untuned GR series from the LFA borehole (Figure 3a) identifies peaks at sedimentation rates of 2.6, 4.4, and 10.3 cm/kyr, with null hypothesis (H0) significance levels of less than 1%. The eCOCO analysis (Figure 3b) demonstrates probable temporal variations in sedimentation rate tests across the studied succession, highlighting high values in correlation coefficient values at 2.6–4.4 cm/kyr and 10.3 cm/kyr. For the LFB borehole, COCO analysis (Figure 3e) finds peaks at 3.3, 4.7, 10.9, and 13.1 cm/kyr, which has H0 significance levels of less than 1%. The eCOCO analysis (Figure 3f) identifies likely changes in sedimentation rates at 3.3–4.7 cm/kyr and 10.9–13.1 cm/kyr with an average value of 12 cm/kyr. Considering that the mean sedimentation rate for LF14, which is close to LFA and LFB boreholes, is ~12.5 cm/kyr [12], the sedimentation rates for the LFA and LFB boreholes are estimated at 10.3 cm/kyr and 12 cm/kyr, respectively.
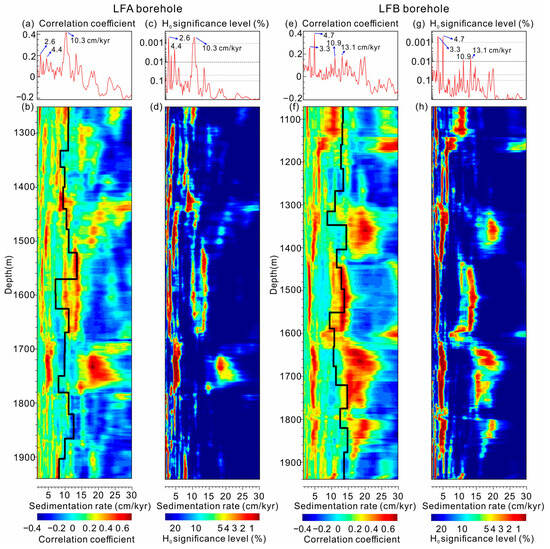
Figure 3.
Sedimentation rates result of GR series from borehole LFA (a–d) and borehole LFB (e–h). (a,e) COCO results of GR series. (c,g) Null hypothesis tests of GR series. (b,f) ECOCO results of GR series, the black lines indicate the sedimentation rates variations calculated by the 405-kyr tuned GR series. (d,h) Evolutive null hypothesis tests of GR series.
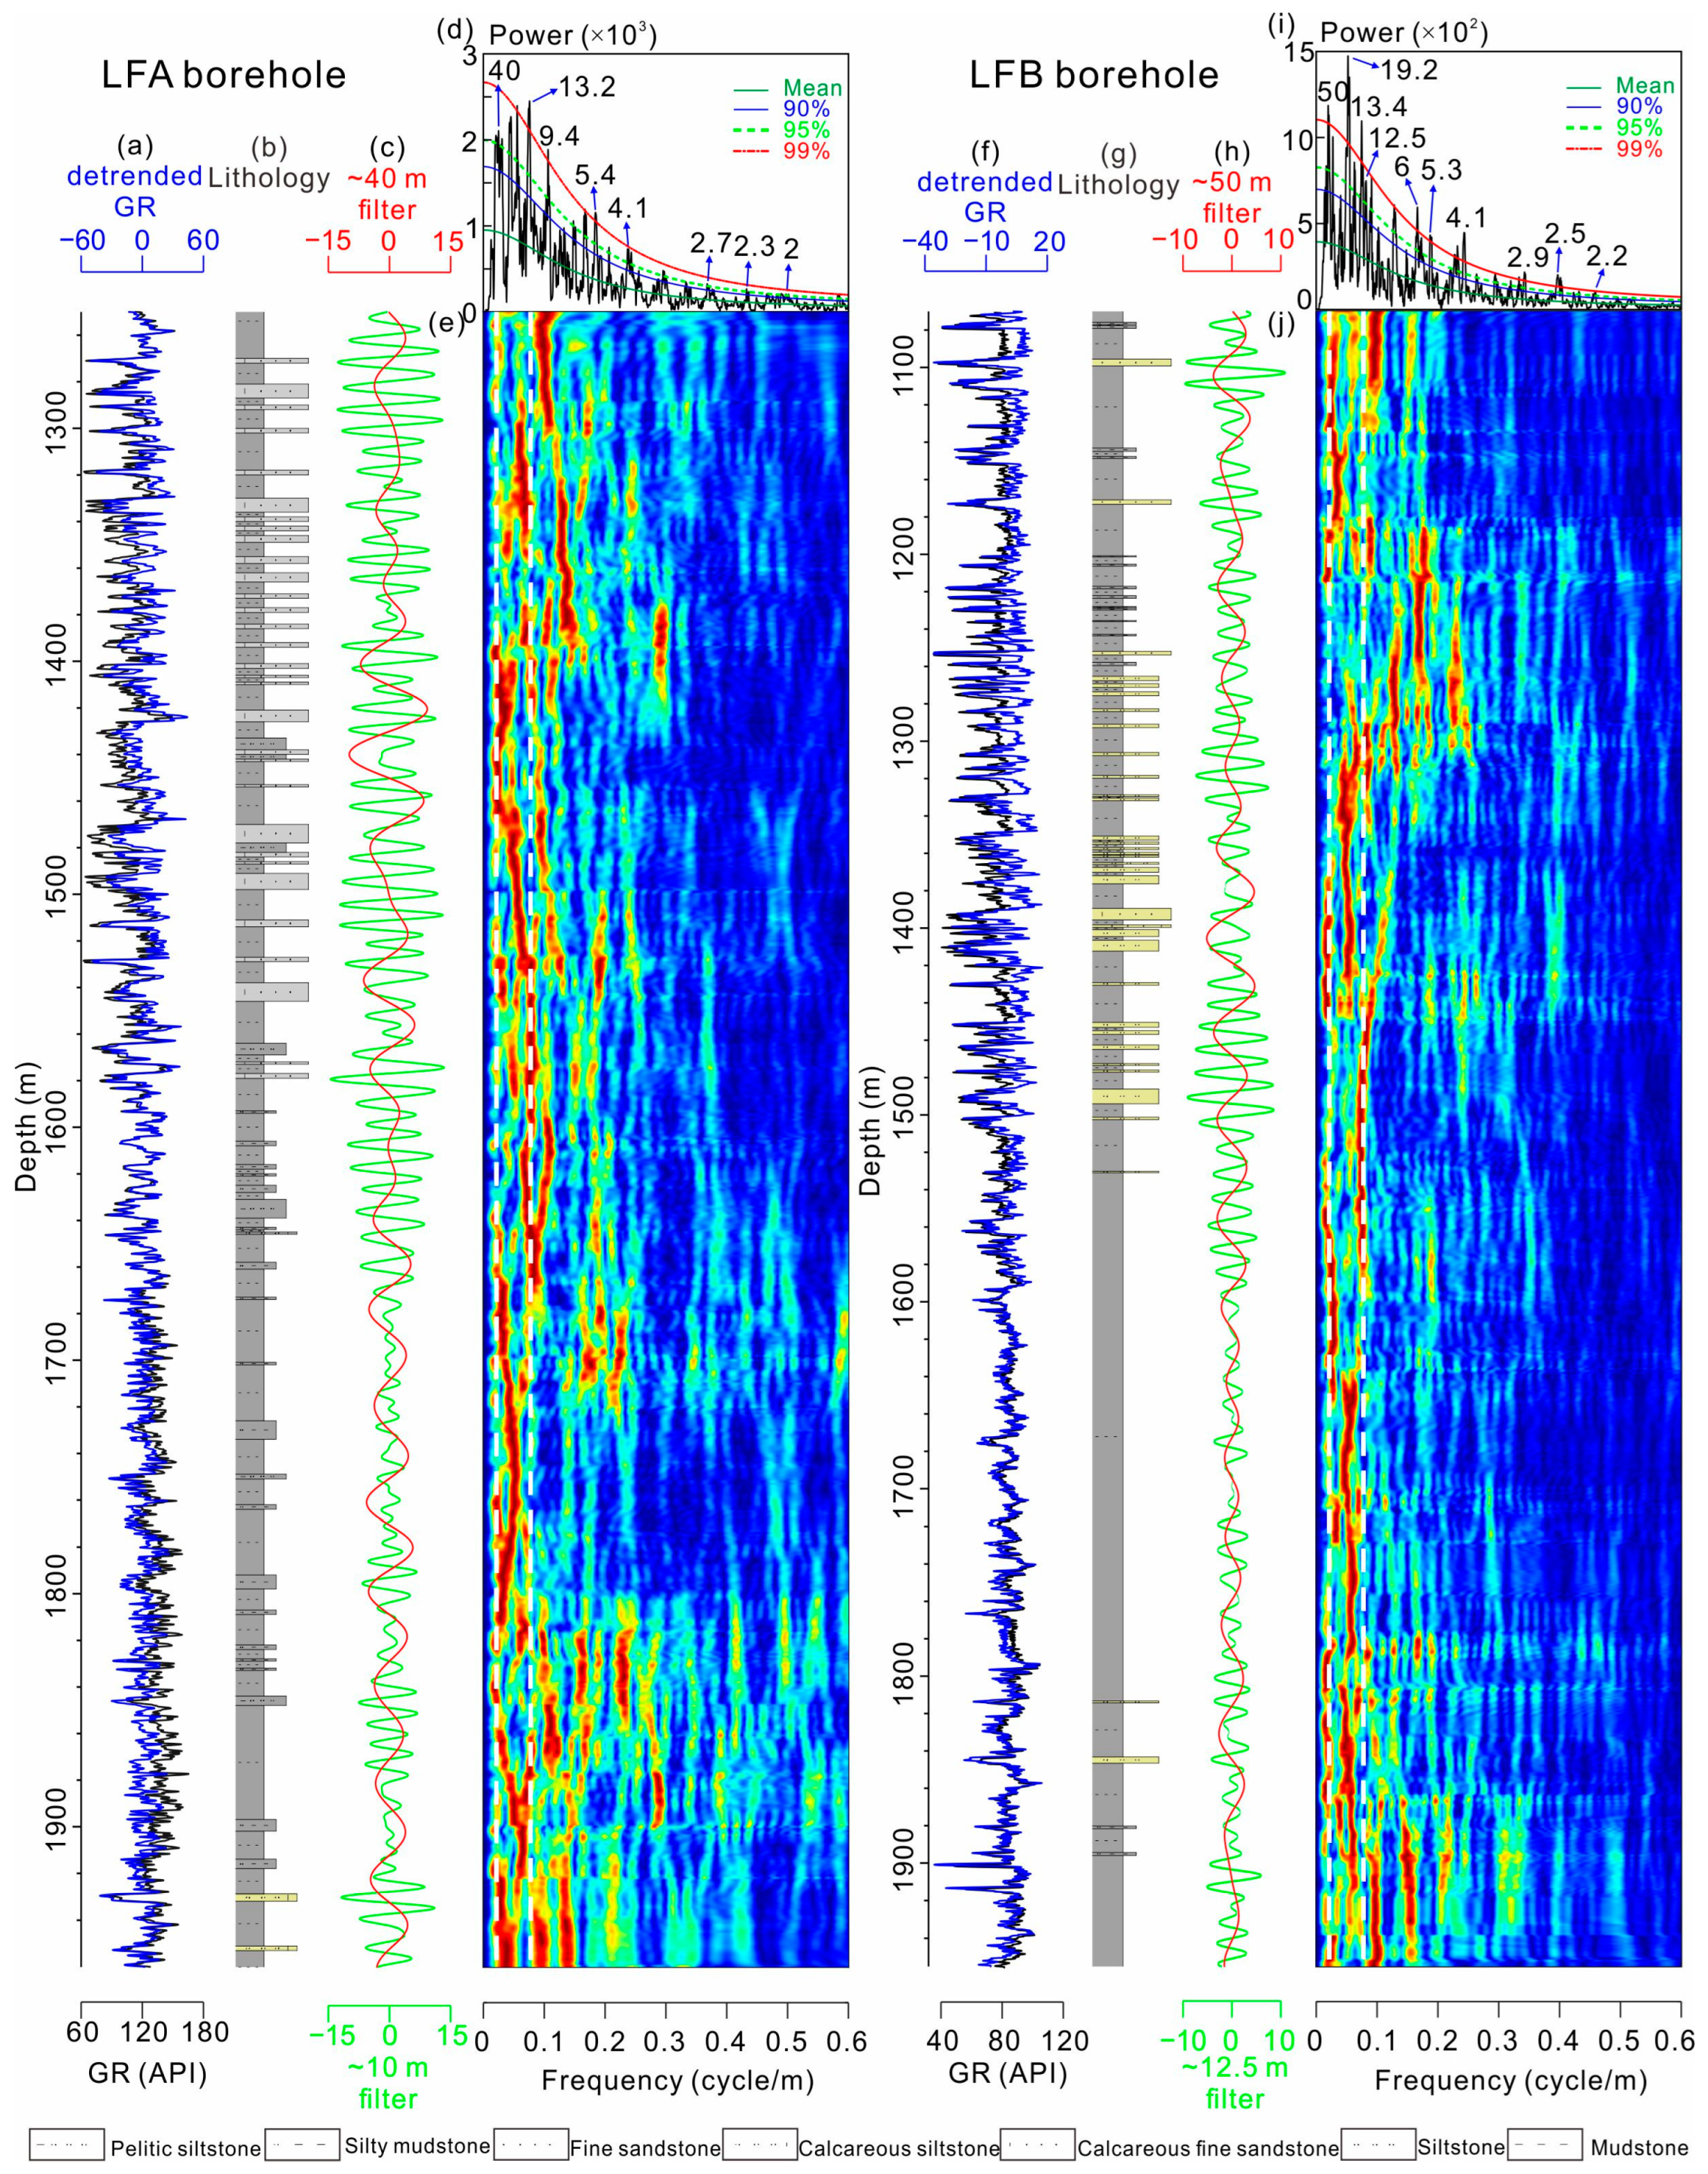
The FFT analysis of the untuned GR series in the LFA (Figure 4e) and LFB (Figure 4j) boreholes reveal fairly continuous frequency bands at 0.25 cycles/m (i.e., 40 m) and 0.2 cycles/m (i.e., 50 m), respectively. The MTM spectral analysis of the untuned GR series from the LFA borehole identifies peaks with a confidence level exceeding 95% at wavelengths of 40, 13.2, 9.4, 5.4, 4.1, 2.7, 2.3, and 2 m (Figure 4d). Similarly, the MTM spectral result of the untuned GR series in borehole LFB reveals prominent peaks at wavelengths of 50, 19.2, 13.4, 12.5, 6, 5.3, 4.1, 2.9, 2.5, and 2.2 m (Figure 4i), all with greater than 95% confidence.
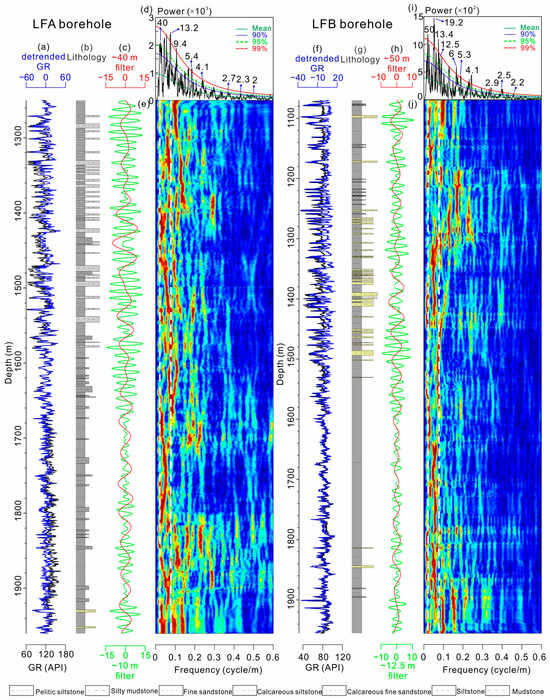
Figure 4.
Time-series analyses of GR series in the LFA (a–e) and LFB (f–j) boreholes in the depth domain. (a,f) Untuned GR and detrended GR series for LFA and LFB boreholes, respectively. (b,g) Lithology. (c) ~40 m filters (passband: 0.025 ± 0.00625 cycles/m) and ~10 m filters (passband: 0.1062 ± 0.02655 cycles/m) of the detrended GR series for LFA borehole. (d,i) 2π MTM power spectrum of the GR series. (e,j) Evolutive FFT analyses of the untuned GR series. (h) ~50 m filters (passband: 0.02 ± 0.005 cycles/m) and ~12.5 m filters (passband: 0.08 ± 0.02 cycles/m) of the detrended GR series for LFB borehole.
Using the COCO and eCOCO estimates for sedimentation rates, the statistically significant peaks at wavelengths of 40, 13.2–9.4, 5.4–4.1, and 2.7–2.2 m in the MTM spectral analysis of the LFA borehole’s untuned GR series (Figure 4d) align with the 405-kyr eccentricity cycles, 100-kyr eccentricity cycles, 41-kyr obliquity cycles, and ~20-kyr precession cycles, respectively. Similarly, the prominent peaks in the MTM spectral analysis of the LFB borehole’s untuned GR series (Figure 4i) at wavelengths of 50, 19.2–12.5, 6–4.1, and 2.9–2.2 m also correspond to the 405-kyr eccentricity cycles, 100-kyr eccentricity cycles, 41-kyr obliquity cycles, and ~20-kyr precession cycles, respectively.
4.2.2. Astronomical Calibrations
Through integrated analyses of FFT, MTM, and mean sedimentation rate, our study correlates the ~40 m filters in the LFA borehole and ~50 m filters in the LFB borehole with the 405-kyr eccentricity cycle (Figure 5). By applying a bandpass filter to isolate these cycles, we identified ~18 cycles in both boreholes. The extraction of 100-kyr eccentricity cycles was achieved through Gaussian bandpass filtering with a cycle of 10 m for the LFA borehole and 12.5 m for the LFB borehole, resulting in ~72 cycles in each case. We then constructed a floating ATS for the HJF in borehole LFA and borehole LFB, using the HJF’s top boundary, dated to 10.221 Ma [12], as the initial calculated point. This anchor allowed for the development of an absolute ATS for both boreholes (Figure 5).
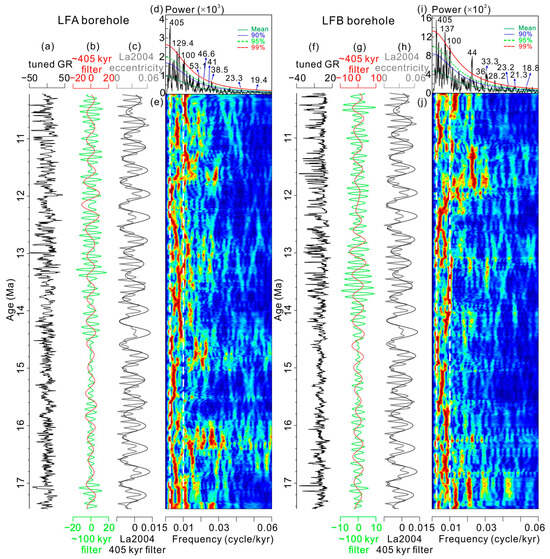
Figure 5.
Time-series analyses of GR series from the LFA (a–e) and LFB (f–j) boreholes in the time domain. (a,f) Tuned GR series. (b,g) ~405-kyr filters and ~100-kyr filters of the tuned GR series. (c,h) The La2004 eccentricity model and its ~405-kyr filters. (d,i) 2π MTM power spectral analysis of the GR series. (e,j) Evolutive FFT analysis of the tuned GR series.
The MTM result of the tuned GR series from the LFA borehole (Figure 5d) shows remarkable peaks at cyclicality of 405, 129.4, 100, 53.1, 46.6, 41, 38.5, 23.3, and 19.4 kyr. Based on this calculated point, the ATS for the HJF of borehole LFA spans from 10.221 ± 0.4 Ma to 17.442 ± 0.4 Ma. Similarly, the MTM analysis of the tuned GR series from the LFB borehole (Figure 5i) shows conspicuous peaks at cyclicality of 405, 137, 100, 44, 36, 33.3, 28.2, 23.2, 21.3, and 18.8 kyr. The ATS derived for the HJF within the LFB borehole spans 10.221 ± 0.4 Ma to 17.441 ± 0.4 Ma. These ATSs cover the associated 405-kyr eccentricity filters in La2004 eccentricity models [44].
4.2.3. Long-Term Amplitude Modulation of Obliquity Cycles
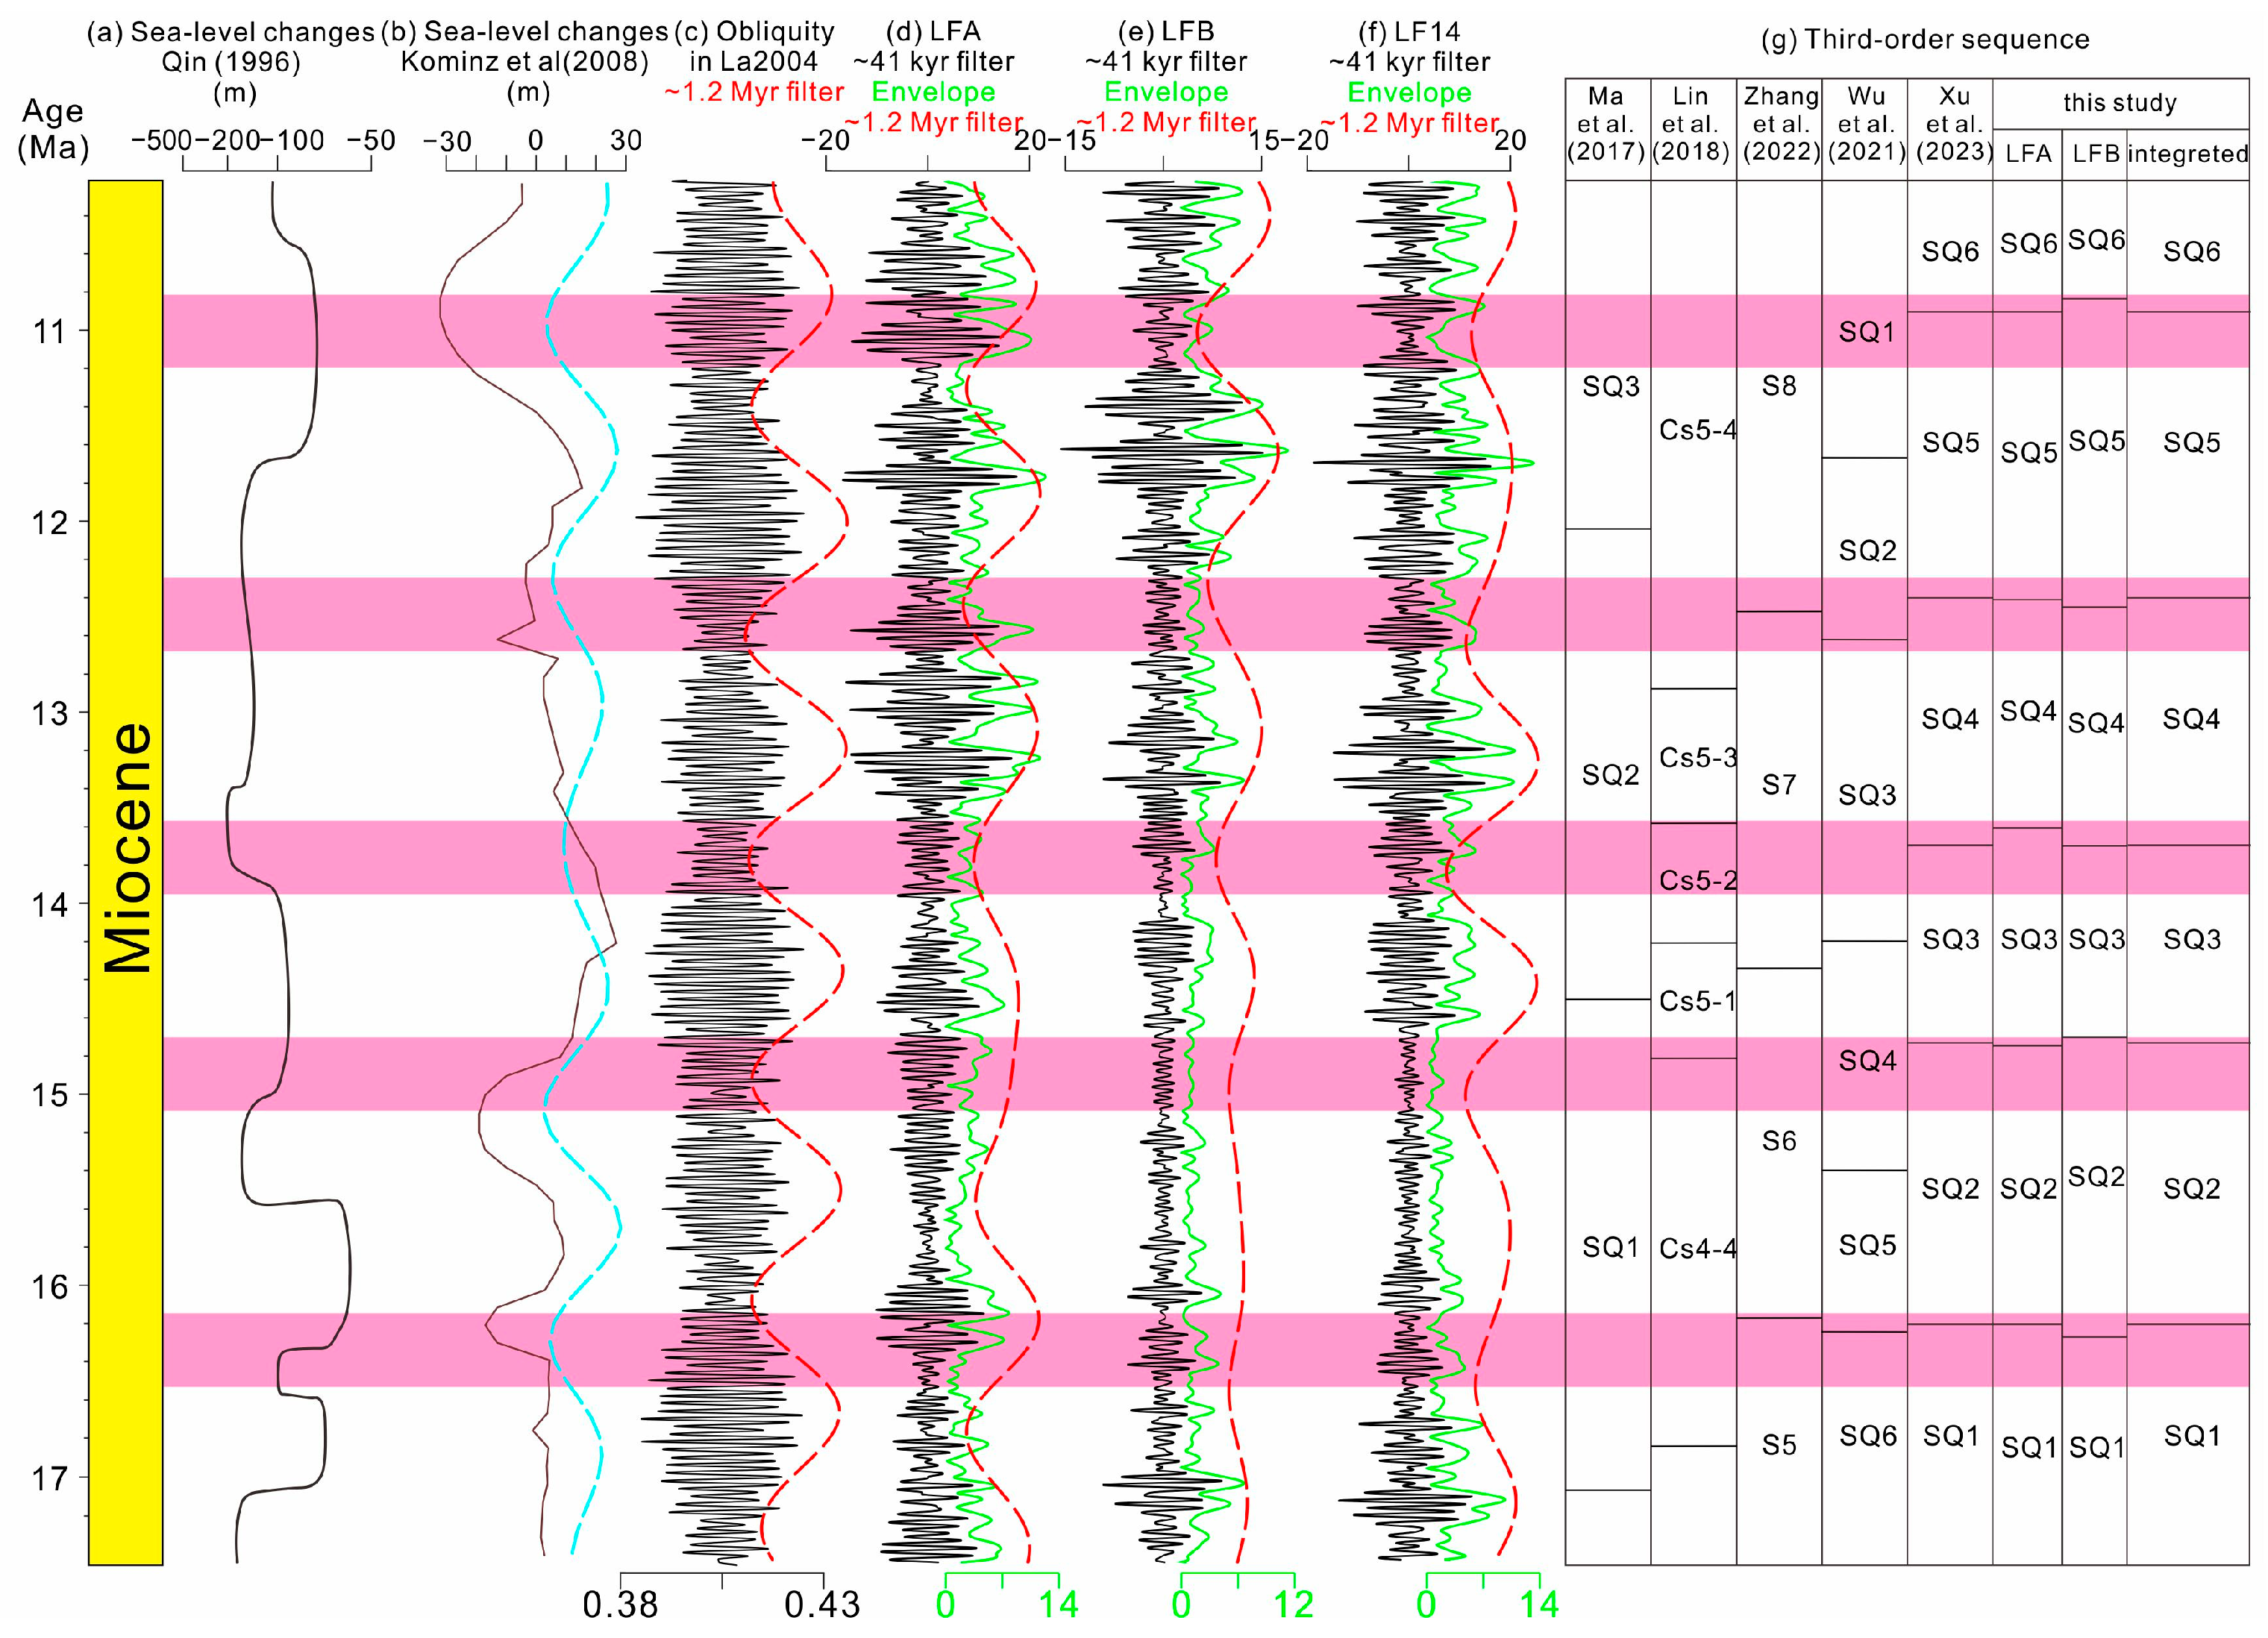
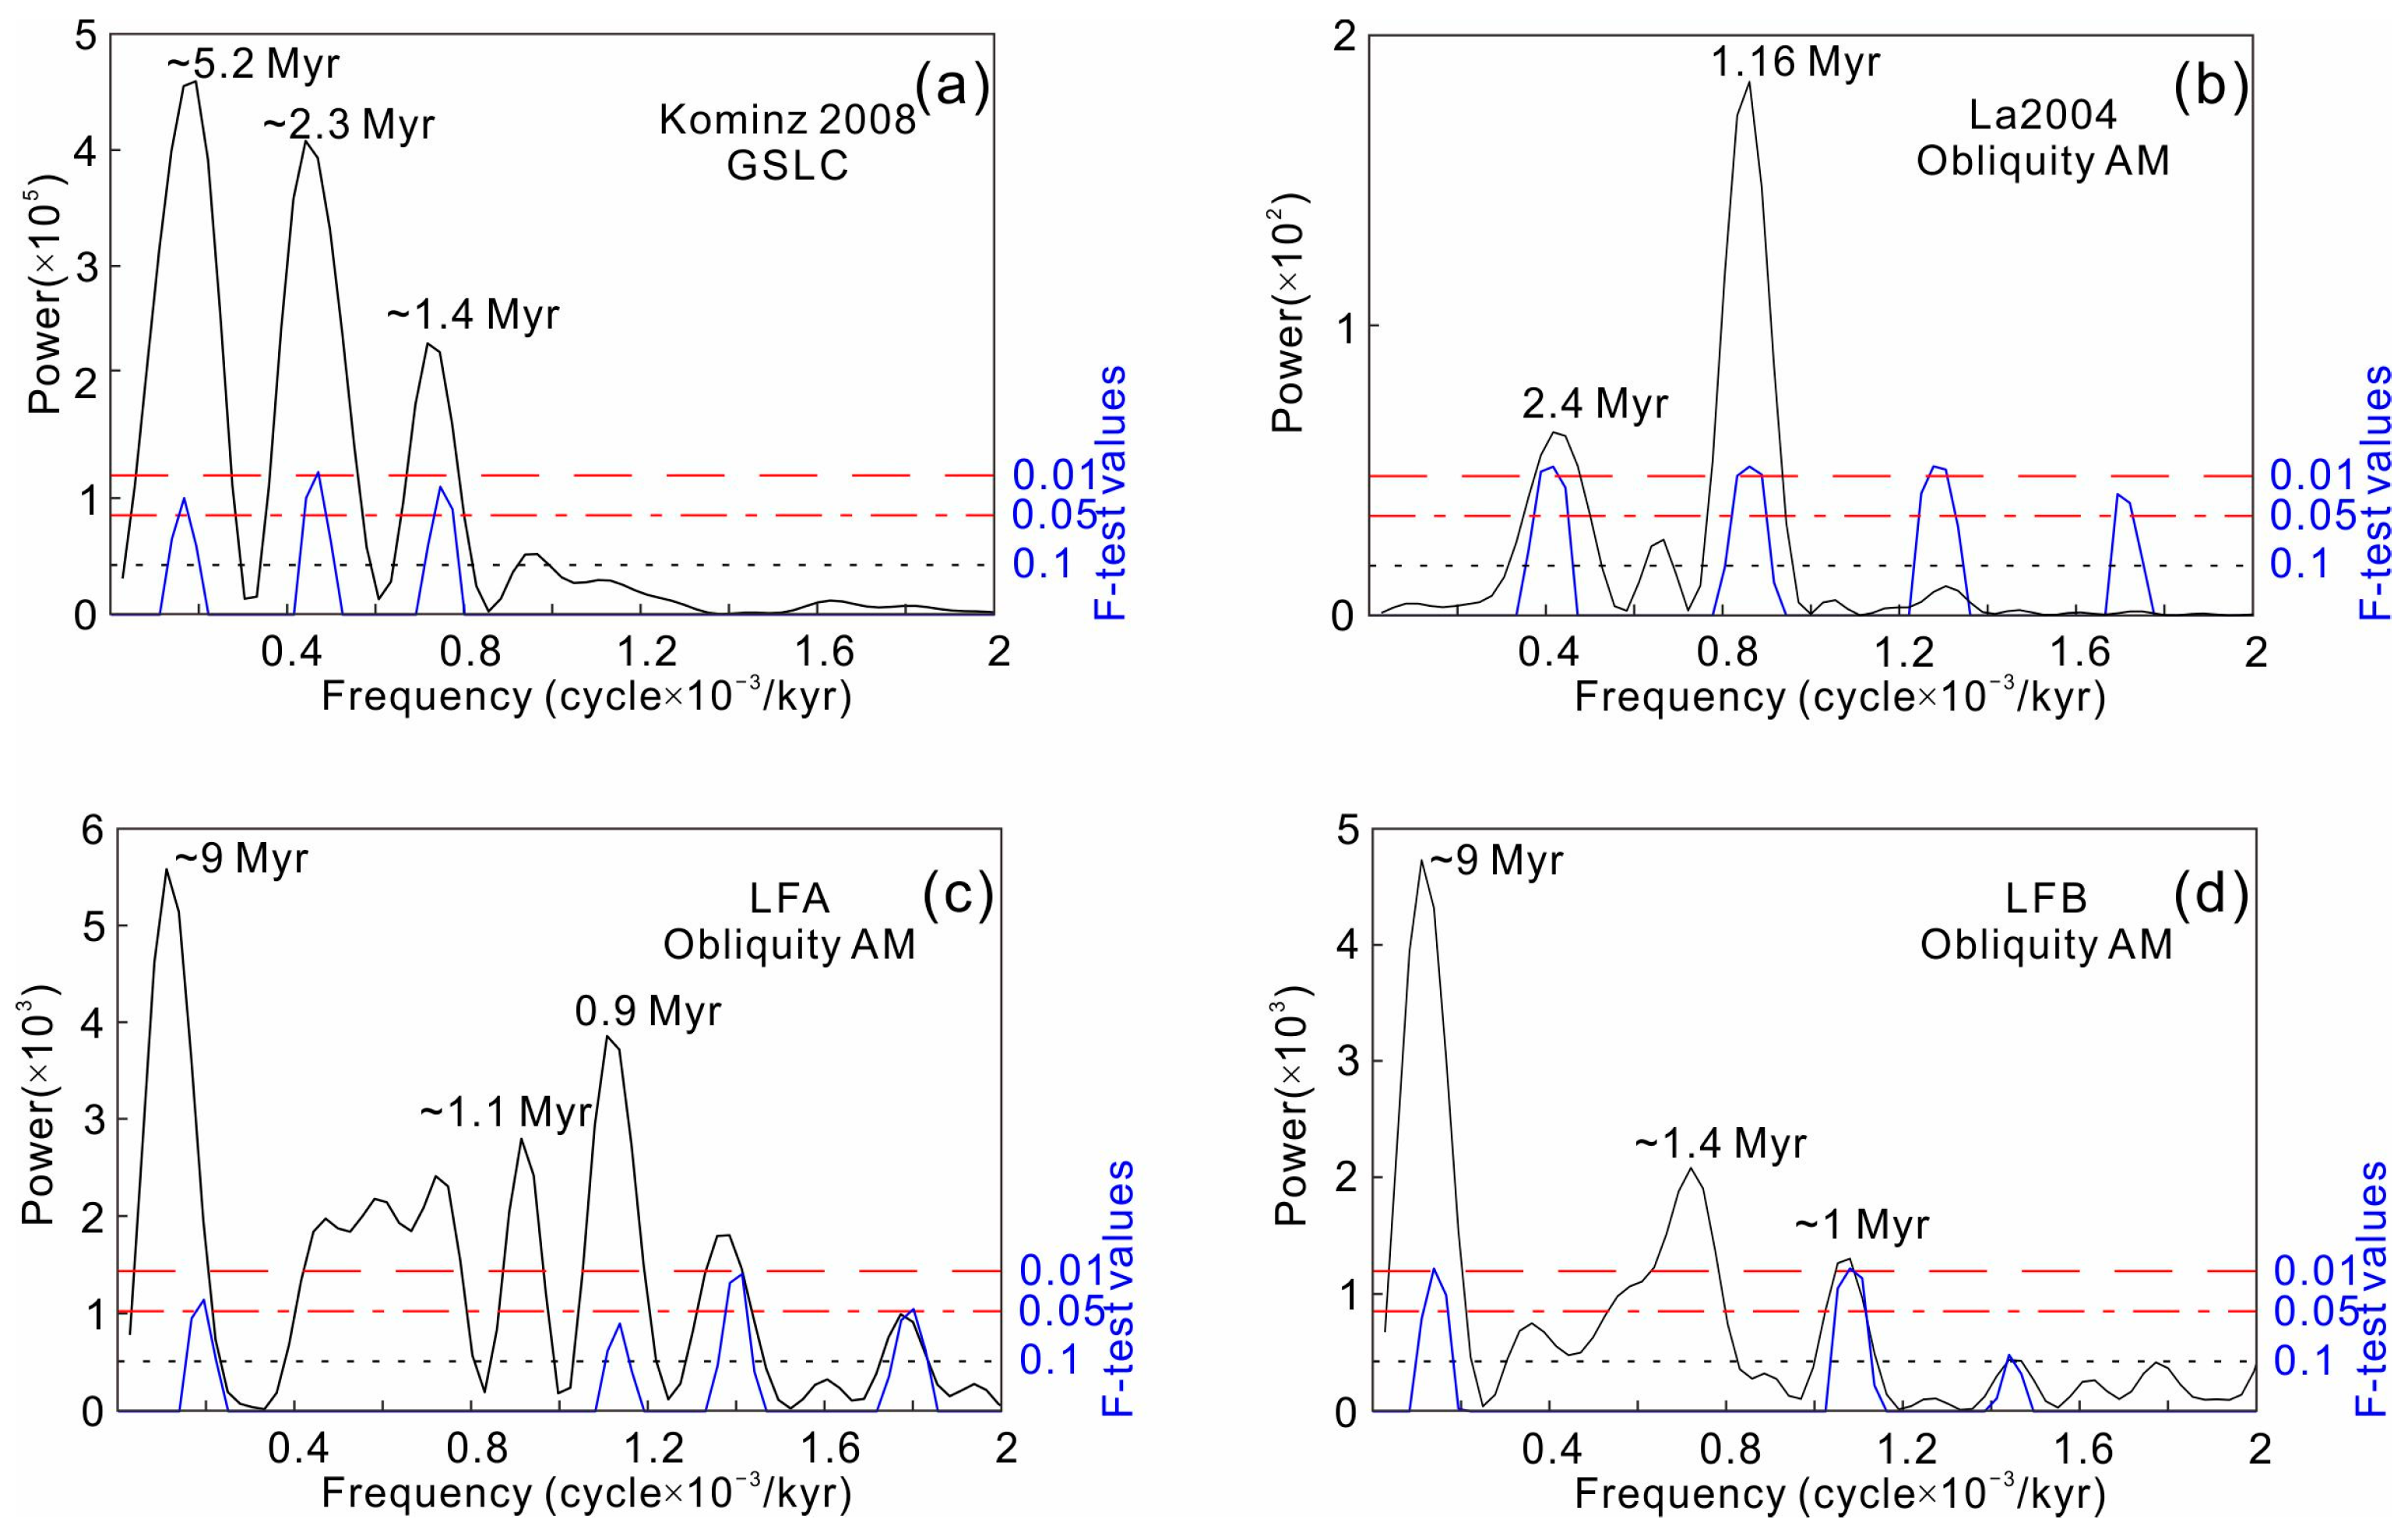
The prominent ~41-kyr obliquity signals (Figure 6d) observed in the tuned GR series of the LFA borehole display a distinct low-frequency amplitude modulation with a period of ~0.9 myr (Figure 7c). Similarly, the ~41-kyr obliquity cycles (Figure 6d) identified in the LFB borehole’s tuned GR series also exhibit a significant low-frequency AM, with a cycle of ~1 Myr (Figure 7d). These low-frequency variations are closely linked to the amplitude modulation of obliquity at a 1.2-Myr cycle, primarily driven by the gravitational interaction between Earth and Mars [44]. This results in roughly six 1.2-Myr obliquity amplitude modulation cycles preserved in both the LFA and LFB boreholes (Figure 6d,e).
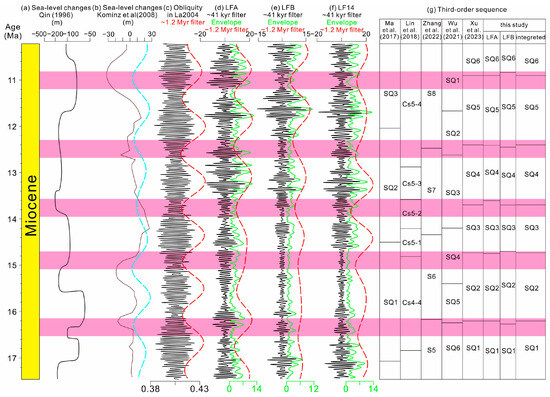
Figure 6.
(a) Sea-level changes in the PRMB of [36]. (b) Global sea-level changes of [47] and their 1.2 Myr filters (the blue line). (c) The La2004 obliquity model (the black line) and their amplitude modulation filters (the red dotted line). For LFA borehole (d), LFB borehole (e) and LF14 borehole (f), the ~41-kyr filters of the tuned GR series (the black line), and the amplitude modulation envelope of the~41-kyr filters (the green solid line), and the 1.2-Myr filters of the amplitude modulation envelope are presented, respectively. (g) Third-order sequence schemes for the HJF between different scholars [12,27,28,29,30], third-order sequence schemes subdivided by the traditional methods for LFA and LFB boreholes in this study, and the integrated third-order sequence scheme subdivided by traditional methods and astronomical cycle method in this study. The pink shaded rectangles show the low sea-level.
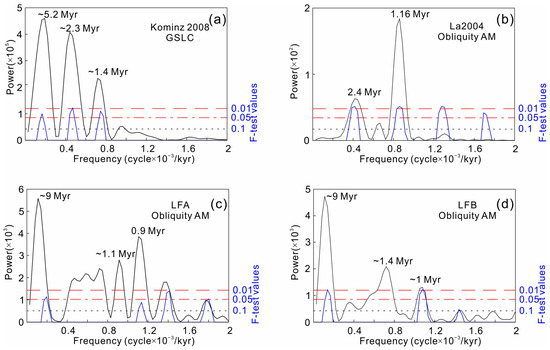
Figure 7.
Long period analysis of (a) GSLC (global sea-level changes) [47], (b) the obliquity amplitude modulation of the La2004 obliquity model [44], the obliquity amplitude modulation of the tuned GR series in borehole LFA (c), and borehole LFB (d). Note that F-test confidence is depicted in blue lines.
5. Discussion
5.1. Verification of the Astrochronology in the Middle Miocene Pearl River Mouth Basin
Here, we employed GR series from two boreholes to construct the ATS. The top boundary of the HJF, dated at 10.221 ± 0.4 Ma [12], was selected as the initial anchor point. Based on this fixed anchor, we obtained an age of 17.442 ± 0.4 Ma for the bottom boundary of the HJF in the LFA borehole, and 17.441 ± 0.4 Ma for the LFB borehole. These results align closely with those of [48] (17.35 Ma/17.4 Ma) and [12] (17.423 ± 0.4 Ma), with the largest discrepancy between our findings and [12] being only 2 kyr. This comparison confirms the reliability of the ATS provided by [12].
The 405-kyr eccentricity cycles detected in the tuned GR series from both the LFA and LFB boreholes are in-phase and closely match the 405-kyr filters from the La2004 eccentricity model (Figure 5c,h). Additionally, the MTM analysis of the tuned GR series from the LFA (Figure 5d) and LFB (Figure 5i) boreholes reveal distinct eccentricity, obliquity, and precession cycles, aligning closely with the La2004 astronomical model [44]. Given that the age uncertainty for the anchor points from [12] is 0.4 Ma, and no new sources of error were introduced in our study, we adopt this uncertainty value for consistency.
In conclusion, the results from this study validate the findings of previous research, while also providing a high-precision ATS for the HJF of two additional wells in the region. This enhanced ATS framework is a valuable contribution to the following quantitative sequence stratigraphy using an astronomical cycle-based method.
5.2. Connection Between Sequence Stratigraphy and Cyclostratigraphy
5.2.1. The 1.2-Myr Obliquity Cycles Modulation of Sea Level Changes and Third-Order Sequences
Although the principles of cyclostratigraphy and sequence stratigraphy are distinct, these methods share a common focus on the study of sedimentary cyclicity within strata. Sequence stratigraphy follows a discernible pattern, often exhibiting a relationship with the cyclicity of global sea-level changes [1,4]. These sea-level changes are, in many cases, driven by astronomical orbital cycles. This provides a good bridge between cyclostratigraphy and sequence stratigraphy. Long-term astronomical cycles are the primary drivers influencing the third-order sequences [4,7,16]. Ref. [7] concluded that third-order sequences were regulated by 1.2-Myr obliquity cycles in Cenozoic icehouse period and 2.4-Myr eccentricity cycles in Mesozoic greenhouse period. They thought that the glacio-eustatically driven sea level in Cenozoic were the primary drivers affecting the third-order sequences development, and the formation of ice sheets and related eustatic sea level fluctuation were triggered by the long-term 1.2-Myr obliquity cycles.
Obliquity, which influences the meridional insolation gradient, plays a considerable role in regulating the latitudinal flux of thermal energy, water vapor, and rainfall at middle to high latitudes [49]. This, in turn, governs the changes of ice sheets and contributes to the eustacy of sea levels [7,50]. Initially, the obliquity signal was thought to be primarily recorded at middle and high latitudes, but subsequent studies have revealed its presence in low-latitude regions as well [12,51,52,53]. The effects of obliquity on glacial dynamics and sea-level changes are well-recorded in benthic foraminifera δ18O data [54]. At the ~1.2-Myr obliquity nodes, the weakening of the latitudinal flux of thermal energy, water vapor, and rainfall promotes the formation of ice sheets, leading to a drop in sea level [16]. Notably, a clear obliquity signal is also observed in the LFA and LFB boreholes (Figure 5d,i).
5.2.2. Third-Order Sequence Development in the PRMB Response to Obliquity Forcing
In this study, we compare the ~1.2-Myr long-term amplitude modulation cycles identified in the GR series from the LFA, LFB, and LF14 boreholes with global sea level changes from [47] and regional sea level changes for the PRMB from [36]. This comparison aims to clarify the connection between third-order sequences and long-term astronomical cycles. Additionally, we contrast the nodes in our ~1.2-Myr amplitude modulation cycles, the nodes in the ~1.2-Myr filters of the La2004 obliquity model, and the third-order sequence schemes for the HJF built by previous studies [12,27,28,29,30] (Figure 6c–f). The ~1.2-Myr amplitude modulation cycles observed in the LFB borehole align well with the ~1.2-Myr cycles in the LF14 borehole reported by [12], and match good with the sea-level curves of [36,47]. Similarly, the ~1.2-Myr amplitude modulation cycles from borehole LFA correspond well with the cycles from borehole LF14 and align with the sea level curves from [36,47]. Furthermore, the ~1.2-Myr amplitude modulation cycles from the LFA and LFB boreholes show strong agreement with the 1.2-Myr amplitude modulation from the La2004 obliquity model (Figure 6).
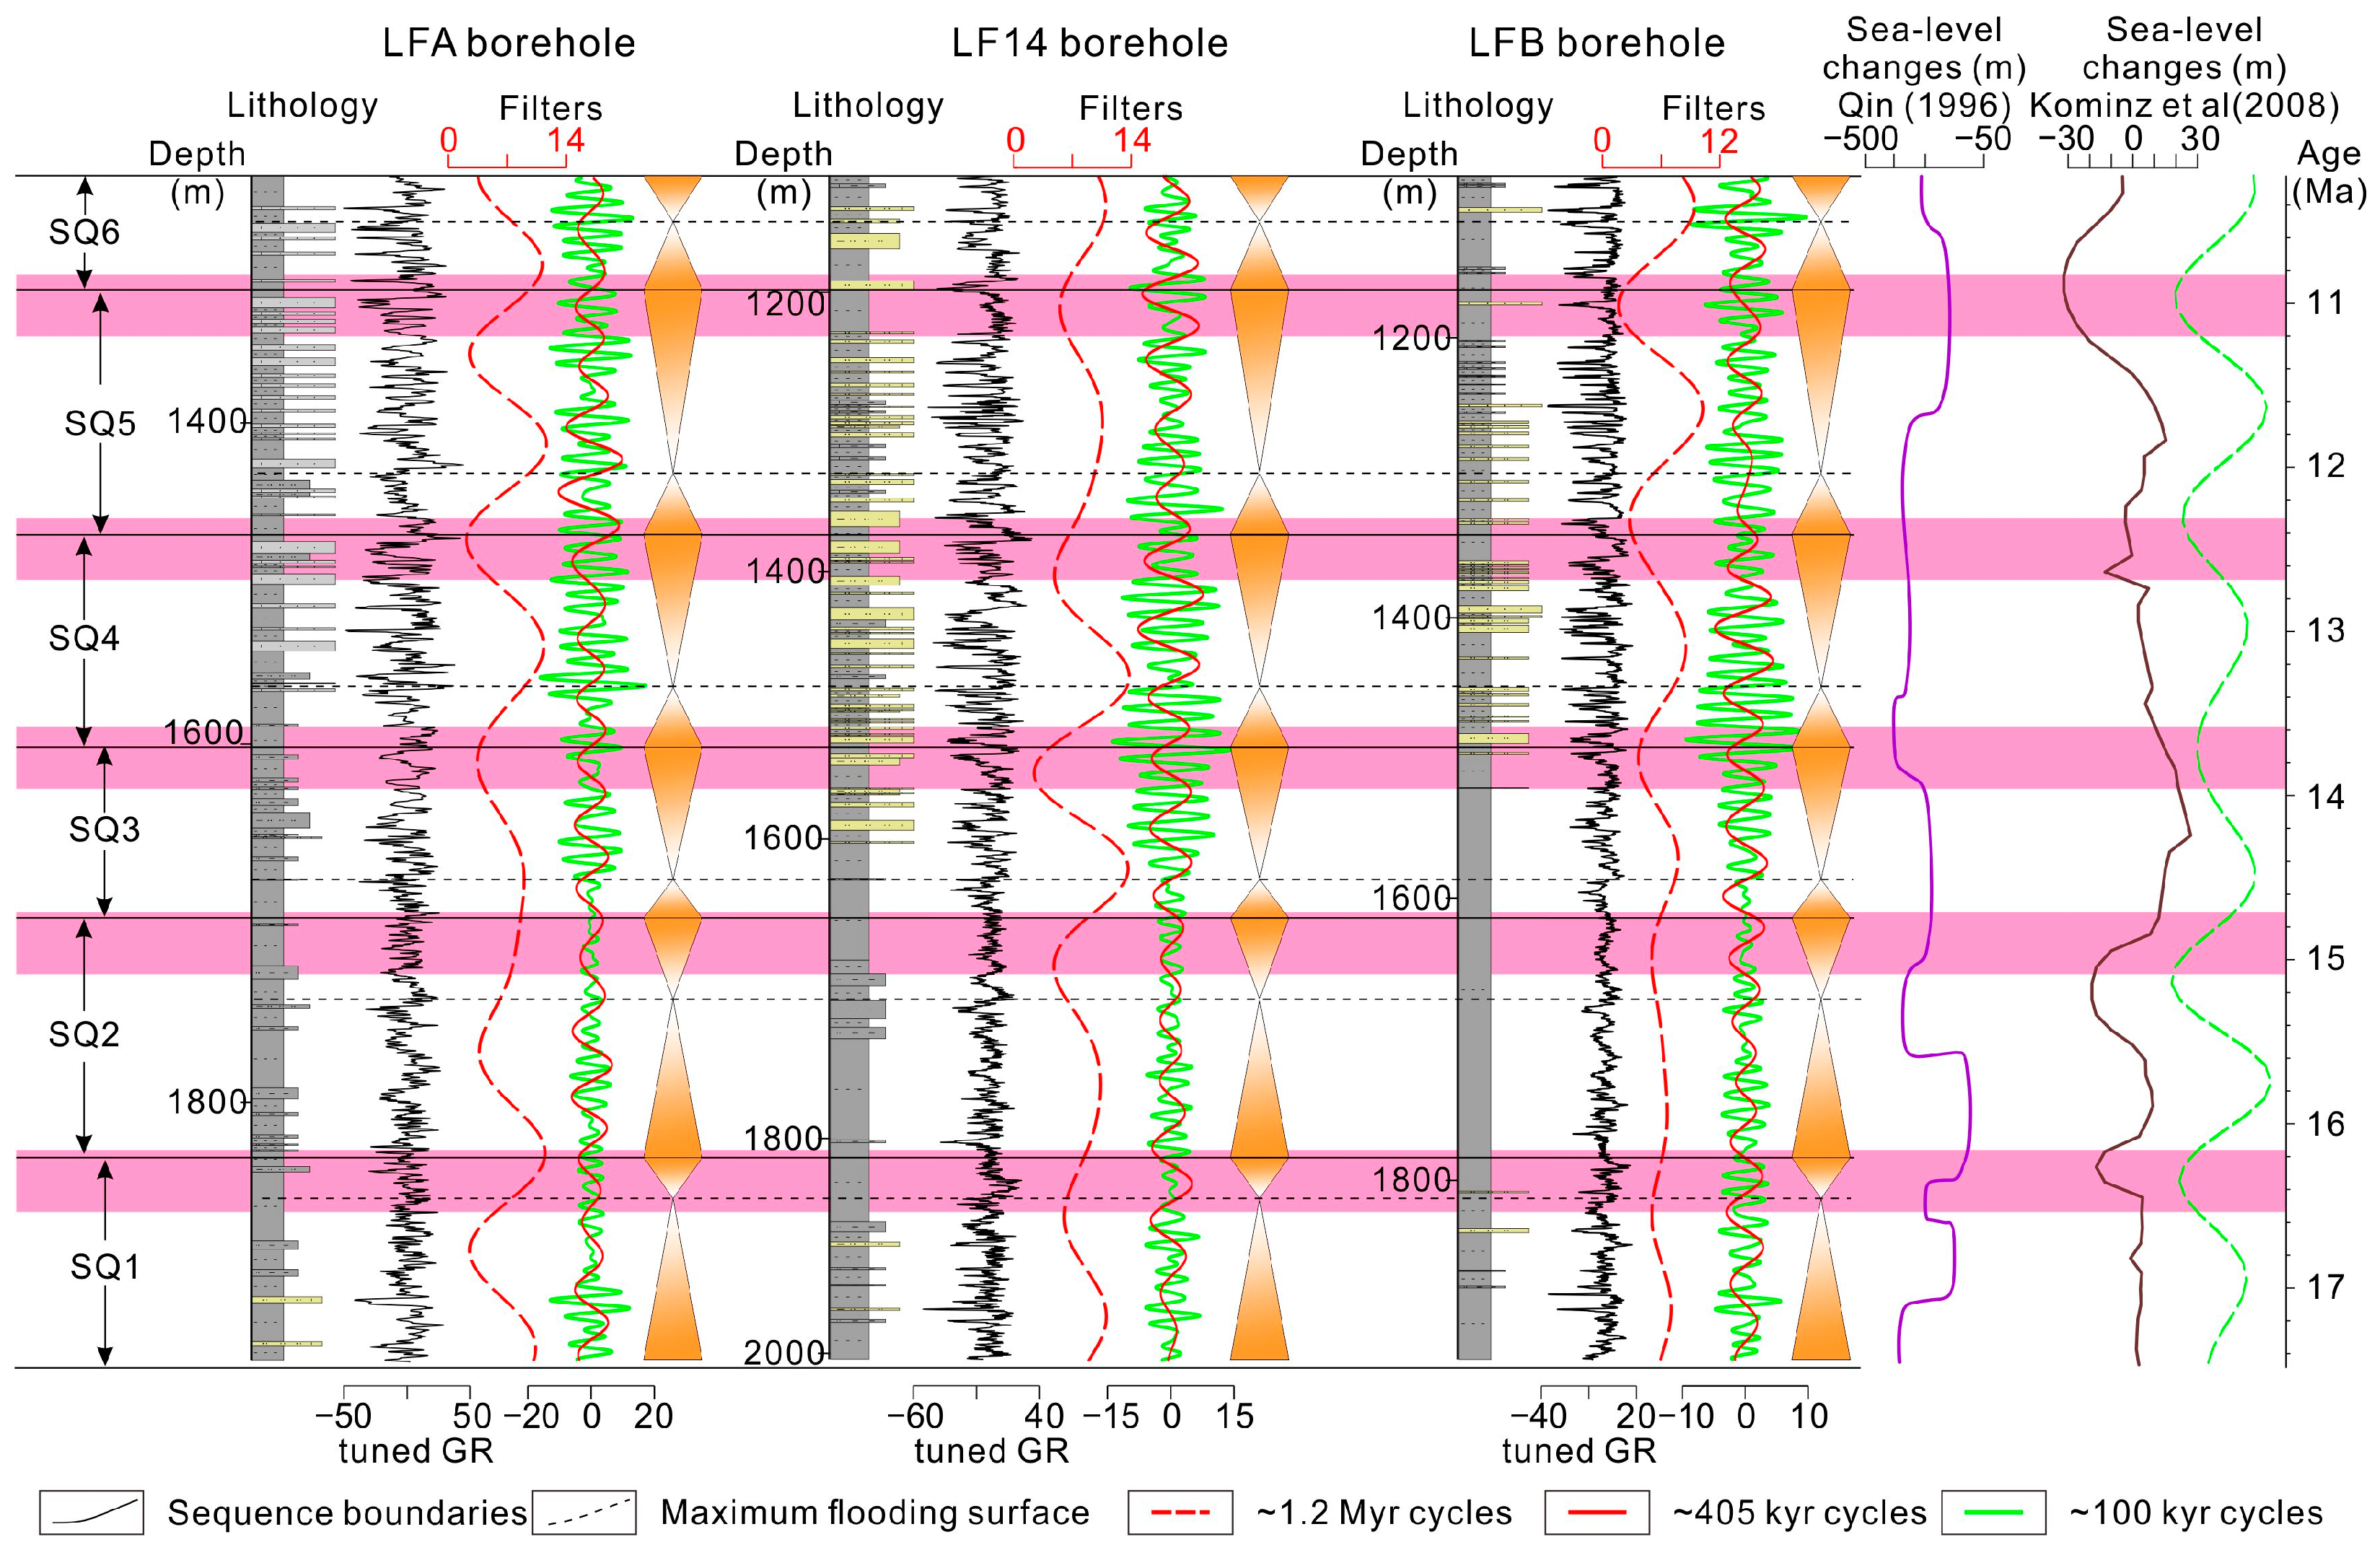
Our results demonstrate that the ~1.2-Myr amplitude modulation cycles from the LFA and LFB boreholes are broadly consistent with the eustatic curves (Figure 6 and Figure 7). These 1.2-Myr obliquity nodes could correspond to potential third-order sequence boundaries. Additionally, we present third-order sequence schemes derived from integrated analyses of INPEFA and wavelet transform methods, by traditional methods for the LFA and LFB boreholes (Figure 6g and Figure 8). These schemes, based on conventional approaches, are in close agreement with the sequence scheme proposed by [12], which is primarily based on astronomical cycles. The seven third-order sequence boundaries (SB1–SB7) identified in the LFA and LFB boreholes fall within the lowstand systems of global sea-level changes (Figure 6 and Figure 8), suggesting that these boundaries are relatively reliable. Moreover, this observation further supports the idea that the third-order sequence subdivision based on traditional methods generally aligns with the subdivision based on astronomical cycle methods, although some discrepancies persist. These differences introduce uncertainties in the precise subdivision of third-order sequences. To address this issue, we propose that the subdivision of third-order sequences using the integrated analyses of traditional methods and astronomical cycle-based method can reduce such uncertainties. Our study highlights that the third-order stratigraphic sequence scheme derived from the astronomical cycle method for the LFA and LFB boreholes aligns well with previous study [12]. Although our third-order sequence scheme derived from the astronomical cycle method differs from previous subdivisions, a detailed comparative analysis demonstrates a moderately strong relationship between every sequence boundary and corresponding boundaries in previous schemes (Figure 6g). For instance, the top sequence boundary of SQ1 in this study corresponds with those identified by [30] for S5 [29] for SQ6, and [12] for SQ1. Furthermore, the top sequence boundary of SQ2 in this study aligns with those identified by [28] for Cs5-1, and the top sequence boundary of SQ3 in this study corresponds with those identified by [28] for Cs5-2. The top sequence boundary of SQ4 in this study aligns with those identified by [30] for S7. Overall, our study demonstrates that the integrated method for subdividing third-order sequences is both replicable and operationally feasible.
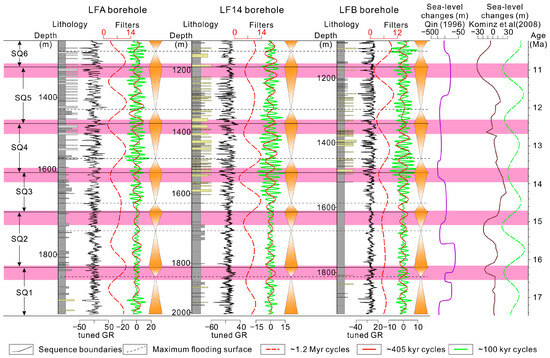
Figure 8.
Comparison and correlation of sequence stratigraphic scheme and filters for LFA, LF14 and LFB boreholes for the HJF, sea-level changes of [36], and global sea-level changes of [47]. The pink shaded rectangles show the low sea-level.
6. Conclusions
In this study, we anchored our ATS to the top boundary of the HJF and constructed an ATS for the HJF ranging from 10.221 ± 0.4 Ma to 17.441 ± 0.4 Ma/17.442 ± 0.4 Ma. Our ATS aligns closely with previous studies, confirming the reliability of astronomical calibration. Our study integrates cyclostratigraphy and sequence stratigraphy to delineate third-order sequence boundaries in the HJF of the PRMB, using data from the LFA and LFB boreholes. The application of INPEFA and wavelet transform techniques reveals clear correlations between sequence boundaries and long-term astronomical cycles, particularly the ~1.2-Myr obliquity cycles, which govern sea-level changes. The HJF comprises six third-order sequences. Furthermore, our results demonstrate that third-order sequences, traditionally subdivided by conventional methods, can be effectively integrated with astronomical cycle-based approaches to reduce uncertainty in sequence boundary identification. This integrated method offers a more objective and reproducible scheme for regional stratigraphic analysis. Our study demonstrates that the 1.2-Myr obliquity cycles governed the regional sea level changes of the PRMB and global eustatic sea-level changes during the middle Miocene, thereby influencing the third-order sequences evolution on at least a regional scale.
Author Contributions
H.X. and N.W.: writing—original draft; H.X. and X.X.: software; B.Y.: validation; H.X., N.W. and K.X.: writing, review, and editing. All authors have read and agreed to the published version of the manuscript.
Funding
This study was funded by National Natural Science Foundation of China (No. 42402132; 42172179).
Data Availability Statement
The raw data supporting the conclusions of this article will be made available by the authors on request.
Conflicts of Interest
The authors declare no conflicts of interest.
References
- Vail, P.R.; Mitchum, R.M., Jr.; Thompson, S., III. Seismic Stratigraphy and Global Changes of Sea Level: Part 3. Relative Changes of Sea Level from Coastal Onlap: Section 2. Application of Seismic Reflection Configuration to Stratigraphic Interpretation. In Seismic Stratigraphy—Applications to Hydrocarbon Exploration; Payton, C.E., Ed.; AAPG Memoir: Tulsa, OK, USA, 1977; Volume 26, pp. 63–81. [Google Scholar]
- Haq, B.U. Sequence Stratigraphy, Sea-level Change, and Significance for the Deep Sea. In Sedimentation, Tectonics and Eustasy: Sea-Level Changes at Active Margins; Macdonald, D.I.M., Ed.; Blackwell Scientific Publications: Oxford, UK, 1991; pp. 1–39. [Google Scholar]
- Catuneanu, O. Principles of Sequence Stratigraphy. In Principles of Sequence Stratigraphy, 2nd ed.; Elsevier: Amsterdam, The Netherlands, 2022; pp. 1–512. [Google Scholar]
- Vail, P.R.; Audemard, F.; Boeman, S.A.; Eisner, P.N.; Perez-Cruz, C. The Stratigraphic Signatures of Tectonics, Eustasy and Sedimentology—An Overview. In Cycles and Events in Stratigraphy; Einsele, G., Ricken, W., Seilacher, A., Eds.; Springer: Berlin/Heidelberg, Germany, 1991; pp. 617–659. [Google Scholar]
- Rasmussen, C. Gaussian Processes in Machine Learning. In Advanced Lectures on Machine Learning: ML Summer Schools 2003; Bousquet, O., von Luxburg, U., Rätsch, G., Eds.; Springer: Berlin/Heidelberg, Germany, 2004; pp. 63–71. [Google Scholar]
- Strasser, A.; Hillgärtner, H.; Hug, W.; Pittet, B. Third-order Depositional Sequences Reflecting Milankovitch Cyclicity. Terra Nova 2000, 12, 303–311. [Google Scholar] [CrossRef]
- Boulila, S.; Galbrun, B.; Miller, K.G.; Pekar, S.F.; Browning, J.V.; Laskar, J.; Wright, J.D. On the origin of Cenozoic and Mesozoic "third-order" eustatic sequences. Earth Sci. Rev. 2011, 109, 94–112. [Google Scholar] [CrossRef]
- Spencer, R.J.; Demicco, R.V. Computer models of carbonate platform cycles driven by subsidence and eustasy. Geology 1989, 17, 165–168. [Google Scholar] [CrossRef]
- Osleger, D.A. Subtidal carbonate cycles: Implications for allocyclic vs. autocyclic controls. Geology 1991, 19, 917–920. [Google Scholar] [CrossRef]
- Strasser, A.; Hilgen, F.J.; Heckel, P.H. Cyclostratigraphy; concepts, definitions, and applications. Newsl. Stratigr. 2006, 42, 75–114. [Google Scholar] [CrossRef]
- Cong, F.; Zhu, F.; Cai, Z.; Chen, H.; Li, J.; Wang, Y.; Wang, L. Orbitally forced glacio-eustatic origin of third-order sequences and parasequences in the Middle Permian Maokou Formation, South China. Mar. Pet. Geol. 2019, 99, 237–251. [Google Scholar] [CrossRef]
- Xu, K.; Ren, J.; Kemp, D.B.; Lei, C.; Zhu, H.; Zheng, J.; Sun, Z. Astronomical Pacing of Third-Order Sea-Level Sequences During the Middle Miocene in the Northern South China Sea. Mar. Pet. Geol. 2023, 154, 106335. [Google Scholar] [CrossRef]
- Gil, J.; Garia-Hidalgo, J.F.; Mateos, R.; Segura, M. Orbital cycles in a late cretaceousshallow platform (Iberian Ranges, Spain). Palaeogeogr. Palaeoclimatol. Palaeoecol. 2009, 274, 40–53. [Google Scholar] [CrossRef]
- Wagreich, M.; Lein, R.; Sames, B. Eustasy, its controlling factors, and the limnoeustatic hypothesis–concepts inspired by Eduard Suess. Austrian J. Earth Sci. 2014, 107, 115–131. [Google Scholar]
- Catuneanu, O. Sequence Stratigraphy: Guidelines for a Standard Methodology. In Stratigraphy & Timescales, 1st ed.; Montenari, M., Ed.; Academic Press: Cambridge, MA, USA, 2017; Volume 2, pp. 1–57. [Google Scholar]
- Liu, Y.; Huang, C.; Ogg, J.G.; Algeo, T.J.; Kemp, D.B.; Shen, W. Oscillations of Global Sea-Level Elevation During the Paleogene Correspond to 1.2-Myr Amplitude Modulation of Orbital Obliquity Cycles. Earth Planet. Sci. Lett. 2019, 522, 65–78. [Google Scholar] [CrossRef]
- Prokoph, A.; Agterberg, F.P. Wavelet Analysis of Well-Logging Data from Oil Source Rock, Egret Member, Offshore Eastern Canada. AAPG Bull. 2000, 84, 1617–1632. [Google Scholar]
- Nio, S.D.; Brouwer, J.H.; Smith, D.; de Jong, M.; Böhm, A.R. Spectral Trend Attribute Analysis: Applications in the Stratigraphic Analysis of Wireline Logs. First Break 2005, 23, 71–75. [Google Scholar]
- Tavakoli, V. Application of gamma deviation log (GDL) in sequence stratigraphy of carbonate strata, an example from offshore Persian Gulf, Iran. J. Petroleum Sci. Eng. 2017, 156, 868–876. [Google Scholar] [CrossRef]
- Schnyder, J.; Ruffell, A.; Deconinck, J.-F.; Baudin, F. Conjunctive Use of Spectral Gamma-Ray Logs and Clay Mineralogy in Defining Late Jurassic–Early Cretaceous Palaeoclimate Change (Dorset, U.K.). Palaeogeogr. Palaeoclimatol. Palaeoecol. 2006, 229, 303–320. [Google Scholar] [CrossRef]
- Wu, H.; Zhang, S.; Jiang, G.; Hinnov, L.; Yang, T.; Li, H.; Wan, X.; Wang, C. Astrochronology of the Early Turonian–Early Campanian terrestrial succession in the Songliao Basin, northeastern China and its implication for long-period behavior of the Solar System. Palaeogeogr. Palaeoclimatol. Palaeoecol. 2013, 385, 55–70. [Google Scholar] [CrossRef]
- Boulila, S.; Dupont-Nivet, G.; Galbrun, B.; Bauer, H.; Châteauneuf, J.J. Age and Driving Mechanisms of the Eocene–Oligocene Transition from Astronomical Tuning of a Lacustrine Record (Rennes Basin, France). Clim. Past 2021, 17, 2343–2360. [Google Scholar] [CrossRef]
- Li, M.; Ogg, J.; Zhang, Y.; Huang, C.; Hinnov, L.; Chen, Z.; Zou, Z. Astronomical Tuning of the End-Permian Extinction and the Early Triassic Epoch of South China and Germany. Earth Planet. Sci. Lett. 2016, 441, 10–25. [Google Scholar] [CrossRef]
- Zhu, M.; Zhang, X.; Huang, Y.; Zhu, J.; Long, Z.; Shi, Y.; Shi, C.; Zhang, X. Source Rock Characteristics and Resource Potential in Pearl River Mouth Basin. Acta Petrol. Sin. 2019, 40, 53–68. [Google Scholar]
- Xiang, Q. Sedimentary Microfacies and Lithologic Trap Types of the Hanjiang Formation in the Enping Depression. Mar. Geol. Front. 2022, 38, 60–66. [Google Scholar]
- Liu, X.; Ge, J.; Qu, H.; Ma, C. Sequence stratigraphy driven by tectonic subsidence and astronomical forcing: A case study from the Miocene Pearl River Mouth Basin, South China Sea. Mar. Pet. Geol. 2024, 169, 107074. [Google Scholar] [CrossRef]
- Ma, M.; Lin, C.; Tao, Z.; Jiang, J. Sedimentary Architecture and Evolution of Slope Channel System and Sequence Stratigraphic Framework: A Case from Northeast of Baiyun Sag, Pearl River Mouth Basin. J. Northeast Pet. Univ. 2017, 41, 85–95. [Google Scholar]
- Lin, C.; Jiang, J.; Shi, H.; Zhang, Z.; Liu, J.; Qin, C.; Li, H.; Ran, H.; Wei, A.; Tian, H.; et al. Sequence Architecture and Depositional Evolution of the Northern Continental Slope of the South China Sea: Responses to Tectonic Processes and Changes in Sea Level. Basin Res. 2018, 30, 568–595. [Google Scholar] [CrossRef]
- Wu, J.; Zhang, X.; Bai, H.; Zheng, X.; Cai, G.; Li, Z. Miocene Tidal Control System and Its Exploration Significance of Lithologic Trap in Yangjiang Sag, Pearl River Mouth Basin. Earth Sci. 2021, 46, 3673–3689. [Google Scholar]
- Zhang, X.; Lin, C.; Zhang, Z.; Feng, X.; Zhang, B.; Bei, R.; Shu, L.; Jiang, J.; Xing, Z.; Sun, H. Shoreline Migration Paths and Depositional Architecture of Early–Mid Miocene Deltaic Clinoforms in Response to Sea-Level Changes in the North-Eastern Shelf Margin, South China Sea. Sedimentology 2022, 69, 1456–1489. [Google Scholar] [CrossRef]
- Xue, L.; Ding, X.; Pei, R.; Wan, X. Miocene Paleoenvironmental Evolution Based on Benthic Foraminiferal Assemblages in the Lufeng Sag, Northern South China Sea. Acta Oceanol. Sin. 2019, 38, 124–137. [Google Scholar] [CrossRef]
- Ren, J.; Luo, P.; Gao, Y.; Wang, H.; Lei, C.; Chao, P. Structural, Sedimentary and Magmatic Records During Continental Breakup at Southwest Sub-Basin of South China Sea. Earth Sci. 2022, 47, 2287–2302. [Google Scholar]
- Ge, J.; Zhao, X.; Tan, M.; Zhuo, H.; Liu, C.; Jones, B.G. Sequence Stratigraphy and Depositional Evolution of the North-Eastern Shelf (33.9–10.5 Ma) of the Pearl River Mouth Basin, South China Sea. Mar. Pet. Geol. 2022, 141, 105697. [Google Scholar] [CrossRef]
- Jamil, M.; Siddiqui, N.A.; Ahmed, N.; Usman, M.; Umar, M.; Rahim, H.u.; Imran, Q.S. Facies Analysis and Sedimentary Architecture of Hybrid Event Beds in Submarine Lobes: Insights from the Crocker Fan, NW Borneo, Malaysia. J. Mar. Sci. Eng. 2021, 9, 1133. [Google Scholar] [CrossRef]
- Jamil, M.; Siddiqui, N.A.; Usman, M.; Wahid, A.; Umar, M.; Ahmed, N.; Haq, I.U.; El-Ghali, M.A.K.; Imran, Q.S.; Rahman, A.H.A.; et al. Facies analysis and distribution of Late Palaeogene deep-water massive sandstones in submarine-fan lobes, NW Borneo. Geol. J. 2022, 57, 4489–4507. [Google Scholar] [CrossRef]
- Qin, G. Application of Micropaleontology to the Sequence Stratigraphic Studies of Late Cenozoic in the Zhujiang River Mouth Basin. Mar. Geol. Quat. Geol. 1996, 16, 1–16. [Google Scholar]
- Zhang, J.; Pas, D.; Krijgsman, W.; Wei, W.; Du, X.; Zhang, C.; Liu, J.; Lu, Y. Astronomical Forcing of the Paleogene Coal-Bearing Hydrocarbon Source Rocks of the East China Sea Shelf Basin. Sediment. Geol. 2020, 406, 105715. [Google Scholar] [CrossRef]
- Cleveland, W.S. Robust Locally Weighted Regression and Smoothing Scatterplots. J. Am. Stat. Assoc. 1979, 74, 829–836. [Google Scholar] [CrossRef]
- Kodama, K.P.; Hinnov, L.A. Rock Magnetic Cyclostratigraphy. In Rock Magnetic Cyclostratigraphy, 1st ed.; Wiley–Blackwell: Hoboken, NJ, USA, 2014; pp. 1–176. [Google Scholar]
- Li, M.; Kump, L.R.; Hinnov, L.A.; Mann, M.E. Tracking Variable Sedimentation Rates and Astronomical Forcing in Phanerozoic Paleoclimate Proxy Series with Evolutionary Correlation Coefficients and Hypothesis Testing. Earth Planet. Sci. Lett. 2018, 501, 165–179. [Google Scholar] [CrossRef]
- Meyers, S.R.; Sageman, B.B. Quantification of Deep-Time Orbital Forcing by Average Spectral Misfit. Am. J. Sci. 2007, 307, 773–792. [Google Scholar] [CrossRef]
- Ma, Y.; Fan, M.; Li, M.; Ogg, J.G.; Zhang, C.; Feng, J.; Zhou, C.; Liu, X.; Lu, Y.; Liu, H.; et al. East Asian lake hydrology modulated by global sea-level variations in the Eocene warmhouse. Earth Planet. Sci. Lett. 2023, 602, 117925. [Google Scholar] [CrossRef]
- Thomson, D.J. Spectrum Estimation and Harmonic Analysis. Proc. IEEE 1982, 70, 1055–1096. [Google Scholar] [CrossRef]
- Laskar, J.; Robutel, P.; Joutel, F.; Gastineau, M.; Correia, A.C.M.; Levrard, B. A Long-Term Numerical Solution for the Insolation Quantities of the Earth. Astron. Astrophys. 2004, 428, 261–285. [Google Scholar] [CrossRef]
- Hinnov, L.A.; Hilgen, F.J. Cyclostratigraphy and Astrochronology. In The Geologic Time Scale; Gradstein, F.M., Ogg, J.G., Schmitz, M.D., Ogg, G.M., Eds.; Elsevier: Amsterdam, The Netherlands, 2012; pp. 63–83. [Google Scholar]
- Li, M.; Hinnov, L.; Kump, L. Acycle: Time-Series Analysis Software for Paleoclimate Research and Education. Comput. Geosci. 2019, 127, 12–22. [Google Scholar] [CrossRef]
- Kominz, M.; Browning, J.; Miller, K.; Sugarman, P.; Mizintseva, S.; Scotese, C. Late Cretaceous to Miocene Sea-Level Estimates from the New Jersey and Delaware Coastal Plain Coreholes: An Error Analysis. Basin Res. 2008, 20, 211–226. [Google Scholar] [CrossRef]
- Liu, Y.; Wu, H.; Zhang, S.; Fang, N.; Jiang, Z.; Yang, T. Cyclostratigraphy Research on the Hanjiang-Wanshan Formations in the Zhu I Depression. Earth Sci. J. China Univ. Geosci. 2012, 37, 411–423. [Google Scholar]
- Raymo, M.; Nisancioglu, K. The 41 kyr World: Milankovitch’s Other Unsolved Mystery. Paleoceanogr. Paleoclimatol. 2003, 18, 101–112. [Google Scholar] [CrossRef]
- van Dam, J.; Abdul Aziz, H.; Álvarez Sierra, M. Long-Period Astronomical Forcing of Mammal Turnover. Nature 2006, 443, 687–691. [Google Scholar] [CrossRef]
- Meyers, S.R.; Sageman, B.B.; Arthur, M.A. Obliquity Forcing of Organic Matter Accumulation During Oceanic Anoxic Event 2. Paleoceanography 2012, 27, PA3212. [Google Scholar] [CrossRef]
- Fang, Q.; Wu, H.; Hinnov, L.A.; Tian, W.; Wang, X.; Yang, T.; Li, H.; Zhang, S. Abiotic and Biotic Responses to Milankovitch-Forced Megamonsoon and Glacial Cycles Recorded in South China at the End of the Late Paleozoic Ice Age. Glob. Planet. Change 2018, 163, 97–108. [Google Scholar] [CrossRef]
- Cao, H.; Jin, S.; Hou, M.; Chen, S.; Liu, Y.; Chen, A. Astronomical Cycles Calibrated the Sea-Level Sequence Durations of Late Miocene to Pliocene in Qiongdongnan Basin, South China Sea. Mar. Pet. Geol. 2022, 143, 105813. [Google Scholar] [CrossRef]
- Armstrong, H.A.; Baldini, J.; Challands, T.J.; Gröcke, D.R.; Owen, A.W. Response of the Inter-Tropical Convergence Zone to Southern Hemisphere Cooling During Upper Ordovician Glaciation. Palaeogeogr. Palaeoclimatol. Palaeoecol. 2009, 284, 227–236. [Google Scholar] [CrossRef]

Disclaimer/Publisher’s Note: The statements, opinions and data contained in all publications are solely those of the individual author(s) and contributor(s) and not of MDPI and/or the editor(s). MDPI and/or the editor(s) disclaim responsibility for any injury to people or property resulting from any ideas, methods, instructions or products referred to in the content. |
© 2025 by the authors. Licensee MDPI, Basel, Switzerland. This article is an open access article distributed under the terms and conditions of the Creative Commons Attribution (CC BY) license (https://creativecommons.org/licenses/by/4.0/).