
Sediment Resuspension in the Yellow River Subaqueous Delta During Gale Events
 , and
, and 
Abstract
1. Introduction
2. Data and Methods
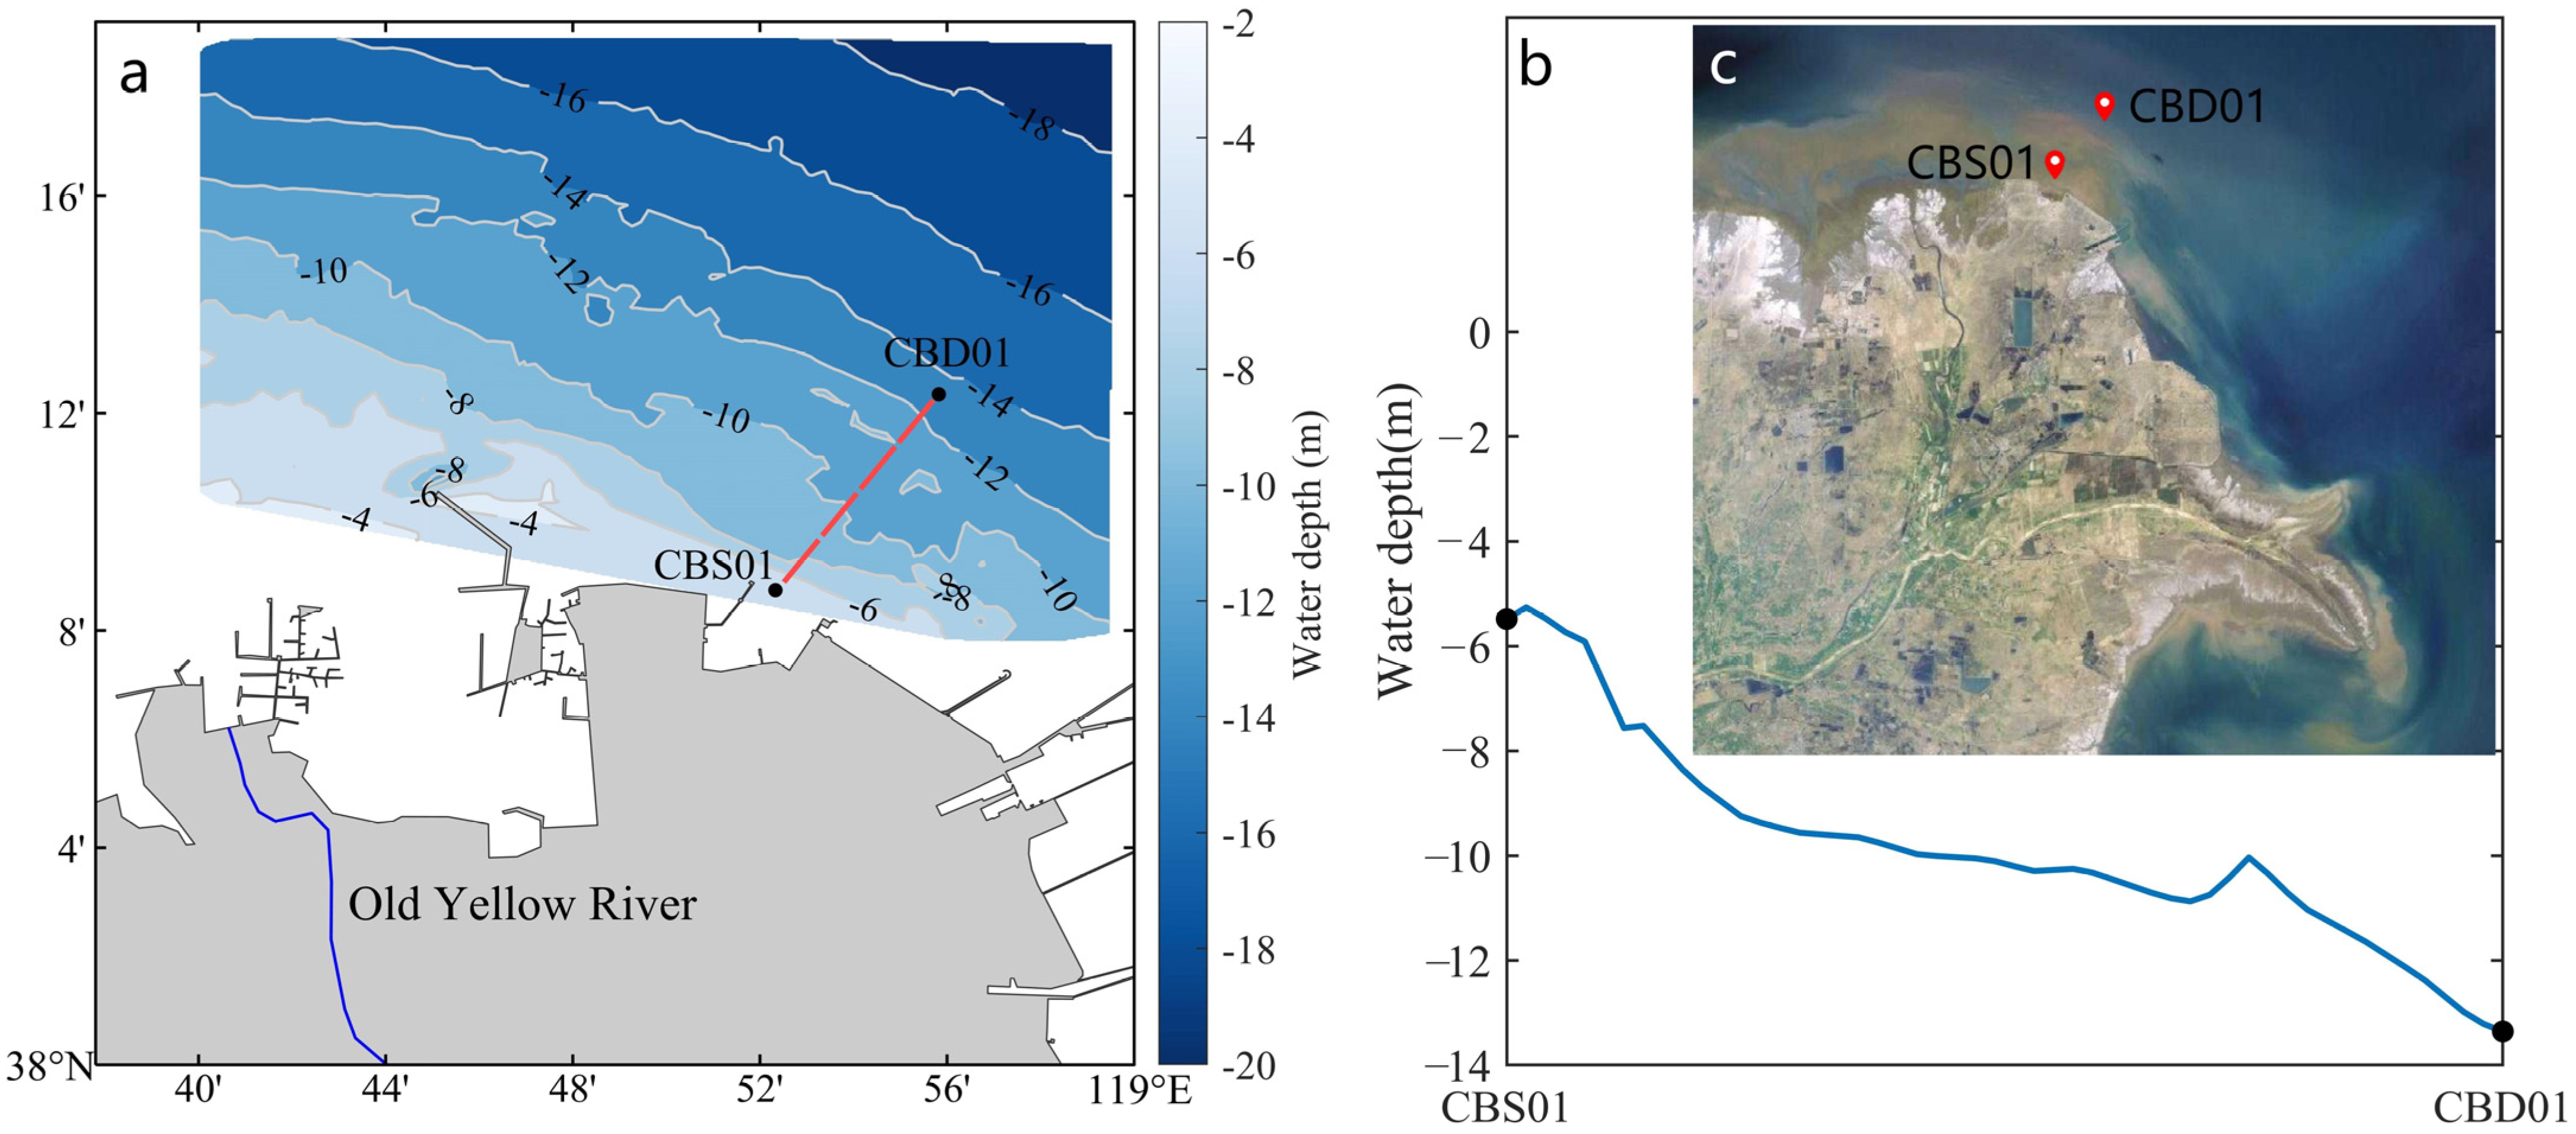
2.1. Study Area
2.2. Data Source
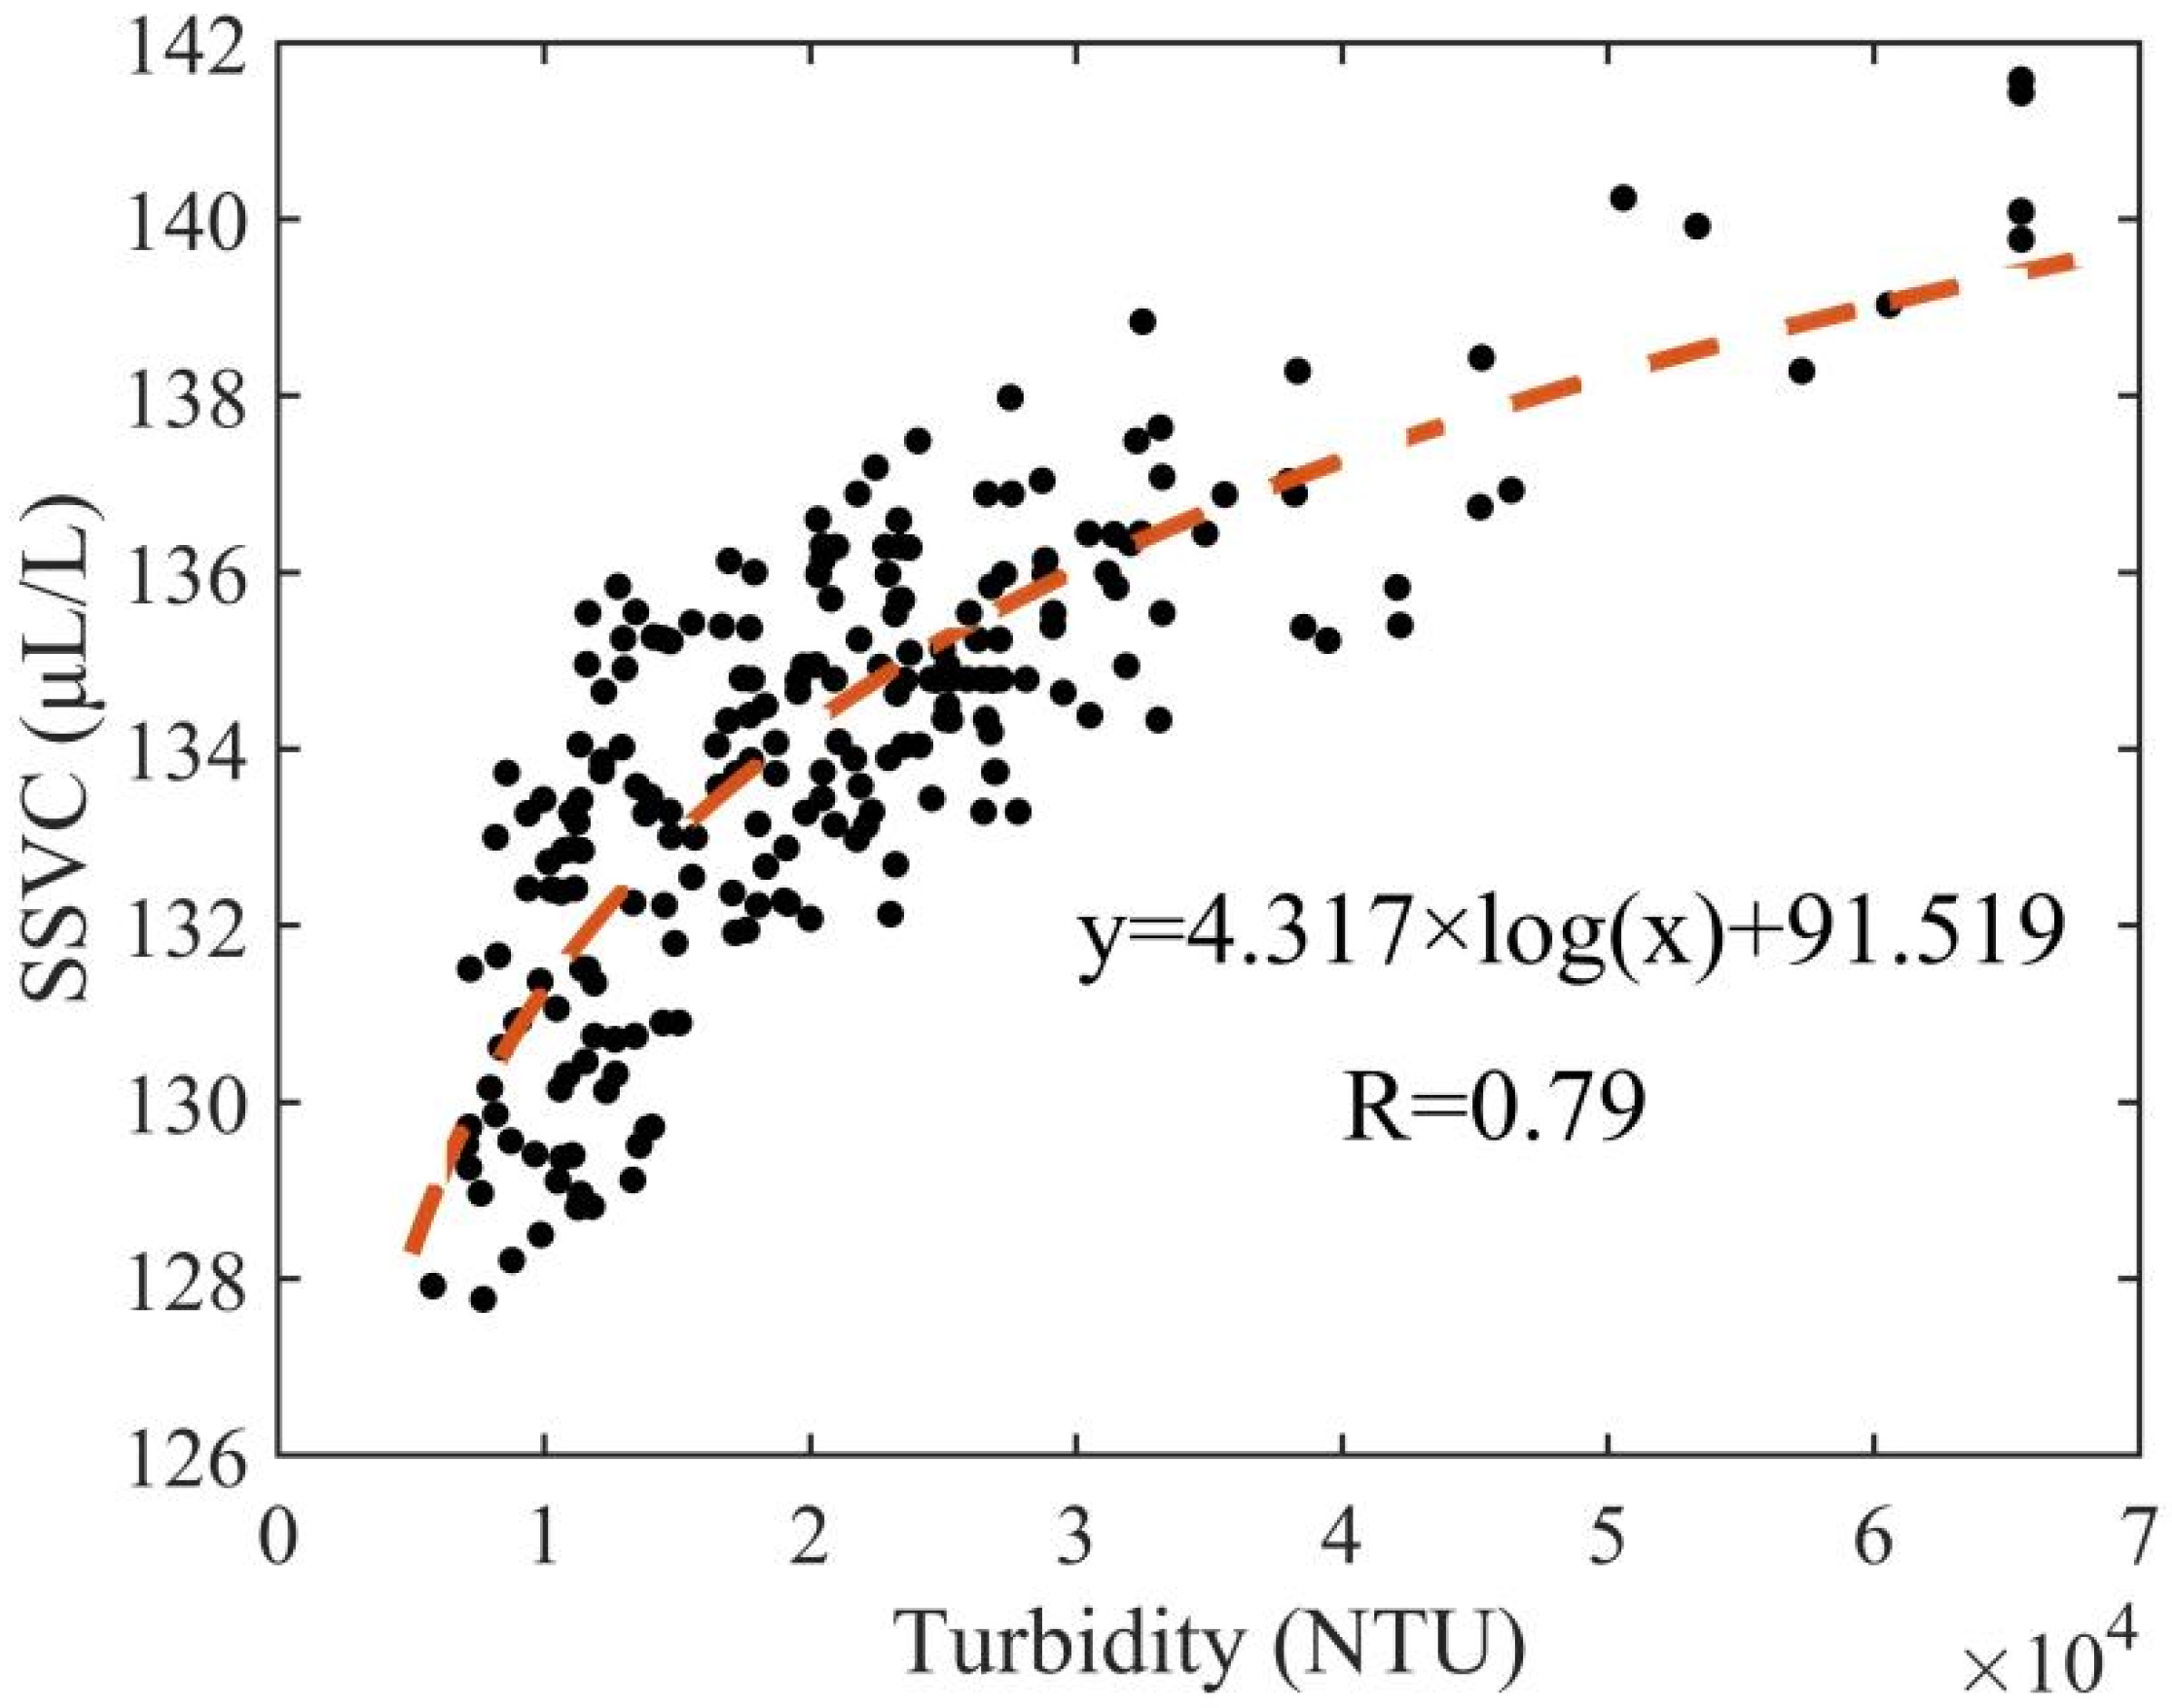
2.3. ADCP Data Processing
2.4. Calculation of Bottom Shear Stress
2.5. Calculation of Critical Shear Stress
3. Results
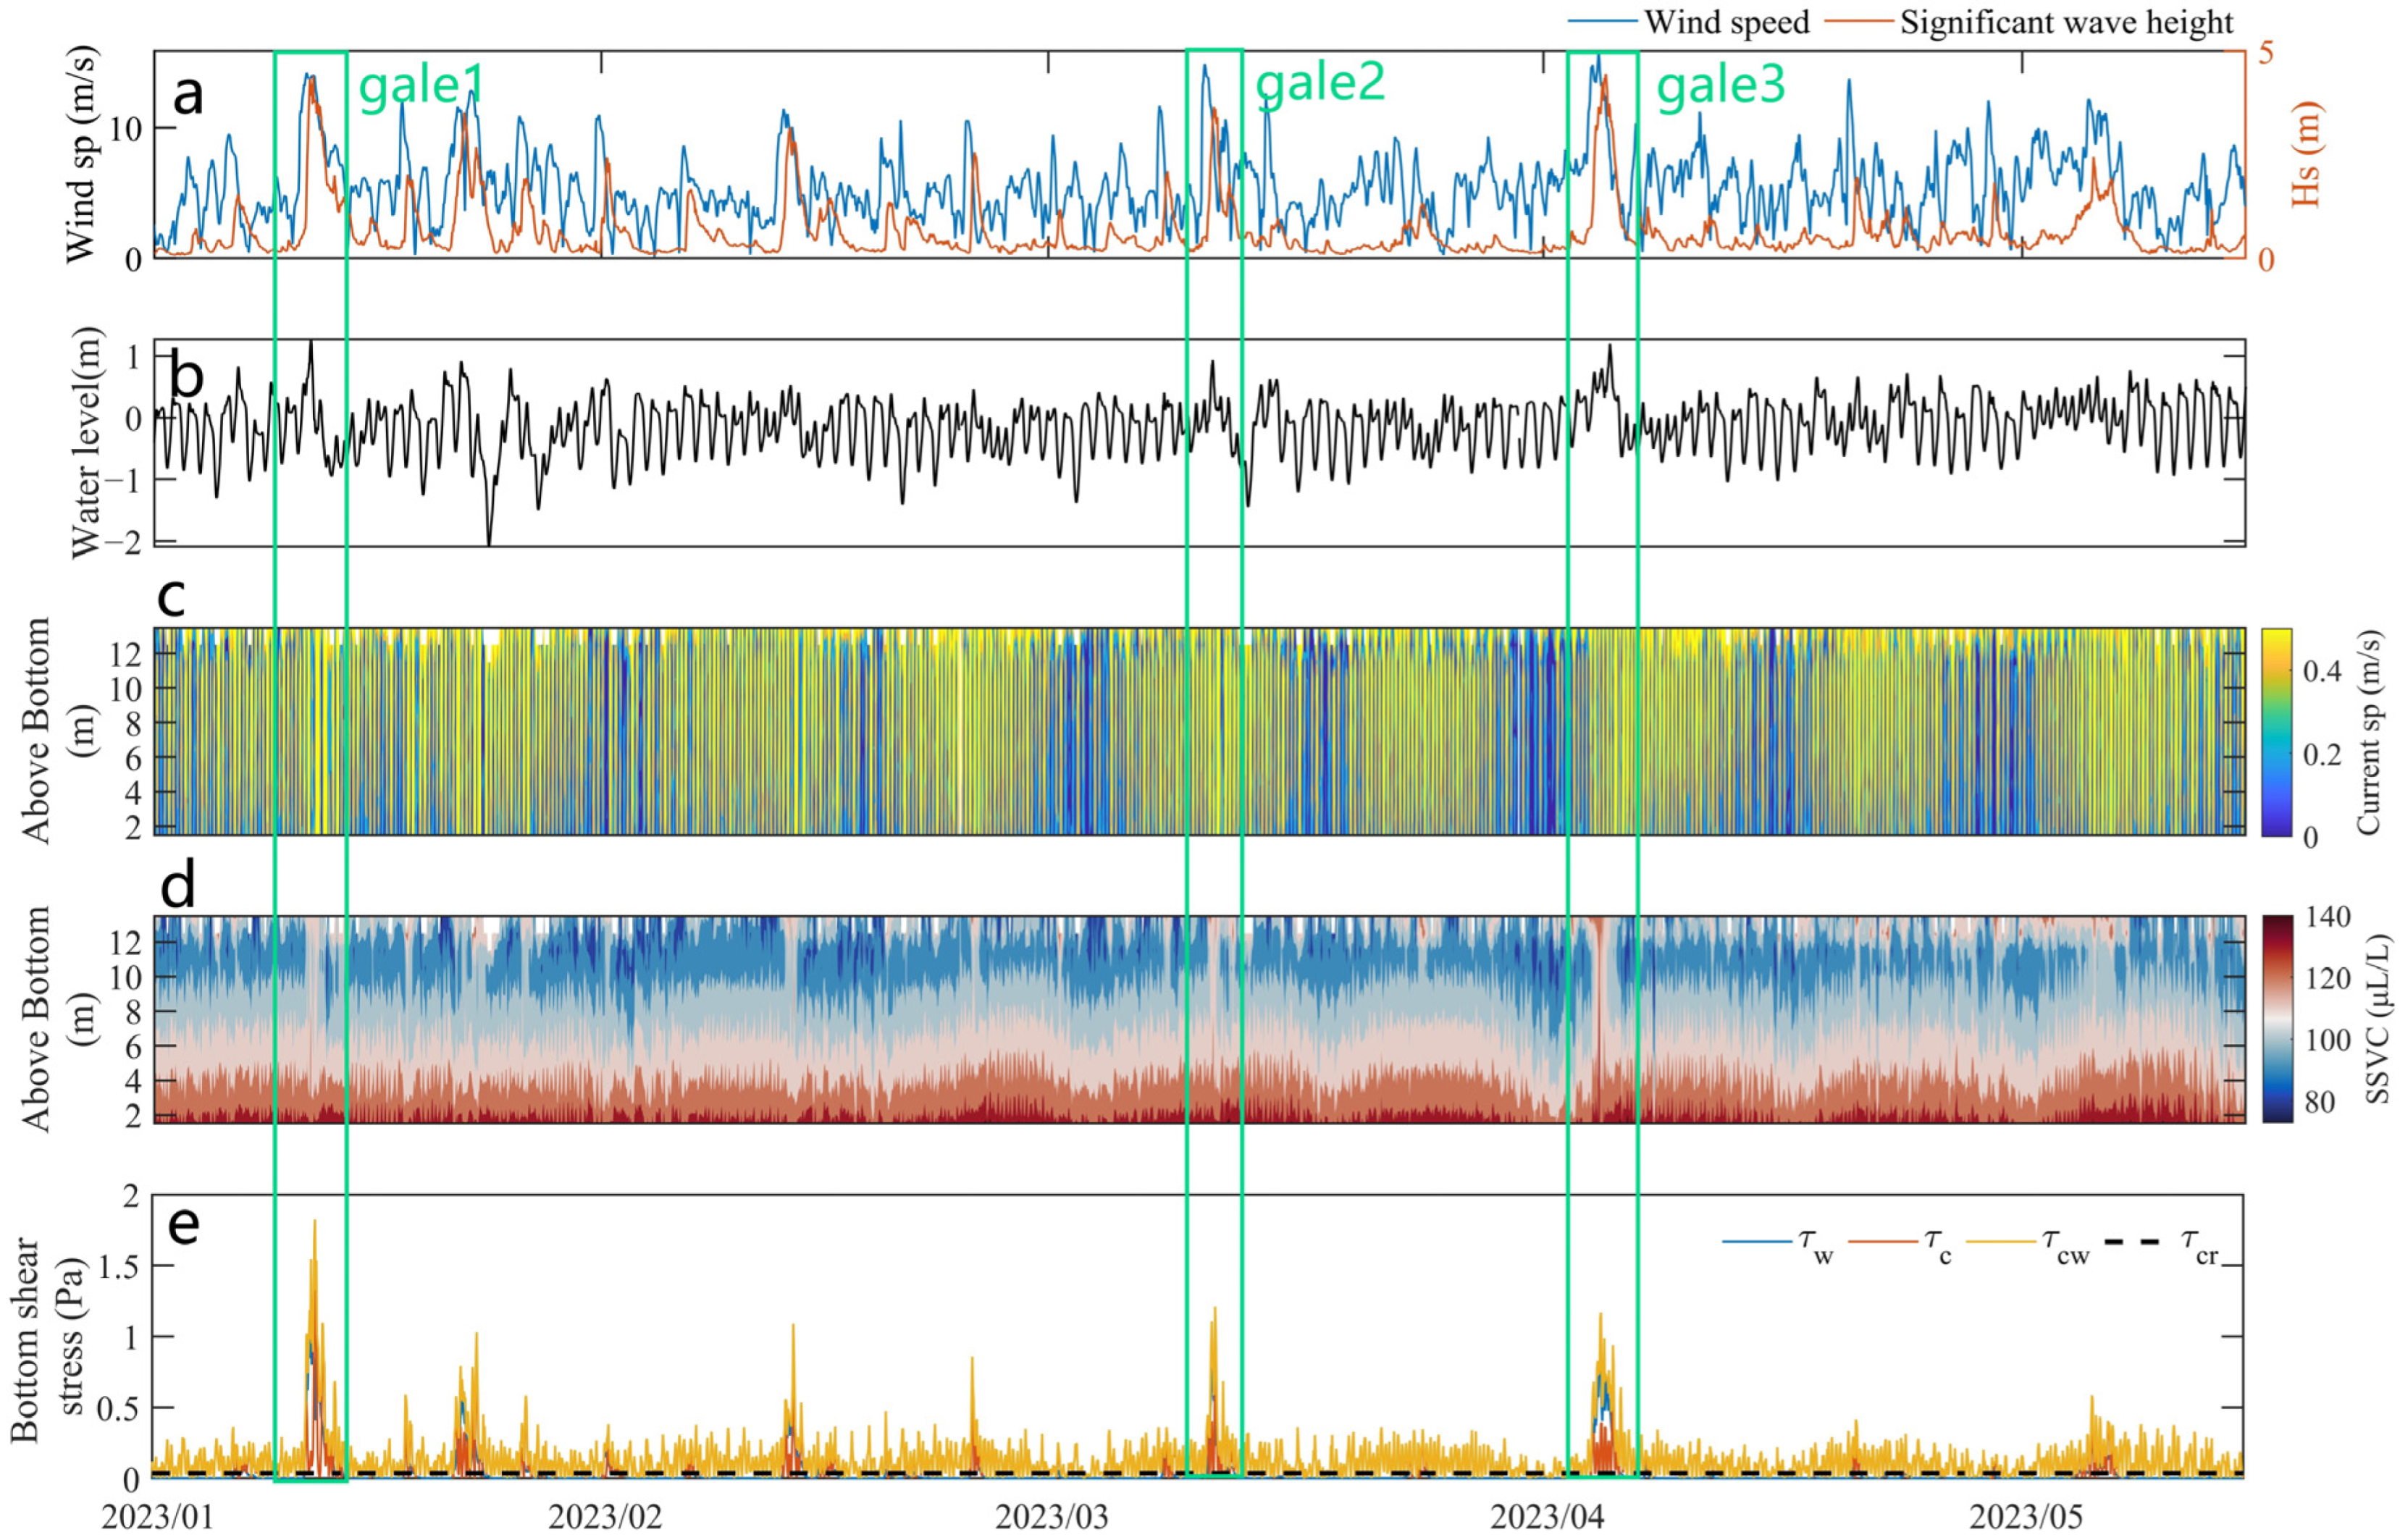
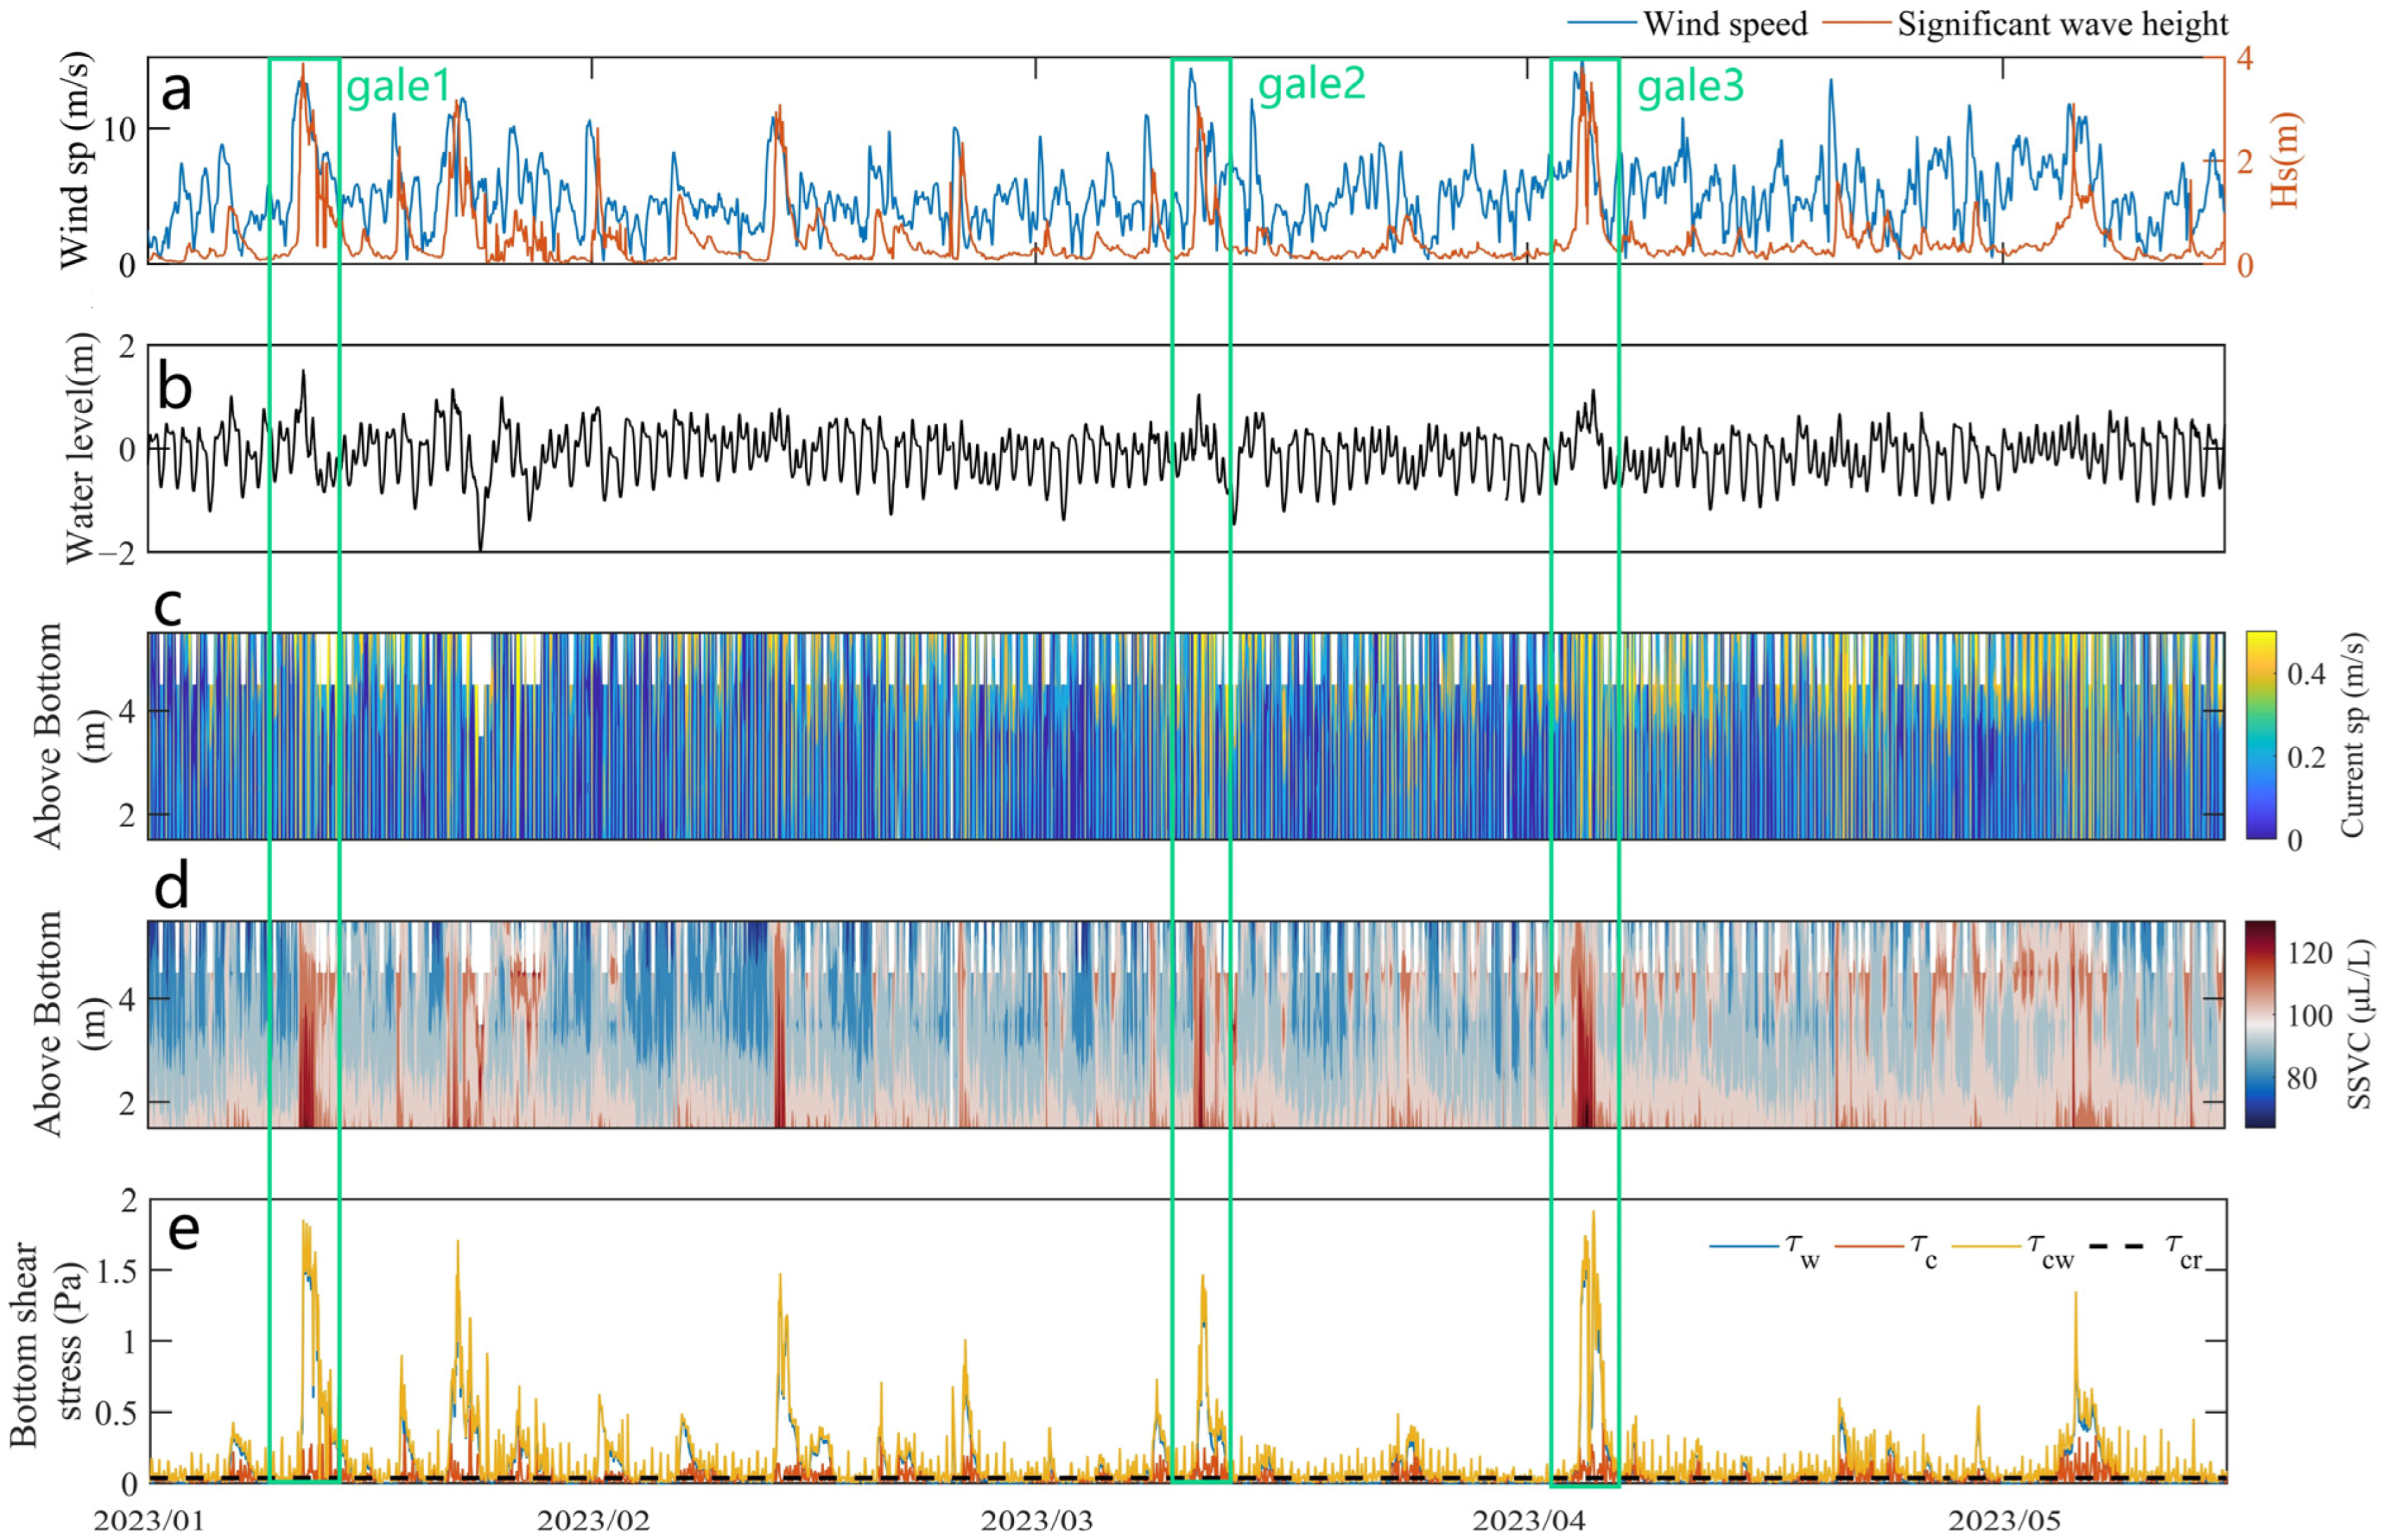
3.1. Holistic Analysis
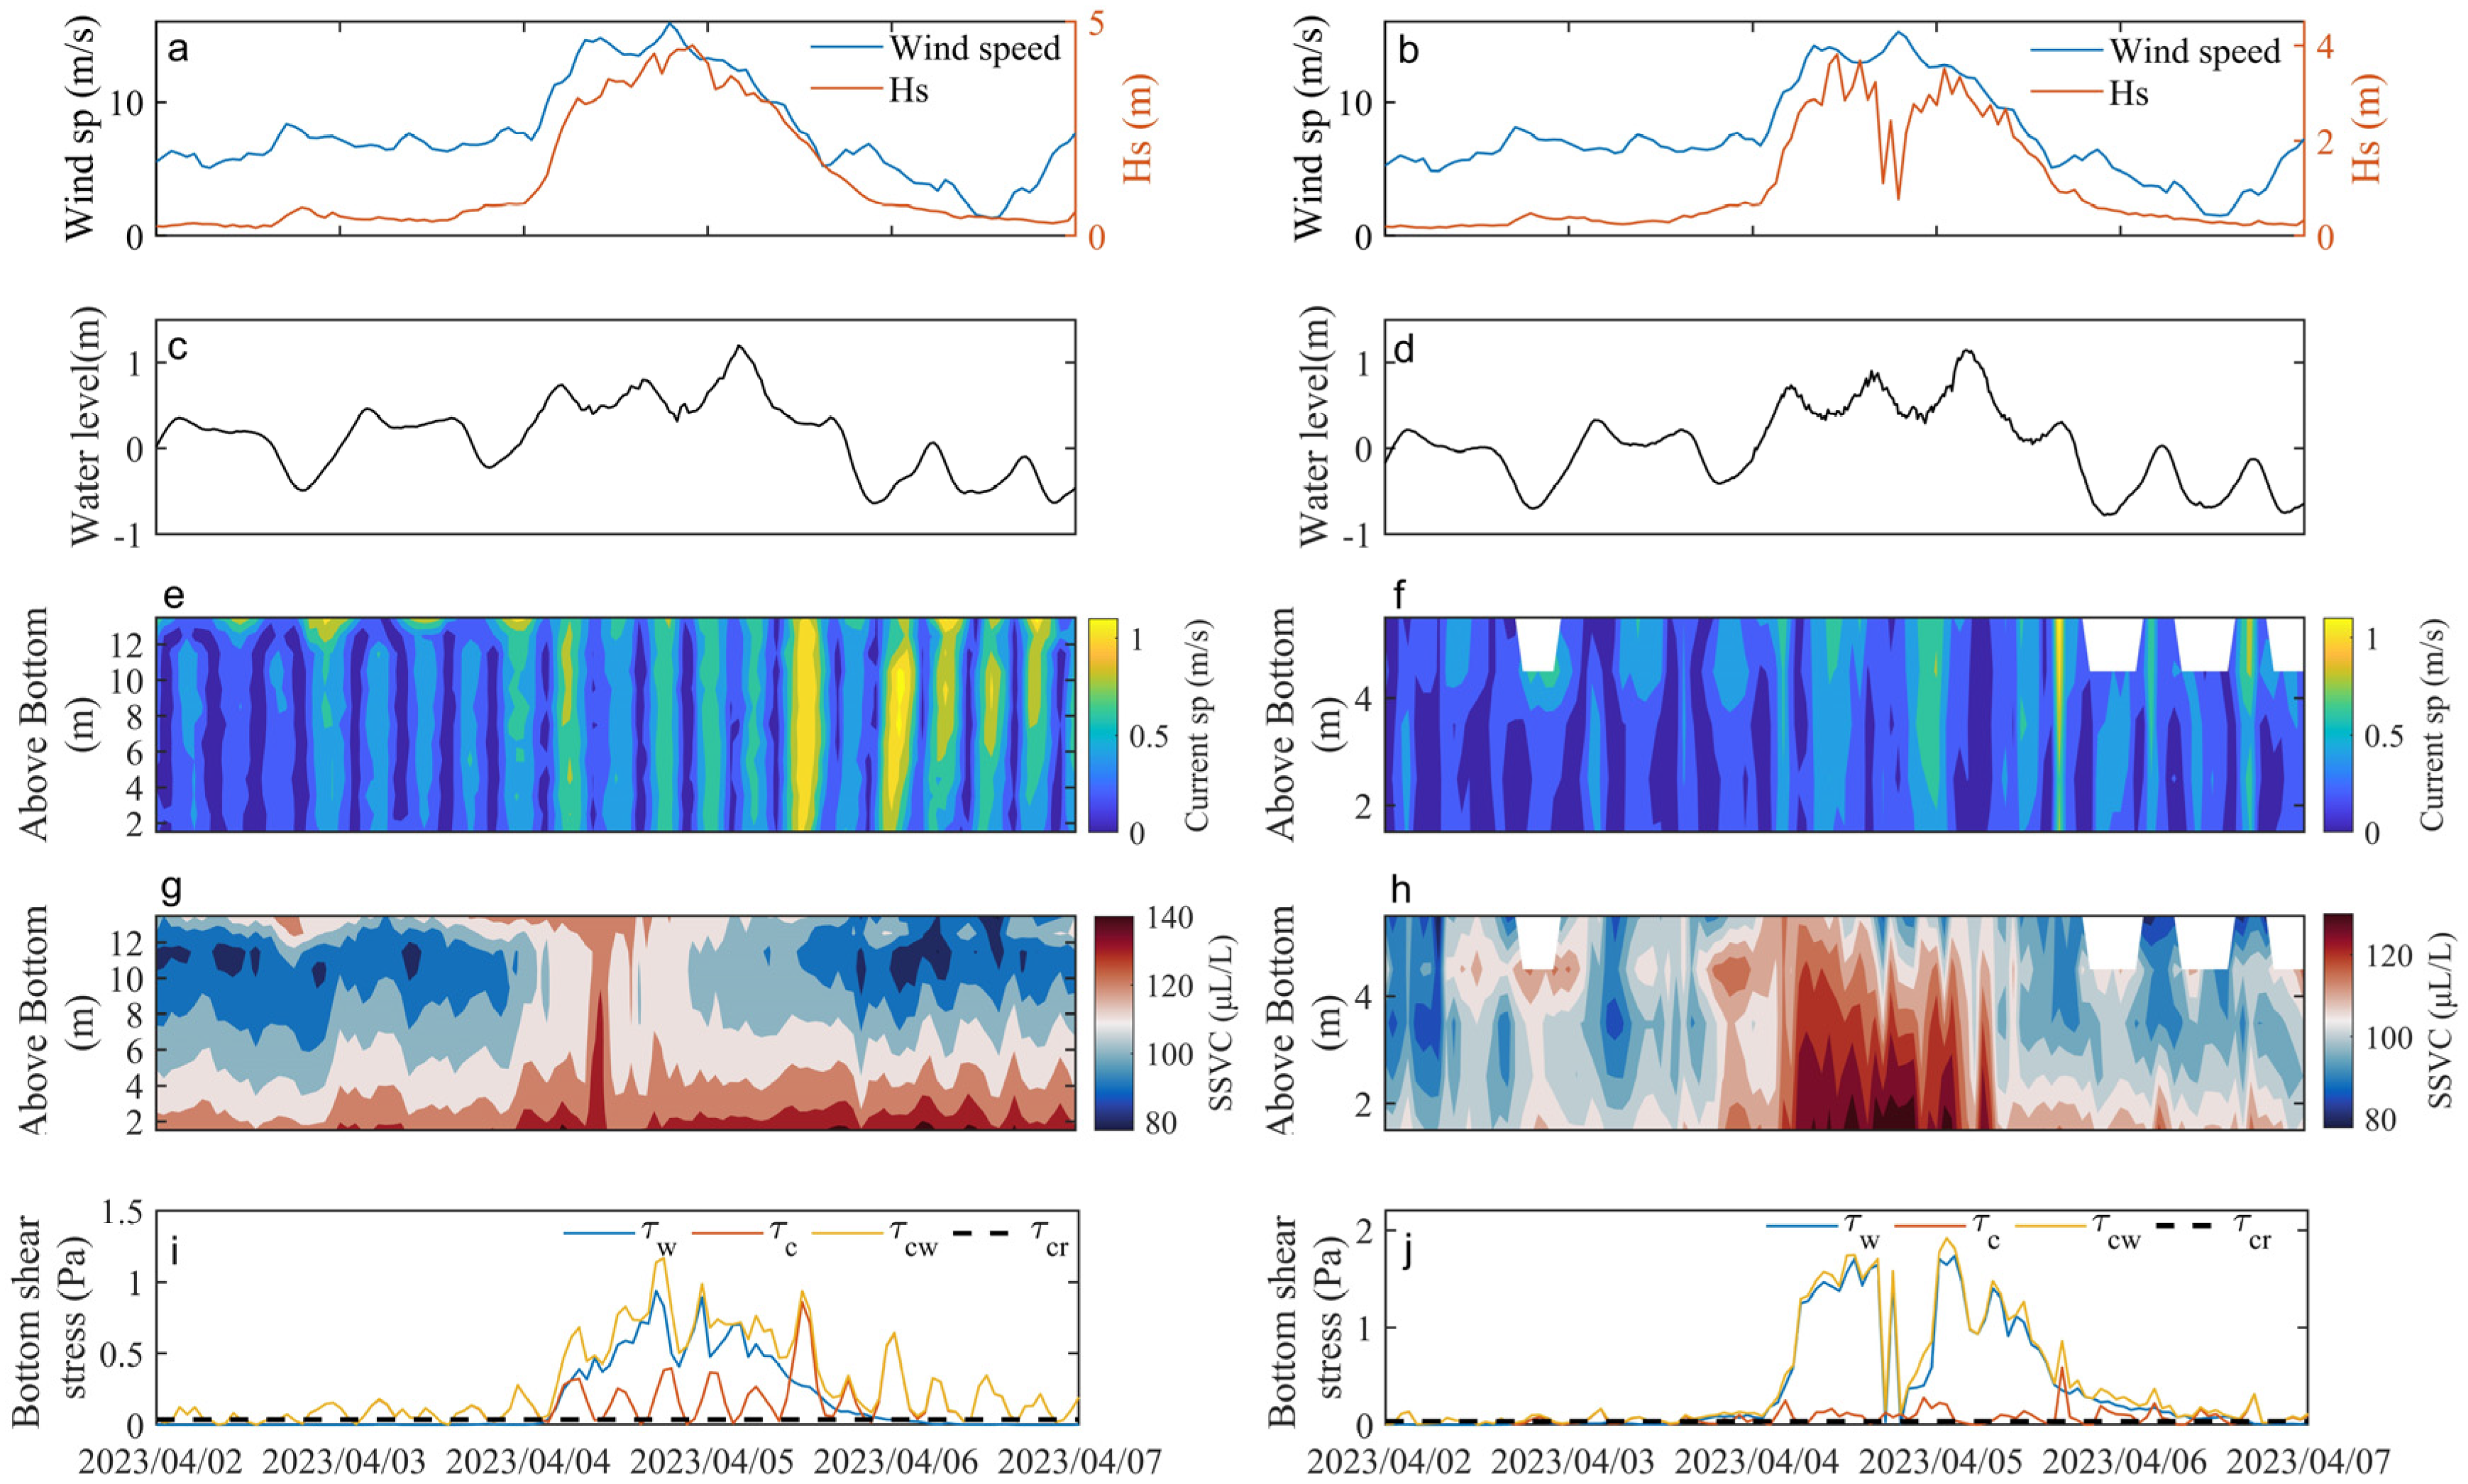
3.2. Northeast Gale Process
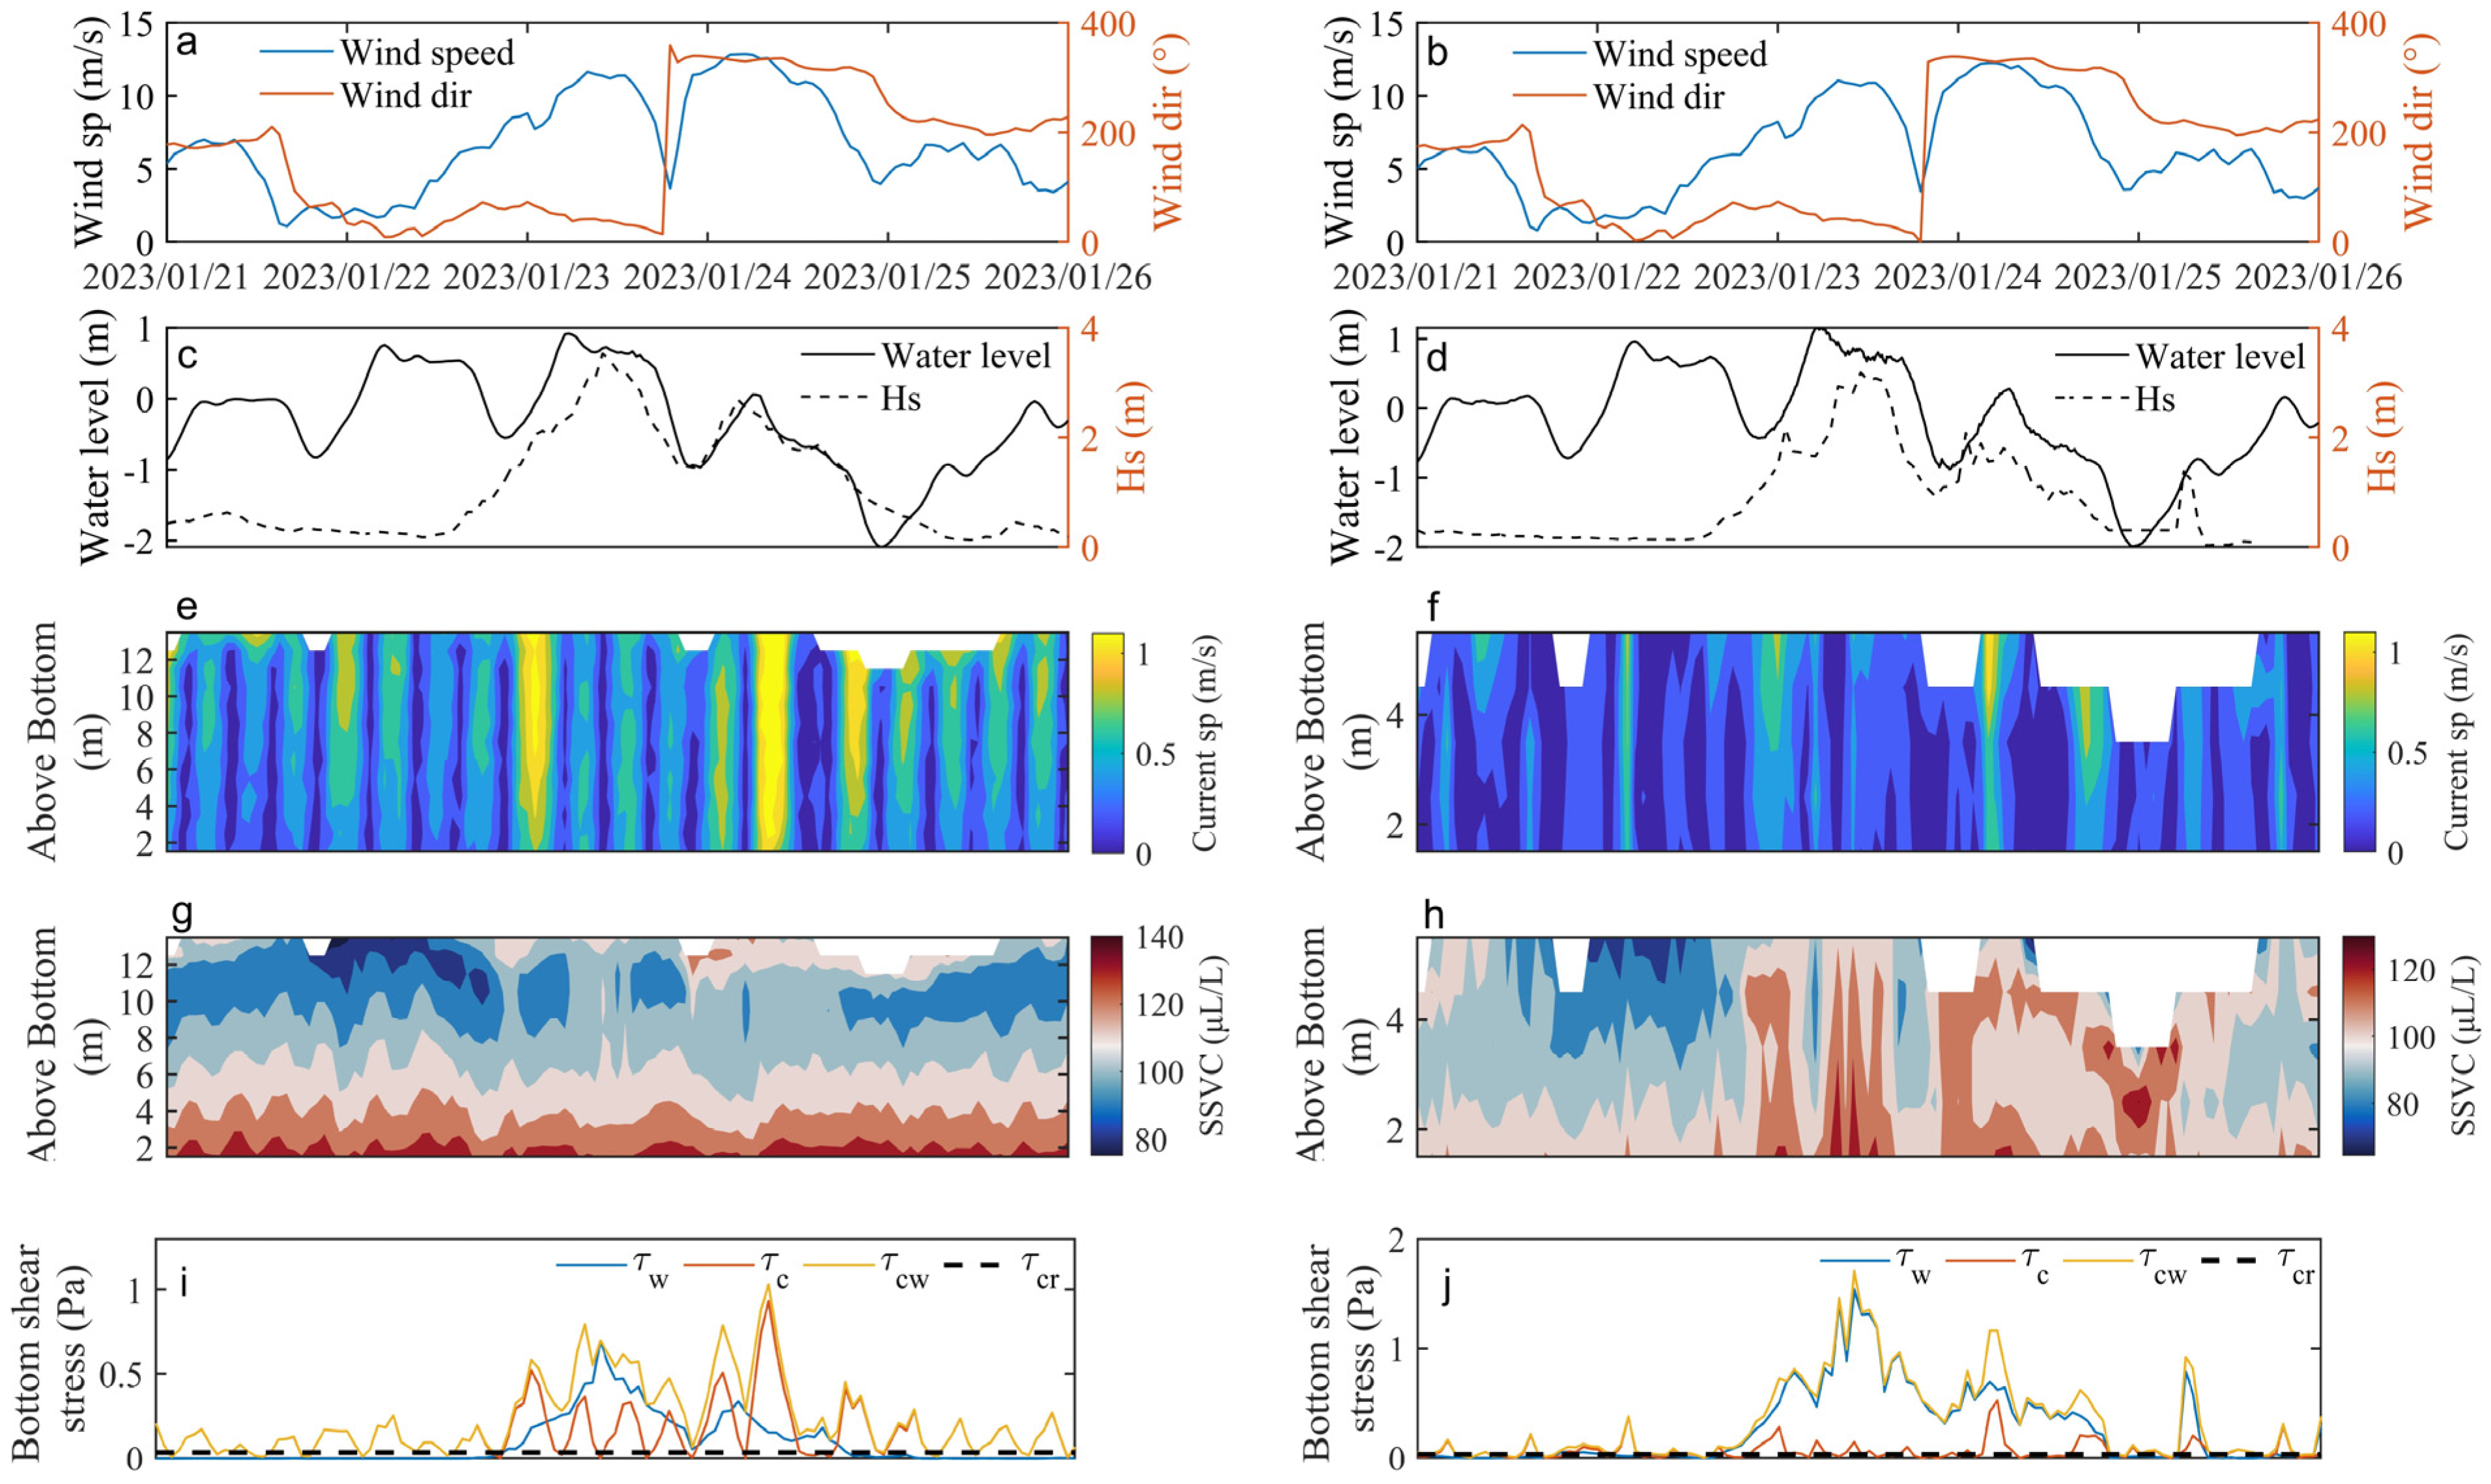
3.3. Gale Event with Changing Wind Directions
4. Discussion
4.1. Wind Speed
4.2. Wind Direction
4.3. Wave Action
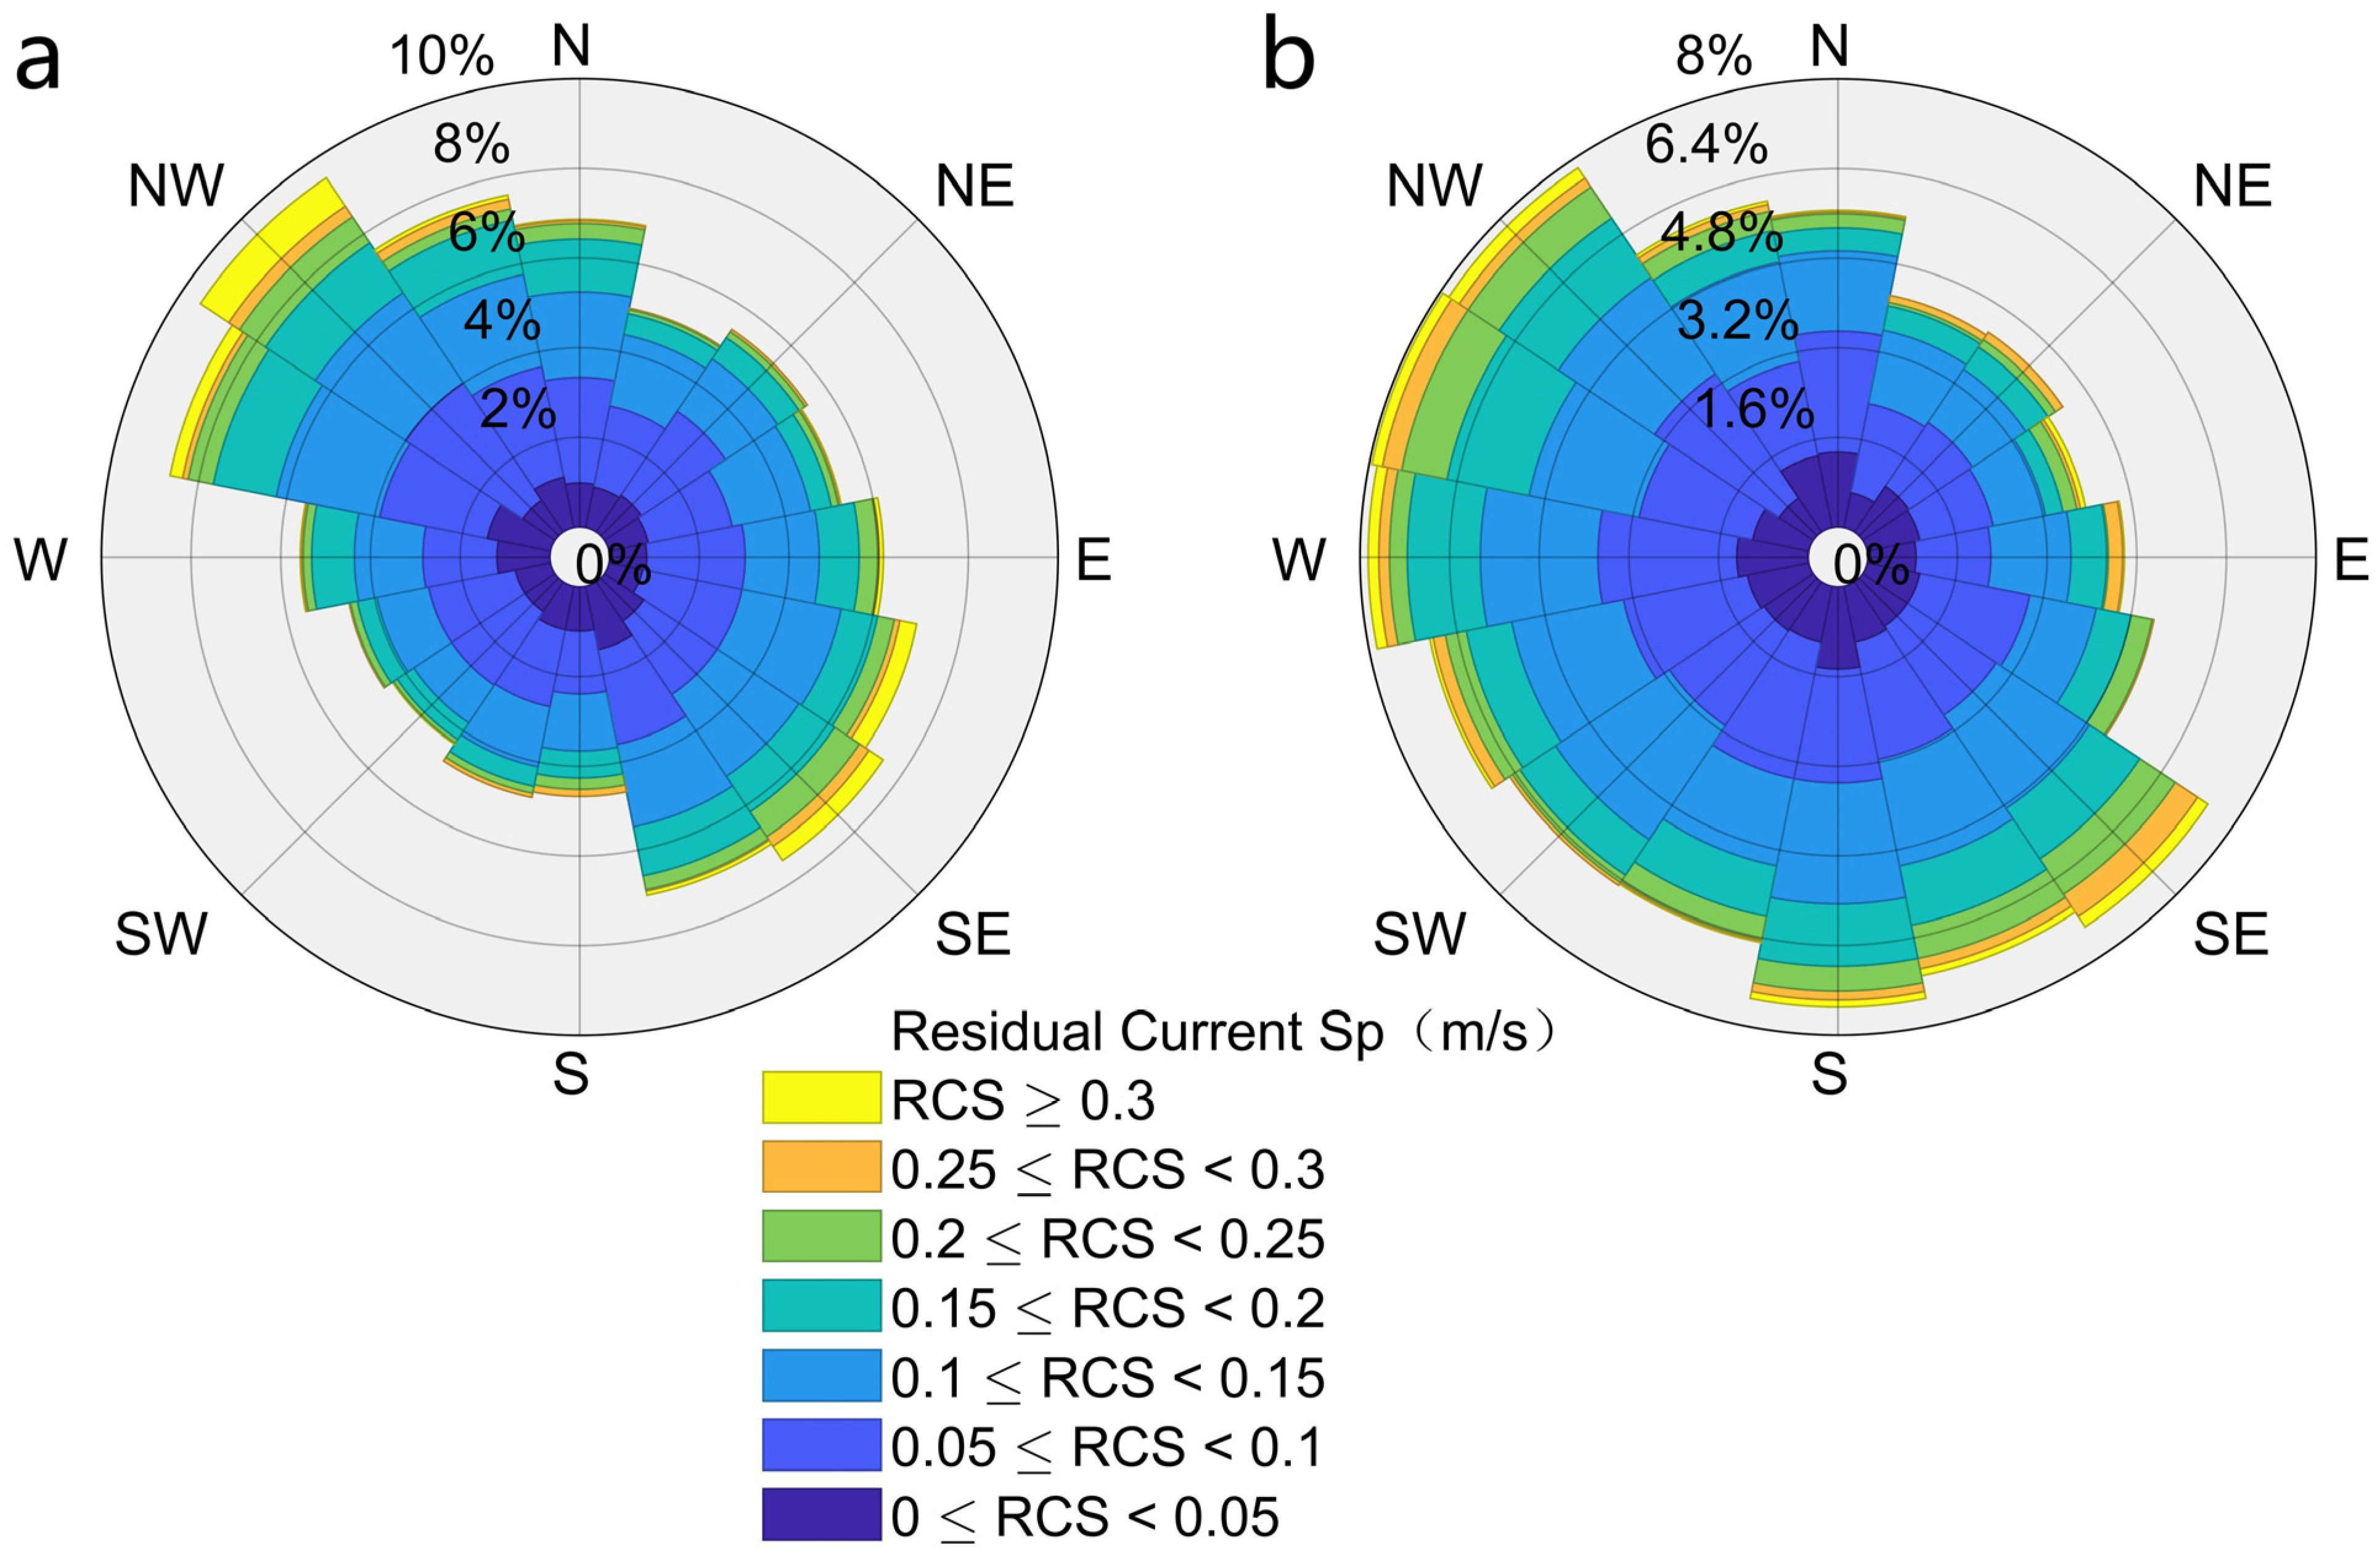
4.4. Bottom Residual Current
5. Conclusions
Author Contributions
Funding
Data Availability Statement
Conflicts of Interest
References
- Sun, S.T.; Xu, J.S.; Li, G.X.; Liu, X.; Qiao, L.L.; Zhou, S. Analysis of suspended sediments concentration in the Bohai Bay in winter based on remote sensing. Oceanol. Limnol. Sin. 2020, 2, 258–264, (In Chinese with English Abstract). [Google Scholar]
- Ma, M.; Feng, Z.; Guan, C.; Ma, Y.; Li, H. DDT, PAH and PCB in sediments from the intertidal zone of the Bohai Sea and the Yellow Sea. Mar. Pollut. Bull. 2001, 42, 132–136. [Google Scholar] [CrossRef] [PubMed]
- Hu, R.J. Sediment Transport and Dynamic Mechanism in the Zhoushan Archipelago Sea Area. Ph.D. Dissertation, Ocean University of China, Qingdao, China, 2009. (In Chinese with English Abstract). [Google Scholar]
- Milliman, J.D.; Meade, R.H. Worldwide delivery of river sediment to the oceans. J. Geol. 1983, 91, 1–21. [Google Scholar] [CrossRef]
- Li, G.X.; Wei, H.L.; Yue, S.H.; Han, Y.S. Sedimentation in the yellow river delta, part II: Suspended sediment dispersal and deposition on the subaqueous delta. Mar. Geol. 1998, 149, 113–131. [Google Scholar] [CrossRef]
- Qiao, L.L. Circulation and Aediments Transport due Winter Storms in the Bohai Sea and Yellow Sea. Ph.D. Dissertation, Ocean University of China, Qingdao, China, 2008. (In Chinese with English Abstract). [Google Scholar]
- Zhou, C.J.; Shen, X.Z. Marine Environment of Yellow River Harbor; China Ocean Press: Beijing, China, 2001; pp. 114–119. [Google Scholar]
- Li, S.H.; Li, G.X.; Xu, J.S.; Liu, S.D.; Ding, D.; Wang, X.D.; Min, J.X.; Tian, J.; Zhang, Y. Annual variation of suspended sediment concentration in Bohai Bay based on ADCP. Mar. Geol. Front. 2020, 36, 30–41, (In Chinese with English Abstract). [Google Scholar]
- Jiang, M.; Pang, C.; Liu, Z.; Jiang, J. Sediment resuspension in winter in an exceptional low suspended sediment concentration area off qinhuangdao in the bohai sea. Estuar. Coast. Shelf Sci. 2020, 245, 106859. [Google Scholar] [CrossRef]
- Zhang, S.; Nielsen, P.; Perrochet, P.; Jia, Y. Multiscale superposition and decomposition of field-measured suspended sediment concentrations: Implications for extending 1DV models to coastal oceans with advected fine sediments. J. Geophys. Res. Ocean. 2021, 126, e2020JC016474. [Google Scholar] [CrossRef]
- Jiang, W.; Pohlmann, T.; Sun, J.; Starke, A. SPM transport in the Bohai Sea: Field experiments and numerical modelling. J. Mar. Syst. 2004, 44, 175–188. [Google Scholar] [CrossRef]
- Niu, J.W.; Xie, J.H.; Zhou, Y.; Cai, S.Q.; Dong, P.; Lin, S.C.; Lin, J.J. Wave-supported fluid mud and sediment vertical mixing under winter storm. Appl. Ocean. Res. 2023, 141, 103768. [Google Scholar] [CrossRef]
- Niu, J.; Xie, J.; Lin, S.; Lin, P.; Gao, F.; Zhang, J.; Cai, S. Importance of bed liquefaction-induced erosion during the winter wind storm in the Yellow River Delta, China. J. Geophys. Res. Ocean. 2023, 128, e2022JC019256. [Google Scholar] [CrossRef]
- Quan, Y.Z. Numerical Simulation of Sediment Movement and Its Dynamic Mechanism in a Strong Wind Processes of Northern Sea of the Yellow River Delta. Master’s Dissertation, Ocean University of China, Qingdao, China, 2014. (In Chinese with English Abstract). [Google Scholar]
- Gao, J.H.; Wang, Y.P.; Wang, A.J.; Li, Z.H.; Yang, S. Suspended sediment behavior and transport in Changjiang River Estuary. Geogr. Res. 2004, 4, 455–462, (In Chinese with English Abstract). [Google Scholar]
- Wang, Y.P.; Gao, S.; Li, K.Y. A preliminary study on suspended sediment concentration measurements using an ADCP mounted on a moving vessel. Oceanol. Limnol. Sin. 1999, 30, 758–763, (In Chinese with English Abstract). [Google Scholar]
- Wang, Y.P.; Gao, S. A Preliminary Study on Suspended Sediment Transportin Coastal Estuary by Using ADCP. Sci. Technol. Eng. 2003, 3, 467–470, (In Chinese with English Abstract). [Google Scholar]
- Moore, S.A.; Coz, J.L.; Hurther, D.; Paquier, A. On the application of horizontal ADCPs to suspended sediment transport surveys in rivers. Cont. Shelf Res. 2013, 46, 50–63. [Google Scholar] [CrossRef]
- Sutherland, T.F.; Lane, P.M.; Amos, C.L.; Downing, J. The calibration of optical backscatter sensors for suspended sediment of varying darkness levels. Mar. Geol. 2000, 162, 587–597. [Google Scholar] [CrossRef]
- Miller, R.L.; McKee, B.A. Using MODIS Terra 250 m imagery to map concentrations of total suspended matter in coastal waters. Remote Sens. Environ. 2004, 93, 259–266. [Google Scholar] [CrossRef]
- Chen, J.; Li, D.; Chen, B.; Hu, F.; Zhu, H.; Liu, C. The processes of dynamic sedimentation in the Changjiang estuary. J. Sea Res. 1999, 41, 129–140. [Google Scholar] [CrossRef]
- Dyer, K.R. Nearshore and coastal oceanography: Preface. Cont. Shelf Res. 2000, 20, 1037–1038. [Google Scholar] [CrossRef]
- Thorne, P.D.; Hurther, D. An overview on the use ofbackscattered sound for measuring suspended particle sizeand concentration profiles in non-cohesive inorganic sedi-ment transport studies. Cont. Shelf Res. 2014, 73, 97–118. [Google Scholar] [CrossRef]
- Holdaway, G.P.; Thorne, P.D.; Flatt, D.; Jones, S.E.; Prandle, D. Comparison between adcp and transmissometer measurements of suspended sediment concentration. Cont. Shelf Res. 1999, 19, 421–441. [Google Scholar] [CrossRef]
- Wang, Y.P.; Pan, S.M.; Wang, H.V.; Gao, J.H.; Yang, Y. Measurement sand analysis of water discharges and suspended sediment fluxes in Changjiang Estuary. Acta Geogr. Sin. 2006, 61, 35–46, (In Chinese with English Abstract). [Google Scholar]
- Fu, M.C.; Zhao, J.P. The analysis of hydrographical characteristics in the nontidal region M2 near the delta of the Huanghe River. J. Shandong Coll. Oceanol. 1985, 15, 127–136, (In Chinese with English Abstract). [Google Scholar]
- Hu, C.H.; Ji, Z.W.; Wang, T. Characteristics of ocean dynamics and sediment diffusion in the Yellow River estuary. J. Sediment Res. 1996, 4, 1–10, (In Chinese with English Abstract). [Google Scholar]
- Li, P.; Zhu, D.Q. The role of wave action on the formation of Yellow River Delta. Mar. Geol. Quat. Geol. 1997, 2, 39–46, (In Chinese with English Abstract). [Google Scholar]
- Qin, Y.S.; Li, F. Study of influence of sediment loads discharged from the Yellow River on sedimentation in the Bohai Sea and the Yellow Sea. In Proceedings of the International Symposium on Sedimentation on the Continental Shelf with Special Reference to the East China Sea; China Ocean Press: Beijing, China, 1983; pp. 83–92. (In Chinese) [Google Scholar]
- Li, G.X. Study on the Origin of Submarine Sedimentary Environment in East China Sea Area; Science Press: Beijing, China, 2005. [Google Scholar]
- Wang, N. Sedimentary Dynamics Process and Topographic Evolution in the Modern Yellow River Mouth. Ph.D. Dissertation, Ocean University of China, Qingdao, China, 2014. (In Chinese with English Abstract). [Google Scholar]
- Thorne, P.D.; Vincent, C.E.; Hardcastle, P.J.; Rehman, S.; Pearson, N. Measuring suspended sediment concentra-tions using acoustic backscatter devices. Mar. Geol. 1991, 98, 7–16. [Google Scholar] [CrossRef]
- Deines, K.L. Backscatter estimation using broadband acoustic Doppler current profilers. In Proceedings of the IEEE Sixth Working Conference on Current Measurement, San Diego, CA, USA, 13–16 September 1999; pp. 249–253. [Google Scholar]
- Li, J.C.; Li, G.X.; Xu, J.S.; Qiao, L.L.; Dong, P.; Ding, D.; Sun, P.K. Seasonal Suspended Particles Distribution Patterns in Western South Yellow Sea Based on Acoustic Doppler Current Profiler Observation. J. Ocean. Univ. China 2015, 3, 385–398. [Google Scholar] [CrossRef]
- Li, B.; Jia, Y.; Liu, J.P.; Liu, X.; Wang, Z. Effect of Wave, Current, and Lutocline on Sediment Resuspension in Yellow River Delta-Front. Water 2020, 12, 845. [Google Scholar] [CrossRef]
- Francois, R.E.; Garrison, G.R. Sound absorption based on ocean measurements, Part I: Pure water and magnesium sulfate contributions. J. Acoust. Soc. Am. 1982, 72, 896–907. [Google Scholar] [CrossRef]
- Francois, R.E.; Garrison, G.R. Sound absorption based on ocean measurements, Part II: Boric acid contribution and equation for total absorption. J. Acoust. Soc. Am. 1982, 72, 1879–1890. [Google Scholar]
- Garter, J.W. Estimating suspended solids concentrations from backscatter intensity measured by acoustic Doppler current profiler in San Francisco Bay, California. Mar. Geol. 2004, 211, 169–187. [Google Scholar] [CrossRef]
- Heath, M.; Sabatino, A.; Serpetti, N.; Mccaig, C.; Murray, R.O.H. Modelling the sensitivity of suspended sediment profiles to tidal current and wave conditions. Ocean. Coast. Manag. 2016, 147, 49–66. [Google Scholar] [CrossRef]
- Yang, Y.; Wang, Y.P.; Gao, S.; Wang, X.H.; Shi, B.W.; Zhou, L.; Wang, D.D.; Dai, C.; Li, G.C. Sediment resuspension in tidally dominated coastal environments: New insights into the threshold for initial movement. Ocean. Dyn. 2016, 66, 401–417. [Google Scholar] [CrossRef]
- Chen, D.X.; Lan, T.F.; Pei, Y.D.; Du, J.B.; Wang, Y.P.; Gao, J.H. Hydrodynamics and sediment transport in response to sequential reclamations over subtidal waters near Tianjin Port. Mar. Sci. 2019, 10, 113–125, (In Chinese with English Abstract). [Google Scholar]
- Soulsby, R.L. Dynamics of Marine Sands (HR Wallingford Titles): A Manual for Practical Applications; Thomas Telford Publications: New York, NY, USA, 1997. [Google Scholar]
- Wang, X.L. The analysis of engineering geological environment and particle size indication in the northern Chengdao sea area of Yellow river delta. Master’s Thesis, Ocean University of China, Qingdao, China, 2014. [Google Scholar]
- Shi, B.W.; Yang, S.L.; Wang, Y.P.; Yu, Q.; Li, M.L. Intratidal erosion and deposition rates inferred from field observations of hydrodynamic and sedimentary processes: A case study of a mudflat-saltmarsh transition at the Yangtze delta front. Cont. Shelf Res. 2014, 90, 109–116. [Google Scholar] [CrossRef]
- Li, M.Z.; Amos, C.L. SEDTRANS96: The upgraded and better calibrated sediment-transport model for continental shelves. Comput. Geosci. 2001, 27, 619–645. [Google Scholar] [CrossRef]
- Wiberg, P.L.; Sherwood, C.R. Calculating wave-generated bottom orbital velocities from surface-wave parameters. Comput. Geosci. 2008, 34, 1243–1262. [Google Scholar] [CrossRef]
- Soulsby, R.L. Bed Shear Stresses Due to Combined Waves and Currents; HR Wallingford: Wallingford, UK, 1995. [Google Scholar]
- Shields, A. Application of Similarity Principles and Turbulence Research to Bed-Load Movement. Ph.D. Thesis, Preussischen Versuchsanstalt für Wasserbau, Berlin, Germany, 1936. [Google Scholar]
- Van Rijn, L.C. Principles of Sediment Transport in Rivers, Estuaries and Coastal Seas; Aqua Publications: Amsterdam, The Netherlands, 1993. [Google Scholar]
- Lv, L.G.; Qiao, F.L.; Ge, R.F.; Lu, Y.; Liu, J.J. Study on the Relationship Between Backscatter Strength and Thermocline. Adv. Mar. Sci. 2003, 21, 465–470, (In Chinese with English Abstract). [Google Scholar]
- Eckart, C. Principles of Underwater Sound; McGraw-Hill: New York, NY, USA, 2005. [Google Scholar]
- Chen, J.L.; Ralston, D.K.; Geyer, W.R.; Sommerfield, C.K.; Chant, R.J. Wave generation, dissipation, and disequilibrium in an embayment with complex bathymetry. J. Geophys. Res. Ocean. 2018, 123, 7856–7876. [Google Scholar] [CrossRef]
- Zhao, J.X.; Qu, P.; He, Z.Q.; Xu, C.Y. Characteristies and Forecasting of Strong Wind Gusts in Bohai Bay. Meteorol. Sci. Technol. 2014, 5, 847–851. [Google Scholar] [CrossRef]
- Enriquez, A. An Investigation of Surface Current Patterns Related to Upwelling in Monterey Bay Using High Frequency Radar; Naval Postgraduate School: Monterey, CA, USA, 2004. [Google Scholar]
- Shen, J.; Zhang, J.; Qiu, Y.; Li, L.; Zhang, S.; Pan, A.; Huang, J.; Guo, X.; Jing, C. Winter counter-wind current in western Taiwan strait: Characteristics and mechanisms. Cont. Shelf Res. 2019, 172, 1–11. [Google Scholar] [CrossRef]
- Wang, L.; Pawlowicz, R.; Wu, X.; Yue, X. Wintertime variability of currents in the southwestern Taiwan Strait. J. Geophys. Res. Ocean. 2021, 126, e2020JC016586. [Google Scholar] [CrossRef]
- Wang, A.; Bi, N.; Wu, X.; Wang, H.; Ralston, D.K.; Wang, C.; Yuan, P. Sediment resuspension and transport due to synoptic winter winds in the bohai sea. Geomorphology 2024, 456, 109211. [Google Scholar] [CrossRef]
- Huang, Z.; Xu, H.; Bai, Y.; Shi, F.; Wen, Z. Coastline changes and tidal current responses due to the large-scale reclamations in the Bohai Bay. J. Ocean. Limnol. 2023, 41, 2045–2059. [Google Scholar] [CrossRef]


Disclaimer/Publisher’s Note: The statements, opinions and data contained in all publications are solely those of the individual author(s) and contributor(s) and not of MDPI and/or the editor(s). MDPI and/or the editor(s) disclaim responsibility for any injury to people or property resulting from any ideas, methods, instructions or products referred to in the content. |
© 2025 by the authors. Licensee MDPI, Basel, Switzerland. This article is an open access article distributed under the terms and conditions of the Creative Commons Attribution (CC BY) license (https://creativecommons.org/licenses/by/4.0/).
Share and Cite
Qi, J.; Liu, S.; Qiao, L.; Xu, X.; Li, J.; Li, H.; Li, G. Sediment Resuspension in the Yellow River Subaqueous Delta During Gale Events. J. Mar. Sci. Eng. 2025, 13, 914. https://doi.org/10.3390/jmse13050914
Qi J, Liu S, Qiao L, Xu X, Li J, Li H, Li G. Sediment Resuspension in the Yellow River Subaqueous Delta During Gale Events. Journal of Marine Science and Engineering. 2025; 13(5):914. https://doi.org/10.3390/jmse13050914
Chicago/Turabian StyleQi, Jingjing, Siyu Liu, Lulu Qiao, Xingyu Xu, Jianing Li, Haonan Li, and Guangxue Li. 2025. "Sediment Resuspension in the Yellow River Subaqueous Delta During Gale Events" Journal of Marine Science and Engineering 13, no. 5: 914. https://doi.org/10.3390/jmse13050914
APA StyleQi, J., Liu, S., Qiao, L., Xu, X., Li, J., Li, H., & Li, G. (2025). Sediment Resuspension in the Yellow River Subaqueous Delta During Gale Events. Journal of Marine Science and Engineering, 13(5), 914. https://doi.org/10.3390/jmse13050914