Abstract
Storm surge forecasting presents a significant challenge for coastal resilience, particularly in typhoon-prone regions such as southeastern China, where compound flooding events lead to substantial socioeconomic losses. Although artificial intelligence (AI) models have shown strong potential in storm surge prediction, their inherent “black-box” nature limits both their interpretability and operational trust. In this study, we integrate a Vision Transformer (ViT) model with an explainable AI (XAI) method—specifically, Shapley value analysis (SHAP)—to develop an interpretable, high-performance storm surge forecasting framework. The baseline ViT model demonstrates excellent predictive skill, achieving spatiotemporal correlation coefficients exceeding 0.90 over a 12 h lead time. However, it exhibits systematic underestimations in topographically complex regions, such as semi-enclosed bays (e.g., up to 0.06 m). SHAP analysis reveals that the model primarily relies on the autocorrelation of historical surge levels rather than external wind forcing—contrary to the conventional physical understanding of storm surge dynamics. Guided by these insights, we introduce the surge time difference (ΔZ/Δt) as an explicit input feature to enhance the model’s physical representation. This modification yields substantial improvements: during the critical first hour of forecasting—a key window for disaster mitigation—the RMSE is reduced from 0.01 m to 0.005 m, while the correlation coefficient increases from 0.92 to 0.98. This study bridges the gap between data-driven forecasting and physical interpretability, offering a transparent and trustworthy framework for next-generation intelligent storm surge prediction.
1. Introduction
Artificial intelligence (AI), particularly deep learning (DL) technologies, has become a transformative tool in marine science, enabling breakthroughs across diverse domains. To date, the relevant topics include big data synthesis (e.g., merging multi-source observations), ocean state reconstruction (e.g., reconstructing the ocean interior from surface remote sensing [1,2]), and AI forecasts (e.g., ocean variable prediction [3]). Beyond these, AI advances oceanic parameterization (e.g., emulating subgrid-scale processes [4]) and digital twins (e.g., real-time coastal system modeling [5]). Among these studies, AI has been applied in forecasting various ocean variables, waves [6], sea surface heights, sea surface temperatures, or on different scales, such as the interannual scale (ENSO, [7]), seasonal (tropical instability waves [8]), or transit (internal waves [9]) scales. In these marine problems, from the perspective of AI models, different DL architectures such as U-Nets [10], ConvLSTMs [11], and Transformer-based models [12] now underpin critical applications.
Storm surge (SS) forecasting represents a high-impact AI application with profound socioeconomic implications, particularly along China’s densely populated coastlines. Situated in the Western Pacific—the world’s most active tropical cyclone (TC) basin—China experiences an average of 7–8 TC landfalls annually [13], with SS events resulting from the synergistic effects of the TC-driven wind setup, atmospheric pressure drop, and astronomic high tides. These compound extremes can elevate coastal water levels by more than 1 m above predicted tides, triggering catastrophic flooding over the broad low-reaching area. For instance, in 2023 alone, seven major SS events struck China’s coasts, causing over 2.4 billion RMB CNY in direct economic losses and displacing 120,000 residents, as reported in the China Marine Disaster Bulletin [14]. The complex, nonlinear physics governing SS generation demands AI-enhanced forecasting approaches. Traditional numerical models [15] can resolve the multiscale interactions between TC dynamics, external forcing [16], and wave-circulation interactions [17,18], but the computational efficiency is a bottleneck during an emergency. Machine learning methods have demonstrated superior skill and performance in capturing nonlinear TC-SS relationships, providing real-time predictions for an emergency response [19]. Therefore, AI-based methods have been extensively applied to the SS forecast problem in the world coasts (e.g., [6,20,21], to list a few).
Despite the AI applications in SS forecast, the missing of explainability hinders the further applications in operational oceanography. Conventionally, deep learning models excel at capturing nonlinear ocean dynamics, their reliance on millions of opaque parameters creates a “black-box” problem [22]. It is practically impossible for a researcher to understand the prediction by a DL model. The “black-box” nature of such models raises concerns for high-stakes decisions, particularly in SS prediction where interpretability is as vital as accuracy—a challenge this study tackles through XAI frameworks.
In general, the integration of XAI can appear in all three research phases of an AI Oceanography topic, i.e., model development, model validation, and model application. For example, during model development, XAI can demystify complex model decisions by revealing how input variables contribute to predictions [23] or visualizing intermediate feature representations (e.g., feature maps in hidden layers) [24]. Second, during model validation, XAI can enable physics-consistency interpretations by quantifying variable relationships (e.g., Coriolis effect on dynamical ocean regimes [25]) or identifying biases in the training data or model architectures (e.g., the unfair utilization of demographic features in healthcare datasets) [26]. Finally, during the model application, XAI can accelerate operational trust. Beyond post hoc explanations, XAI actively enhances research and deployment by guiding hypothesis generation (e.g., detecting overlooked susceptible areas of hydro-morphological processes) [27] or provides actionable insights for emergency responders (e.g., anomaly detection of autonomous vehicles) [28]. Despite these advantages, XAI remains markedly underutilized in oceanographic research—a critical gap that leaves its transformative potential largely unexplored. Only a few studies have applied XAI techniques to dissect marine AI models, and even fewer have evaluated their utility for operational oceanography.
The question thus remains: how can XAI bridge the interpretability gap while preserving the predictive power of modern AI? To answer this question, this study takes the southeastern coastal region of China as a case study to explore the application of a typical XAI method, the Shapley value [29] in SS intelligent forecasting research. In this paper, an XAI-guided Vision Transformer framework was developed and validated on a southeastern China testbed, embedding spatiotemporal self-attention to capture long-range storm dynamics, integrating Shapley-value attribution to quantify the impact of atmospheric drivers on surge generation and correlating attribution scores with forecast errors to guide iterative model refinement. The experiments demonstrate that this unified approach enhances the predictive accuracy while providing pixel-level interpretability, thus improving both the performance and trustworthiness of AI-based geophysical forecasting systems.
2. Data
The Southeastern Chinese Coasts (16 N–33 N, 110 E–127 E) represent one of the most typhoon-prone areas globally, where typhoon-induced SS annually inflict substantial casualties and economic losses. The accurate prediction of SS dynamics in this maritime zone not only facilitates effective emergency preparedness measures to guide marine economic activities and coastal urban planning, but also holds significant importance for safeguarding human lives, protecting property, and ensuring sustainable socio-economic development. This study, therefore, focuses on the Southeastern Chinese Coasts to develop an intelligent SS forecasting system based on the ViT algorithm. The bathymetric characteristics of the study area are illustrated in Figure 1.
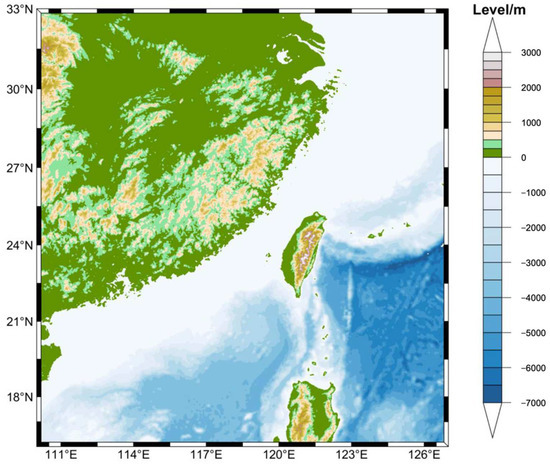
Figure 1.
Study area: the Southeastern Chinese Coasts.
This study developed a high-resolution two-dimensional SS model for the southeastern coastal waters of China using the unstructured semi-implicit cross-scale SCHISM (Semi-implicit Cross-scale Hydroscience Integrated System Model). The SCHISM is a fully three-dimensional hydrodynamic model that comprehensively represents the interactions among tides, currents, and storm surges. Leveraging the outputs of the SCHISM as supervisory signals, a Vision Transformer (ViT) model was trained to implicitly capture the secondary effects of ocean circulation on storm surges, such as those mediated through boundary condition influences. The computational grid consists of 70,775 nodes and 133,431 triangular elements, with nearshore critical areas achieving a spatial resolution of 50 m. Bathymetric data were derived from the 2022 Global Bathymetric Chart (GEBCO) provided by the Earth System Science Data Center, featuring a spatial resolution of 15 arc-seconds. Shoreline data were obtained from Google Earth (available at: https://earth.google.com/web/, accessed on 8 September 2024) with a nominal spatial resolution of 100 m, while localized areas achieve an enhanced accuracy of 50–60 m. Wind fields at 10 m elevation from the ERA5 [30] reanalysis dataset (European Centre for Medium-Range Weather Forecasts, ECMWF) with a spatial resolution of 0.25 and a temporal resolution of 1 h were employed as dynamic forcing to reconstruct SS processes induced by 20 representative typhoon events affecting the study area between 2010 and 2023 (Table 1). Each typhoon simulation encompassed a complete storm cycle, spanning 96 h prior to landfall to 72 h post-landfall, totaling 7 days of dynamic response analysis.

Table 1.
Characterization and dataset partitioning of 20 representative typhoon-induced SS events impacting the southeastern coastal region of China (2010–2023).
3. Methods
This study employs an advanced ViT deep learning model for SS inundation forecasting. Traditional artificial intelligence (AI) forecasting paradigms typically train models based on historical observational data and evaluate the model performance through independent test sets, while relying on empirical approaches or trial-and-error methods for model tuning and optimization. However, such conventional methods often lack transparency during the optimization process, making it difficult to clearly elucidate the specific mechanisms behind model (i.e., “black-box”) decision making, particularly in complex deep learning models where this issue is more pronounced. To address these challenges, this paper proposes an innovative XAI-based SS inundation forecasting framework. Specifically, we first train the ViT model using a historical training dataset to achieve accurate SS prediction. Subsequently, we introduce the SHapley Additive exPlanations (SHAP) method, widely applied in XAI research, to conduct an in-depth analysis of test data. This approach quantitatively evaluates the contribution of each input feature variable to the prediction results, identifying the key features and their spatial distribution patterns that the ViT model focuses on during forecasting. Building on the critical insights gained from this interpretability analysis, we further optimize the model to enhance the SS prediction accuracy, thereby achieving transparency in the predictive mechanisms of the deep learning model (“gray-box”). The detailed research framework and implementation procedures are illustrated in Figure 2.
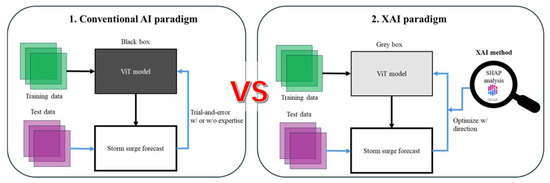
Figure 2.
Schematic diagram of ViT SS forecast with XAI paradigm.
3.1. Baseline Model
This study develops a ViT-based intelligent forecasting model for typhoon-induced SS (Figure 3). The Vision Transformer (ViT) architecture, adapted from the original Transformer framework proposed by Vaswani, et al. [31], introduces a paradigm shift for spatiotemporal modeling in geophysical forecasting applications. Unlike conventional convolutional neural networks, ViT processes input data through patch-based sequence modeling—for typhoon SS prediction, we partition multi-source input fields into N non-overlapping patches of size (P × P). Each patch undergoes linear projection to embedding space:
where E denotes the trainable embedding matrix and Epos encodes spatiotemporal position information [32]. The core encoder stack employs multi-head self-attention (MSA) to capture cross-scale interactions:
where each head computes scaled dot-product attention.
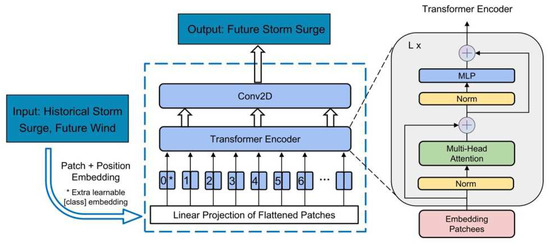
Figure 3.
ViT-based SS forecasting model.
The ViT model integrates historical SS fields from 12 consecutive timesteps with 12 h ahead U/V component wind fields through a ViT-convolution hybrid architecture to achieve spatiotemporal feature coupling. The training set comprises 16 representative typhoon events from 2010–2018 (Table 1), while the test set contains four independent typhoon cases from 2020–2023 to evaluate generalization capability. Taking Typhoon Lionrock (1006) as an example, the input spans 29 August 2010 T00:00–T11:00 (surge fields) and T12:00–T23:00 (wind fields), with prediction targets set for surge evolution during T12:00–T23:00. In total, the 16 training events from 2010 to 2018 were segmented into 2320 training samples based on a 7-day simulation window around each landfall event. This dataset is sufficiently large and diverse to ensure stable and reliable training of the deep learning model.
The model executes multi-stage processing where input SS and wind fields are first partitioned into 8 × 8 non-overlapping patches and embedded into a 128-dimensional feature space. Dual-encoder modules equipped with four self-attention heads capture multiscale interactions governing typhoon dynamics. Expanded 256-dimensional multilayer perceptrons enhance nonlinear representations before a final 1 × 1 convolutional layer generates resolution-preserving predictions through cross-channel fusion. Within the MLP blocks, the ReLU activation function is applied, and optimization is performed with the Adam optimizer (initial learning rate of 1 × 10⁻³) to minimize the mean squared error (MSE) loss, using a learning-rate scheduler that halves the rate if the loss fails to decrease for 10 consecutive epochs. The model is trained for 100 epochs with a batch size of 32 on a single NVIDIA V100 GPU (manufactured by NVIDIA Corporation, Santa Clara, CA, USA) with 32 GB of memory.
This consistent configuration of hyperparameters ensures the reproducibility of experimental results. Model performance is quantitatively assessed using two metrics: root mean square error (RMSE) and correlation coefficient (CC).
3.2. Shapely Additive Explanations Method
Explainability in deep learning for SS forecasting pertains to the capability of deep learning models to provide transparent and interpretable insights into their predictions, facilitating a clear understanding of the underlying factors contributing to SS events. Among various explainability techniques, SHapley Additive exPlanations (SHAP) is particularly effective, utilizing cooperative game theory to quantify the influence of individual predictors on the model’s predictions.
In the context of SS modeling, SHAP conceptualizes each predictor as a participant in a cooperative setting, collectively working towards accurate SS prediction. Each predictor’s contribution, measured by its SHAP value, is computed by evaluating the differences in the model’s predictive outcomes when the predictor is alternately included or omitted from subsets comprising other predictors. Mathematically, the SHAP value () for predictor i is represented as:
Here, signifies the weighted mean of marginal contributions made by predictor i across all possible predictor subsets (S), F represents the total number of predictors, and the weighting factor accounts for all permutations of these subsets. The term indicates the predicted SS outcome given the subset of predictors S, whereas quantifies the incremental predictive impact introduced by adding predictor i. Unlike traditional feature importance measures, such as gain or split count methods that provide only global, dataset-level insights, SHAP values offer a dual-interpretability framework:
- 1.
- Local Importance: this highlights the predictor significance specific to individual SS events, acknowledging that the sensitivity towards various predictors can significantly differ across distinct surge occurrences.
- 2.
- Global Importance: This identifies predictors that have a consistent and significant influence over SS predictions across the entire dataset. Typically, global importance is evaluated within specific spatial domains to ascertain predictors consistently driving the surge intensity and variability.
4. Results
4.1. Baseline Model Performance
This study systematically evaluates the spatiotemporal predictive performance of the baseline SS forecasting model based on the ViT architecture (referred to as Model 1). Figure 4 presents a spatial comparison of SS predictions from the ViT-based model and the SCHISM model during Typhoon Doksuri’s impact along the southeastern coast of China. Typhoon Doksuri originated over the western Pacific east of the Philippines on 21 July 2023, and tracked northwestward before making a landfall along the Fujian coastline on 28 July. At peak intensity, Doksuri reached maximum sustained winds of 52 m/s—classifying it as a super typhoon—with a minimum central pressure of 915 hPa. The typhoon generated a maximum storm surge of approximately 1.2 m along the southeastern coastline, resulting in widespread inundation in the Minjiang Estuary and adjacent low-lying areas.
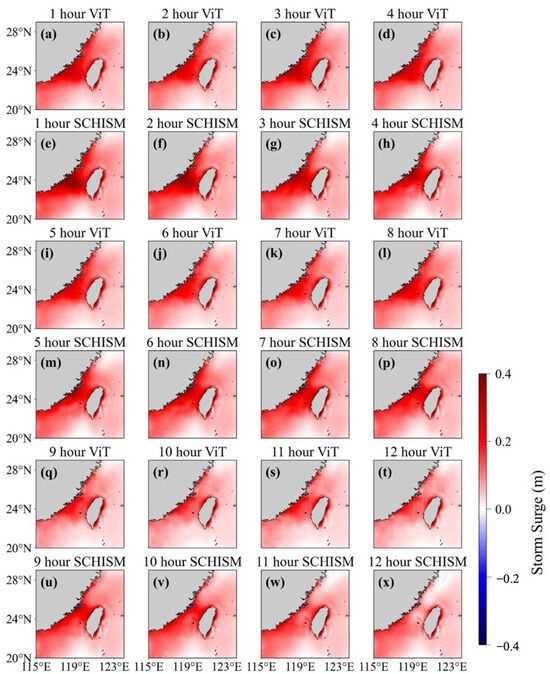
Figure 4.
ViT-based (a–d,i–l,q–t) and SCHISM model-based (e–h,m–p,u–x) forecasting results of SS induced by Typhoon Doksuri over a 12 h period.
The results indicate that the ViT-based model effectively reconstructs the large-scale spatial structure of the SS field, including: (1) the extreme surge center near the landfall location; (2) the spatial extent of coastal inundation; and (3) the presence of a secondary surge peak in offshore regions.
Notably, the model captures the surge gradient induced by the combined effects of the Coriolis force and onshore wind stress—characterized by increasing surge heights from the open sea toward the coastline—in alignment with classical SS dynamics (e.g., the Proudman resonance mechanism). However, in regions with a complex topography, such as semi-enclosed bays including the Minjiang Estuary and Meizhou Bay, the model consistently underestimates the surge magnitudes (Figure 5a–d), with RMSE reaching up to 0.06 m. This underestimation is primarily attributed to (1) the insufficient resolution of the seabed topography in the model inputs, and (2) limitations of the ViT’s global attention mechanism in capturing small- to medium-scale hydrodynamic processes. In contrast, in open continental shelf regions (water depth > 50 m), the model exhibits high predictive accuracy, with RMSE values below 0.02 m, demonstrating its strong performance in areas with relatively simple bathymetry. In addition to RMSE, the Pearson correlation coefficient (CC) was also used to evaluate the model performance. Interestingly, in complex topographic regions such as the Minjiang Estuary (Figure 5e–h), the model yielded a high CC of 0.92 alongside a relatively large RMSE (~0.06 m). This “high-CC–high-RMSE” inconsistency highlights the risk of overestimating the model performance when relying solely on the correlation metrics. The discrepancy is primarily a result of the systematic bias introduced by unresolved bathymetric details, rather than statistical noise. Overall, the quantitative analysis confirms that the ViT-based baseline model shows significant potential in capturing the spatiotemporal evolution of SS. Nevertheless, further improvement is needed to enhance its accuracy in topographically complex coastal environments.
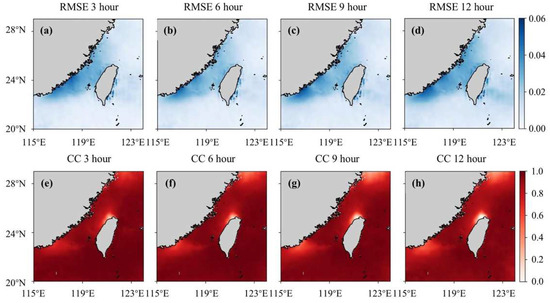
Figure 5.
Variations in spatially averaged RMSE ((a–d) 3, 6, 9, and 12 h forecasts) and spatially averaged correlation coefficients ((e–h) 3, 6, 9, and 12 h forecasts).
4.2. Explainability Analysis Using SHAP Method
Using the SHAP interpretability framework, this study systematically quantified the contributions of input variables to 12 h SS forecasts produced by the ViT-based model. The model takes as the input the historical SS height (Z) over the preceding 12 h, along with wind field components (u10, v10) forecasted for the subsequent 12 h. By computing SHAP values for each input variable, the relative importance of different features was assessed (Figure 6).
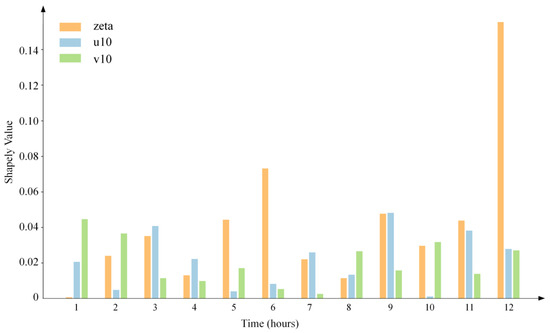
Figure 6.
Predictors for the ViT model based on the mean SHAP value.
The results indicate that the historical surge height (Z) contributes substantially more to the forecast output than the wind components (u10, v10) (Figure 6). This observation stands in marked contrast to traditional physics-based numerical models, where wind stress is typically the dominant driver of surge generation. The finding underscores the distinctive predictive mechanism of the ViT model, which appears to rely more heavily on the intrinsic temporal dynamics of the surge field than on external forcing.
Moreover, the contribution of the historical surge height exhibits a clear pattern of temporal dependency: the closer a data point is to the prediction time, the greater its influence on the forecast. This emphasizes the model’s sensitivity to recent surge variations when projecting future water levels. Notably, a recurring 3 h periodicity in the SHAP values of the historical surge height was detected, closely corresponding to the semidiurnal tidal cycle (particularly the M2 constituent). This suggests that the model is capable of implicitly learning and embedding tidal dynamics from the input data.
Further spatial SHAP analysis provides deeper insights into feature attribution patterns across different regions (Figure 7 and Figure 8). The SHAP values demonstrate significant spatial heterogeneity, with higher contributions concentrated in estuarine and semi-enclosed bay areas. Additionally, across most of the forecast domain, the SHAP values of wind components remain consistently lower than those of tidal elevation, with the disparity becoming more pronounced as the forecast approaches the model initialization time. Based on these findings, we hypothesize that the ViT model primarily leverages the temporal correlations within the tidal elevation data for surge prediction, rather than directly responding to wind forcing.
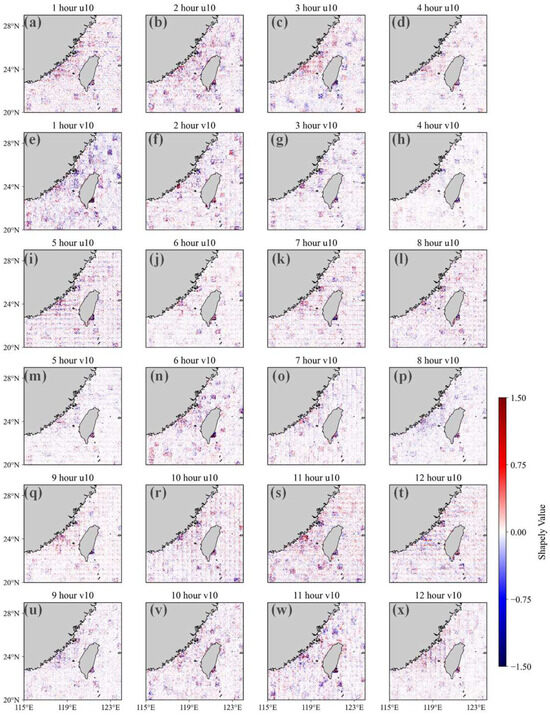
Figure 7.
Spatial distribution of SHAP values for U10 (a–d,i–l,q–t) and V10 (e–h,m–p,u–x) in the 12-h forecast. The color bar indicates SHAP values; higher values denote greater contributions of the corresponding wind field components to the model prediction.
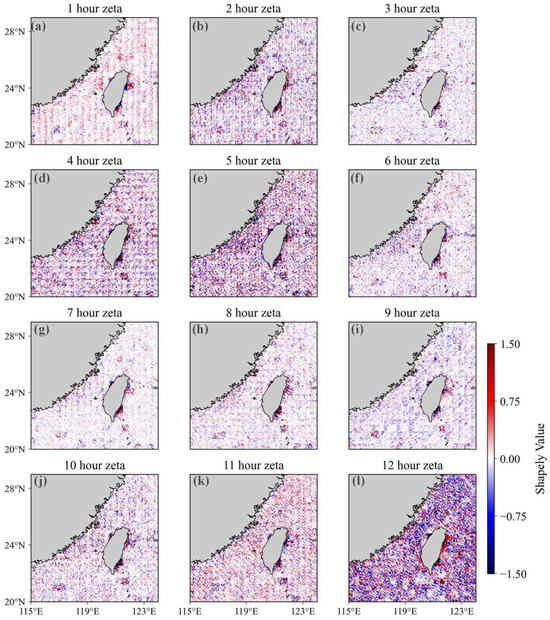
Figure 8.
Spatial distribution of SHAP values (a–l) for surge height (Z) in the 12-h forecast.
4.3. Optimizing Model Guided by SHAP Interpretability
Guided by the model mechanisms revealed through SHAP-based interpretability analysis, this study introduces, for the first time, the explicit inclusion of the tidal elevation time difference (ΔZ/Δt) as an input feature in ViT Model 1, resulting in a physically enhanced variant—ViT Model 2. This optimization carries dual physical significance: (1) it directly provides the instantaneous rate of change in tidal elevation, thereby enhancing the model’s ability to capture hydrodynamic inertia effects, and (2) it compensates for the original model’s limitations in learning the temporal evolution characteristics of the tide.
A systematic performance comparison (Figure 9) clearly demonstrates the superiority of Model 2. The quantitative analysis shows that the improved model significantly enhances the short-term forecasting accuracy within a 12 h lead time. In particular, during the most critical initial 1 h forecast window for disaster prevention, the RMSE is reduced from 0.01 m in Model 1 to 0.005 m in Model 2—representing a 100% improvement in precision—while the correlation coefficient (CC) rises from 0.92 to 0.98, approaching a near-perfect prediction.
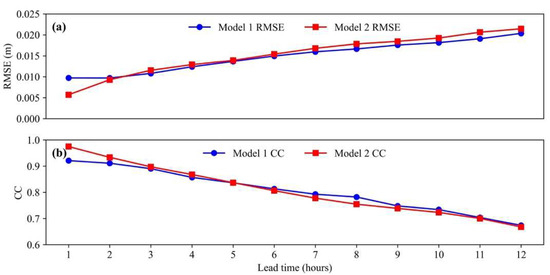
Figure 9.
RMSE (a) and CC (b) values for SS predictions during Typhoon Doksuri over a 12 h forecast period, comparing the baseline ViT model (Model 1) and the improved ViT model (Model 2).
This level of improvement holds substantial practical value for disaster mitigation. In the context of rapid storm surge warnings, doubling the accuracy of forecasts within the first hour can significantly improve the timeliness of emergency responses. Moreover, the enhanced short-term forecast precision offers a more reliable scientific basis for decision making in personnel evacuation, port operations, and other emergency measures. These findings validate the effectiveness of using explainable XAI to guide physics-informed model optimization.
Importantly, these performance gains are achieved without increasing the computational complexity, thus preserving the model’s feasibility for operational applications. This work provides a valuable paradigm for developing next-generation intelligent storm surge forecasting models that are both physically interpretable and highly accurate.
5. Discussion
Synthesizing the results presented above, this study demonstrates the dual value of XAI in both the practical forecasting performance and scientific understanding. Previous studies have established diverse methodological approaches for storm surge forecasting in China’s coastal waters, such as Feng et al. who developed a high-resolution numerical model for the southeastern Chinese coast [16], Shi et al. who mapped the risk of SS along the whole Chinese coast, pointing out that northern Fujian Coasts have higher SS risks [33], Zhu et al. who developed an AI-based forecasts in the Bohai Sea [34], and Xie et al.’s deep learning-based SS forecasting model [35]. In contrast, this study advances the field by demonstrating that XAI not only enhances the SS prediction accuracy, but also deepens our understanding of AI methodologies in geophysical contexts.
From a practical perspective, the application of XAI reveals a critical insight into storm surge forecasting: despite the strong performance of the ViT model, it does not appear to learn the fundamental physical mechanism of the sea surface response to external wind forcing—typically the dominant driver in conventional storm surge generation. Instead, the model relies predominantly on the autocorrelation of tidal elevation, rather than directly leveraging wind field information. However, nearshore surge predictions are subject to greater uncertainty from tidal, wave, and topographic effects [18]. Nonetheless, our offshore forecasts closely match the physics-based benchmarks of Peng and Wang [18], confirming that we capture the dominant open-coast surge drivers. This finding raises important questions for similar AI-based storm surge models, as existing evidence [35] suggests that other deep learning approaches may share this limitation. Notably, while traditional AI models [34,35] achieve comparable accuracy through empirical tuning, they lack the capacity to diagnose such mechanistic shortcomings. By uncovering this mechanism through XAI and subsequently refining the modeling strategy, the predictive accuracy was significantly improved: during the critical first hour of the forecast lead time, RMSE was reduced from 0.01 m (Model 1) to 0.005 m (Model 2), representing a 100% improvement in precision. Meanwhile, the CC increased from 0.92 to 0.98, approaching a near-perfect prediction. This new understanding is instrumental in refining physical assumptions and guiding the future optimization of AI-based forecasting models.
From a cognitive perspective, this study offers a novel paradigm for addressing one of the key bottlenecks in AI oceanography—model optimization workflows. Traditional AI model development often relies on empirical trial-and-error strategies, with limited visibility into the underlying physical or statistical mechanisms. This limitation persists even in state-of-the-art regional studies like Feng et al.’s numerical framework [16], which requires computationally intensive sensitivity experiments to isolate dominant drivers. In contrast, SHAP analysis in this study not only revealed the ViT model’s reliance on the temporal autocorrelation of tidal elevation, but also exposed its limited capacity to represent wind-surge coupling, limitations that would remain hidden under a black-box modeling framework. This level of interpretability enabled targeted improvements, such as the explicit incorporation of the tidal elevation time difference (ΔZ), to better capture hydrodynamic inertia. Notably, using rates of change as features in oceanic and atmospheric forecasting has proven to be an effective strategy in recent state-of-the-art AI models [36,37]. The application of XAI is thus poised to accelerate such advancements, enabling a shift from purely empirical optimization to a physically constrained modeling paradigm.
Looking ahead, the broader application of XAI is expected to fundamentally transform AI-based oceanographic research. Although this study focused on the model development phase, XAI also holds substantial potential in model validation and operational deployment. This will require systematic efforts to (1) establish benchmark XAI methodologies across a range of oceanographic forecasting tasks, and (2) develop integrated frameworks that incorporate domain-specific physical knowledge. This study lays a foundational step toward building coastal disaster modeling systems that are both predictive and scientifically interpretable.
6. Conclusions
This study innovatively integrates the ViT deep learning architecture with XAI techniques to develop a novel intelligent SS forecasting system. Using Typhoon Doksuri as a representative case, this study systematically evaluates the model’s predictive performance under various forecast lead times, verifying its practicality and robustness in SS prediction. By introducing the SHAP method, this study thoroughly analyzes the model’s predictive mechanisms and implements targeted optimizations based on these insights. The results demonstrate that the baseline ViT model (Model 1) exhibits an outstanding 12 h lead time forecasting capability, with a spatiotemporal correlation coefficient exceeding 0.90 (p < 0.01). The model accurately reconstructs the three-dimensional spatial structure and dynamic evolution characteristics of SS fields.
The global feature importance analysis based on SHAP reveals the key features driving model predictions: despite conventional theories suggesting that wind field parameters are critical factors in SS formation, this study finds that the contribution of wind components (u10, v10) is relatively limited. Instead, the model primarily relies on the historical autocorrelation characteristics of the SS height itself. Building on this mechanistic understanding, this study innovatively introduces the surge time difference (ΔZ/Δt) as an explicit input feature in the improved model (ViT Model 2), which achieved substantial performance improvements. Specifically, during the initial 1 h forecast period—a critical window for disaster mitigation—the RMSE decreased from 0.01 m (Model 1) to 0.005 m, while CC increased from 0.92 to 0.98, approaching a perfect prediction.
In summary, the “data-driven and explainable validation” technical framework established in this study holds significant methodological and practical value, providing a new generation of intelligent decision support tools for integrated coastal disaster prevention and mitigation. However, challenges remain in extending forecast lead times, enhancing regional adaptability, and strengthening physical constraints. Future work will focus on developing multi-scale recursive architectures, conducting transfer learning research in typical coastal zones, and exploring hybrid modeling methods.
This study demonstrates that the synergy between deep learning and explainable AI not only overcomes the efficiency bottleneck of traditional numerical models, but also advances the intelligent transformation of marine hazard forecasting through the establishment of a verifiable scientific explanation framework. The proposed approach offers more reliable technological support for coastal disaster prevention and control, driving the development of intelligent and transparent forecasting systems in oceanographic research.
Author Contributions
Conceptualization, L.H. and W.L.; methodology, L.H. and W.L.; validation, L.H. and W.L.; formal analysis, W.L.; investigation, L.H. and W.L.; resources, W.L. and C.D.; data curation, L.H. and W.L.; writing—original draft preparation, L.H. and W.L.; writing—review and editing, L.H., W.L., and C.D.; visualization, L.H.; supervision, W.L. and C.D.; project administration, C.D.; funding acquisition, C.D. All authors have read and agreed to the published version of the manuscript.
Funding
This research was funded by the National Key Research and Development Program of China, grant number 2023YFC3008200, and the Science and Technology Innovation Project of Laoshan Laboratory under contract LSKJ202400203.
Data Availability Statement
ECMWF-ERA5 wind data are obtained from the Climate Data Store (https://cds.climate.copernicus.eu/, accessed on 1 August 2024). Bathymetric data are available in the General Bathymetric Chart of the Oceans (https://www.gebco.net/, accessed on 8 September 2024). Shoreline data are obtained from Google Earth (https://earth.google.com/web/, accessed on 8 September 2024).
Acknowledgments
We thank the National Key Research and Development Program of China for funding and supporting this research. We also thank Yingjie Liu and Zimeng Zhao at the Institute of Oceanology, Chinese Academy of Sciences, for their guidance and assistance in the analysis and interpretation of the results, as well as in the manuscript preparation.
Conflicts of Interest
The authors declare no conflicts of interest.
Abbreviations
The following abbreviations are used in this manuscript:
| AI | Artificial intelligence |
| SS | Storm surge |
| XAI | Explainable AI |
| ViT | Vision Transformers |
References
- Lu, W.; Su, H.; Yang, X.; Yan, X.-H. Subsurface Temperature Estimation from Remote Sensing Data Using a Clustering-Neural Network Method. Remote Sens. Environ. 2019, 229, 213–222. [Google Scholar] [CrossRef]
- Yang, G.G.; Wang, Q.; Feng, J.; He, L.; Li, R.; Lu, W.; Liao, E.; Lai, Z. Can Three-Dimensional Nitrate Structure Be Reconstructed from Surface Information with Artificial Intelligence?—A Proof-of-Concept Study. Sci. Total Environ. 2024, 924, 171365. [Google Scholar] [CrossRef]
- Liu, Y.; Lu, W.; Wang, D.; Lai, Z.; Ying, C.; Li, X.; Han, Y.; Wang, Z.; Dong, C. Spatiotemporal Wave Forecast with Transformer-Based Network: A Case Study for the Northwestern Pacific Ocean. Ocean Model. 2024, 188, 102323. [Google Scholar] [CrossRef]
- Bolton, T.; Zanna, L. Applications of Deep Learning to Ocean Data Inference and Subgrid Parameterization. J. Adv. Model. Earth Syst. 2019, 11, 376–399. [Google Scholar] [CrossRef]
- Chau, K. A Review on the Integration of Artificial Intelligence into Coastal Modeling. J. Environ. Manag. 2006, 80, 47–57. [Google Scholar] [CrossRef]
- Wang, X.; Jiang, H. Physics-Guided Deep Learning for Skillful Wind-Wave Modeling. Sci. Adv. 2024, 10, eadr3559. [Google Scholar] [CrossRef] [PubMed]
- Ham, Y.G.; Kim, J.H.; Luo, J.J. Deep Learning for Multi-Year ENSO Forecasts. Nature 2019, 573, 568–572. [Google Scholar] [CrossRef]
- Zheng, G.; Li, X.; Zhang, R.-H.; Liu, B. Purely Satellite Data-Driven Deep Learning Forecast of Complicated Tropical Instability Waves. Sci. Adv. 2020, 6, eaba1482. [Google Scholar] [CrossRef]
- Zhang, X.; Wang, H.; Wang, S.; Liu, Y.; Yu, W.; Wang, J.; Xu, Q.; Li, X. Oceanic Internal Wave Amplitude Retrieval from Satellite Images Based on a Data-Driven Transfer Learning Model. Remote Sens. Environ. 2022, 272, 112940. [Google Scholar] [CrossRef]
- García Fernández, J.; Abdellaoui, I.A.; Mehrkanoon, S. Deep Coastal Sea Elements Forecasting Using UNet-Based Models. Knowl.-Based Syst. 2022, 252, 109445. [Google Scholar] [CrossRef]
- Zhou, S.; Xie, W.; Lu, Y.; Wang, Y.; Zhou, Y.; Hui, N.; Dong, C. ConvLSTM-Based Wave Forecasts in the South and East China Seas. Front. Mar. Sci. 2021, 8, 680079. [Google Scholar] [CrossRef]
- Yang, Z.; Wang, G.; Feng, L.; Wang, Y.; Wang, G.; Liang, S. A Transformer Model for Coastline Prediction in Weitou Bay, China. Remote Sens. 2023, 15, 4771. [Google Scholar] [CrossRef]
- Shan, K.; Yu, X. Variability of Tropical Cyclone Landfalls in China. J. Clim. 2021, 34, 9235–9247. [Google Scholar] [CrossRef]
- Ministry of Natural Resources. China Maritime Disaster Bulletin 2023; Ministry of Natural Resources: Beijing, China, 2024. [Google Scholar]
- Danilov, S. Ocean Modeling on Unstructured Meshes. Ocean Model. 2013, 69, 195–210. [Google Scholar] [CrossRef]
- Feng, X.; Li, M.; Yin, B.; Yang, D.; Yang, H. Study of Storm Surge Trends in Typhoon-Prone Coastal Areas Based on Observations and Surge-Wave Coupled Simulations. Int. J. Appl. Earth Obs. Geoinf. 2018, 68, 10. [Google Scholar] [CrossRef]
- Feng, X.; Yin, B.; Yang, D. Development of an Unstructured-Grid Wave-Current Coupled Model and Its Application. Ocean Model. 2016, 104, 213–225. [Google Scholar] [CrossRef]
- Peng, Z.; Wang, P. Surface Wave Effects on Storm Surge: A Case Study of Typhoon Doksuri (2023). J. Mar. Sci. Eng. 2025, 13, 478. [Google Scholar] [CrossRef]
- Ramos-Valle, A.N.; Curchitser, E.N.; Bruyère, C.L.; McOwen, S. Implementation of an Artificial Neural Network for Storm Surge Forecasting. J. Geophys. Res. Atmos. 2021, 126, e2020JD033266. [Google Scholar] [CrossRef]
- Pachev, B.; Arora, P.; del-Castillo-Negrete, C.; Valseth, E.; Dawson, C. A Framework for Flexible Peak Storm Surge Prediction. Coast. Eng. 2023, 186, 104406. [Google Scholar] [CrossRef]
- Giaremis, S.; Nader, N.; Dawson, C.; Kaiser, C.; Nikidis, E.; Kaiser, H. Storm Surge Modeling in the AI Era: Using LSTM-Based Machine Learning for Enhancing Forecasting Accuracy. Coast. Eng. 2024, 191, 104532. [Google Scholar] [CrossRef]
- Holm, E.A. In Defense of the Black Box. Science 2019, 364, 26–27. [Google Scholar] [CrossRef] [PubMed]
- Hossain, E.; Ferdous, M.H.; Wang, J.; Subramanian, A.; Gani, M.O. Correlation to Causation: A Causal Deep Learning Framework for Arctic Sea Ice Prediction. arXiv 2025, arXiv:2503.02093. [Google Scholar]
- Zhang, Q.; Wu, Y.N.; Zhu, S.-C. Interpretable Convolutional Neural Networks. In Proceedings of the IEEE Conference on Computer Vision and Pattern Recognition, Salt Lake City, UT, USA, 18–22 June 2018; pp. 8827–8836. [Google Scholar] [CrossRef]
- Clare, M.C.A.; Sonnewald, M.; Lguensat, R.; Deshayes, J.; Balaji, V. Explainable Artificial Intelligence for Bayesian Neural Networks: Toward Trustworthy Predictions of Ocean Dynamics. J. Adv. Model. Earth Syst. 2022, 14, e2022MS003162. [Google Scholar] [CrossRef]
- Meng, C.; Trinh, L.; Xu, N.; Enouen, J.; Liu, Y. Interpretability and Fairness Evaluation of Deep Learning Models on MIMIC-IV Dataset. Sci. Rep. 2022, 12, 7166. [Google Scholar] [CrossRef]
- Wang, N.; Zhang, H.; Dahal, A.; Cheng, W.; Zhao, M.; Lombardo, L. On the Use of Explainable AI for Susceptibility Modeling: Examining the Spatial Pattern of SHAP Values. Geosci. Front. 2024, 15, 101800. [Google Scholar] [CrossRef]
- Nazat, S.; Abdallah, M. XAI-Based Feature Ensemble for Enhanced Anomaly Detection in Autonomous Driving Systems. arXiv 2024, arXiv:2410.15405. [Google Scholar]
- Lundberg, S.M.; Lee, S.-I. A Unified Approach to Interpreting Model Predictions. In Advances in Neural Information Processing Systems 30; Curran Associates, Inc.: Red Hook, NY, USA, 2017. [Google Scholar]
- Hersbach, H.; Bell, B.; Berrisford, P.; Biavati, G.; Horányi, A.; Muñoz Sabater, J.; Nicolas, J.; Peubey, C.; Radu, R.; Rozum, I. ERA5 Hourly Data on Single Levels from 1940 to Present; Copernicus Climate Change Service (C3S) Climate Data Store (CDS) [Data Set]: European Centre for Medium-Range Weather Forecasts (ECMWF): Reading, UK, 2023. [Google Scholar] [CrossRef]
- Vaswani, A.; Shazeer, N.; Parmar, N.; Uszkoreit, J.; Jones, L.; Gomez, A.N.; Kaiser, Ł.; Polosukhin, I. Attention is All You Need. Adv. Neural Inf. Process. Syst. 2017, 30, 6000–6010. [Google Scholar]
- Dosovitskiy, A.; Beyer, L.; Kolesnikov, A.; Weissenborn, D.; Zhai, X.; Unterthiner, T.; Dehghani, M.; Minderer, M.; Heigold, G.; Gelly, S. An image is worth 16x16 words: Transformers for image recognition at scale. arXiv 2020, arXiv:2010.11929. [Google Scholar]
- Shi, X.; Zhang, Y.; Liu, S.; Yang, L.; Yu, L.; Zhang, Y.; Jia, N.; Tian, Z. Mapping Storm Surge Risk at County Level in Coastal Areas of China. J. Mar. Sci. Eng. 2025, 13, 427. [Google Scholar] [CrossRef]
- Zhu, Z.; Wang, Z.; Dong, C.; Yu, M.; Xie, H.; Cao, X.; Han, L.; Qi, J. Physics informed neural network modelling for storm surge forecasting—A case study in the Bohai Sea, China. Coast. Eng. 2025, 197, 104686. [Google Scholar] [CrossRef]
- Xie, W.; Xu, G.; Zhang, H.; Dong, C. Developing a deep learning-based storm surge forecasting model. Ocean Model. 2023, 182, 102179. [Google Scholar] [CrossRef]
- Kochkov, D.; Yuval, J.; Langmore, I.; Norgaard, P.; Smith, J.; Mooers, G.; Klwer, M.; Lottes, J.; Rasp, S.; Dben, P.; et al. Neural general circulation models for weather and climate. Nature 2024, 632, 1060–1066. [Google Scholar] [CrossRef]
- Cui, Y.; Wu, R.; Zhang, X.; Zhu, Z.; Liu, B.; Shi, J.; Chen, J.; Liu, H.; Zhou, S.; Su, L.; et al. Forecasting the eddying ocean with a deep neural network. Nat. Commun. 2025, 16, 2268. [Google Scholar] [CrossRef]
Disclaimer/Publisher’s Note: The statements, opinions and data contained in all publications are solely those of the individual author(s) and contributor(s) and not of MDPI and/or the editor(s). MDPI and/or the editor(s) disclaim responsibility for any injury to people or property resulting from any ideas, methods, instructions or products referred to in the content. |
© 2025 by the authors. Licensee MDPI, Basel, Switzerland. This article is an open access article distributed under the terms and conditions of the Creative Commons Attribution (CC BY) license (https://creativecommons.org/licenses/by/4.0/).