1. Introduction
Floating docks are mainly used for the maintenance and construction of ships at sea. During their operation, every effort is made to avoid collisions with ships. However, due to the influence of factors such as water flow, wind force, and operation, collisions with ships may still occur. Since the walls of the floating dock are relatively thin, in the event of a collision, it may lead to problems such as dents, cracks, and even leakage in the dock walls. Moreover, once some key components of the floating dock, such as the temporary dock gate and mooring equipment, are impacted, their normal functions may be affected. Therefore, designing a specialized anti-collision structure for the floating dock to absorb and disperse collision energy, reduce the direct impact on the dock walls, and protect the structural and functional integrity of the dock walls or key components is of great significance for ensuring the operational safety and functionality of the floating dock [
1].
The research on ship anti-collision protection is one of the most widely studied categories in the field of ship collision issues, and numerous experts and scholars have achieved fruitful research results. In terms of the dynamic laws of collisions, Minorsky [
2] obtained the theoretical relationship curve between the degree of hull damage and the change in kinetic energy through the analysis of 26 nuclear-powered ship collision experiments. Liu et al. [
3] established a finite-element model of a 50,000-ton-class ship colliding with a rigid pier wall using the ANSYS/LS-DYNA software and carried out a numerical simulation of the collision process, obtaining the collision force–time curve and summarizing the general laws of ship collisions. Sha et al. [
4] established a numerical model of collision between a ship and a floating bridge using the USFOS software, selected three collision positions for simulation, and studied the dynamic characteristics of the floating bridge when impacted by the ship. Ye et al. [
5] considered the interaction between the main body of the ship and the surrounding fluid, used the LS-DYNA software to conduct fluid–structure interaction simulations of the ship–bridge collisions at different collision angles, evaluated the influence of the impact angle, ship speed, draft depth, and collision position on the hydrodynamic effect, and improved the analytical formulae related to collision energy absorption. Yao et al. [
6] carried out equivalent experiments of the ship–bridge collisions using a scaled physical model and compared the numerical values of the collision force with those obtained from fluid–structure interaction simulations using finite-element software. The simulation values and experimental results showed a high degree of agreement with an error of less than 10%, verifying the reliability of using the fluid–structure interaction method for collision simulations.
In terms of anti-collision device design, Wang et al. [
7] designed a new type of flexible steel wire ring anti-collision device attached to the outside of the bridge pier. They conducted a dynamic analysis of the ship collision process through numerical simulation methods and verified the effectiveness of this anti-collision device in reducing the peak value of the impact force. Fang et al. [
8] proposed a new type of bridge pier foam anti-collision system (LCBS). Then, they used the LS-DYNA software to conduct an explicit analysis of its dynamic response during the collision process. The results showed that this structure could effectively reduce the maximum collision force on the bridge to a non-destructive level. Fan et al. [
9] compared the impact resistance performance of a new type of steel-fiber-reinforced concrete (UHPFRC) and steel-reinforced concrete (RC) composite anti-collision fenders through drop-hammer impact tests. It was verified that the impact resistance performance of the UHPFRC panel was better than that of the RC panel, which could effectively reduce the impact response of the ship on the bridge and avoid ship damage. Jiang et al. [
10], by analyzing the respective protection methods of ships and bridges, proposed a new type of additional isolated flexible anti-collision device. They carried out a dynamic numerical simulation using LS-DYNA, and the results showed that this structure could provide reliable protection for the bridge. Chen et al. [
11], in order to improve the impact resistance of bridge piers, designed a new type of corrugated steel bridge pier anti-collision device (CSP) and carried out numerical modeling and simulation studies. It was found that the CSP could effectively improve the impact resistance of bridge piers, and its energy absorption capacity increased with the increase in the thickness of the corrugated steel wall. Sha et al. [
12], in order to improve the impact resistance of the reinforced concrete anti-collision floating box, used carbon-fiber-reinforced composite material (CFRP) to reinforce it and carried out a finite-element collision analysis. The results showed that the impact resistance performance of the reinforced floating box was significantly improved, and its impact resistance effect was related to the thickness of the floating box. Wang et al. [
13] adopted the method of digital simulation to design a new type of gradient lattice-filled thin-shell structure (FGLPS). Through finite-element simulation, they studied the influence of the gradient pattern and the impact angle on its energy absorption performance. Finally, it was found that the FGLPS could play a protective role in significantly reducing the impact force and prolonging the impact time, providing a new thinking direction for the research and development of anti-collision structures. Lee [
14] used the ANSYS/LS-DYNA software to simulate the collision process of a ship equipped with rubber fenders, studied the influences of different ship speeds, load weights, and rubber materials on the energy absorption and deformation of the fenders, and obtained the minimum thickness needed to meet the working conditions of the fenders, providing a structural reference for the anti-collision of the tripod foundation. Liu et al. [
15] designed a composite crashworthy structure with an external steel shell and an internal rubber layer and carried out an explicit dynamic analysis through the LS-DYNA software. They optimized the hardness of the rubber used in this crashworthy structure and the thickness of the external steel shell and obtained better dimensions of the composite crashworthy structure.
Reviewing the existing literature, collision protection devices play a critical role in maritime safety, with applications spanning pier protection [
16], ship-to-ship resupply operations [
17,
18], and floating wind turbine maintenance [
15]. These systems are generally divided into three types, as shown in
Table 1.
As mentioned above, given their affordability and performance, rigid steel systems remain the preferred choice for low-speed collisions in floating docks, ensuring both safety and economic efficiency. Future developments may focus on optimizing hybrid designs for broader maritime applications.
Ship collision is a complex, non-linear process in which the ship structure undergoes a dynamic response to huge impact loads within a short time. It involves a large number of non-linear problems, such as material non-linearity, geometric non-linearity, contact non-linearity, and motion non-linearity. Up until now, research on collision simulations has mainly formed three research methods: the experimental method, the analytical method, and the finite-element simulation method.
The current mainstream research method is the finite-element simulation method, and a large number of scholars have used this method to conduct a lot of related research [
29,
30,
31]. Sun [
32] studied the dynamic response of flexible floating collision prevention systems under random waves and found that their motion and tension amplitudes increase with wave height, while their multi-frequency characteristics are primarily influenced by the edge mooring chain and blockchain. Wang [
33] designed two types of pontoon protection structures. Through drop weight tests and numerical simulations, he analyzed their deformation patterns and impact forces under different impact speeds and positions, concluding that the O-shaped structure has superior impact resistance. Thamburaja [
34] derived the constitutive theory of viscoelastic materials and non-local fracture criteria. Using finite-element simulations, they demonstrated that non-local fracture criteria can make simulation results grid-independent and accurately simulate crack propagation. With the continuous progress of computer performance and finite-element analysis software, the research into new anti-collision structures is gradually based on the computer simulation test, which not only saves on cost but also greatly shortens the time of anti-collision structure development, and with a large number of experiments, comparative analysis shows that the computer simulation test has high accuracy.
A review of the existing literature reveals that there has been relatively little research and design work dedicated specifically to anti-collision devices for floating docks. Nevertheless, the extensive studies on ship collisions and ship fenders in current research can offer valuable insights and serve as beneficial references for the present study. Based on non-linear dynamics analysis software, this paper uses the numerical simulation method to analyze the collision buffer performance of collision avoidance devices under different structural forms, different impact speeds, and other conditions and evaluates the performance of different materials in collisions. The research results can provide support for the determination of the design and improvement of collision avoidance devices for floating docks.
2. Theoretical Methods
2.1. Mathematical Model
The solution methods of non-linear finite-element analysis have two kinds of explicit and implicit solution methods in the time domain and three kinds of Lagrange algorithms, Euler algorithms, and ALE algorithms in the space domain. The implicit solution method is too costly in terms of computational time and is prone to non-convergence when solving complex non-linear problems, while the explicit solution method (center difference method) is more suitable for solving transient non-linear problems such as explosions and collisions, etc. The Lagrange algorithm, i.e., the follower method, describes the displacements, stresses, and strains of the unitary mass: the coordinate origin is fixed in the computation, and the nodes on the object are fixed in position and move in space together with the change in the system’s shape and parameter. In the calculation, its coordinate origin is fixed, the position of the nodes on the object is fixed, and the nodes move in the space with the change in the system’s positional shape, i.e., the material follows the deformation of the mesh, and the mesh may undergo serious distortion in the case of large deformation, which is usually used in the structural analysis and interface of the large deformation model. To solve the collision problem in this paper, ALE algorithms were used.
The (ALE) method can move in any form within space, independent of the material coordinate system and the spatial coordinate system. Defining an appropriate mesh movement pattern accurately describes the moving interface of objects while maintaining the reasonable shape of the elements. This approach resolves the issue of mesh distortion and subsequent calculation failures in the Lagrange method when dealing with large deformations due to material twisting, and it also avoids the difficulty of capturing material boundaries in the Euler method [
35].
The Arbitrary Lagrangian–Eulerian (ALE) method employs a reference configuration (denoted as Ω) that is independent of both the initial configuration and the current motion configuration. In this reference configuration, the position of each material point is defined by its position vector ζ in the reference coordinate system.
The ALE-based mesh is decoupled from both material motion and spatial motion, allowing flexible transformation as needed. Equation (1) describes the motion law of material point
X in the reference coordinate system, where
t is time. The evolution of the position of the reference point in the reference coordinate system can be determined over time and with respect to the material point. Equation (2) governs the motion law of reference points in the spatial domain. A connection can be established between the reference point and the actual spatial position.
The velocity of the reference point,
ζ, in space (grid velocity),
vζ, is equal to the derivative of the position vector,
x(
ζ,
t), with respect to time. The speed of the motion of the grid can be characterized in space.
The derivative of the position vector,
ζ(
X,
t), of material point
X with respect to time is the velocity of material point
X in the reference coordinate system. The motion rate of the material point can be reflected in the reference coordinate system.
In the reference domain
Ωζ, the mass conservation equation is as follows:
In this equation, is the density in the reference domain, and is the velocity component. This equation indicates that the sum of the mass change rates with respect to time and space in the reference domain is zero, which is mass conservation.
In the reference domain Ω
ζ, the momentum equation can be written as follows:
In this equation, Tij represents the first Piola–Kirchhoff stress tensor defined on the reference domain. is the density, and is the velocity component. is the component of the body force. It reflects the balanced relationship between the change in momentum in the reference domain and the stress and body force.
Within the reference domain Ω
ζ, the energy equation can be transformed into the following equation:
In this formula, e represents the internal energy per unit mass of the object. is the heat flux component.
When discretizing two contacting objects and using finite-element interpolation for field variables, the dynamic contact differential equation is the following:
In this formula,
M is the mass matrix,
C is the damping matrix,
K is the stiffness matrix,
u is the displacement,
P is the external force, and
R is the contact force. For detailed derivation, refer to reference [
36].
For collision contact problems, due to the sudden change in contact pressure, the assumption of linear acceleration variation within the interval, as required by the Newmark–β method, is not satisfied. By using the Lagrange multiplier method to correct the acceleration at the initial contact and initial separation of the objects, the Newmark–β method can be applied to obtain the dynamic contact equations, which then yield the contact force vector and the displacements of the two objects [
37].
2.2. Collision Scenario and Simulation Model
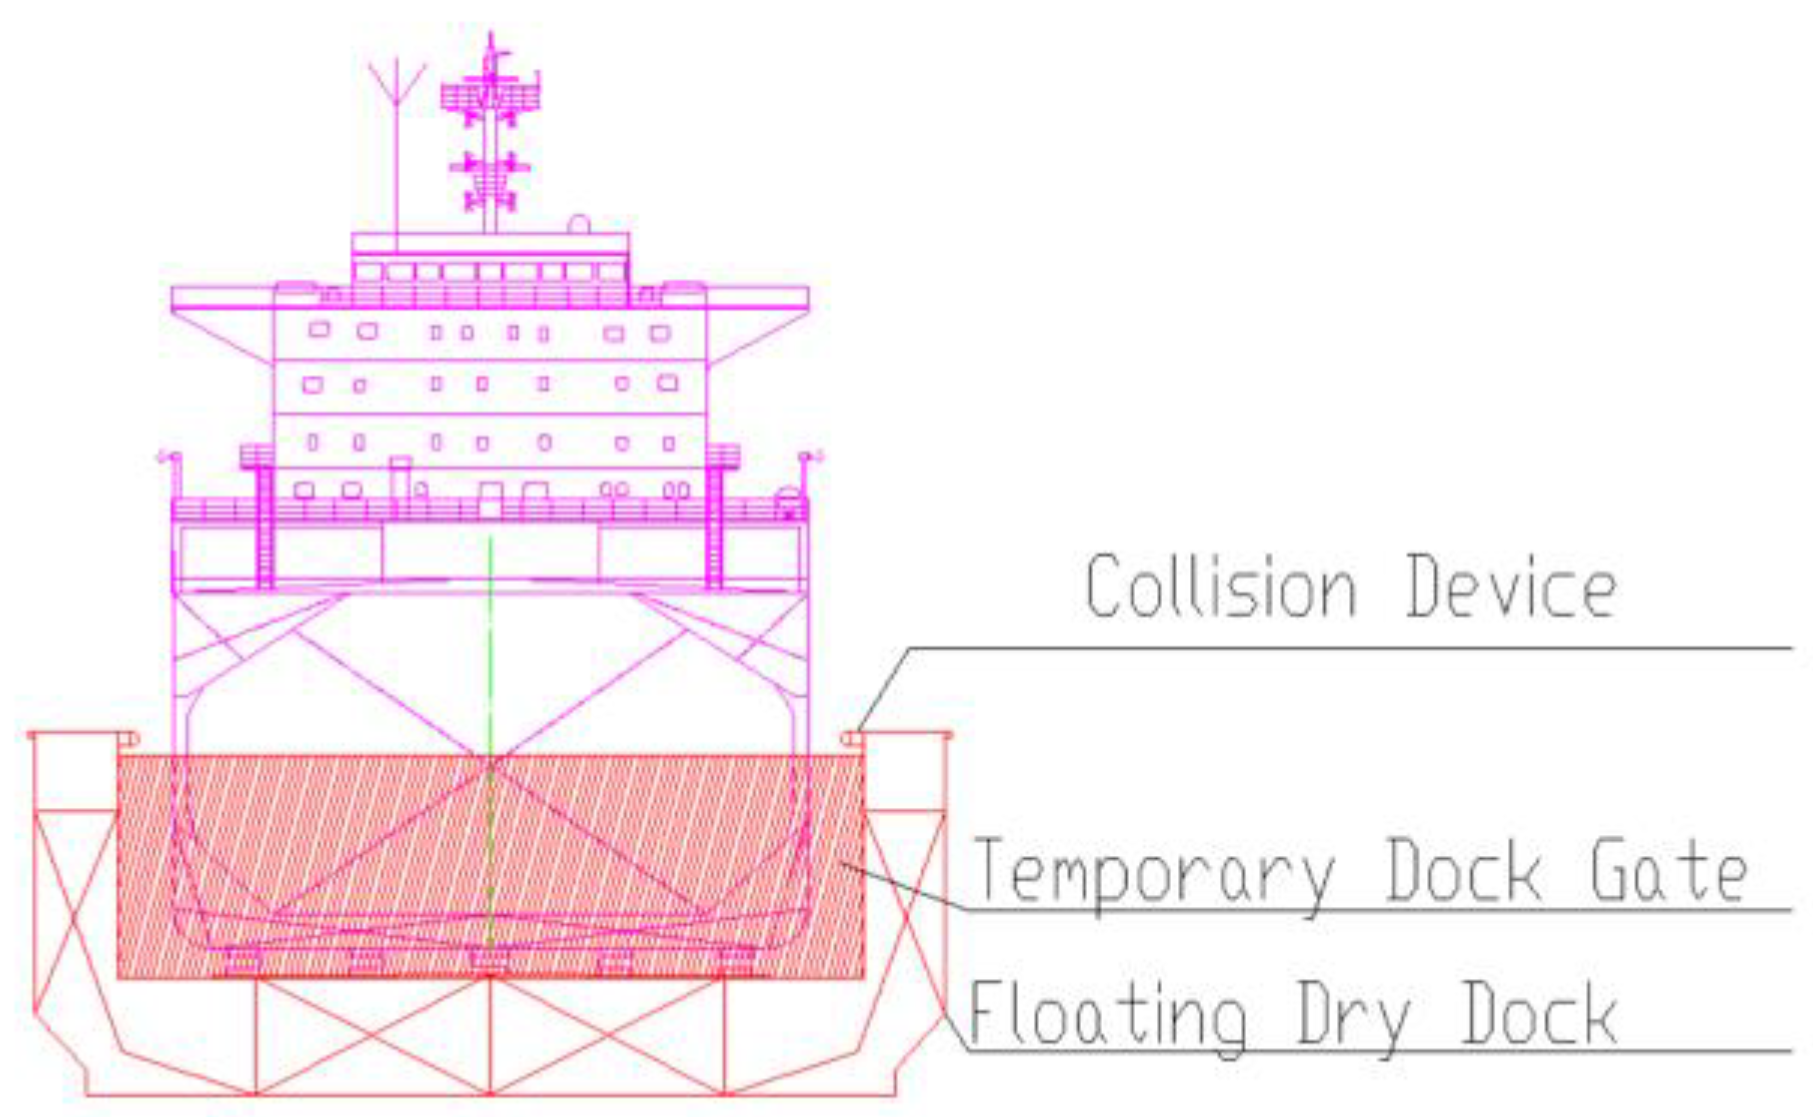
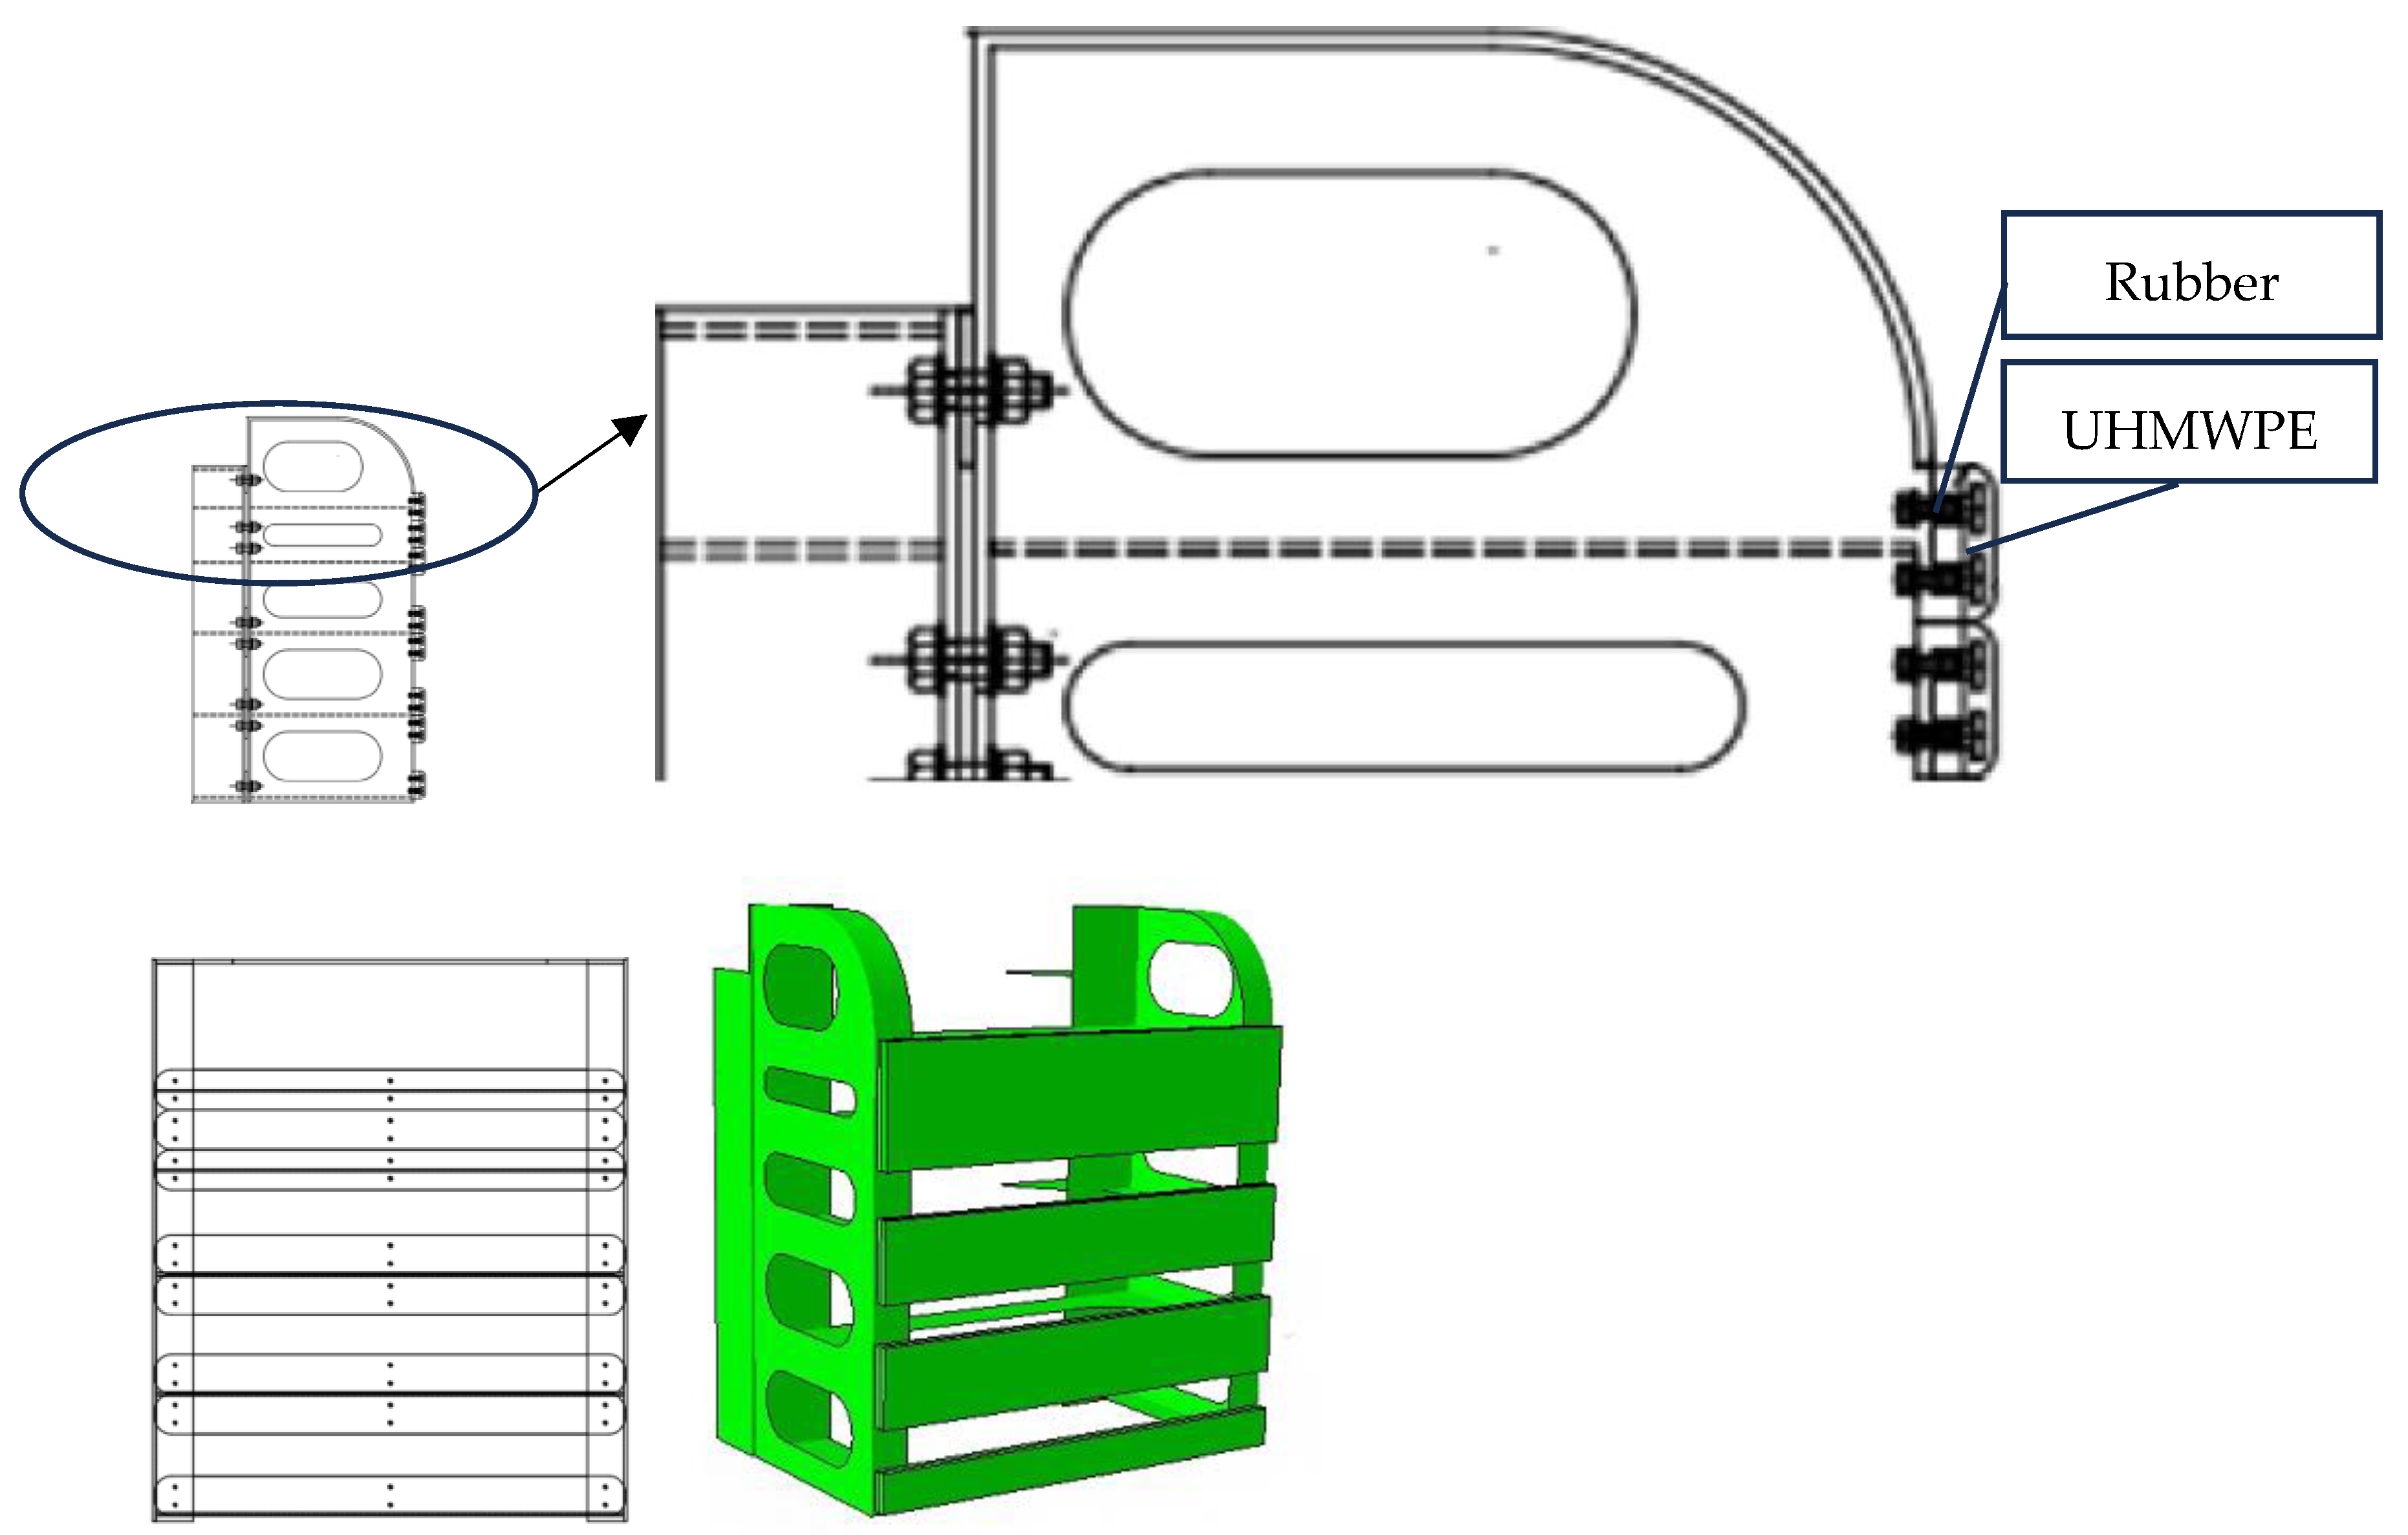
Usually, collision prevention structures are placed at the ends of the side boxes. But in some unconventional usage environments, some special floating drydock may be equipped with temporary closure devices, such as setting up temporary dock gates during specific maintenance scenarios (e.g., classified repairs of nuclear submarines), which are fitted with removable sealing structures to isolate external waters or control internal environments. Even within the dock walls, partial anti-collision structures may be installed, as shown in
Figure 1.
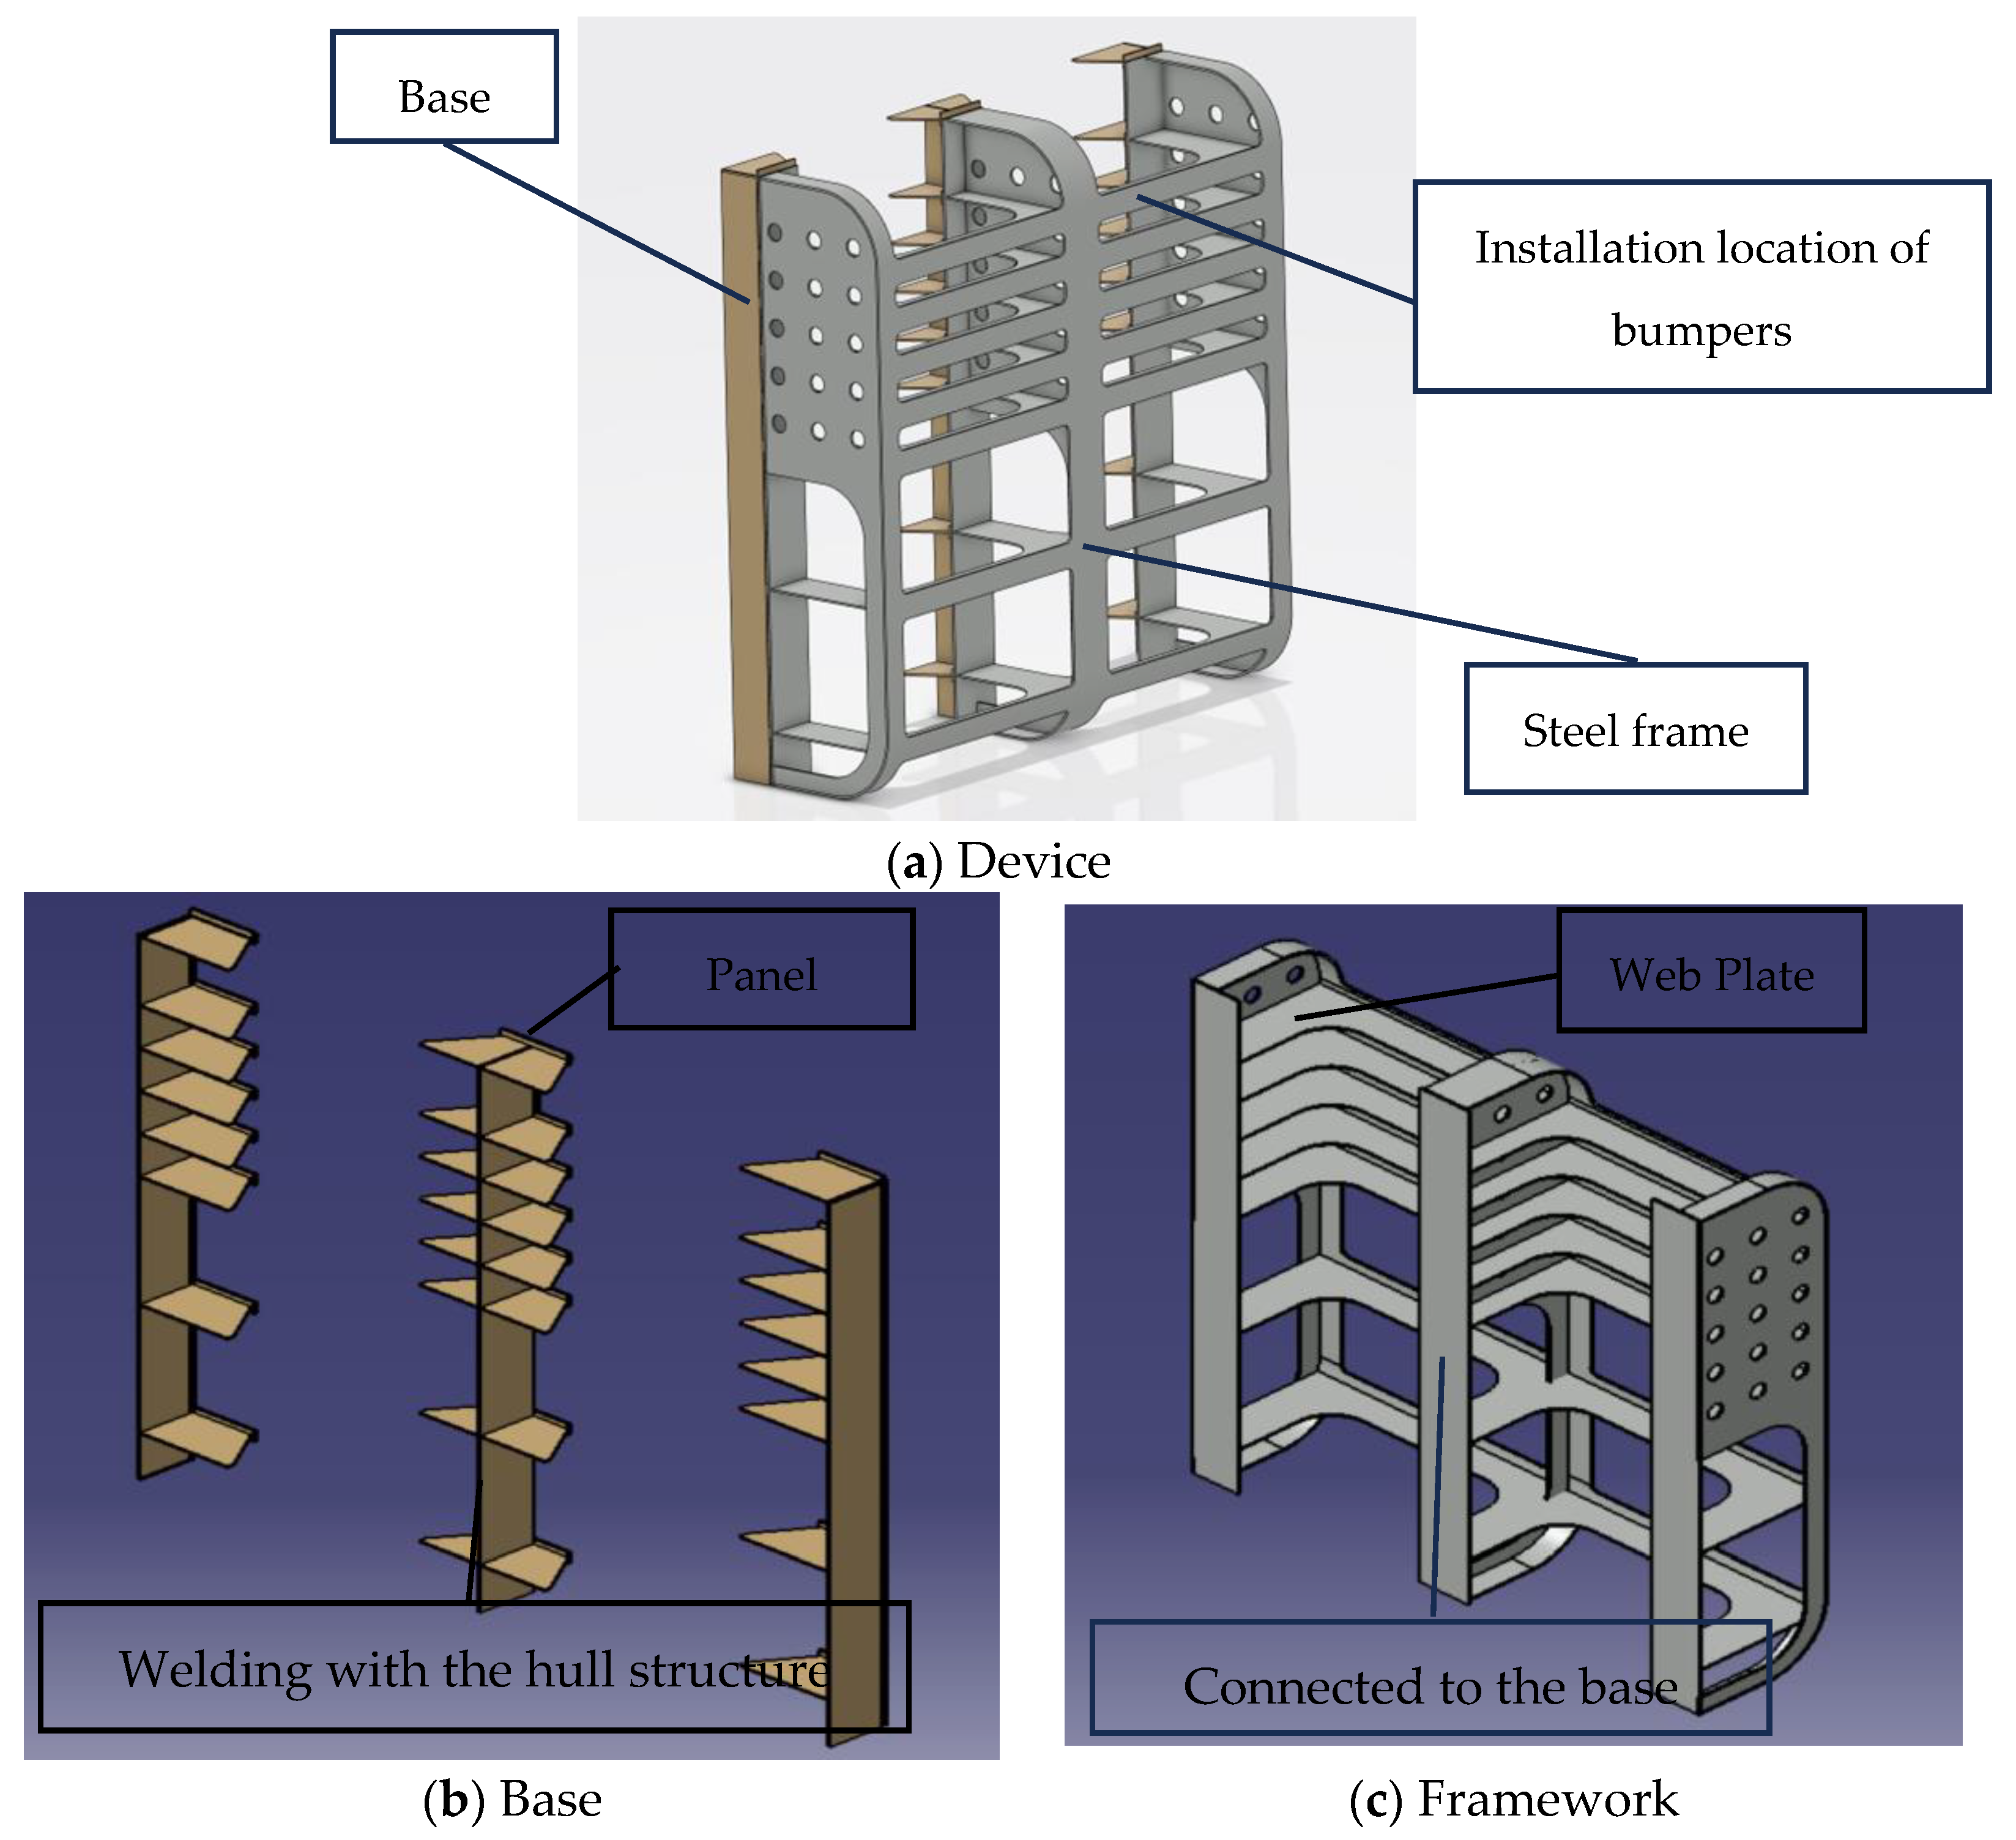
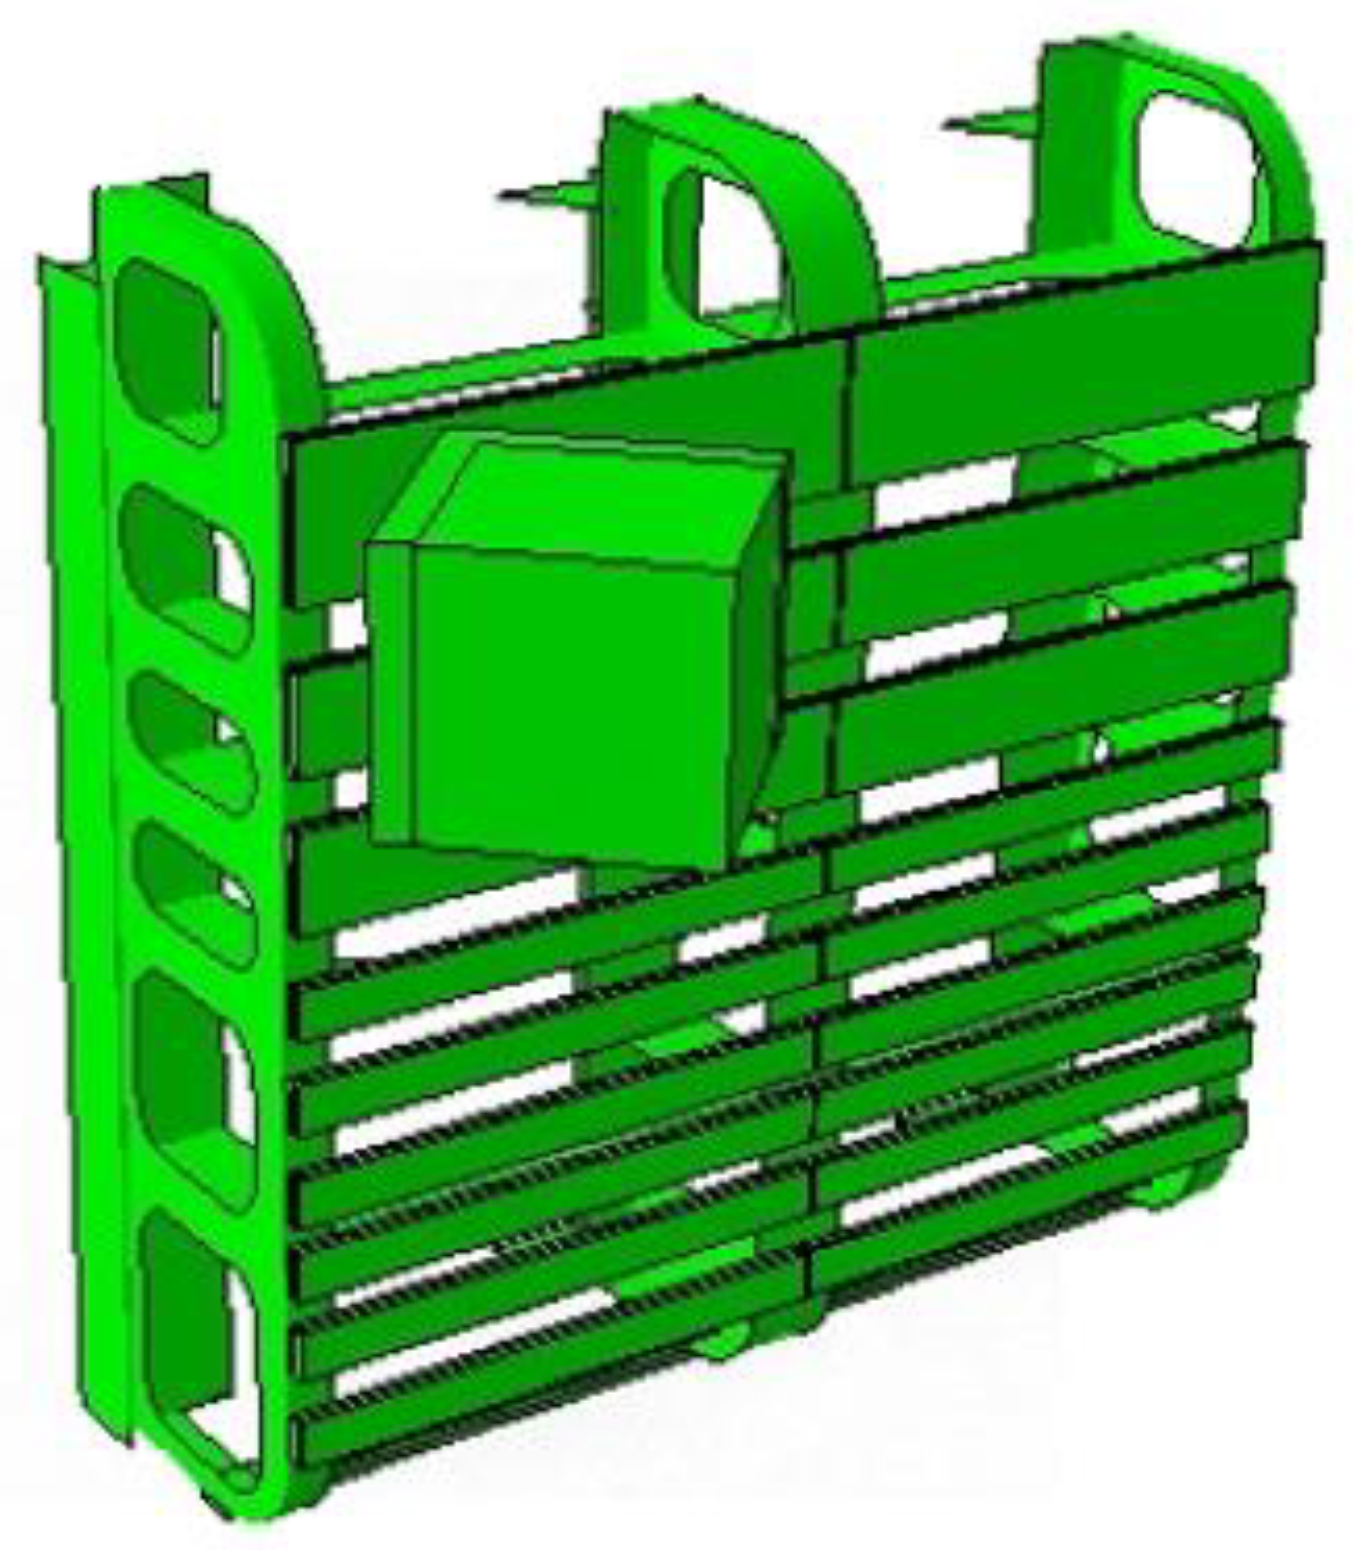
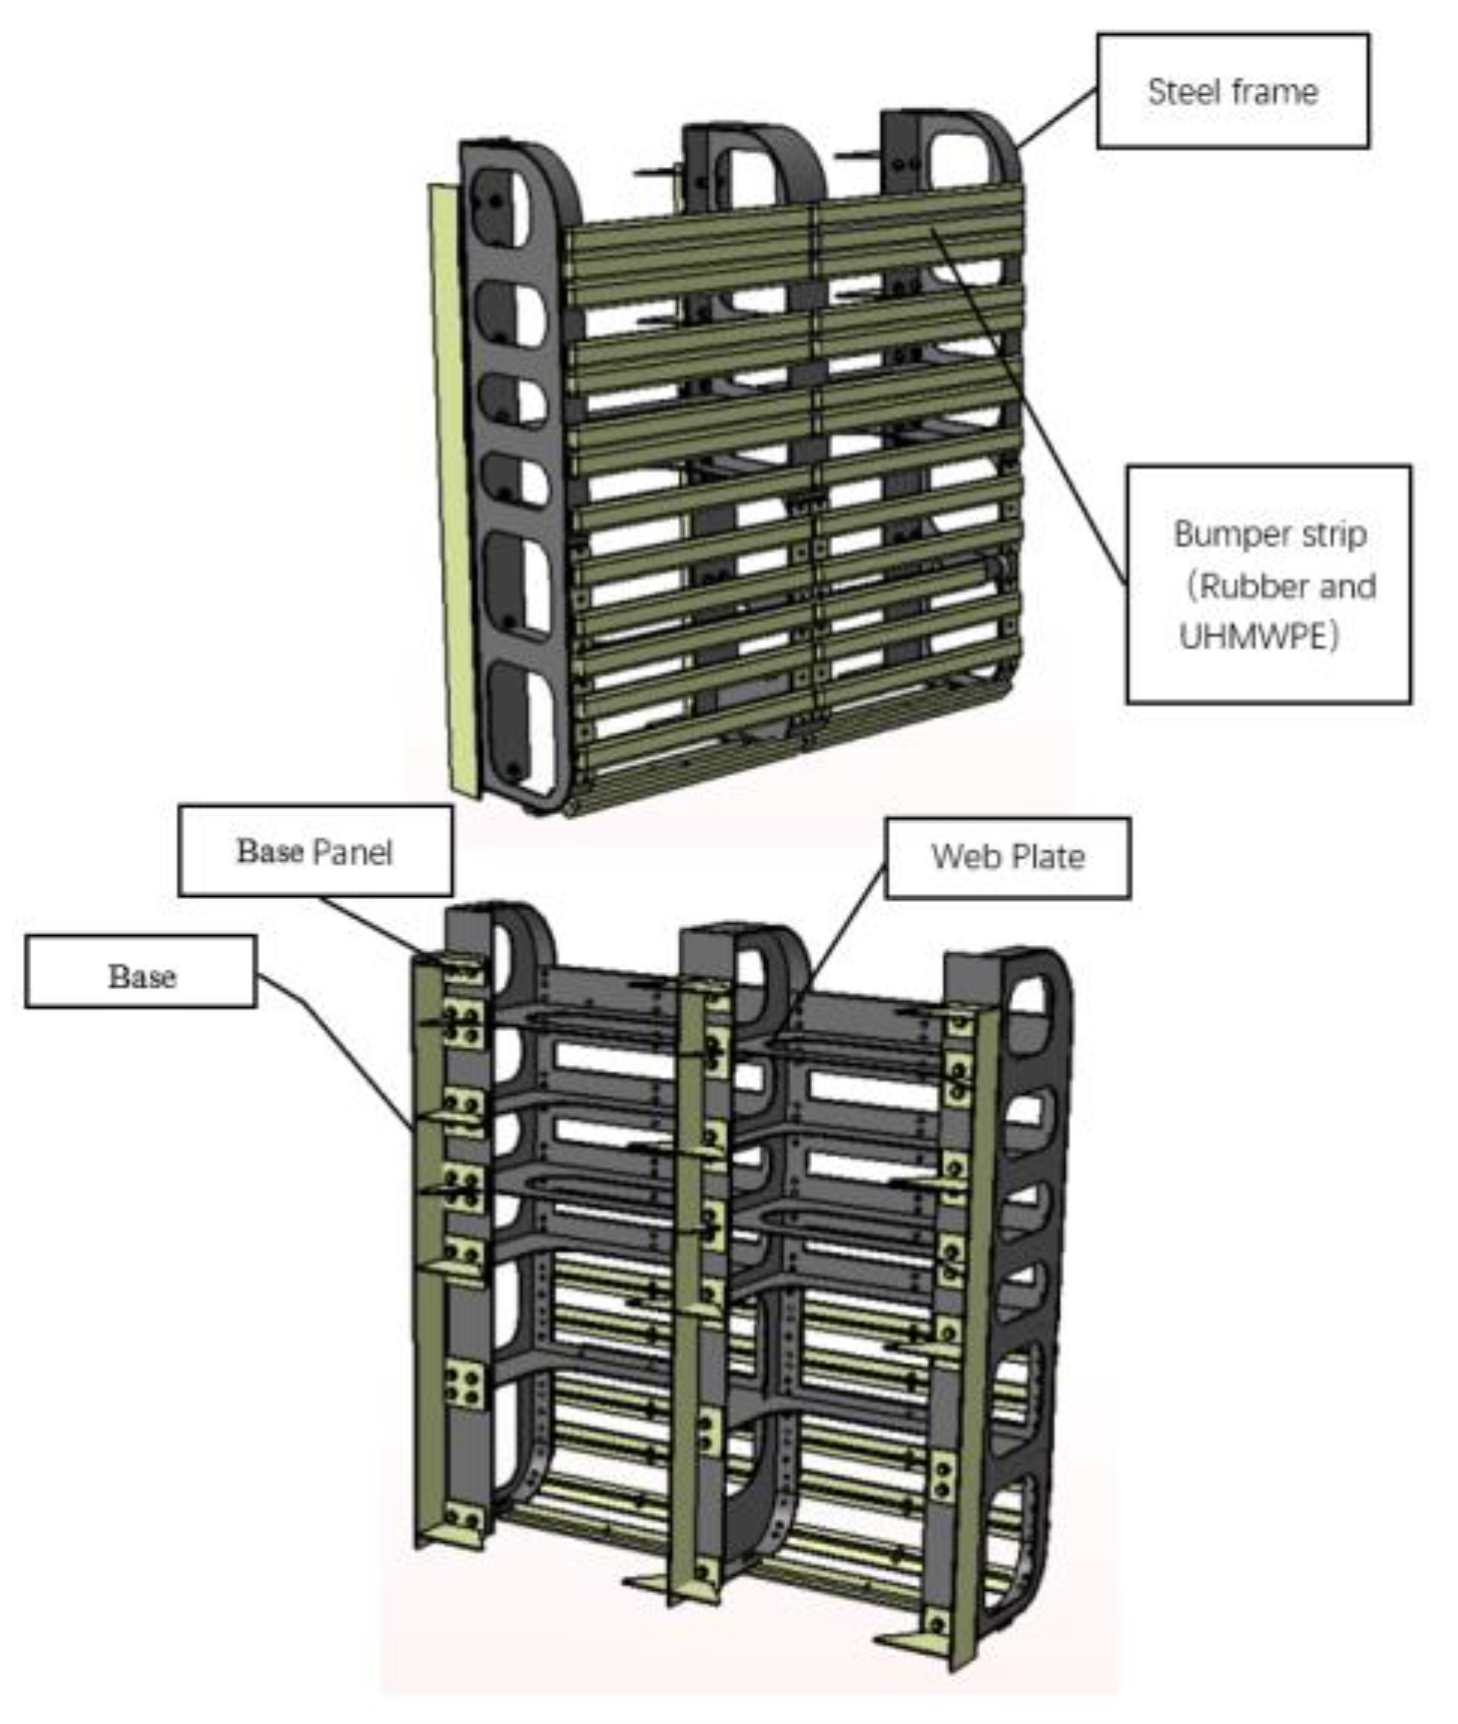
The collision device of a steel frame and a base, with the framework depicted in gray in the 3D diagram and the base shown in yellow, is shown in
Figure 2.
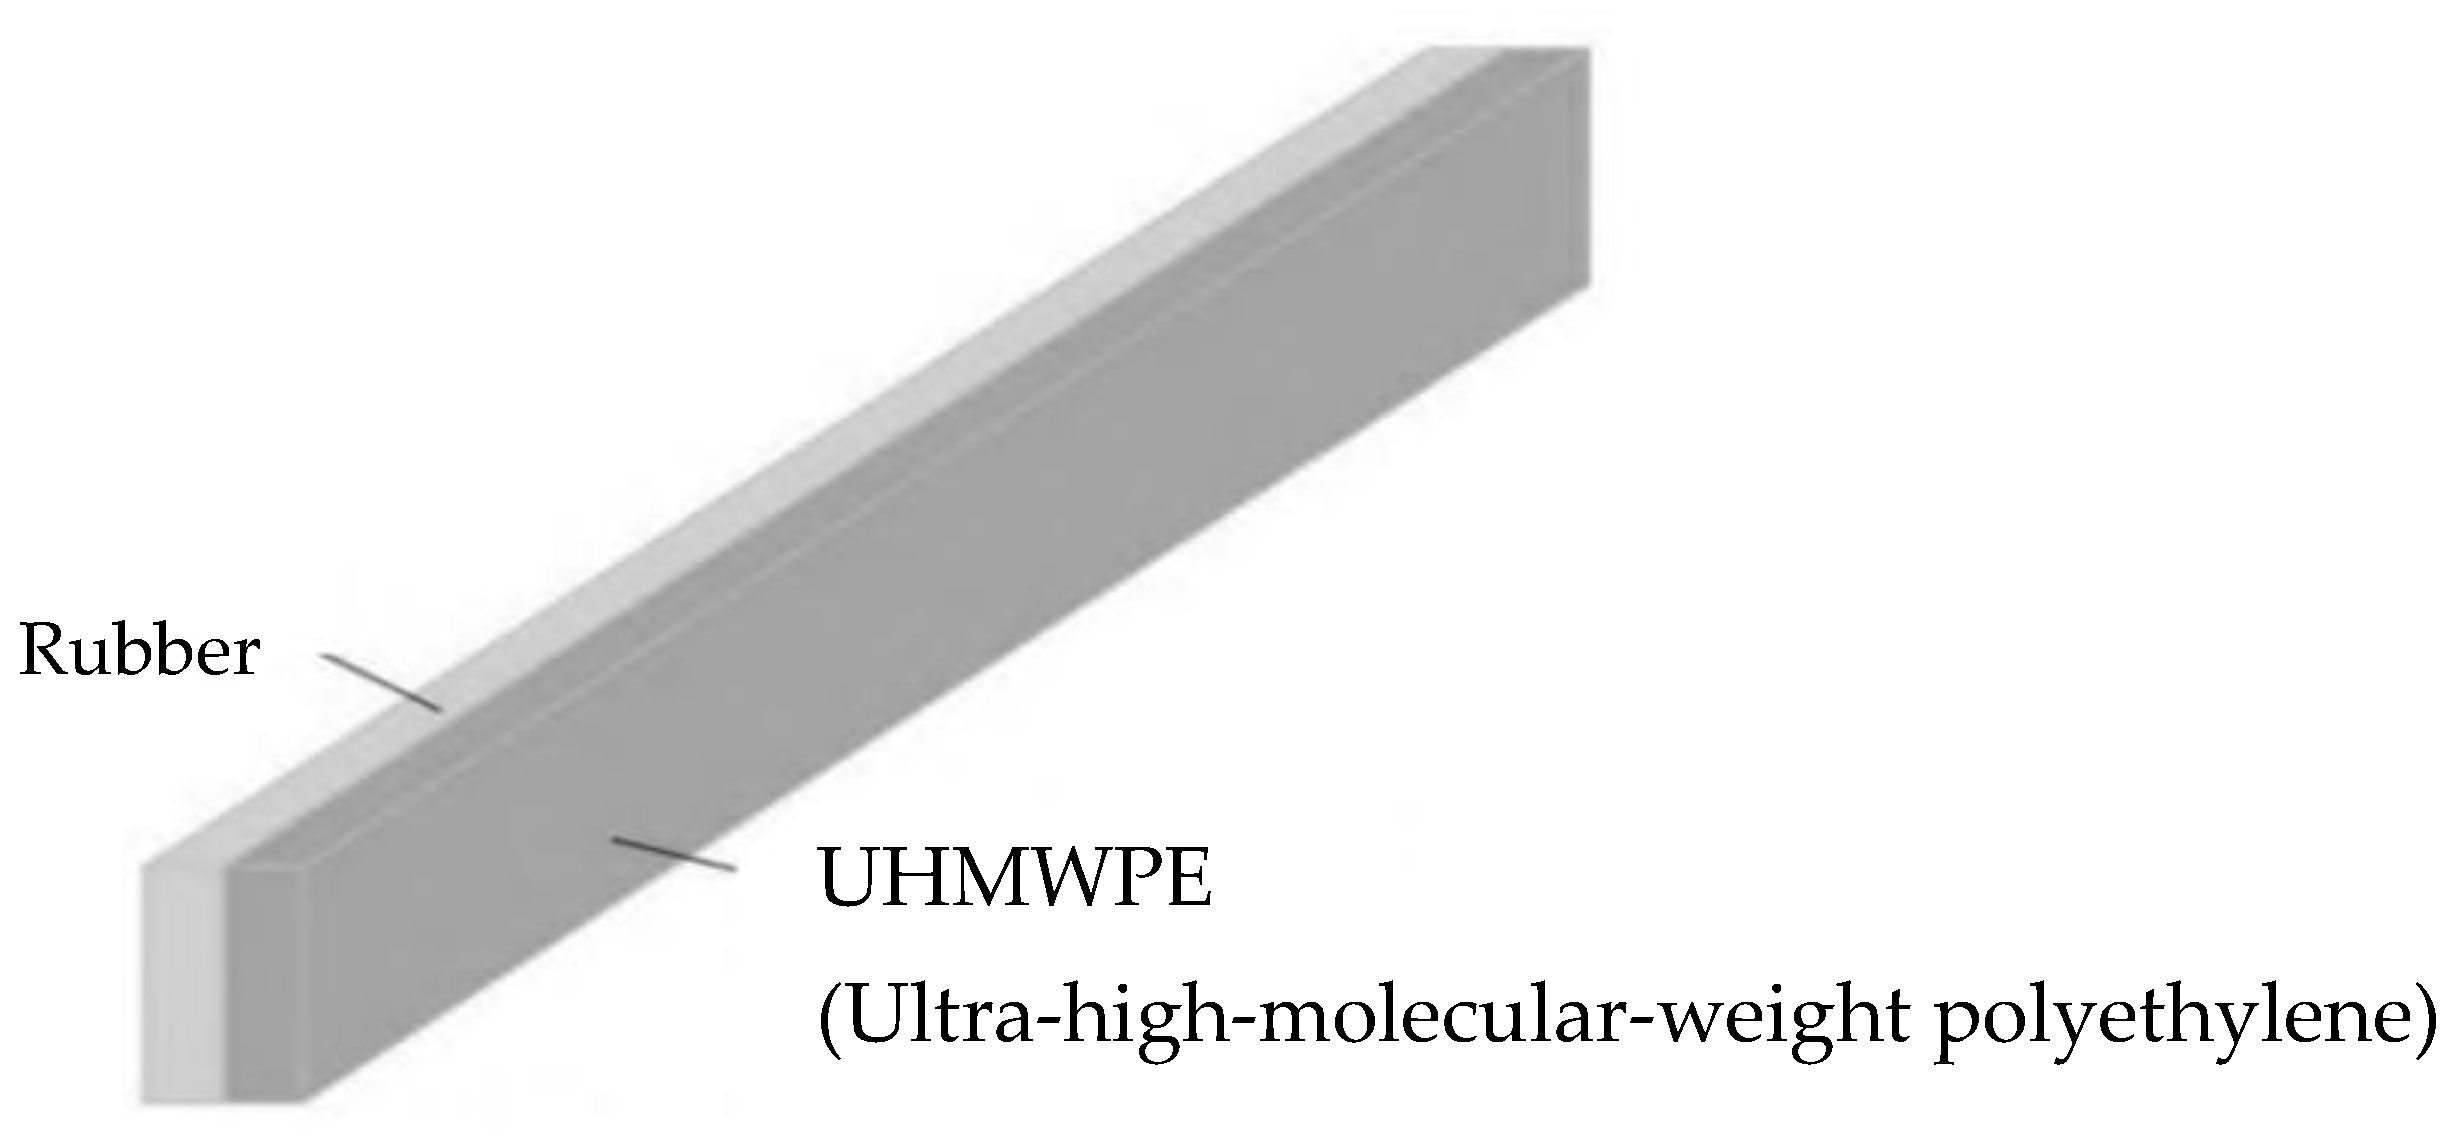
The device frame is connected to the base using bolts on the panel of the base. The base is welded to the floating drydock structure to secure the installation of the device. The bumper strip is installed on the surface of the device, with specific details shown in
Figure 3.
This article focuses more on protecting the dock walls inside floating drydocks and examines the impact of ship collisions on these protective structures. In this simulation, cubes with the same mass as those in the drop hammer experiment are used. They are set as rigid bodies and collide with the anti-collision device with equal energy. Simultaneously, the anti-collision device is designed to connect two layers of energy-absorbing soft materials with a steel frame using bolts; the steel frame is bolted to a base that is welded to the floating drydock. The floating drydock’s structural strength is significantly greater than the stiffness of the anti-collision structure, so the base is fixed rigidly. In finite-element calculations, the computation time required for solid elements is much longer than that for shell elements. Therefore, in this calculation, the rear steel frame model was simplified into a panel structure.
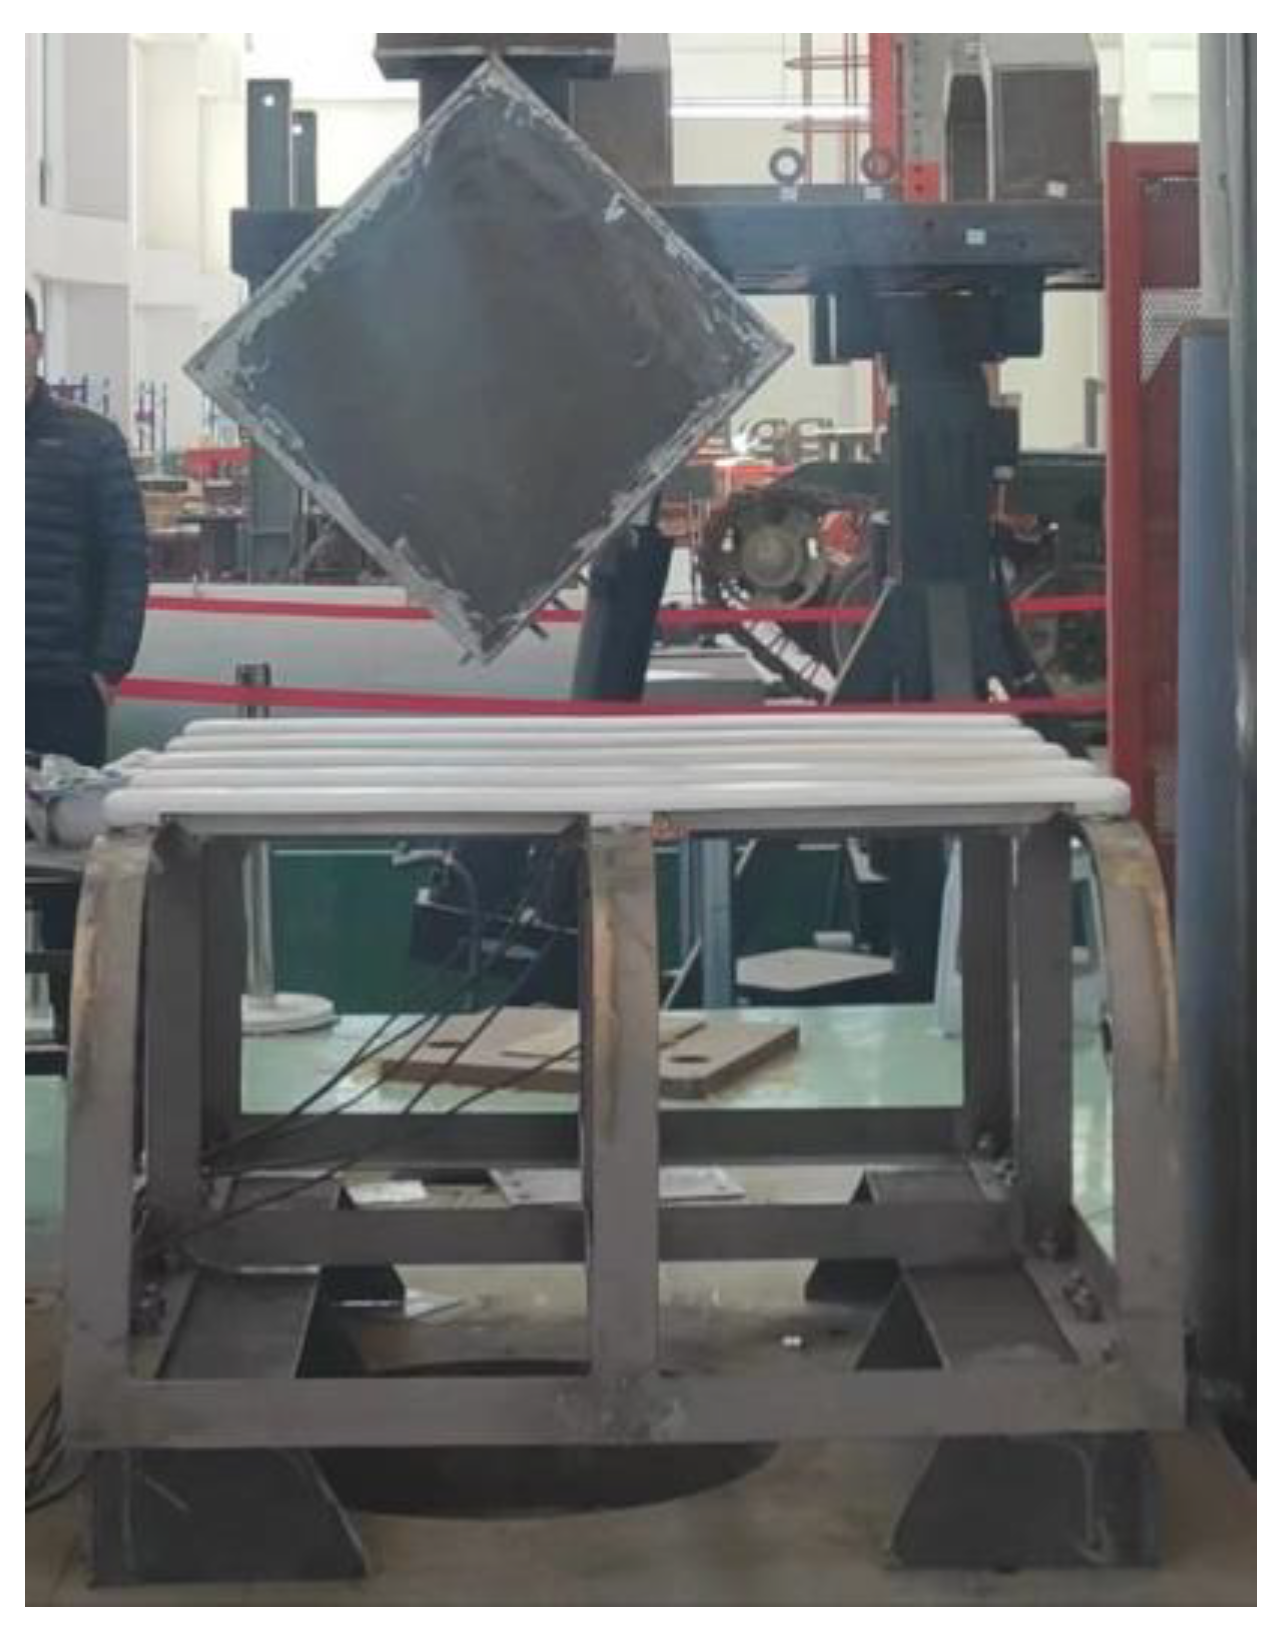
The simulation conditions are evaluated based on the results of the drop hammer test. During the drop hammer test, to accurately replicate the structural deformation of the framework and damage carried out on the protective device after the collision, the physical test model is consistent with the model of the anti-collision device used on ships. The physical experiment process is shown in
Figure 4.
In summary, the impact simulation geometric model is shown in
Figure 5.
2.3. Finite-Element Modeling
- (1)
Device
As mentioned earlier, the device is divided into a device frame and a base; at the panel of the base, the device frame and the base are connected with bolts. The base and the longitudinal bulkhead of the floating drydock are fixed by welding, thus realizing the installation of the device. The bumper strip is installed on the bumper frame, as shown in
Figure 6.
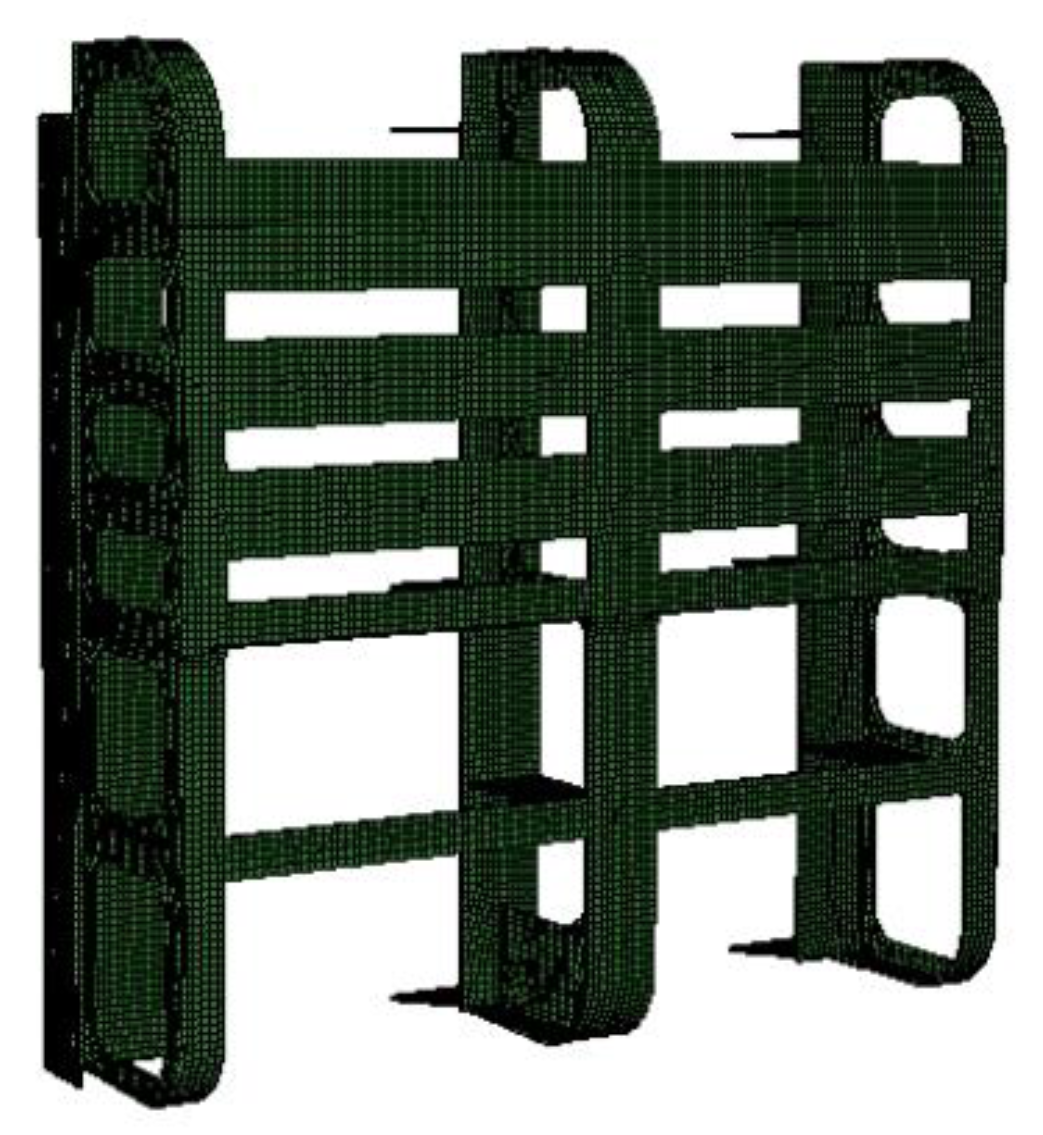
The finite-element model of the device is shown in
Figure 7.
- (2)
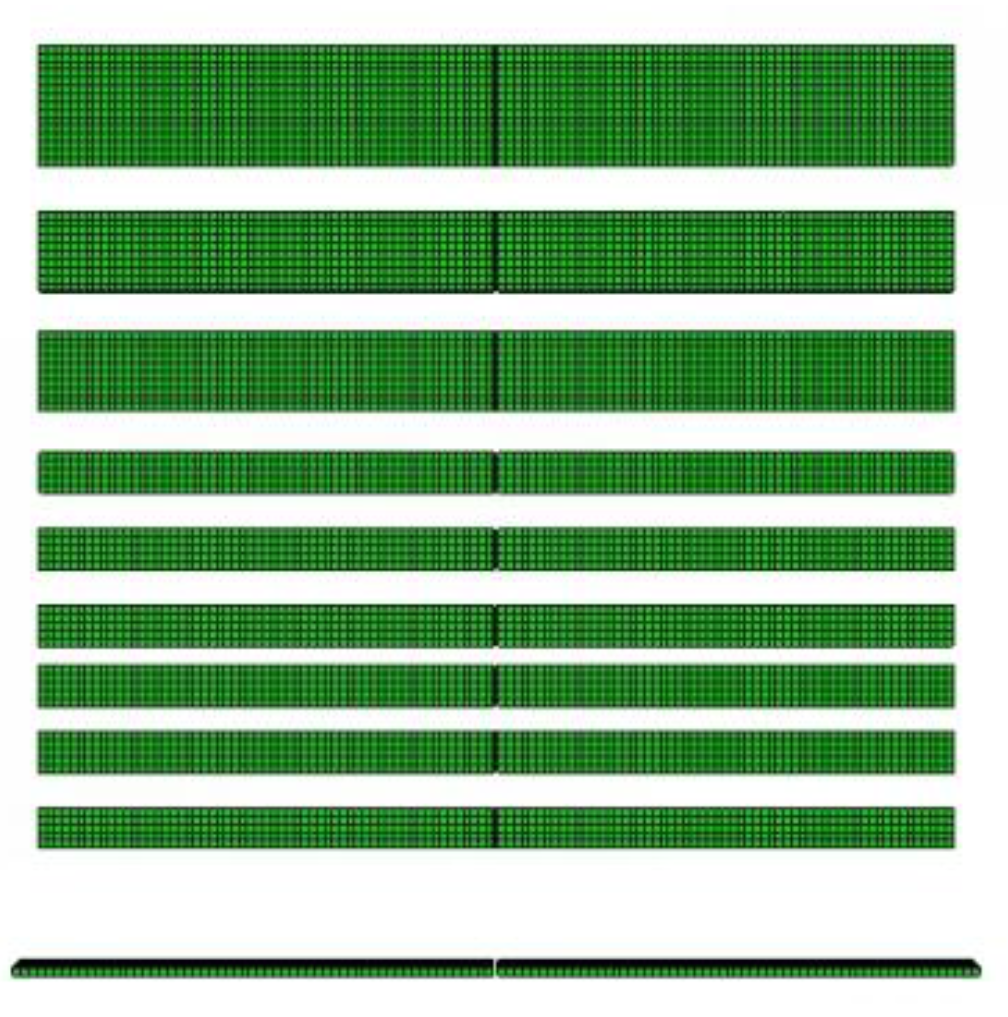
Rubber and UHMWPE
In this calculation, rubber and UHMWPE (ultra-high-molecular-weight polyethylene) are installed on the device as anti-collision materials, in which the thickness of the rubber is 20 mm, the thickness of UHMWPE is 20 mm, the width of both kinds of bumper strips is 100 mm, and the bumper strips are simulated by solid units in the finite-element calculation. The finite-element model is shown in
Figure 8.
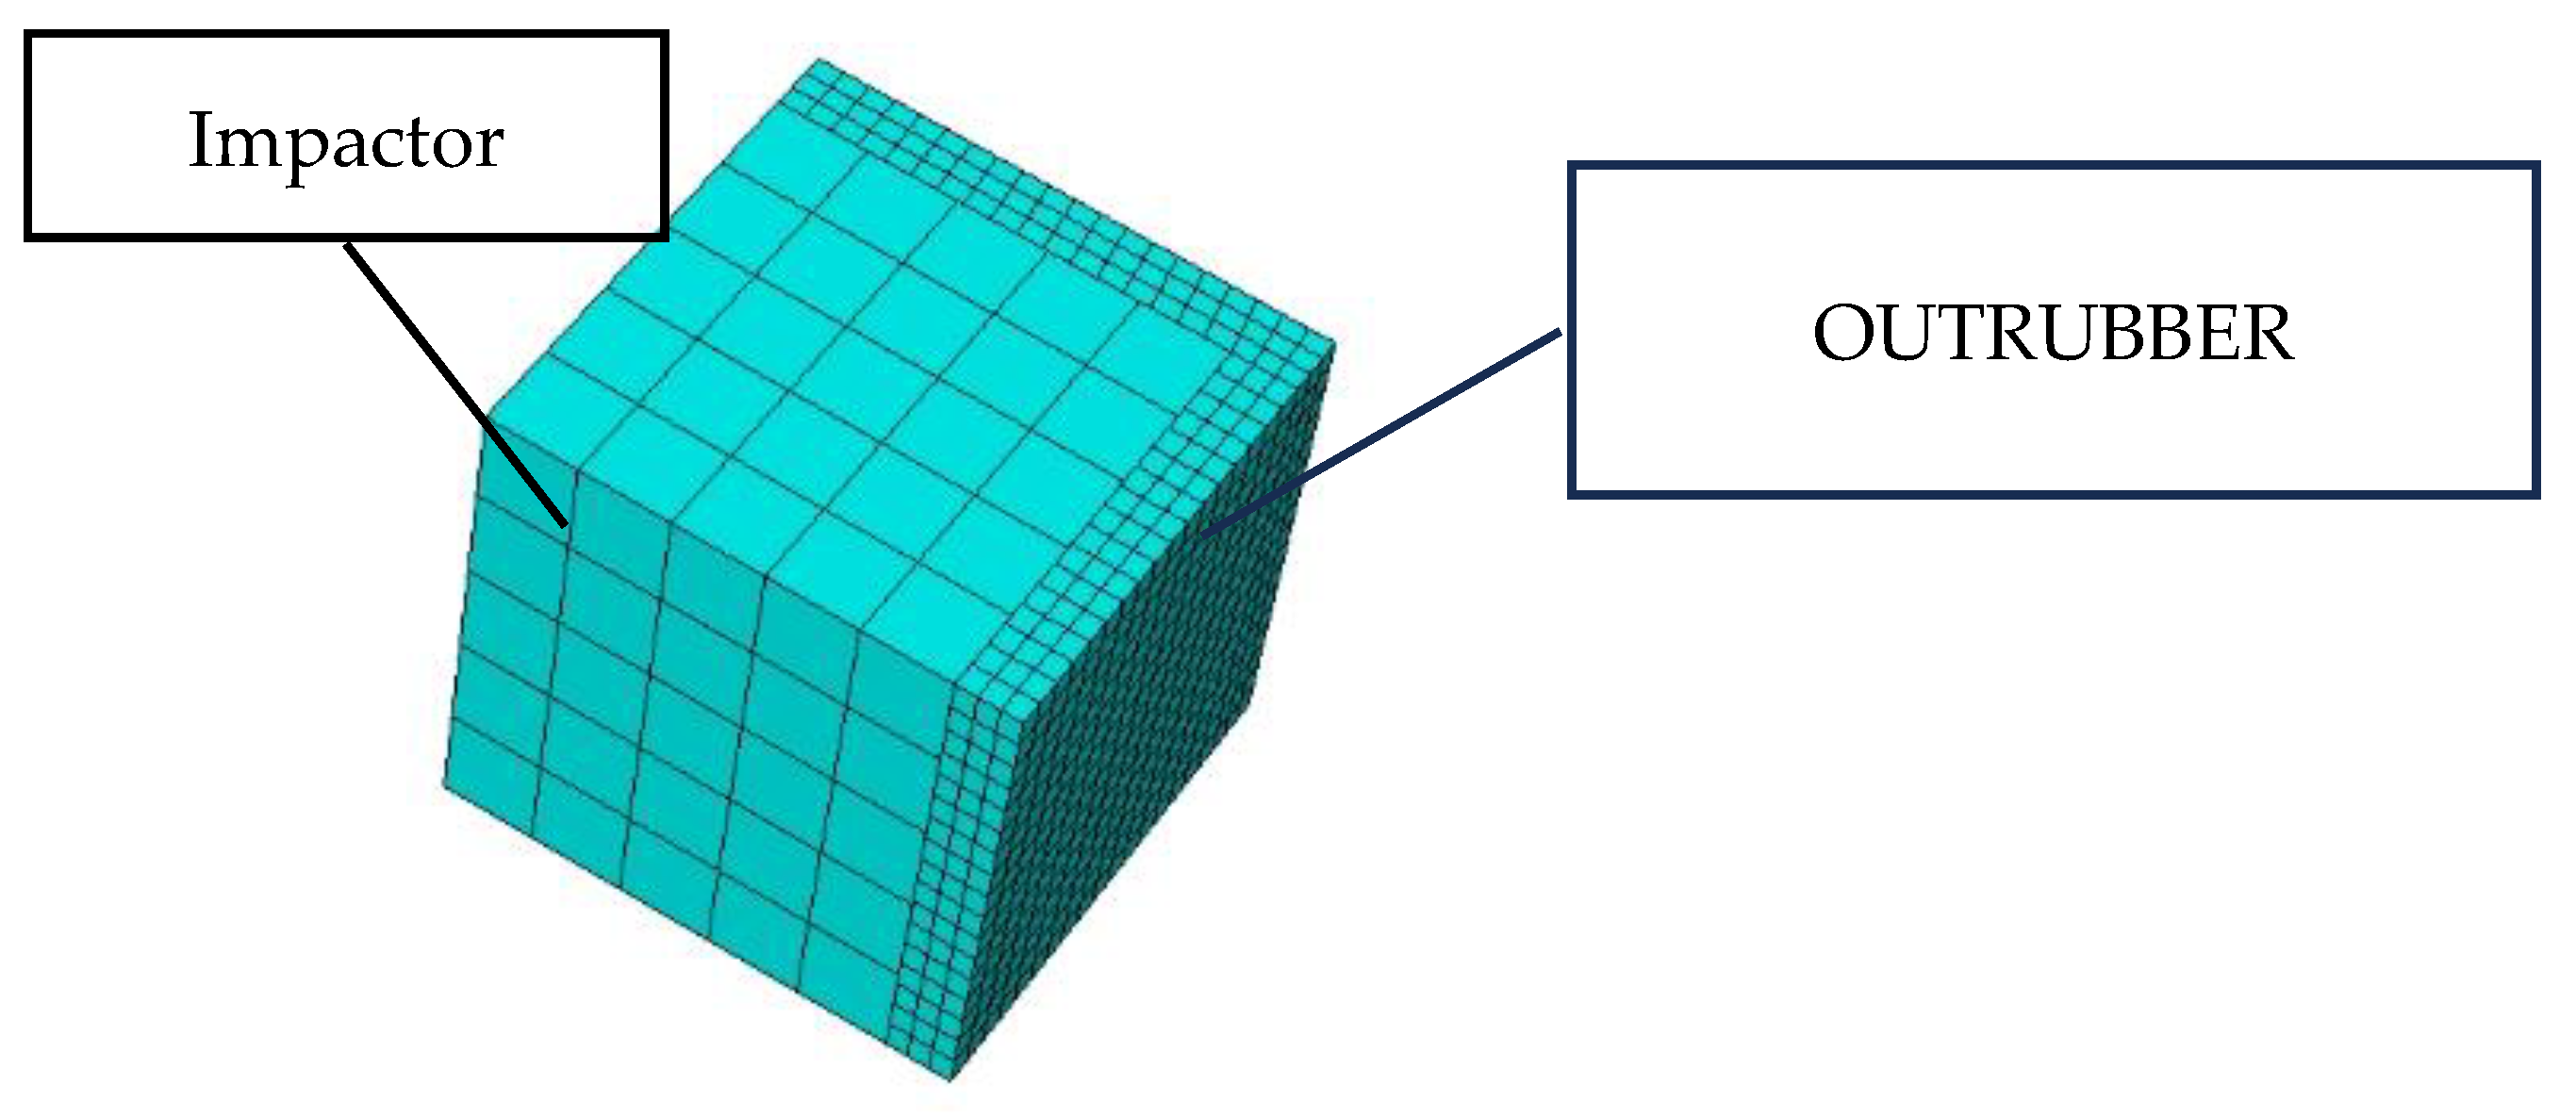
Due to the complexity of the hull structure, this paper mainly studies the performance of anti-collision materials. To save on the calculation time, the hull (collision ship) is replaced by a square body with a mass of 235 t. The exterior of the hull is installed with 75mm of anti-collision rubber. Solid models are used for both the impactor and the rubber. The finite-element model is shown in
Figure 9.
2.4. Relevant Parameters and Calculation Conditions
2.4.1. Device
The material selected for the structure of the device is Q355 steel, the modulus of elasticity is E = 210 GPa, material density is , Poisson’s ratio is , and yield strength is .
2.4.2. Rubber
The mechanical properties of rubber materials are relatively complex, usually described by a hyperelastic model. The hyperelastic model is mostly image-only, and part of it is a thermodynamic statistical model, which can only approximately describe the mechanical properties of rubber materials when the model takes a finite number of terms; thus, the hyperelastic model with a finite number of terms must be fitted with as many types of parameters as possible in order to obtain more reliable parameters. Commonly used models are the Mooney–Riviln model, the Ogden model, and Vander Waals model, etc. The latter two models can more accurately describe the material’s mechanical properties, but at the same time, more test data are required, and it is difficult to obtain better results with less test data.
The intrinsic model of rubber is commonly used as the MOONEY model, which has a strain of energy as follows:
In the formula, I1 and I2 for the first and second strain invariants and and are the rubber material constants, which can be taken as = 7 E/48, = E/48, and E for the initial elastic modulus of rubber materials. The typical rubber modulus of elasticity can be taken as 2~10 MPa.
In this paper, the hardness of the rubber bumper strip was 40. It was installed on the anti-collision device of the dry dock. The hardness of the anti-collision rubber was 60. It was installed on the impactor. The specific parameters are listed in
Table 2.
2.4.3. UHMWPE
Based on the stress–strain curves at the three tensile rates, the relevant parameters obtained from the parametric fitting of the J-C eigenstructure equation are shown in
Table 3.
2.4.4. Boundary Condition Constraints
Based on the experimental conditions, the boundary conditions of the model are as follows:
- (1)
The base of the device is welded to the floating drydock structure, so the rear boundary of this finite-element model is fully fixed, meaning all six degrees of freedom for nodes on the rear boundary are set to zero.
- (2)
The bumper strip is connected to the device with bolts. To simplify the calculations and minimize their impact on the results, in this calculation, the ends and the middle part of the bumper strip are bonded to the device.
- (3)
The impact of the object and anti-collision rubber are also bonded together.
In the ABAQUS program, the role of the contact between different moving objects is obtained by defining the surfaces that may be in contact, specifying the type of contact, and some parameters related to the contact. This ensures that the contact interface is not penetrated during the calculation process of the program, and the role of friction is taken into account in the relative motion of the contact interface.
The fully automated contact analysis functions of the ABAQUS program are user-friendly and powerful. Various existing contact types can solve the following contact problems: general contact, surface-to-surface contact (explicit), self-contact (explicit), fluid cavity, fluid exchange, and other contact problems. In the collision operation involved in this report, the collision avoidance material and the steel frame structure acted as deformable bodies and collided with the impacting object modeled by a rigid body. General contact was used in this paper for the calculation.
2.4.5. Calculation Conditions
The numerical simulation calculation of the collision buffering performance of collision prevention devices under typical operating conditions includes four working conditions, which are as follows:
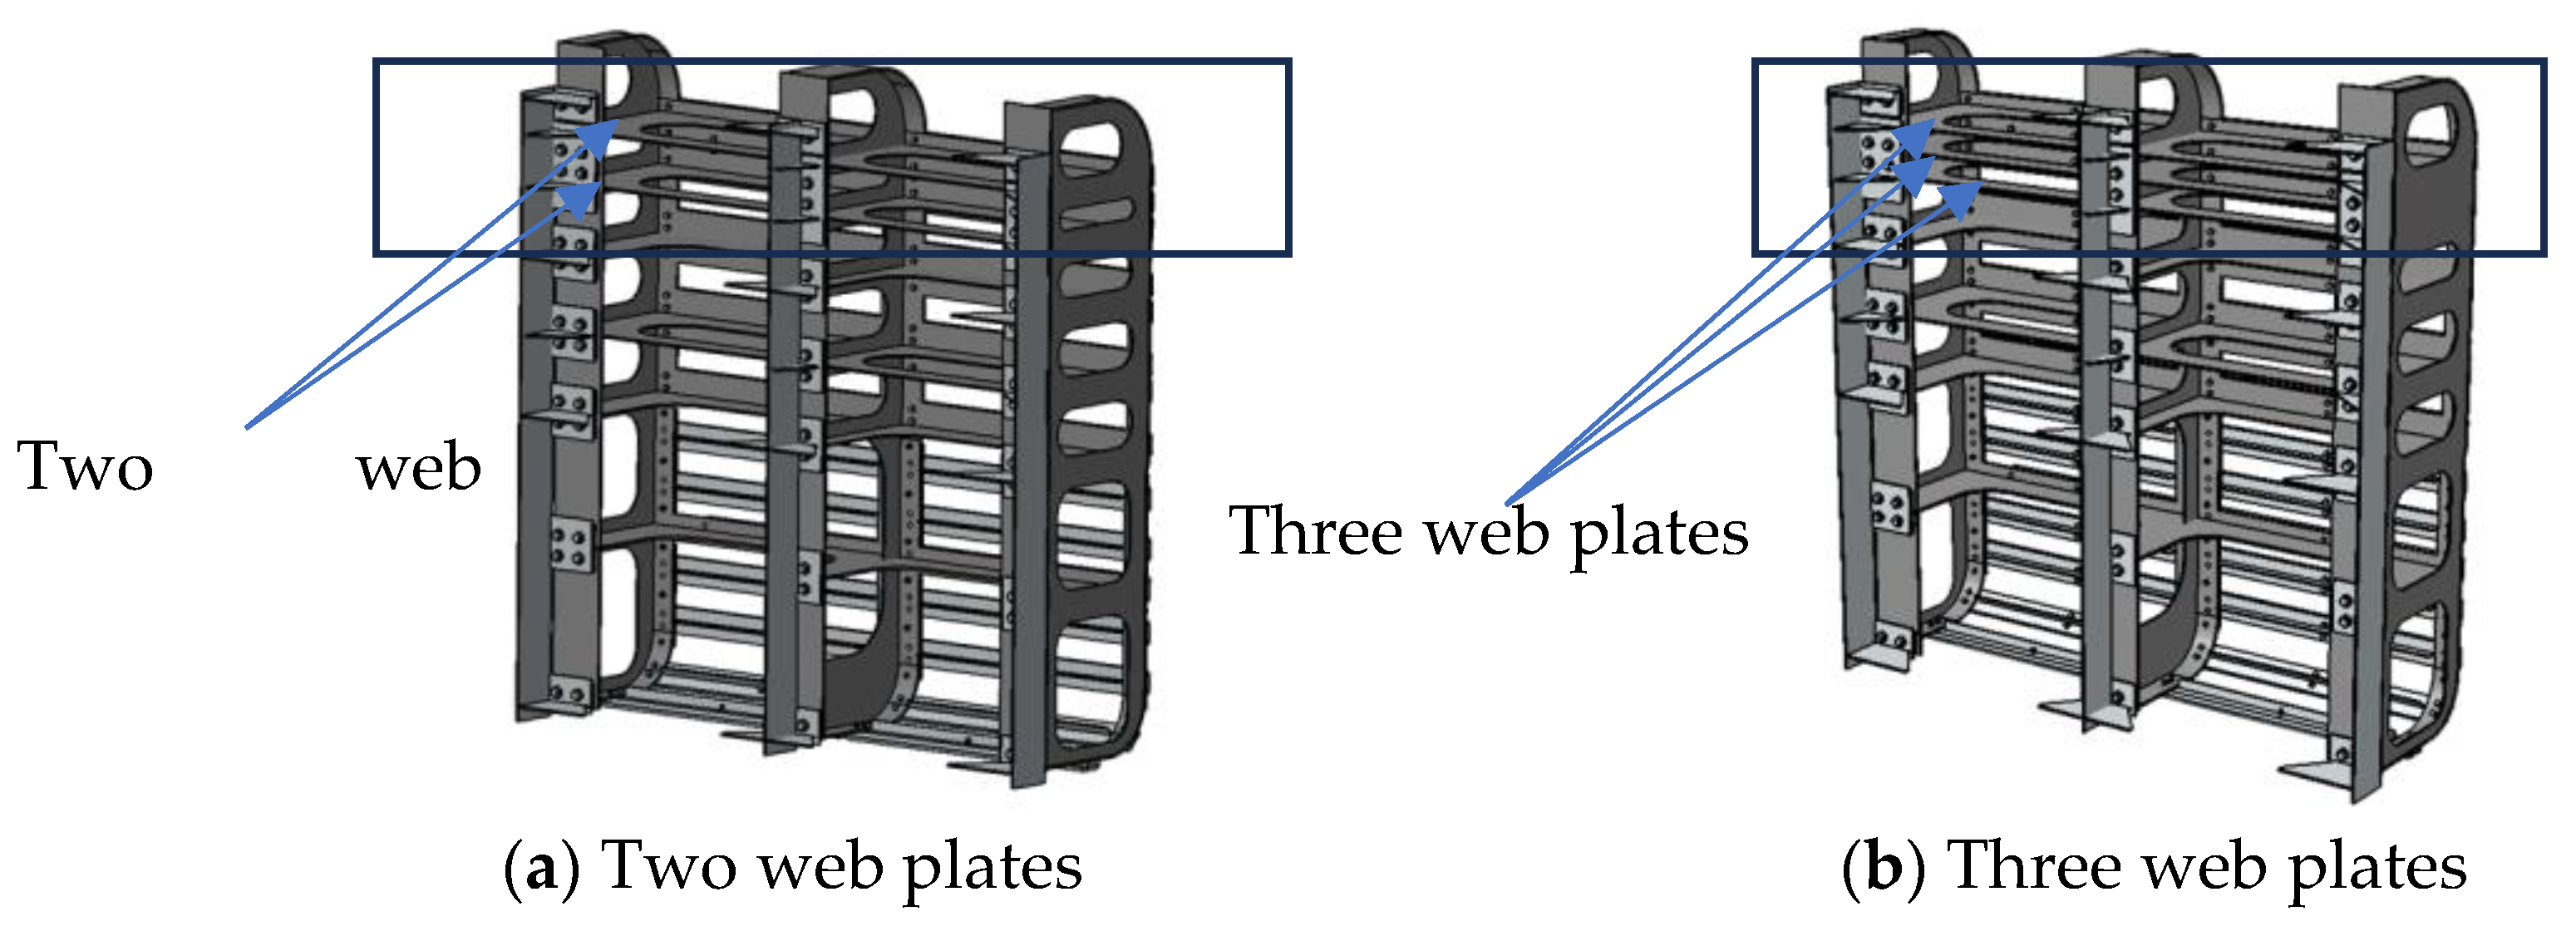
Working Condition I: the crash bar is 20 mm UHMWPE + 20 mm rubber, the steel frame upon impact has two web plates (as shown in
Figure 10a), the steel frame material is Q355 steel, and the impact speed is 0.25 m/s.
Working Condition II: Different from working condition I, the impact speed is 0.3 m/s.
Working Condition III: Different from working condition I, the steel frame upon impact has three web plates (as shown in
Figure 10b).
Working Condition IV: Different from working condition III, the impact speed is 0.3 m/s.
3. Numerical Simulation Results
Based on the design scheme model, specific collision scenarios were simulated for the equipment under four different operating conditions, and the simulation analysis results were obtained.
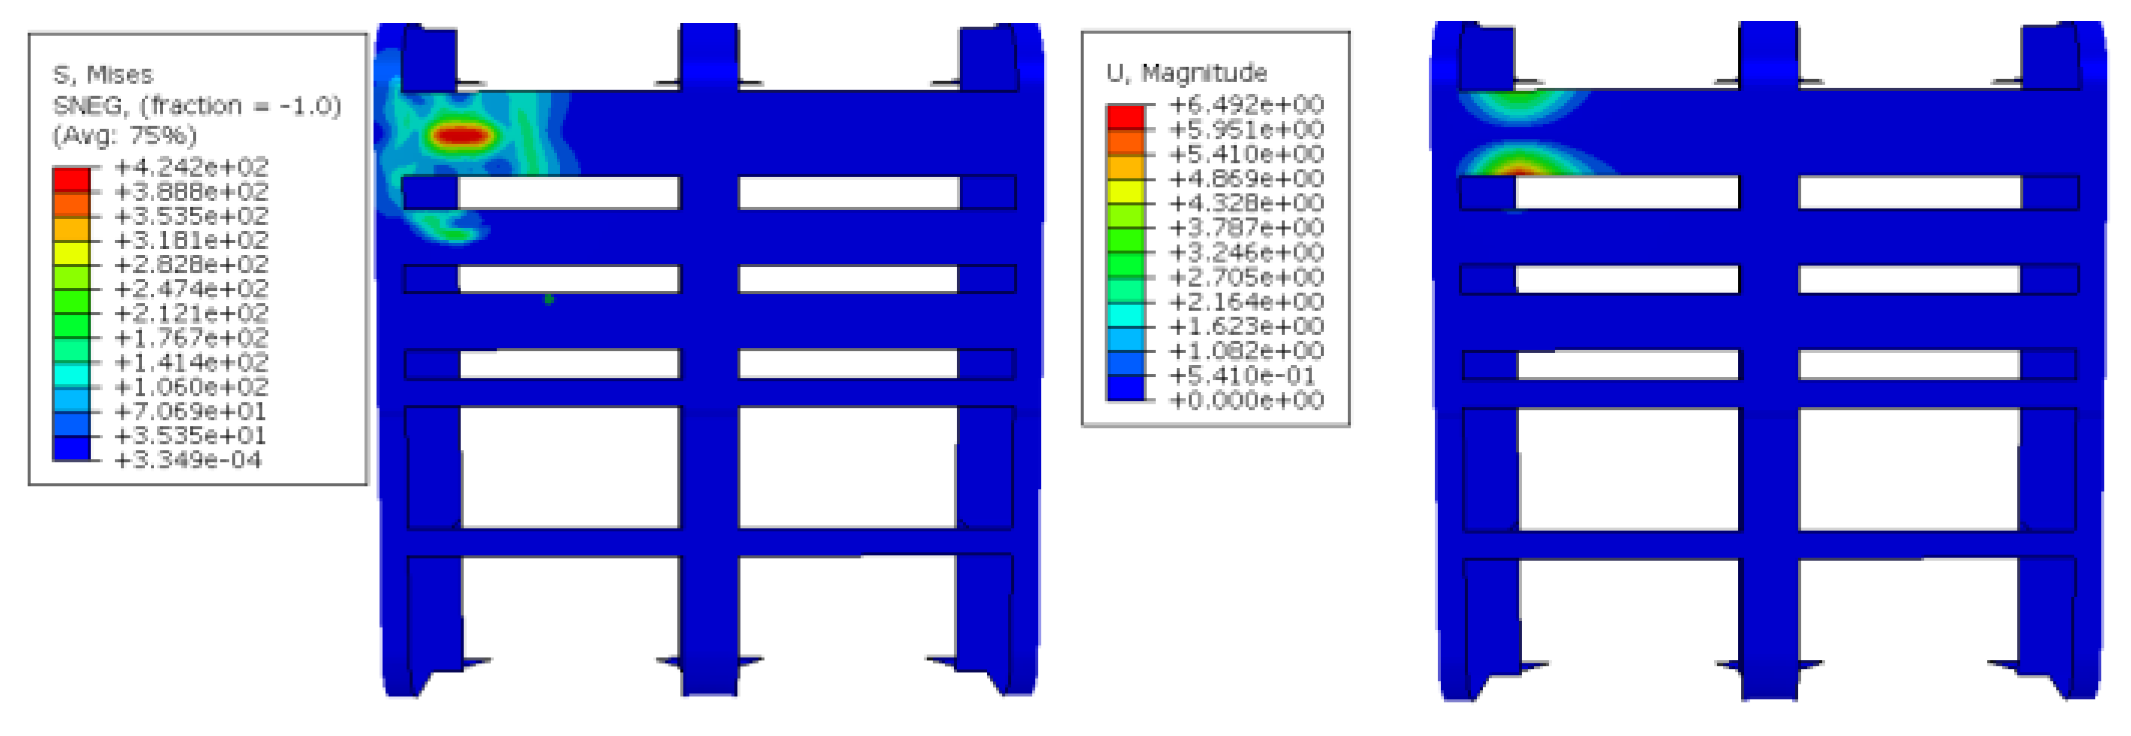
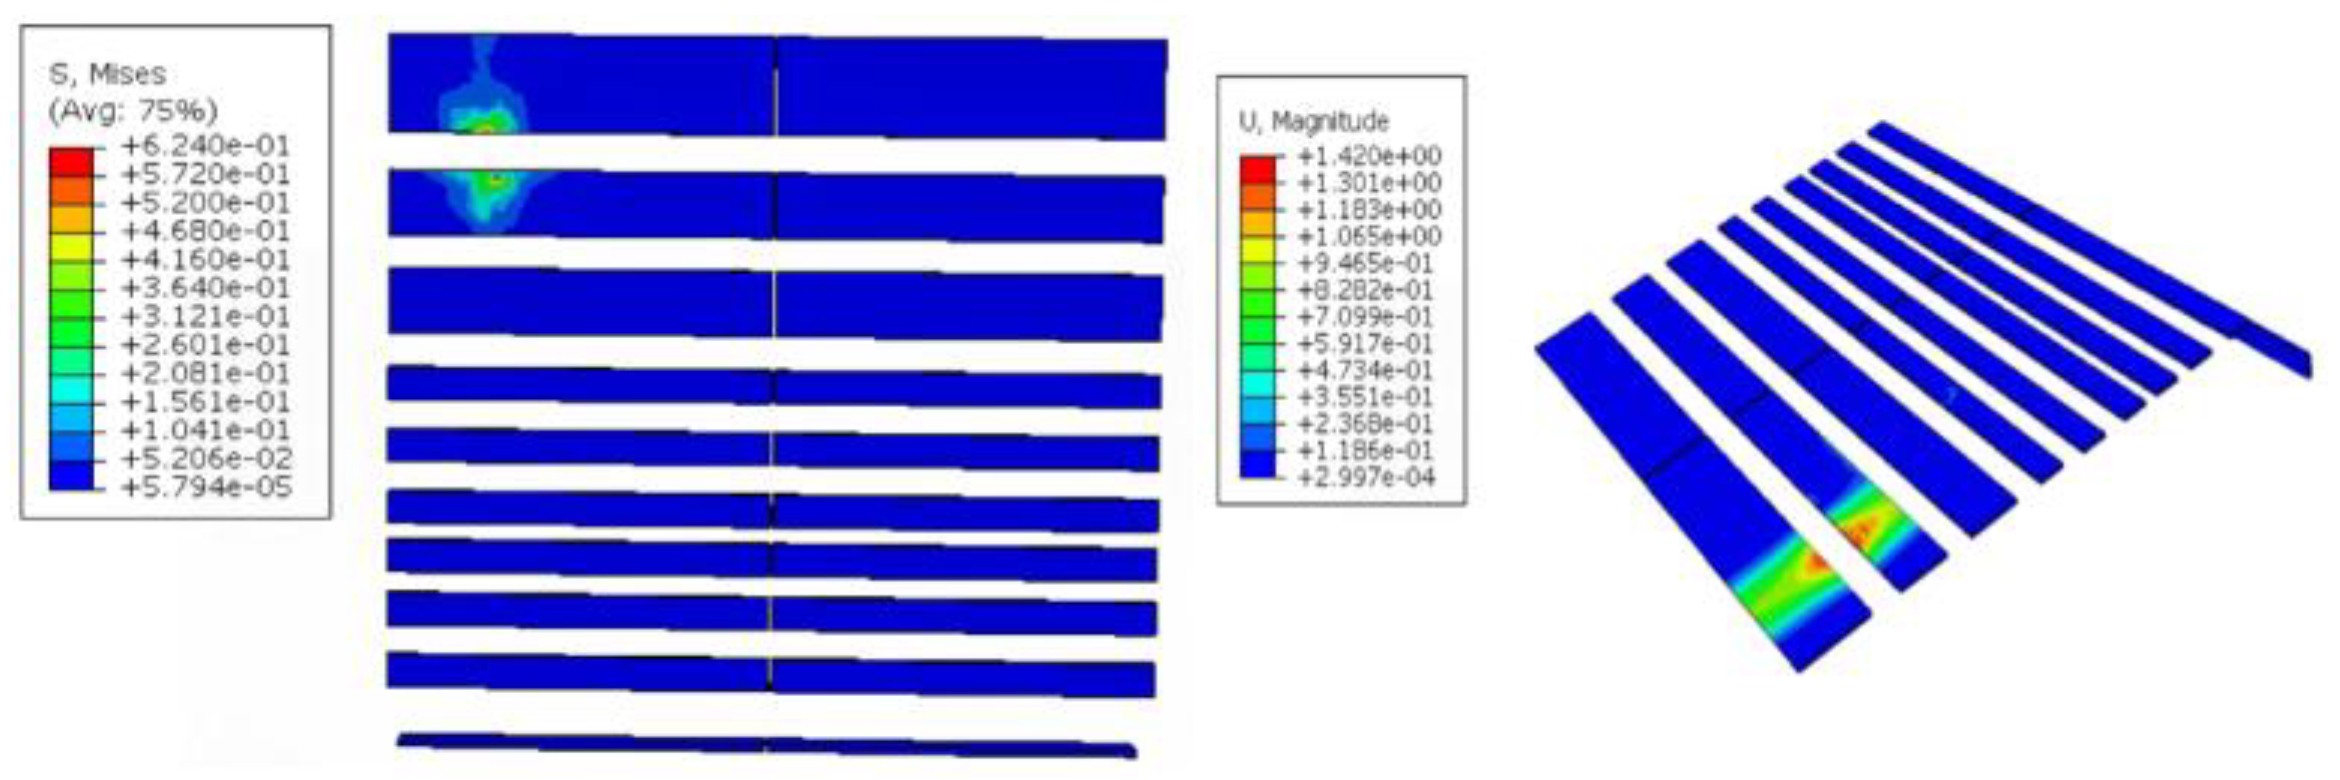
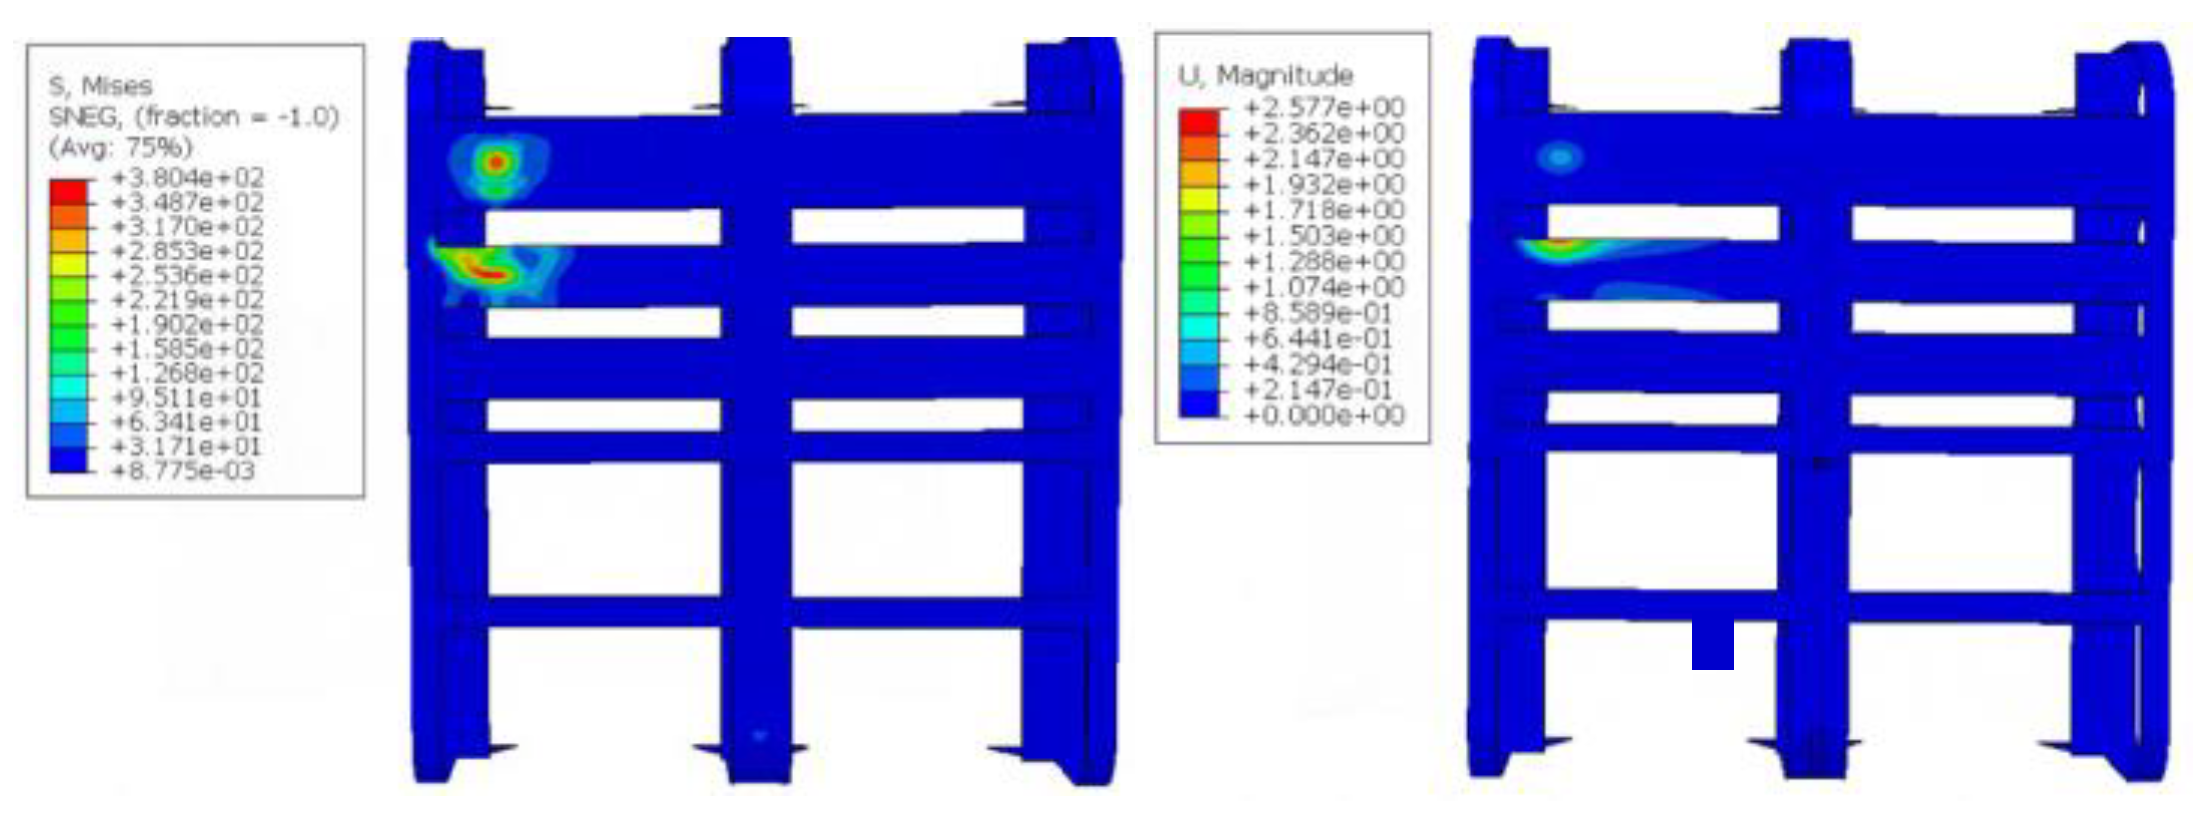
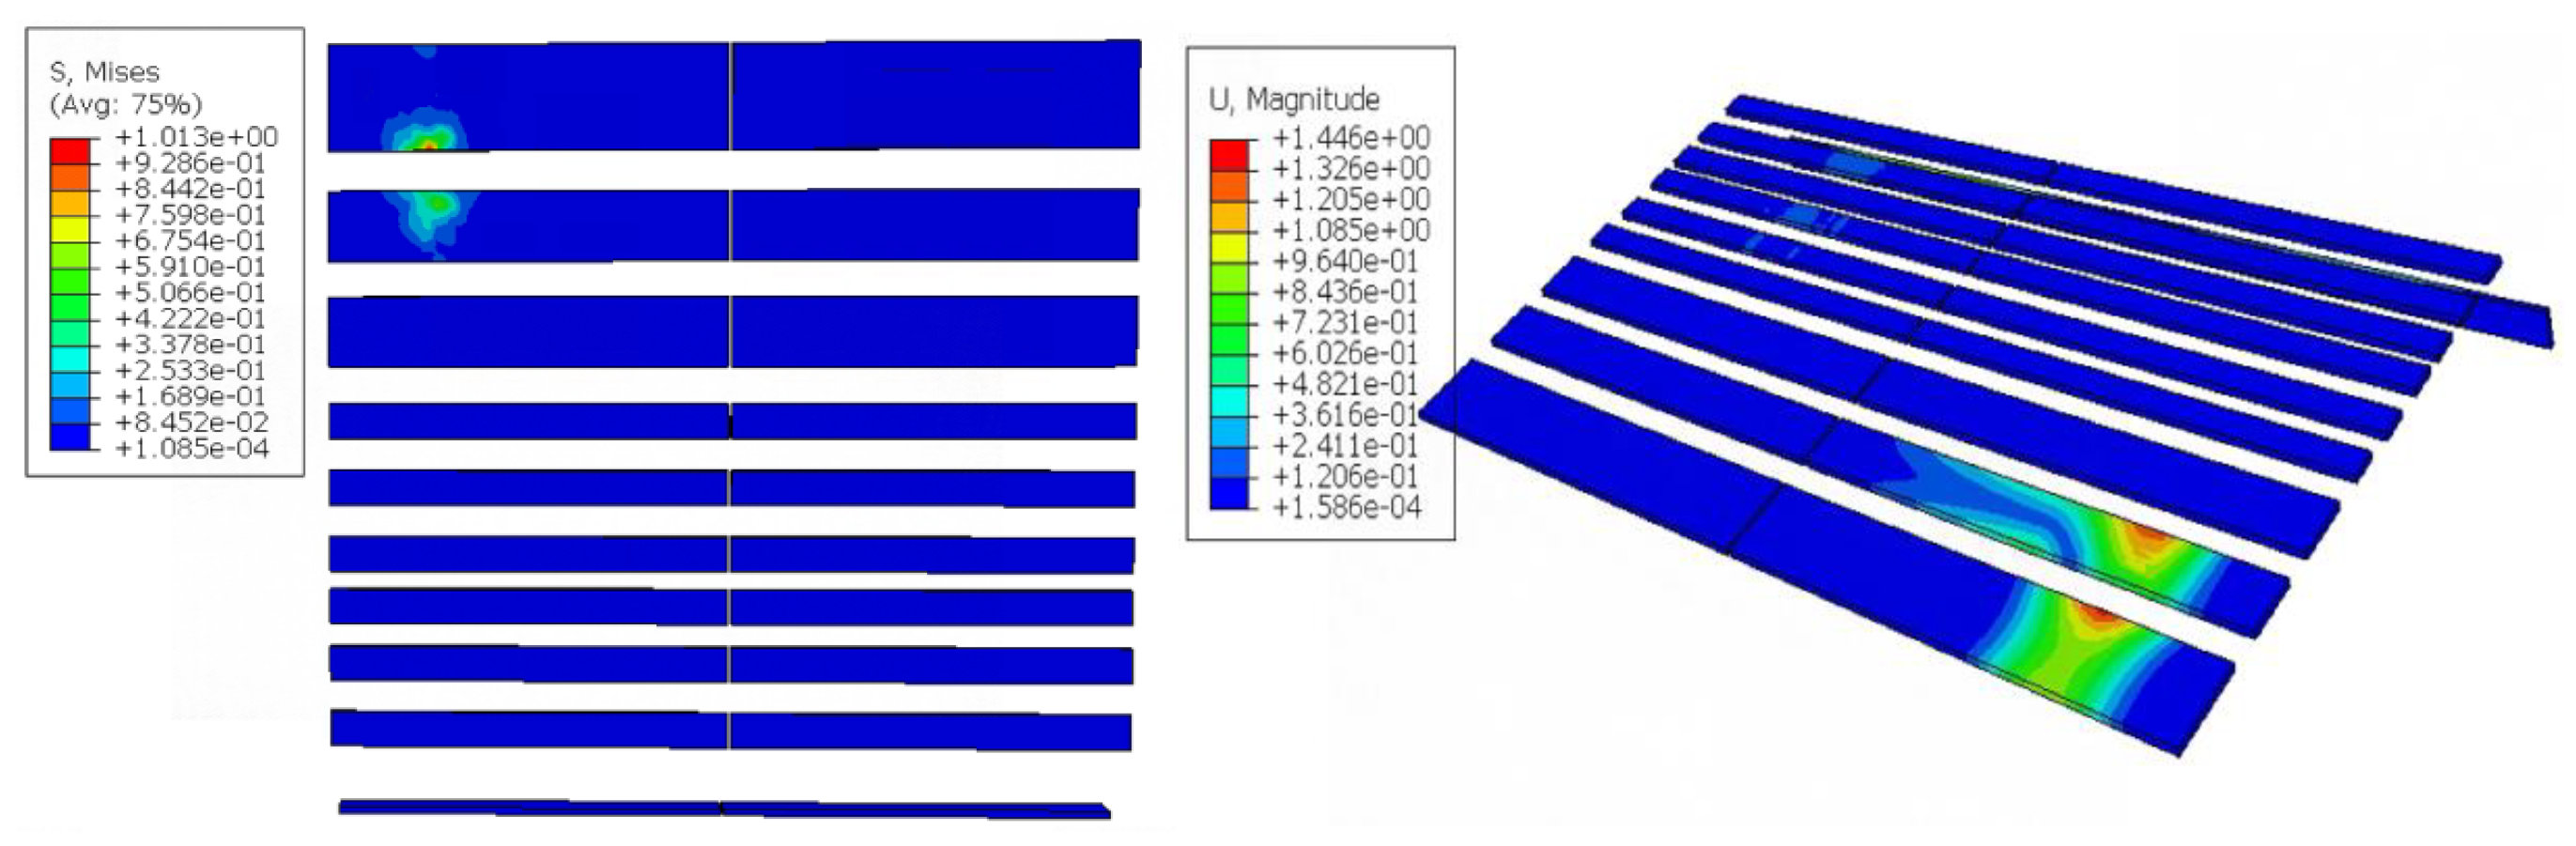
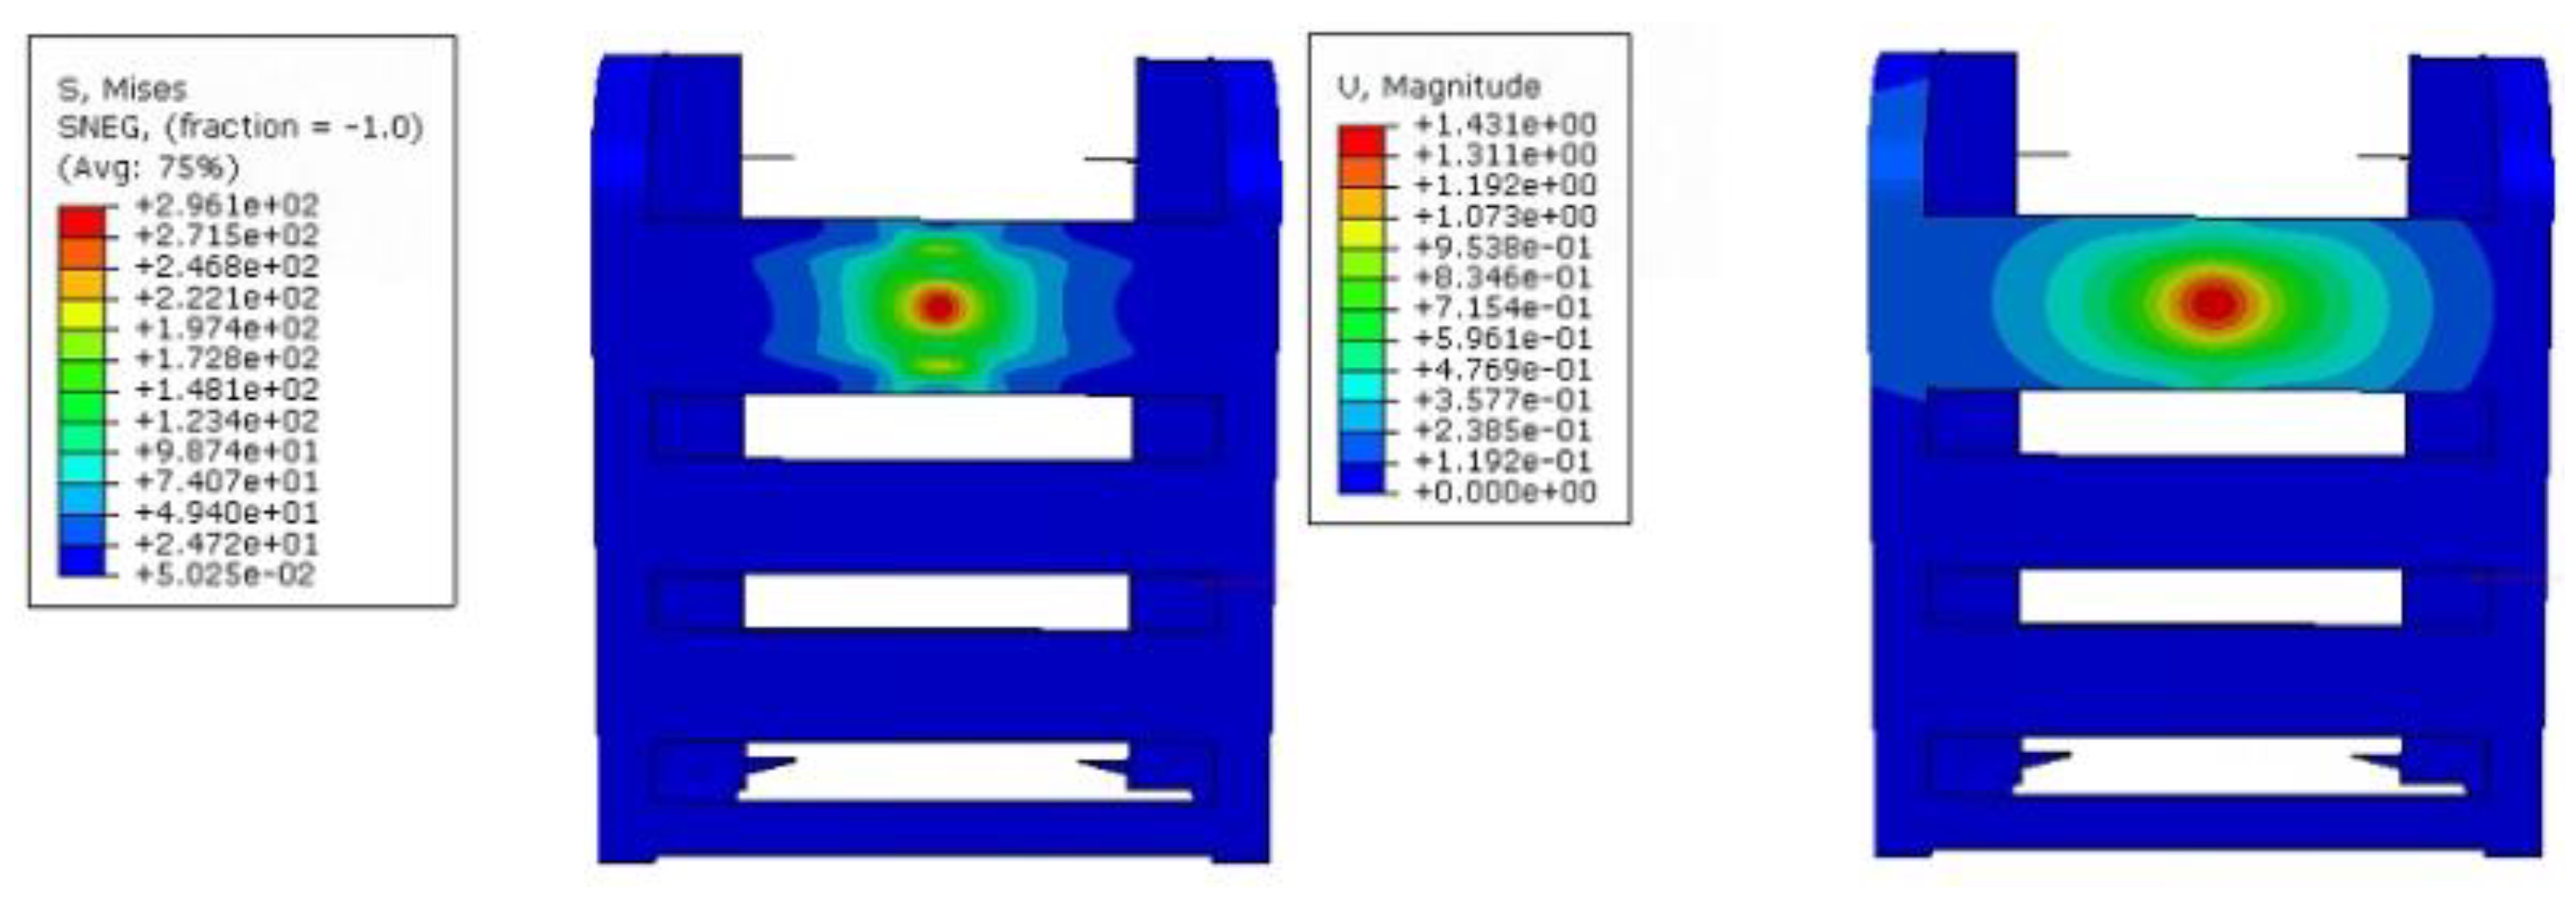
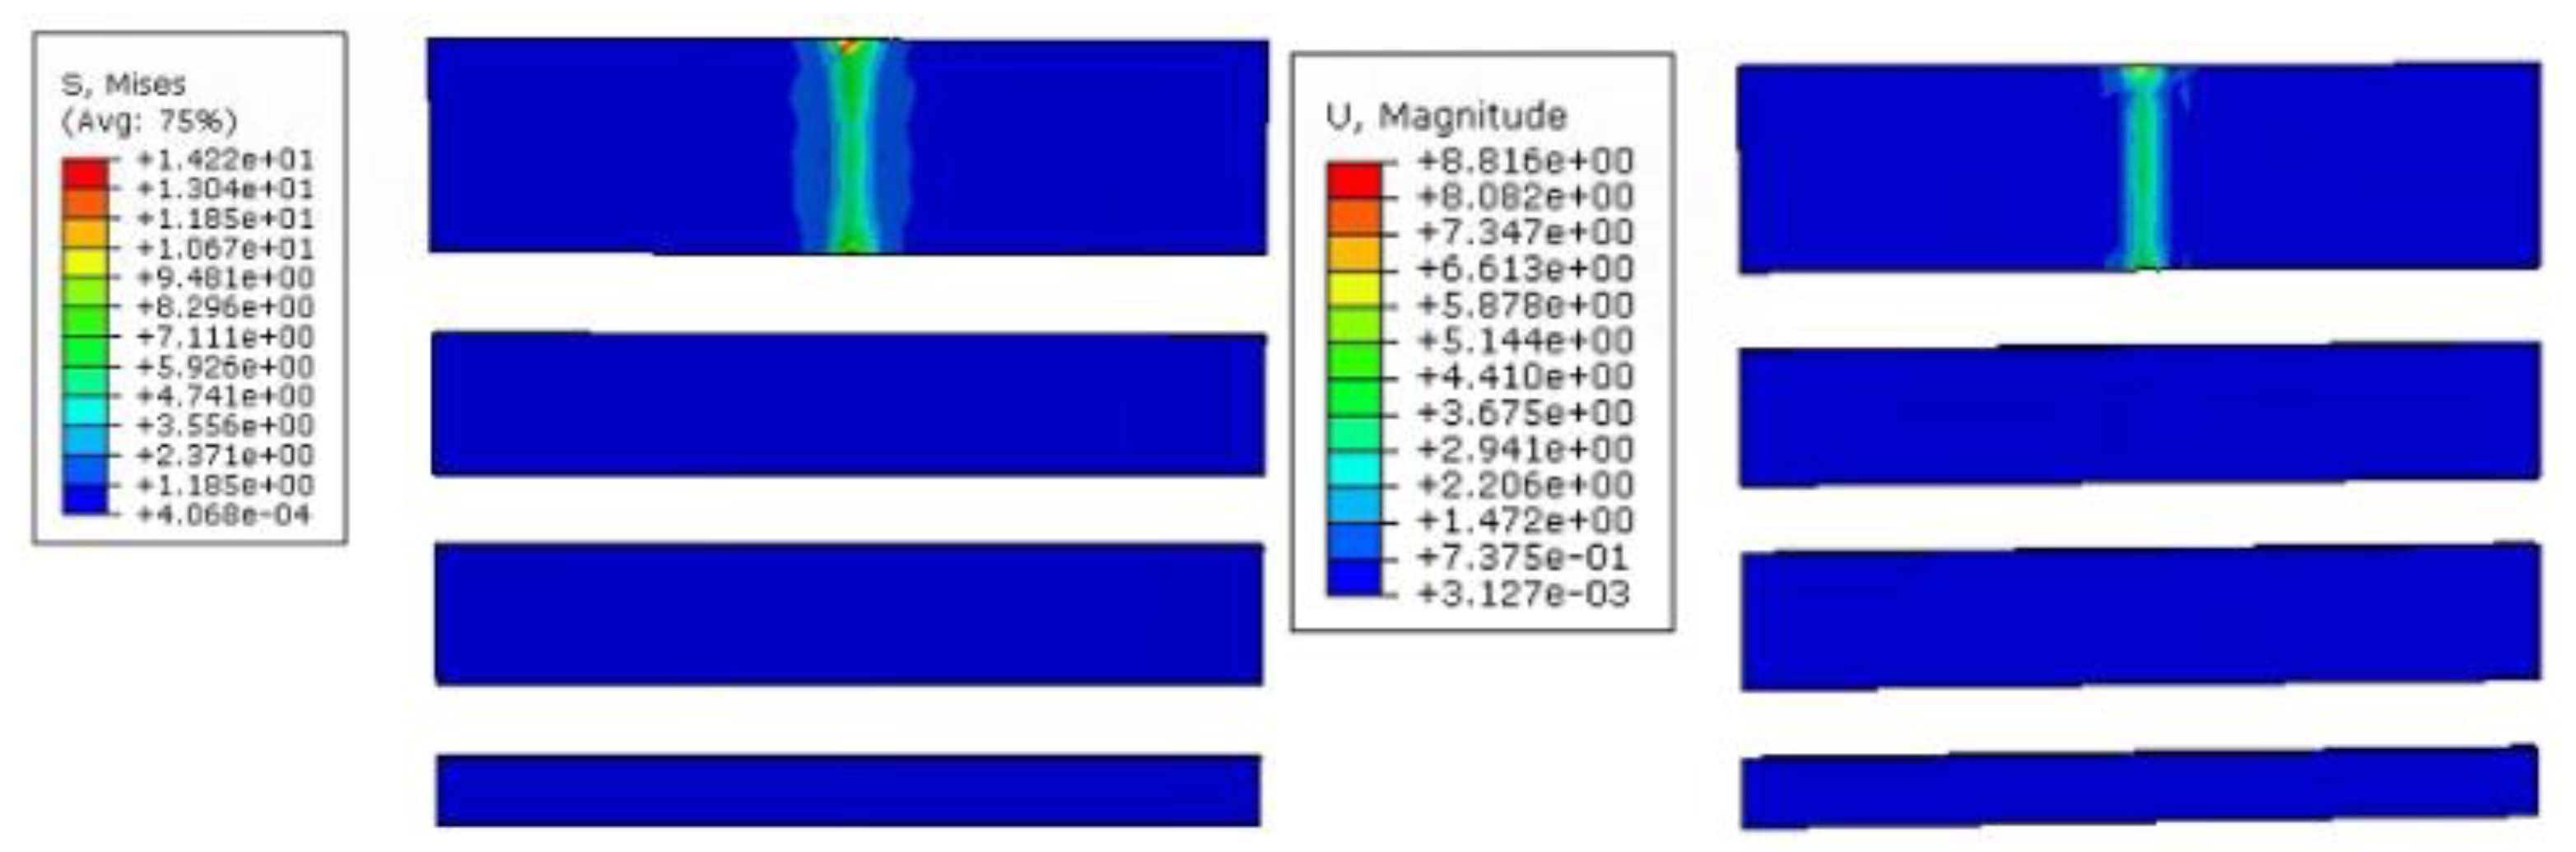
During the whole collision process, the maximum stress on the device is 424.2 MPa, the maximum stress is located at the intersection of the first panel and the web, and the maximum deformation of the device is 6.49 mm. The externally mounted UHMWPE impact strip concentrates the impact energy in the contact area, with its effective stress transmission range accounting for about 9.62% of the total protective area. The maximum deformation occurs at the edge of the third impact strip, measuring 1.48 mm. Throughout the entire collision process, the maximum impact force reaches 326 kN.
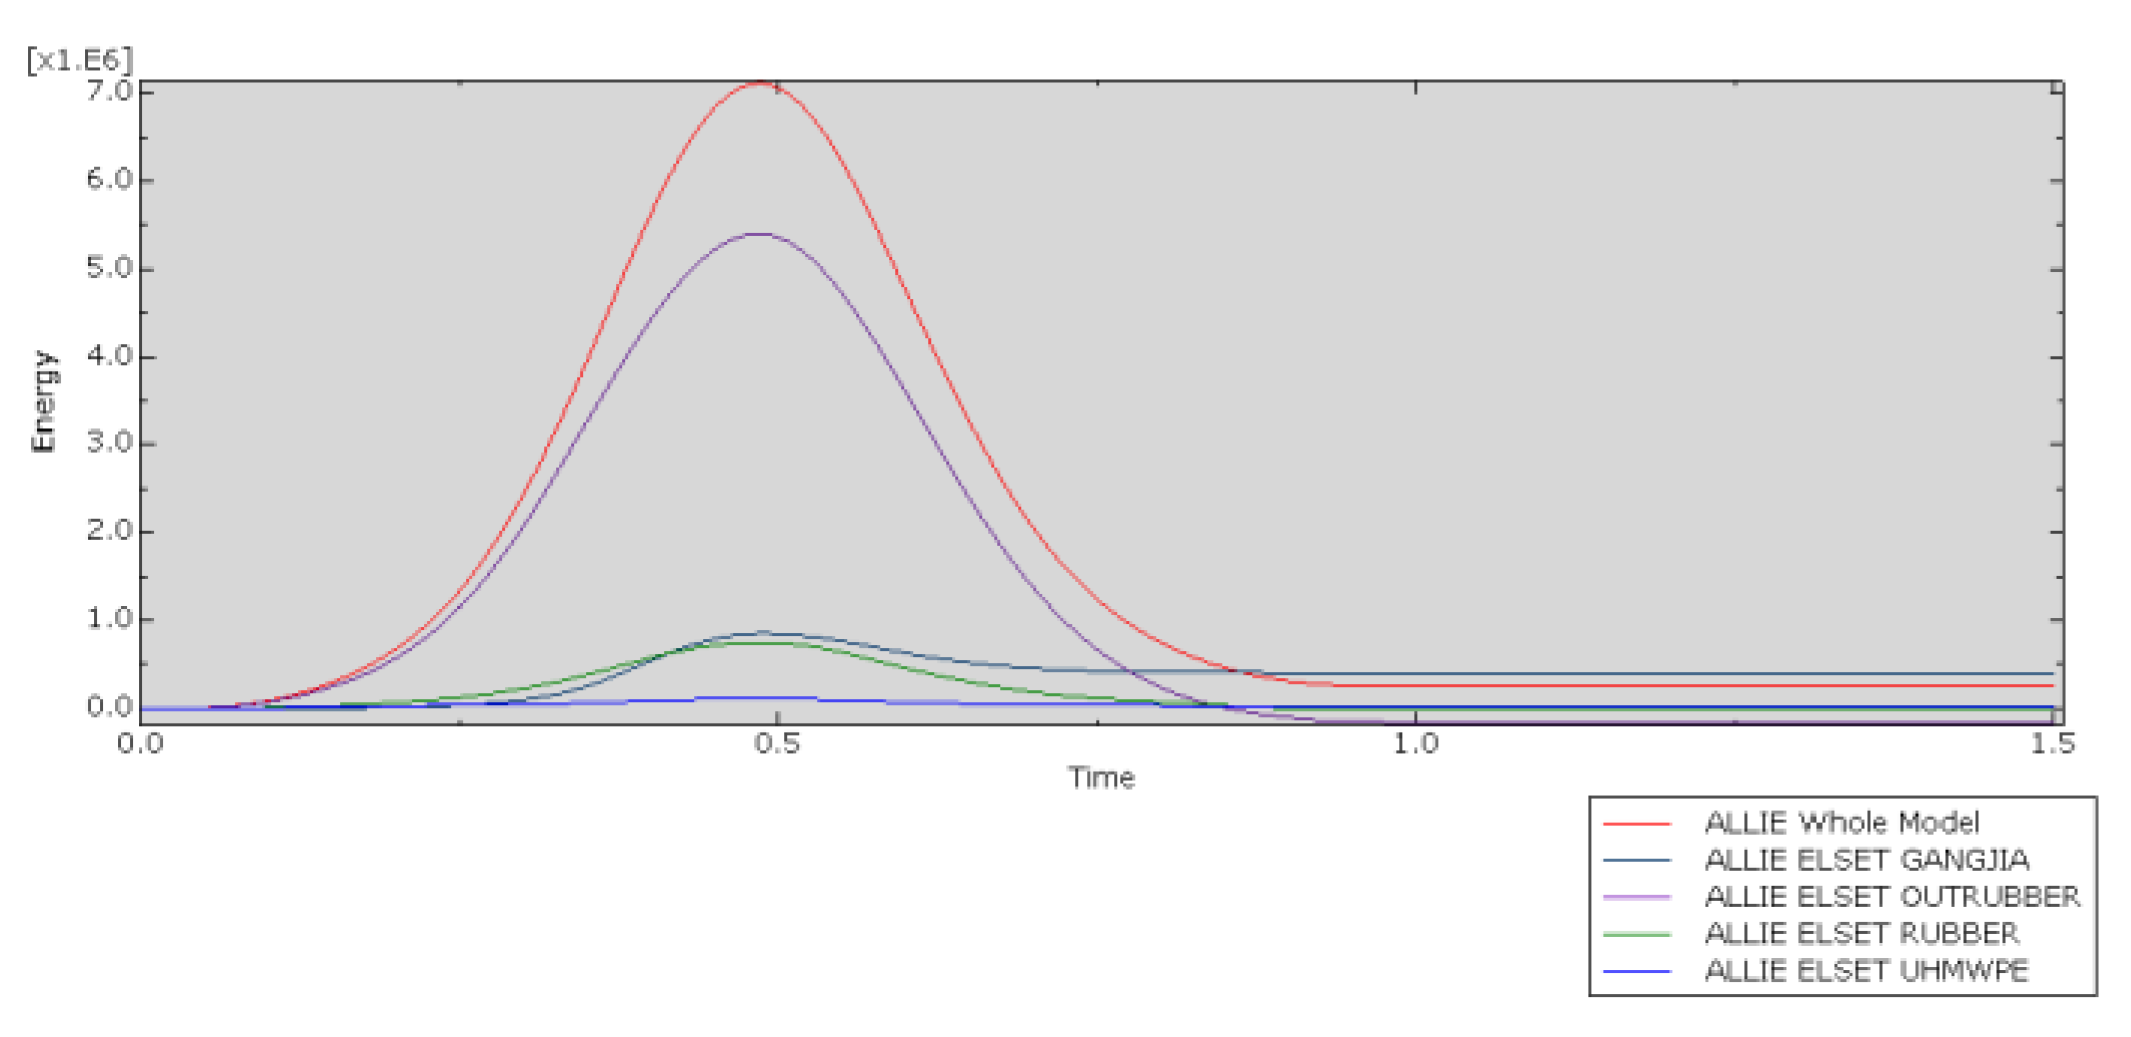
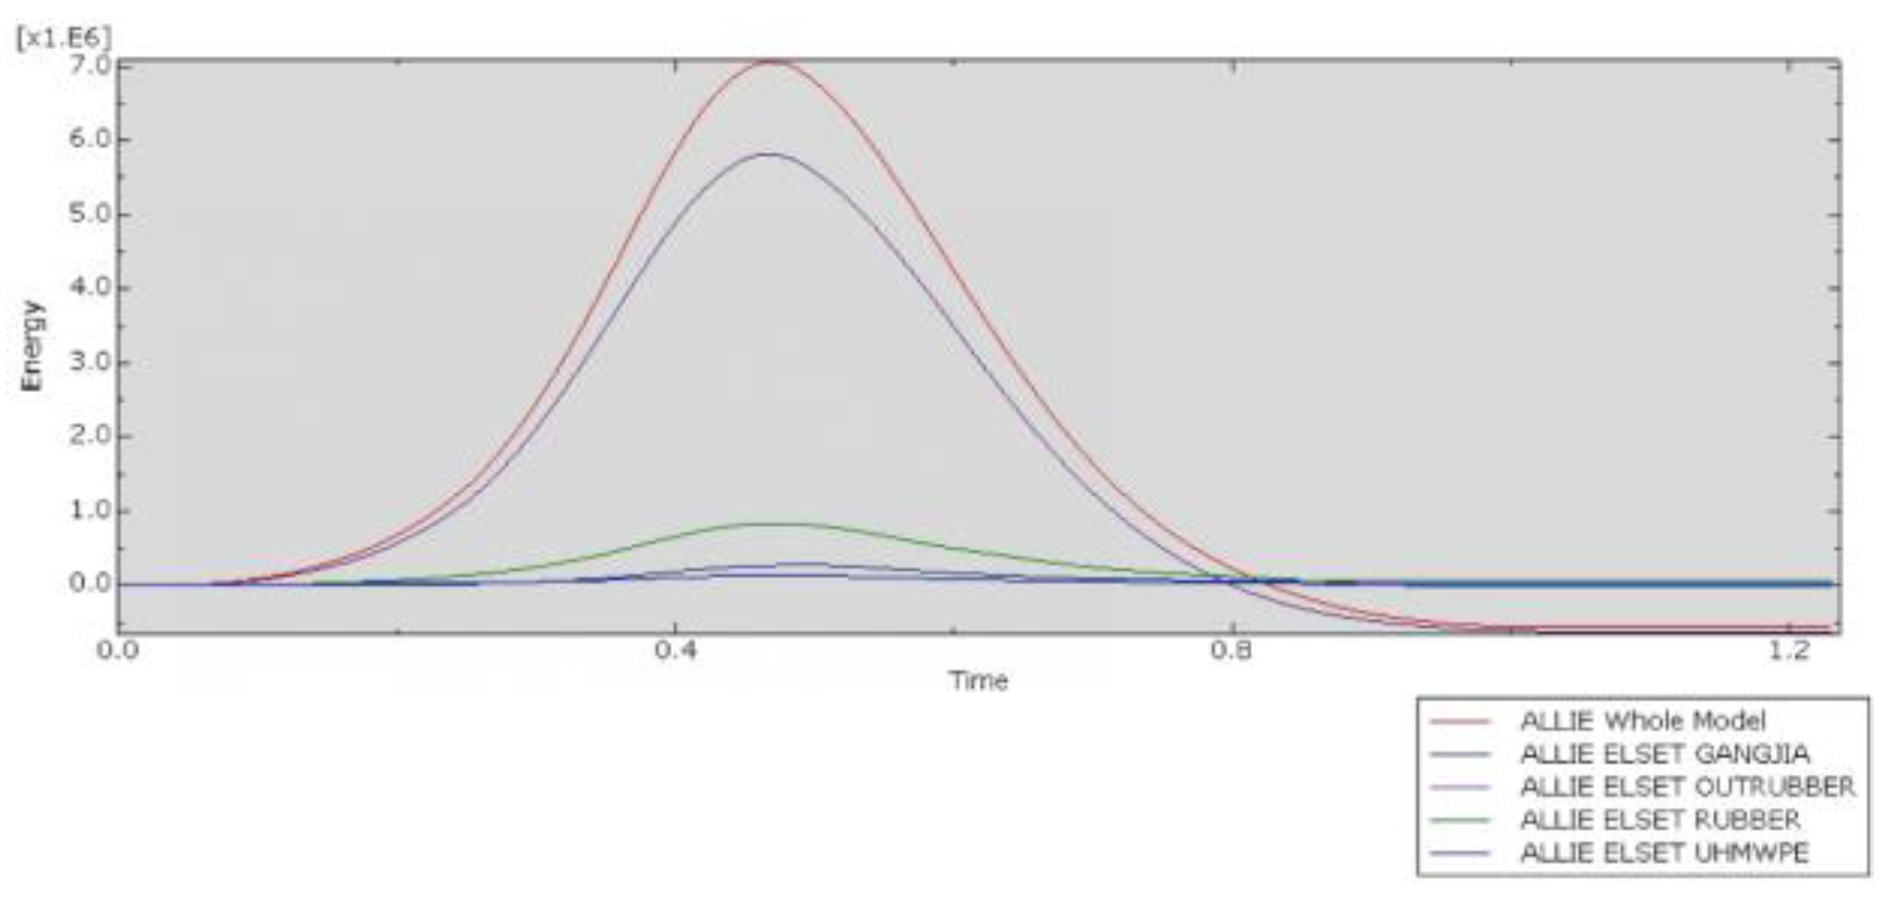
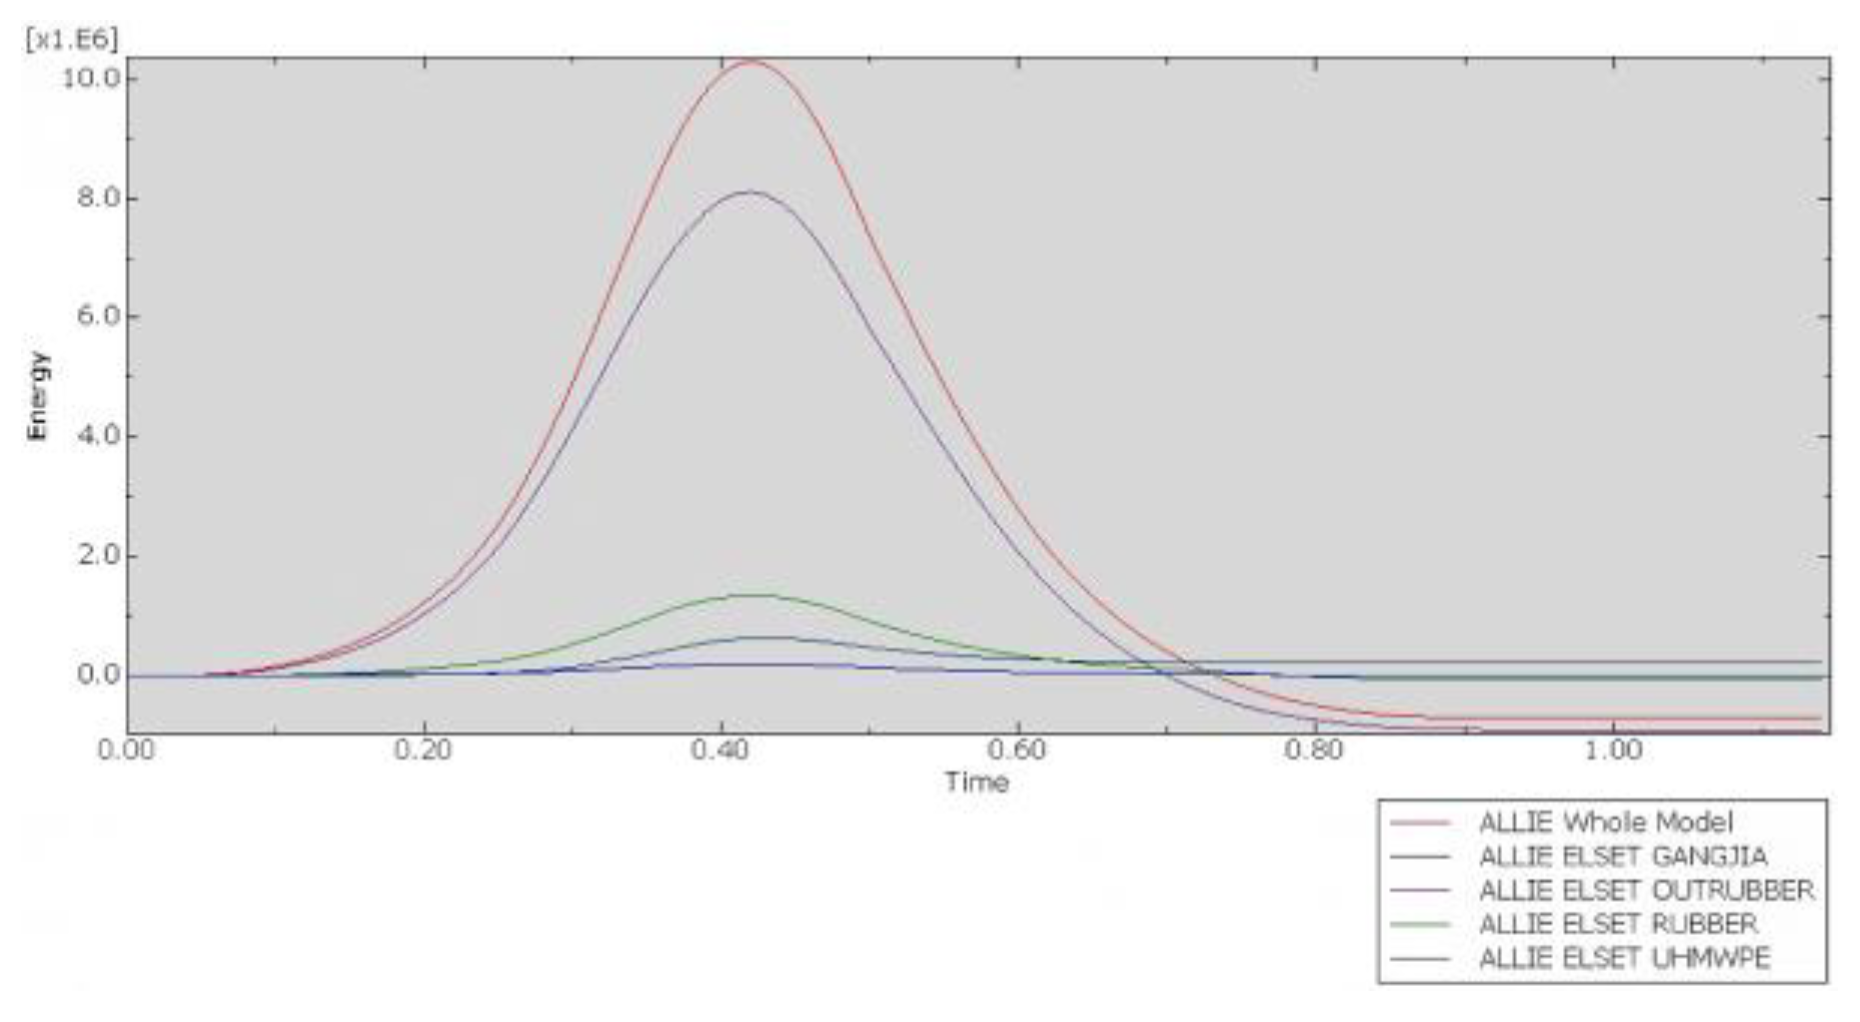
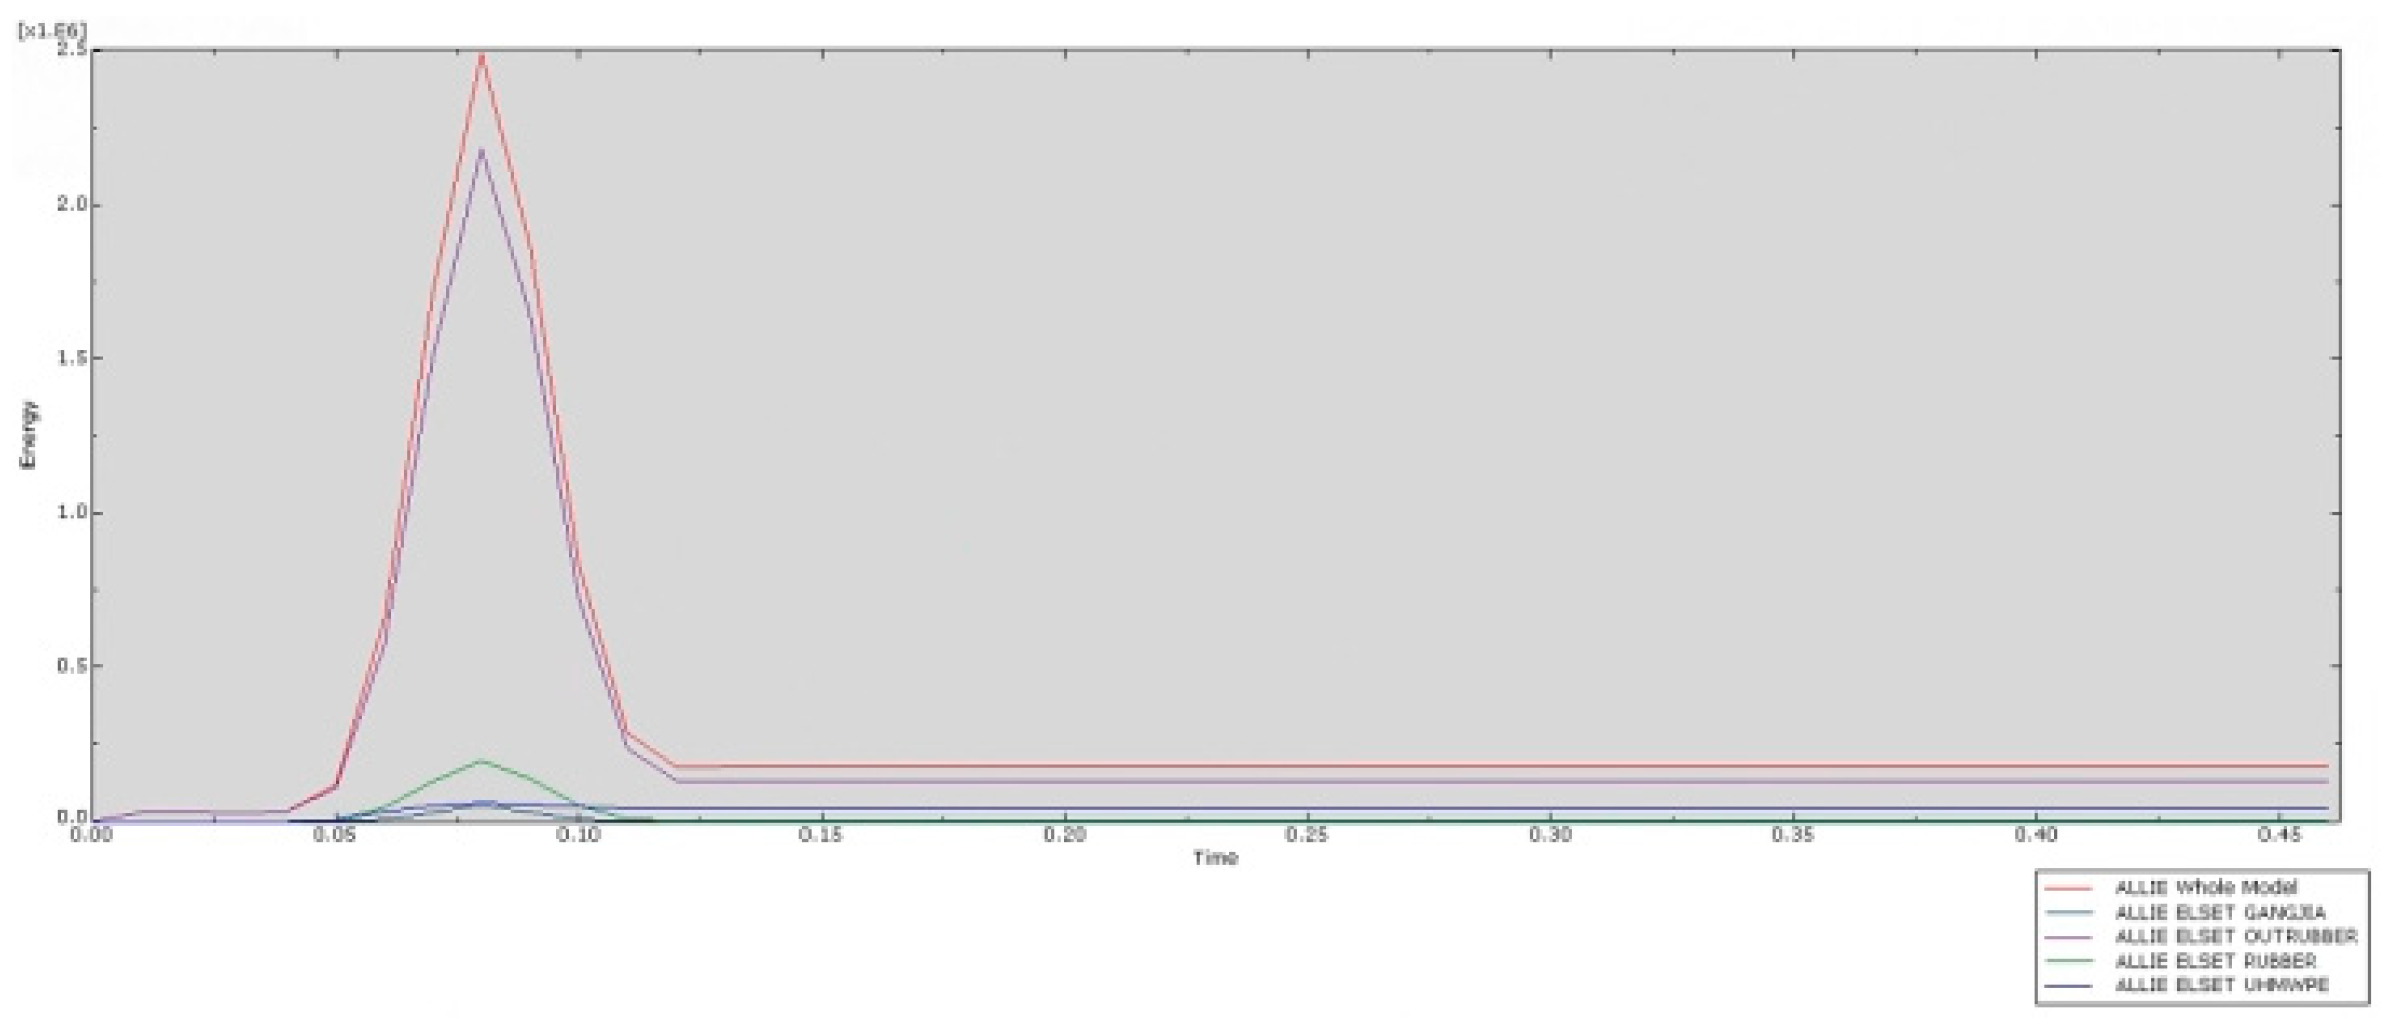
Regarding the energy curves in
Figure 13, the Whole Mode represents all models throughout the entire experiment. GANGJIA refers to the rear steel frame of the collision prevention device, while OUTRUBBER denotes the outer layer of rubber wrapping around the impact object. The anti-collision strip consists of two materials: the outer layer is UHMWPE, and the inner layer is RUBBER. The internal energy of each component reaches its peak within approximately 0.5 s. However, the energy absorption process of the multi-material anti-collision structure exhibits certain temporal differences: the anti-collision steel frame (GANGJIA), serving as the rigid core, quickly absorbs energy through high stiffness during the initial phase of the collision and rapidly becomes saturated. Energy is then dispersed through elastic deformation and structural transmission. The outer layer of rubber (OUTRUBBER) utilizes low modulus and high elasticity to dissipate energy first by undergoing viscoelastic deformation. Its high damping characteristics facilitate rapid energy release. The inner layer of rubber (RUBBER), influenced by the support of the steel frame, lags slightly behind the outer layer in terms of energy absorption, demonstrating a layered cushioning effect. The outermost layer of ultra-high-molecular-weight polyethylene (UHMWPE), due to its high toughness and energy dissipation mechanism dominated by plastic deformation, has its internal energy peak delayed. Molecular chain slippage and micro-crack propagation require more time to accumulate energy. As the outermost material, it prioritizes delaying energy transfer inward through large deformations, complementing the rapid response of the inner layer materials in a temporal sequence, thereby enhancing the overall impact resistance performance of the structure.
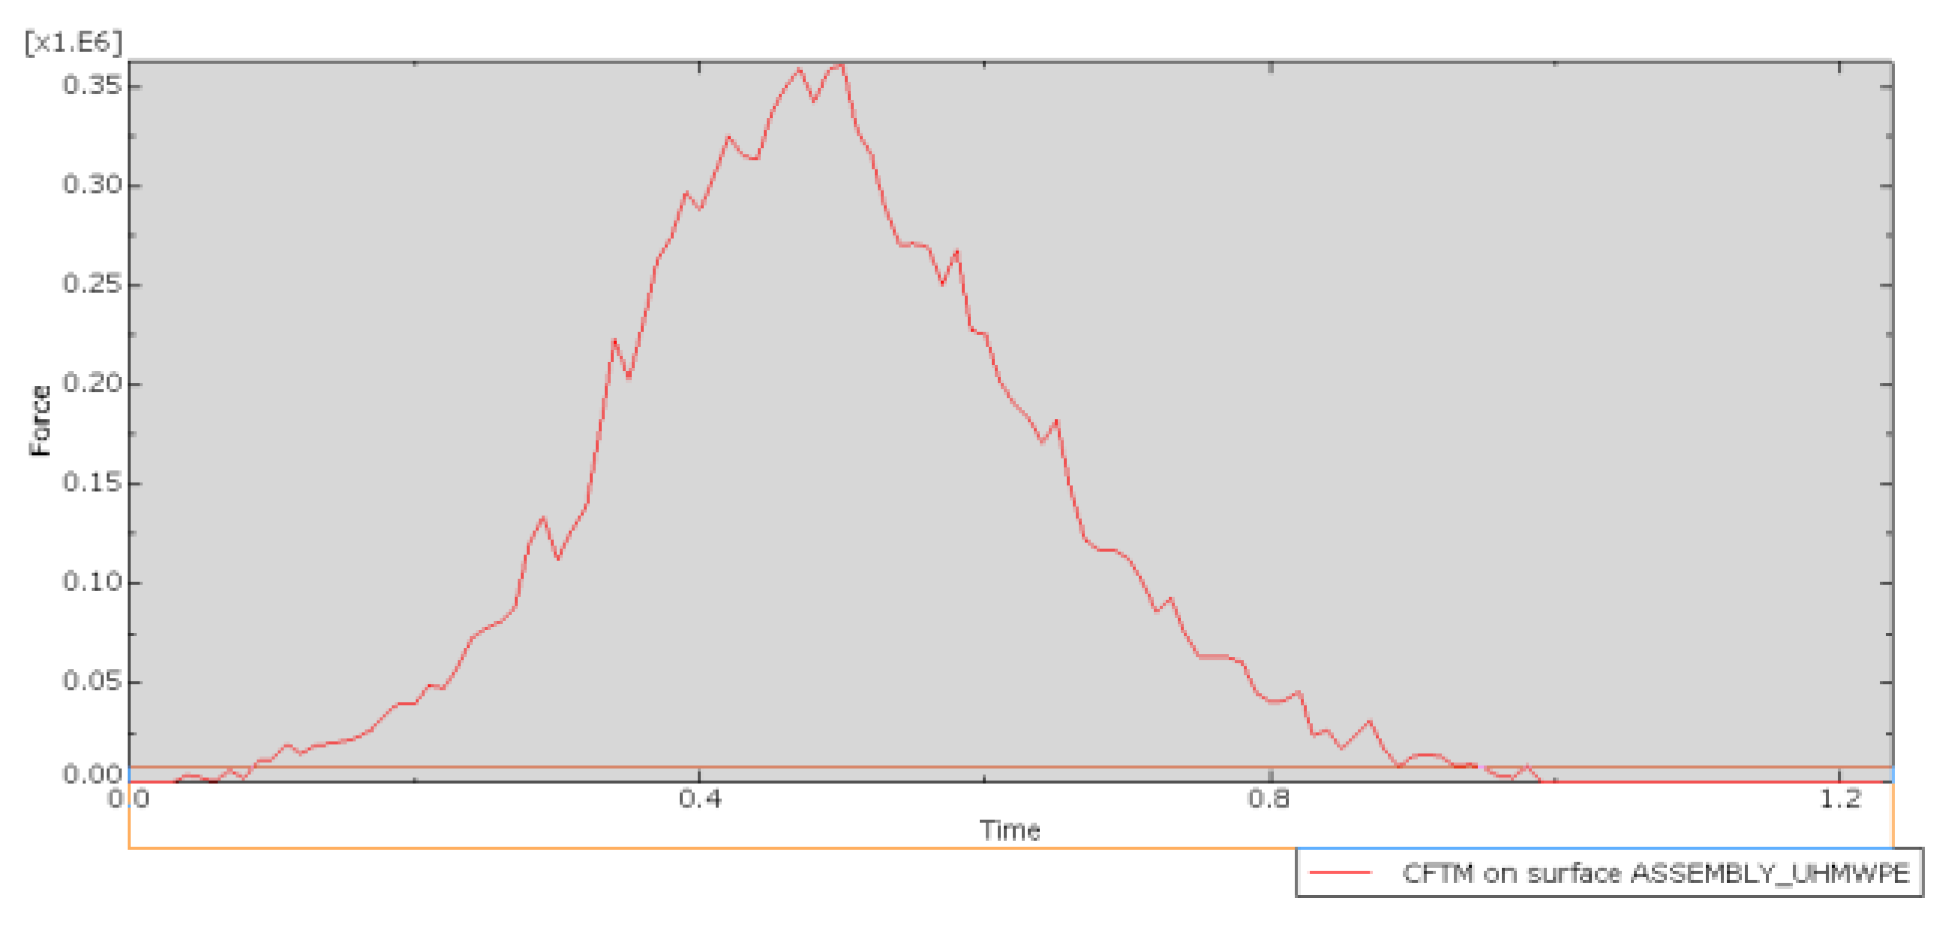
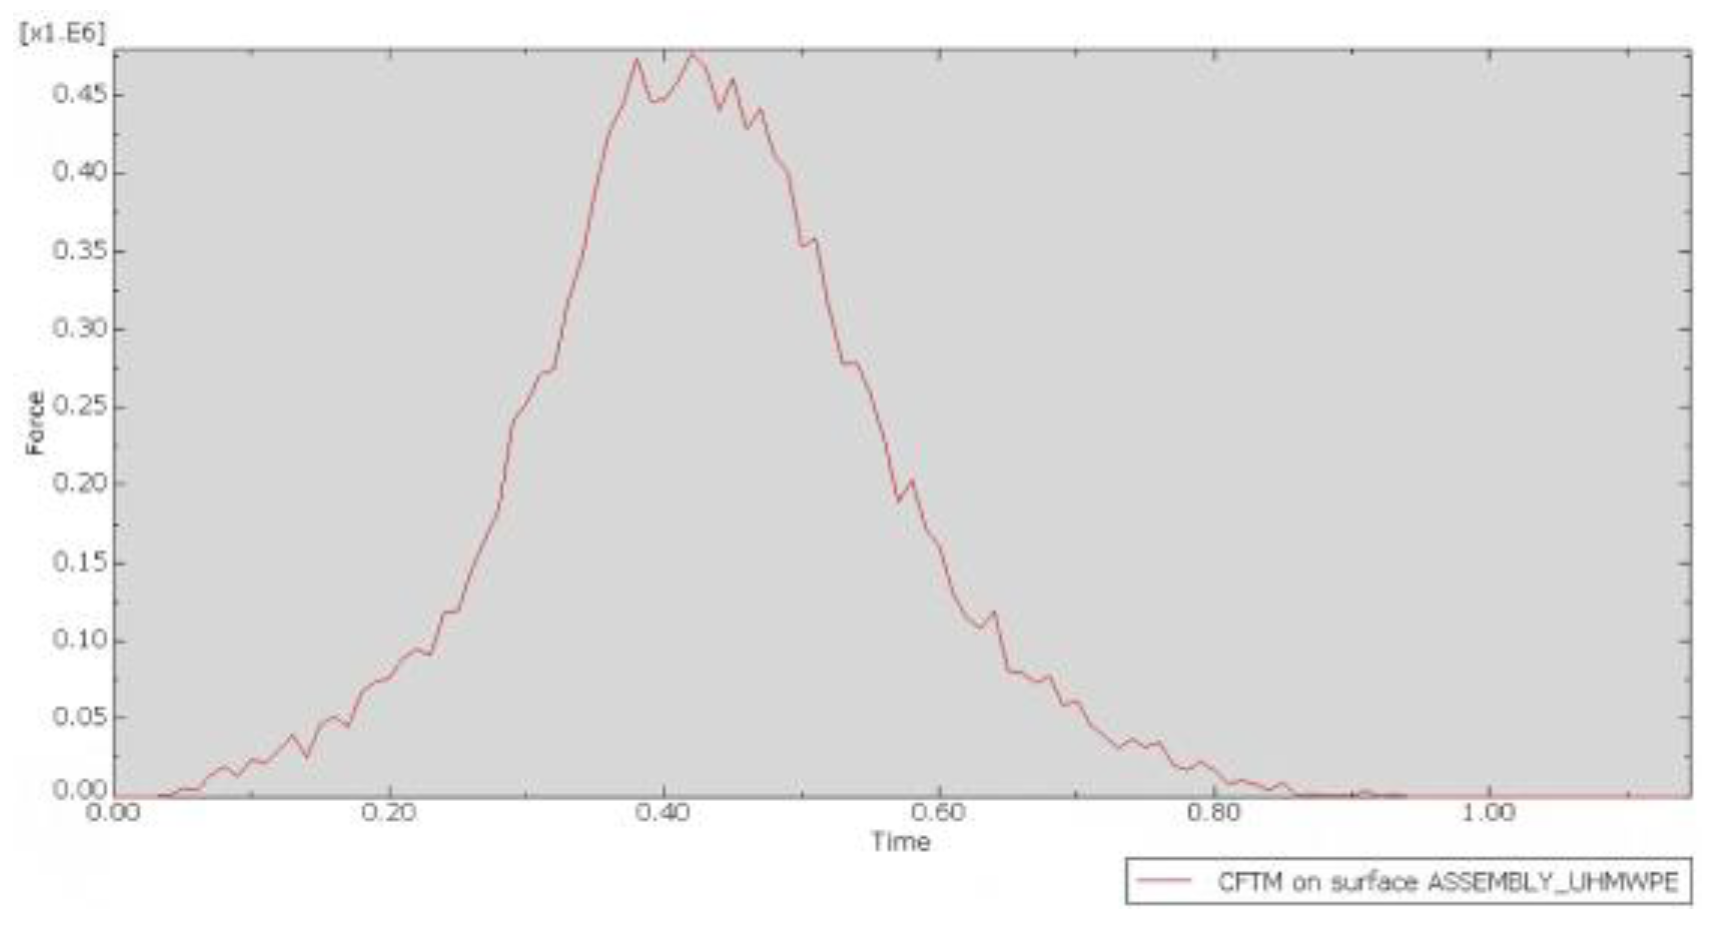
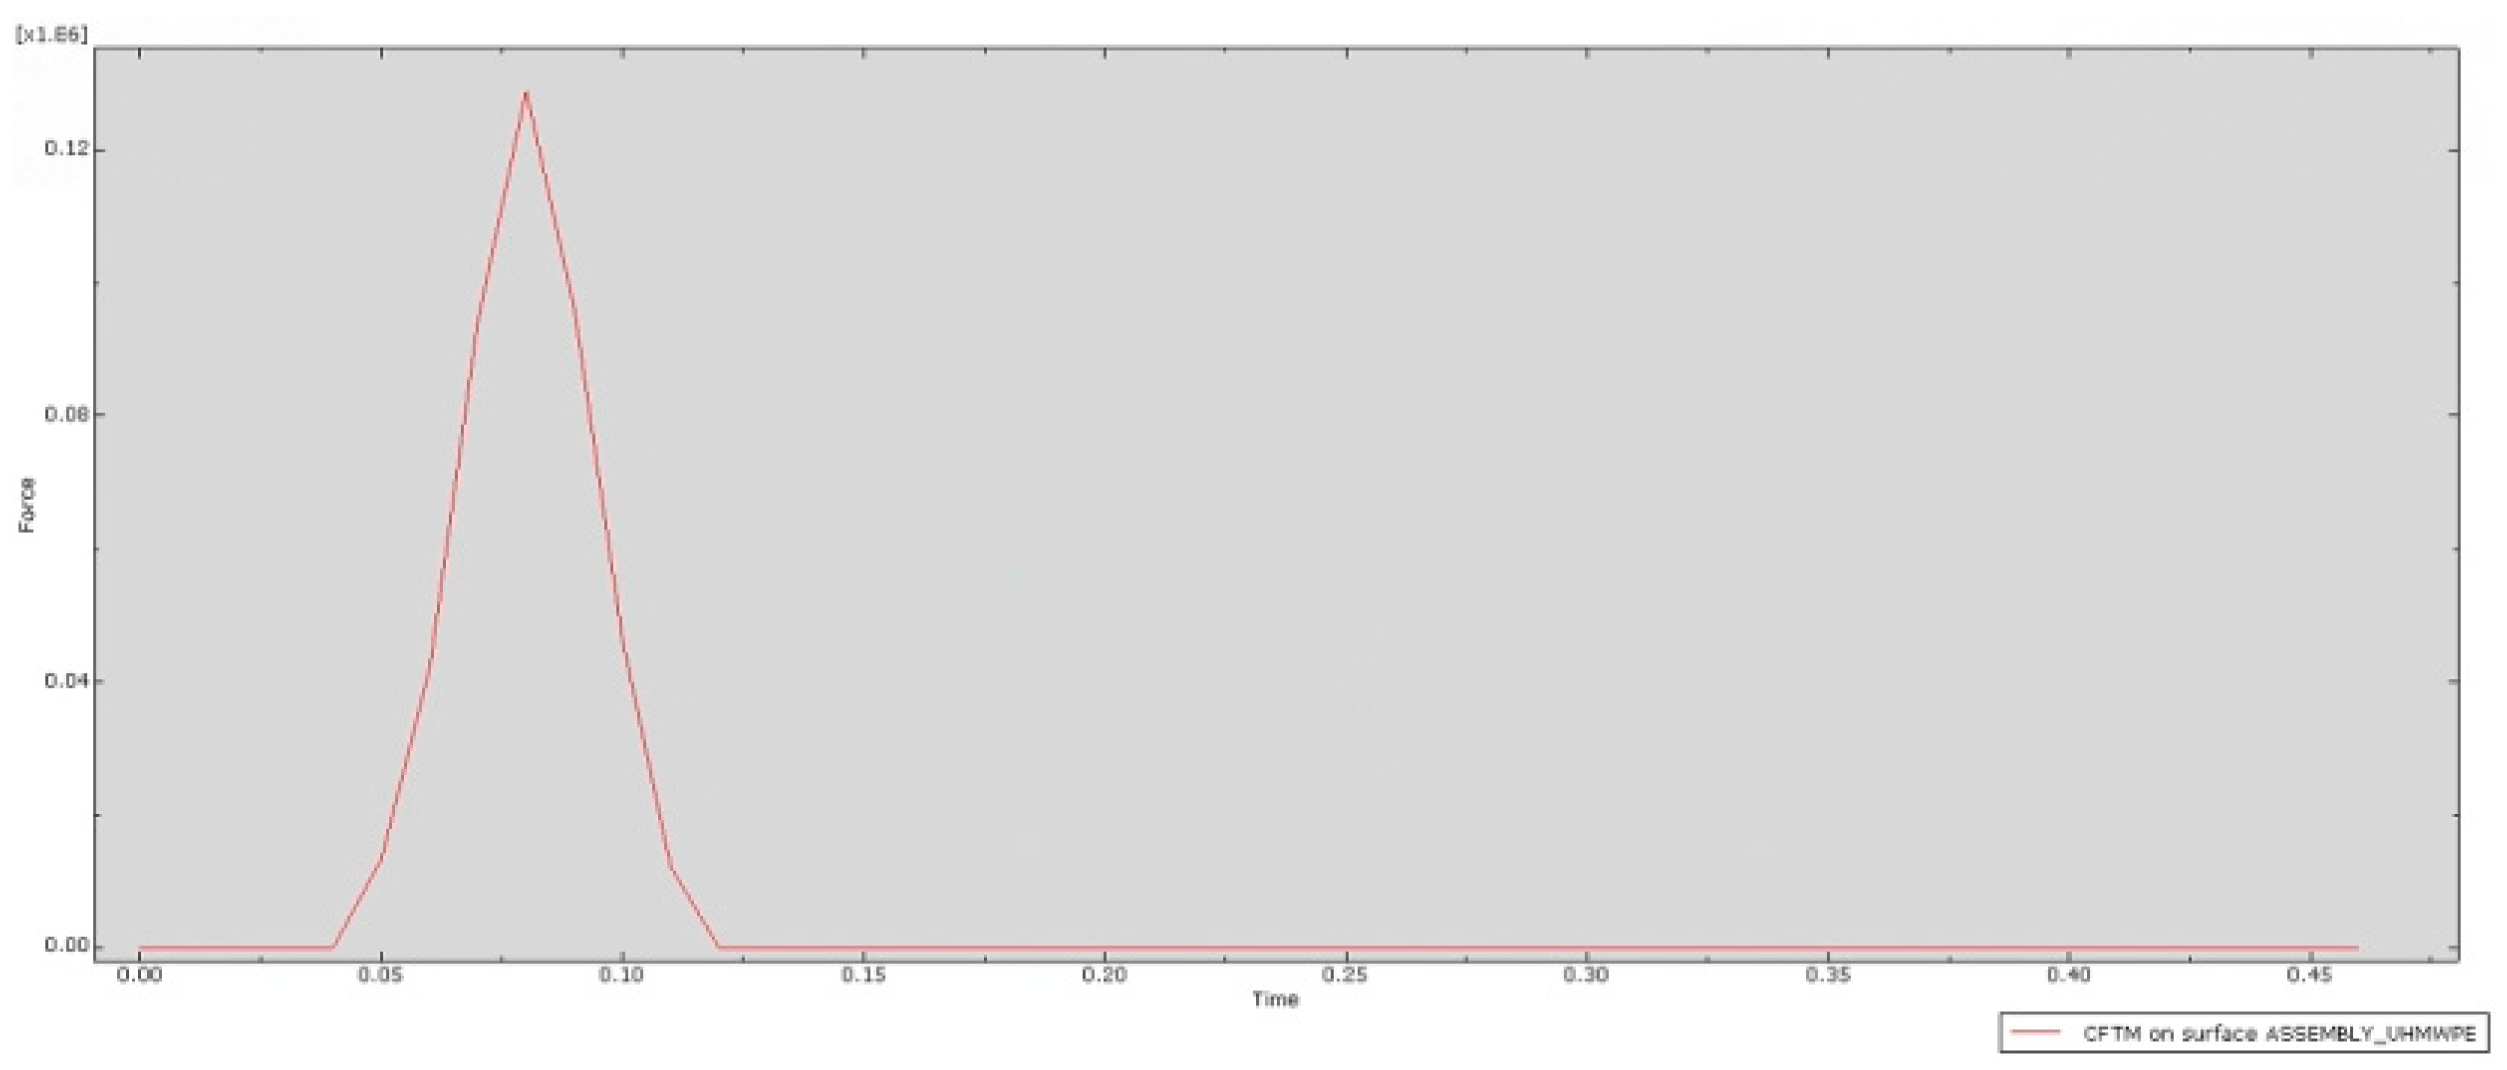
As shown in
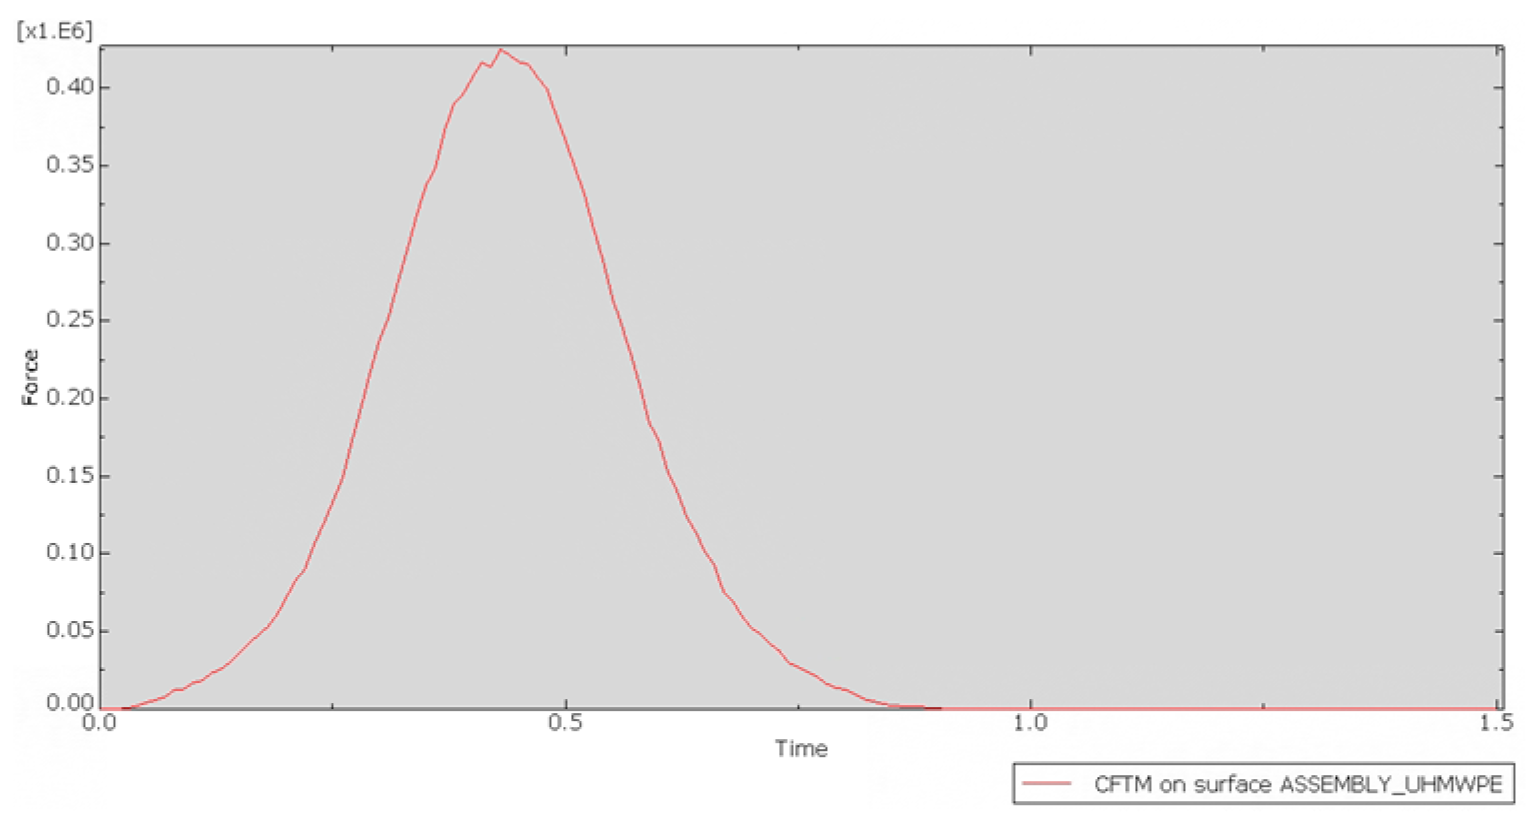
Figure 14, this demonstrates the dynamic response of the impact force in UHMWPE throughout the entire collision process. The outer bumper strip, as the outermost component in direct contact with the impacting object, serves as the first barrier for energy transfer. Its impact force curve fully covers the entire process, from elastic deformation to plastic energy dissipation, systematically characterizing the temporal features of dynamic response. During the initial stage of collision, this component quickly absorbs energy through elastic deformation, causing the impact force to rapidly rise and reach its peak at 0.5 s. As the collision continues to 1 s, the impact force gradually decreases, with the internal structure of UHMWPE dispersing the impact force through sliding and reorganization. In the final stage of the collision, the impact force gradually decreases and stabilizes, ensuring that the entire bumper structure does not become damaged by the impact.
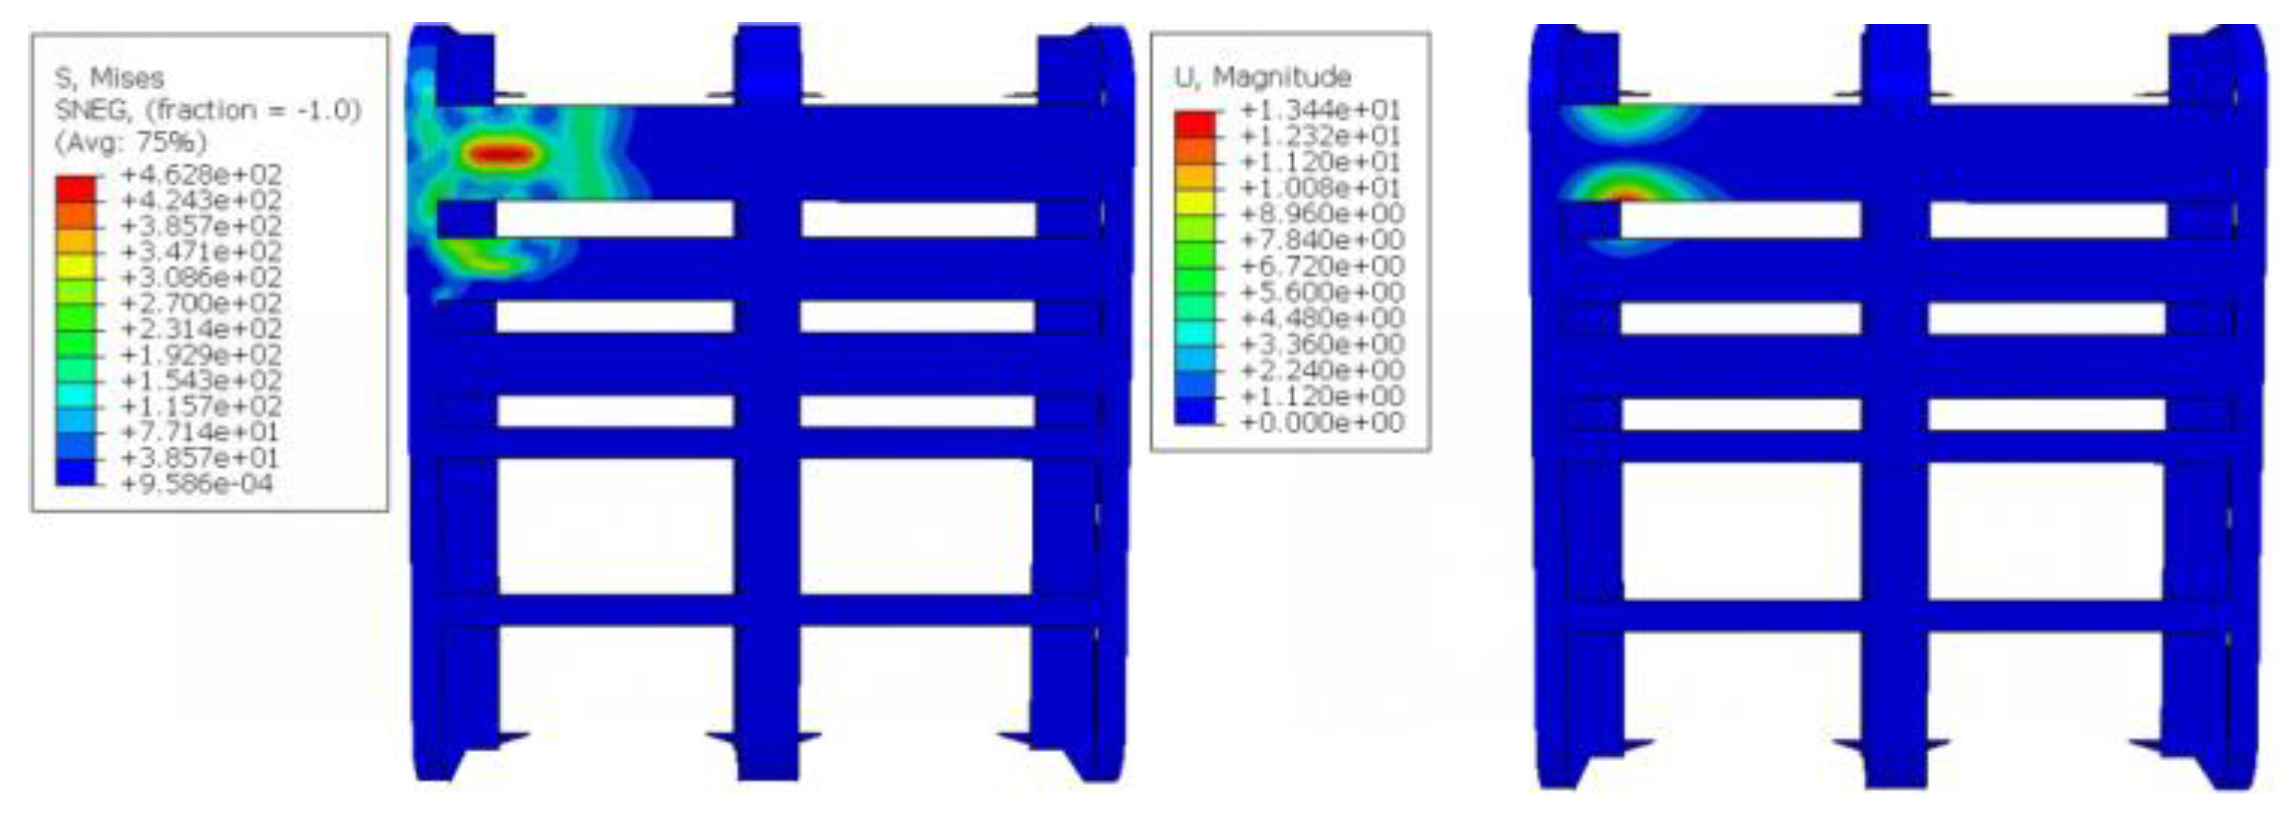
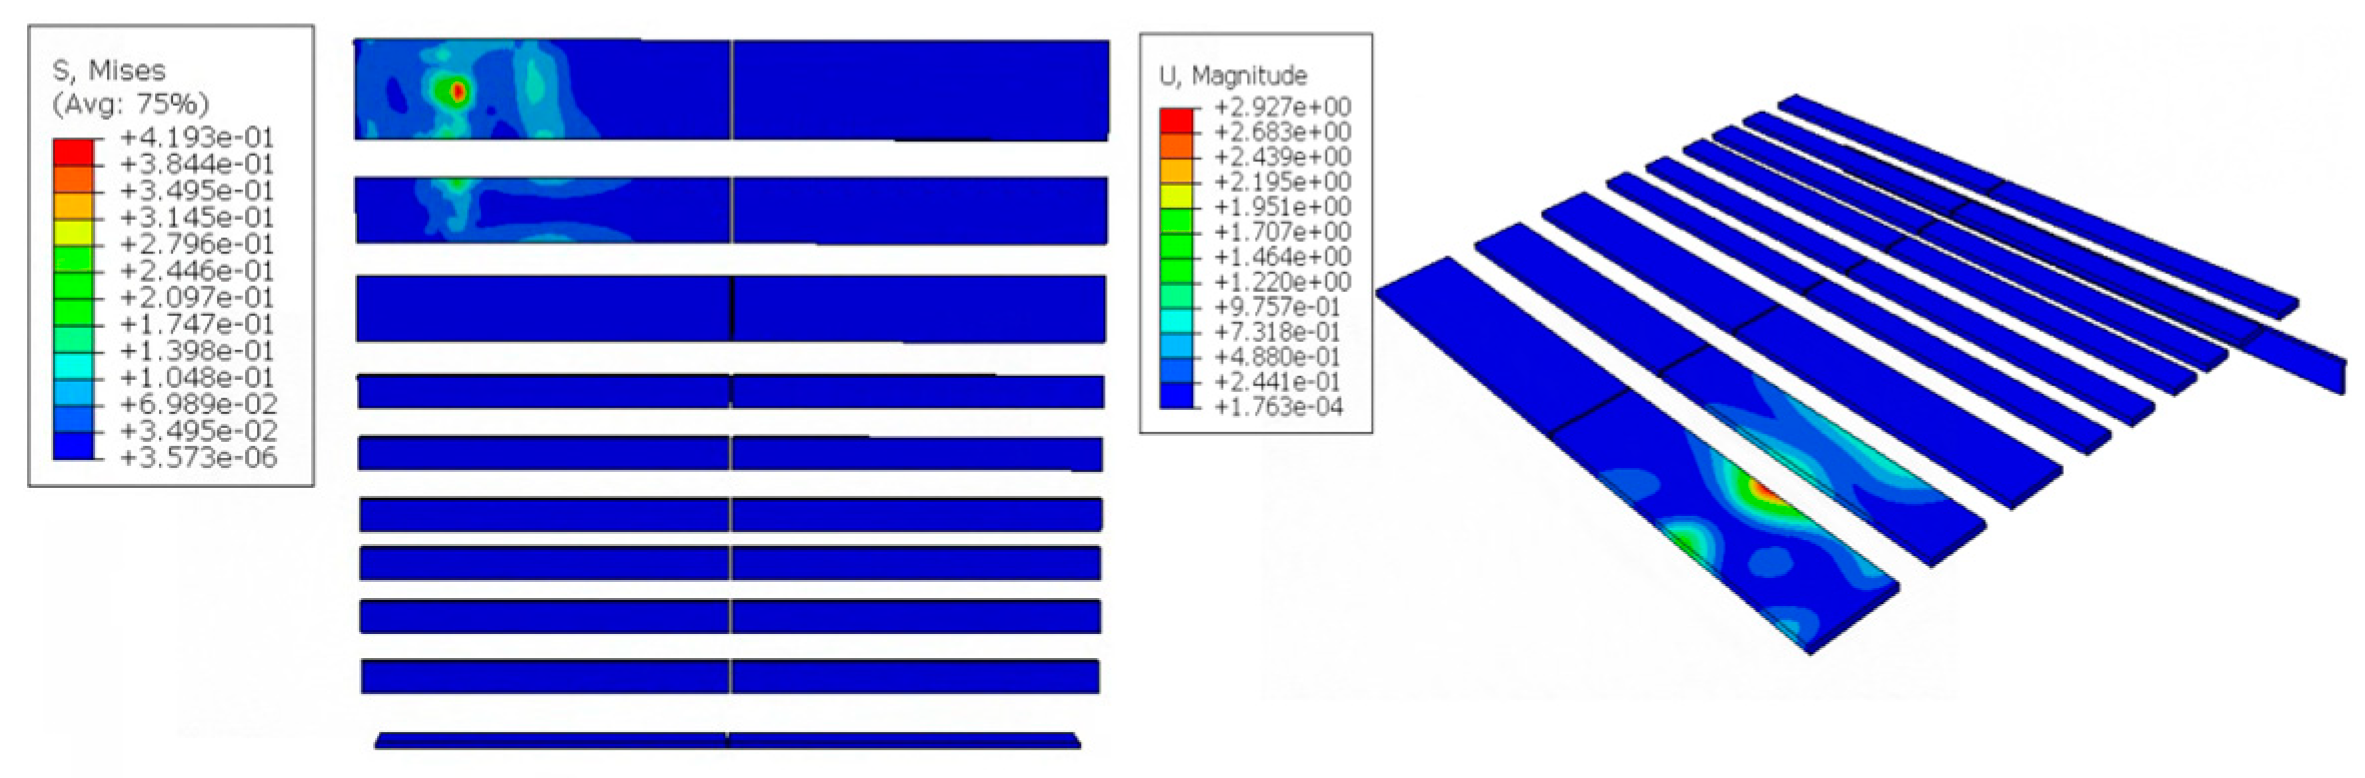
During the whole collision process, the maximum stress of the device is 462.8 MPa, the maximum stress is located in the first panel and at the intersection of the web plate, and the maximum deformation of the device is 13.4 mm. The externally mounted UHMWPE impact strip concentrates the impact energy in the contact area, with its effective stress transmission range accounting for approximately 9.85% of the total protective area. The maximum deformation occurs at the edge of the third impact strip, measuring 2.93 mm. Throughout the entire collision process, the peak impact force reaches 425 kN.
As shown in
Figure 17, the internal energy of each component reaches its peak before 0.5 s, while the energy absorption process of the multi-material impact-resistant structure exhibits certain temporal differences. As depicted in
Figure 18, during the initial stage of the collision, this component rapidly absorbs energy through elastic deformation, causing the impact force to rise quickly and reach its peak before 0.5 s; when the collision continues until 0.9 s, the impact force steadily decreases.
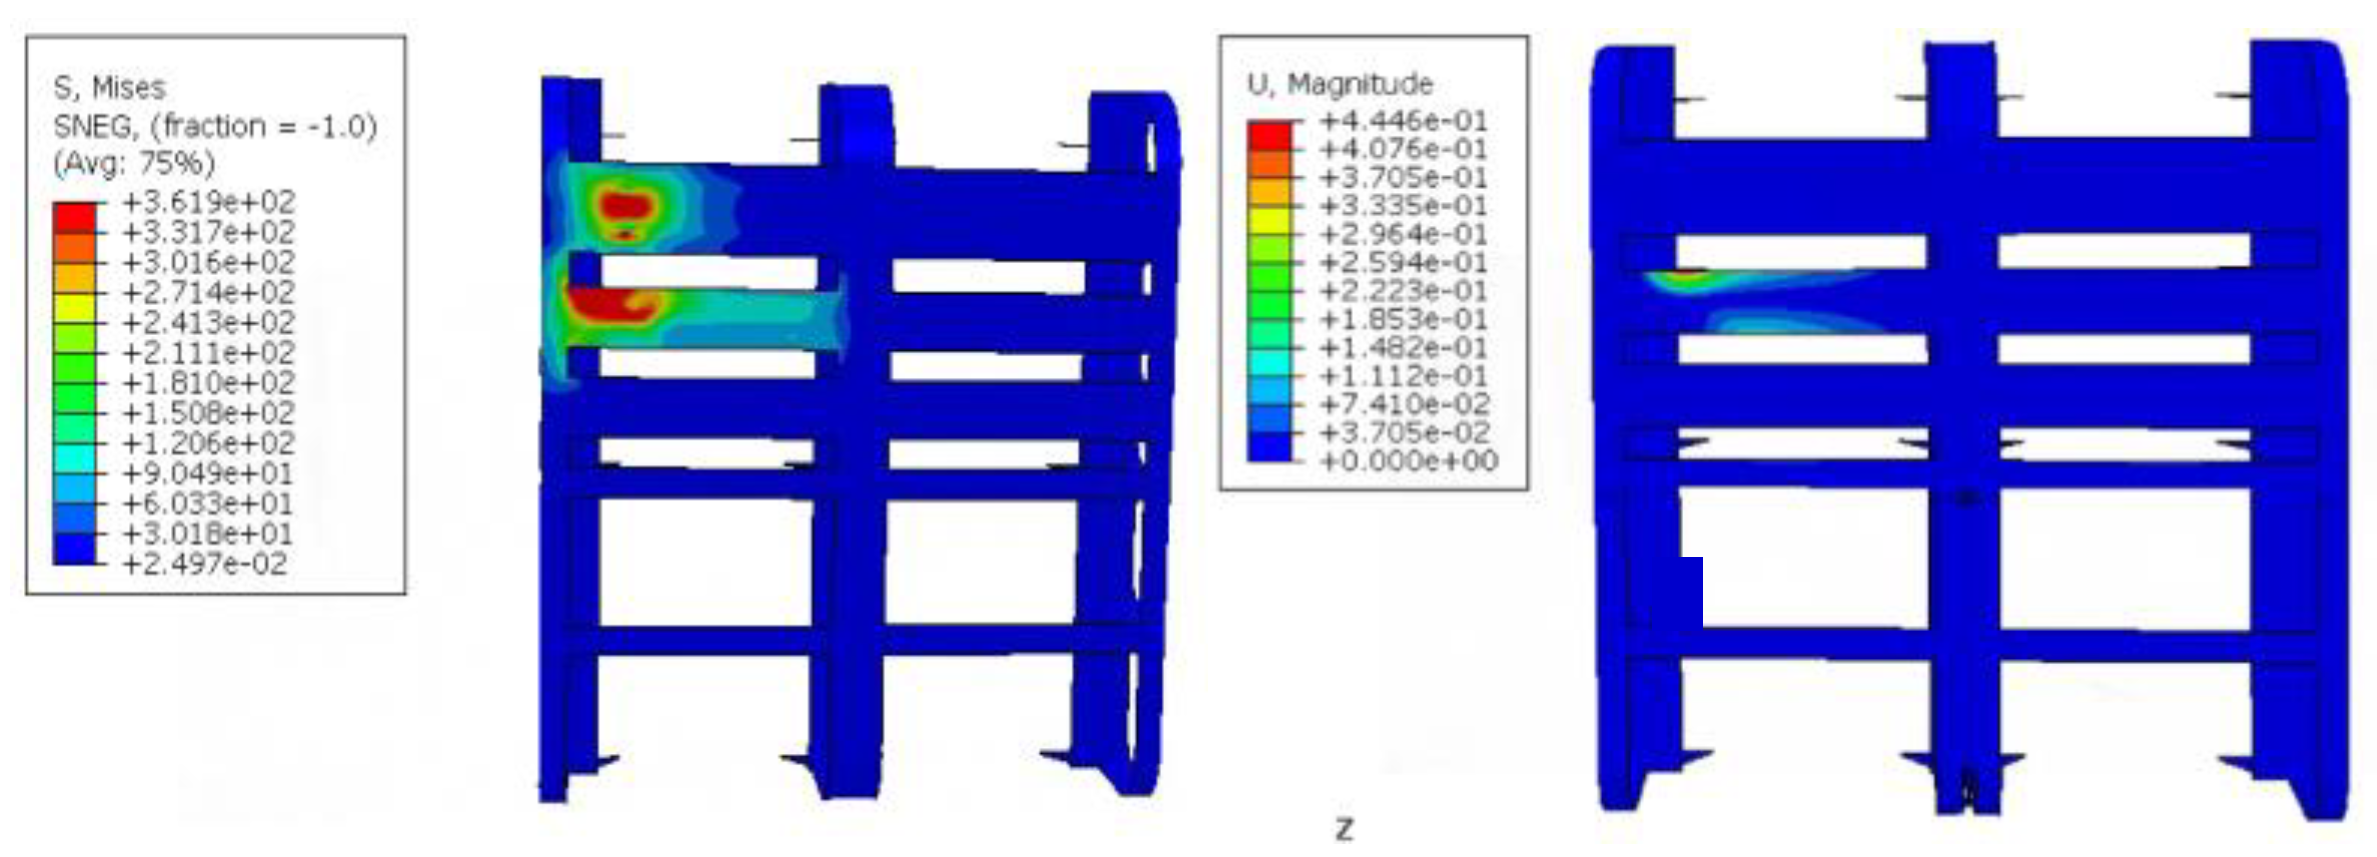
During the whole collision process, the maximum stress of the device is 361.9 MPa, and the maximum stress is located in the middle of the upper two webs and the intersection of the third web and the panel, and the maximum deformation of the device is 0.44 mm. The UHMWPE impact strip is installed externally and, after being struck, has an effective stress transfer range accounting for approximately 7.98% of the total protective area. The maximum deformation occurs at the lower edge of the third impact strip and the upper edge of the fourth impact strip, with a value of 1.42 mm. Throughout the entire collision process, the maximum impact force reaches 361 kN. As shown in
Figure 21, the internal energy of each component reaches its peak before 0.45 s, while the energy absorption process of the multi-material impact-resistant structure exhibits certain temporal differences. As depicted in
Figure 22, during the initial stage of the collision, this component rapidly absorbs energy through elastic deformation, causing the impact force to rise quickly and reach its peak before 0.45 s; when the collision continues until 0.9 s, the impact force steadily decreases.
The calculation results are listed in
Table 4. During the whole collision process, the maximum stress of the device is 380.4 MPa, the maximum stress is located in the middle of the upper two webs and the intersection of the third web and panel, and the maximum deformation of the device is 2.57 mm. The UHMWPE impact strip installed externally transfers effective stress over approximately 6.31% of the total protective area after impact. The maximum deformation occurs at the lower edges of the third and fourth impact strips, measuring 1.45 mm. Throughout the entire collision process, the peak impact force reaches 477 kN. As shown in
Figure 25, the internal energy of each component reaches its peak 0.4 s later, while the energy absorption process of the multi-material impact-resistant structure exhibits certain temporal differences. As depicted in
Figure 26, during the initial stage of the collision, this component rapidly absorbs energy through elastic deformation, causing the impact force to rise quickly and reach its peak 0.4 s later; when the collision continues until 0.9 s, the impact force steadily decreases.
Comparing the simulation results, the collision force increases with the increase in the collision speed, and the device stress and device deformation decrease with the increase in the number of web plates. The maximum deformation of the device is greatly reduced when the number of web plates at the impact site is set to three. At this time, the maximum stress of the device still exceeds its maximum strength, so the device needs to be further improved to achieve the corresponding strength requirements.
Experiments show that collision deformation is mainly concentrated in certain local areas. This means that, under the premise of ensuring strength and stability, these specific load-bearing areas can be optimized, further reducing the size of the anti-collision device. By minimizing material usage in unnecessary parts, costs can be saved, and the utilization of space within the floating dock can be improved. Based on this design concept, the steel frame is reduced to a size that meets the protective requirements, and the bottom reinforcement materials are changed to a ring shape for these local load-bearing areas, effectively enhancing the load-bearing capacity and compressive resistance of the steel frame, ensuring that its overall strength and stability are not affected by the reduced size; the inner side of the anti-collision strip is made of rubber, while the outer side uses UHMWPE. The specific design model is shown in
Figure 27.
The crash bar is 20 mm rubber + 20 mm UHMWPE; the rear steel frame is 355 steel; the impact speed is 2.32 m/s; and the calculation results are shown in
Figure 28,
Figure 29,
Figure 30 and
Figure 31:
Throughout the whole collision process, the maximum stress of the device is 296.1 MPa, the maximum stress is located in the middle area of the first panel, and the maximum deformation of the device is 1.43 mm. After impact, the external bumper strip transfers effective stress over approximately 3.72% of its total protective area, with the maximum final displacement occurring at the edge of the first bumper strip, measuring 8.82 mm. Throughout the entire collision process, the peak impact force reaches 128.92 kN. The internal energy of each component reaches its peak 0.075 s later, while the energy absorption process of the multi-material impact-resistant structure exhibits certain temporal differences. During the initial stage of the collision, this component rapidly absorbs energy through elastic deformation, causing the impact force to rise quickly and reach its peak 0.075 s later; when the collision continues until 0.12 s, the impact force steadily decreases. It can be seen from the calculation that the designed structure meets the requirements of anti-collision.
4. Conclusions
In this study, a simplified model of a floating dock in-dock collision avoidance structure was developed, its buffering performance was investigated, and a novel collision avoidance structure was optimized and designed. Through in-depth simulation analysis, several innovative findings were obtained:
Firstly, we discovered that the collision force exhibits a power–law relationship with the collision velocity of the colliding objects. This relationship is not simply linear, and further research on this non-linear relationship can be applied to more accurately predict the impact of collisions under different scenarios. For example, in high-speed collision scenarios, this power–law relationship can help us better estimate the required energy absorption capacity of the collision avoidance device.
Secondly, the stress and deformation of the collision avoidance device demonstrate a complex correlation with the collision contact area. It is not just a simple inverse–proportional relationship. When the contact area increases, the stress and deformation distribution on the device changes in a non-uniform manner. Some areas show a significant decrease in stress and deformation, while others may experience a more complex stress–strain state. This finding provides new ideas for the local optimization of the collision avoidance structure. We can use this non-uniform distribution characteristic to design a variable-thickness or variable-stiffness structure, which can not only improve the energy-absorbing efficiency but also reduce the overall weight of the device.
Thirdly, we found that the composite structure of flexible and rigid components has excellent energy-absorbing characteristics, but its performance can be further enhanced by adjusting the interface properties between different materials. Further research will explore the use of advanced bonding techniques or the insertion of special transition layers to harmonize the deformation and energy absorption processes of different materials, thereby achieving more efficient energy dissipation effects. This can be considered a new design concept for composite impact protection structures.
Therefore, in the design process, we should try to improve the buffering performance of the collision avoidance device, reduce the collision speed with the object, and improve the collision area so as to greatly absorb the collision energy and achieve the purpose of protecting both sides from collisions. In the future, based on more general collision scenarios, we will study the buffer design guidelines for hull collision avoidance structures, use abandoned ships to carry out real-scale collision tests to check the results of theoretical analysis or numerical methods, and study possible collision scenarios as much as possible to enrich the types of collision analysis models available.


