1. Introduction
Profiling floats are autonomous observation platforms that adjust their depth by changing their buoyancy, and can be equipped with different kinds of sensors for collecting vertical oceanographic data [
1,
2]. The Array for Real-time Geostrophic Oceanography (ARGO) project has deployed almost 4000 profiling floats for data observations, and has collected more than 2 million profiles over the past 25 years, providing strong support for marine science [
3,
4,
5]. In addition to their deployment in deep-sea regions, the application of profiling floats has gradually extended to shallow-sea environments, including marginal and shelf seas [
6]. However, owing to the limited water depth (≤200 m depth [
7]) and intensified hydrodynamic forces of shallow-sea environments, profiling floats are susceptible to problems such as being stuck in muddy bottoms [
8] and drifting beyond shallow-sea observation regions due to coastal or tidal currents [
9,
10]. To date, the deployment of profiling floats has been focused mainly on deep-sea environments.
Numerous researchers have focused on developing shallow-sea profiling floats. To address the problems of positional drift caused by ocean currents, Siiriä et al. proposed a motion control strategy in which the float dives close enough to the bottom, but does not contact the sediment, to stay better in the designated area [
8]. Wallace et al. utilized a direct seabed contact method that relies on seabed friction to minimize positional drift [
11]. Merchel et al. adopted the same approach as Wallace et al. in the Baltic Sea and reported that the profiling floats drifted approximately 0.5–1.43 km/day [
12].
To further reduce the drift caused by ocean currents in shallow-sea environments, auxiliary stabilization mechanisms have been designed for profiling floats. For example, the French Research Institute for Exploitation of the Sea (IFREMER) developed the Arvor-C, a 300 m-rated variant derived from the 2000 m Arvor profiling float, by equipping it with anti-drift claws composed of multiple metal rods. This mechanism reduces the daily drift distance of Arvor-C in shallow seas from several kilometers to less than 200 m [
13]. Jouffroy adopted a similar approach, utilizing steel claws at the bottom of the profiling float to grip the seabed [
14]. McGuire et al. used a simple anchor consisting of a thin stainless steel rod that can sink into the sediment to resist the drift of the TideRider profiling float [
15]. Morales-Aragón et al. incorporated a landing platform composed of four stainless steel rods at the bottom of the profiling float “s-Nautilus” to achieve seabed station-keeping and data acquisition [
16,
17]. In the design of the SMART Float, Viswanathan and Taher used several steel rods as anti-drift claws and enhanced buoyancy adjustment through a ballast chamber to reduce the risk of grounding [
18]. The “Dagon” system designed by Yu et al. combined the designs of moored vertical profilers and gliders, equipped with an anchoring mechanism to remain stationary in the seabed during adverse tidal conditions [
19]. However, such an anti-drift mechanism is driven by negative buoyancy, and its efficiency might be lost in situations where the seafloor sediment is too hard for the mechanism to grip.
In addition to the use of anti-drift mechanisms to reduce positional drift in shallow-sea environments, external propulsion has been used to correct drift. For example, Le Mezo’s Seabot float was equipped with two thrusters that could be used at the surface to correct its position [
20]. The hybrid underwater profiler (HUP) designed by Zhou et al. combines the capacity of the glider and the profiling float to glide to rectify the horizontal displacement offset generated by the ocean current. Additionally, the HUP was equipped with a steel bottom-sitting shelf for landing on the seabed [
21]. The Nezha-F, developed by Bai et al., integrates a quadrotor UAV with a profiling float to adjust position through flying on its own [
22]. While this type of design enhances mobility and operational performance, it involves more energy consumption.
In shallow-sea environments where profiling floats may be grounded, the release of drop weights has been implemented as a recovery method. The Mid-Depth Lagrangian Float developed by Katz and Groper exemplified this method, which released drop weight via a magnetic coupling mechanism [
23]. The Swish Float, designed by Stevens and Pawlowicz, employs galvanic timed release (GTR) to adjust the drop weight to return the float to the surface [
24]. A similar method of dropping weight was adopted by Snyder et al., who applied a thruster in addition to floating to provide more force for ascent [
25]. However, this design results in the float being unable to continue the observation mission after releasing the drop weight, and can only wait for surface recovery. Other researchers tried to prevent grounding through positive buoyancy designs. For example, the Autonomous Vertical Profiler (AVP) developed by CSIR National Institute of Oceanography used a top-mounted thruster to provide downward force for profiling observations [
26]. The profiler designed by Monteiro et al. was similar to AVP, and it had the advantage of enabling rapid profiling observations and anti-grounding capabilities [
27]. However, since the thruster must operate continuously, it results in high energy consumption.
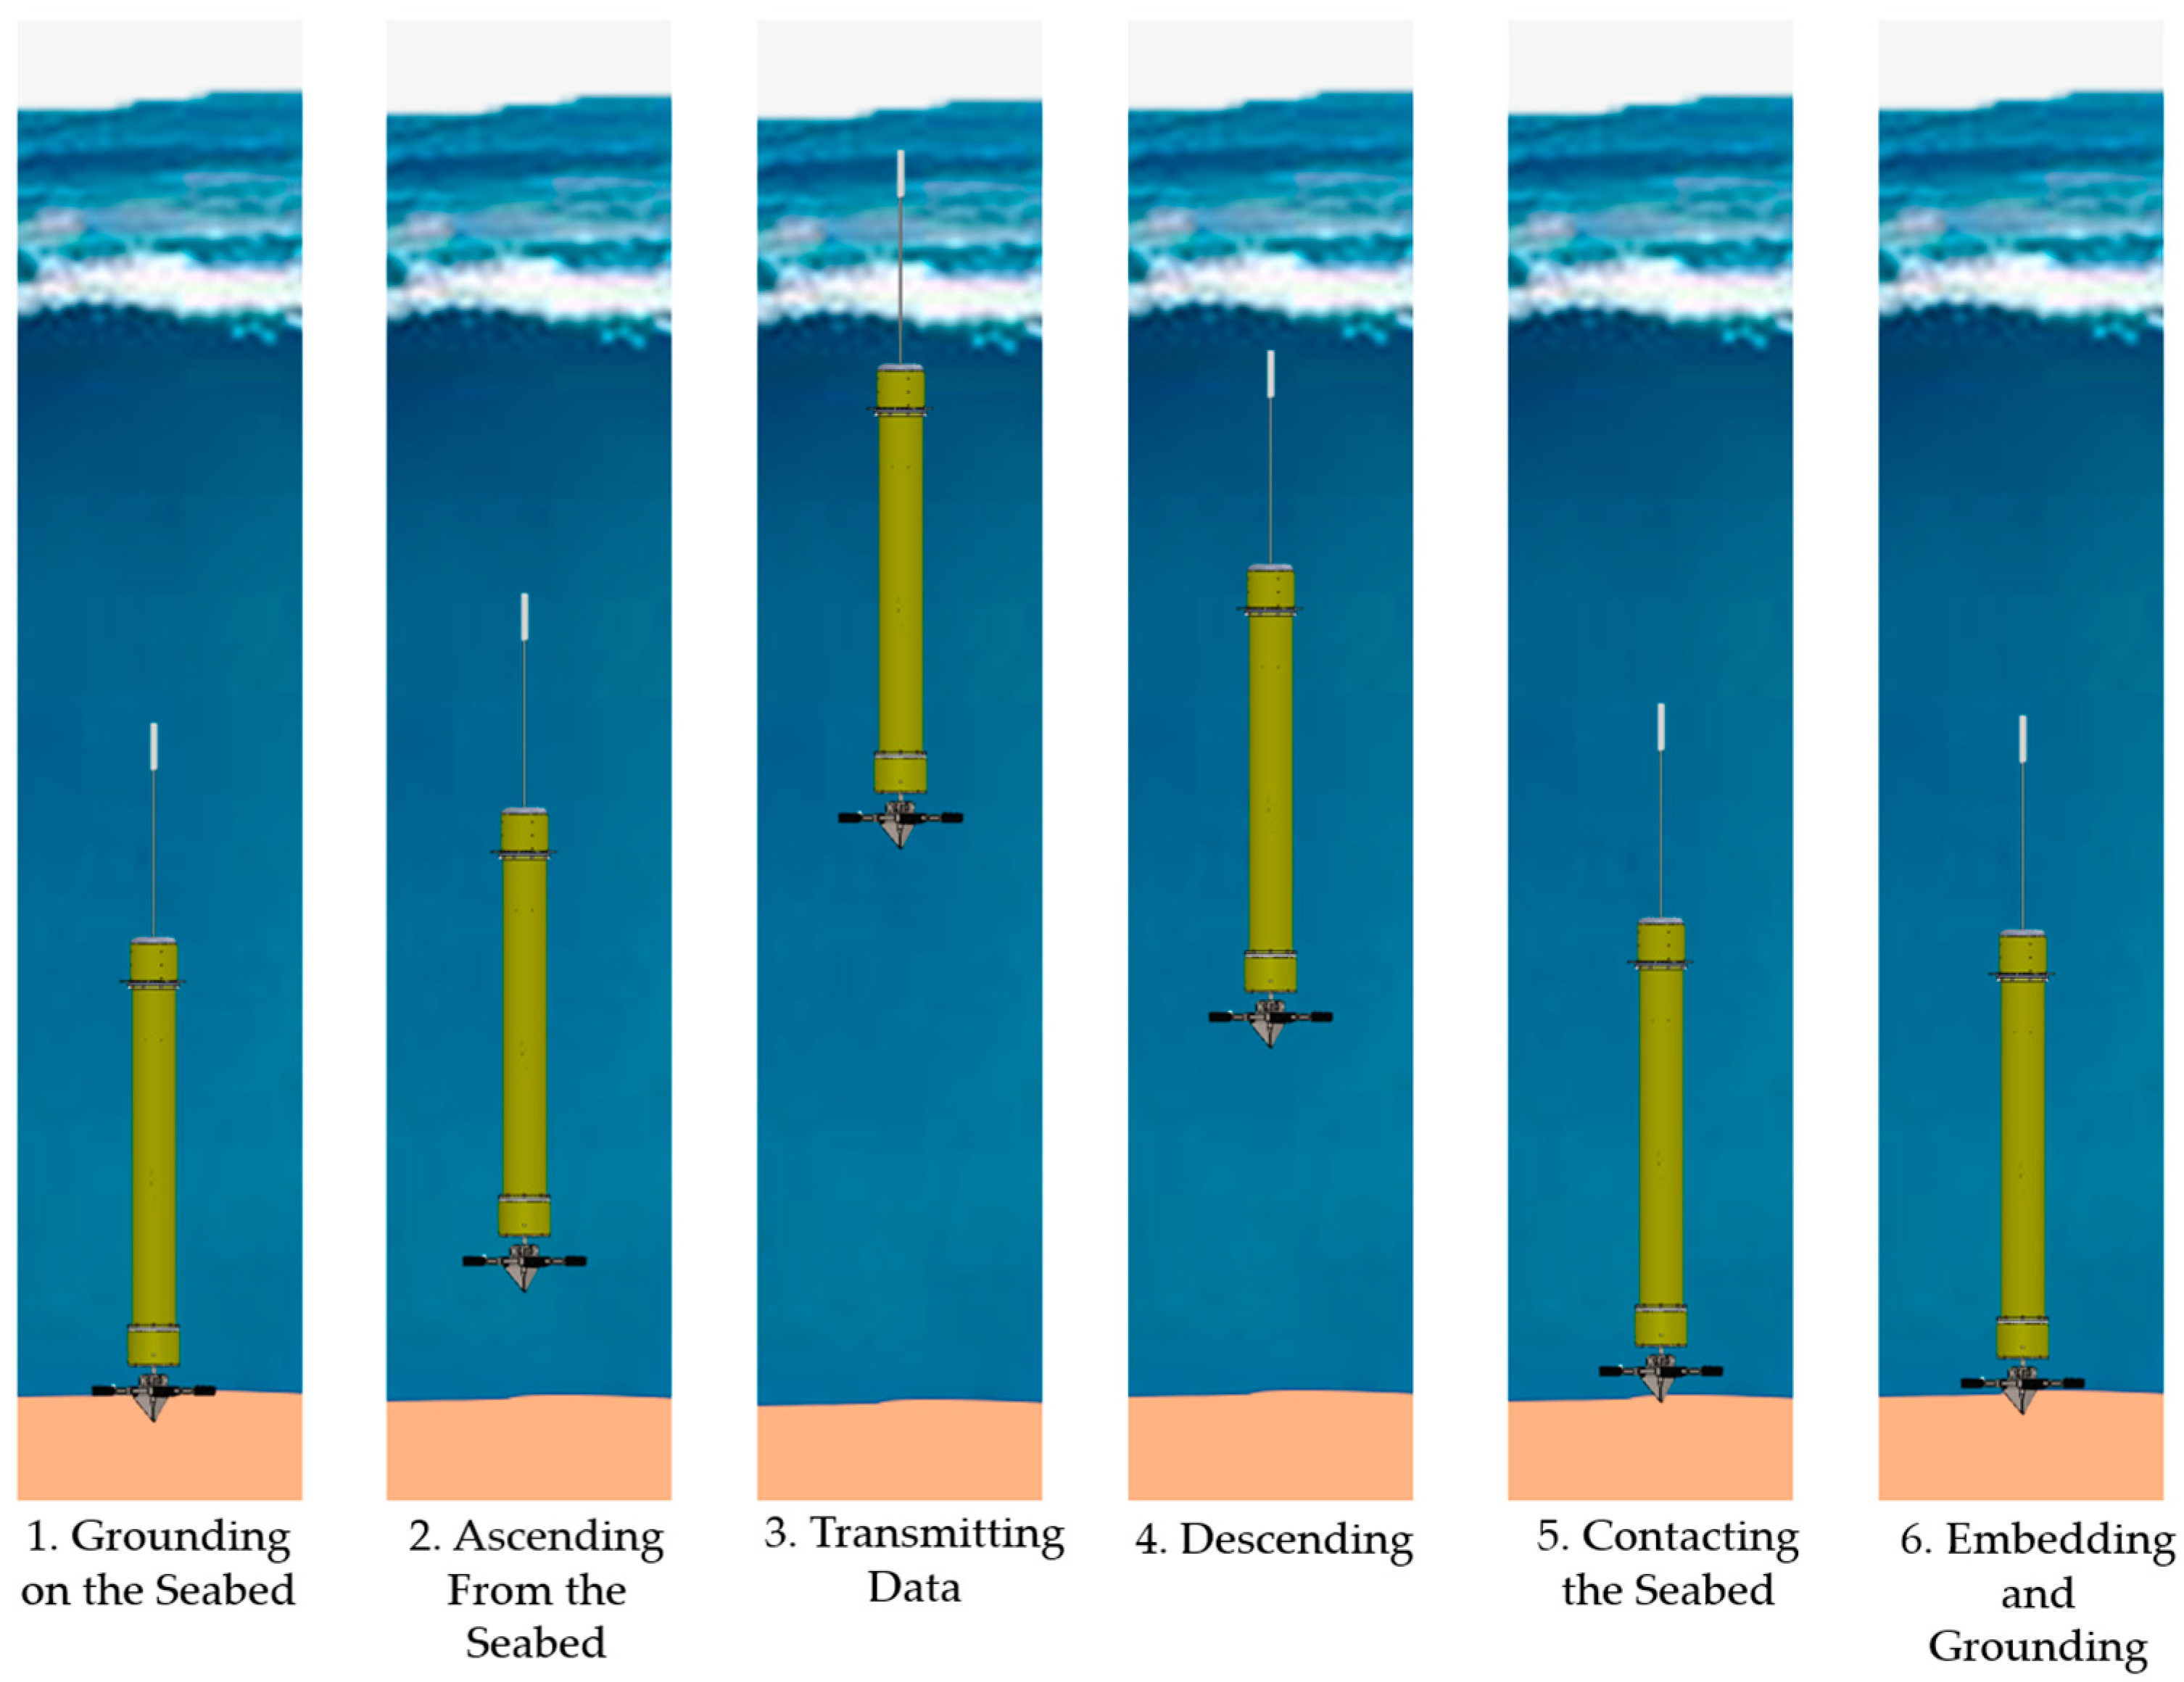
To improve the ability of long-term shallow-sea observations for profiling floats, a novel propulsion-enabled station-keeping anchoring system (PESKAS), which can be installed at the bottom of floats, is designed in this paper. The PESKAS has the following functions: (1) when the profiling float dives to the seabed, the anchor wings of the PESKAS penetrate seafloor sediment with the assistance of the thrusters and provide enough station-keeping force for the float; and (2) when the profiling float needs to ascend from the seabed, the thrusters generate an upward force for the float. Profiling floats equipped with PESKAS can achieve longer-term profiling observations in the shallow sea through/by an operational strategy: conducting measurements during slack tides and remaining anchored to the seabed during other periods.
4. Numerical Simulation and Analysis
Numerical simulation methods are used in this section to validate whether the designed anchor wing length and thruster force can achieve full penetration of the anchor wings of the PESKAS. The coupled Eulerian–Lagrangian (CEL) algorithm is a widely used numerical simulation approach for studying large-deformation interactions between anchor foundations and soil substrates. The algorithm coordinates interactions between Lagrangian and Eulerian meshes, ensuring computational accuracy in deformation zones [
60].
This paper uses the CEL algorithm in the nonlinear finite element software Abaqus/CAE 2024 to simulate the penetration process of PESKAS into seafloor sediments. Seafloor sediments are subjected to simultaneous elastic and plastic deformation, with plastic volumetric strain induced by compressive and shear stresses [
61]. The Mohr–Coulomb yield criterion in Abaqus is selected as the elastoplastic model for the sediments.
In addition to the clay-dominated sediment types mentioned in
Section 3.1, shallow-sea seafloor sediments also include clayey silt and silty sand [
62]. Therefore, comparative analyses across different seafloor sediment substrate types have been conducted (
Table 4), with the Young’s modulus set to E = 500
[
56].
To improve the computational convergence rate and simplify the PESKAS model, the simulation framework includes Lagrangian-mesh components (including anchor wings, support frames, and thrusters) and Eulerian-mesh discretized seafloor sediment, with relevant parameters as specified in
Table 1,
Table 2 and
Table 4.
Since the PESKAS is constructed of aluminum alloy with a Young’s modulus significantly higher than that of the surrounding seafloor sediment, the Lagrangian mesh-discretized PESKAS model is set as point-based rigid body constraints [
64] to improve the speed of computational convergence. The PESKAS is modeled via ten-node modified tetrahedral elements (C3D10M) to capture structural features accurately, resulting in a total of 15,283 mesh elements.
For Eulerian seafloor sediment, the Eulerian volume fraction (EVF) is calculated to track material flow between Eulerian mesh elements, where an EVF of 1 indicates full material occupation of an element, and 0 indicates no material [
65]. Therefore, the seafloor sediment, discretized via eight-node Eulerian integration elements (EC3D8R), is assigned an EVF of 1. The lateral boundaries of the sediment are constrained against horizontal displacement, and the bottom boundary is restrained against any movement in the vertical direction, whereas the upper boundary remains unconstrained. An Eulerian void region with an EVF of 0 is defined at the sediment surface to allow material to flow out of the initial area and to account for surface heave. The Eulerian domain contains 637,000 mesh elements.
Because the volume of the anchor wings is small and the penetration is vertical, the lateral mesh size of the seafloor sediment is set to 4 D (where D is the width of the anchor wings), and the vertical mesh size is set to 8 L (where L is the length of the anchor wings) to minimize the computational cost while maintaining the accuracy of the results. The interaction between Eulerian material (seafloor sediment) and Lagrangian material (PESKAS) is modeled via a general contact algorithm based on the hard contact method [
66].
Throughout the simulation analysis, the penetration of the PESKAS from the seafloor sediment surface is simulated with an initial velocity
applied in the vertically downward direction, and all other directional velocities are set to zero, which aims to reduce the computational burden. This velocity vector constraint simulates the vertical penetration behavior of the PESKAS hitting the seafloor sediment surface at a predetermined velocity [
56]. The final finite element model structure is shown in
Figure 8.
The descent velocity of the profiling float is fixed at
= 0.15 m/s (
Section 3.3). The simulation results of the penetration depth of the PESKAS under thruster-off conditions across different sediment substrates reveal that the maximum penetration depth of the PESKAS (
Figure 9a) tends to decrease because of the progressively increasing undrained shear strength from clay to clayey silt and silty sand. Owing to the elastoplastic deformation of seafloor sediments, the penetration depth peaks at approximately 1 s before slightly decreasing and stabilizing.
Figure 9b shows the velocity variation curve during PESKAS penetration. The results indicate that the velocity begins to decrease upon sediment contact, with faster attenuation observed in substrates with higher undrained shear strength (from clay to clayey silt and silty sand), confirming greater seafloor sediment resistance per unit time in stronger substrates. The simulations indicate that the profiling float’s penetration depth using its own kinetic energy is limited to a penetration depth of 0.05–0.08 m because of sediment resistance, which falls short of the full penetration design target (0.12 m anchor wing length). This necessitates the use of supplemental force from thrusters.
When the PESKAS approaches a stationary state after penetrating the seafloor sediment, the thruster activation is simulated by applying loads to the thruster surfaces with varying magnitudes of thruster force. The simulation results revealed that the penetration depth of PESKAS into the sediment begins to increase after thruster activation, and the penetration depth effectively increases due to external forces. A comparative analysis of
Figure 10a–c shows that greater undrained shear strength in the substrates necessitates greater force from the thrusters to achieve equivalent penetration depths. Within the same sediment substrate type, the incremental penetration depth per 20 N increase in propulsion force progressively diminishes beyond 0.1 m, with boundary effects observed to emerge. The final penetration depth stabilizes near 0.1 m.
Based on the simulation results in
Figure 10, under both free descent and thruster-activated conditions, the penetration depth of the PESKAS stabilizes after 3 s, with minor fluctuations. The X-direction stress contour plot at 30 s (
Figure 11) is selected for conservative analysis. The stress contour plot shows that the penetration of the PESKAS is further hindered because of sediment deformation and uplift, which contacts the bottom of the PESKAS. As shown in
Figure 11, the Mises stress in the sediment is primarily distributed near the anchor wings, with the maximum stress concentration (approximately
MPa) occurring at the wing tips where the contact area is the smallest. This phenomenon results from the wing tips compressing and displacing the surrounding sediment, creating lateral expansion and subsequent stress concentration zones. Additionally, significant Mises stress is also present at the interface between the bottom of the PESKAS and the sediment uplift, further demonstrating how this contact inhibits deeper penetration. The Mises stress gradually decreases to about
MPa with increasing radial distance from the wings, indicating diminishing compressive effects on the sediment. At this time, although the 0.12 m long anchor wings of the PESKAS have achieved a penetration depth of only 0.10 m into the sediment, the bottom of the PESKAS has reached the sediment layer, which can be considered fully penetrated. Through comprehensive consideration of thruster power consumption and penetration depth increment, different thruster forces can be configured for different types of seabed sediments. This can be achieved by adjusting the duty ratio to modify current magnitude, while simultaneously activating all four thrusters ensures uniform thrust distribution, with the corresponding total values provided in
Table 5.
According to the simulation results in
Figure 10, the anchor wings reach their maximum penetration depth within approximately 1 s of thruster activation. For different seafloor sediment substrates (clay, clayey silt, and silty sand), the total force of the four thrusters is set to 80–160 N, with a power consumption range of 325–920 W [
58]. Assuming a thruster activation duration of 1 s during penetration and, as analyzed in
Section 3.3, a smaller resistance during sediment ascent than during penetration, the ascent phase is also assigned a 1 s activation period for simplified estimation. Consequently, the total energy consumption per operational cycle (including the penetration and ascent phases) is calculated as 0.65–1.84 kJ. Compared with the energy consumption of the PROVOR profiling floats commonly used in the Argo program, which requires approximately 26.28 kJ per operating cycle at 2000 m water depth [
29], the energy consumption of each component is shown in
Table 6.
A comparison of the energy consumption components in the PROVOR profiling float reveals that the newly added energy consumption from the integrated PESKAS is relatively minor, exhibiting small impact on the overall power consumption of the profiling float.
5. Experiment
In order to validate the engineering applicability of the PESKAS in shallow-sea environments, a simulation experiment was performed in a large water tank in the laboratory. The PESKAS should be installed at the bottom of the profiling float for testing, but the volume of the float was too large to perform the experiment in the water tank. Therefore, in order to simulate the actual force state of the PESKAS installed on the profiling float, the air bag was used to balance part of the gravity of the PESKAS in the water. In the experiment, the sediment of clayey silt, common in shallow sea [
44], was chosen to fill the bottom of the water tank to a certain thickness, and then water was added to the tank to a certain depth to simulate the seafloor environment. To make the undrained shear strength of the sediment stronger than 5 kPa, the sediment was compacted before water was added to the tank. The thrusters of the PESKAS were powered by DC regulated power supplies and controlled by a signal generator during the experiment.
5.1. Preparation of Experimental Apparatus
The primary experimental apparatus includes: the PESKAS, an air bag, a force gauge, DC regulated power supplies, a signal generator, an oscilloscope, a water tank, a water pump, and a hoisting crane, as illustrated in
Figure 12.
The PESKAS was equipped with four thrusters. The air bag was used to adjust the total force of the PESKAS in the water, which was measured by the force gauge.
DC regulated power supplies (Model: GPD-3303S) provided power to the thrusters of the PESKAS; a signal generator (Model: AFG-2225) controlled the operational states of the motors, while an oscilloscope (Model: SDS 1202X-E) was used to monitor the output signals from the signal generator.
The water tank, with a diameter of 1.58 m and depth of 1 m, was used to hold sediment and water to simulate seafloor environment. The water pump facilitated tank drainage, and the hoisting crane assisted in PESKAS testing operations.
5.2. Experimental Procedure
(1) Buoyancy adjustment. Firstly, we filled the water tank with water. Secondly, we secured the air bag to the top of the PESKAS using straps and put it in the water tank. By adjusting the volume of the air bag, we achieved an overall force of 14 N (according to
Table 1 and
Table 2) of the PESKAS in the vertically downward direction, as shown in
Figure 13a. Finally, we drained the water using the water pump.
(2) Test environment setup. Because the length of the PESKAS’s anchor wings is 0.12 m, the sediment with a thickness of 0.3 m was prepared in the water tank for this experiment, and it could satisfy the full penetration requirements. With the PESKAS’s total height being approximately 0.3 m, the water depth was set at about 0.5 m to meet thruster propulsion needs. The PESKAS was submerged in the water and positioned at the center of the sediment surface using the hoisting crane, as shown in
Figure 13b.
(3) Experimental preparation. We connected the positive and negative terminals of the thrusters to the corresponding terminals of the power supply, and enabled the PARA/INDEP mode to obtain higher output current. We connected the positive terminal of the signal generator to the signal line of the thrusters, while establishing a common ground connection between the signal generator’s negative terminal and the power supply’s negative terminal via conducting wires. We configured the signal generator to output a PWM square wave signal with 50 Hz frequency, 3.3 V voltage, and pulse width ranging from 1000 to 2000 μs. Pulse width could be set from 1000 to 1499 μs to obtain the download force, while 1501 to 2000 μs to obtain the upload force. We connected an oscilloscope to the output terminal of the signal generator for real-time monitoring of control signals.
(4) Penetration test. We initialized the thrusters by sending a 1500 μs pulse-width signal from the signal generator. Upon hearing the motor activation sound, we adjusted the pulse width to 1150 μs (total download force of about 115 N) for approximately 1 s before stopping and powering off. Significant water turbidity could be observed during this process (
Figure 14a). After maintaining static conditions for a period, we used the water pump to drain the water (
Figure 14b). It was shown that the anchor wings of the PESKAS had achieved full penetration in the sediment.
(5) Sediment sampling. Two samples of approximately 20 cm sediment were taken by PC tubes for undrained shear strength test.
(6) Ascending test. Water was carefully replenished to the water tank to 0.5 m depth. Following thruster activation, we adjusted the pulse width to 1850 μs (total upload force of about 100 N) for approximately 1 s before stopping and powering off. It was shown that the PESKAS successfully ascended from the sediment and reached the surface of the water, as shown in
Figure 15.
(7) Sediment analysis. The average undrained shear strength of the sediment of 0–12 cm depth was determined by the direct shear apparatus (Model: S-TEC K6520) at Geotechnical and Underground Engineering Laboratory, Tongji University. Test results showed an average undrained shear strength of approximately 6.19 kPa (
Table 7).
5.3. Experimental Conclusions
It was shown by the experiment that the PESKAS could successfully achieve complete penetration and controlled ascent in sediment with undrained shear strength of approximately 6.19 kPa. It is demonstrated that the PESKAS can achieve the design objectives and has the engineering applicability in the shallow-sea environment.


