Article

Jellyfish and Ctenophores Around Gotland in the Baltic Sea—Local Data Contributing to Global Assessments

by
Florian Lüskow
1,*,
Philipp Neitzel
2,
Elizabeth R. Lawrence
3 and
Lina M. Nordlund
1
1
Department of Earth Sciences, Natural Resources and Sustainable Development, Uppsala University, Campus Gotland, 62167 Visby, Sweden
2
Independent Researcher, Berlin, Germany
3
Intergovernmental Oceanographic Commission of UNESCO (UNESCO-IOC), Jacobsenstraat 1, InnovOcean Campus, 8400 Oostende, Belgium
*
Author to whom correspondence should be addressed.
J. Mar. Sci. Eng. 2025, 13(5), 852; https://doi.org/10.3390/jmse13050852
Submission received: 20 March 2025 / Revised: 19 April 2025 / Accepted: 22 April 2025 / Published: 25 April 2025
(This article belongs to the Section Marine Ecology)

Abstract

:
In this study, we investigate the diversity and spatiotemporal distribution of gelatinous zooplankton (GZ) in the central Baltic Sea (coastal waters of Gotland and adjacent Eastern and Western Gotland Basins), a region characterised by low salinity and ecological sensitivity. Despite the Baltic Sea being the largest brackish water body globally, knowledge about its GZ, specifically, medusae and ctenophores, is limited. Our research synthesises the existing literature, open-access data, and local reports. Three to five GZ species occur within the studied area, with the common jellyfish Aurelia aurita dominating. Peak sightings of A. aurita happen between July and October, whereas the ctenophore Mertensia ovum and scyphozoan Cyanea capillata display sporadic occurrences. We identify notable gaps in understanding GZ phenology and food web impacts due to historical neglect and insufficient monitoring, particularly under low-salinity conditions (between 5 and 8), which restricts species richness. Jellyfish and ctenophores fall under the Essential Ocean Variable (EOV) “Zooplankton Biomass and Diversity” governed by the Global Ocean Observing System, UNESCO-IOC. EOVs are an approach for globally usable data and adhere to Findable, Accessible, Interoperable, and Reusable (FAIR) data principles. Including EOVs in routine collection and reporting would significantly enhance regional and global understanding, contributing to a holistic ecosystem view. Thus, we advocate for global ocean observation frameworks to comprehensively monitor GZ populations and their ecological, biogeochemical, and socioeconomic roles. Our findings serve as a crucial step towards understanding the implications of climate change for GZ assemblages in the Baltic Sea, promoting a holistic approach to marine ecosystem management.

1. Introduction

The Baltic Sea, the largest brackish water body in the world, is a unique and ecologically significant body of water located in Northern Europe. Stretching over 1600 kilometres in length and bordered by nine countries, the Baltic is a semi-enclosed, shallow sea that plays a critical role in the regional climate, biodiversity, and economy [1,2]. One of the most distinctive features of the Baltic Sea is its generally low salinity, resulting from the considerable influx of freshwater from a variety of rivers and limited connection to the open ocean. This creates a salinity gradient, where the salinity levels are significantly lower in the inner parts of the sea compared to the more open areas near the Danish Straits, which connect it via the Kattegat and Skagerrak to the North Sea [3].
The Baltic Sea’s salinity gradient is essential for the diverse communities that thrive in its waters. This west-to-east gradient influences the types of species that can survive in different regions, with freshwater species dominating in the northern parts (e.g., Bothnian Bay) and marine species found in the southern areas (e.g., Belt Sea). Vast parts of the central sea, the Baltic Proper, experience brackish conditions (salinity between 5 and 8). The reduced salinity in most areas of the Baltic also presents challenges for many marine multicellular organisms, as it creates a delicate balance between freshwater and saltwater species. It is here where we find a species minimum [4,5,6,7]. The Baltic Sea’s brackish water ecotone, with its low salinity combined with species invasions, cyanobacteria blooms, and climate change effects, supports fewer species than fully marine environments [8]. This unique habitat limits biodiversity, as only organisms capable of tolerating fluctuating or generally intermediate salinities thrive. Consequently, the Baltic is home to a relatively low number of specialised species adapted to these conditions. This general pattern is also true for gelatinous zooplankton (GZ) [9].
GZ are a taxonomically, morphologically, and functionally highly diverse group of organisms that traditionally includes cnidarian medusae and siphonophores, ctenophores, pelagic tunicates, but also other soft-bodied groups such as heteropods, polychaetes, and chaetognaths [10,11]. GZ are critical components in food webs, nutrient cycles, and carbon sequestration [12,13,14] in marine and brackish water ecosystems (to a likely smaller degree in freshwater systems). These organisms are notoriously difficult to study because of their often patchy distribution, delicate body structure, complex life cycles, boom-and-bust population dynamics, and complicated taxonomy [15,16]. Mass occurrences of these soft-bodied plankton organisms in coastal areas can have negative effects on fisheries, beach tourism, aquacultures, and energy generation [17,18]. In the Baltic, GZ may primarily be composed of cnidarian medusae and ctenophores.
GZ monitoring protocols lack standardisation within the guidelines set by the Baltic Marine Environment Protection Commission (HELCOM). In addition, quantitative long-term monitoring programmes are almost entirely missing in the central, eastern, and northern Baltic. Only recently, the first semi-quantitative long-term monitoring effort on cnidarian jellyfish in the Eastern Gotland Basin was published [19]. A meta-analysis of globally available long-term trends in jellyfish populations indicated, however, that the Baltic might experience increasing GZ populations (though with low certainty) [20]. No thaliaceans (e.g., salps) are inhabiting the Baltic [21]. There is an apparent west-to-east trend with increasingly less research being conducted on GZ [22]. Larger annual blooms (seasonal mass occurrences) of jellyfish and/or ctenophores in more saline waters may explain this trend, corresponding with the salinity gradient [23,24]. Both the salinity and research effort gradients point towards a disconnect between western/southwestern research efforts [23,25] and eastern/northern ones in the Baltic [19,26], with a few exceptions [27,28].
Specific knowledge on GZ species in the Baltic Proper is scarce. Aurelia aurita (Linnaeus, 1758) medusae occur in the western, southern, and central Baltic Sea in large numbers in the summer and autumn months, with potentially high top-down control on lower trophic levels in the pelagic ecosystem [19]. This is, however, rarely studied in coastal and open-sea regions of the Baltic Proper [29,30]. Ecological studies on the lion’s mane jellyfish Cyanea capillata (Linnaeus, 1758) or the non-indigenous ctenophore Mnemiopsis leidyi A. Agassiz, 1865 are even more scant [29,31,32,33,34,35]. The lion’s mane jellyfish is mostly restricted to the open sea of the southwestern Baltic Proper and deeper water layers [29,31,36,37], whereas M. leidyi can occur in considerable abundances in the Bornholm Basin and closer to the Swedish and Polish mainland [38,39,40,41,42]. The ctenophore Mertensia ovum (Fabricius, 1780) occurs from the Gulf of Bothnia to the western Baltic (Arkona Basin), but is generally understudied [41,43,44], whereas Pleurobrachia pileus (O. F. Müller, 1776) occurs in more saline western waters and is increasingly rare towards the east [32,45]. This being said, there is a considerable gap in (recent) knowledge in the central Baltic Proper on species occurrence, phenology, and temporal patterns. Without such knowledge and systematic monitoring [46], any attempt to comprehend GZ population dynamics, impacts on ecosystems and human coastal activities, and even to verify the 2012 predicted trend in the Baltic [20] is impossible.
Jellyfish and ctenophores fall under the Essential Ocean Variable (EOV, https://goosocean.org/what-we-do/framework/essential-ocean-variables/, accessed on 15 February 2025) “Zooplankton Biomass and Diversity”—a concept that the Global Ocean Observing System (GOOS, https://goosocean.org/, accessed on 15 February 2025), an UNESCO-IOC programme, implemented. EOVs are variables identified by experts that, when measured, provide essential information to inform global ocean health. GOOS has created (and is currently improving) helpful specification sheets for each EOV, outlining details on data collection requirements. As such, variables related to the zooplankton EOV should be included in routine collection and reporting to significantly enhance regional and global understanding of GZ. Following the FAIR (Findable, Accessible, Interoperable, and Reusable) data principles ensures GZ monitoring from the Baltic and elsewhere will contribute to a holistic view of marine ecosystems [47]. Hence, we must lay the groundwork to enhance GZ observations and integrate them into global efforts.
This study aimed to update and extend our knowledge on GZ in the central Baltic Proper, i.e., coastal waters of Gotland, as well as the Eastern and Western Gotland Basins, which have historically received limited research attention. In particular, we aim to (i) synthesise information on cnidarian jellyfish and ctenophores from the peer-reviewed literature, open-source online data repositories, and local radio and newspapers; (ii) identify knowledge gaps; (iii) estimate, for the first time, jellyfish abundances in coastal Gotlandic waters using a non-invasive recording technique; and (iv) formulate priority objectives for future ecological research in the Baltic Proper region, which should place more emphasis on connecting already available data resources.

2. Materials and Methods
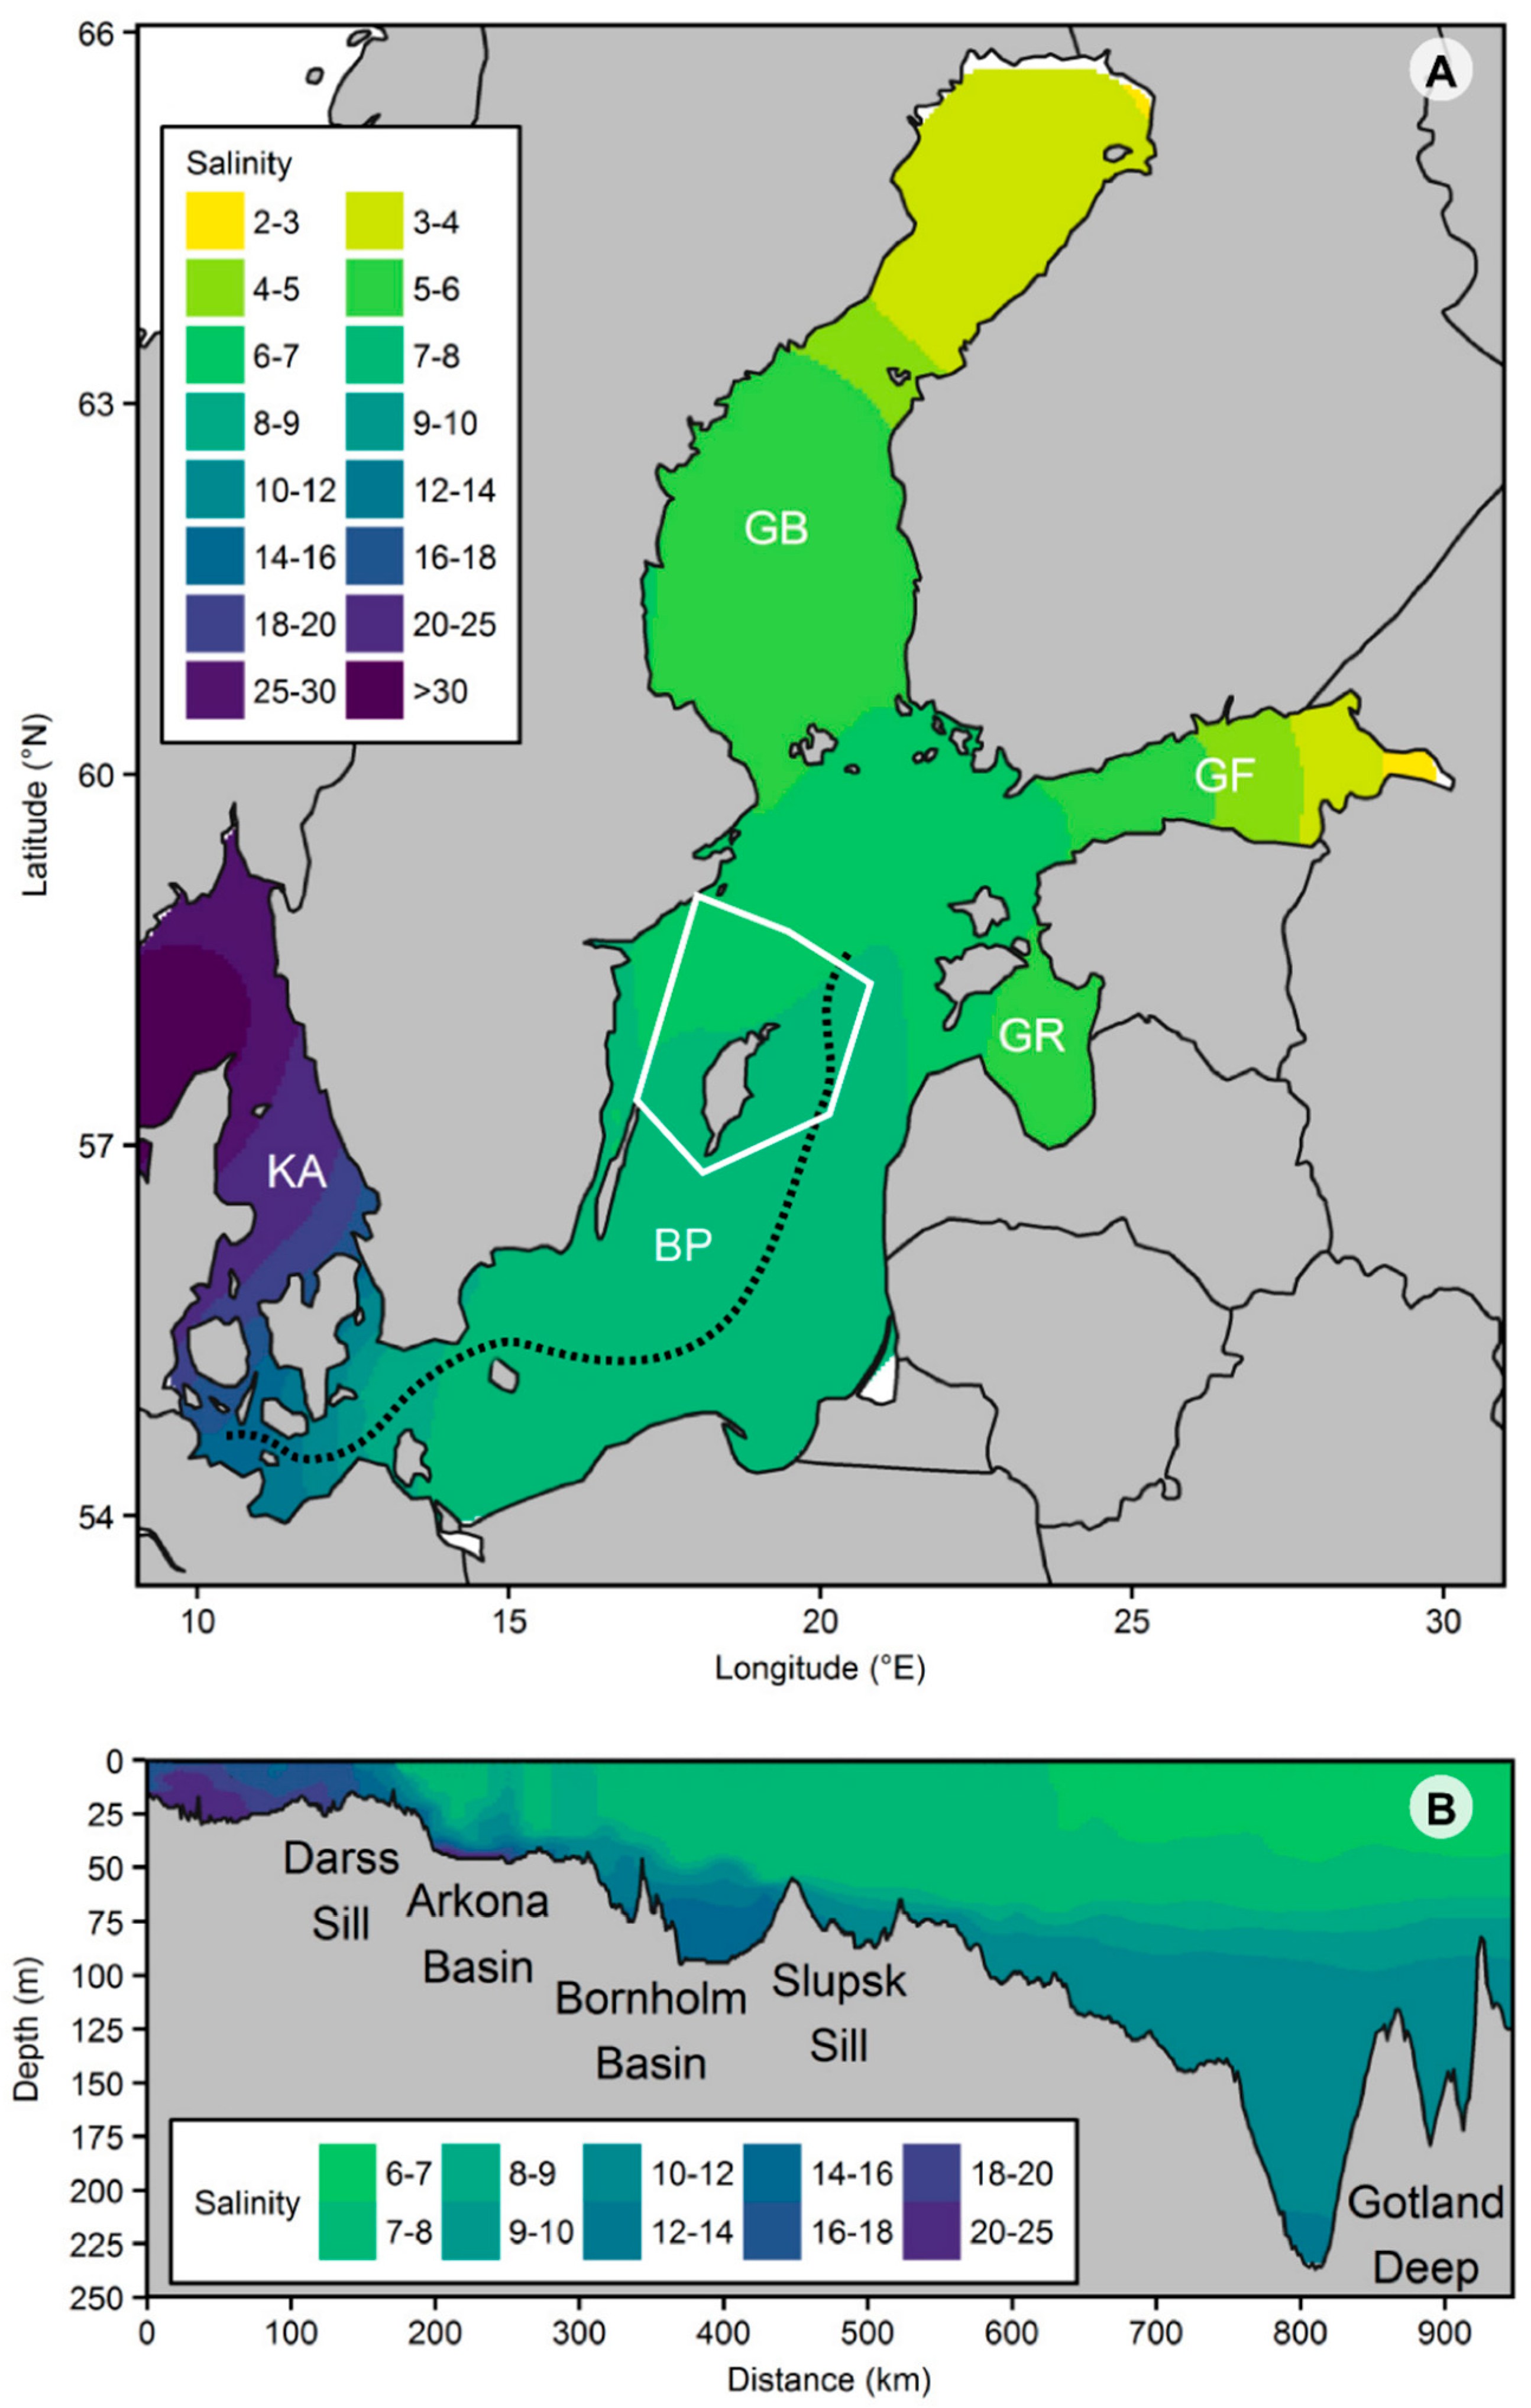
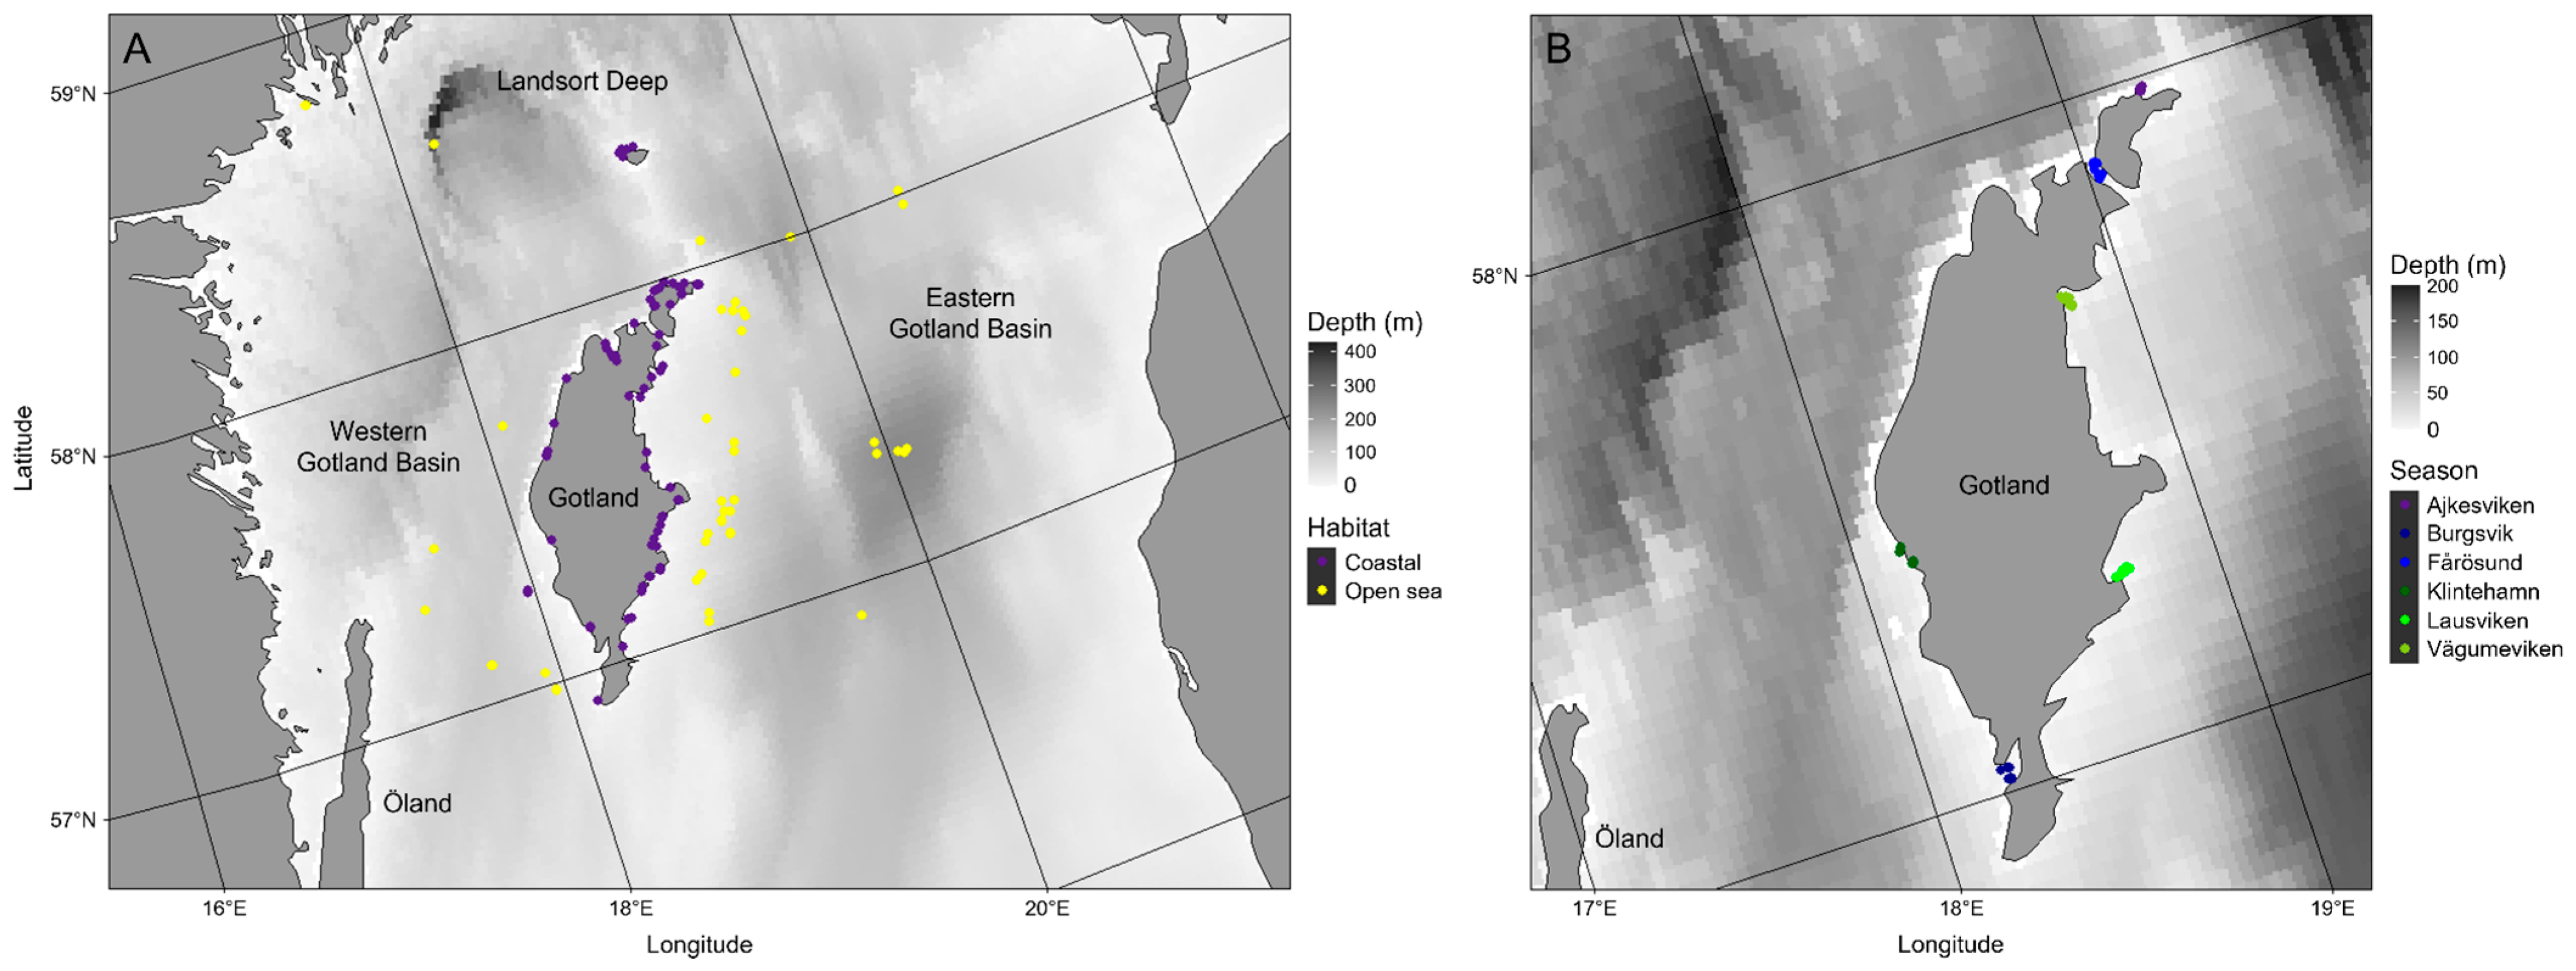
2.1. Study Area

The study area covers the coastal waters of Gotland with sandy and rocky habitats, as well as the Eastern and Western Gotland Basins, located in the central Baltic Sea (Baltic Proper; Figure 1 and Figure 2A). On sandy bottoms, seagrass and freshwater plants grow, while on rocky bottoms, macroalgae thrive. The Eastern Gotland Basin is characterised by deeper waters with strong stratification, whereas the Western Gotland Basin (including the deepest point in the Baltic, the Landsort Deep) has more dynamic conditions with significant freshwater input [48,49]. It is these deep basins that hold water masses with higher salinity (>10); strongly reduced dissolved oxygen concentrations (<2 mg L−1); and increasing with residence time, elevated hydrogen sulphide concentrations below 150 m [50]. Conditions in deep basins may contrast sharply with surface water conditions (salinity typically between 6 and 8; Figure 1) and only change during deep-water renewal after massive inflow of North Sea water through the Danish Straits. Horizontal water movements in the Baltic are primarily driven by the wind, differences in air pressure, and differences between water mass densities. As the currents in the Baltic Sea depend on the weather, they vary; there are no permanent currents like in the world’s ocean basins. Southwestern winds are dominating the Baltic Sea area, and together with the rotation of Earth, counter-clockwise circular water movements in the Baltic can be observed [51]. For defining the study area, we used a polygon in open-access online data repositories (see below) oriented at landmarks like the northern tip of Öland and the Gotska Sandön island with the following coordinates: 58.4362, 19.3469; 58.8852, 17.6015; 57.3562, 17.0892; 56.8370, 18.1494; 57.2464, 20.1489; 58.0517, 20.6763 (Figure 1).

2.2. Literature and Open-Source Data Mining

Multiple sources were used to search for information on gelatinous zooplankton, i.e., cnidarian medusae and ctenophores, from the central Baltic Proper in December 2024. These included published scientific papers available on the Web of Science and in Google Scholar (search terms included “comb jelly”, “ctenophore”, “jellyfish”, and “gelatinous zooplankton”, in combination with “Baltic Sea” and “Gotland”). Materials in all languages were accepted, but only papers in English, German, and Russian were returned. We also reviewed grey literature pieces (theses and a conference abstract) [31,37,53]. Furthermore, species records from the Ocean Biodiversity Information System (OBIS [54], https://obis.org/, accessed on 15 January 2025), the Swedish Biodiversity Data Infrastructure (SBDI, https://biodiversitydata.se, accessed on 15 January 2025), and iNaturalist® (https://www.inaturalist.org, accessed on 15 January 2025) were reviewed for entries in the study area indicated by the polygon (Table 1). The Swedish Agency for Marine and Water Management (SHARK, https://shark.smhi.se/hamta-data, accessed on 15 January 2025) website was searched with appropriate terms (see list above), but could not deliver any entries in addition to the ones found previously [55,56,57,58,59,60,61]. SeaLifeBase (https://www.sealifebase.ca, accessed on 15 December 2024) was searched for data in Sweden, and despite showing 20 entries for “Jellies”, 13 of them referred to marine (and freshwater) hydrozoans with/without a medusa stage. Of the remaining seven entries, three were ctenophore and four were scyphozoan jellyfish species. We will elaborate on these findings in the section below. All open-source repositories were accessed in December 2024 and January 2025. Data extracted from OBIS, SBDI, and iNaturalist® totalled 218 entries. This included a considerable number of false entries and duplicates across data portals. After cleaning, the resulting dataset contained 148 unique entries (Table 1, Figure 2A), which equals a reduction of 32.1%. The distance of a record location to the nearest shore was measured in Google Earth Pro®.
Local ecological knowledge also exists/is communicated through radio clips and newspaper articles. We, therefore, searched https://www.sverigesradio.se and https://www.helagotland.se (accessed on December 2024 and January 2025) using the keywords “öronmanet” and “manet”, which are the Swedish words for common jellyfish and jellyfish, respectively. The search returned 56 hits in local newspapers (partly overlapping between keywords), of which 45 were not (directly) related to the study objectives. The oldest useful record was published in October 2002. The search for radio clips resulted in 3 clips from the Gotland region. Whether no older records exist, or articles were not yet digitised, is unknown.

2.3. Opportunistic Jellyfish Abundance Estimates in 2022

Available video footage from seagrass meadows around Gotland was reanalysed to estimate jellyfish abundance in this study. The video footage originates from a research study in 2022 that was designed to investigate seagrass-associated fish around Gotland [62] (L. M. Nordlund, unpublished data). Six sites with known seagrass (Zostera marina Linnaeus, 1753) habitats were sampled in August and September 2022. A GoPro HERO 5 Black camera was used to record the substrate along a modified Nordic coastal survey net (55 m long and 1.8 m deep). The GoPro camera was towed horizontally at a speed of less than 1 km h−1 (approximately 14 m min−1) for 55 m above a seagrass-dominated soft-bottom habitat at 2.1–6.9 m depth (Table 2). The camera itself was located between 80 and 100 cm above the seafloor. All transect work was carried out either in the evening (18:10–21:02, local time) or morning (08:54–09:59, local time). The traditional fish monitoring programme is based on net deployment in the evening and retrieval the following morning. Camera transects were thus performed opportunistically, depending on time availability and sea state. Sixty such transects (six sites with each ten camera deployments; Table 2, Figure 2B, Video S1) were filmed, with an average length of about 4 min (range: 2:00–6:57 min), depending on the wave direction.
To estimate the abundance of jellyfish from the video footage, the filmed water volume needs to be calculated. We approximated the volume of water captured on each video transect as a right, triangular prism with a known height of 1 m (distance of the camera to the seafloor) and a known length of 55 m (the transect length). We calculated the prism’s width, which is the horizontal extent of the seafloor visible on the video, through trigonometry based on the angular field of view, the sensor size of the GoPro HERO5 Black, and its focal length. The video transects were performed with two different setups: one in which the optical axis of the camera was perpendicular to the seafloor, and one in which the optical axis of the camera was rotated by 70° (rotation estimated from the videos) upwards in the direction of the transect movement. These two camera setups resulted in two volume estimations. A detailed document on the calculations can be found in the Supplementary Materials (File S1).
The temperature was measured at the surface and near the bottom using a ProDSS Multiparameter Digital Water Quality Meter (YSI, xylem, Yellow Springs, OH, USA). Wind direction and speed data were recovered from https://www.kustvader.se (accessed on 12 September 2022) and https://www.smhi.se (accessed on 12 September 2022) at the beginning and end of the transect (Table 2). No other environmental parameters were measured at the time of data collection.

2.4. Data Visualisation

All visualisations were made in R [63] version 4.4.1. The figures and map were created using the R packages “ggplot2” [64], “ggOceanMaps” [65], and “ggspatial” [66] and FreeHand MX®.

3. Results

3.1. Species Richness (Literature and Open-Access Data)

In the coastal waters of Gotland and the adjacent Eastern and Western Gotland Basins, there are five species of gelatinous zooplankton (GZ) reported in the peer-reviewed and grey literature, as well as open-access biodiversity repositories (Table 1, Figure 2A). The common jellyfish Aurelia aurita is by far the most often reported species, followed by the ctenophore Mertensia ovum. Both species appear in the peer-reviewed literature, theses, reports, and online biodiversity databases. While A. aurita is listed in SeaLifeBase, there is no entry for M. ovum in Sweden yet. Noteworthy, the second scyphozoan jellyfish species, Cyanea capillata, in the Baltic Proper has only been reported in the grey literature, recently in a peer-reviewed paper, and not in biodiversity repositories (Table 1). Given its biology, this is not necessarily surprising. We will elaborate on the reasons for the disagreement of biodiversity sources in the next section. In SeaLifeBase, C. capillata is listed; however, all data points are located in the western/southwestern Baltic, with only one north of Stockholm. The invasive ctenophore M. leidyi is included with a few records in OBIS and SBDI; however, these observations lack literature support. Even more so, the ctenophore Pleurobrachia pileus was recorded only five times in OBIS, but in none of the other biodiversity sources (Table 1). While P. pileus is recognised in SeaLifeBase as a species present in Swedish waters (widespread occurrence in the Baltic Proper and Gulf of Finland), M. leidyi is, surprisingly, not. Records of the latter two species are doubtful, likely reflect misidentification of M. ovum, and will be discussed below.
Other non-indigenous brackish water GZ species in the Baltic Sea, i.e., Blackfordia virginica Mayer, 1910 and Maeotias marginata (Modeer, 1791), have not been reported from the Gotland Basins and coastal waters yet. The introduced freshwater species Craspedacusta sowerbii Lankester, 1880 has similarly not been sighted on Gotland. While benthic hydrozoans with/without a medusa stage may be expected from the study area, there are no records existing. The distance to shore of the compiled GZ species records varies from 0 and 71 km. Gotland was, in most cases, the closest shore; in a few cases, it was Öland, Sweden’s second largest island, or the Swedish mainland. Most confidence in the reported species records can be given to A. aurita and M. ovum. These are also the species with the richest datasets. We, therefore, attempted in the following section to summarise information regarding their seasonal presence patterns in the studied area.

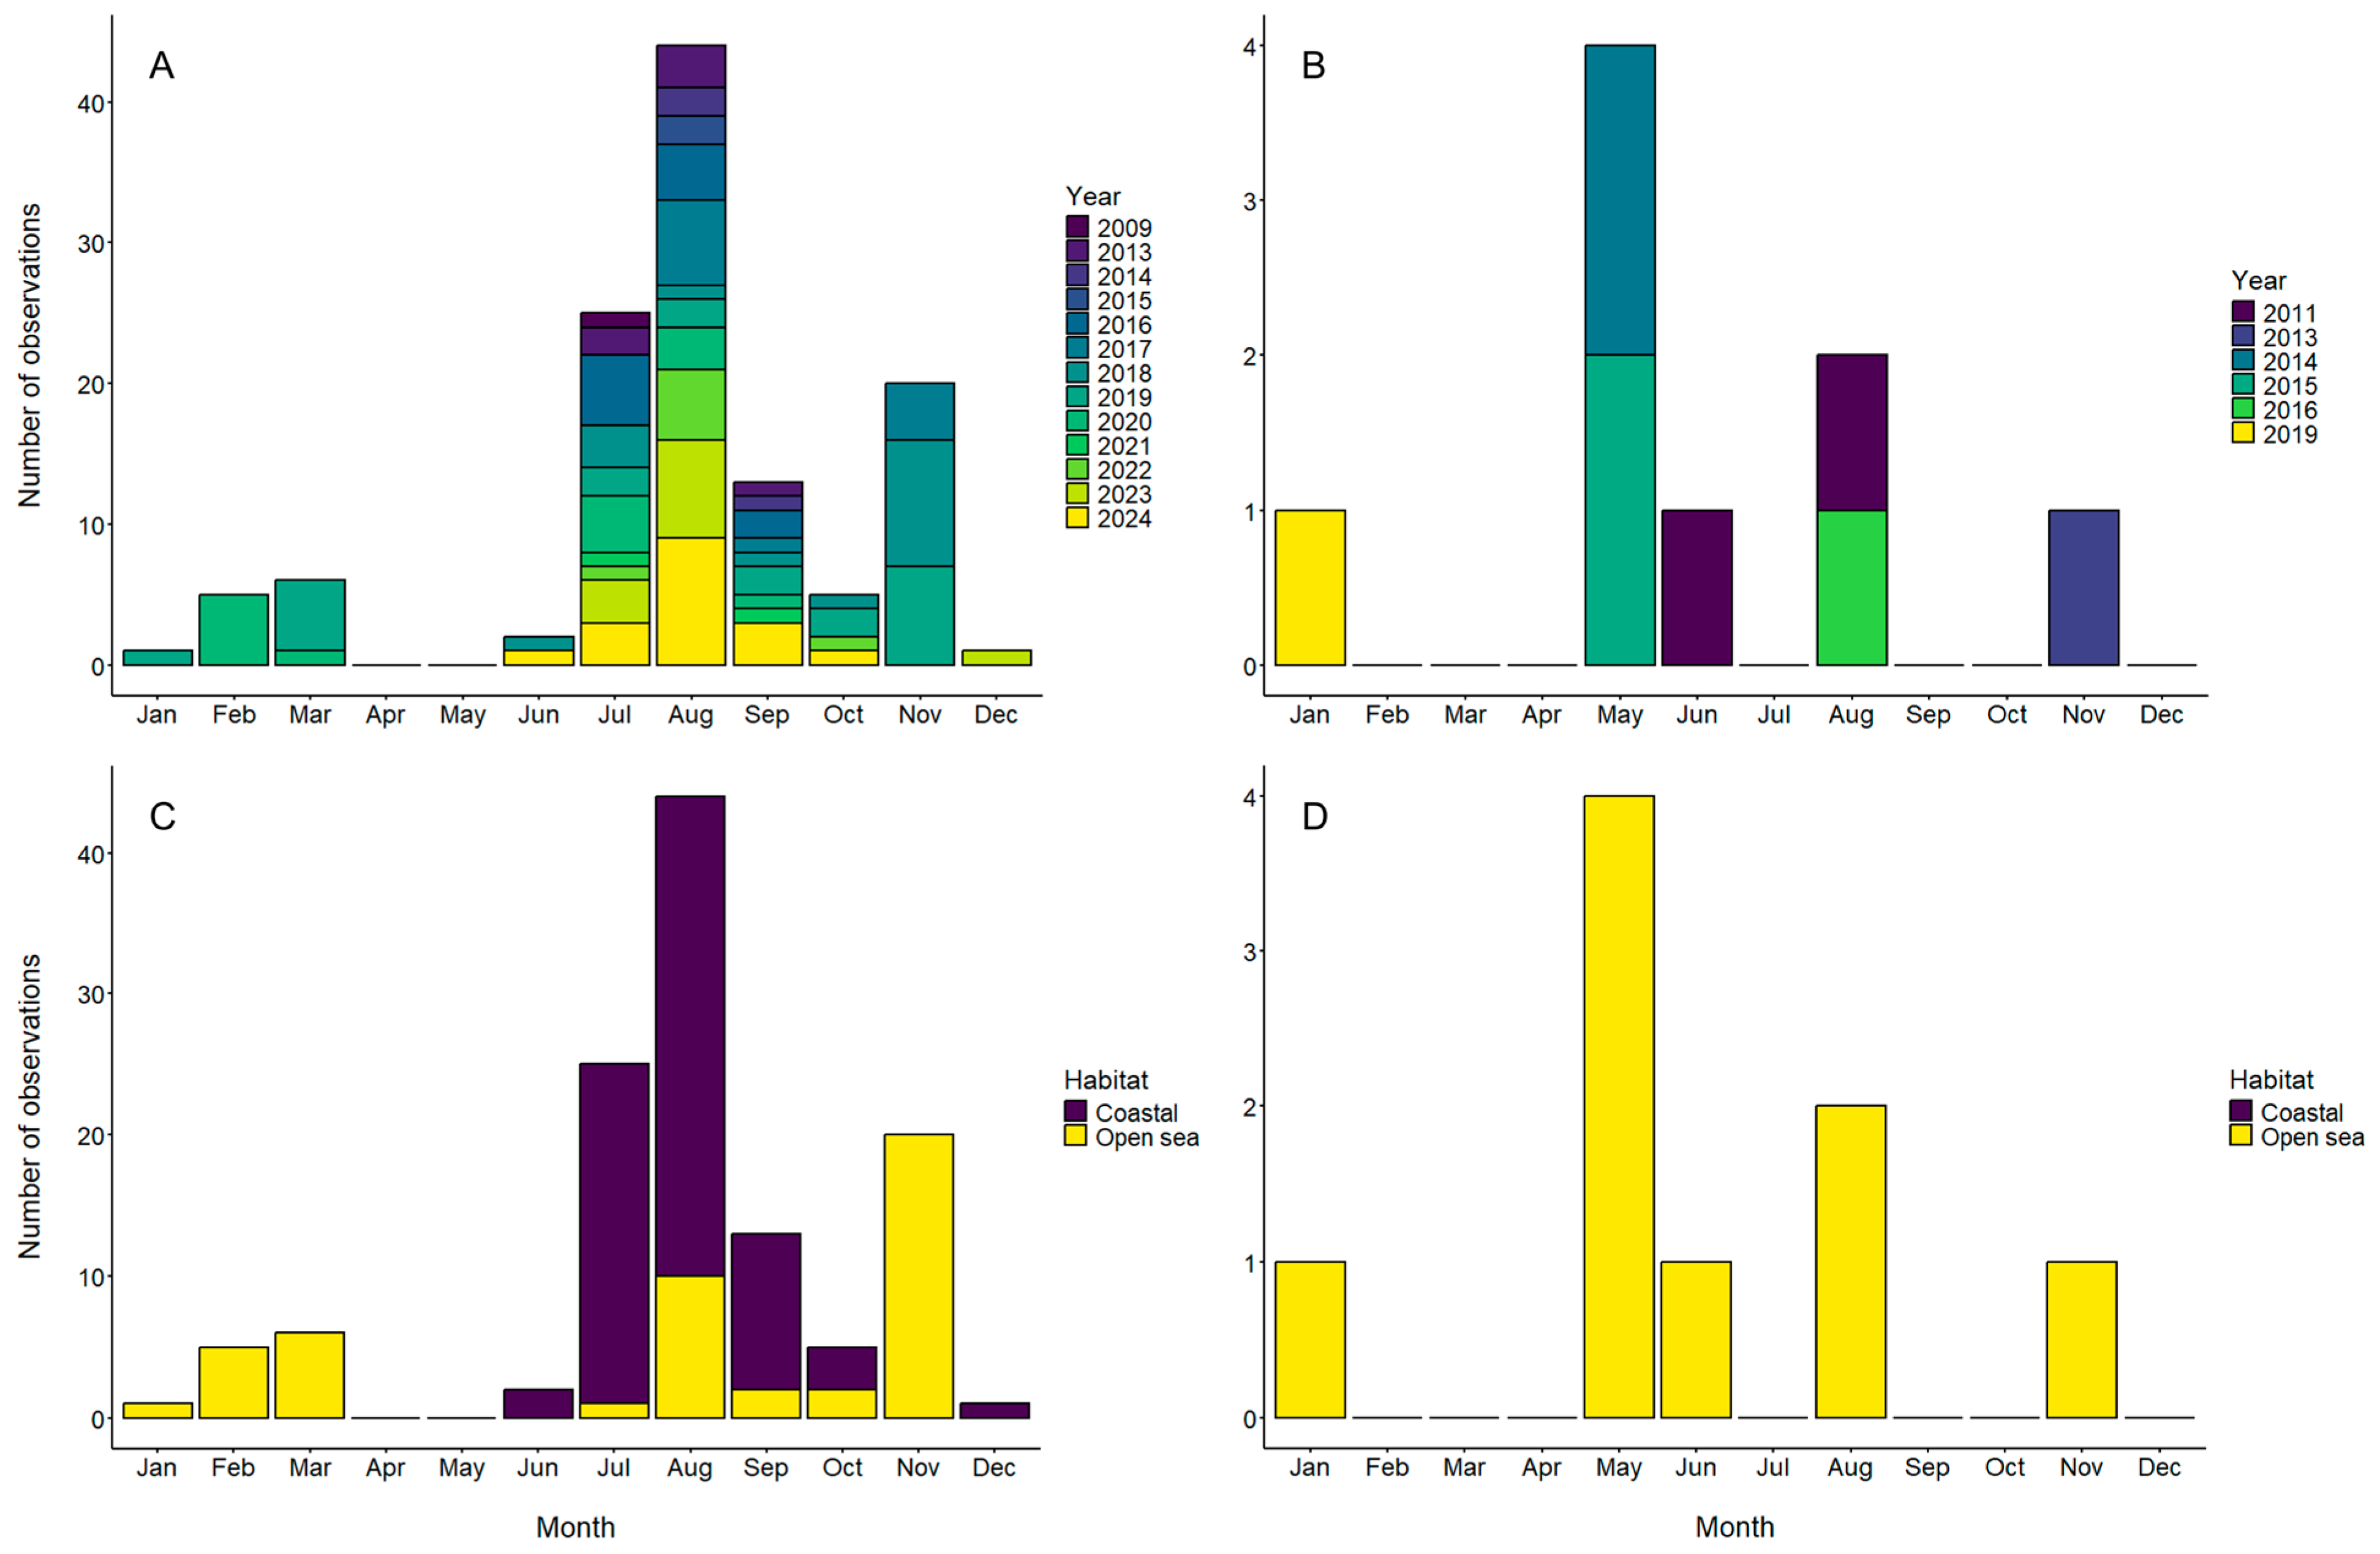
3.2. Phenology of Aurelia aurita and Mertensia ovum in Gotlandic Waters

Monthly changes in the number of observations of A. aurita and M. ovum are apparent (Figure 3). Based on the 122 and 9 records that we retrieved from open-source online data repositories (not including records from the grey and peer-reviewed literature) for the two species, respectively, different patterns can be derived. Most records (N = 87, 71.3%) of A. aurita medusae were reported in the summer/autumn months (July to October), with a higher number of records from recent years (since 2020). It is, however, noteworthy that records were made in all months (except for April and May) to varying extents (Figure 3A). Aurelia aurita medusae can thus be found year-round in the study area. Individuals or groups of large (>10 cm in diameter) and actively swimming A. aurita medusae can be found in Visby Harbour near the surface throughout December and January, with surface temperatures generally below 6 °C (Figure S1; F. Lüskow, pers. obs.). It is critical to differentiate between records that were made in coastal waters or of stranded specimens (highest likelihood in summer months, when tourists are numerous on Gotland) and in open-sea areas, where records usually originate from (dedicated) research expeditions. Such open-sea observations are then clustered and bias the annual cycle, e.g., November 2017–2019 (Figure 3A,C). In general, A. aurita specimens are encountered in coastal Gotlandic waters from June to October, with peak records in July and August (Figure 3C). The considerably lower number of records in open-sea areas and outside the summer/autumn window may be explained by several aspects that we elaborate on below. Records do not provide information about specimen size, so we cannot provide details on size–frequency distributions, monthly changes, and growth/degrowth patterns. We are not aware of local polyp (benthic asexually reproducing life cycle stage) beds and, therefore, strobilation, despite a large amount of suitable hard substrates (natural and artificial) around the island. No ephyrae (young pelagic stage budded from the polyp) have yet been sighted around the island of Gotland.
A similarly clear seasonal record pattern cannot be found for M. ovum. Opportunistic observations originate from only six years (2011–2019; Figure 3B) and were made exclusively in open-sea areas (Figure 3D). While most records came from May (N = 4, 44.4%), the species is observed in months with increased (June and August), as well as low (November and January), surface temperature. No M. ovum strandings along the shores of Gotland are known yet.

3.3. Radio and Newspaper Mentioning of Jellyfish Around Gotland

Three radio clips covered unusually high occurrences of A. aurita medusae around Gotland in August 2016 (https://www.sverigesradio.se/artikel/6485631, accessed on 15 February 2025), July 2018 (https://www.sverigesradio.se/artikel/7002938, accessed on 15 February 2025), and September 2024 (https://www.sverigesradio.se/artikel/manetinvasion-i-visby-hamnade-nastan-i-chock, accessed on 15 February 2025). Some of these events were also addressed in newspaper articles. Eleven articles from Gotlandic newspapers published between October 2002 and September 2024 addressed jellyfish. In total, 91% of them were published in summer and autumn (between June and October, with only one article released in March), which indicates a seasonal imbalance in interest in this topic. There is no evidence of an increase in jellyfish-related newspaper articles over time. Most releases addressed sightings, strandings, and even mass occurrences of A. aurita medusae around Gotland. One article published in September 2019 covered a drift trash collector in Visby Harbour that also incidentally fetches jellyfish. In August 2007, two articles reported the absence of M. leidyi in the coastal waters of Gotland. As this species was first sighted in October 2006 in the Baltic Sea, the two 2007 articles are directly linked to a growing concern about the detrimental effects of this marine invader. Neither radio nor newspapers report on the second prominent species, M. ovum, in the study area.

3.4. Abundance Estimation Based on Camera Transects

The surface temperature varied considerably between camera transects filmed between mid-August and mid-September, with an average of 18.3 °C (± 2.5 °C SD, range: 13.7–22.1 °C, N = 60). Similarly, the bottom temperature ranged between 11.5 and 21.8 °C, with an average of 17.7 ± 2.9 °C (Table 2). Temperature differences between the surface and bottom were generally small (0.7 ± 1.2 °C), but could be as big as 5.9 °C. While the wind direction varied from 30 to 360°, the average wind speed was moderate with 4.4 ± 1.4 m s−1 (range: 1.0–7.0 m s−1, N = 60). Aurelia aurita was the only gelatinous zooplankton species observed on GoPro camera transects above seagrass habitats. In total, more than 4000 A. aurita medusae were counted, with encounter rates varying from 0 (N = 8) to 638 per transect (Table 3). Besides the seagrass, aquatic plants such as Stuckenia pectinata (L.) Börner, 1912 and macroalgae like Fucus vesiculosus Linnaeus, 1753 were frequently seen (Video S1). Within and above the seagrass habitat, many small fishes (likely gobies) were recorded; details on other faunal and floral groups will be presented in another study.
Jellyfish were drifting or actively swimming in most cases above the seagrass habitat, while single specimens (fewer than a dozen) also occurred in between the seagrass blades. Jellyfish abundances varied between 0.0 and 4.3 ind. m−3, with an average of 0.6 ± 0.9 ind. m−3 (Table 3). While it was not possible to infer the individual sizes (and thus jellyfish biomass) from the GoPro footage, we noticed a variety of sizes along the 60 transects. In 81.7% of transects, the abundance of jellyfish was moderately low (<1 ind. m−3). In August, abundances were, on average, double the values in September (0.75 and 0.35 ind. m−3, respectively). We cannot infer a geographic jellyfish hotspot based on the obtained data; however, the eight highest abundance values (>1 ind. m−3) were estimated from Gotland’s south and west (Burgsvik and Klintehamn sites, respectively; Figure 2B). We did not find a clear correlation between wind speed and jellyfish abundance, despite a tendency towards higher abundances at moderate (around 4 m s−1) wind speeds (Table 2 and Table 3). Also, the wind direction could not be directly linked to the jellyfish abundance. Two examples with high nearshore jellyfish numbers and onshore wind were stations #K4 and #B6, with 4.3 and 3.7 ind. m−3, respectively.
The abundance and/or biomass of a zooplankton taxon, measured in per unit volume or unit area of water, are the sub-variables of the zooplankton Essential Ocean Viable (EOV). To ensure the jellyfish abundance estimates produced in this study adhere to both the EOV guidelines and the Findable, Accessible, Interoperable, and Reusable (FAIR) data principles, we developed an example scheme for depositing GZ data in global repositories such as the Ocean Biodiversity Information System (OBIS; Figure 4). This scheme can act as a blueprint for future efforts in GZ data collection, formatting, publishing, and accessing.

4. Discussion

4.1. Gelatinous Zooplankton Species Richness in the Baltic Proper

The Baltic Proper harbours a low number of gelatinous zooplankton (GZ) species (here: cnidarian medusae and ctenophores), which is in line with the overall species minimum in the typical brackish conditions [4,5,6,8]. Only two scyphozoan species (Aurelia aurita and Cyanea capillata) were confirmed from the peer-reviewed and grey literature [9,19,22,31,37,53], open-access biodiversity repositories (Ocean Biodiversity Information System (OBIS), Swedish Biodiversity Data Infrastructure (SBDI), and iNaturalist®), local radio and newspaper contributions, and new opportunistically collected underwater footage. Of the three listed ctenophore species, only Mertensia ovum is supported by peer-reviewed literature [41,43,44] and records in OBIS and SBDI from the open sea. The invasive ctenophore Mnemiopsis leidyi and the native Pleurobrachia pileus have only been identified in OBIS and SBDI records. However, these are doubtful, as both species require higher salinity for metabolism and reproduction [41,42,43,45], and were likely misidentified M. ovum specimens. On a recent cross-regional cruise in September 2020, no M. leidyi specimens (larvae to adult) were recorded in waters northeast of the Bornholm Basin [35]. Aurelia aurita was found in the upper 30 m of the water column, apart from one specimen in the central Bornholm Basin (45 to 50 m) and off Gotland, where one specimen was found between 60 and 70 m. Small A. aurita (<50 mm) were encountered across the entire investigation area, whereas the largest specimens (>150 mm) occurred within and to the east of the Arkona Basin [35]. A few C. capillata specimens (N = 3) were caught off western Gotland between 60 and 70 m. While low in numbers, it can be hypothesised that these medusae will exert a predation pressure on fish eggs and larvae in the midwater.
The overall low species richness (3–5 species) can also partly be explained by the historical disinterest in this group, the missing taxonomic experts, and dedicated sampling campaigns in this part of the Baltic Sea. For comparison, in Puck Bay, Poland, A. aurita, C. capillata, M. leidyi, and P. pileus are seen with varying frequency [32]. In this study, we focussed on understudied gelatinous macrozooplankton (>20 mm), while excluding gelatinous mesozooplankton (<0.2–20 mm), i.e., appendicularians. Appendicularians play an important role seasonally in Baltic Sea food webs [67]. The phenology and ecological roles of appendicularians in the central Baltic Sea are considerably better studied than those of their macroscopic counterparts.
The Baltic Sea is prone to invasions of species from the Ponto-Caspian and other regions [68]. Regardless of sightings of non-indigenous GZ species in the western/southern (Blackfordia virginica and M. leidyi) and eastern (Maeotias marginata) parts of the Baltic, none of them has been reported from Gotlandic coastal waters or the Gotland Basins yet [27,41,69,70,71]. This is somewhat surprising given the spatial interconnectedness and Visby being one of the ten busiest cruise ship ports in the Baltic (https://www.cruisebaltic.com/modularpages/reports, accessed on 15 February 2025). Other typical members of GZ assemblages, such as thaliaceans and siphonophores, are missing in the Baltic Proper [21]. We also expected to find the invasive freshwater jellyfish Craspedacusta sowerbii on Gotland (though missing), because it is spreading on the Swedish mainland [72] and in Finland [73]. Remarkably, no hydromedusae have yet been reported from the Gotland Basins and nearshore waters of Gotland, which may be attributed to missing observational effort rather than true absence. In the southwestern Baltic Sea (salinity typically between 10 and 18), Euphysa aurata Forbes, 1848; Lizzia blondina Forbes, 1848; Rathkea octopunctata (M. Sars, 1835); and Stauridiosarsia gemmifera (Forbes, 1848) are regularly encountered [74,75].
Complementing the peer-reviewed literature with biodiversity repositories fed by community science (e.g., iNaturalist®) can be important for the early detection of arriving non-indigenous species [76]. Engaging the public can be an effective and low-cost way to enhance spatiotemporal coverage, particularly for species with sporadic appearances like gelatinous zooplankton. For instance, in Portugal, the GelAvista programme (https://gelavista.ipma.pt/, accessed on 15 April 2025) has been successful in gathering valuable observations from the general public. The programme includes an annual meeting that fosters collaboration between citizen observers and researchers. While a comparable programme on Gotland, in Sweden, or the Baltic Sea region would be highly advantageous, it is currently missing. The establishment of a broad-scale community science-driven programme would, however, overcome many of the data limitation-related problems mentioned above. At the same time, we need to be aware of false-positive entries when observations are not expert-verified.
The discrepancy between the literature-documented C. capillata records in the study area [31,35,37,53] and the complete absence of sightings in biodiversity repositories is intriguing (Table 1). This may reflect a lack of data publication in such open-access repositories, highlighting that simply publishing data in the literature does not automatically make them findable, accessible, interoperable, and reusable (FAIR). Given the species’ biology to prefer colder, more saline waters, opportunistic surface observations, typical of community science observations, probably did not reveal its presence. Low near-surface counts of other species (A. aurita and M. ovum) should not falsely inform species distribution maps, as high abundances can be found at greater depth, including changes in diel vertical distribution [30,35,36,44]. While GZ species are found in coastal and open-sea habitats in the studied area (Figure 2), it is noteworthy that M. ovum was only reported outside the nearshore realm (beyond the 1 km demarcation line; Figure 3). Reasons for this are unclear, but may include misidentification of stranded specimens and limited observational effort outside the tourist seasons (July–September).

4.2. Phenology of Aurelia aurita in the Central Baltic Sea

Seasonal changes in the abundance, composition, and distribution of GZ have historically often been studied in the western Baltic [24,25,77]. The research focus was on the scyphozoan jellyfish A. aurita and Cyanea spp., as well as the ctenophore M. leidyi. However, comparable temporal high-resolution studies do not exist in the Baltic Proper, with a few exceptions. One should not assume that the species’ phenology is the same across the Baltic Sea, as already highlighted by Thill [78]. He hypothesised that there is a time lag in the life cycle succession of A. aurita moving from the marine North Sea towards the brackish northern Baltic Proper. He summarised information available in 1937: further east, A. aurita development is characterised by the later appearance of strobilation, a shorter growth period for medusae (thus smaller maximum size), and a longer scyphistoma period. This hypothesis, however, still requires testing.
In this study, A. aurita medusae were recorded in open-access online data repositories year-round in the central Baltic Sea, but with a clear peak between July and September in coastal waters. While the community science-based records did not allow quantification of jellyfish abundance (not reported consistently alongside the observations) around Gotland (see Section 3.4 for comparison), they show a clear seasonal picture of low numbers in spring and winter and elevated records in summer and early autumn (Figure 3). Reasons for this involved sporadic open-sea observation include increased observational effort in the summer months (tourists) and the species’ reproductive biology bound to increased water temperature.
The best regional comparison can likely be made to the investigation by Janas & Witek [29], who studied A. aurita medusa phenology in the Polish Exclusive Economic Zone between 1983 and 1991. Their study confirmed that the primary occurrence onset is in July (only very few specimens were seen before), and the highest medusa biomass was captured between August and November (typically peaking in September). Aurelia aurita was present in low numbers until January of the following year [29]. In contrast, C. capillata medusae appeared irregularly in low numbers, as suggested by scarce sightings of this species in the present study. The impact of jellyfish on mesozooplankton production was, on average, less than 5%; nevertheless, at times (and in some places), medusa abundance was considerably higher, thus exerting noteworthy top–down control [29]. Unfortunately, we cannot estimate the predatory impact of jellyfish in coastal and open-sea habitats in the present study. However, a pan-Baltic modelling study showed that with increased fishing pressure on cod and sprat, GZ biomass and, therefore, predation impact on lower trophic levels, will (likely in some depth layers) increase [12,79]. In addition, A. aurita occurs between July and November in the Bornholm Basin, with maximum abundances in August [36]. However, the predation impact on lower trophic levels was low throughout the annual cycle (<8% of the standing stock consumed per day). This requires dedicated sampling and quantification in future investigations. In slight contrast are findings from Karasiova et al. [37], who recorded the highest abundance of A. aurita medusae in October along a seasonally repeated transect from the Bornholm Basin to the Gulf of Finland. How the food web and biogeochemical roles of GZ in the central Baltic Sea will change with regional climate change in comparison to these decades-old studies remains to be investigated.
We noticed in the GoPro camera transects (Video S1) and the winter observations in Visby Harbour (Figure S1) a mixture of differently sized medusae, which may suggest a blend of locally produced medusae, as well as those that were advected there. This question was asked previously by Janas & Witek [29], Barz & Hirche [36], and Cant et al. [28]. Interestingly, Karasiova et al. [37] reported A. aurita ephyrae in the “Gotland area” collected with an IKS-80 ichthyoplankton net that was towed vertically (335 µm mesh size filtering cod-end, 0.5 m2 mouth opening) between May and July. This may indicate local reproduction around the island of Gotland. Unfortunately, no further information is available. Historically, no attention has been paid to the early life cycle stage of cnidarians, which could indicate ephyra production through polyp strobilation in the region [29]. Gotland’s coast is a combination of rocky shores and sandy/muddy habitats that could be suitable for scyphozoan polyps. Studies from various ecosystems show that Aurelia polyps inhabit natural and artificial hard substrates, such as bivalve shells, polychaete tubes, floating piers, metal structures, and ocean debris [80,81,82,83]. Until in situ confirmation of polyp beds or phylogeographic evidence for the origin of A. aurita medusae in Gotlandic waters exists, this question remains open.
Even less is known about the phenology of C. capillata in this part of the Baltic Sea. Karasiova et al. [37] mentioned that along their Bornholm Basin–Gulf of Finland transect, C. capillata was most and least abundant in spring and summer, respectively. However, C. capillata medusae were only seen in the Bornholm Basin. Wihen [53] sampled the medusae in the Bornholm and Western Gotland basins. Mertensia ovum likely reproduces throughout the Baltic Sea [41,43,44], given the widespread occurrence of the larval stage. However, the northern Baltic (Bothnian Sea and Gulf of Finland) may be most suitable. As the presence of M. leidyi and P. pileus in the central Baltic Sea is doubtful, no information on their phenology exists. However, a recent study showed that eggs of M. leidyi are located deeper in the water column (generally below 50 m) in the southeastern Baltic and may thus go undetected by nearshore surface observations and sampling [34].

4.3. Summer Aurelia aurita Abundance in Gotlandic Coastal Waters

Our opportunistic jellyfish abundance estimation campaign indicated that their abundances are, on average, higher in the southern and western stations of Gotland (Table 3). This apparent pattern requires further research attention, as causes such as local reproduction or hydrodynamics are not yet understood. We further cannot conclude from the GoPro footage whether jellyfish occurred more often above seagrass habitats than in macroalga or bare sediment areas. Our jellyfish abundance data further indicated higher values in August than in September, which is in line with observation records from public repositories (Figure 3C). However, the obtained maximum abundance of 4.3 ind. m−3 was, compared with other Baltic Sea locations, only moderate. In the shallow fjord system Kertinge Nor, Denmark, A. aurita abundances can in August/September be as high as 90 ind. m−3 [46], whereas in the extensive Limfjord system, Denmark, abundances can reach 5 ind. m−3 [84]. This is, however, in sharp contrast to open-sea moderate abundance values in the Bornholm Basin (<0.1 ind. m−3; Barz & Hirche [36]), the southwestern Baltic (<0.3 ind. m−3; Janßen et al. [85]), or the Gulf of Gdansk (<1.5 ind. m−3; Brulińska et al. [33]). We need to stress that the GoPro transects that we utilised to estimate jellyfish abundances were not designed for this purpose, and absolute values should, therefore, be treated with caution. On the contrary, the data showcase that A. aurita can form aggregations of noteworthy density around Gotland at salinities between 5 and 8, which was previously not reported in the scientific literature and only in newspaper articles and local knowledge.
As our sampling design had caveats, we need to briefly discuss potential sources of error. It could be that the GoPro was located, at times, more than 1 m above the seafloor, which was used in the volume calculations. If this is the case, the volume used in abundance calculations would be larger; hence, the absolute abundance values could be lower (2–3 times). If the GoPro was modified (dome port) before deployment (often done for GoPro HERO 5 Black), this could have affected the technical parameters and thus the volume calculation. Our simplification of applying 55.55 m3 and 146.85 m3 to all downward-facing and tilted forward-facing video transects, respectively, is a source of error and does not consider station-specific conditions. In the absence of a better approach for estimating volume than outlined above, we relinquished to introduce another layer of uncertainty, knowing that we estimated the filmed volume of water conservatively and that the real volumes are likely larger. If an object that functions as a scale were deployed with the camera at the beginning of each transect, real-world measures of the field of view on the seafloor would be available. Although the angular field of view can be calculated without real-world measures of the horizontal and vertical field of view, having these values could help improve the precision of the calculations. In addition, strong near-bottom currents at some stations violently transported jellyfish, leading to increased counts along the 55 m transect. We were unable to correct for the current velocity in such cases. To mitigate the effect of currents, we suggest moving the research vessel at 1 km h−1 (as done in this study), or faster, but not slower. Also, if possible, we suggest carrying out video sampling only on days with calm weather conditions. A more precise estimate of video volumes can be achieved by keeping the distance between the camera and the seafloor during a transect as constant as possible. This would require prior knowledge of the depth profile of the sampling area. Ideally, it would be any seafloor that is flat and ensures only a small variation in the distance of the camera to the seafloor along a transect.

4.4. Long-Term Trends of Gelatinous Zooplankton in the Baltic Proper

A meta-analysis of globally available long-term trends in jellyfish populations indicated, one and a half decades ago, that the Baltic might experience an increase [20]. However, this prediction was made with low certainty. The public perception and the establishment of populations of three non-indigenous GZ species in the Baltic Sea (B. virginica, M. marginata, and M. leidyi), though with varying success, seemingly support this prediction. However, species distribution models for the native macroscopic species (A. aurita, C. capillata, and M. ovum) under various climate scenarios are currently missing, as is a re-analysis of regional population trends. Robinson et al. [86] indicated the western Baltic Sea as an area of coastal GZ blooms, while the Baltic Proper and eastern basins were not highlighted. More recently, Schnedler-Meyer et al. [87] modelled the likelihood of forage fish and jellyfish presence given environmental envelopes and changes, and underlined, among other findings, that the entire Baltic is prone to a dominance shift towards gelatinous species. Models and predictions can, however, only be as good as their basic data. Without fundamental input variables for parameterisation and systematic monitoring [46], any attempt to comprehend GZ population dynamics, impacts on ecosystems and human coastal activities, and even to verify the 2012 predicted trend in the Baltic [20], is challenging. Alignment and inclusion of novel technologies are, therefore, key to enhancing our understanding of long-term pelagic community changes [88].
GZ population trends need to be considered on a sub-regional scale instead of generalising trends across the Baltic. This is also true for marine heatwaves and their effects on biota, regional climate, and ecosystem services that act on a sub-region scale [89,90]. Frequency, intensity, spatial extent, as well as duration, vary across the Baltic basins between months, distance to shore, and water depth, making simplified conclusions faulty. Some GZ taxa are known to tolerate and even take advantage of temporally abnormally warm conditions when the regional oceanography is altered [13]. However, the mechanisms behind blooming GZ during marine heatwaves have not yet been fully understood [91,92]. In the Baltic Sea, neither documentation nor a mechanistic understanding of how GZ populations behave during such events has been studied. However, it remains a priority research field, as both marine heatwaves and GZ are predicted to become increasingly more abundant over the next decades.

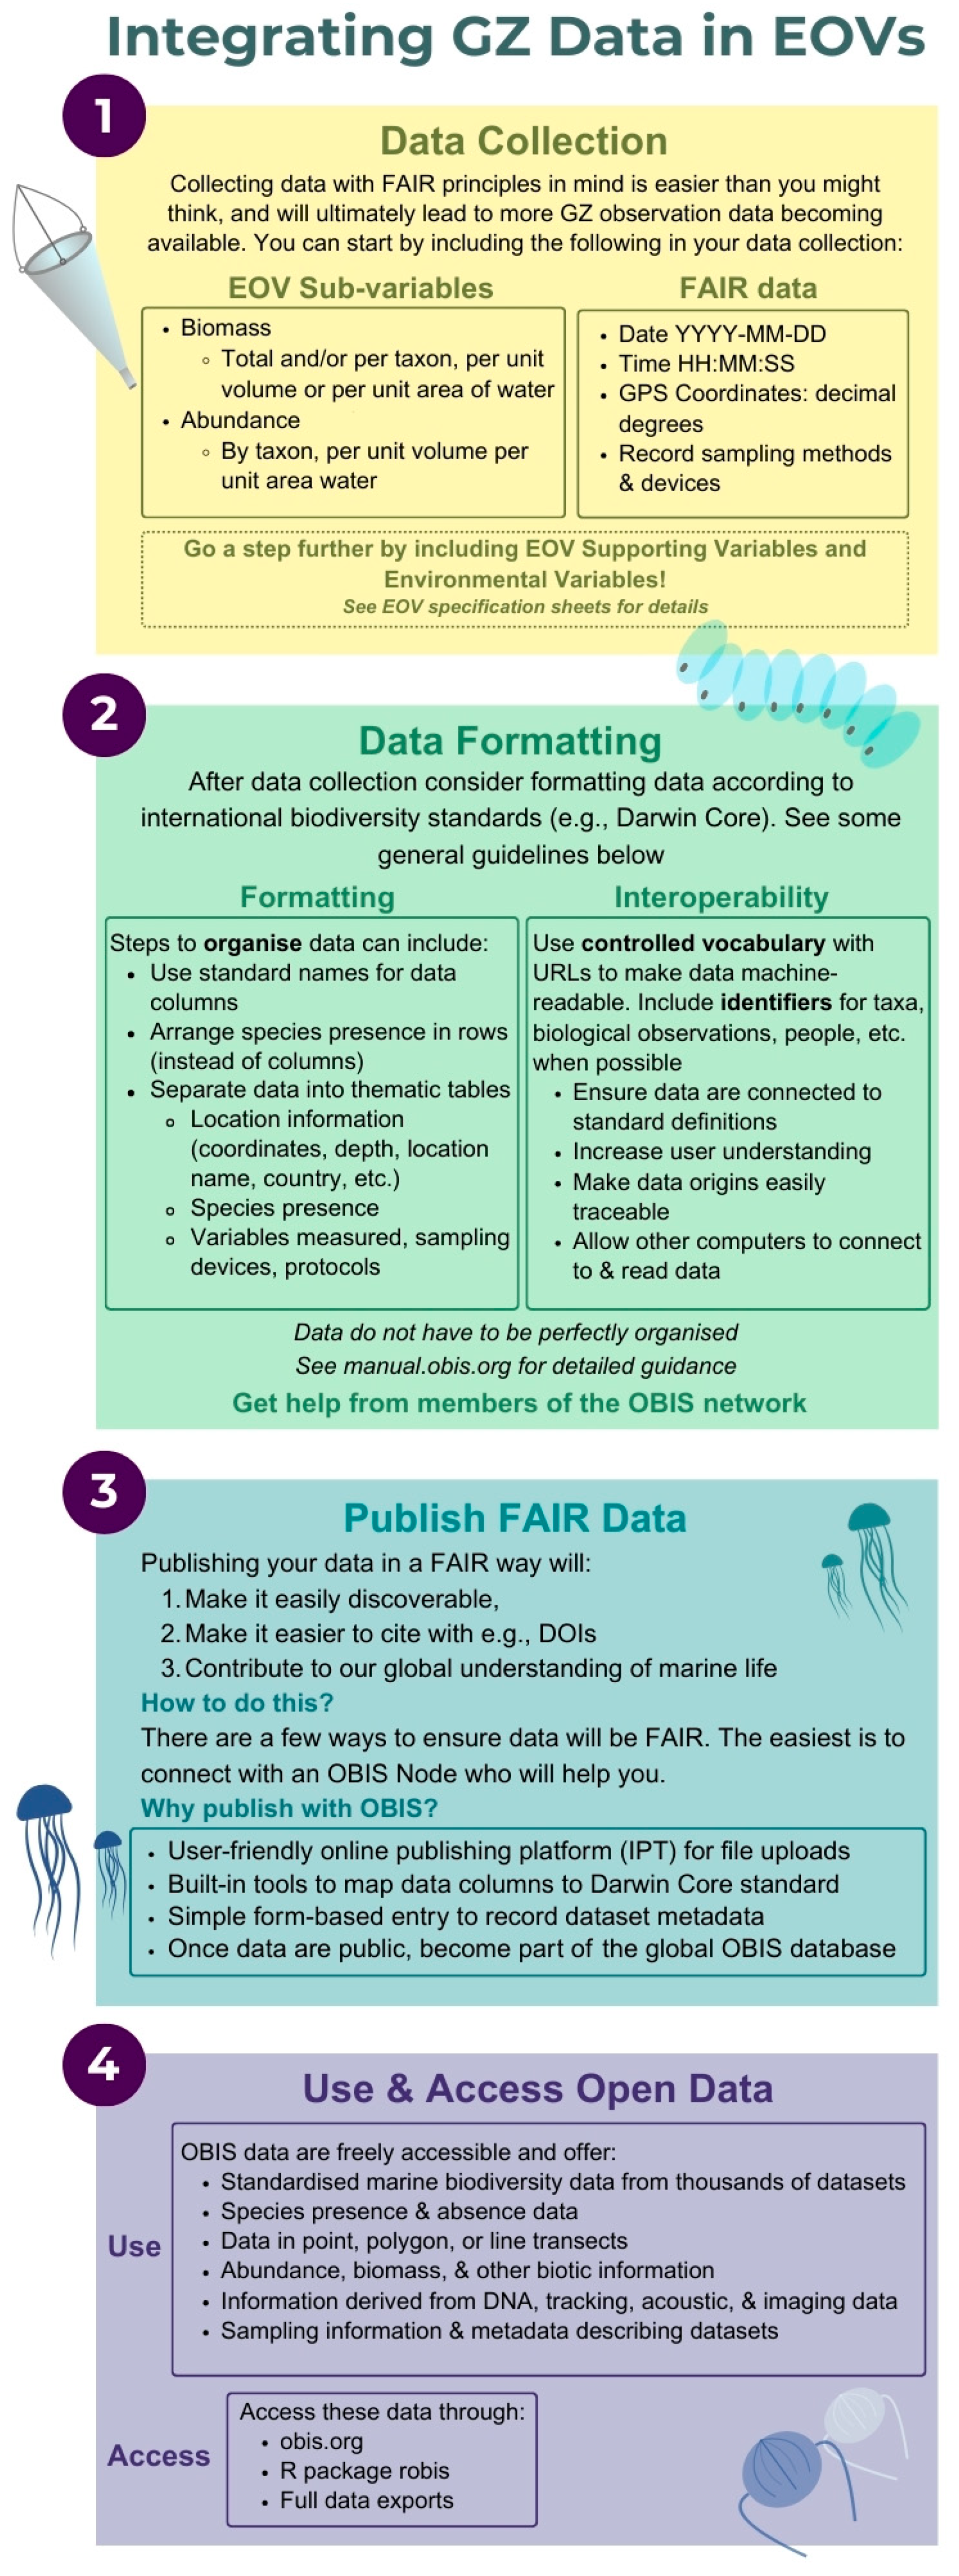
4.5. New Ways for Gelatinous Zooplankton Research Around Gotland and FAIR Data

As mentioned, jellyfish and ctenophores are part of the Essential Ocean Variable (EOV, https://goosocean.org/what-we-do/framework/essential-ocean-variables/, accessed on 15 February 2025) “Zooplankton Biomass and Diversity”—a concept implemented by the Global Ocean Observing System (GOOS). To date, GZ, as part of the zooplankton EOV, have rarely been considered (but see [93]). It is clear from the discussion above that the connection between FAIR data pipelines and jellyfish, ctenophores, etc., is not yet satisfyingly established (see Figure 4 for data pipeline blueprint). Non-invasive monitoring approaches to supplement/overcome financial and logical constraints, as well as historical sampling difficulties (around Gotland and elsewhere), could include large-scale polls among fishers, ferry-based observations, in-depth bycatch analysis, social media data mining, and sampling for environmental DNA (eDNA) across national borders [46,94,95]. It is this connection between traditional sampling techniques and novel (semi-)automated approaches that will ultimately enable us to monitor GZ adequately in time and space [88].
At the same time, we must work to improve the accuracy and completeness of species inventories in open-access online data repositories such as SeaLifeBase (https://www.sealifebase.ca, accessed on 15 February 2025) and the Swedish Agency for Marine and Water Management (SHARK, https://shark.smhi.se/hamta-data, accessed on 15 February 2025) and their integration and communication to global databases such as the Ocean Biodiversity Information System (OBIS, https://obis.org/, accessed on 15 February 2025). Data accuracy and completeness can be enhanced by aligning with international biodiversity data standards, such as Darwin Core (DwC, https://dwc.tdwg.org/, accessed on 15 February 2025). The EOV framework recommends DwC to help make data consistent and FAIR. It provides standard names and definitions for data column headers, as well as specifications for organising data tables.
Redesigning monitoring programmes to include (gelatinous) zooplankton EOV sub-variables (key measurements used for estimation of the EOV) and potentially supporting variables (other measurements that help to provide scale or context for the EOV sub-variables) will be the first step for creating standardised and comparable sampling routines. Such efforts align with ongoing work by the Global Ocean Observing System (GOOS) to develop robust standards and guidelines for EOVs. Such efforts will ensure consistency across datasets and allow researchers to include diverse information sources more effectively in broader analyses, like this study [96]. By doing so, we will be able to significantly enhance regional (Baltic Sea) and global ecosystem understanding in the context of a changing climate.

Supplementary Materials

The following supporting information can be downloaded at: https://www.mdpi.com/article/10.3390/jmse13050852/s1, Figure S1. Exemplary pictures of Aurelia aurita medusae taken in Visby Harbour, Gotland, Sweden. (A) (and insert) 4 December 2024, (B) 11 December 2024, (C) 14 January 2025, and (D) 18 January 2025. White arrows indicate medusa positions. Umbrella diameters ranged between approximately 5 and 15 cm. All photos taken by F. Lüskow. Video S1. Exemplary GoPro camera transect at site Fårösund (station #F4), northern Gotland, Sweden, on 12 September 2022. For station details, see Table 2 and Table 3. File S1. Volume from video—a guide to the calculation of the volume of water, which was captured on camera through a video transect.

Author Contributions

Conceptualisation: F.L. and L.M.N.; Methodology: F.L. and P.N.; Software: F.L.; Validation: F.L.; Formal analysis: F.L. and P.N.; Visualisation: F.L. and E.R.L.; Investigation: F.L.; Resources: L.M.N.; Data curation: F.L. and E.R.L.; Writing—original draft preparation: F.L.; Writing—review and editing: F.L., P.N., E.R.L. and L.M.N. All authors have read and agreed to the published version of the manuscript.

Funding

This project was funded by the European Union’s Horizon Europe Research and Innovation Programme under Grant Agreement No. 101136748 (BioEcoOcean). Views and opinions expressed are, however, those of the authors only and do not necessarily reflect those of the European Union or the European Research Executive Agency; neither the European Union nor the granting authority can be held responsible for them.

Data Availability Statement

Acknowledgments

We appreciate Eva Buskas-Englund and Pär Ullrich’s assistance in accessing data from P4 Gotland and https://www.helagotland.se, respectively, and Jens D. Müller for sharing the raw map used in Figure 1. The fieldwork would not have been possible without a very fruitful collaboration with Calluna—an environmental consultancy in Sweden. We would especially like to thank Anton Lindberg and Ivan Olsson for their help in the field and their solutions-oriented mindset. We also thank Sara Kurland for letting us use footage and Bernd Lüskow for creating the graphical abstract and Figure 1. We acknowledge critical comments made by Anna S. Semenova and four anonymous reviewers on an earlier version of this manuscript.

Conflicts of Interest

The authors declare no conflicts of interest.

References

  1. Inácio, M.; Karnauskaitė, D.; Baltranaitė, E.; Kalinauskas, M.; Bogdzevič, K.; Gomes, E.; Pereira, P. Ecosystem services of the Baltic Sea: An assessment and mapping perspective. Geogr. Sustain. 2020, 1, 256–265. [Google Scholar] [CrossRef]
  2. Rosciszewski-Dodgson, M.J.; Cirella, G.T. Environmental drivers affecting the status of top commercial fish stocks in the Baltic Sea: Review. Front. Mar. Sci. 2024, 11, 1399707. [Google Scholar] [CrossRef]
  3. Gustafsson, B.G.; Westman, P. On the causes for salinity variations in the Baltic Sea during the last 8500 years. Paleoceanogr. Paleoclimatol. 2002, 17, 12/1–12/14. [Google Scholar] [CrossRef]
  4. Remane, A. Die Brackwasserfauna. Zool. Anz. 1934, 36, 34–74. [Google Scholar]
  5. Kinne, O. (Ed.) Salinity: 3. Animals: 1. Invertebrates. In Marine Ecology: A Comprehensive, Integrated Treatise on Life in Oceans and Coastal Waters: 1. Environmental Factors: 2; Wiley: London, UK, 1971; pp. 821–995. [Google Scholar]
  6. Khlebovich, V.V. Critical Salinity of Biological Processes; Leningrad: Nauka, Russia, 2010; p. 235. [Google Scholar]
  7. Telesh, I.; Schubert, H.; Skarlato, S. Life in the salinity gradient: Discovering mechanisms behind a new biodiversity pattern. Estuar. Coast. Shelf. Sci. 2013, 135, 317–327. [Google Scholar] [CrossRef]
  8. Ojaveer, H.; Jaanus, A.; MacKenzie, B.R.; Martin, G.; Olenin, S.; Radziejewska, T.; Telesh, I.; Zettler, M.L.; Zaiko, A. Status of biodiversity in the Baltic Sea. PLoS ONE 2010, 5, e12467. [Google Scholar] [CrossRef]
  9. Jaspers, C.; Bezio, N.; Hinrichsen, H.-H. Diversity and physiological tolerance of native and invasive jellyfish/ctenophores along the extreme salinity gradient of the Baltic Sea. Diversity 2021, 13, 57. [Google Scholar] [CrossRef]
  10. Gershwin, L.-A. Jellyfish–A Natural History; The University of Chicago Press: Chicago, IL, USA, 2016; p. 224. [Google Scholar]
  11. Chi, X.; Dierking, J.; Hoving, H.-J.T.; Lüskow, F.; Denda, A.; Christiansen, B.; Sommer, U.; Hansen, T.; Javidpour, J. Tackling the jelly web: New insights into the trophic ecology of gelatinous zooplankton in oceanic food webs of the eastern tropical Atlantic assessed by stable isotope analysis. Limnol. Ocean. 2021, 66, 289–305. [Google Scholar] [CrossRef]
  12. Bossier, S.; Palacz, A.P.; Nielsen, J.R.; Christensen, A.; Hoff, A.; Maar, M.; Gislason, H.; Bastardie, F.; Gorton, R.; Fulton, E.A. The Baltic Sea Atlantis: An integrated end-to-end modelling framework evaluating ecosystem-wide effects of human-induced pressures. PLoS ONE 2018, 13, e0199168. [Google Scholar] [CrossRef]
  13. Brodeur, R.D.; Auth, T.D.; Phillips, A.J. Major shifts in pelagic micronekton and macrozooplankton community structure in an upwelling ecosystem related to an unprecedented marine heatwave. Front. Mar. Sci. 2019, 6, 212. [Google Scholar] [CrossRef]
  14. Tinta, T.; Klun, K.; Herndl, G.J. The importance of jellyfish–microbe interactions for biogeochemical cycles in the ocean. Limnol. Ocean. 2021, 66, 2011–2032. [Google Scholar] [CrossRef]
  15. Madin, L.P.; Harbison, G.R. Gelatinous zooplankton. In Encyclopedia of Ocean Sciences; Steele, J., Thorpe, S., Turekian, K., Eds.; Academic Press: London, UK, 2019; Volume 2, pp. 1120–1130. [Google Scholar]
  16. Harbison, G.R.; Madin, L.P.; Swanberg, N.R. On the natural history and distribution of oceanic ctenophores. Deep. Sea Res. 1978, 25, 233–256. [Google Scholar] [CrossRef]
  17. Graham, W.M.; Gelcich, S.; Robinson, K.L.; Duarte, C.M.; Brotz, L.; Purcell, J.E.; Madin, L.P.; Mianzan, H.; Sutherland, K.R.; Uye, S.; et al. Linking human well-being and jellyfish: Ecosystem services, impacts, and societal responses. Front. Ecol. Environ. 2014, 12, 515–523. [Google Scholar] [CrossRef]
  18. Sigurdsson, G.M.; Lüskow, F.; Gislason, A.; Svavarsson, J. Detached tentacles of lion’s mane jellyfish Cyanea capillata can injure aquaculture fish. Aquacult. Env. Interact. 2024, 16, 263–266. [Google Scholar] [CrossRef]
  19. Labuce, A.; Batare, L.; Ikauniece, A. Spatiotemporal dataset on moon jellyfish Aurelia aurita incidental observations in the Gulf of Riga and Eastern Gotland Basin, Baltic Sea. Data Brief. 2024, 56, 110880. [Google Scholar] [CrossRef]
  20. Brotz, L.; Cheung, W.W.L.; Kleisner, K.; Pakhomov, E.A.; Pauly, D. Increasing jellyfish populations: Trends in Large Marine Ecosystems. Hydrobiologia 2012, 690, 3–20. [Google Scholar] [CrossRef]
  21. Sommer, F.; Stibor, H.; Sommer, U.; Velimirov, B. Grazing by mesozooplankton from Kiel Bight, Baltic Sea, on different sized algae and natural seston size fractions. Mar. Ecol. Prog. Ser. 2000, 199, 43–53. [Google Scholar] [CrossRef]
  22. Stoltenberg, I.; Dierking, J.; Müller-Navarra, D.C.; Javidpour, J. Review of jellyfish trophic interactions in the Baltic Sea. Mar. Biol. Res. 2021, 17, 311–326. [Google Scholar] [CrossRef]
  23. Javidpour, J.; Molinero, J.C.; Peschutter, J.; Sommer, U. Seasonal changes and population dynamics of the ctenophore Mnemiopsis leidyi after its first year of invasion in the Kiel Fjord, Western Baltic Sea. Biol. Inv. 2009, 11, 873–882. [Google Scholar] [CrossRef]
  24. Riisgård, H.U.; Goldstein, J.; Lundgreen, K.; Lüskow, F. Jellyfish and ctenophores in the environmentally degraded Limfjorden (Denmark) during 2014—Species composition, population densities and predation impact. Fish Aquac. J. 2015, 6, 1000137. [Google Scholar] [CrossRef]
  25. Lüskow, F.; Riisgård, H.U. Population predation impact of jellyfish (Aurelia aurita) controls the maximum umbrella size and somatic degrowth in temperate Danish waters (Kertinge Nor and Mariager Fjord). Vie et Milieu 2016, 66, 233–243. [Google Scholar]
  26. Majaneva, S.; Setälä, O.; Gorokhova, E.; Lehtiniemi, M. Feeding of the Arctic ctenophore Mertensia ovum in the Baltic Sea: Evidence of the use of microbial prey. J. Plank. Res. 2014, 36, 91–103. [Google Scholar] [CrossRef]
  27. Jaspers, C.; Huwer, B.; Antajan, E.; Hosia, A.; Hinrichsen, H.; Biastoch, A.; Angel, D.; Asmus, R.; Augustin, C.; Bagheri, S.; et al. Ocean current connectivity propelling the secondary spread of a marine invasive comb jelly across western Eurasia. Glob. Ecol. Biogeogr. 2018, 27, 814–827. [Google Scholar] [CrossRef]
  28. Cant, J.; Jones, O.R.; Ellingsen, I.; Laverick, J.H.; Majaneva, S.; Dierking, J.; Aberle, N.; Javidpour, J. Coupling hydrodynamic drifting simulations and seasonal demographics to forecast the occurrence of jellyfish blooms. bioRxiv 2025. bioRxiv:584451. [Google Scholar]
  29. Janas, U.; Witek, Z. The occurrence of medusae in the southern Baltic and their importance in the ecosystem, with special emphasis on Aurelia aurita. Oceanologia 1993, 34, 69–84. [Google Scholar]
  30. Karasiova, E.M.; Semenova, A.S.; Zezera, A.S.; Karpushevski, I.V. The quantitative distribution of scyphozoan medusae Aurelia aurita and crustacean plankton in the Baltic Sea during autumn season. Tr. AtlantNIRO 2019, 3, 12–25. [Google Scholar]
  31. Lischka, M. Abundanz, Verteilung und Nahrungsökologie von Scyphomedusen in der Zentralen Ostsee. Diploma Thesis, Christian Albrechts University, Kiel, Germany, 1999; 91p. [Google Scholar]
  32. Olenycz, M. Gelatinous zooplankton—A potential threat to the ecosystem of the Puck Bay (the southern Baltic Sea, Poland). Bull. Mar. Inst. Gdańsk 2015, 30, 78–85. [Google Scholar]
  33. Brulińska, D.; Olenycz, M.; Ziółkowska, M.; Mudrak-Cegiołka, S.; Wołowicz, M. Moon jellyfish, Aurelia aurita, in the Gulf of Gdańsk: Threatening predator or not? Boreal Environ. Res. 2016, 21, 528–540. [Google Scholar]
  34. Polunina, J.J.; Kondrashov, A.A.; Utkina, J.V. Distribution of invader Mnemiopsis leidyi (Ctenophora) in early stages of development in the southeastern Baltic Sea in autumn 2021. Russ. J. Biol. Inv. 2023, 14, 222–228. [Google Scholar] [CrossRef]
  35. Jaspers, C.; Hauss, H.; Hinrichsen, H.H. Jellyfish and comb jellies in the Baltic Sea: Depth resolved distribution pattern along the salinity gradient of the Baltic Sea during September 2020. Data Brief 2025, 60, 111511. [Google Scholar] [CrossRef]
  36. Barz, K.; Hirche, H.J. Seasonal development of scyphozoan medusae and the predatory impact of Aurelia aurita on the zooplankton community in the Bornholm Basin (Central Baltic Sea). Mar. Biol. 2005, 147, 465–476. [Google Scholar] [CrossRef]
  37. Karasiova, E.M.; Karpushevski, I.V.; Zezera, A.S. Scyphozoan medusae: The seasonal and spatial distribution along transects through the Baltic Sea. In Proceedings of the ICES Ann Sci Conference, A Coruña, Spain, 2014. A 17. [Google Scholar]
  38. Storr-Paulsen, M.; Huwer, B. Changes in distribution and lengths of Mnemiopsis leidyi in the central Baltic Sea between fall and spring. Aquat. Inv. 2008, 3, 429–434. [Google Scholar] [CrossRef]
  39. Huwer, B.; Storr-Paulsen, M.; Riisgård, H.U.; Haslob, H. Abundance, horizontal and vertical distribution of the invasive ctenophore Mnemiopsis leidyi in the central Baltic Sea, November 2007. Aquat. Inv. 2008, 3, 113–124. [Google Scholar] [CrossRef]
  40. Haraldsson, M.; Jaspers, C.; Tiselius, P.; Aksnes, D.L.; Andersen, T.; Titelman, J. Environmental constraints of the invasive Mnemiopsis leidyi in Scandinavian waters. Limnol. Ocean. 2013, 58, 37–48. [Google Scholar] [CrossRef]
  41. Jaspers, C.; Haraldsson, M.; Lombard, F.; Bolte, S.; Kiørboe, T. Seasonal dynamics of early life stages of invasive and native ctenophores give clues to invasion and bloom potential in the Baltic Sea. J. Plank. Res. 2013, 35, 582–594. [Google Scholar] [CrossRef]
  42. Oesterwind, D.; Bartolino, V.; Behrens, J.W.; Erlandsson, M.; Florin, A.-B.; Henseler, C.; Jakubowska-Lehrmann, M.; Jaspers, C.; Lehtiniemi, M.; Naddafi, R.; et al. Disentangling the potential effects of four non-indigenous species on commercially and recreationally used fish stocks in the Baltic Sea—A review. Biol. Inv. 2025, 27, 76. [Google Scholar] [CrossRef]
  43. Gorokhova, E.; Lehtiniemi, M.; Viitasalo-Frösen, S.; Haddock, S.H.D. Molecular evidence for the occurrence of ctenophore Mertensia ovum in the northern Baltic Sea and implications for the status of the Mnemiopsis leidyi invasion. Limnol. Ocean. 2009, 54, 2025–2033. [Google Scholar] [CrossRef]
  44. Lehtiniemi, M.; Gorokhova, E.; Bolte, S.; Haslob, H.; Huwer, B.; Katajisto, T.; Lennuk, L.; Majaneva, S.; Põllumäe, A.; Schaber, M.; et al. Distribution and reproduction of the Arctic ctenophore Mertensia ovum in the Baltic Sea. Mar. Ecol. Prog. Ser. 2013, 491, 111–124. [Google Scholar] [CrossRef]
  45. Schneider, G. Role of advection in the distribution and abundance of Pleurobrachia pileus in Kiel Bight. Mar. Ecol. Prog. Ser. 1987, 41, 99–102. [Google Scholar] [CrossRef]
  46. Lüskow, F. Importance of environmental monitoring: Long-term record of jellyfish (Aurelia aurita) biomass in a shallow semi-enclosed cove (Kertinge Nor, Denmark). Reg. Stud. Mar. Sci. 2020, 34, 100998. [Google Scholar] [CrossRef]
  47. Nolan, G.; Cusack, C.; Fitzhenry, D.; McGovern, E.; Cronin, M.; O’Donnell, G.; O’Dowd, L.; Clarke, M.; Reid, D.G.; Clarke, D.; et al. Baseline Study of Essential Ocean Variable Monitoring in Irish Waters; Current Measurement Programmes & Data Quality; Marine Institute: Galway, Ireland, 2021; 63p. [Google Scholar]
  48. Wieczorek, G.; Hagen, E.; Umlauf, L. Eastern Gotland Basin case study of thermal variability in the wake of deep water intrusions. J. Mar. Syst. 2008, 74, S65–S79. [Google Scholar] [CrossRef]
  49. Liblik, T.; Naumann, M.; Alenius, P.; Hansson, M.; Lips, U.; Nausch, G.; Tuomi, L.; Wesslander, K.; Laanemets, J.; Viktorsson, L. Propagation of impact of the recent major Baltic inflows from the Eastern Gotland Basin to the Gulf of Finland. Front. Mar. Sci. 2018, 5, 222. [Google Scholar] [CrossRef]
  50. Laine, A.O.; Sandler, H.; Andersin, A.-B.; Stigzelius, J. Long-term changes of macrozoobenthos in the Eastern Gotland Basin and the Gulf of Finland (Baltic Sea) in relation to the hydrographical regime. J. Sea Res. 1997, 38, 135–159. [Google Scholar] [CrossRef]
  51. Kanarik, H.; Tuomi, L.; Björkqvist, J.-V.; Kärnä, T. Improving Baltic Sea wave forecasts using modelled surface currents. Ocean. Dyn. 2021, 71, 635–653. [Google Scholar] [CrossRef]
  52. Müller, J.D. Ocean Acidification in the Baltic Sea. Involved Processes, Metrology of pH in Brackish Waters, and Calcification Under Fluctu-ating Conditions. Ph.D. Thesis, University of Rostock, Rostock, Germany, 2018; p. 52. [Google Scholar]
  53. Wihen, A. Identification and Population Genetic Analysis of Jellyfish Blooms in Trondheimsfjord. Master’s Thesis, Norwegian University of Science and Technology, Trondheim, Norway, 2021; p. 55. [Google Scholar]
  54. OBIS Ocean Biodiversity Information System (2025). Available online: https://obis.org (accessed on 6 March 2025).
  55. ICES Historical Plankton Dataset (1901–1912); ICES: Copenhagen, Denmark, 2010.
  56. Fish Trawl Survey: ICES Baltic International Trawl Survey for Commercial Fish Species; ICES Database of Trawl Surveys: Copenhagen, Denmark, 2010.
  57. SHARK; Stockholm University; University of Gothenburg; Linnaeus University; Swedish Agency for Marine and Water Management; Swedish Environmental Protection Agency; Swedish Meteorological and Hydrological Institute. National Epibenthos monitoring in Sweden Since 1992; EMODnet Product Catalogue: Online, 2017. [Google Scholar]
  58. SHARK; Swedish County Administration Boards; Swedish Municipalities; Swedish Coalitions of Water Conservation; Swedish Meteorological and Hydrological Institute. Regional Monitoring and Monitoring Projects of Epibenthos in Sweden Since 1994; EMODnet Product Catalogue: Online, 2017. [Google Scholar]
  59. Finnish Environment Institute SYKE. Finnish Baltic Sea Zooplankton Monitoring. 2018. Available online: https://obis.org/dataset/531637ff-203d-447a-8595-519080144a1d (accessed on 15 February 2025).
  60. Estonian Marine Institute; University of Tartu. Zooplankton biomass and abundance in Estonian territorial waters 1994–2016. 2019. Available online: https://emodnet.ec.europa.eu/geonetwork/srv/api/records/6d617269-6e65-696e-666f-000000006022 (accessed on 15 February 2025).
  61. ICES Eggs and Larvae Database: Copenhagen, Denmark. Available online: https://www.ices.dk/data/data-portals/Pages/Eggs-and-larvae.aspx (accessed on 15 February 2025).
  62. Lindberg, A.; Andersson, M.; Nordlund, L.M.; Olsson, I. Provfisken i ålgräsängar runt Gotland 2022; Report to the County Administrative Board; Länsstyrelsen i Gotlands län: Visby, Sweden, 2023; p. 54. [Google Scholar]
  63. R Core Team. R: A language and environment for statistical computing. In R Foundation for Statistical Computing; R Core Team: Vienna, Austria, 2024; Available online: http://www.R-project.org/ (accessed on 15 February 2025).
  64. Wickham, H. Ggplot2: Elegant Graphics for Data Analysis, version 3.5.2.; Springer: New York, NY, USA, 2016; Available online: https://ggplot2.tidyverse.org (accessed on 15 February 2025).
  65. Vihtakari, M. ggOceanMaps: Plot data on Oceanographic Maps Using ‘ggplot2’, R package version 2.1.1; Comprehensive R Archive Network: Vienna, Austria, 2023. [Google Scholar]
  66. Dunnington, D. ggspatial: Spatial Data Framework for ggplot2; 2023. Available online: https://paleolimbot.github.io/ggspatial/ (accessed on 15 February 2025).
  67. Fridolfsson, E.; Bunse, C.; Lindehoff, E.; Farnelid, H.; Pontiller, B.; Bergström, K.; Pinhassi, J.; Legrand, C.; Hylander, S. Multiyear analysis uncovers coordinated seasonality in stocks and composition of the planktonic food web in the Baltic Sea proper. Sci. Rep. 2023, 13, 11865. [Google Scholar] [CrossRef]
  68. Leppäkoski, E.; Gollasch, S.; Gruszka, P.; Ojaveer, H.; Olenin, S.; Panov, V. The Baltic—A sea of invaders. Can. J. Fish. Aquat. Sci. 2002, 59, 1175–1188. [Google Scholar] [CrossRef]
  69. von Numers, M. The first record of Maeotias marginata (Modeer, 1791) (Cnidaria, Hydrozoa) from Finland, northern Baltic Sea. BioInv. Rec. 2013, 2, 39–42. [Google Scholar] [CrossRef]
  70. Jaspers, C.; Huwer, B.; Weiland-Bräuer, N.; Clemmesen, C. First record of the non-indigenous jellyfish Blackfordia virginica (Mayer, 1910) in the Baltic Sea. Helgol. Mar. Res. 2018, 72, 13. [Google Scholar] [CrossRef]
  71. Serandour, B.; Leroy, B.; Blenckner, T.; Mittermayer, F.; Clemmesen, C.; Cruz, J.; Nowaczyk, A.; Winder, M.Q. Assessing the invasion risk of the cnidaria Blackfordia virginica Mayer, 1910: A threat to the Baltic Sea ecosystem? Biol. Inv. 2025, 27, 106. [Google Scholar] [CrossRef]
  72. Lundberg, S.; Svensson, J.-E.; Petrusek, A. Craspedacusta invasions in Sweden. Verh. Intern. Ver. Limnol 2005, 29, 899–902. [Google Scholar] [CrossRef]
  73. Lüskow, F.; Lehtiniemi, M.; Väinölä, R.; von Numers, M.; Pakhomov, E.A. Spreading of the non-indigenous freshwater jellyfish Craspedacusta sowerbii in Finland. Hydrobiologia 2025. [Google Scholar]
  74. Dutz, J.; Kremp, A.; Zettler, M.L. Biological assessment of the Baltic Sea 2020. Mar. Sci. Rep. Warn. 2020, 120, 82. [Google Scholar]
  75. Dutz, J.; Zettler, M.L.; Kremp, A.; Kube, S. Biological assessment of the Baltic Sea 2023. Mar Sci Rep Warn. 2025, 129, 79. [Google Scholar]
  76. Compagnone, F.; Varricchione, M.; Stanisci, A.; Matteucci, G.; Carranza, M.L. Exploring the contribution of a generalist citizen science project for alien species detection and monitoring in coastal Areas. A case study on the Adriatic of central Italy. Diversity 2024, 16, 746. [Google Scholar] [CrossRef]
  77. Gröndahl, F. A comparative ecological study on the scyphozoans Aurelia aurita, Cyanea capillata and C. lamarckii in the Gullmar Fjord, western Sweden, 1982 to 1986. Mar. Biol. 1988, 97, 541–550. [Google Scholar] [CrossRef]
  78. Thill, H. Beiträge zur Kenntnis der Aurelia aurita (L.). Zeitschr. Wiss. Zool. 1937, 150, 51–96. [Google Scholar]
  79. Stoltenberg, I.; Mittermayer, F.; Clemmensen, C.; Dierking, J.; Javidpour, J. Predation on Baltic Sea yolk-sac herring larvae (Clupea harengus) by the invasive ctenophore Mnemiopsis leidyi. Fish. Res. 2024, 273, 106973. [Google Scholar] [CrossRef]
  80. Miyake, H.; Terazaki, M.; Kakinuma, Y. On the polyps of the common jellyfish Aurelia aurita in Kagoshima Bay. J. Ocean. 2002, 58, 451–459. [Google Scholar] [CrossRef]
  81. Di Camillo, C.G.; Betti, F.; Bo, M.; Martinelli, M.; Puce, S.; Bavestrello, G. Contribution to the understanding of seasonal cycle of Aurelia aurita (Cnidaria: Scyphozoa) scyphopolyps in the northern Adriatic Sea. J. Mar. Biol. Assoc. UK 2010, 90, 1105–1110. [Google Scholar] [CrossRef]
  82. Toyokawa, M.; Aoki, K.; Yamada, S.; Yasuda, A.; Murata, Y.; Kikuchi, T. Distribution of ephyrae and polyps of jellyfish Aurelia aurita (Linnaeus 1758) sensu lato in Mikawa Bay. Jpn. J. Ocean. 2011, 67, 209–218. [Google Scholar] [CrossRef]
  83. Shibata, H.; Miyake, H.; Goto, T.; Adachi, A.; Toshino, S. Wild polyps of the blooming jellyfish Aurelia limbata (Brandt, 1838) (Cnidaria: Scyphozoa) found on deep-sea debris off Sanriku, Japan. Plank. Benthos. Res. 2015, 10, 133–140. [Google Scholar] [CrossRef]
  84. Riisgård, H.U.; Jaspers, C.; Serre, S.; Lundgreen, K. Occurrence, inter-annual variability and zooplankton-predation impact of the invasive ctenophore Mnemiopsis leidyi and the native jellyfish Aurelia aurita in Limfjorden (Denmark) in 2010 and 2011. BioInv. Rec. 2012, 1, 145–159. [Google Scholar] [CrossRef]
  85. Janßen, H.; Augustin, C.B.; Hinrichsen, H.H.; Kube, S. Impact of secondary hard substrate on the distribution and abundance of Aurelia aurita in the western Baltic Sea. Mar. Poll. Bull. 2013, 75, 224–234. [Google Scholar] [CrossRef] [PubMed]
  86. Robinson, K.L.; Ruzicka, J.J.; Decker, M.B.; Brodeur, R.D.; Hernandez, F.J.; Quiñones, J.; Acha, E.M.; Uye, S.; Mianzan, H.; Graham, W.M. Jellyfish, forage fish, and the world’s major fisheries. Oceanogr 2013, 27, 104–115. [Google Scholar] [CrossRef]
  87. Schnedler-Meyer, N.A.; Mariani, P.; Kiørboe, T. The global susceptibility of coastal forage fish to competition by large jellyfish. Proc. R. Soc. B. 2016, 283, 20161931. [Google Scholar] [CrossRef]
  88. Holland, M.M.; Artigas, L.F.; Atkinson, A.; Best, M.; Bresnan, E.; Devlin, M.; Eerkes-Medrano, D.; Johansen, M.; Johns, D.G.; Machairopoulou, M.; et al. Mind the gap—The need to integrate novel plankton methods alongside ongoing long-term monitoring. Ocean. Coast. Manag. 2025, 262, 107542. [Google Scholar] [CrossRef]
  89. Bashiri, B.; Barzandeh, A.; Männik, A.; Raudsepp, U. Variability of marine heatwaves’ characteristics and assessment of their potential drivers in the Baltic Sea over the last 42 years. Sci. Rep. 2024, 14, 22419. [Google Scholar] [CrossRef]
  90. Lindenthal, A.; Hinrichs, C.; Jandt-Scheelke, S.; Kruschke, T.; Lagemaa, P.; Lee, E.M.v.d.; Morrison, H.E.; Panteleit, T.R.; Raudsepp, U. Baltic Sea surface temperature analysis 2022: A study of marine heatwaves and overall high seasonal temperatures. State Planet 2024, 4, 1–16. [Google Scholar] [CrossRef]
  91. Quilestino-Olario, R.; Concolis, B.M.M.; Atup, D.P.D.; Cortes, A.; Yñiguez, A.T.; Edullantes, B. Co-occurrence of a marine heatwave and a reported tomato jellyfish (Crambione mastigophora Maas, 1903) bloom in March 2020 at El Nido, Palawan, Philippines. Plank. Benthos. Res. 2023, 18, 93–105. [Google Scholar] [CrossRef]
  92. Capidos, C.G.G.; Boco, S.R.; Morandini, A.C. Blooms of the dragon thimble jellyfish, Linuche draco, sometimes co-occur with marine heatwaves. Mar. Biodiv. 2024, 54, 38. [Google Scholar] [CrossRef]
  93. Hoving, H.J.T.; Neitzel, P.; Hauss, H.; Christiansen, S.; Kiko, R.; Robison, B.H.; Silva, P.; Körtzinger, A. In situ observations show vertical community structure of pelagic fauna in the eastern tropical North Atlantic off Cape Verde. Sci. Rep. 2020, 10, 21798. [Google Scholar] [CrossRef] [PubMed]
  94. Aubert, A.; Antajan, E.; Lynam, C.; Pitois, S.; Pliru, A.; Vaz, S.; Thibault, D. No more reason for ignoring gelatinous zooplankton in ecosystem assessment and marine management: Concrete cost-effective methodology during routine fishery trawl surveys. Mar. Pol. 2018, 89, 100–108. [Google Scholar] [CrossRef]
  95. Ratnarajah, L.; Abu-Alhaija, R.; Atkinson, A.; Batten, S.; Bax, N.J.; Bernard, K.S.; Canonico, G.; Cornils, A.; Everett, J.D.; Grigoratou, M.; et al. Monitoring and modelling marine zooplankton in a changing climate. Nat. Comm. 2023, 14, 564. [Google Scholar] [CrossRef] [PubMed]
  96. Titocci, J.; Pata, P.R.; Durazzano, T.; Ayata, S.-D.; Clerc, C.; Cornils, A.; Duffy, P.; Greer, A.T.; Halsband, C.; Heneghan, R.F.; et al. Pathways for converting zooplankton traits to ecological insights are paved with findable, accessible, interoperable, and reusable (FAIR) data practices. ICES J. Mar. Sci. 2025, 82, fsaf017. [Google Scholar] [CrossRef]
Figure 1. (A) Sub-surface salinity pattern indicating the extensive gradient within the Baltic Sea area (BP: Baltic Proper, GB: Gulf of Bothnia, GF: Gulf of Finland, GR: Gulf of Riga, KA: Kattegat). The dotted black line is a hypothetical transect; the white polygon indicates the study area; for details, see text. (B) Vertical interpolated salinity profiles along a hypothetical transect from the Belt Sea to the northern Baltic Proper. Data were obtained from IOW monitoring in 2013. Redrawn and edited with permission from Müller [52] and the University of Rostock.
Jmse 13 00852 g001
Figure 2. Distribution of gelatinous zooplankton records from (A) Gotlandic coastal waters and the Western and Eastern Gotland Basins. For study area details, see text and Figure 1. Habitat types: coastal (records within 1 km off the shoreline) and open sea (beyond the 1 km demarcation line). Data included here are from open-access online data repositories. These records include all currently described species from the area (Table 1). (B) Location of the six sites with each ten camera deployments around Gotland investigated during the 2022 seagrass-associated fish field campaign. The only species recorded here was Aurelia aurita. For details on the sites, see Table 2.
Jmse 13 00852 g002
Figure 3. Phenology of major gelatinous zooplankton species observations around Gotland. (A,C) Aurelia aurita records (N = 122) split by year and habitat type, respectively; (B,D) Mertensia ovum (N = 9) split by year and habitat type, respectively. Habitat types: coastal (records within 1 km off the shoreline) and open sea (beyond the 1 km demarcation line).
Jmse 13 00852 g003
Figure 4. Steps for integrating gelatinous zooplankton (GZ) data into Essential Ocean Variables (EOVs) using Findable, Accessible, Interoperable, and Reusable (FAIR) principles. There are four key stages: (1) Data collection, ensuring that EOV sub-variables and FAIR data principles are adhered to right from the beginning; (2) formatting data to align with international biodiversity standards such as Darwin Core (DwC); (3) publishing FAIR data through, for example, the Ocean Biodiversity Information System (OBIS) to ensure global access; and (4) using and accessing open data via platforms like OBIS and SeaLifeBase. These steps will enhance data interoperability and contribute to a more holistic understanding of global marine ecosystems. DOI = Digital Object Identifier, IPT = Integrated Publishing Toolkit, URL = Uniform Resource Locator.
Jmse 13 00852 g004
Table 1. List of gelatinous zooplankton species (cnidarian medusae and ctenophores) recorded in Gotlandic waters, Baltic Proper. Source: Literature = see reference details in the text, OBIS = Ocean Biodiversity Information System, SBDI = Swedish Biodiversity Data Infrastructure, and iNaturalist®. × = presence of a species in the respective source. Numbers of records after dataset cleaning are indicated in brackets for open-source repositories. Asterisks indicate doubtful identifications; specimens are likely Mertensia ovum.
SpeciesLiteratureOBISSBDIiNaturalist®
Aurelia aurita (Linnaeus, 1758)×× (36)× (63)× (23)
Cyanea capillata (Linnaeus, 1758)×
Mertensia ovum (Fabricius, 1780)×× (8)× (1)
Mnemiopsis leidyi A. Agassiz, 1865 * × (11)× (1)
Pleurobrachia pileus (O. F. Müller, 1776) * × (5)
Table 2. Details of GoPro deployments at six sites around Gotland, Sweden, with each ten camera transects. Surface and bottom temperatures, as well as wind direction and strength, are means of readings before fishing net deployment and after retrieval (for methodological details, see text). Mean, standard deviation (SD), minimum, and maximum values are provided for some metrics.
SiteStationDateTime (Local)LatitudeLongitudeBottom Depth (m)Surface Temperature (°C)Bottom Temperature (°C)ΔTemperature Surface/Bottom (°C)Wind Direction (°)Wind Speed (m s−1)
AjkesvikenA118-Aug-2219:1857.985619.22956.021.220.60.730.01.5
A217-Aug-2218:1157.992319.24023.020.721.20.4160.04.0
A317-Aug-2218:2357.991419.23463.021.021.40.4160.04.0
A417-Aug-2218:3357.990419.22932.321.021.40.4160.04.0
A518-Aug-2218:5057.986319.22896.021.221.30.030.01.5
A617-Aug-2219:0257.987119.22735.220.320.80.5160.04.5
A717-Aug-2218:4657.989119.23186.120.720.70.1160.04.5
A818-Aug-2218:1057.989419.23064.820.920.80.130.01.0
A918-Aug-2218:3657.988319.22915.321.021.40.430.01.5
A1018-Aug-2218:2657.988719.23196.021.020.90.130.01.5
BurgsvikB114-Aug-229:5957.036318.23303.418.212.75.575.05.0
B214-Aug-229:5057.035218.22843.018.212.35.975.05.0
B314-Aug-229:2457.051518.21304.220.821.00.275.05.0
B414-Aug-229:0957.052918.23132.722.121.80.375.05.0
B514-Aug-228:5457.051518.23992.721.621.40.275.05.0
B615-Aug-2219:0757.034418.23642.919.318.70.682.54.0
B715-Aug-2219:3057.035818.22904.020.218.22.185.04.5
B815-Aug-2219:5357.034918.22554.320.718.72.085.04.5
B915-Aug-2219:2057.035918.23413.219.118.30.882.54.5
B1015-Aug-2219:4357.035418.22704.820.518.42.185.04.5
FårösundF112-Sep-2220:0857.892819.02342.816.015.80.1270.03.0
F212-Sep-2220:4957.878019.03292.715.915.90.0270.04.0
F325-Aug-2218:4957.903219.03652.120.520.50.061.53.0
F412-Sep-2220:3757.880019.03173.215.915.70.2270.03.5
F525-Aug-2218:5757.901119.03754.520.320.50.361.54.0
F625-Aug-2219:1657.900619.02725.920.320.50.361.55.0
F712-Sep-2220:2757.881819.03032.915.715.70.0270.03.5
F812-Sep-2219:4557.882819.04336.215.815.60.2270.03.0
F925-Aug-2219:2857.904019.02805.520.520.50.061.55.5
F1025-Aug-2219:0557.901219.03633.920.320.50.261.54.0
KlintehamnK123-Aug-2219:4657.401618.15654.119.418.11.4360.03.5
K223-Aug-2219:3657.402218.15694.219.518.31.3360.03.0
K316-Aug-2219:4057.430718.13873.021.721.80.1180.05.0
K424-Aug-229:1457.402118.15883.915.413.22.2210.04.0
K523-Aug-2219:2357.404418.16153.019.419.00.4360.03.0
K624-Aug-2219:0357.402018.15734.215.413.22.2210.03.5
K716-Aug-2219:3157.431018.13674.221.621.50.1180.05.0
K822-Aug-2220:0757.425518.13405.021.420.11.3187.52.0
K922-Aug-2219:5257.425118.13252.521.220.50.6187.51.5
K1024-Aug-2218:5557.402418.15593.715.512.92.630.03.5
LausvikenL114-Sep-2219:1457.280718.70122.815.915.90.090.06.0
L216-Sep-2219:1757.286318.74592.814.214.00.1310.05.5
L314-Sep-2220:0757.286218.72484.816.216.20.090.06.5
L416-Sep-2219:4957.289218.73892.513.913.50.5310.05.5
L514-Sep-2219:5657.283618.73044.616.016.00.090.06.5
L616-Sep-2218:5757.287918.72794.814.311.52.8310.05.5
L714-Sep-2219:3857.280118.71143.015.915.90.090.07.0
L816-Sep-2219:2857.288018.74274.213.813.80.1310.05.5
L916-Sep-2219:3957.289718.74042.913.713.50.2310.06.0
L1014-Sep-2219:2657.279418.70362.416.015.90.190.06.0
VägumevikenV16-Sep-2220:4057.720018.82382.917.117.10.0285.06.5
V27-Sep-2221:0257.718018.81555.416.816.80.050.05.5
V36-Sep-2220:2657.716218.83322.816.416.40.0285.06.5
V47-Sep-2220:2857.711618.83312.815.915.90.050.03.5
V56-Sep-2220:5357.722318.81204.316.916.90.0285.05.0
V67-Sep-2220:4257.716918.82354.816.716.60.050.04.5
V77-Sep-2220:1257.705818.83644.216.616.50.150.05.5
V86-Sep-2220:1357.713018.82884.217.016.90.1285.06.5
V97-Sep-2219:5857.705918.82866.916.916.90.045.05.0
V106-Sep-2219:5357.702618.83446.417.117.00.1285.05.0
Mean 4.018.317.70.7155.64.4
SD 1.22.52.91.2106.31.4
Min 8:54 2.113.711.50.030.01.0
Max 21:02 6.922.121.85.9360.07.0
Table 3. Details of GoPro footage at six sites around Gotland, Sweden, with each ten camera transects. Orientation: D = downward-facing camera setup, F = tilted forward-facing camera setup. For the estimation of the filmed volume of water, see text. Mean, standard deviation (SD), minimum, and maximum values are provided for recording length and abundance.
SiteStationRecording Length (min)Recording Length (s)OrientationEstimated Volume (m3)No. JellyfishAbundance (ind. m−3)
AjkesvikenA13:53233F146.8500.0
A23:00180F146.85110.1
A33:54234F146.8510.0
A43:28208F146.8580.1
A53:46226F146.8500.0
A63:40220F146.85900.6
A73:35215F146.8560.0
A83:45225F146.8520.0
A93:29209F146.8500.0
A103:56236F146.8540.0
BurgsvikB12:28148D55.55841.5
B22:45165D55.55460.8
B32:44164D55.551252.3
B42:44164D55.55290.5
B52:38158D55.5520.0
B65:17317D55.552043.7
B75:47347D55.55310.6
B86:57417D55.55160.3
B94:25265D55.55320.6
B105:55355D55.55220.4
FårösundF13:40220F146.851020.7
F23:21201F146.85460.3
F32:00120F146.85350.2
F42:20140F146.851531.0
F52:02122F146.85340.2
F64:11251F146.8520.0
F73:30210F146.851831.2
F86:02362F146.851260.9
F95:15315F146.8500.0
F104:27267F146.8570.0
KlintehamnK14:07247F146.853662.5
K23:50230F146.852081.4
K32:37157D55.5590.2
K42:47167F146.856384.3
K54:31271F146.852861.9
K64:49289F146.851080.7
K72:55175D55.5550.1
K85:38338F146.851060.7
K95:56356F146.85190.1
K103:26206F146.852031.4
LausvikenL14:00240F146.85150.1
L24:15255F146.8500.0
L33:19199F146.8500.0
L42:59179F146.8540.0
L53:04184F146.8500.0
L64:41281F146.85190.1
L73:48228F146.8550.0
L83:49229F146.8500.0
L93:18198F146.8530.0
L103:33213F146.8530.0
VägumevikenV13:57237F146.851451.0
V24:57297F146.85120.1
V33:54234F146.8520.0
V44:48288F146.8520.0
V54:45285F146.851350.9
V65:35335F146.85860.6
V74:34274F146.851431.0
V83:17197F146.8540.0
V93:38218F146.851010.7
V103:34214F146.8540.0
Mean 235 0.6
SD 64 0.9
Min 120 0.0
Max 417 4.3
Disclaimer/Publisher’s Note: The statements, opinions and data contained in all publications are solely those of the individual author(s) and contributor(s) and not of MDPI and/or the editor(s). MDPI and/or the editor(s) disclaim responsibility for any injury to people or property resulting from any ideas, methods, instructions or products referred to in the content.

