Article

Reducing Wave Overtopping on Rubble Mound Breakwaters Using Floating Kelp Farms

by
Filipe Miranda
1,2,
Tomás Calheiros-Cabral
1,2,
Diogo Mendes
3,
Paulo Rosa-Santos
1,2,
Francisco Taveira-Pinto
1,2 and
Tiago Fazeres-Ferradosa
1,2,*
1
Department of Civil Engineering and Georresources, Faculty of Engineering, University of Porto, Rua Dr. Roberto Frias s/n, 4200-465 Porto, Portugal
2
Marine Energy and Hydraulic Structures Research Group, Interdisciplinary Center of Marine and Environmental Research (CIIMAR-LA), University of Porto, Port of Leixões Cruise Terminal, Av. General Norton de Matos s/n, 4450-208 Matosinhos, Portugal
3
CERIS—Civil Engineering Research and Innovation for Sustainable Development, Instituto Superior Técnico, University of Lisbon, Av. Rovisco Pais 1, 1049-001 Lisboa, Portugal
*
Author to whom correspondence should be addressed.
J. Mar. Sci. Eng. 2025, 13(5), 850; https://doi.org/10.3390/jmse13050850
Submission received: 3 April 2025 / Revised: 17 April 2025 / Accepted: 21 April 2025 / Published: 25 April 2025
(This article belongs to the Section Coastal Engineering)

Abstract

:
Near-surface floating kelp farms constitute a Nature-Based Solution (NBS) capable of damping incident wind-generated waves, which might be beneficial to reduce wave overtopping on maritime structures. As the global mean sea level rises, the mean wave overtopping discharge is expected to increase. The incorporation of this NBS, as a green–grey solution, might be beneficial to mitigate this effect. Physical modelling experiments with random waves have been conducted to assess the ability of this NBS to reduce the mean wave overtopping discharge on a rubble mound breakwater. Results show that while the mean wave overtopping discharge was reduced by 47% with a kelp farm length of 50 m (prototype scale), a kelp farm of 200 m achieved a reduction of 93% for the tested conditions. This reduction is mainly a function of the ratio between floating kelp farm length and incident wavelength. An idealized case study at the Port of Leixões breakwater suggests that, under storm wave conditions with return period of 2 and 5 years, floating kelp farms could maintain mean wave overtopping discharges below present levels until 2070. Thus, this study highlights the relevance of incorporating NBS with existing coastal and port defence structures as an adaptation measure to mitigate climate change effects.

1. Introduction

Nature-Based Solutions (NBSs) that incorporate aquatic vegetation either emerged or submerged can play an important role in hazard mitigation in different coastal settings.
A large body of literature attests their use on dunes that back up low-lying sandy beaches [1,2,3,4,5,6]. In general, vegetated dunes can reduce beach and dune erosion during coastal storms as well as dune overwash, thereby mitigating coastal hazards.
From a coastal engineering perspective, NBSs can also play a role in damping incident wind-generated waves in more sheltered areas, such as lakes and inland areas of estuaries. Based on results obtained using both physical modelling experiments and field observations, this damping capacity has been highlighted in the literature for submerged aquatic vegetation and mangroves [7,8,9,10,11].
The previously mentioned works suggest that vegetation has the potential to be included in hybrid coastal solutions composed of a maritime work and complemented with a NBS to form a green–grey solution. Such a hybrid solution can effectively mitigate coastal hazards [12]. These authors performed a cost-benefit analysis to compare the wave overtopping discharge between a scenario where the seawall crest height is increased and the scenario where a saltmarsh is placed in front of the seawall. Based on their results, the hybrid solution composed of a saltmarsh in front of the seawall was economically justifiable. Moreover, this solution promoted ecosystem services and also reduced sediment resuspension close to the seawall.
The combined ability of NBSs in reducing coastal hazards and promoting wave damping might be extended to other coastal engineering applications. The hydraulic design of breakwaters takes the mean wave overtopping discharge into account. In general, the admissible limits of mean wave overtopping discharge can be defined based on the EurOtop Manual [13]. These limits mainly depend on the purpose of the maritime work. The overtopping discharge over rubble mound breakwaters is often characterized by the mean wave overtopping discharge ( q ), which is the total wave overtopping volume ( m 3 ) per unit of time ( s ) per meter width of breakwater ( m ). This parameter is relatively easy to measure, and there is an extensive physical modelling database in the literature [14]. The EurOtop manual proposed a mean value approach formula [Equation (1)] to predict q for rubble mound breakwaters with a slope between 1:2 and 1:4/3:
q g H m 0 3 = 0.09   e 1.5 R c H m 0 γ f γ β 1.3
where H m 0 is the incident significant wave height, g is the acceleration of gravity, γ f is the influence factor for the permeability and roughness of the slope, γ β is the influence factor of oblique wave attack, and R c is the crest freeboard.
Based on Equation (1), the expected increase in global mean sea level may have important consequences for wave overtopping levels. Sea level rise leads to a decrease in the crest freeboard, which will in turn result in higher wave overtopping volumes. In this regard, NBSs can play a role in mitigating this effect.
To the authors’ best knowledge, only two studies have been conducted using physical modelling to assess the potential of NBSs to reduce the wave overtopping hazard. Marsh vegetation placed in front of a dyke was able to reduce mean wave overtopping discharges [15]. Moreover, mangroves reduced mean wave overtopping discharge when placed in front of both seawalls and rock revetments [16]. Similarly to the saltmarsh and seawall solution [12], the saltmarsh and dyke solution [15], or the mangroves and both seawall and coastal revetment solutions [16], aquatic vegetation might be used to reduce wave overtopping on a rubble mound breakwater.
Instead of submerged aquatic vegetation (SAV), a patch of algae can be deployed. If successful, this NBS will not only promote wave damping [17] but will also promote wave overtopping reduction and further contribute to enrich local biodiversity and harvesting. Overall, the use of an NBS in the form of algae as a coastal protection enhancement may mitigate the effect of mean sea level rise in wave overtopping, thereby keeping mean wave overtopping discharge within admissible limits.
Despite the vast examples in the literature of NBSs’ contribution to reducing coastal hazards and SAV’s ability to promote wave attenuation, the literature is very limited on the effect of suspended aquatic vegetation. Zhu et al. [18] analysed the wave damping effect of suspended Saccharina latissima kelps, achieving a wave energy dissipation ratio of up to 34%. Miranda et al. [17] analysed the wave damping promoted by idealized suspended kelps, achieving wave transmission coefficients ranging from 0.56 to 0.96, being largely a decreasing function with an increase of the ratio between kelp farm length and incident wavelength. Nevertheless, the effect of suspended kelps on wave overtopping of a rubble mound breakwater is still very poorly understood. This aspect still constitutes an important research gap to be fulfilled that will promote design guidance for green–grey hybrid coastal engineering solutions.
The objective of this study is to better understand how the effect of a floating kelp farm can change the mean wave overtopping discharge on rubble mound breakwaters, thereby contributing to improving guidance on the use of NBSs in coastal engineering. Specific objectives include the following: (i) the quantification of the influence factor for suspended kelps and (ii) the assessment of whether this hybrid solution can maintain the admissible mean wave overtopping discharge to cope with sea level rise in an idealized but realistic rubble mound breakwater. To the authors’ best knowledge, this is the first study that carries out an experimental study of wave overtopping on a hybrid solution composed of a rubble mound breakwater with and without an artificial floating kelp farm.
This paper is structured as follows. Section 2 describes the small-scale physical modelling experiments that have been conducted to measure the mean wave overtopping discharge of the hybrid solution. Section 3 presents the obtained results and provides a discussion about the floating kelp farm influence factor on the mean wave overtopping discharge. Section 4 provides a practical application of the obtained results to highlight that such a hybrid solution can keep the mean wave overtopping discharge to a desired level even under the sea level rise scenario SSP2-7.0. Section 5 presents the main conclusions.

2. Methodology

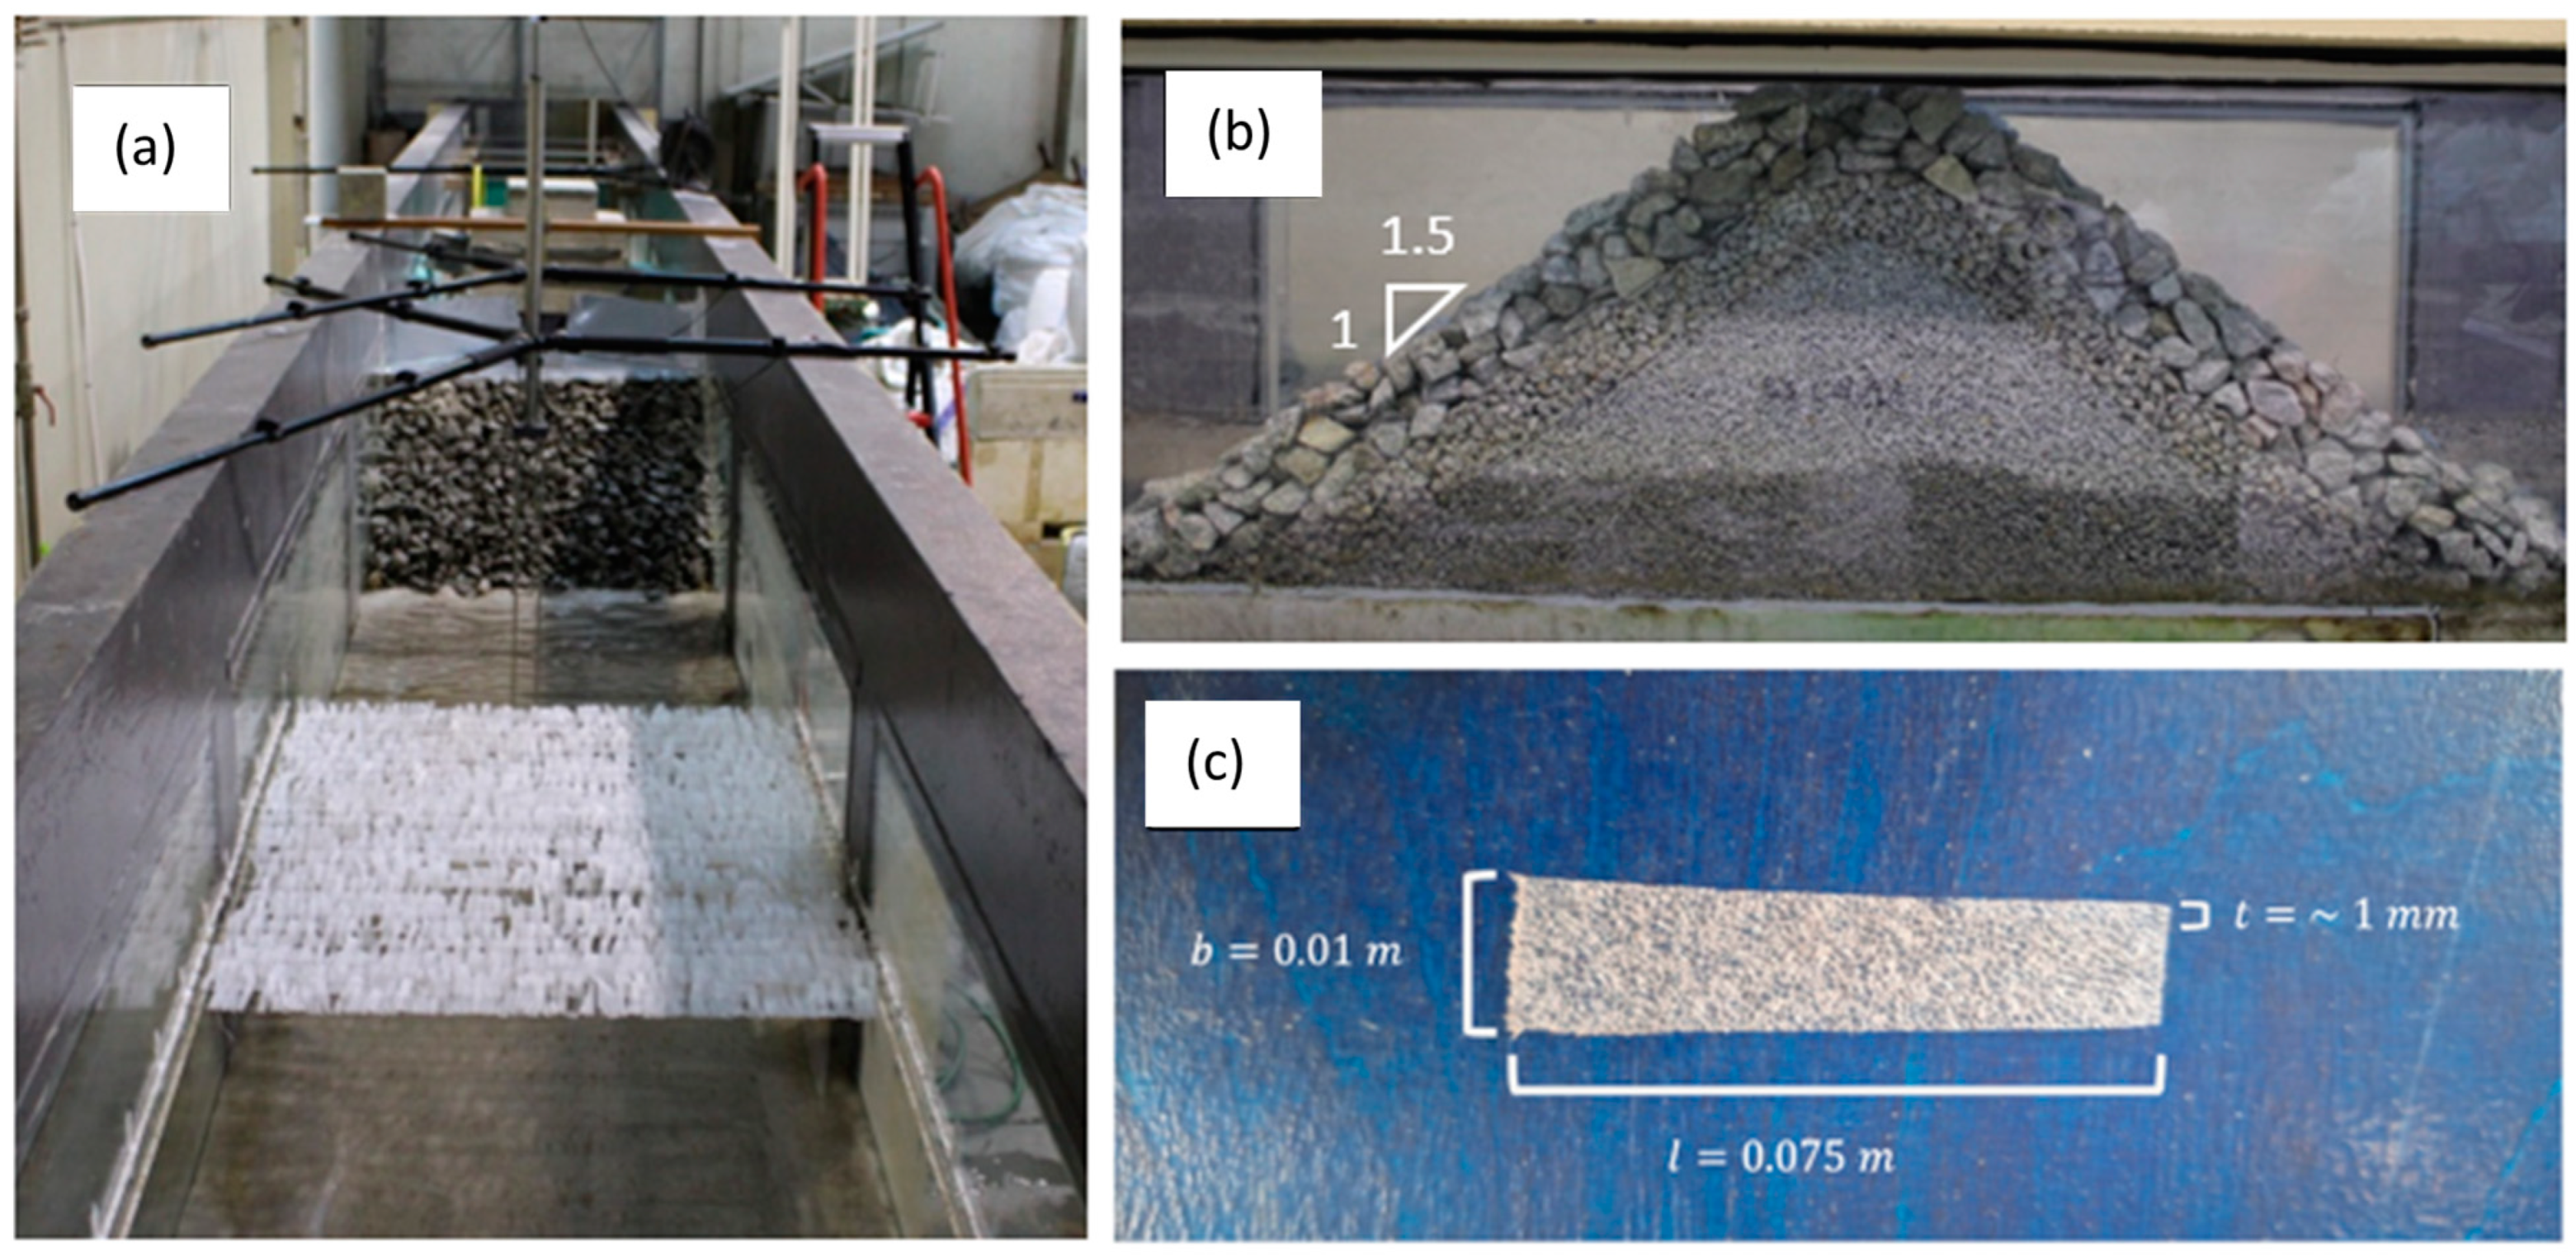
2.1. Experimental Set-Up

This experimental study was conducted at the wave flume of the Hydraulics Laboratory of the Faculty of Engineering of the University of Porto (FEUP). The flume is 29 m long, 1 m wide, and 1 m deep, and it is equipped with an HR Wallingford piston-type wave-generation system. Further description of the wave flume layout can be found in Chambel et al. [19] and Miranda et al. [20].
The experimental set-up consists of a floating kelp farm model installed seawards of a rubble mound breakwater model built on a 1:40 geometric scale, following Froude similitude. To measure the free surface water level and evaluate the incident wave characteristics, four resistive wave probes were placed seawards of the floating kelp farm model with a sampling frequency of 100 Hz. Their spacing followed the method for separating incident from reflected waves using three wave gauges proposed by Mansard and Funke [21]. Additionally, two wave probes were placed between the floating kelp farm model and the breakwater, one immediately leeward and the other one at the toe of the breakwater (Figure 1).
To measure the wave overtopping volume, a sloped metal chute was installed at the top of the breakwater to direct the water to an overtopping reservoir (0.53 × 0.93 × 0.95 m) that was placed leeward of the breakwater. Inside of the overtopping reservoir, a resistive free-surface wave probe was installed to measure wave overtopping volume. A water pump was also placed inside the reservoir to remove water during the test for large wave overtopping volumes.
Due to space constraints in the flume, the distance between the floating kelp farm and the rubble mound breakwater was fixed at 2 m (equivalent to 80 m in prototype scale). Under real-world conditions, this distance may be insufficient given the lateral movement permitted by the mooring system. Previous experiments on wave propagation through floating kelp farms indicated that only incident wave height was affected [17]. Therefore, the influence of the distance between the kelp farm and the breakwater on wave overtopping is expected to be limited. Nonetheless, further testing with varying distances is recommended to assess potential effects.
The armour layer was built with available stones with sizes between 0.031 and 0.054 m and a thickness of 0.08 m, an underlayer with stones with sizes between 0.014 and 0.016 m and a thickness of 0.06 m, and a permeable core consisting of gravel with a mean size of 0.004 m. The breakwater model was built with a crest height of 0.46 m, which, for the tested water depth h = 0.34 m, presents a crest freeboard R c = 0.12 m. The floating kelp farm model consists of multiple (25, 50, and 100) 1 m longlines placed perpendicular to the wave-propagation direction, with 80 kelp individuals (kelp density of 1600 stems/ m 2 ). The longlines were fixed at the flume walls 0.05 m below the still water level with a spacing between each of 0.05 m to replicate typical kelp optimal growth condition (i.e., adequate light penetration and nutrient flow). Each individual kelp consists of a polyurethane foam stem with a length l = 0.075 m, a width b = 0.010 m, a thickness t = 0.8 1.2 mm, and a material density ρ = 20   k g / m 3 (Figure 2). The kelp-mimicking material density is significantly lower than the water density, resulting in a floating position when the wave flume is filled (see Figure 3b at [17]).

2.2. Testing Plan

The testing plan that was carried out consists of five incident wave conditions tested on four different physical model configurations (Case 0 to 3) and with varying floating kelp farm lengths l m :
  • Case 0—Control tests without the presence of the floating kelp farm model;
  • Case 1—Tests with a floating kelp farm model with 25 longlines;
  • Case 2—Tests with a floating kelp farm model with 50 longlines;
  • Case 3—Tests with a floating kelp farm model with 100 longlines.
The still water depth was set to h = 13.6 m (full-scale) to represent environmental conditions just seawards of the depth of closure along the northwest Portuguese coastline [22]. The incident wave characteristics measured seawards of the floating kelp farm model can be found in Table 1, where H m 0 is the incident spectral significant wave height, T p is the peak wave period, λ the wavelength, s is the wave steepness, a k is the relative wave amplitude, k is the wave number, k h is the relative water depth, and R c / H m 0 is the relative crest freeboard.

2.3. Similarity Analysis

Vegetation characteristics tend to be particularly hard to replicate in laboratory conditions due to their complex flexibility and geometry. According to Luhar and Nepf [23], wave–vegetation interaction can be characterized by the wave Cauchy number ( C a w ) in Equation (2), which represents the ratio between the hydrodynamic drag forces and the kelp stem stiffness; the length ratio ( L ) in Equation (3), which represents the ratio between the stem length and wave orbital excursion; and the buoyancy parameter ( B ) in Equation (4), which represents the ratio between buoyancy forces and stiffness-restoring forces:
C a w = ρ w b U w 2 l 3 E I
L = 2 π l U w T
B = ρ g b t l 3 E I
where ρ w is the water density, E is the stem’s Young’s modulus, I the stem second moment of inertia, and Δ ρ the difference between water and vegetation mass density. The Young’s modulus of the kelp-mimicking material used in the current study ( E = 84   M p a ) was estimated using 30 cantilever tests (see Section 2.2 in [17]). Table 2 presents a summary of the used vegetation characteristics in this study and a comparison to possible idealized fully grown Laminaria hyperborea and Laminaria digitata kelp specimens with a length of 3 m and a constant width of 0.4 m [17].
According to previous authors [27,28,29], vegetation similarity between field and experimental conditions can be achieved by guaranteeing four parameters: (i) geometrical dimensions, (ii) incoming wave dynamics, (iii) hydrodynamic impact of wave on plant, and (iv) plants’ response to wave motion.
Both species presented in Table 2 (L. hyperborea and L. digitata) have been reported to grow up to a length of 2 to 4 m and a blade width over 0.35 m for mid-sized specimens [25,30]. In this study, polyurethane foam stem with 0.07 m of length and 0.001 m of width (1:40 geometric scale) were used to replicate the geometry of an idealized fully grown kelp with a uniform width. The Froude similitude ensures that hydrodynamic ratios such as the Froude number, F r , and the relative wave height, H m 0 / h , are equal between prototype and experimental conditions.
The physical model was built using Froude similitude; therefore, the Keulegan–Carpenter number ( K C ) is equal between polyurethane stem and idealized kelps with 0.4 m uniform width.
Regarding the plant’s response to wave motion, which can be characterized by C a w , B , and L , the polyurethane foam stems used in the current study are associated with the following: (1) equal length ratio L as idealized 3 m long kelp individuals for both L. hyperborea and L. digitata; (2) a buoyancy parameter B within the range of reported plant characteristics for L. digitata and below the reported plant characteristics for L. hyperborea; and (3) a wave Cauchy number C a w close to the lower range of reported plant characteristics for L. digitata and below the reported plant characteristics for L. hyperborea. Additionally, the polyurethane foam stems used in this study display morphological and material property discrepancies between model and prototype, namely, differences in mass density and stiffness. Further discussion on the limitation of the current study can be found in Section 2.5.

2.4. Wave Overtopping Signal Processing

The wave overtopping volumes were measured using a resistive-type wave probe placed inside the reservoir (Figure 1). This reservoir collected the overtopping volumes via a 1 m wide chute, which directed water from the crest of the structure to the reservoir. To prevent overflow, a pump was installed in the reservoir, activating it when the water level reached an upper threshold and deactivating it when the water level dropped below a lower limit.
Initial attempts to utilize wave gauges for analysing individual wave overtopping events proved unsuccessful. Based on Koosheh, et al. [31], two complementary methods were initially planned for the measurement of individual wave overtopping: (i) analysing the signal of the wave probe inside the overtopping reservoir to detect the punctual increase in water level, indicating an overtopping event, and (ii) placing wave probes on top of the breakwater’s crest to detect when water passed over the crest. However, the increase in water level inside the reservoir was not sufficiently clear to unequivocally identify individual wave overtopping events. Additionally, the analysis faced challenges due to the merging of two (or more) overtopping events into one. Consequently, the analysis of individual wave overtopping events was not possible.

2.5. Scaling and Model Effects

Several scaling and model effects should be considered while analysing the obtained results. The wave flume presents variations in roughness along its length, mainly induced by the concrete and glass walls. To avoid these effects, the resistive wave probes were placed at the centre of the flume. Regarding the formation of evanescent wave modes, the wave flume has a constant water depth between the wavemaker and the 1/20 sloped approach ramp. These conditions satisfy Wolters et al.’s [32] recommendations for evanescent wave modes decay. Moreover, the physical modelling experiments were carried out using 1st order wave generation without active wave absorption. Despite this shortcoming, no signs of seiching motion were visually detected during the tests.
Investigations carried out by various authors have led to some generic scale and model effects recommendations (see [13]). Water depth should be larger than 0.02 m ( h = 0.34 > 0.02   m ), wave periods larger than 0.35 s ( T p = 1.66 2.44   s ), significant wave heights higher than 0.05 m ( H m 0 = 0.106 0.127   m ), and armour layer Reynolds number exceeding 3 × 10 4 ( R e = 4.6 4.8 × 10 5 ). Therefore, the above-mentioned scale and model effects recommendations have been fulfilled in the experiments.
However, it is important to note that the materials used to simulate kelp do not fully replicate the material properties and geometry of the prototype kelp. Although the mimicking material offers a similar fluid–vegetation interaction to L. digitata, it does not match the more flexible properties of L. hyperborea. The polyurethane foam stems used generally exhibit higher stiffness, with lower values of C a w and B , which may result in an overestimation of wave overtopping reduction compared to what a L. hyperborea prototype kelp farm might achieve.

2.6. Mean Wave Overtopping Discharge, Reduction Rate, and Influence Factor

The mean wave overtopping discharge, q , was obtained by the ratio between the cumulative volume of all wave overtopping events and the total test duration.
Following Libby et al. [16], the wave overtopping reduction rate δ was computed using Equation (5).
δ = q   ( I D i _ O ) q   ( I D i _ j ) q   ( I D i _ O )
Following EurOtop [13], the mean wave overtopping discharge of rubble mound breakwaters is a function of the relative crest freeboard, the significant wave height and influence factors (see Equation (1)). In this equation and following the EurOtop guidelines, the significant wave height and the wave period should be computed at the toe of the structure. Therefore, the γ f influence factor is associated with permeability and roughness elements between the toe and the breakwater crest.
In this case, the hybrid solution is composed by a kelp farm located seaward of the breakwater toe. This difference implies that the influence factor for the kelp farm also accounts for friction effects that may take place between the section seawards of the kelp farm and the breakwater crest. Here, the roughness influence factor was separated from the influence factor associated with the kelp farm. For that purpose, a kelp influence factor γ k was introduced in Equation (1) as follows:
q g H m 0 3 = 0.09 e 1.5 R c H m 0 γ f γ k 1.3
γ k accounts for the reduction in wave energy due to the presence of a kelp farm that is placed seawards of the rubble mound breakwater. γ k is estimated for each test (ID1_1 to ID5_3) using Equation (6) fitted with measured values of q and γ f varied from 0.44 and 0.49 depending on the incident wave conditions. Note that γ f was derived from the control tests (ID1_0 to ID5_0).

3. Experimental Results

Figure 3 shows the mean wave overtopping discharge measured for each test. The figure shows an increase in q from wave conditions ID1 to ID5 for each configuration, although for the first two configurations there is a slight reduction between tests 4 and 5 (Figure 3). Moreover, it is clear that the kelp farm leads to a reduction in q (Figure 3). The wave overtopping reduction rate δ increases with the increase of kelp farm length l m , eventually leading to almost no wave overtopping for some conditions (i.e., ID1_3). Test results and measured parameters can be found in Table A1.
Tests with 25 longlines (blue bars in Figure 3) presented a wave overtopping reduction rate between 31% and 64% with an average of 47% (see Figure 3). Tests with 50 longlines (green bars in Figure 3) presented a wave overtopping reduction rate between 49% and 84%, with an average of 70%, and tests with 100 longlines (purple bars in Figure 3) presented a wave overtopping reduction rate between 83% and 100%, with an average of 93% (Table 3). The results clearly suggest that a suspended kelp farm is capable of reducing the mean wave overtopping discharge of a rubble mound breakwater. This reduction capacity increases as a function of the floating kelp farm length (Figure 3).
The rubble mound breakwater roughness factor was estimated using measured values of q for each control test (ID1_0 to ID5_0) with values between γ f = 0.44 0.49 . γ f estimates are within the expected values based on physical modelling experiments [13] for rubble mound breakwaters with a two-layer rock armour and impermeable or permeable core. Figure 4 depicts the measured values of mean wave overtopping for each test. Additionally, the curve fitted to the control tests is also shown (ID1_0 to ID5_0). This curve was obtained using Equation (1) with γ f as a calibration parameter (mean value of γ f = 0.47 ).
The kelp farm influence factors range between 0.48 and 0.93. While larger values of γ k are associated with smaller kelp farm lengths, smaller values of γ k correspond to large kelp farm lengths. This suggests that a smaller kelp farm has a smaller influence on the mean wave overtopping discharge than a longer one.
Miranda et al. [17] studied the wave decay using a similar set-up and concluded that the transmission coefficient induced by a floating kelp farm is mostly a function of the ratio between the floating kelp length and the incident wavelength l m / λ . From the estimated γ k , the following empirical equation, which gives a functional relation between γ k and l m / λ with an R 2 = 0.83, is proposed:
γ k = 1 0.2 l m λ
Figure 5 shows a scatter plot of the measured dimensionless wave overtopping parameter values and the ones obtained using Equation (6), where γ k is given by Equation (7). In this analysis, test number ID1_3 was eliminated because it did not register any wave overtopping ( q = 0   l / s / m ) . Following Goda [33], the geometric mean and geometric standard deviation of the scatter shown in Figure 5 is 1.028 and 1.617, respectively. The uncertainty in measuring overtopping discharges in physical modelling usually leads to significant geometric standard deviations, as shown in [33,34,35].
Baker et al. [15] conducted small-scale physical modelling experiments to assess the influence of marsh vegetation on wave damping on coastal dykes. These authors also compared values of mean wave overtopping discharges for different marsh vegetation densities. Although with some scatter, Baker et al. [15] highlighted the potential role of saltmarshes to decrease wave overtopping of coastal dykes. The results obtained in this study are in agreement with those obtained by Baker et al. [15]. In more detail, the incorporation of a floating kelp farm seaward of a rubble mound breakwater provides a reduction on the mean wave overtopping discharge (Figure 3). The reduction rate ranges between 47% and 93% for floating kelp farm lengths between 1.25 and 5.00 m, respectively.
Libby et al. [16] carried out large-scale physical modelling to assess different hybrid solutions to reduce wave overtopping of a seawall. These authors combined either mangroves alone or mangroves plus a rock revetment. Similar to their results, the incorporation of aquatic vegetation reduced the mean wave overtopping discharge. While in their tests the reduction factor ranged between 0.40 and 0.99, in this study the reduction factor ranged between 0.31 and 1.00. In line with Libby et al.’s [16] findings, the reduction factor also decreased almost exponentially with the length of the aquatic vegetation (compare Figure 9 by Libby et al. [16] with Figure 3). This may be attributed to the wave attenuation promoted by the floating kelp farm that reduces the incident wave height at the toe of the breakwater.
Unlike previous studies, the present study provides a way to incorporate the effect of a floating kelp farm in the EurOtop [13] formulation (see Equation (6)) through the γ k influence factor. This way, a quantitative assessment of the wave overtopping on hybrid solutions was provided, which may be important in coastal engineering practice. A possible application of such extension to sea level rise is provided in the next section.

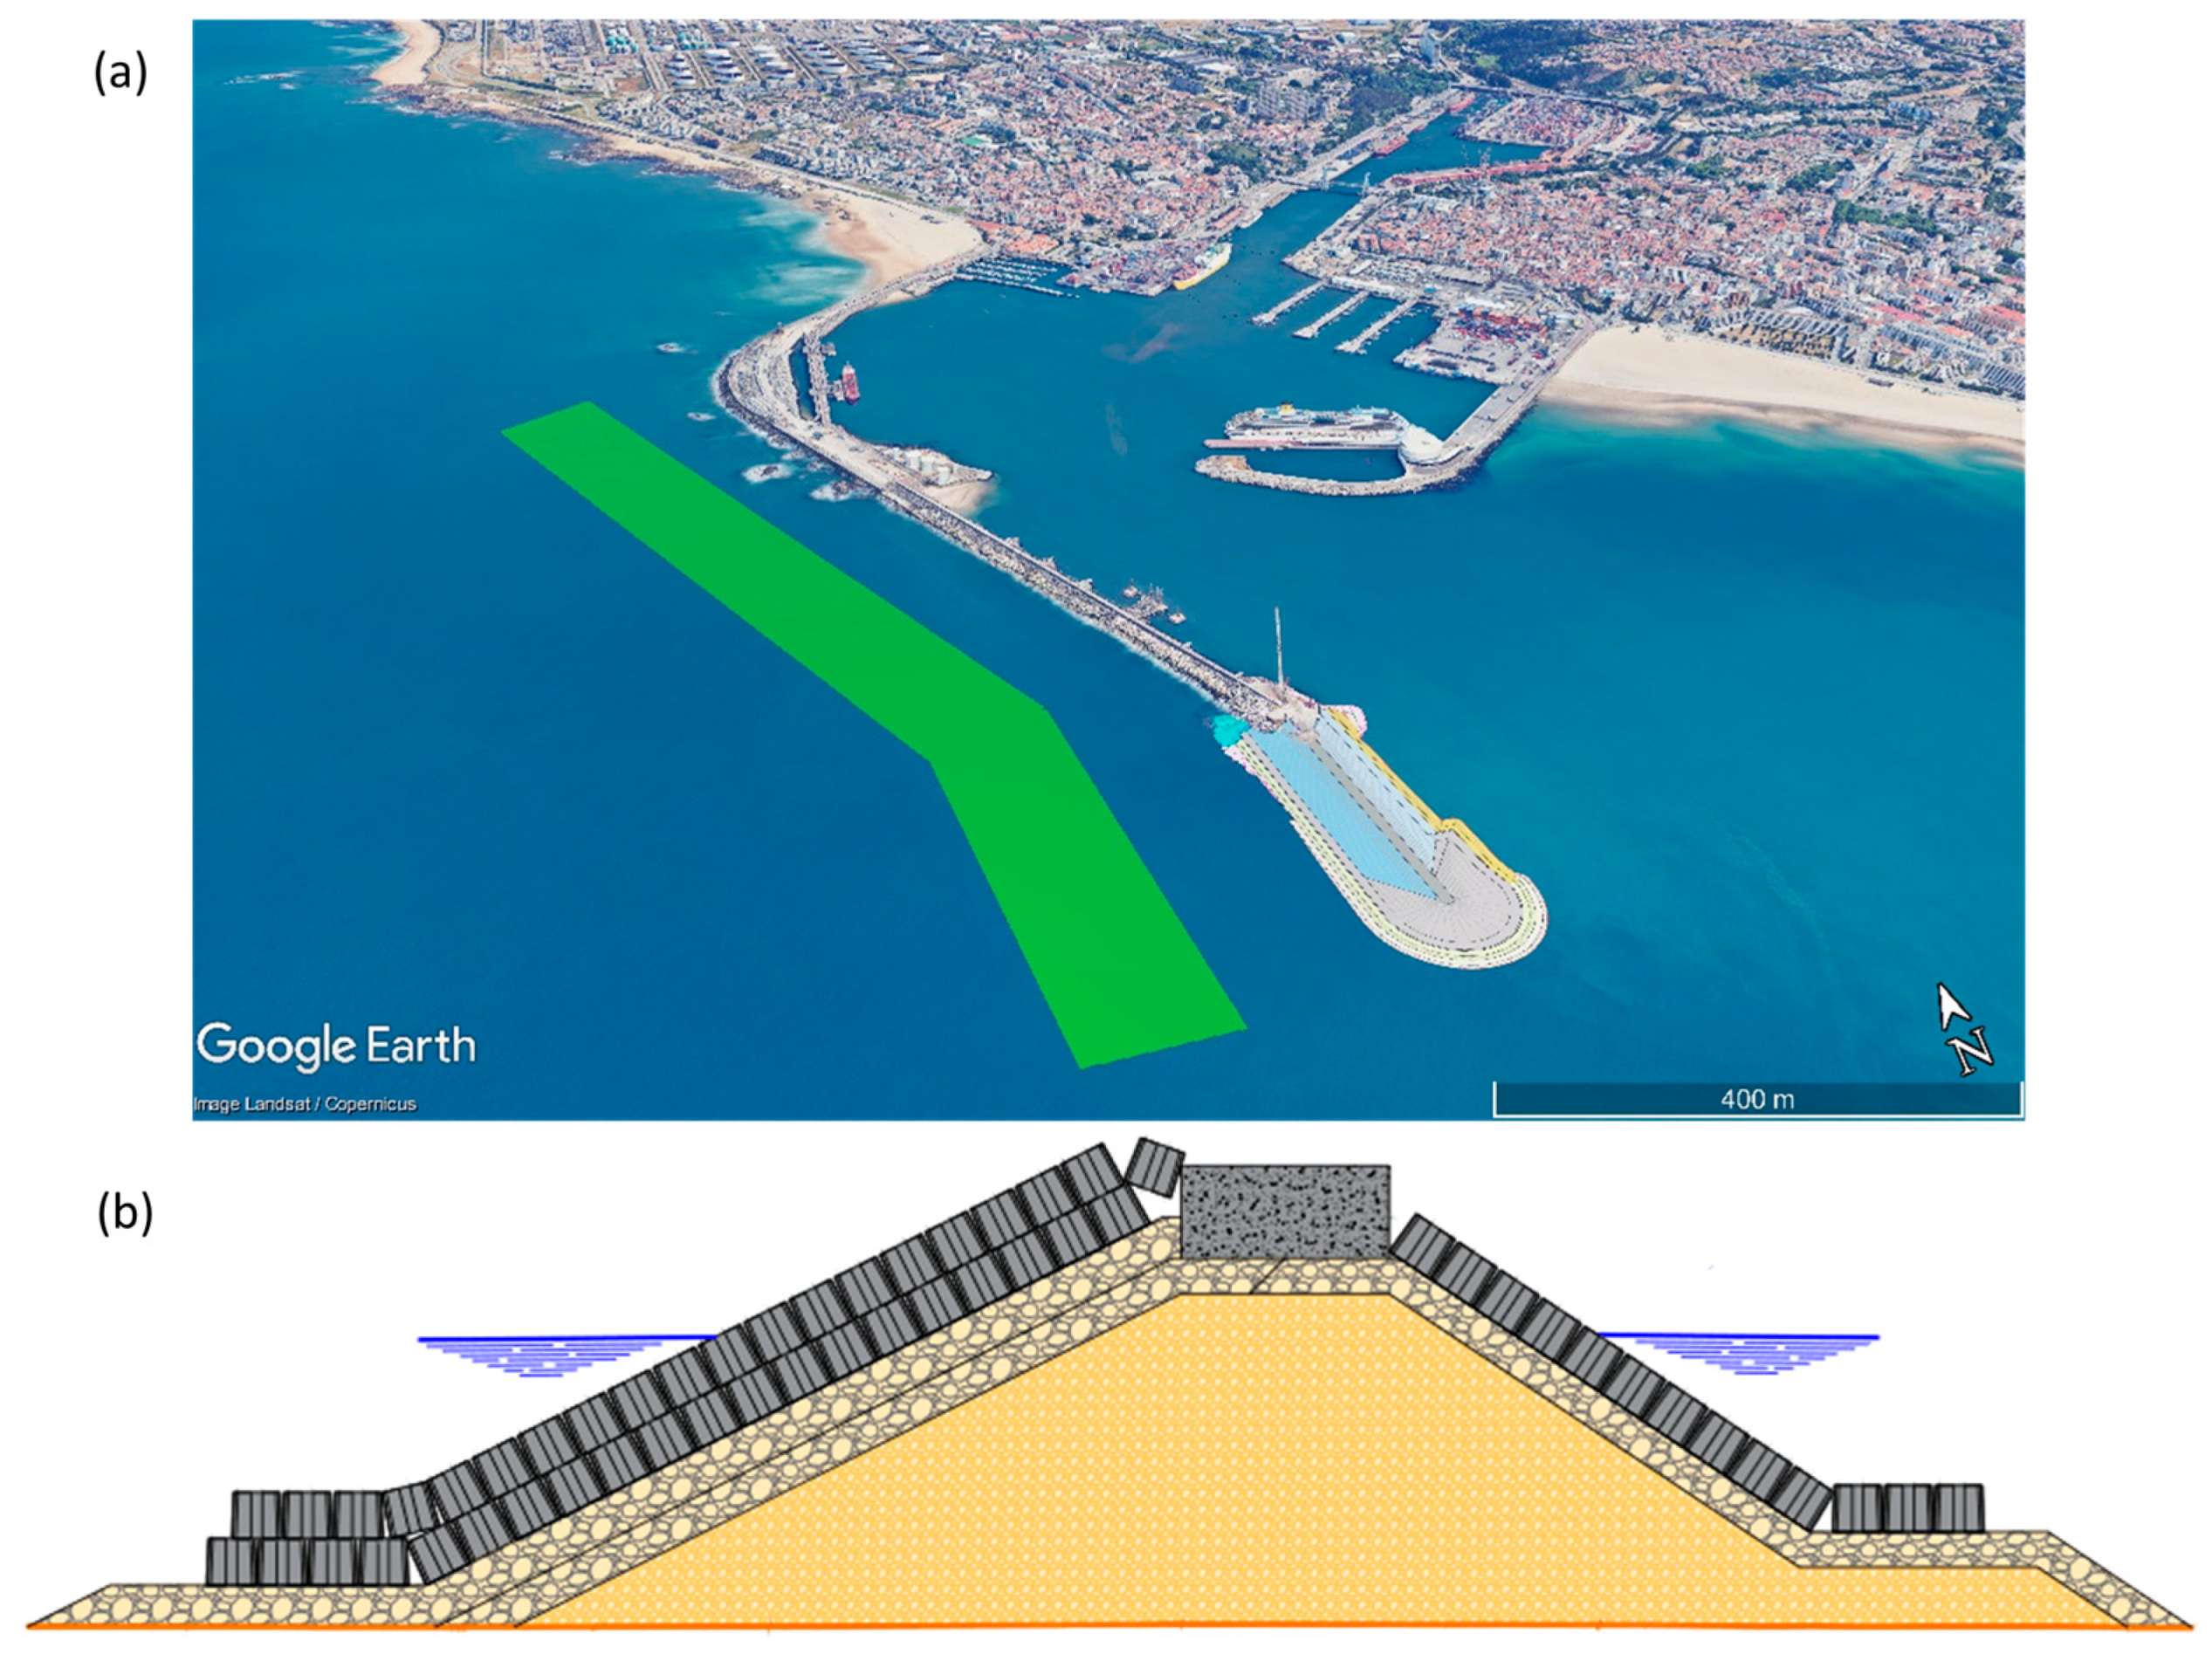
4. Case Study: Port of Leixões

4.1. Brief Introduction to Port of Leixões

The Port of Leixões is situated in the north of Portugal, 2.5 nautical miles north of the mouth of the Douro River. This port is bordered by the towns of Leça da Palmeira to the north and Matosinhos to the south. The Port Authority of Douro, Leixões, and Viana do Castelo (APDL) deemed necessary to extend the north breakwater of the port by 300 m to improve sheltering conditions and to be able to receive larger container ships (Figure 6).
The seaward armour layer of the extension comprises a double layer of regularly placed Antifer blocks, each measuring 2.9 m in height and weighing 680 kN. The toe berm also consists of two layers, using blocks with the same dimensions as those in the armour layer but heavier, weighing 800 kN each. On the leeward side, both the armour layer and toe berm are built with a single layer of regularly placed Antifer blocks, with the same dimensions and a weight of 680 kN. On the seaward side, two filter layers of rocks, ranging from 40 to 60 kN and 5 to 10 kN, provide the transition to a tout-venant core, containing rocks between 0.01 and 10 kN. The leeward side has a single filter layer with rocks between 20 and 40 kN. The armour crest height is at 14.76 m Local Chart Datum (LCD), which is 1.674 m below mean sea level. The superstructure crest is at 13.00 m (LCD).
This section was used as an idealized, but realistic, case study to assess the effectiveness of the floating kelp to reduce mean wave overtopping discharges over rubble mound breakwaters for wave conditions associated with return periods of 2 and 5 years. For that, the EurOtop formula is applied considering the reduction factor for the floating kelp γ k (Equation (6)), and the resulting wave overtopping discharges are compared to the case without the floating kelp (see Figure 6).

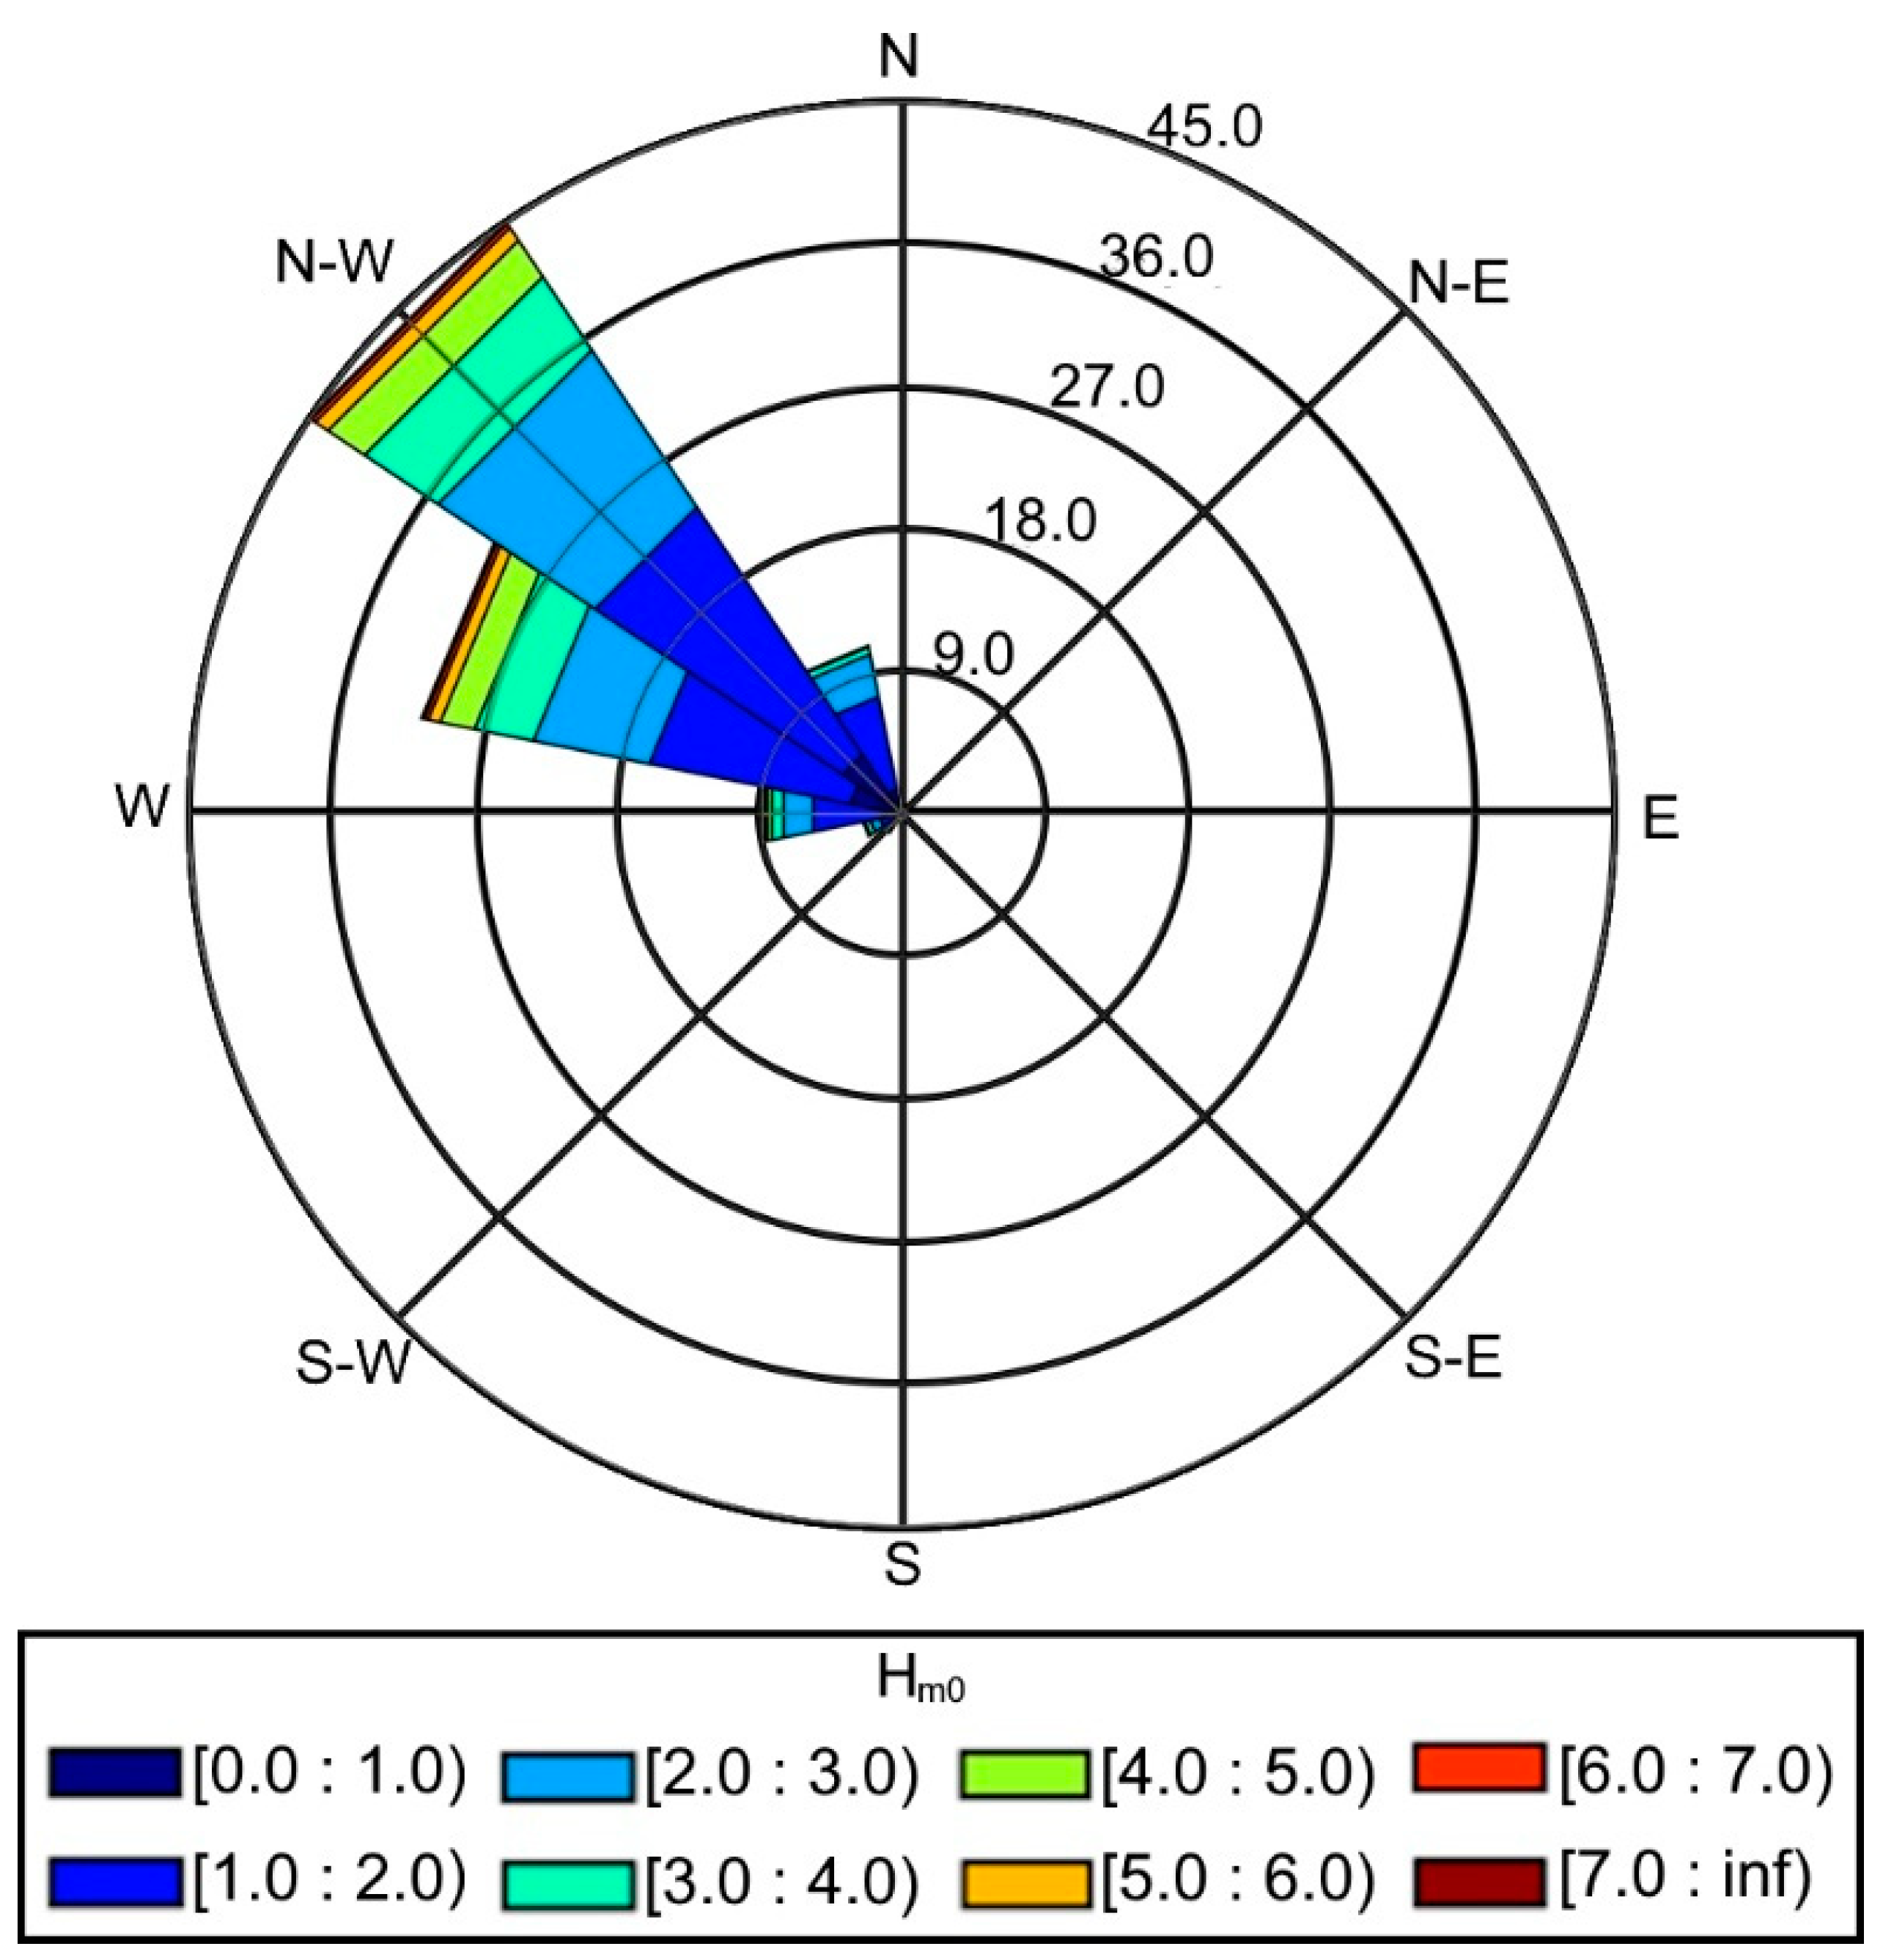
4.2. Wave Climate and Sea Level Rise Projections near Port of Leixões

The Port of Leixões is subjected to an energetic wave climate [36,37]. Ramos et al. [38] processed data from the wave buoy close to Port of Leixões (41.33° N, 8.98° W), located at a water depth of 83 m, spanning 15 years from 1 January 2004 to 31 December 2018. The data have a 3 h time interval, resulting in the analysis of 43,800 sea states. The wave parameters from the wave buoy are the significant wave height H m 0 , the peak wave period T P , and the mean wave direction θ m . The annual wave rose is shown in Figure 7.
Four points were selected for a detailed assessment of the wave energy at the Port of Leixões in Ramos et al. [38], shown in Figure 8 as Point 1, Point 2, Point 3, and Point 4. Point 3 was selected to determine H m 0 at the extension of the breakwater to use in this case study. This point’s coordinates are −48,524 m and 167,522 m (PT-TM06/ETRS89), and the depth at the point is 13.8 m (MSL).
Satellite altimetry measurements of the global mean sea level have provided evidence that the global mean sea level has risen by 111 mm between 1993 and 2023 [39]. According to Hamlington et al. [39], sea level rise rate is expected to reach ~5 mm/year by 2030, 5.8 mm/year by 2040, and 6.5 mm/year by 2050. This projection shows good agreement with the projections of IPCC AR 6, especially with the scenarios of SSP2-4.5 and SSP2-7.0 (see Figure 2 from Hamlington, et al. [39]). Table 4 presents the sea level rise projection from IPCC AR6 for scenario SSP2-7.0 at the Port of Leixões that was obtained using the NASA Sea Level Projection Tool (https://sealevel.nasa.gov/ipcc-ar6-sea-level-projection-tool [accessed on 6 January 2025]) for the Leixões tidal gauge.
A standard extreme value analysis was carried out to determine the significant wave height close to the breakwater for return periods between 2 and 5 years. These return periods were preferred because it is unknown whether a floating kelp farm is able to resist higher return periods (e.g., 50 or 100 years). Nevertheless, this choice allows us to provide an estimate on whether this hybrid solution can reduce q during frequent storm conditions that can take place every few years. The extreme value analysis was carried out following the procedures described in Goda [40]. The annual maxima method was applied on the time series at Point 3 (Figure 8) to obtain the sample values. This time series was obtained after propagation of wave conditions measured by the Leixões wave buoy from 2004 and 2018 with the SWAN phase-averaged model towards the study site [38]. The Weibull distribution function was fitted to the sample values with a fixed k value of 2.0. A linear regression analysis was used to calculate the A and B parameters of the distribution. This extreme value analysis procedure provided a 2-year (5-year) return period significant wave height of 6.28 m (7.47 m) at a water depth of 13.8 m (MSL) close to the breakwater. The incident wave period was varied between 14 s, 16 s, and 18 s to provide some intervals of mean wave overtopping discharge computations. A perpendicular wave incidence was assumed, which leads to a value of 1.0 associated with the angle of wave attack influence factor.

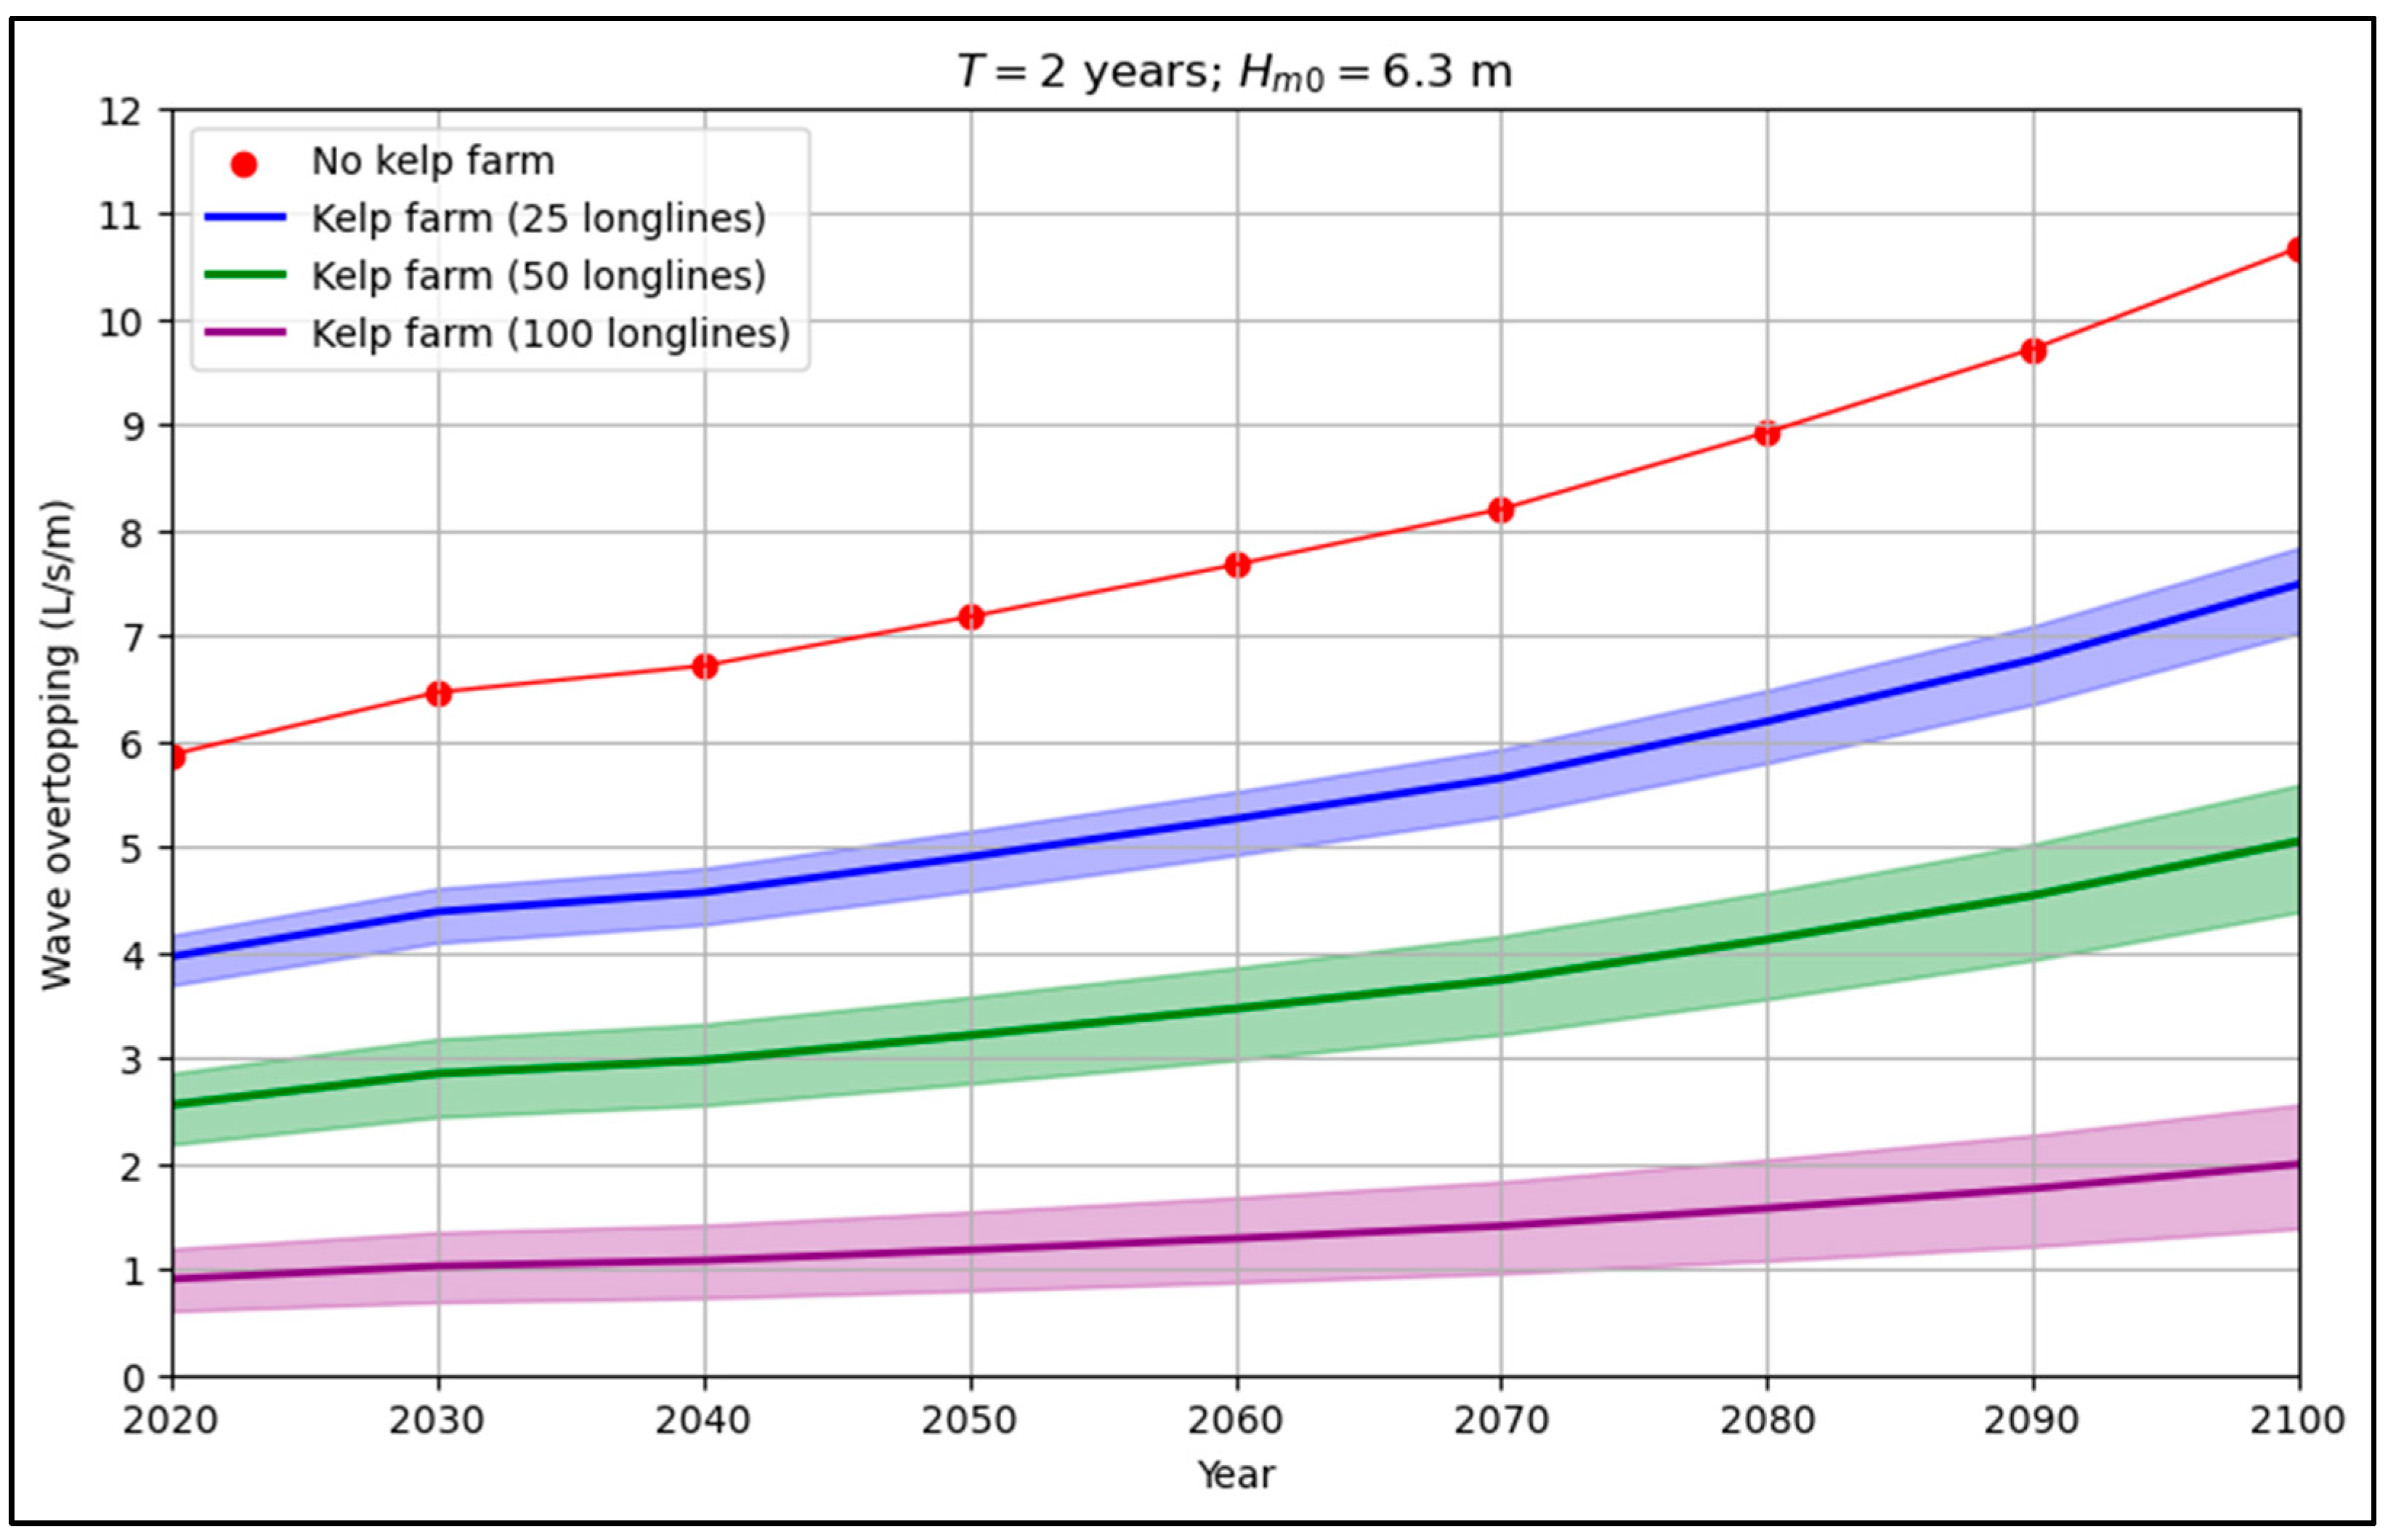
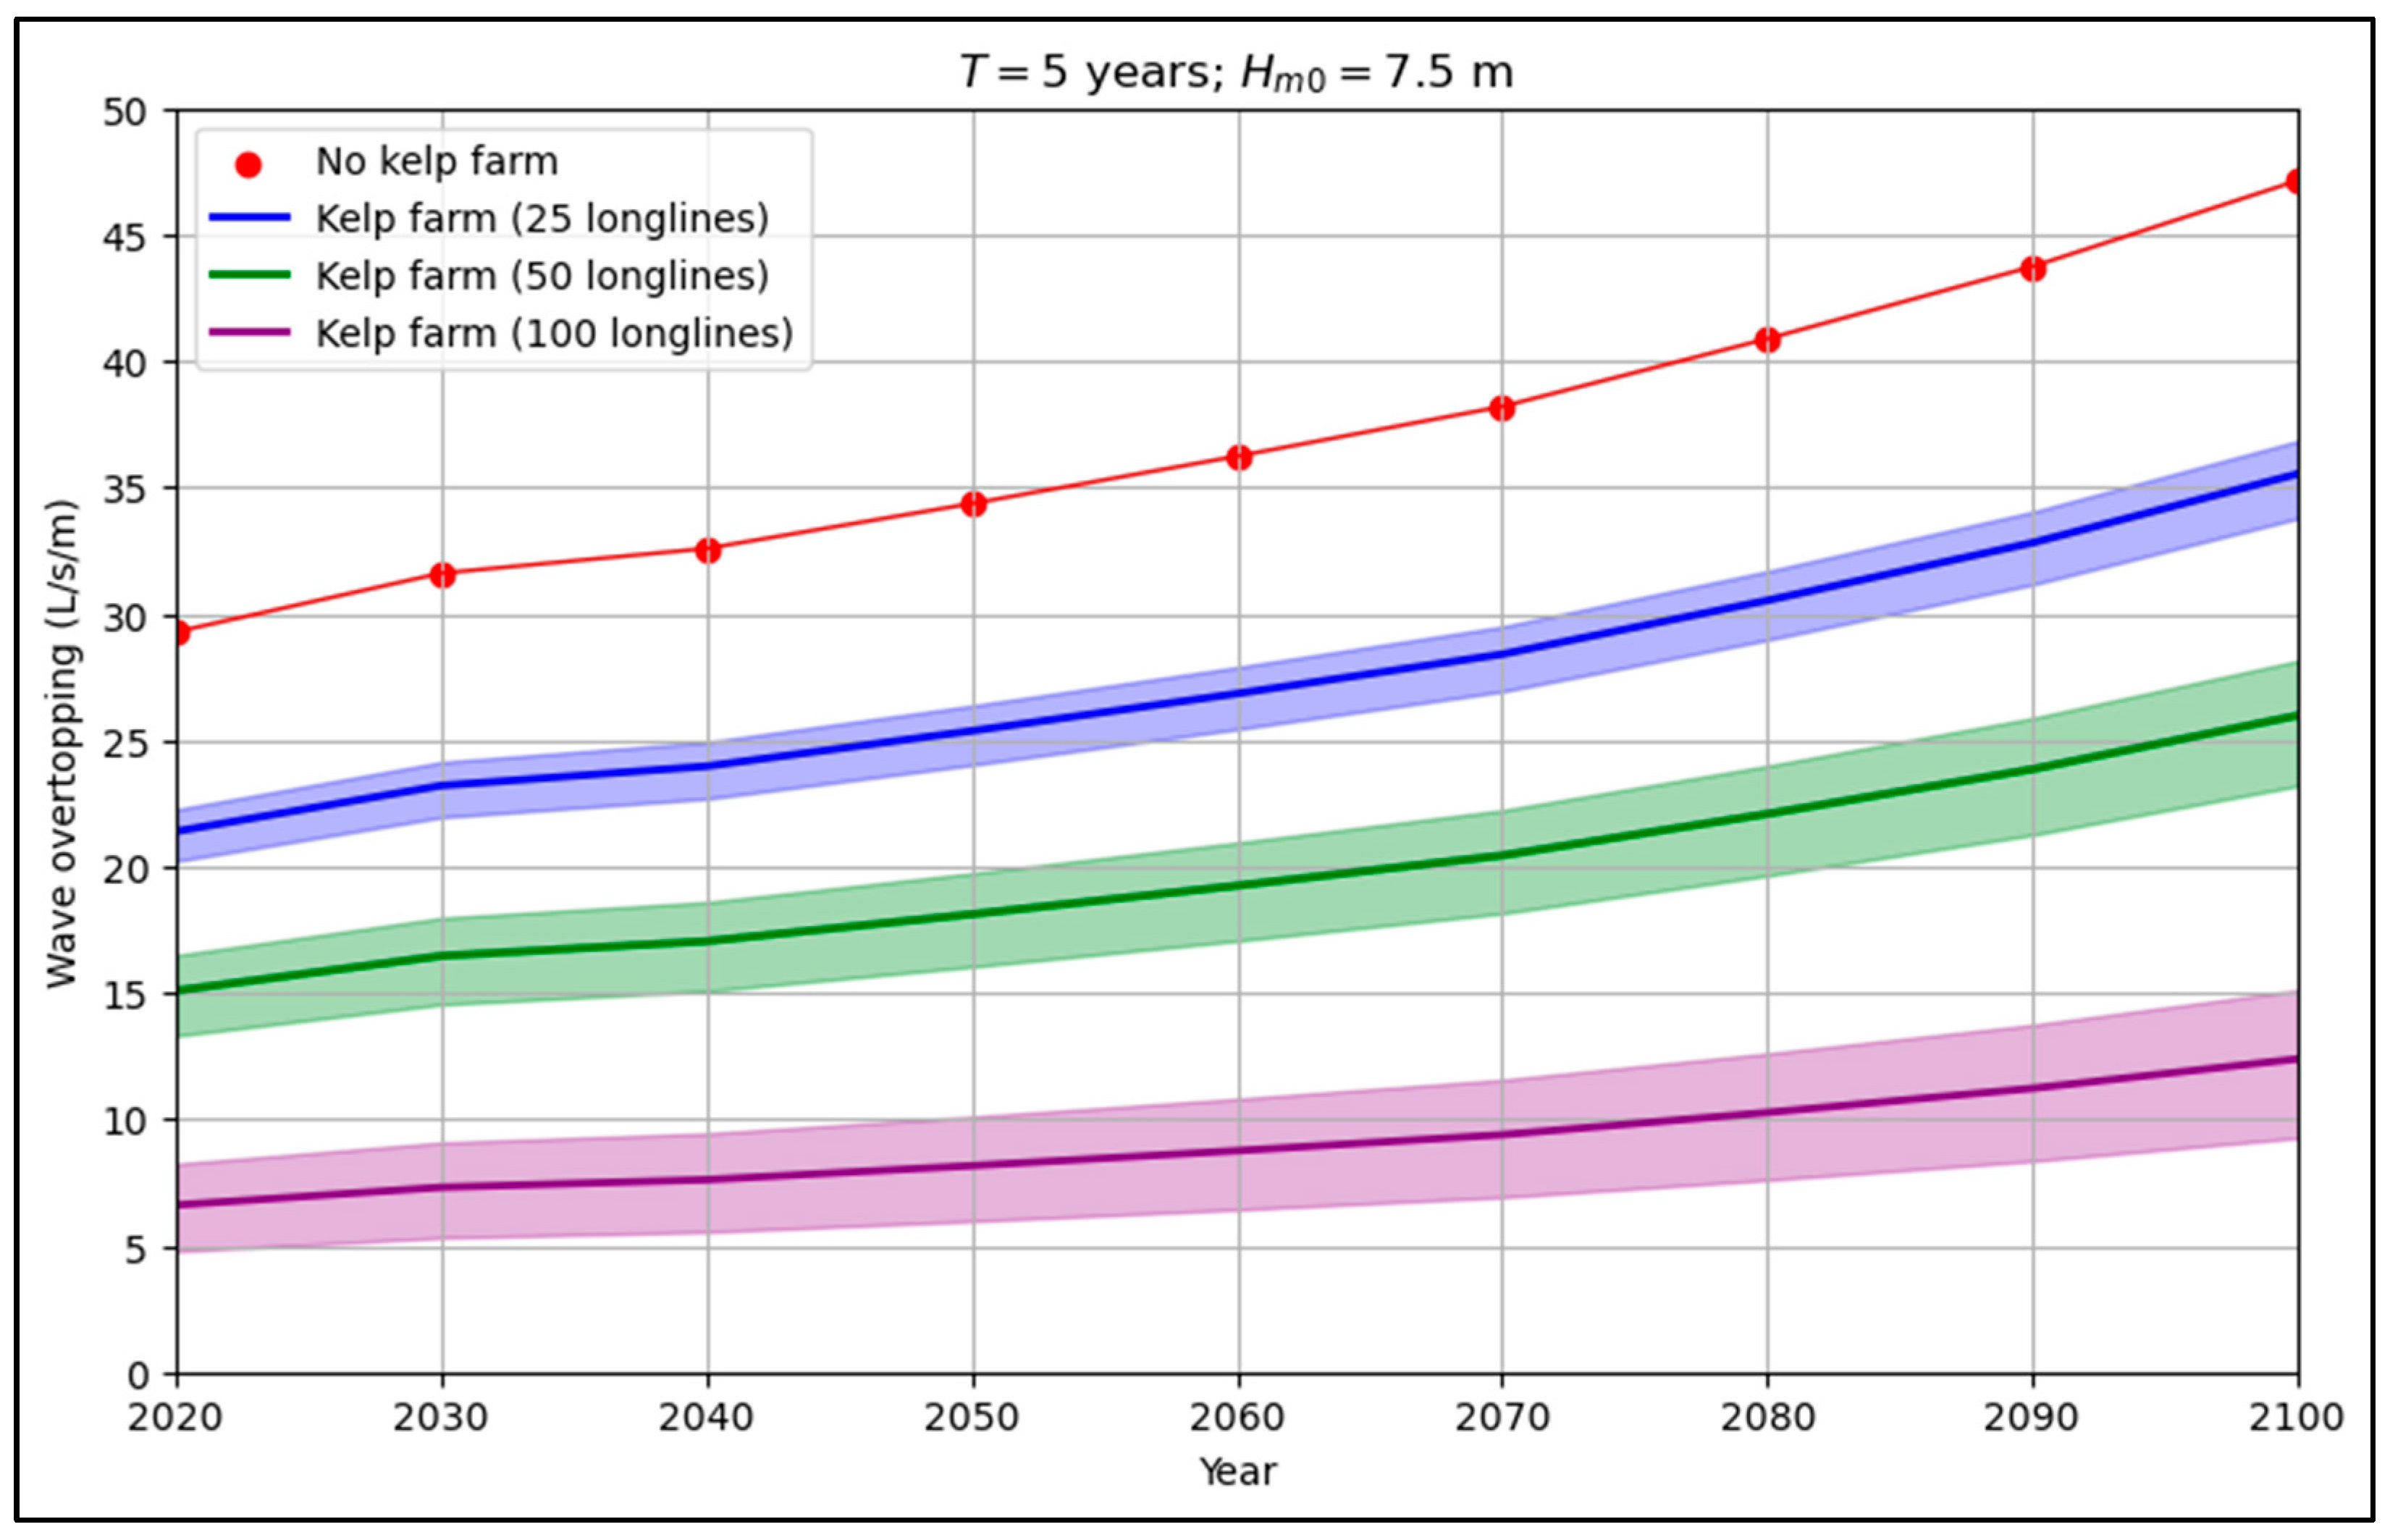
4.3. Potential Wave Overtopping Reduction Promoted by a Floating Kelp Farm with Sea Level Rise

Figure 9 and Figure 10 illustrate the projected wave overtopping along the extended Port of Leixões breakwater under storm events with return periods of T = 2 years and T = 5 years, projected until 2100. For conditions without a kelp farm seaward of the rubble mound breakwater, wave overtopping was estimated using Equation (1), with parameters set to R c = 9   m , γ f = 0.5 (Antifer blocks), and γ β = 1 (assuming orthogonal attack). In the scenario that includes an idealized floating kelp farm in front of the breakwater, wave overtopping estimates were calculated using Equation (6) where γ k is estimated from Equation (7). The wavelength was computed using linear wave theory.
This analysis indicates that the implementation of a floating kelp farm can significantly reduce wave overtopping, with the effectiveness varying based on the number of longlines (Figure 8 and Figure 9). For a storm event with a 2-year return period in 2020, a kelp farm consisting of 25 longlines with a cross-shore length of 50 m was found to reduce mean wave overtopping discharge by over 30%, decreasing from 6 l/s/m to approximately 4 l/s/m. Notably, with the 50 m long kelp farm, the initial wave overtopping of 6 l/s/m is only anticipated to reoccur by 2070. When the kelp farm is increased to 50 longlines with a cross-shore length of 100 m, the mean wave overtopping discharge reduction exceeds 50%. For an even larger configuration of 100 longlines with a 200 m cross-shore length, wave overtopping is reduced by over 80%. For a storm event with a 5-year return period, the kelp farm continues to show significant impact. A kelp farm with 25 longlines results in a 26% reduction in wave overtopping, while a configuration of 50 longlines achieves a reduction of over 45%. For the largest configuration tested, 100 longlines, the wave overtopping reduction surpassed 75%. Therefore, our results suggest that a hybrid solution composed of a kelp farm and a rubble mound breakwater, as a green–grey solution, can significantly reduce the wave overtopping coastal hazard in the above presented application, even surpassing the wave overtopping increase induced by the expected sea level rise.

5. Conclusions

This study uses physical modelling to investigate how floating kelp farms can help reduce wave overtopping when installed in front of rubble mound breakwaters. An idealized application of these findings was performed in the Port of Leixões to better understand if such an NBS is capable of reducing wave overtopping for a sea level rise scenario. Key findings include the following:
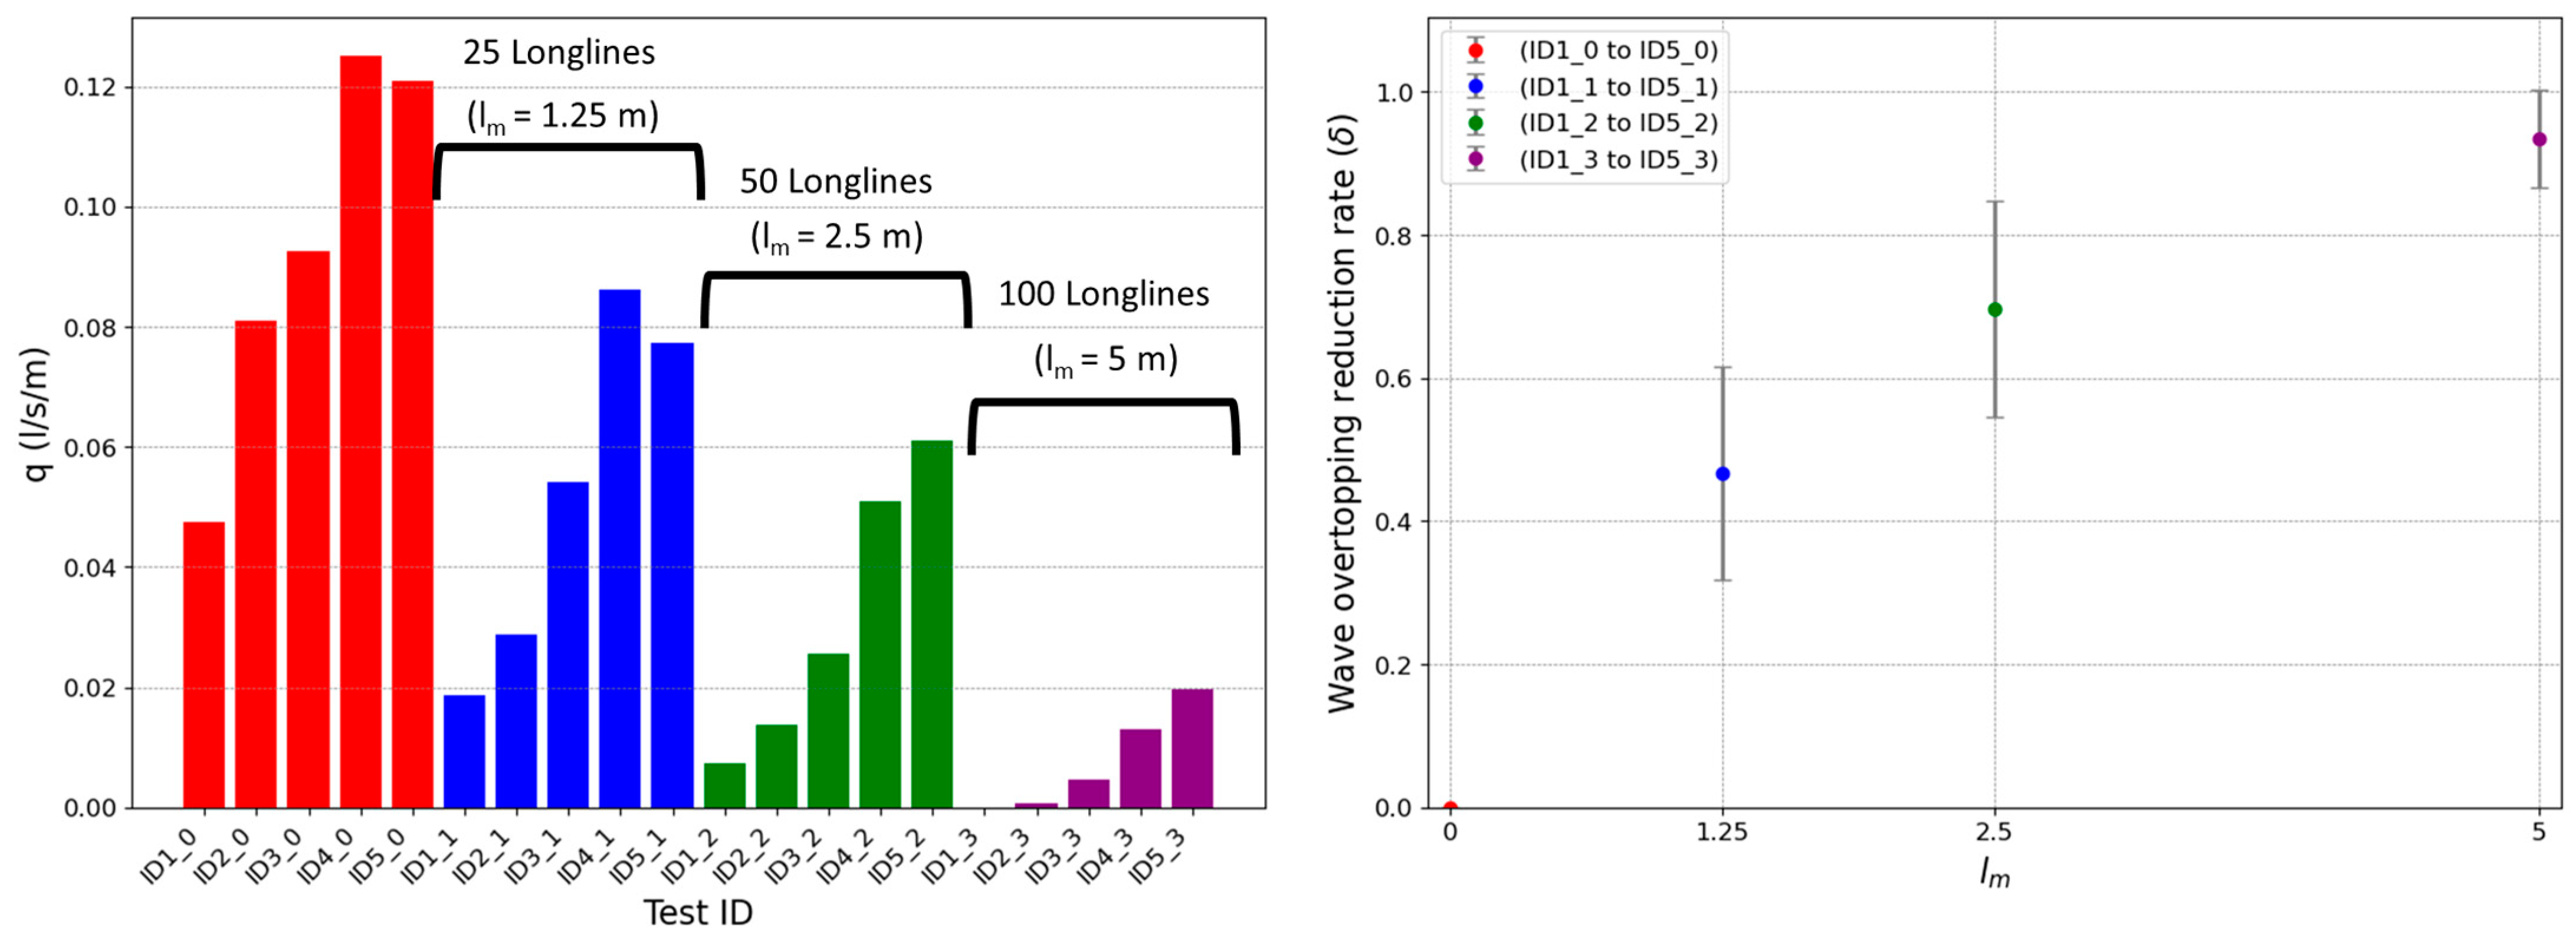
  • Floating kelp farms are shown to be effective in reducing wave overtopping, which can enhance the performance and operational time window of existing coastal defence structures. Experimental tests with 25 longlines seawards of a rubble mound breakwater revealed an average wave overtopping reduction of 47%. With 50 longlines, an average wave overtopping reduction of 70% was achieved, and with 100 longlines, the average wave overtopping reduction was over 90%.
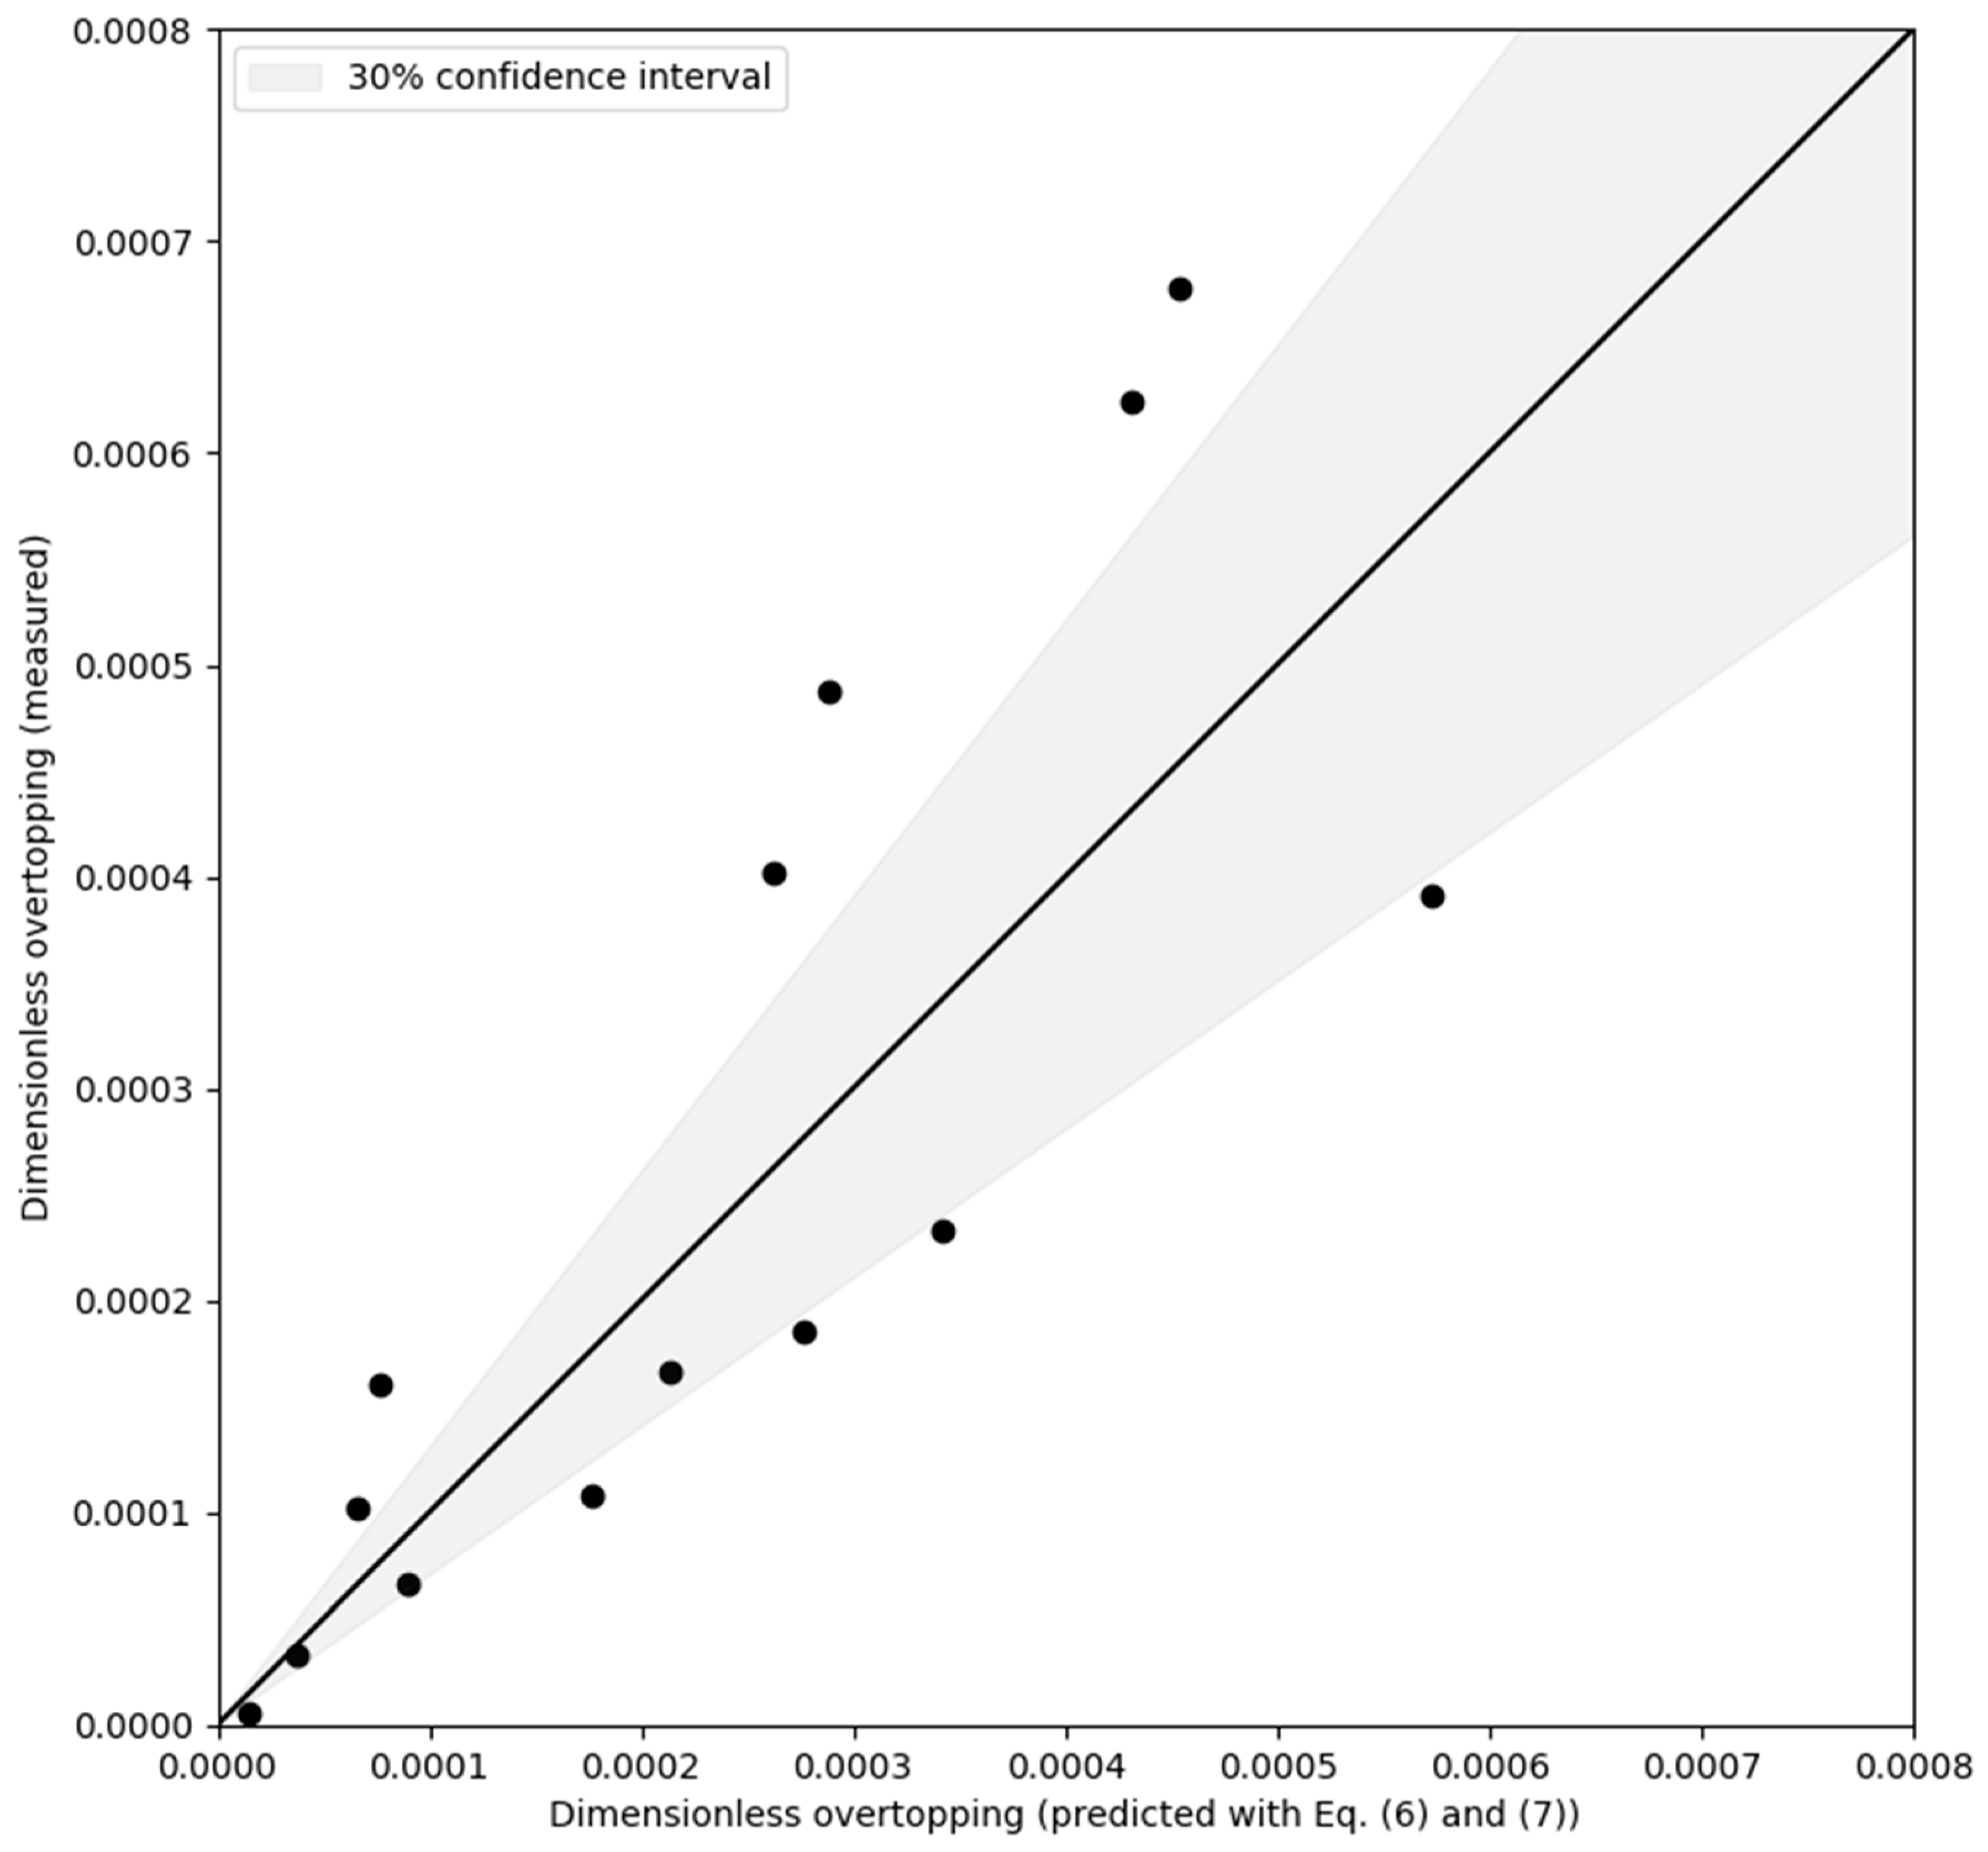
  • The EurOtop manual’s wave overtopping prediction equation for rubble mound breakwaters was slightly adjusted for cases where a floating kelp farm is present seawards of the breakwater. This modification introduces a kelp factor γ k , which accounts for the presence of the kelp farm [see Equation (6)]. γ k can be estimated by Equation (7), and it is a function of the ratio between the farm’s cross-shore length and incident wavelength.
  • The analysis, based on a hypothetical installation at the Port of Leixões, explored the impact of fully developed kelp farms (25, 50, and 100 longlines with 50, 100, and 200 m cross-shore, respectively) on wave overtopping under storm scenarios with 2- and 5-year return periods. The results point out that a kelp farm with 25 longlines can sustain wave overtopping levels below current rates until 2070, and a configuration with 50 or 100 longlines can sustain wave overtopping levels below the current values at least until 2100.
Overall, these findings suggest that kelp farms might be a practical enhancement to traditional rubble mound breakwaters, thereby contributing to mitigate wave overtopping coastal hazards.
It is also important to note that this study has some limitations. Firstly, this study is based on limited physical model tests and assumes a fully grown kelp farm, whereas in prototype, kelp varies in growth and density throughout the year [41], potentially affecting wave attenuation performance. Moreover, tested conditions had a relative freeboard R c / H m 0 close to 1, leaving the empirical equations’ applicability to higher or lower relative freeboards uncertain. Further testing is needed to assess these effects.
Equations (6) and (7) were derived from a floating kelp farm physical model that was fixed to the flume walls. In the prototype, kelp farms are secured by a mooring system, allowing significant lateral and vertical movement. Moreover, a flexible floating kelp farm, such as the one tested in this study, may not completely withstand the high-energy storm wave conditions typical of the North Atlantic Ocean [37,42]. Pilot projects would be very valuable to confirm the projections reported here.
Moreover, although this study incorporated sea level rise projections with an acceptable degree of confidence, based on the recent analysis by Hamlington, et al. [39], data concerning potential variations in storm intensity over the coming decades remain limited. This scarcity of reliable storm intensity data adds an element of unpredictability.
Addressing these limitations in future studies would help to further refine the assessment of kelp farms as a natural, supplementary solution for coastal defence. This will help coastal engineers to design hybrid and green–grey solutions in practice.

Author Contributions

Writing—original draft preparation, conceptualization, methodology, visualization, F.M., T.C.-C. and D.M.; writing—review and editing, supervision, funding acquisition, P.R.-S., F.T.-P. and T.F.-F. All authors have read and agreed to the published version of the manuscript.

Funding

F. Miranda acknowledges funding in the form of a Ph.D. scholarship grant by the FCT, with the reference 2023.00590.BD. T. Calheiros-Cabral acknowledges funding in the form of a Ph.D. scholarship grant by the FCT, with the reference 2021.07687.BD. This work was performed in the scope of the AQUABREAK—Aquaculture Living Breakwater for Coastal protection and Sea Decarbonization project, grant code PT-INNOVATION-0093, funded by the “Blue Growth” program of the EEA Grants Portugal 2014–2021. D. Mendes is grateful for financial support of the Foundation for Science and Technology (FCT) through the project UIDB/04625/2025 of the research unit CERIS.

Data Availability Statement

The data that support the findings of this study are available from the corresponding author, T.F.-F., upon reasonable request.

Acknowledgments

The authors would like to acknowledge Victor Ramos for providing the data from the SWAN propagation study and Miguel Guerra for the support during the physical modelling experiments.

Conflicts of Interest

The authors declare no conflicts of interest.

Appendix A

Table A1. Test results and measured parameters for each test.
# h (m) H m 0   m l m   m T p   s λ (m) H m 0 /hakkh R c / H m 0 q   ( m 3 / s / m )
ID1_00.340.10601.662.970.3120.1120.7161.1324.74 × 10−5
ID2_00.1141.662.970.3350.1210.7161.0538.09 × 10−5
ID3_00.1211.662.970.3560.1280.7160.9929.25 × 10−5
ID4_00.1152.173.900.3380.0930.5451.0431.25 × 10−4
ID5_00.1162.444.510.3410.0810.4721.0341.21 × 10−4
ID1_10.1091.251.662.970.3210.1150.7161.1011.87 × 10−5
ID2_10.1161.662.970.3410.1230.7161.0342.88 × 10−5
ID3_10.1251.662.970.3680.1320.7160.9605.41 × 10−5
ID4_10.1182.173.900.3470.0950.5451.0178.61 × 10−5
ID5_10.1162.444.510.3410.0810.4721.0347.72 × 10−5
ID1_20.1092.51.662.970.3210.1150.7161.1017.45 × 10−6
ID2_20.1181.662.970.3470.1250.7161.0171.38 × 10−5
ID3_20.1251.662.970.3680.1320.7160.9602.56 × 10−5
ID4_20.1182.173.900.3470.0950.5451.0175.10 × 10−5
ID5_20.1172.444.510.3440.0820.4721.0266.11 × 10−5
ID1_30.11851.662.970.3470.1250.7161.0170.00 × 100
ID2_30.1171.662.970.3440.1240.7161.0267.77 × 10−7
ID3_30.1271.662.970.3740.1340.7160.9454.58 × 10−6
ID4_30.1192.173.900.3500.0960.5451.0081.31 × 10−5
ID5_30.1152.444.510.3380.0800.4721.0431.96 × 10−5

References

  1. Gralher, C.; Kobayashi, N.; Do, K. Wave overwash of vegetated dunes. Coast. Eng. Proc. 2012, 1, sediment.34. [Google Scholar] [CrossRef]
  2. Silva, R.; Martínez, M.L.; Odériz, I.; Mendoza, E.; Feagin, R.A. Response of vegetated dune–beach systems to storm conditions. Coast. Eng. 2016, 109, 53–62. [Google Scholar] [CrossRef]
  3. Bryant, D.B.; Anderson Bryant, M.; Sharp, J.A.; Bell, G.L.; Moore, C. The response of vegetated dunes to wave attack. Coast. Eng. 2019, 152, 103506. [Google Scholar] [CrossRef]
  4. Fernández-Montblanc, T.; Duo, E.; Ciavola, P. Dune reconstruction and revegetation as a potential measure to decrease coastal erosion and flooding under extreme storm conditions. Ocean Coast. Manag. 2020, 188, 105075. [Google Scholar] [CrossRef]
  5. Sigren, J.; Figlus, J.; Armitage, A. Coastal sand dunes and dune vegetation: Restoration, erosion, and storm protection. Shore Beach 2014, 82, 5–12. [Google Scholar]
  6. Odériz, I.; Knöchelmann, N.; Silva, R.; Feagin, R.A.; Martínez, M.L.; Mendoza, E. Reinforcement of vegetated and unvegetated dunes by a rocky core: A viable alternative for dissipating waves and providing protection? Coast. Eng. 2020, 158, 103675. [Google Scholar] [CrossRef]
  7. Möller, I. Quantifying saltmarsh vegetation and its effect on wave height dissipation: Results from a UK East coast saltmarsh. Estuar. Coast. Shelf Sci. 2006, 69, 337–351. [Google Scholar] [CrossRef]
  8. Marin-Diaz, B.; van der Wal, D.; Kaptein, L.; Martinez-Garcia, P.; Lashley, C.H.; de Jong, K.; Nieuwenhuis, J.W.; Govers, L.L.; Olff, H.; Bouma, T.J. Using salt marshes for coastal protection: Effective but hard to get where needed most. J. Appl. Ecol. 2023, 60, 1286–1301. [Google Scholar] [CrossRef]
  9. Leonardi, N.; Carnacina, I.; Donatelli, C.; Ganju, N.K.; Plater, A.J.; Schuerch, M.; Temmerman, S. Dynamic interactions between coastal storms and salt marshes: A review. Geomorphology 2018, 301, 92–107. [Google Scholar] [CrossRef]
  10. Möller, I.; Kudella, M.; Rupprecht, F.; Spencer, T.; Paul, M.; van Wesenbeeck, B.K.; Wolters, G.; Jensen, K.; Bouma, T.J.; Miranda-Lange, M.; et al. Wave attenuation over coastal salt marshes under storm surge conditions. Nat. Geosci. 2014, 7, 727–731. [Google Scholar] [CrossRef]
  11. Garzon, J.L.; Maza, M.; Ferreira, C.M.; Lara, J.L.; Losada, I.J. Wave Attenuation by Spartina Saltmarshes in the Chesapeake Bay Under Storm Surge Conditions. J. Geophys. Res. Ocean. 2019, 124, 5220–5243. [Google Scholar] [CrossRef]
  12. Lee, E.I.H.; Nepf, H. Marsh restoration in front of seawalls is an economically justified nature-based solution for coastal protection. Commun. Earth Environ. 2024, 5, 605. [Google Scholar] [CrossRef]
  13. Van der Meer, J.W.; Allsop, N.W.H.; Bruce, T.; De Rouck, J.; Kortenhaus, A.; Pullen, T.; Schüttrumpf, H.; Troch, P.; Zanuttigh, B. EurOtop Manual on Wave Overtopping of Sea Defences Related Structures An Overtopping Manual Largely Based on European Research but for Worldwide Application. 2018. Available online: www.overtopping-manual.com (accessed on 1 January 2025).
  14. van der Meer, J.W.; Verhaeghe, H.; Steendam, G.J. The new wave overtopping database for coastal structures. Coast. Eng. 2009, 56, 108–120. [Google Scholar] [CrossRef]
  15. Baker, S.; Murphy, E.; Cornett, A.; Knox, P. Experimental Study of Wave Attenuation Across an Artificial Salt Marsh. Front. Built Environ. 2022, 8, 893664. [Google Scholar] [CrossRef]
  16. Libby, M.; Tomiczek, T.; Cox, D.; Lomónaco, P. The sum of the parts: Green, gray, and green-gray infrastructure to mitigate wave overtopping. Coast. Eng. 2024, 194, 104615. [Google Scholar] [CrossRef]
  17. Miranda, F.; Mendes, D.; Castro, J.M.; Rosa-Santos, P.; Taveira-Pinto, F.; Fazeres-Ferradosa, T. Physical modelling study on wave damping induced by an idealized floating kelp farm. Coast. Eng. 2025, 195, 104648. [Google Scholar] [CrossRef]
  18. Zhu, L.; Lei, J.; Huguenard, K.; Fredriksson, D.W. Wave attenuation by suspended canopies with cultivated kelp (Saccharina latissima). Coast. Eng. 2021, 168, 103947. [Google Scholar] [CrossRef]
  19. Chambel, J.; Fazeres-Ferradosa, T.; Miranda, F.; Bento, A.M.; Taveira-Pinto, F.; Rosa-Santos, P. The Adaptation of a Current Flume to a Wave-Current Flume for Coastal Studies. In Proceedings of the IAHR World Congress, Vienna, Austria, 21–25 August 2023; pp. 379–387. [Google Scholar]
  20. Miranda, F.; Bento, A.M.; Chambel, J.; Sarmento, M.F.; Rosa-Santos, P.; Taveira-Pinto, F.; Fazeres-Ferradosa, T. A novel and simple passive absorption system for wave-current flumes. Alex. Eng. J. 2023, 71, 463–477. [Google Scholar] [CrossRef]
  21. Mansard, E.P.D.; Funke, E.R. The measurement of incident and reflected spectra using a least squares method. Coast. Eng. Proc. 1980, 1, 8. [Google Scholar] [CrossRef]
  22. Mendes, D.; Pais-Barbosa, J.; Baptista, P.; Silva, P.A.; Bernardes, C.; Pinto, C. Beach Response to a Shoreface Nourishment (Aveiro, Portugal). J. Mar. Sci. Eng. 2021, 9, 1112. [Google Scholar] [CrossRef]
  23. Luhar, M.; Nepf, H. Flow-induced reconfiguration of buoyant and flexible aquatic vegetation. Limnol. Oceanogr. 2011, 56, 2003–2017. [Google Scholar] [CrossRef]
  24. Harder, D.L.; Hurd, C.L.; Speck, T. Comparison of mechanical properties of four large, wave-exposed seaweeds. Am. J. Bot. 2006, 93, 1426–1432. [Google Scholar] [CrossRef]
  25. Henry, P.-Y. Variability and similarities in the structural properties of two related Laminaria kelp species. Estuar. Coast. Shelf Sci. 2018, 200, 395–405. [Google Scholar] [CrossRef]
  26. Paul, M.; Henry, P.Y.T.; Thomas, R.E. Geometrical and mechanical properties of four species of northern European brown macroalgae. Coast. Eng. 2014, 84, 73–80. [Google Scholar] [CrossRef]
  27. Luhar, M.; Infantes, E.; Nepf, H. Seagrass blade motion under waves and its impact on wave decay. J. Geophys. Res. Ocean. 2017, 122, 3736–3752. [Google Scholar] [CrossRef]
  28. van Veelen, T.J.; Karunarathna, H.; Reeve, D.E. Modelling wave attenuation by quasi-flexible coastal vegetation. Coast. Eng. 2021, 164, 103820. [Google Scholar] [CrossRef]
  29. Zhu, L.; Huguenard, K.; Zou, Q.-P.; Fredriksson, D.W.; Xie, D. Aquaculture farms as nature-based coastal protection: Random wave attenuation by suspended and submerged canopies. Coast. Eng. 2020, 160, 103737. [Google Scholar] [CrossRef]
  30. Dickinson, C.I. British Seaweeds; Eyre & Spottiswoode: London, UK, 1963. [Google Scholar]
  31. Koosheh, A.; Etemad-Shahidi, A.; Cartwright, N.; Tomlinson, R.; van Gent, M.R.A. Individual wave overtopping at coastal structures: A critical review and the existing challenges. Appl. Ocean Res. 2021, 106, 102476. [Google Scholar] [CrossRef]
  32. Wolters, G.; Gent, M.; Allsop, W.; Hamm, L.; Muhlestein, D. HYDRALAB III: Guidelines for physical model testing of rubble mound breakwaters. In Coasts, Marine Structures and Breakwaters: Adapting to Change: Proceedings of the 9th International Conference Organised by the Institution of Civil Engineers and Held in Edinburgh on 16 to 18 September 2009; Thomas Telford Ltd.: London, UK, 2009. [Google Scholar]
  33. Goda, Y. Derivation of unified wave overtopping formulas for seawalls with smooth, impermeable surfaces based on selected CLASH datasets. Coast. Eng. 2009, 56, 385–399. [Google Scholar] [CrossRef]
  34. Romano, A.; Bellotti, G.; Briganti, R.; Franco, L. Uncertainties in the physical modelling of the wave overtopping over a rubble mound breakwater: The role of the seeding number and of the test duration. Coast. Eng. 2015, 103, 15–21. [Google Scholar] [CrossRef]
  35. Altomare, C.; Suzuki, T.; Chen, X.; Verwaest, T.; Kortenhaus, A. Wave overtopping of sea dikes with very shallow foreshores. Coast. Eng. 2016, 116, 236–257. [Google Scholar] [CrossRef]
  36. Calheiros-Cabral, T.; Clemente, D.; Rosa-Santos, P.; Taveira-Pinto, F.; Ramos, V.; Morais, T.; Cestaro, H. Evaluation of the annual electricity production of a hybrid breakwater-integrated wave energy converter. Energy 2020, 213, 118845. [Google Scholar] [CrossRef]
  37. Mendes, D.; Oliveira, T.C.A. Deep-water spectral wave steepness offshore mainland Portugal. Ocean Eng. 2021, 236, 109548. [Google Scholar] [CrossRef]
  38. Ramos, V.; Calheiros-Cabral, T.; Rosa-Santos, P.; Taveira-Pinto, F. Advanced and High-Resolution Numerical Modelling of Wave Energy Resource: Porto of Leixões (APDL). Deliverable 5.5. PORTOS Project. Ref: EAPA 784/2018. 44 pp. 2020. Unpublished Manuscript, Version 1, Last Modified June 2020. Available online: https://portosproject.eu/work-plan/work-package-5/ (accessed on 1 January 2025).
  39. Hamlington, B.D.; Bellas-Manley, A.; Willis, J.K.; Fournier, S.; Vinogradova, N.; Nerem, R.S.; Piecuch, C.G.; Thompson, P.R.; Kopp, R. The rate of global sea level rise doubled during the past three decades. Commun. Earth Environ. 2024, 5, 601. [Google Scholar] [CrossRef]
  40. Goda, Y. Random Seas and Design of Maritime Structures; World Scientific: Singapore, 2010. [Google Scholar]
  41. Lindhart, M.; Daly, M.A.; Walker, H.; Arzeno-Soltero, I.B.; Yin, J.Z.; Bell, T.W.; Monismith, S.G.; Pawlak, G.; Leichter, J.J. Short wave attenuation by a kelp forest canopy. Limnol. Oceanogr. Lett. 2024, 9, 478–486. [Google Scholar] [CrossRef]
  42. Esteves, R.; Mendes, D.; Neves, M.G.; Oliveira, T.; Pinto, J.P. Observed changes in significant wave heights derived from long-term homogenized measurements offshore mainland Portugal. Appl. Ocean Res. 2025, 158, 104546. [Google Scholar] [CrossRef]
Figure 1. (a) Experimental set-up (dimensions in meters); (b) Floating kelp farm model close-up; (c) Wave overtopping set-up close-up. ( l m —Floating kelp farm length; h —water depth).
Jmse 13 00850 g001
Figure 2. (a) Floating kelp farm model; (b) Rubble mound breakwater model; (c) Kelp individual stem.
Jmse 13 00850 g002
Figure 3. Mean wave overtopping discharge for each testing condition (left); Wave overtopping reduction rate for each floating kelp farm length (right).
Jmse 13 00850 g003
Figure 4. EurOtop formula roughness factor fitted to measured values in the control tests (ID1–5).
Jmse 13 00850 g004
Figure 5. Fitting of the dimensionless overtopping q / g H m 0 3 measured and predicted with Equations (6) and (7).
Jmse 13 00850 g005
Figure 6. (a) Illustrative rendering of the kelp farm in front of the north breakwater of the Port of Leixões (not to scale and for illustration purposes only) and (b) cross-section of the breakwater extension.
Jmse 13 00850 g006
Figure 7. Annual wave rose from the Leixões wave buoy.
Jmse 13 00850 g007
Figure 8. Locations of the detailed assessment of the wave energy at the Port of Leixões.
Jmse 13 00850 g008
Figure 9. Projected wave overtopping along the Port of Leixões breakwater extension for storm events with a 2-year return period, with and without the presence of floating kelp farms of varying lengths.
Jmse 13 00850 g009
Figure 10. Projected wave overtopping along the Port of Leixões breakwater extension for storm events with a 5-year return period, with and without the presence of floating kelp farms of varying lengths.
Jmse 13 00850 g010
Table 1. Testing conditions measured seawards of the floating kelp farm model.
# h (m) H m 0   m T p   s λ (m)s (-) H m 0 /hakkh R c / H m 0
ID1_00.3400.1061.662.970.0360.3120.1120.7161.13
ID2_00.1141.662.970.0380.3350.1200.7161.05
ID3_00.1211.662.970.0410.3560.1270.7160.99
ID4_00.1152.173.900.0290.3380.0920.5451.04
ID5_00.1162.444.510.0260.3410.0810.4721.03
Table 2. Stem characteristics and hydrodynamic dimensionless parameter tested.
Polyurethane Foam (1:40 Geometrical Scale)L. hyperborea
[24,25]
L. digitata
[24,25,26]
ρ , mass density (kg/m3)201070–10861001.5–1067
b , width (m)0.4000.014–0.4030.010–0.372
t , thickness (m)0.0400.00057–0.0130.0006–0.010
l , length (m)3up to 4up to 2–4
E , Elastic modulus (MPa)33601.2–109.41.1–3074
K C (-)55.5–83.355.5–83.355.5–83.3
B (-)0.591.11–100.980.027–75.85
L (-)0.57–0.850.57–0.850.57–0.85
C a w (-)6.9–9.4213.2–26,292.97.6–28,683.1
Table 3. Wave overtopping reduction rate for each testing condition and for different cases, each one associated with different floating kelp farm lengths.
Condition H m 0  (m) T p (s) a k k h δ c a s e 1 δ c a s e 2 δ c a s e 3
ID10.1061.660.1120.7160.600.841.00
ID20.1141.660.1200.7160.640.830.99
ID30.1211.660.1270.7160.420.720.95
ID40.1152.170.0920.5450.310.590.90
ID50.1162.440.0810.4720.360.490.84
Table 4. Sea level rise projection at Leixões tidal gauge for the IPCC AR6—scenario SSP2-7.0.
Year202020302040205020602070208020902100
SLR (m)+0.00+0.10+0.14+0.21+0.28+0.35+0.44+0.53+0.63
Disclaimer/Publisher’s Note: The statements, opinions and data contained in all publications are solely those of the individual author(s) and contributor(s) and not of MDPI and/or the editor(s). MDPI and/or the editor(s) disclaim responsibility for any injury to people or property resulting from any ideas, methods, instructions or products referred to in the content.

