Article

Shoaling and Sedimentation Dynamics in Fishery Shelters: A Case Study of Sandıktaş Fishery Shelter

by
Veli Süme
1,*,
Enver Yılmaz
1,
Hasan Oğulcan Marangoz
1,
Rasoul Daneshfaraz
2,
Parisa Ebadzadeh
2 and
John Patrick Abraham
3
1
Department of Civil Engineering, Recep Tayyip Erdogan University, Rize 53100, Turkey
2
Department of Civil Engineering, University of Maragheh, Maragheh 83111-55181, Iran
3
School of Engineering, University of St. Thomas, St. Paul, MN 55105, USA
*
Author to whom correspondence should be addressed.
J. Mar. Sci. Eng. 2025, 13(4), 779; https://doi.org/10.3390/jmse13040779
Submission received: 5 March 2025 / Revised: 6 April 2025 / Accepted: 11 April 2025 / Published: 14 April 2025
(This article belongs to the Section Coastal Engineering)

Abstract

:
Sediment transportation on coasts can be significantly affected by rivers, wave–wind effects, and human activities. As a result, undesirable effects such as shoaling or erosion may occur in fishery shelters. This study examines the “Sandıktaş a Fishery Shelter”, a coastal structure in the Eastern Black Sea region of Turkey, and its susceptibility to shoaling. Bathymetric measurements were performed within the nearshore and onshore, and sediment samples were taken periodically from selected points and analyzed in the laboratory. The characteristic grain diameters of the sedimentation were obtained. It was revealed that the average grain diameter was d50 = 0.30–0.91, caused by an increase of 11,611 m3 in shoaling, which caused the decrease of 8 cm water depth that occurred between 2019 and 2022. The entrance of the fishery shelter has become progressively shallower, making it difficult for boats to navigate. Existing breakwater configurations played a role in trapping sediments, requiring optimized breakwater designs/modifications for improved sediment control. The Mann–Kendall test showed an increasing trend in sediment accumulation, particularly in coarser fractions. The findings highlight the necessity of periodic dredging and potential structural modifications to mitigate shoaling and ensure the long-term sustainability of the fishery shelter. Moreover, they emphasize the critical challenges caused by sedimentation in fishery shelters and provide data-driven recommendations for enhancing coastal engineering practices and maintenance strategies.

1. Introduction

Coastal zones are vital ecosystems that have been increasingly impacted by sediment transport and accumulation. These problems are caused by shoaling and erosion of coastal structures. They are natural phenomena that occur because of natural factors such as alluvium, sand, and gravel transport by rivers; wind-induced wave movements; and human impact. Shoaling and erosion can cause a serious threat to ports, piers, and other structures along the coastline and may result in economic losses. For this reason, minimizing these losses or effectively tracking sediment movement is important.
In the Eastern Black Sea, there is a high amount of shoaling in fishery shelters. Obtaining the coastal sediment erosion [1,2] makes it easier to quantify the degree of erosion and deposition. Conducting a bathymetric survey is useful to obtain the rate of sediment transport; however, sometimes partially surveyed areas may be studied by a numerical model such as LITPACK [3]. Most of the time, the main reason for the sediment transport is extreme events [4]. These kinds of events play a critical role in affecting some critical places, i.e., port basins [5]. Sometimes they result in erosion [6] and sometimes in deposition. Minimizing sediment transport in coastal areas is possible with a carefully designed structure [7]. Coastal structures such as fishery shelters should not be considered without protective structures. Building a coastal protection structure alone is not sufficient; its effectiveness in the protection [8,9,10] of the coast must also be carefully monitored. The same applies for harbor facilities [11,12]. While wind-induced waves affect coastal sedimentation, wave currents and tidal flows are also critical [13,14]. Understanding sedimentation processes is essential for harbor development, as excessive shoaling disrupts navigation and raises maintenance costs. Previous studies have focused on sediment management, dredging optimization, and sustainable port design to enhance long-term efficiency [15,16]. Some researchers have added granulometric analysis for a more precise assessment of sediment transport [17,18], while other researchers have used numerical modeling methods, such as Delft3D [19], to enhance the accuracy of their analysis. Exploring the source of sediment or tracing the current sediment [20] is sometimes useful to explain complex and shoaling patterns and coastal sediment behavior [21]. Unforeseen effects may negatively affect fishery shelters. Moreover, choosing the wrong place for a structure or a poorly designed breakwater can contribute to shoaling problems [22]. It is not only in the Black Sea region that these problems persist; other locations also face these kinds of problems [23]. Various methods can be employed to conduct water depth measurements [24]. Some bathymetries are produced by satellite-derived approaches [25,26,27,28,29,30,31], while others are produced by other remote sensing techniques [32,33,34]. Regardless of the measurement method, long-term monitoring leads to a deeper understanding of sediment transport and erosion patterns [35,36]. Recent studies have enhanced bathymetric monitoring, numerical modeling, and sediment transport analysis, improving the understanding of coastal dynamics and shoreline changes.
Advances in satellite-derived bathymetry (SDB) and remote sensing techniques have led to more precise depth estimations for navigation and coastal planning [37,38]. The effects of waves, currents, and sediment transport on shoreline morphology highlight the importance of predictive models for managing erosion and sediment accumulation [39]. To improve coastal mapping, Structure from Motion (SfM) photogrammetry and numerical simulations such as COSMOS modeling have been used to assess storm-induced sea level changes and sediment transport [40,41]. Additionally, alternative depth estimation techniques, including video-based measurements, have been explored, though their accuracy depends on environmental factors [42]. Beyond coastal stability, sediment transport is also important in aquatic ecosystems, influencing habitat quality and fisheries management, with studies emphasizing the benefits of optimized aquaculture shelters for sustainable marine environments [43].
The primary focus of the referenced studies has been on detecting sediment transport through various methods to ensure adequate coastal protection and implementing necessary modifications to insufficient coastal structures accordingly. One of the most significant challenges in coastal management is sediment accumulation in fishery shelters, particularly in regions like the Sandıktaş Fishery Shelter. Wind-induced currents and wave action contribute to shoaling, reducing water depth, and disrupting fishing activities. This not only affects the economic viability of local fisheries but also threatens marine ecosystems, especially in spawning grounds where sedimentation can alter habitat conditions. By integrating numerical models with real-time monitoring, more effective strategies can be developed for sustainable coastal and fishery management.
This study presents a novel approach to exploring shoaling processes in fishery shelters by integrating detailed field measurements with numerical modeling, including the analysis of sedimentation patterns and the effect of wave dynamics over periods of 3 years. This allows predictions of future changes and identification of critical areas for adjustment. Unlike previous studies, which primarily focused on general sediment transport dynamics, this research provides a site-specific analysis of the Sandıktaş Fishery Shelter, incorporating multi-seasonal bathymetric surveys and granulometric sediment characterization. The combination of high-precision GPS and acoustic-sounding techniques has resulted in a more stable prediction of seabed changes over time. The findings contribute significantly to coastal engineering and sediment management strategies by offering data-driven predictions on the long-term evolution of fishery shelters. This study not only enhances the understanding of sedimentation patterns but also proposes practical recommendations for sustainable fishery coastal structure management, making it a valuable reference for future research and infrastructure planning.
The terms fishery harbor and fishery shelter are generally used interchangeably. Moreover, fishery coastal structures include fishery harbors/fishery shelters, shelters, boatyards, and other elements.

1.1. Fishery Shelters in Turkey

The total length of the Turkish coast, including the Black Sea (1719 km), Marmara (1474 km), Mediterranean (2025 km), and Aegean (3265 km) coastal regions, is 8483 km. There are a total of 28 coastal cities in these regions, and about 54% of the total population of Turkey lives in these cities [44]. There are 363 fishery coastal structures in operation throughout Turkey, including coastal structures whose nature is not defined. The Eastern Black Sea region alone accommodates approximately 34% of Turkey’s fishery coastal structures. When considering the total distribution, the Black Sea region accounts for nearly half of all shelters in the country. With this proportion, it is recorded as the region with the highest number of fishing coastal structures [45].

1.2. Fishery Coastal Structures in the Eastern Black Sea

Including Rize’s neighboring provinces of Artvin, Trabzon, and Giresun, which also have fishing coastal structures, a total of 98 structures are present. Considering both the number of structures per unit coastline length and the total number of structures, Rize stands out as the province with the highest concentration of fishing coastal structures among the coastal provinces of the Eastern Black Sea region, accounting for approximately 40% of the total.
The province of Rize, where the study area is located, has a coastal length of 80 km in the Eastern Black Sea region and a total of 39 coastal structures, including 5 fishery shelters, 9 shelters, and 25 boatyards. In addition, it is the city with the largest number of total coastal structures.

1.3. The Need for Dredging in Fishery Shelters

Fishery shelters become shallow as they fill with sand over time. This prevents the movement of boats in the area. Thus, the need for dredging arises in coastal fishery structures. Fishery structures are built in beach areas, and the main and secondary breakwaters are often not extended to a sufficient depth. Groins cannot be built despite their need, and the main and secondary breakwater lengths are short.
When evaluating the need for dredging among all fishing shelters in Turkey, it is observed that 39% of the total fishing shelters in the Black Sea require dredging. Across Turkey, this ratio rises to 55%. A province-level analysis within the Eastern Black Sea region further indicates that Rize has the highest number of fishing coastal structures requiring dredging in the medium and long term. Consequently, Rize also stands out as the province where the most fishing coastal structures need to be redesigned or expanded due to this requirement. It can be said that in the province of Rize, there are 10 fishery coastal structures in the short term and 8 that need improvement in the medium term.

1.4. Study Area

The Sandıktaş Fishery shelter on the coast of Derepazarı, Rize Province, often experiences shoaling and erosion problems that negatively affect fisheries in the region. Bathymetric measurements were made around and inside the fishery shelter, the processes of shoaling in and around the shelter were evaluated, and the characteristic grain diameters of the materials were determined with sediment samples taken periodically from selected points (Figure 1). Tidal effects in the Black Sea are minimal and therefore have a negligible influence on sediment movement in the area.
There is a need for dredging in the short term and expansion of the Sandıktaş Fishery shelter on the Rize Derepazarı coast [45]. It is at 40°24′8″ E, 41°1′32″ N, and features a 230 m main breakwater and a 60 m secondary breakwater. Covering a total water area of 1.25 hectares, the shelter has a capacity of 20 boats, with a usage intensity of 90.9%. Additionally, the purpose of the shelter is entirely dedicated to 100% agricultural activities, and it remains actively in use.
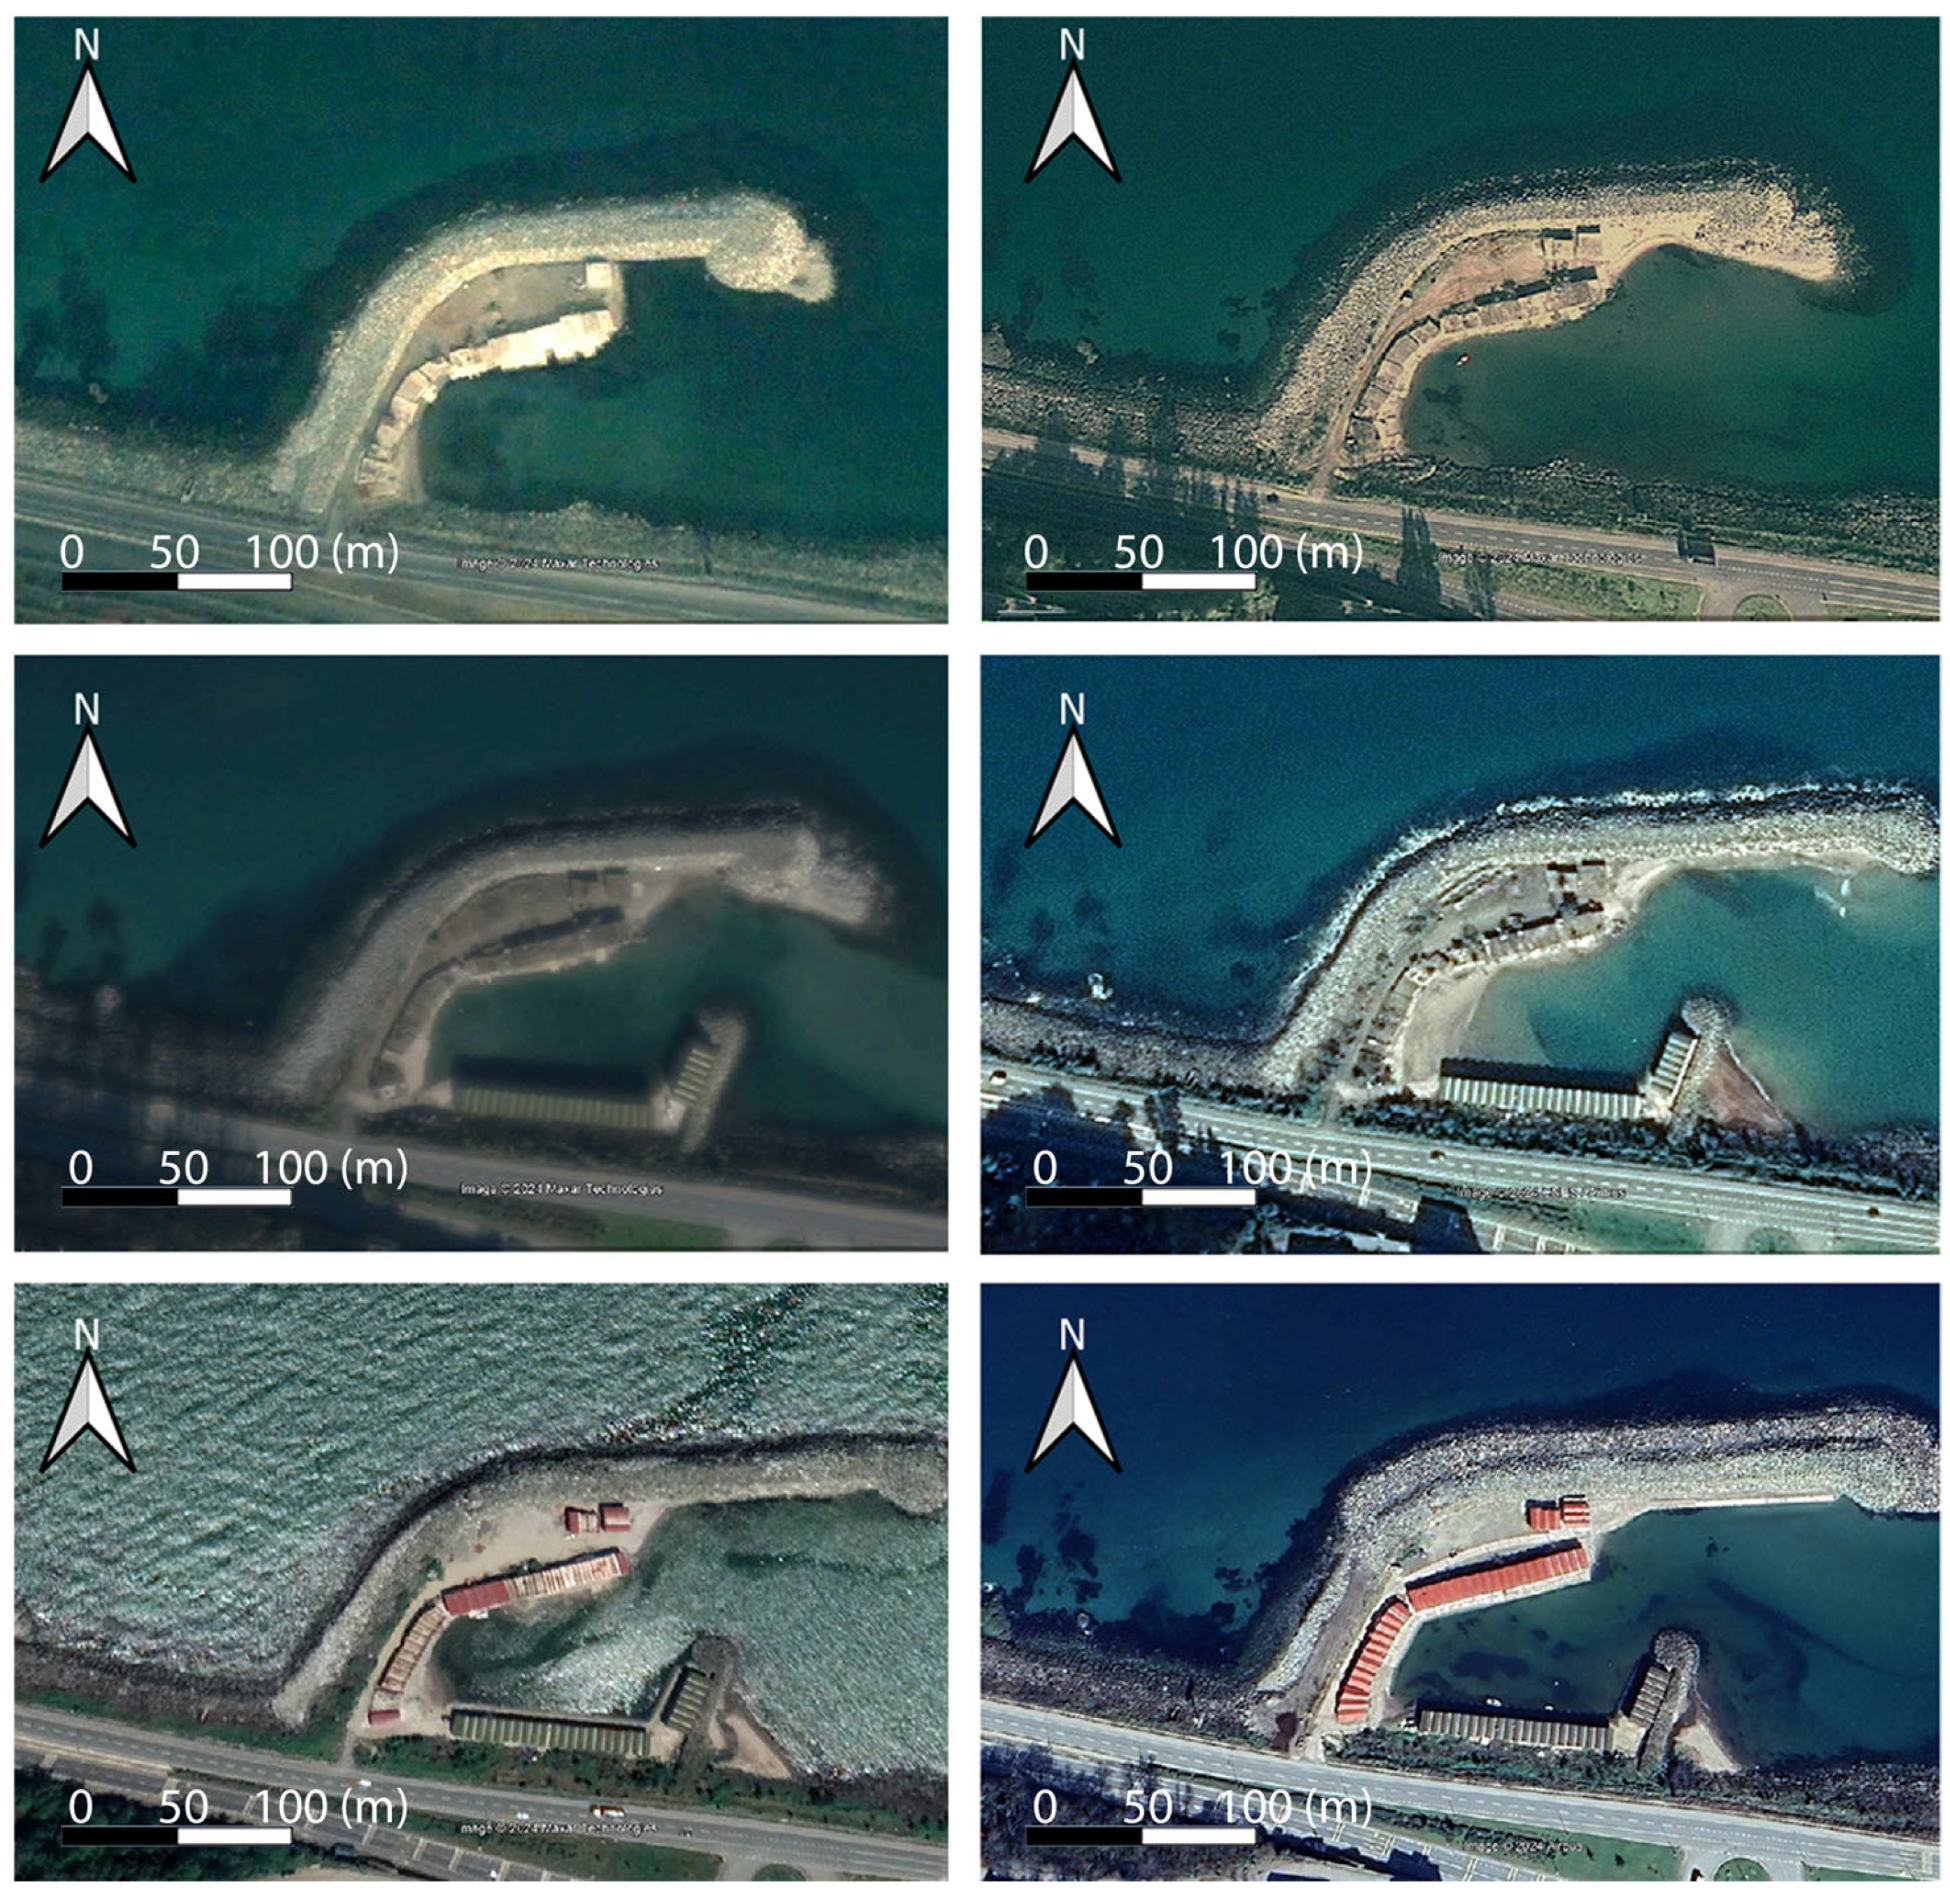
The shelter was first built in 1975 and was renovated and extended along the breakwater with the completion of the Black Sea coastal road. The physical changes in the shelter are shown in Figure 2. Here, bathymetric surveys were conducted on 12 November 2019, 2 September 2020, 10 October 2020, 16 July 2021, 30 October 2021, 27 April 2022, and 29 September 2022. These surveys were generally completed between 09:00 and 13:00 (local daytime hours), ensuring consistency in data collection and minimizing the influence of external factors such as tidal variations and weather conditions. Table 1 presents the records of survey dates, dredging dates, and their seasonal classifications. To enhance clarity and simplify interpretation, only two seasonal categories, summer and winter, were used. This classification is based on air temperature variations, with August serving as the reference month. Accordingly, the months preceding August (excluding January) are categorized as summer, while the months following August are considered winter. In the table, entries starting with ‘D’ indicate dredging activities, while those beginning with ‘S’ correspond to survey dates. Dredging is only performed inside the fishery shelter.

2. Materials and Methods

For the fishery shelter on the Derepazarı coast of Rize Province, which has a constant shoaling and erosion problem, bathymetric data were taken for the winter season in 2019 and 2020, and for the summer and winter seasons in 2021 and 2022. Changes in the seabed were observed by bathymetry and sediment samples. Sediment samples were taken periodically from selected points inside and outside the shelter. However, the weather conditions, particularly the wave and turbulence conditions of the sea, blocked operations and caused the planned measurement periods to change. To observe the seabed changes inside and around the shelter (nearshore), measurements were made at two locations, at sea and on the shore (land side), with more frequent intervals where the surface slope changed frequently or suddenly.
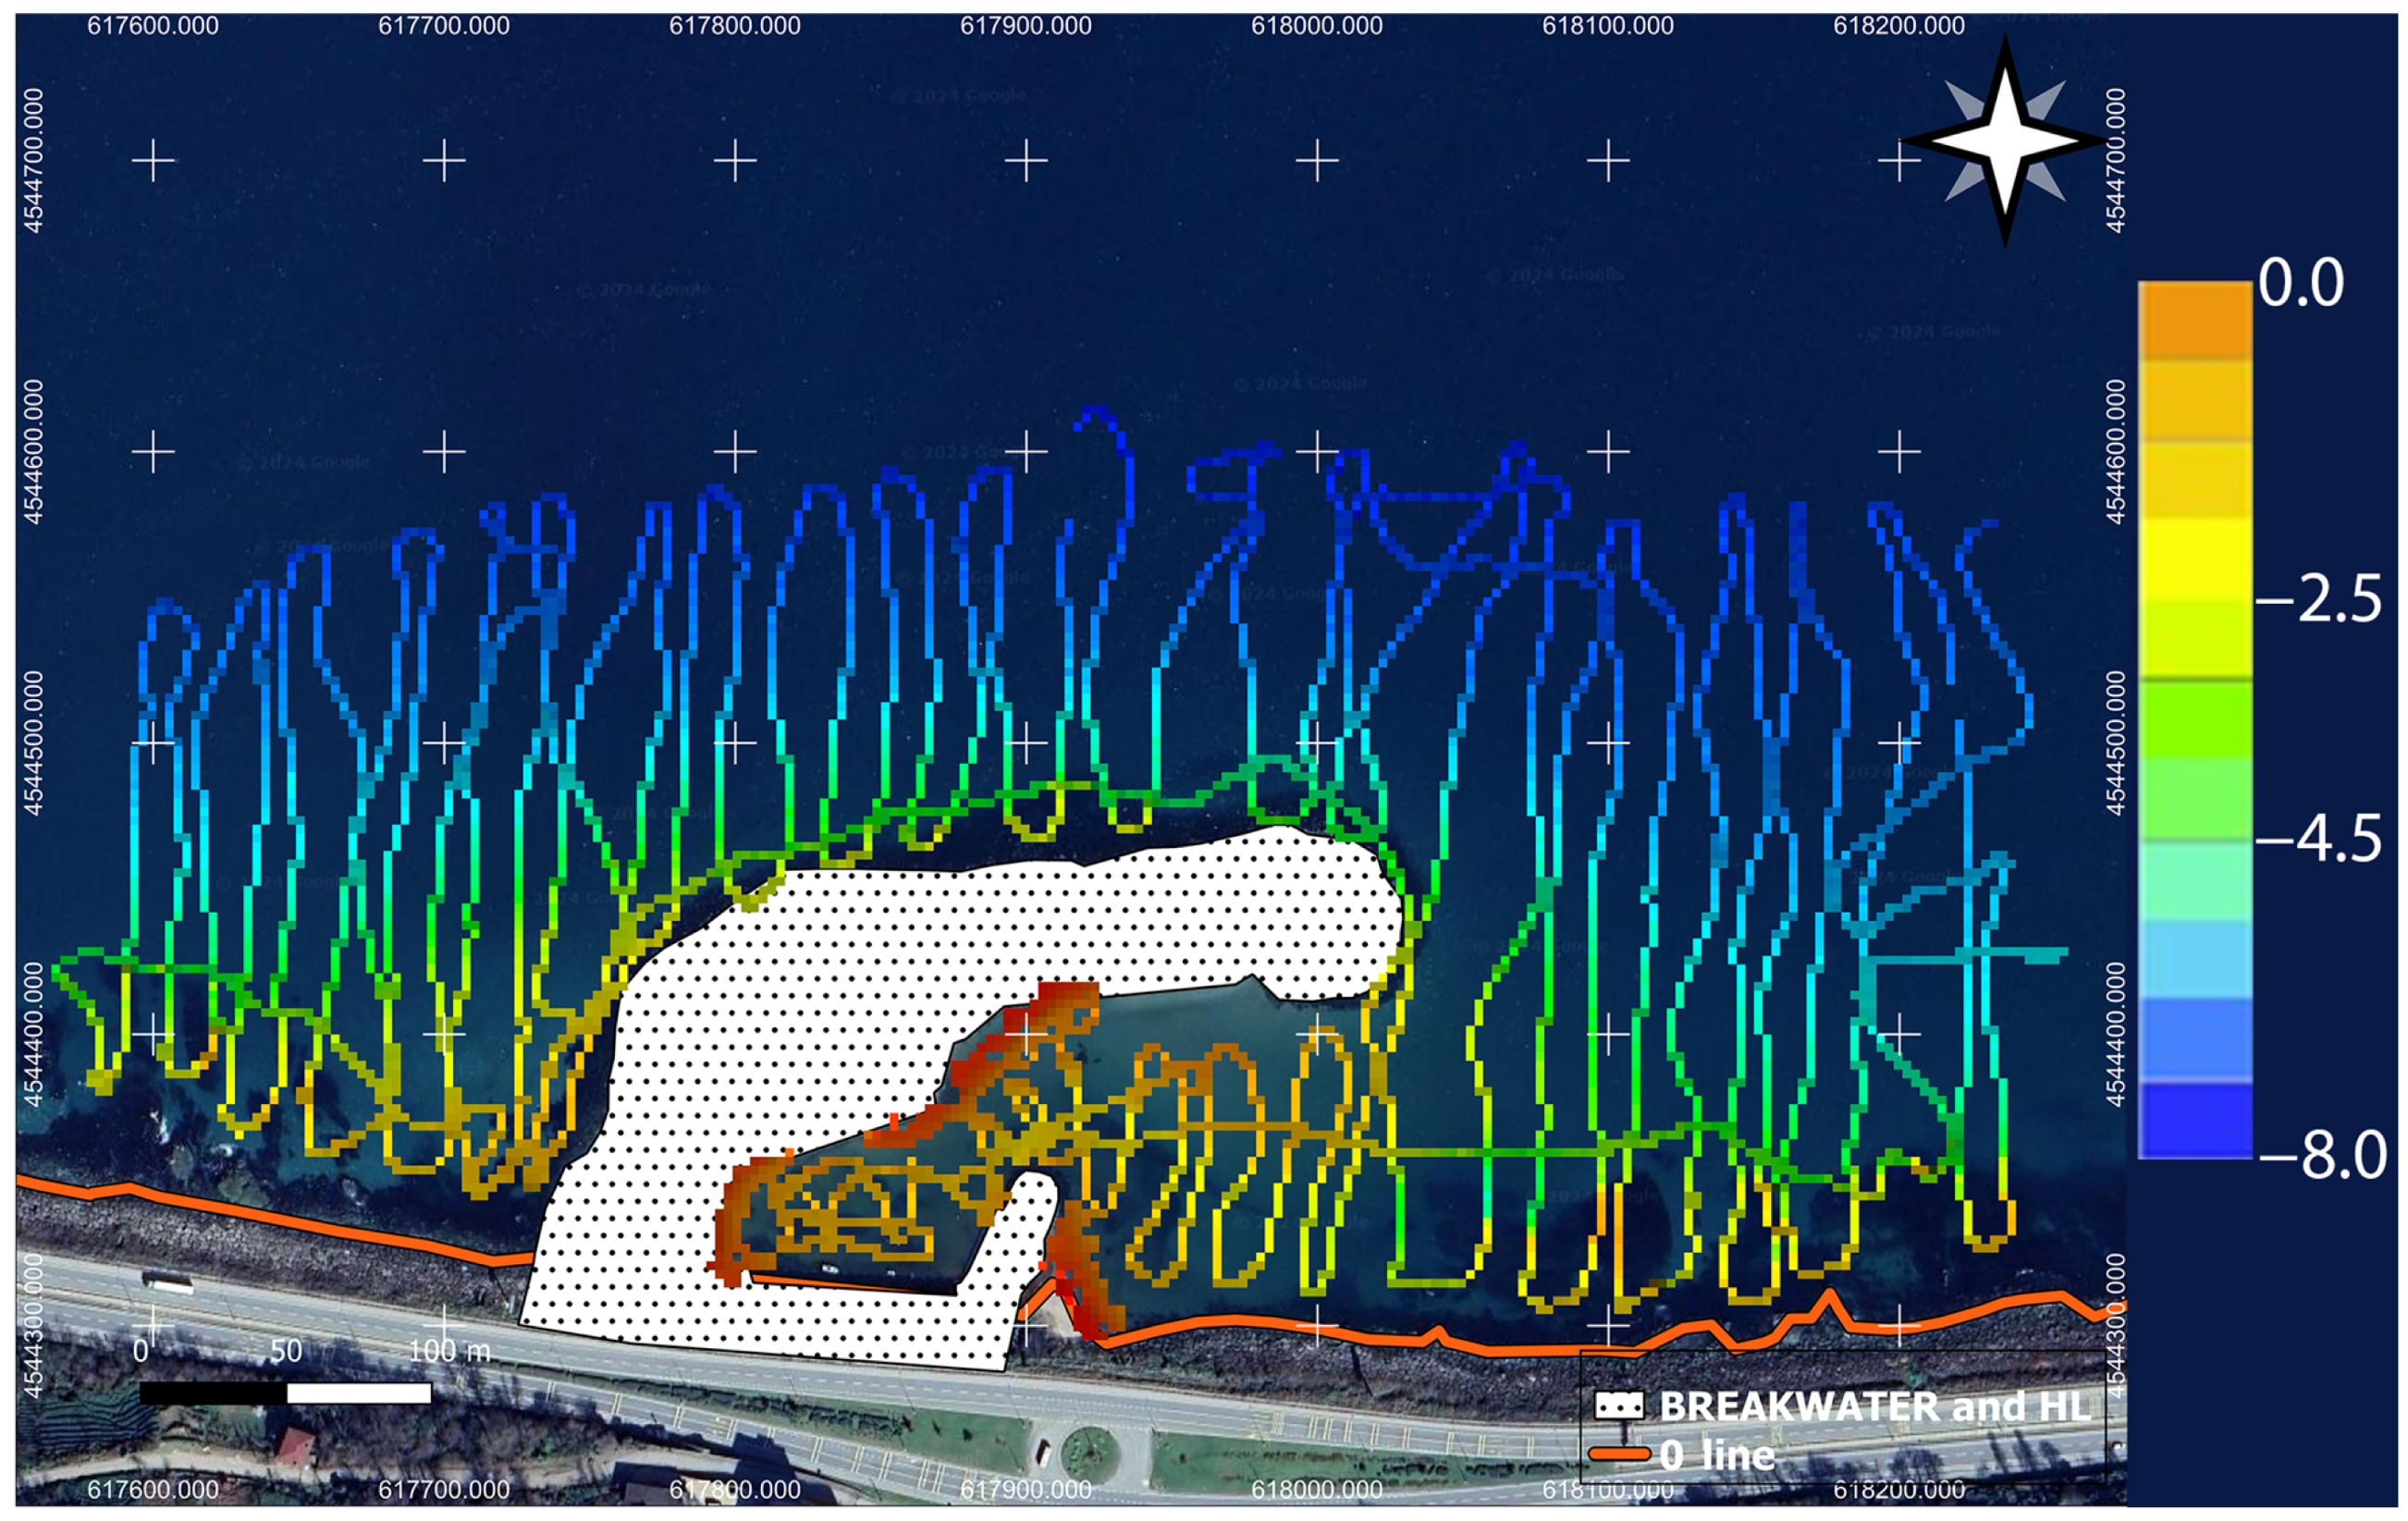
For coastal and marine measurements, since it is difficult to make bathymetric measurements in shallow waters close to the coastline, a manual mobile Topcon HiPer V GPS device(Topcon Positioning Systems, Inc., Livermore, CA, USA) was used. The CORS-TR system, which provides real-time location information based on polygon points whose elevations were previously determined, was used. During the survey process, the coordinates of each point were taken by a GPS device(Topcon Positioning Systems, Inc., Livermore, CA, USA) fixed to the life vest on the person. This measurement process was repeated for all survey numbers. To ensure the sensitivity of bathymetric measurements and to obtain reliable data, a light, stable, and maneuverable 3 m long rubber boat with an average speed of 4 knots was used. A Topcon HiPer V mobile satellite receiver (Topcon Positioning Systems, Inc., Livermore, CA, USA), Ohmex SonarMite-BTX Singlebeam Echosounder (Ohmex Limited, Sway, Hampshire, UK), AML Oceanographic BASE X (AML Oceanographic Ltd., Saanichton, BC, Canada), and a computer with appropriate equipment were available on the boat, and the predetermined measurement lines were followed linearly as much as possible (Figure 3 and Figure 4).
A series of corrections was applied to the depth values recorded during the measurement process to obtain the actual depth elevation. By utilizing the parameters presented in the schematic below the image on the left in Figure 3, Equation (1) illustrates how the actual depth (AD) is calculated.
A D = D + A S V 1500
where AD represents the depth from the mean sea level (MSL) to the seabed, D represents the value measured by the echo-sounder, and A represents the transducer draft (TD). The SV (sound velocity) value (m/s) is the velocity obtained from the sound profile, which changes with the salinity of the sea. It was observed that SV was approximately 1500 m/s in the study area. In bathymetric measurements, at least two of the parameters A, B, or C in Figure 3 should be entered into the integrated measurement system by the user. The echo-sounder continuously adds the entered A value to the measured depth in order to approximate the actual water depth. By applying an additional SV correction to this value, the actual depth (AD) can be determined. The SV correction involves a velocity adjustment derived from the salinity level of the seawater. Sea surface elevation was measured before and after the bathymetric measurements, and the average change was found to be approximately 5 cm; this value was then added to the depths. The process was repeated for all seasonal measurements. However, the tidal variations in the Black Sea are relatively small, and their impact on the accuracy of this study is not significant. Previous studies conducted in the region support this observation. For instance, the literature review provided in [22] highlighted that the maximum tidal effect on the sea surface in the Black Sea does not exceed 20 cm. Based on this, such minor variations do not influence bathymetric data during survey periods.
Acoustic sounding with high resolution up to 9 m depth was used for data acquisition. An Ohmex SonarMite-BTX Singlebeam Echosounder (Ohmex Limited, Sway, Hampshire, UK) with a frequency of 235 kHz was used, and water depths were digitally recorded on the computer thanks to its smart transducer and bottom monitoring feature.
Simultaneously, the coordinates were combined with the Topcon HiPer V mobile GNSS (Global Navigation Satellite System) system (Topcon Positioning Systems, Inc., Livermore, CA, USA) on the boat, and the positional data at the time of the depth reading were obtained and converted into the TUDKA (Turkish National Vertical Control Network) system. To ensure high precision in the measurements, the speed of sound propagation in water (SV) was measured with an AML Oceanographic BASE X device (AML Oceanographic Ltd., Saanichton, BC, Canada). A speed correction was made for all depths according to the speed of sound propagation in water. For easy evaluation of bathymetric measurements and precise tracking of changes, the line spacing was designed to be a maximum of 15 m in the AutoCAD 2024 software (Figure 4). In all measurements, these routes were monitored on the computer screen on the boat to ensure an accurate and healthy comparison of measurements.
Kordil Geodesy Tools (v2.8.2), SonarMagic (v2.6.1) and PDS2000 (v3.9.2.5) softwares were used to process the obtained data. With Kordil Geodesy Tools and SonarMagic, the coordinates were printed out at the time the echosounder data were received, the necessary deletions and edits were made on the three-dimensional bathymetric profiles obtained with PDS2000, unrealistic data were removed, and the final maps were obtained.
Statistical analysis of bathymetric data is essential for differentiating between random seabed variations and significant trends, providing a more precise understanding of erosion and sedimentation processes. Identifying trends across all categories enhances data interpretation, offering a clearer and more comprehensive perspective. Trend analysis plays a vital role in detecting long-term changes, enabling the prediction of future patterns and the early assessment of potential risks. In this context, the Mann–Kendall test, a widely used non-parametric method that does not require a normal distribution assumption, is employed to determine the presence of statistically significant trends in time series data related to granulometry (on d10, d30, d50, d60, and d90) and volumetric changes. The analysis of variance test could not be used because of the limited year-based data.

Reliability of Bathymetric Surveys

The measurements should be sufficiently accurate, and in cases where their reliability is uncertain, recalibration and repeated analyses are necessary. Various methods exist to assess measurement reliability and data quality, among which the Root Mean Square Error (RMSE) is one of the most widely recognized. RMSE is a fundamental statistical metric used to quantify the deviation between observed and actual values, providing a clear indication of measurement accuracy. Here, RMSE was applied to evaluate the reliability of bathymetric measurements taken within the fishery shelter, where continuous morphological changes occur in the inner section (Equation (2)). However, in areas deeper than 6–7 m, no significant changes are expected under normal conditions due to the depth of closure, which defines the boundary beyond which sediment transport is minimal. The resulting RMSE value of 0.022 suggests a high level of measurement accuracy, as it indicates minimal deviation from the reference depths. By analyzing depth variations across different sections, the quality and reliability of the measurements were systematically validated, ensuring consistency within the expected hydrodynamic framework.
R = i = 1 n ( e i ) 2 n
Here e i represents the differences between observed (actual) values and predicted or measured values, and n is the total number of observations. The R value is expected to be less than 10%, indicating an acceptable level of accuracy. However, values below 5% are considered much more reliable, as they suggest minimal measurement errors and higher data precision. Lower R values enhance confidence in the dataset, particularly in bathymetric studies where even small deviations can influence hydrodynamic assessments and sediment transport analyses.

3. Results and Discussion

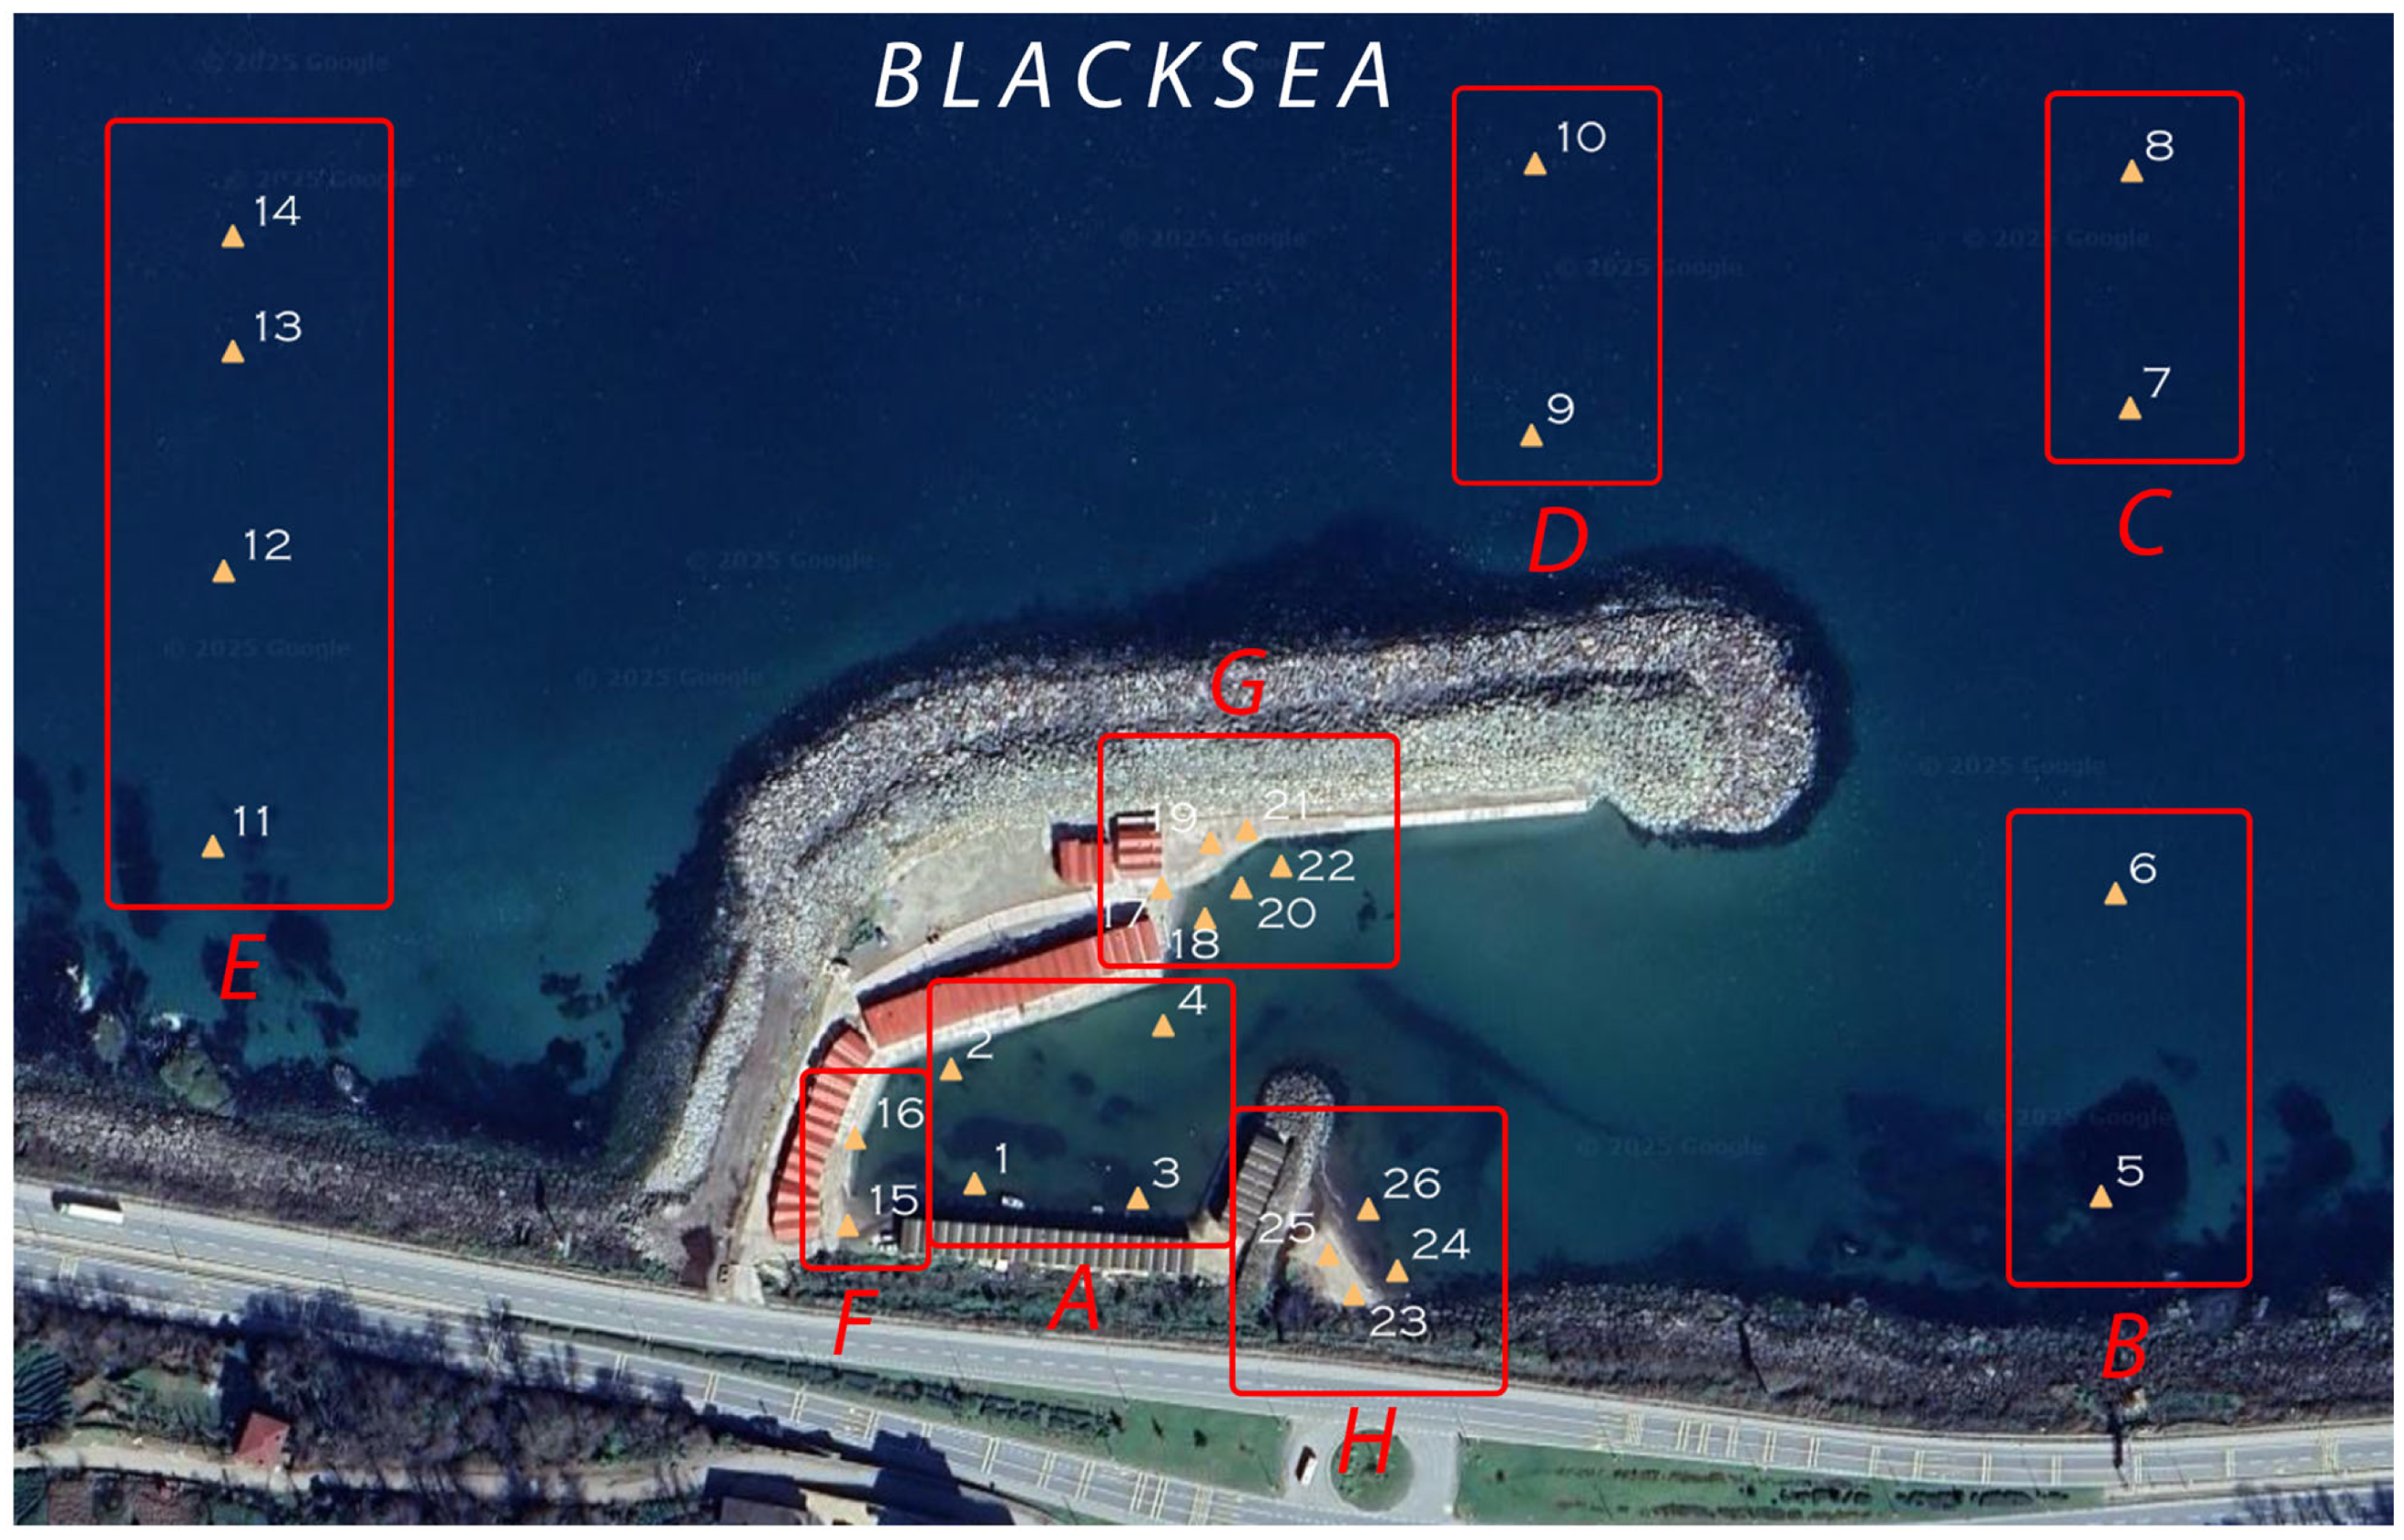
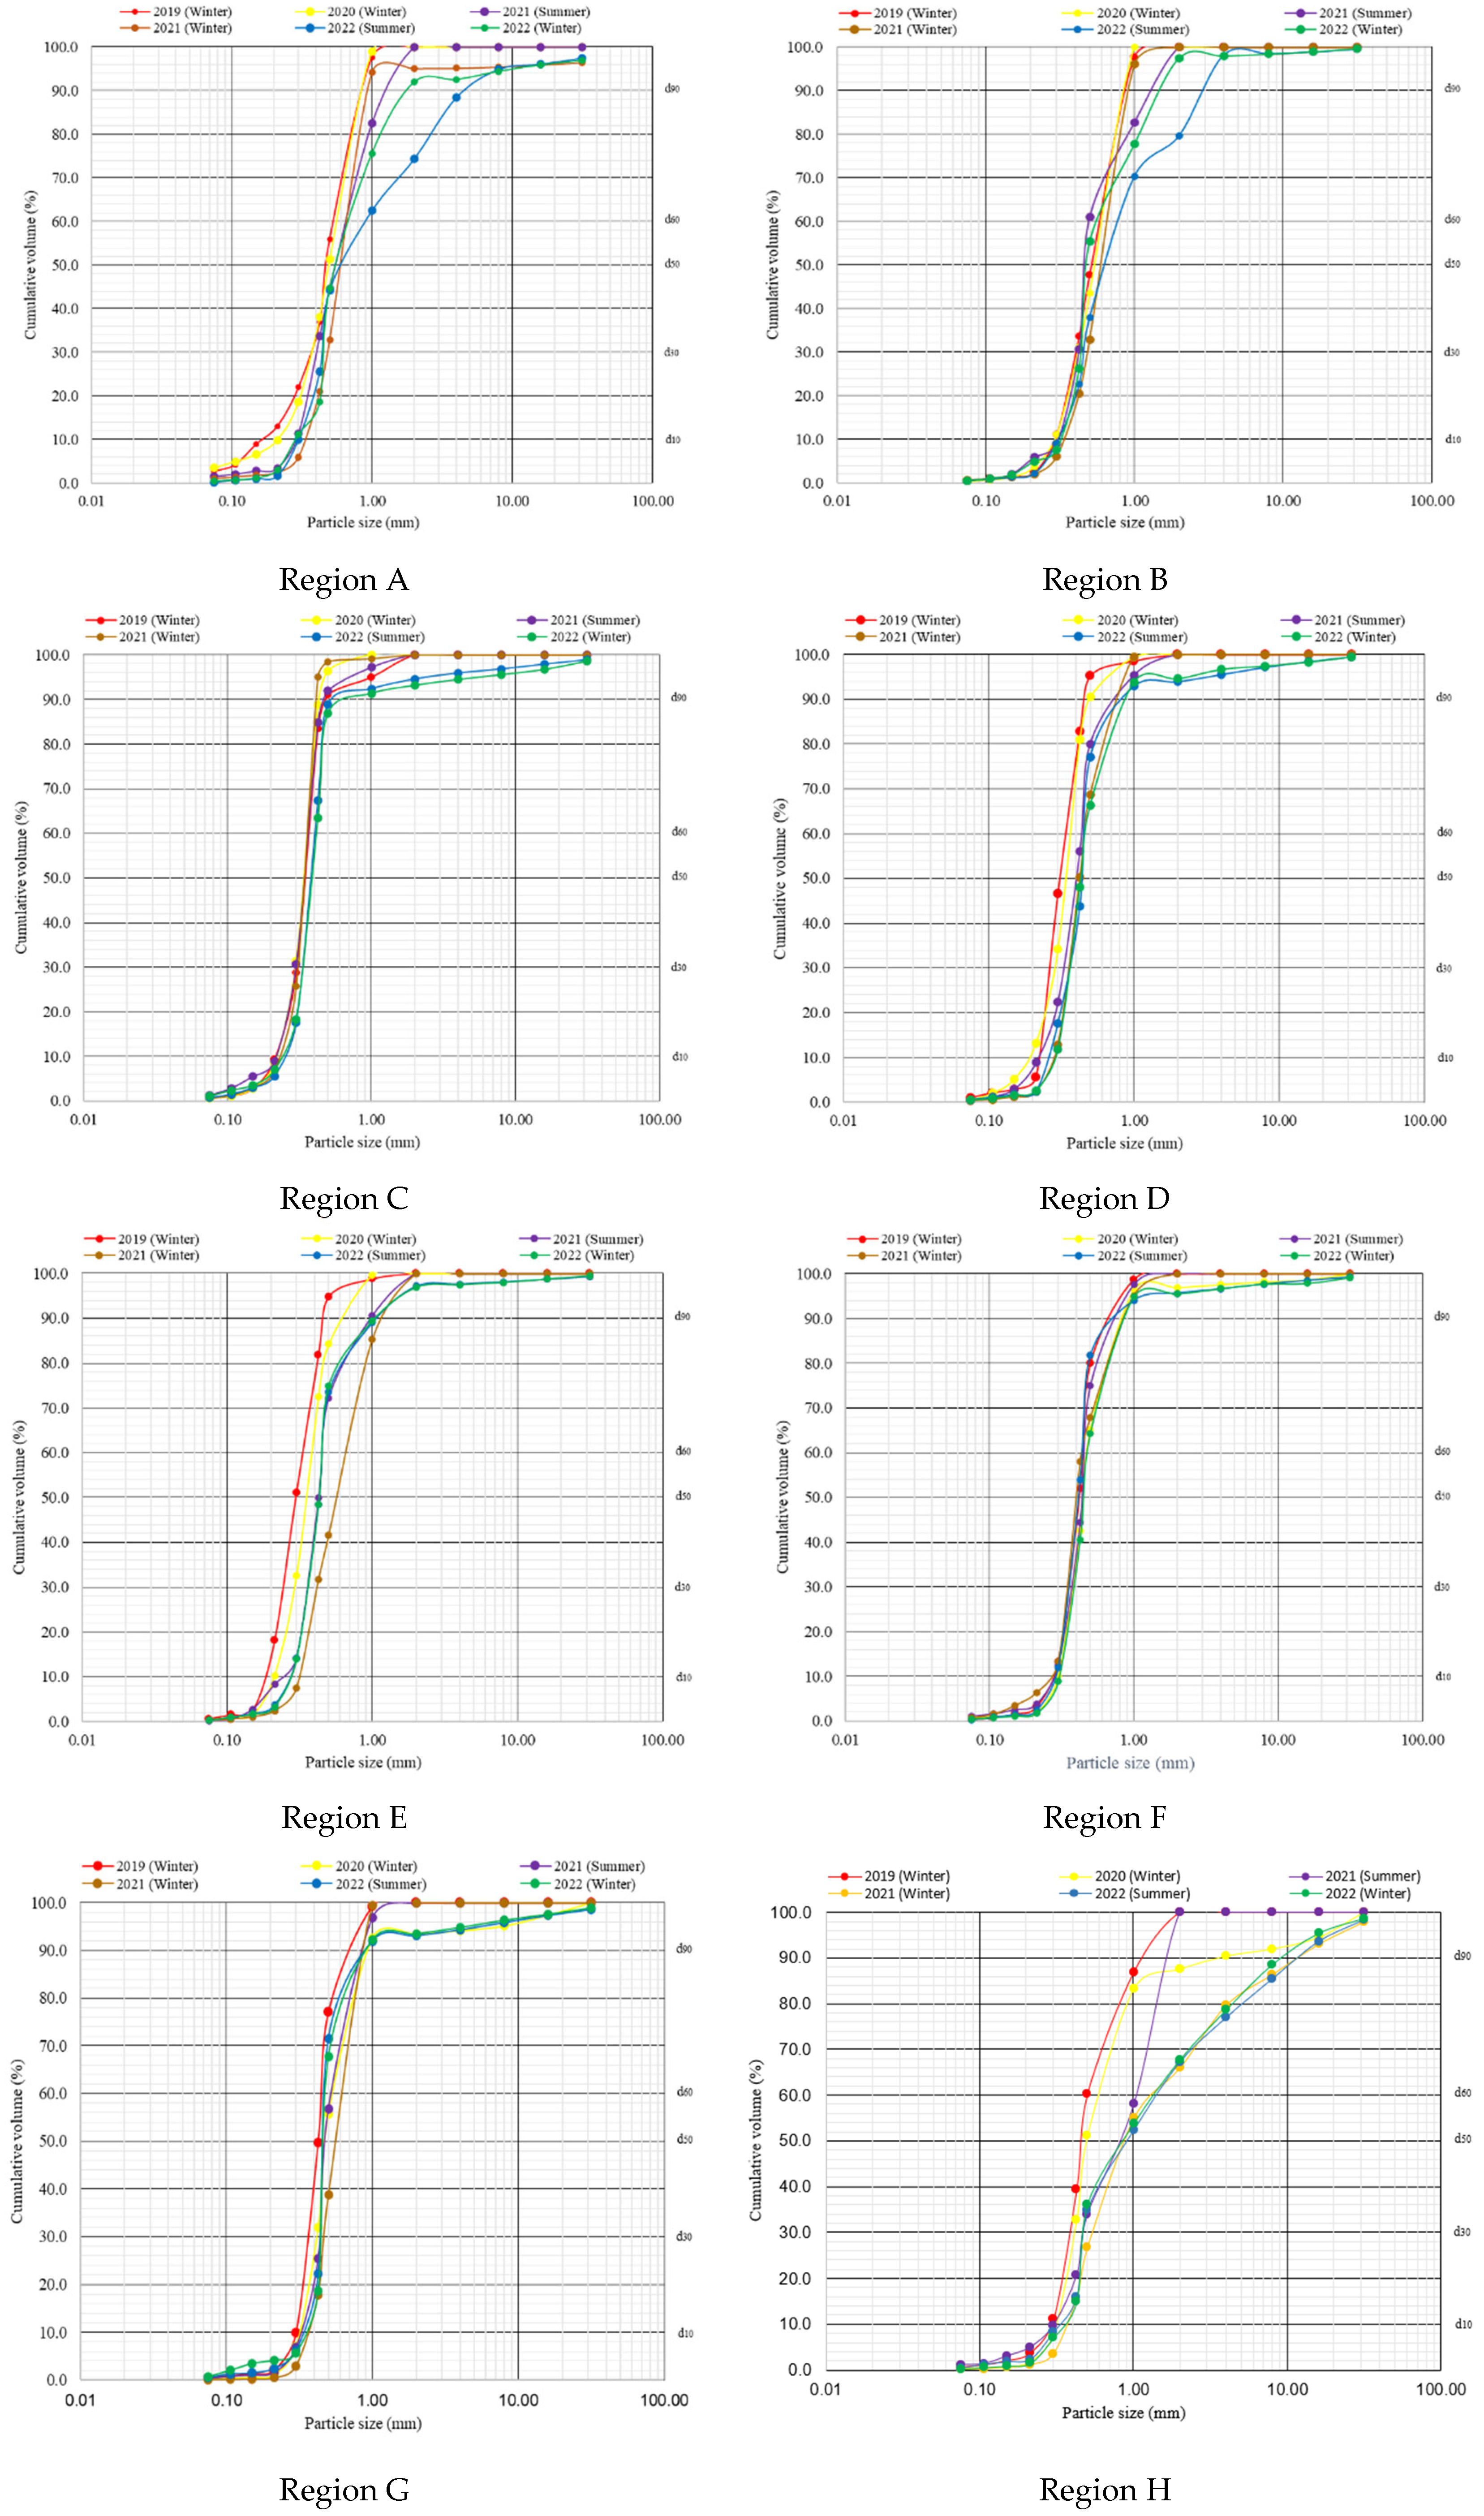
Sediment sample locations are shown in Figure 5. The samples were taken based on regional areas. Additionally, both eroded and deposited materials along the coastline were examined simultaneously. Sediment sample weights varied between 0.25 and 1.5 kg depending on location and position. The aggregate remaining on the sieve was dried and weighed in an oven at 110 ± 5 °C until the mass difference above the sieve was constant with a tolerance of ± 0.1 kg. Next, sieve analysis was performed, granulometry curves were drawn, and characteristic grain diameters (d10, d30, d50, d60, and d90) were obtained. The coefficient of uniformity (Cu) is the ratio of the effective grain size (d10) to the diameter (d60) at which less than 60% of the soil is smaller, and the coefficient of curvature (Cc) is found from the grain distribution curve as d30/(d10.d60). The Unified Soil Classification (USCS) method was used to classify the soil samples. Granulometric analysis was completed by using the passing percentages of all sieves and Cu and Cc values, and the soil class is shown in Figure 6 and Table 2.
Sediment samples were taken from various depths both inside and outside the shelter. The samples were grouped based on the order of collection and the area from which they were taken. Accordingly, points 1–4 were classified as Group A, 5–6 as Group B, 7–8 as Group C, 9–10 as Group D, 11–14 as Group E, 15–16 as Group F, 17–22 as Group G, and 23–26 as Group H.
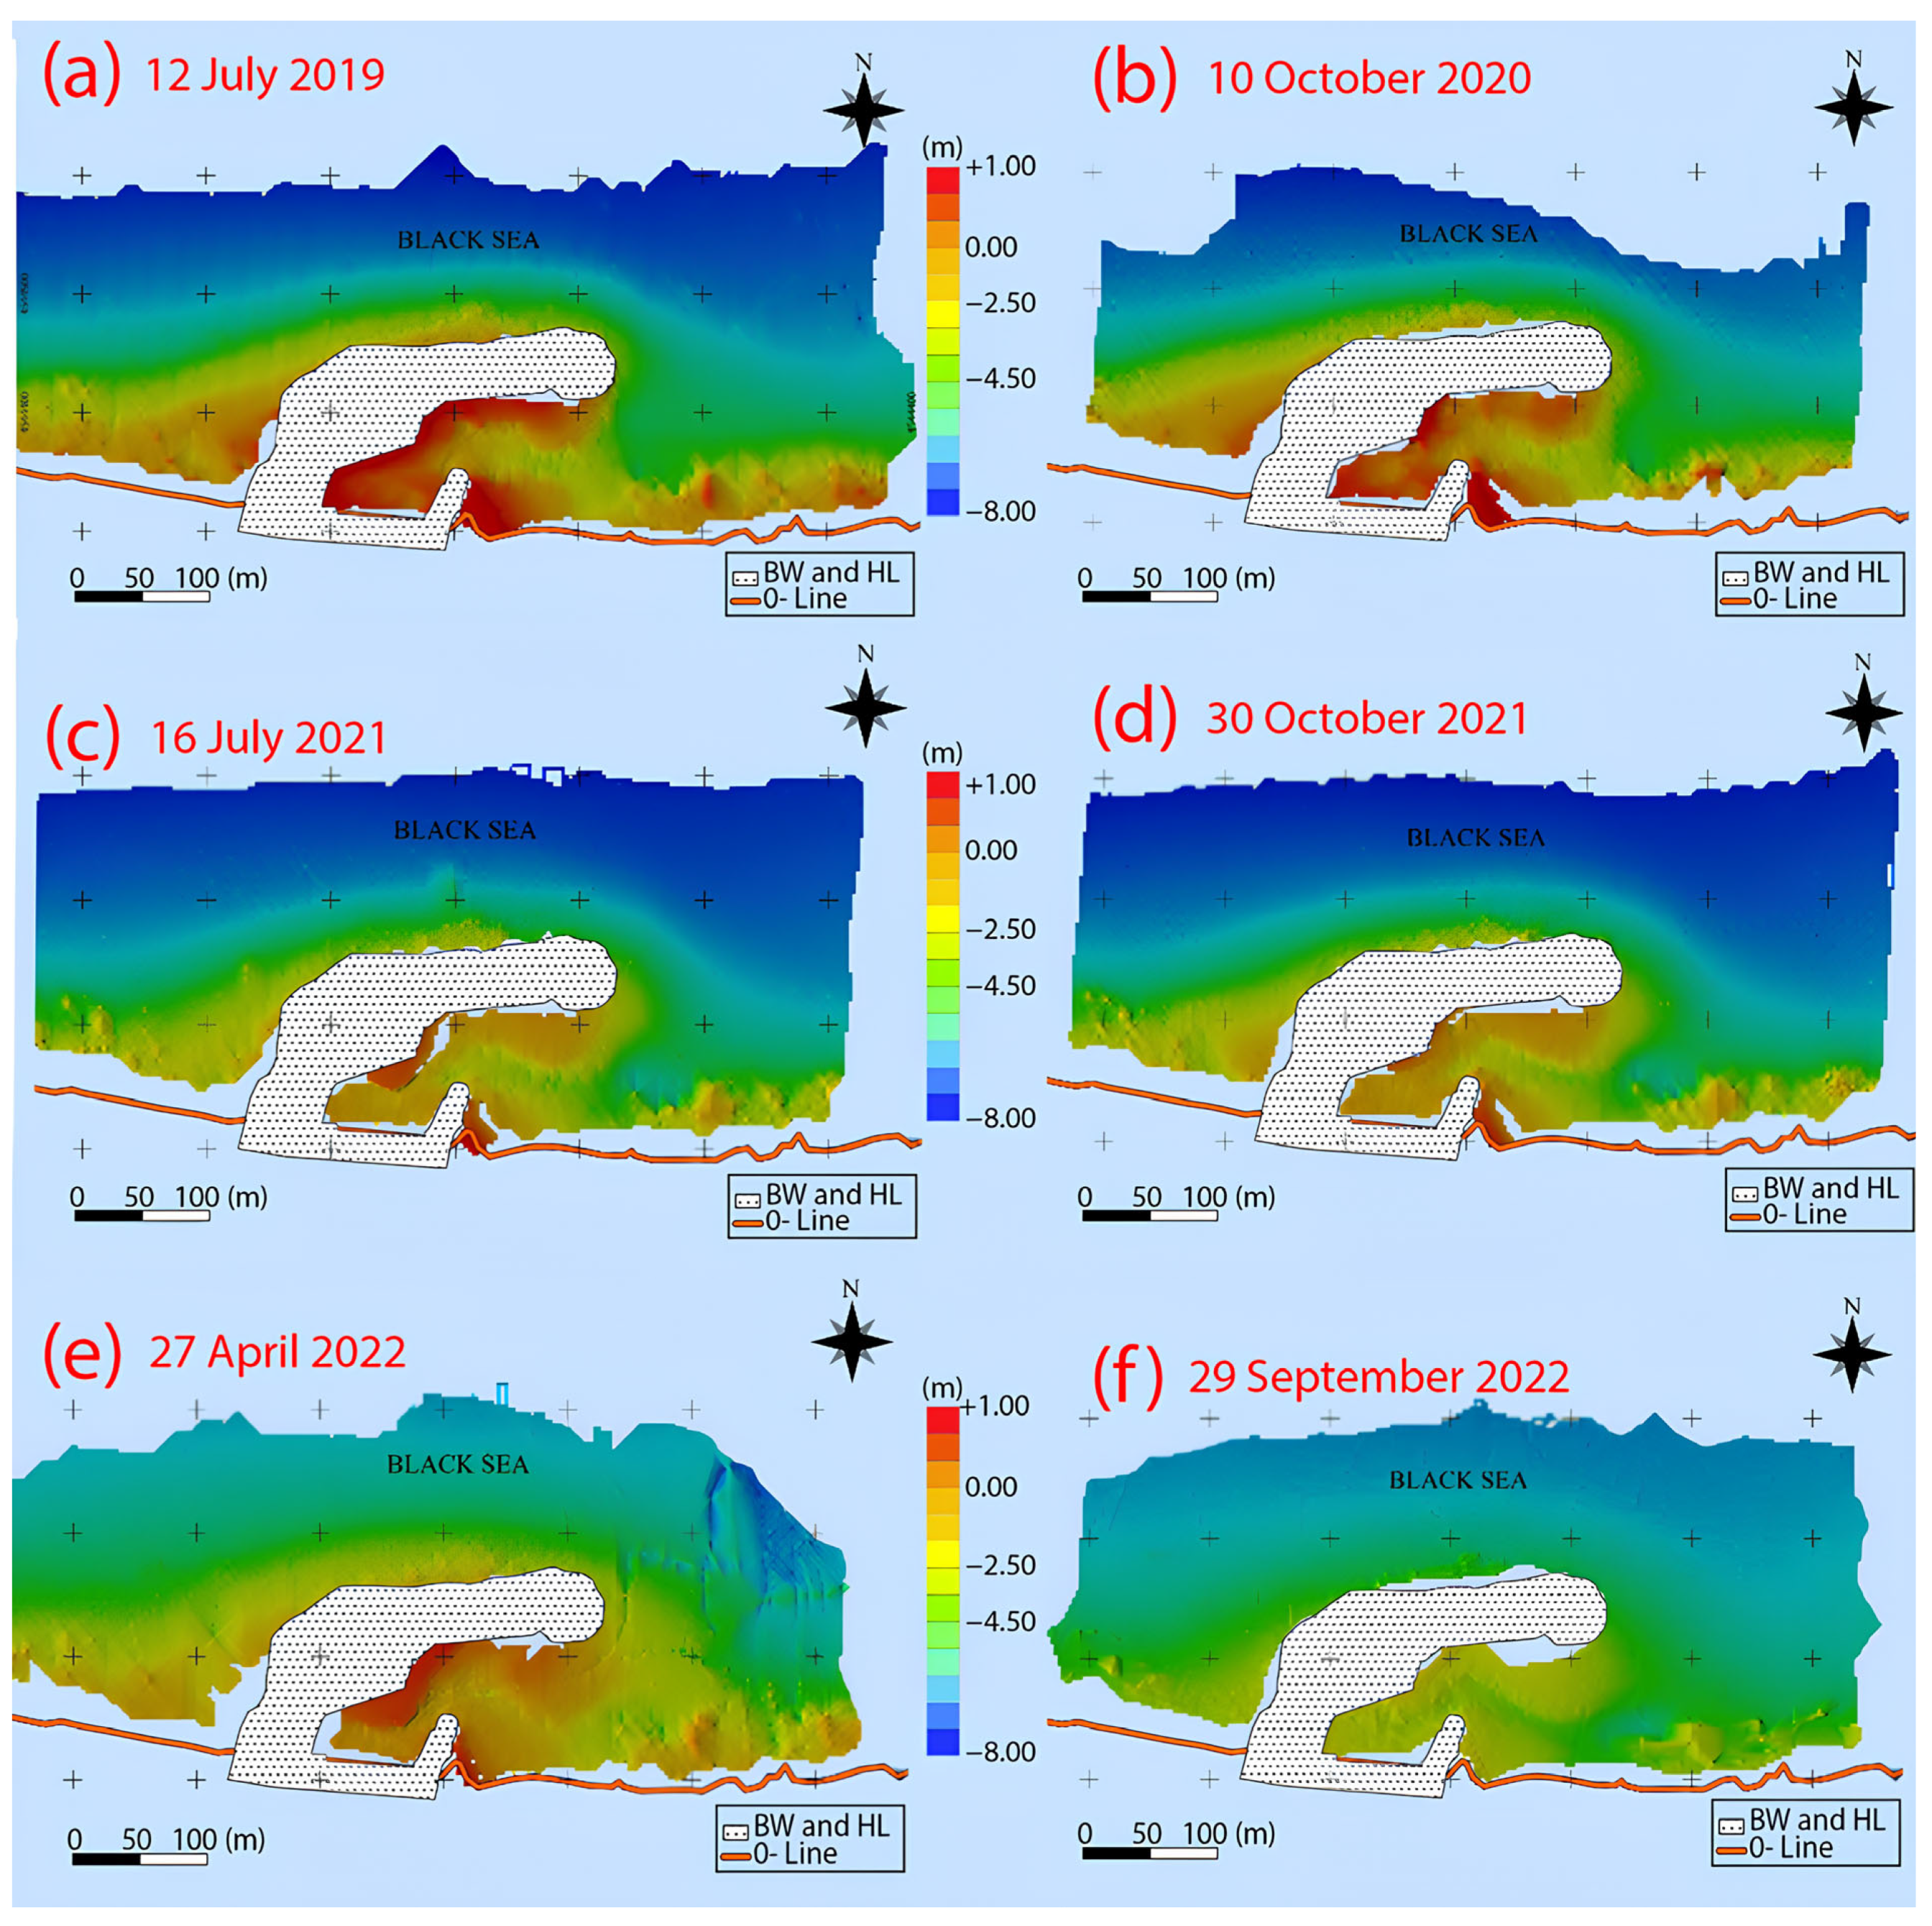
Bathymetric maps of the study area were generated during the data processing phase. Average water depths and bathymetric changes are presented in Figure 7 and Figure 8.
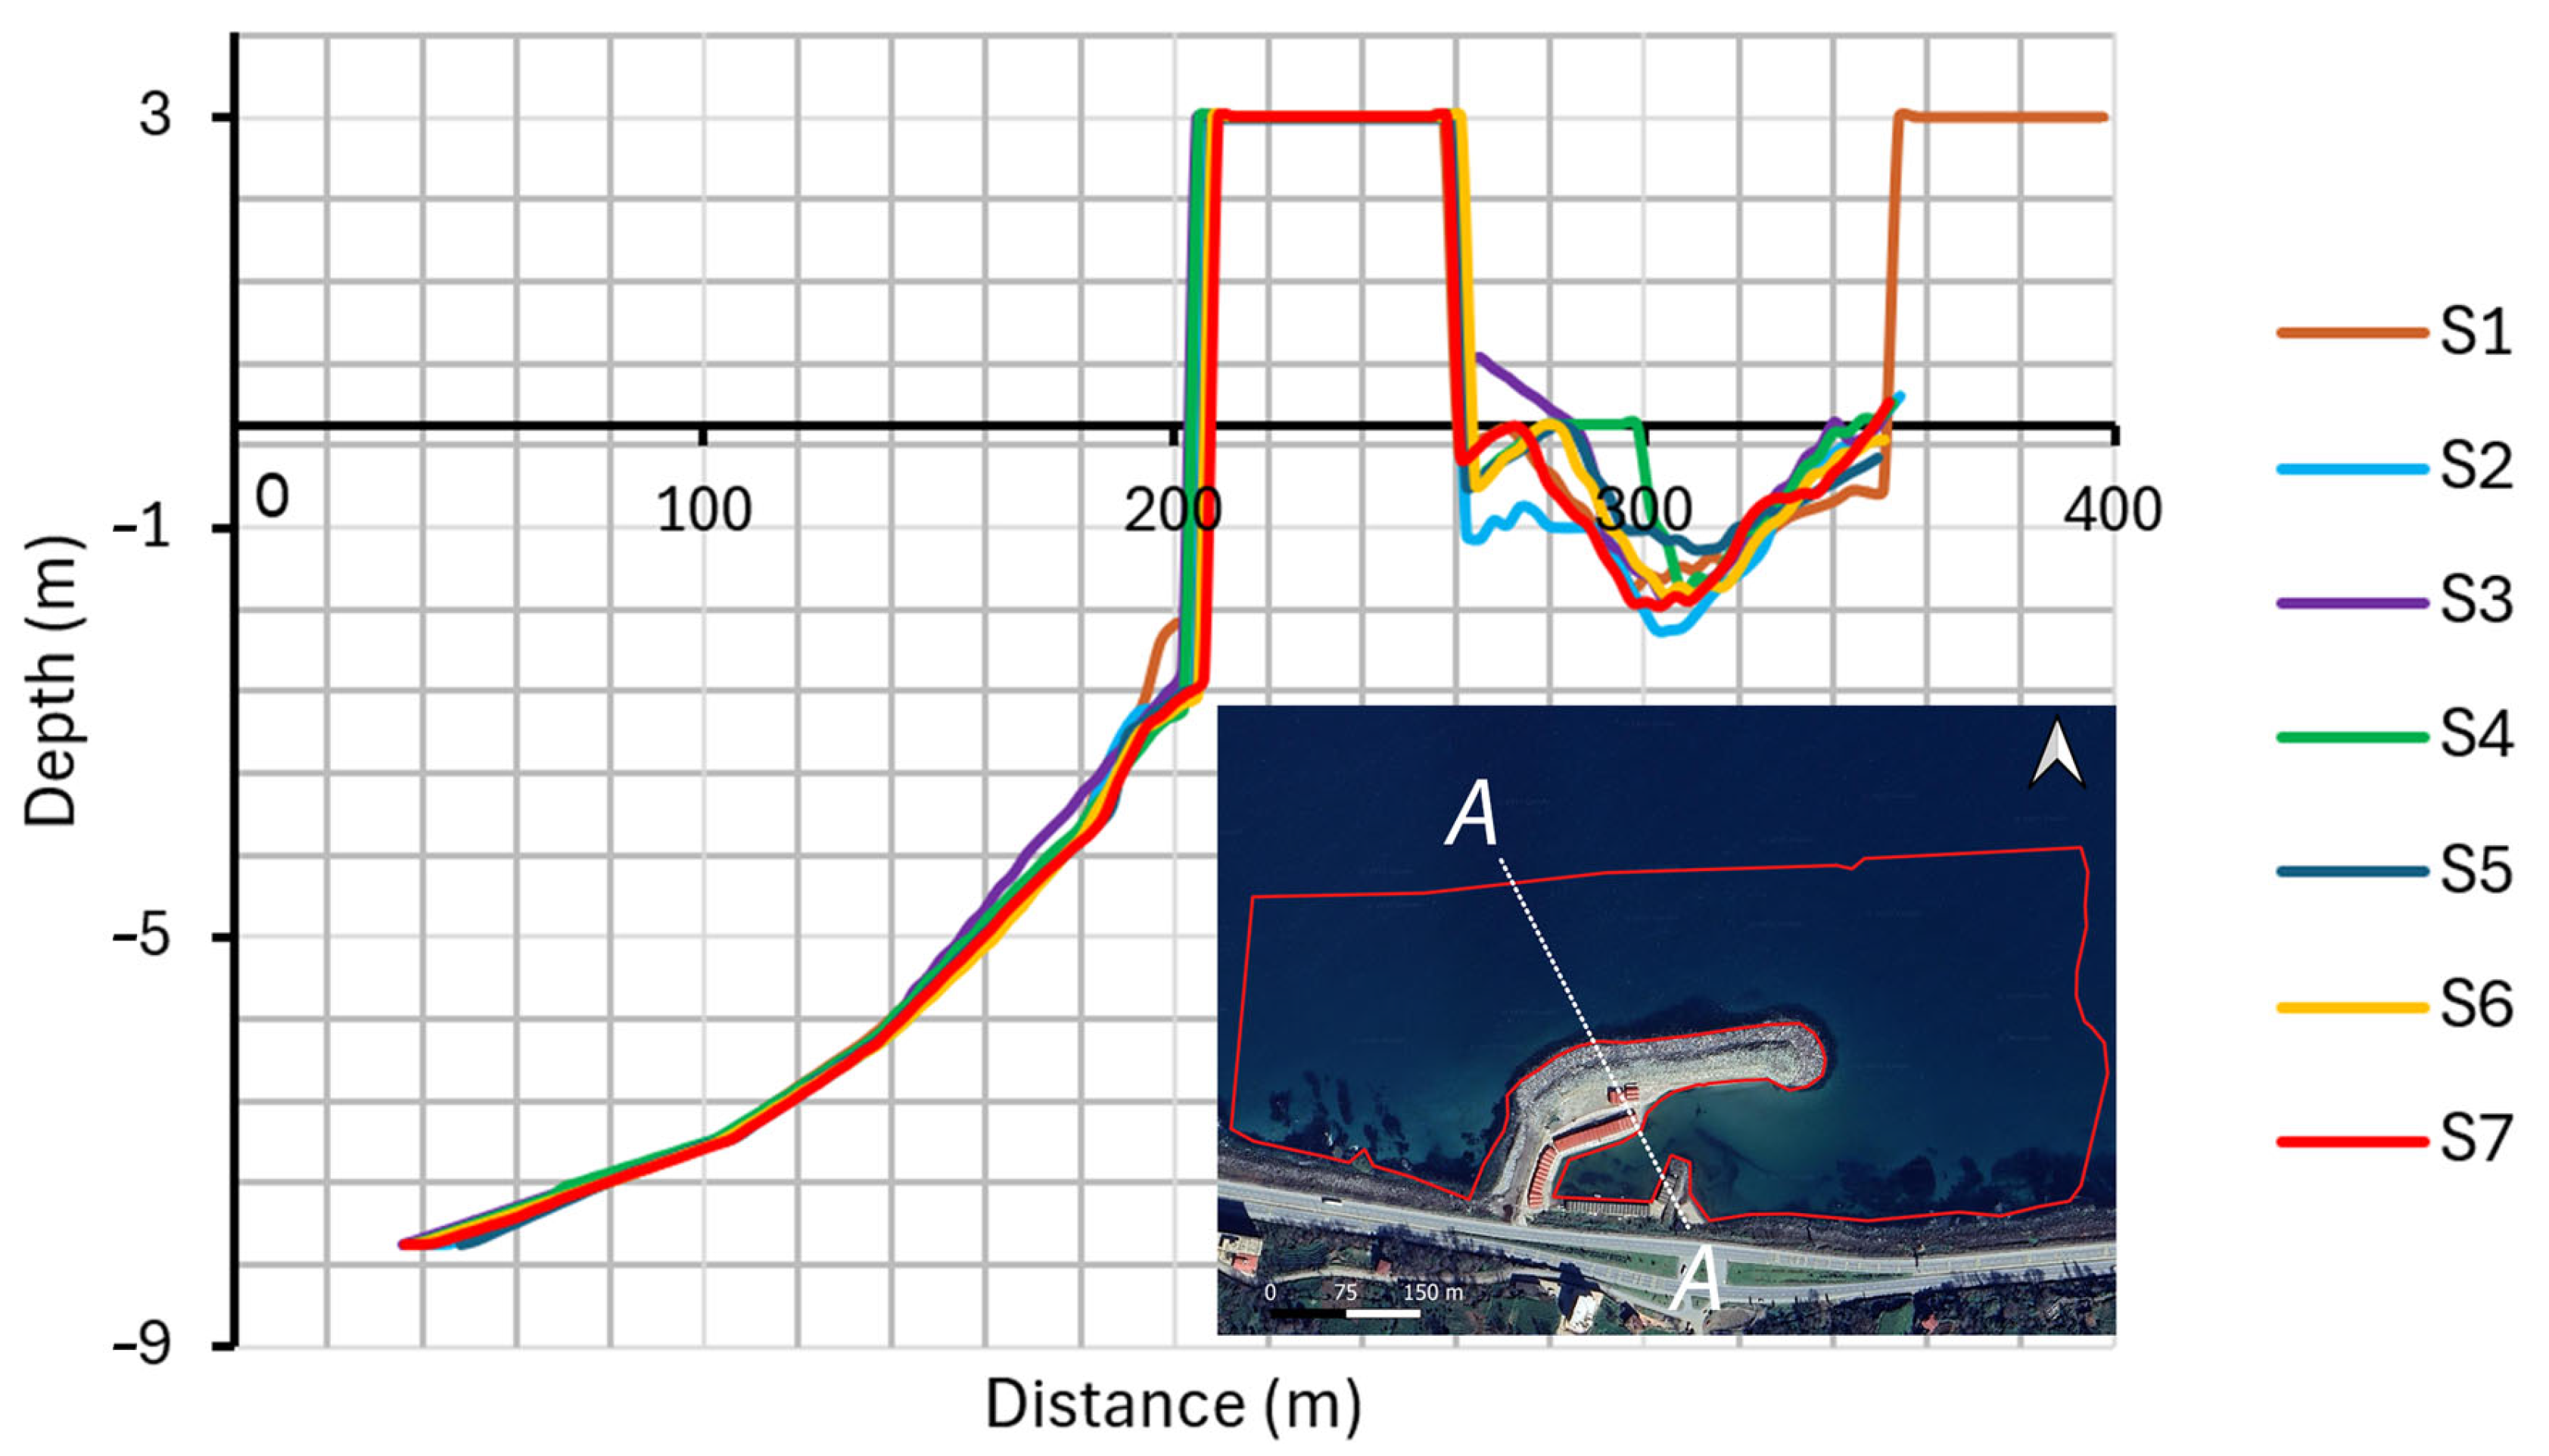
In the bathymetry maps obtained from measurements between 2019 (winter) and 2022 (winter) (3 years) in the study area, the cross sections in the dominant wind direction (NNW) and changes in the seabed are shown in Figure 9.
The sediment movement pattern is influenced by the dominant wave direction and wind-induced currents. Notably, an erosional eddy is observed in the vicinity of the breakwater structure, where flow disturbance promotes localized scouring. In contrast, significant sediment accumulation is evident in the sheltered section behind the breakwater, indicating that the structure acts as a sediment trap. This spatial variation in erosion and deposition shows the complex interaction between hydrodynamics and structural layout, underlining the necessity for optimized breakwater design to balance sediment transport and maintain navigability.
Storms significantly influenced the results, primarily by altering sediment transport dynamics, shoaling rates, and bathymetric changes within the fishery shelter. Storm-induced wave action and strong currents transport large amounts of sediment into the fishery shelter, leading to shoaling (sediment accumulation). As seen in Table 3, the volumetric changes in the study area indicate a net sediment accumulation of 11,611 m3 between 2019 and 2022, demonstrating the impact of storm-driven sediment deposition.
In Figure 2, it is seen that shoaling increased in 2003 and began to decrease in 2009, and continued to decrease until 2014. In 2017 and 2019, it increased once more. Sand dredging in the fishery shelter occurred in the following years (see Table 1). Thus, shoaling was very low in 2024. It is seen that this situation coincides with the data obtained.
After the sediment samples were tested in the laboratory, it was seen that the characteristic grain diameters varied between d10 = 0.16–0.36, d30 = 0.24–0.54, d50 = 0.30–0.91, d60 = 0.33–1.43, and d90 = 0.41–11.72 mm. Coarse-grained sediments are predominantly observed outside the breakwater, exhibiting a seasonal shift toward a more linear depositional pattern as summer approaches. The characteristic grain diameter d50 increases (in mm) from 0.48 to 0.62 in zone A, from 0.52 to 0.65 in zone B, from 0.34 to 0.38 in zone C, from 0.31 to 0.43 in zone D, from 0.30 to 0.43 in zone E, from 0.42 to 0.45 in zone F, from 0.43 to 0.47 in zone G, and from 0.46 to 0.91 in zone H. It can be seen that the changes in the D and E regions outside the breakwater are similar. The shoaling is quite high in the H region, and the soil samples are SP, the poorly graded sand class according to the USCS soil classification system (Table 2, Figure 6).
Analysis of the bathymetric maps indicates that shoaling and erosion patterns are spatially close to each other due to the low sediment movement in parts deeper than 4 m. Over the years, these changes are estimated to remain balanced. It is observed that erosion has increased at the entrance of the fishery harbor, and shoaling has intensified, especially inside the harbor (Figure 7 and Figure 8).
From the profiles created by taking the dominant wind direction (NNW) into consideration, it is seen that there is very little change in the water depth over the years in the sections deeper than 5 m, while the water depth changes as it approaches the fishery harbor. Measurements north of the shelter showed that the water depth was approximately 0.50 m, and the water depth decreased by 1.00–1.50 m on the north and south inside the shelter. There is sediment transport in these areas, and shoaling occurs at the bottom (Figure 9). The seabed deepened by 4 cm between 2019 and 2020; however, in the following years, it became shallower by a total of approximately 8 cm. The changes in the intermediate years remained within this height range, causing serious shoaling that restricted the movement of fishing boats. A total of 13,879 m3 volume was eroded and 25,490 m3 volume was deposited, and shoaling occurred in and around the fishery harbor. A total volume increase of 11,611 m3 (Table 3) occurred, causing the sea level to decrease by 8 cm on average. This sediment redistribution was largely influenced by storm events, which played a critical role in reshaping the seabed. High-energy waves and storm-induced currents transported sediments from exposed coastal areas to more sheltered regions, altering the bathymetric profile.
Fluctuations in wave energy contributed to an uneven sediment balance, where erosion in certain locations was counteracted by excessive deposition elsewhere. These dynamic changes impacted the structural stability of the fishery shelter and necessitated periodic dredging efforts to maintain navigability. Storm events caused bed level changes, influencing the navigability of the fishery shelter. Over time, repeated storm effects resulted in depth variations inside and around the shelter, making boat access more difficult. Storms accelerated coastal erosion, particularly at the entrance of the harbor, leading to a loss of sediment in some areas and depositions in others. This uneven distribution of sediment caused morphological changes in the fishery shelter, affecting wave patterns and increasing maintenance requirements such as dredging. The sediment accumulation due to storms reduced water depth, restricting the movement of fishing boats, especially in key mooring areas. While the Black Sea has minimal tidal variations, the combined effects of storm surges, sediment deposition, and seabed changes contributed to localized fluctuations in relative sea level.

Statistical Analysis of Result Data

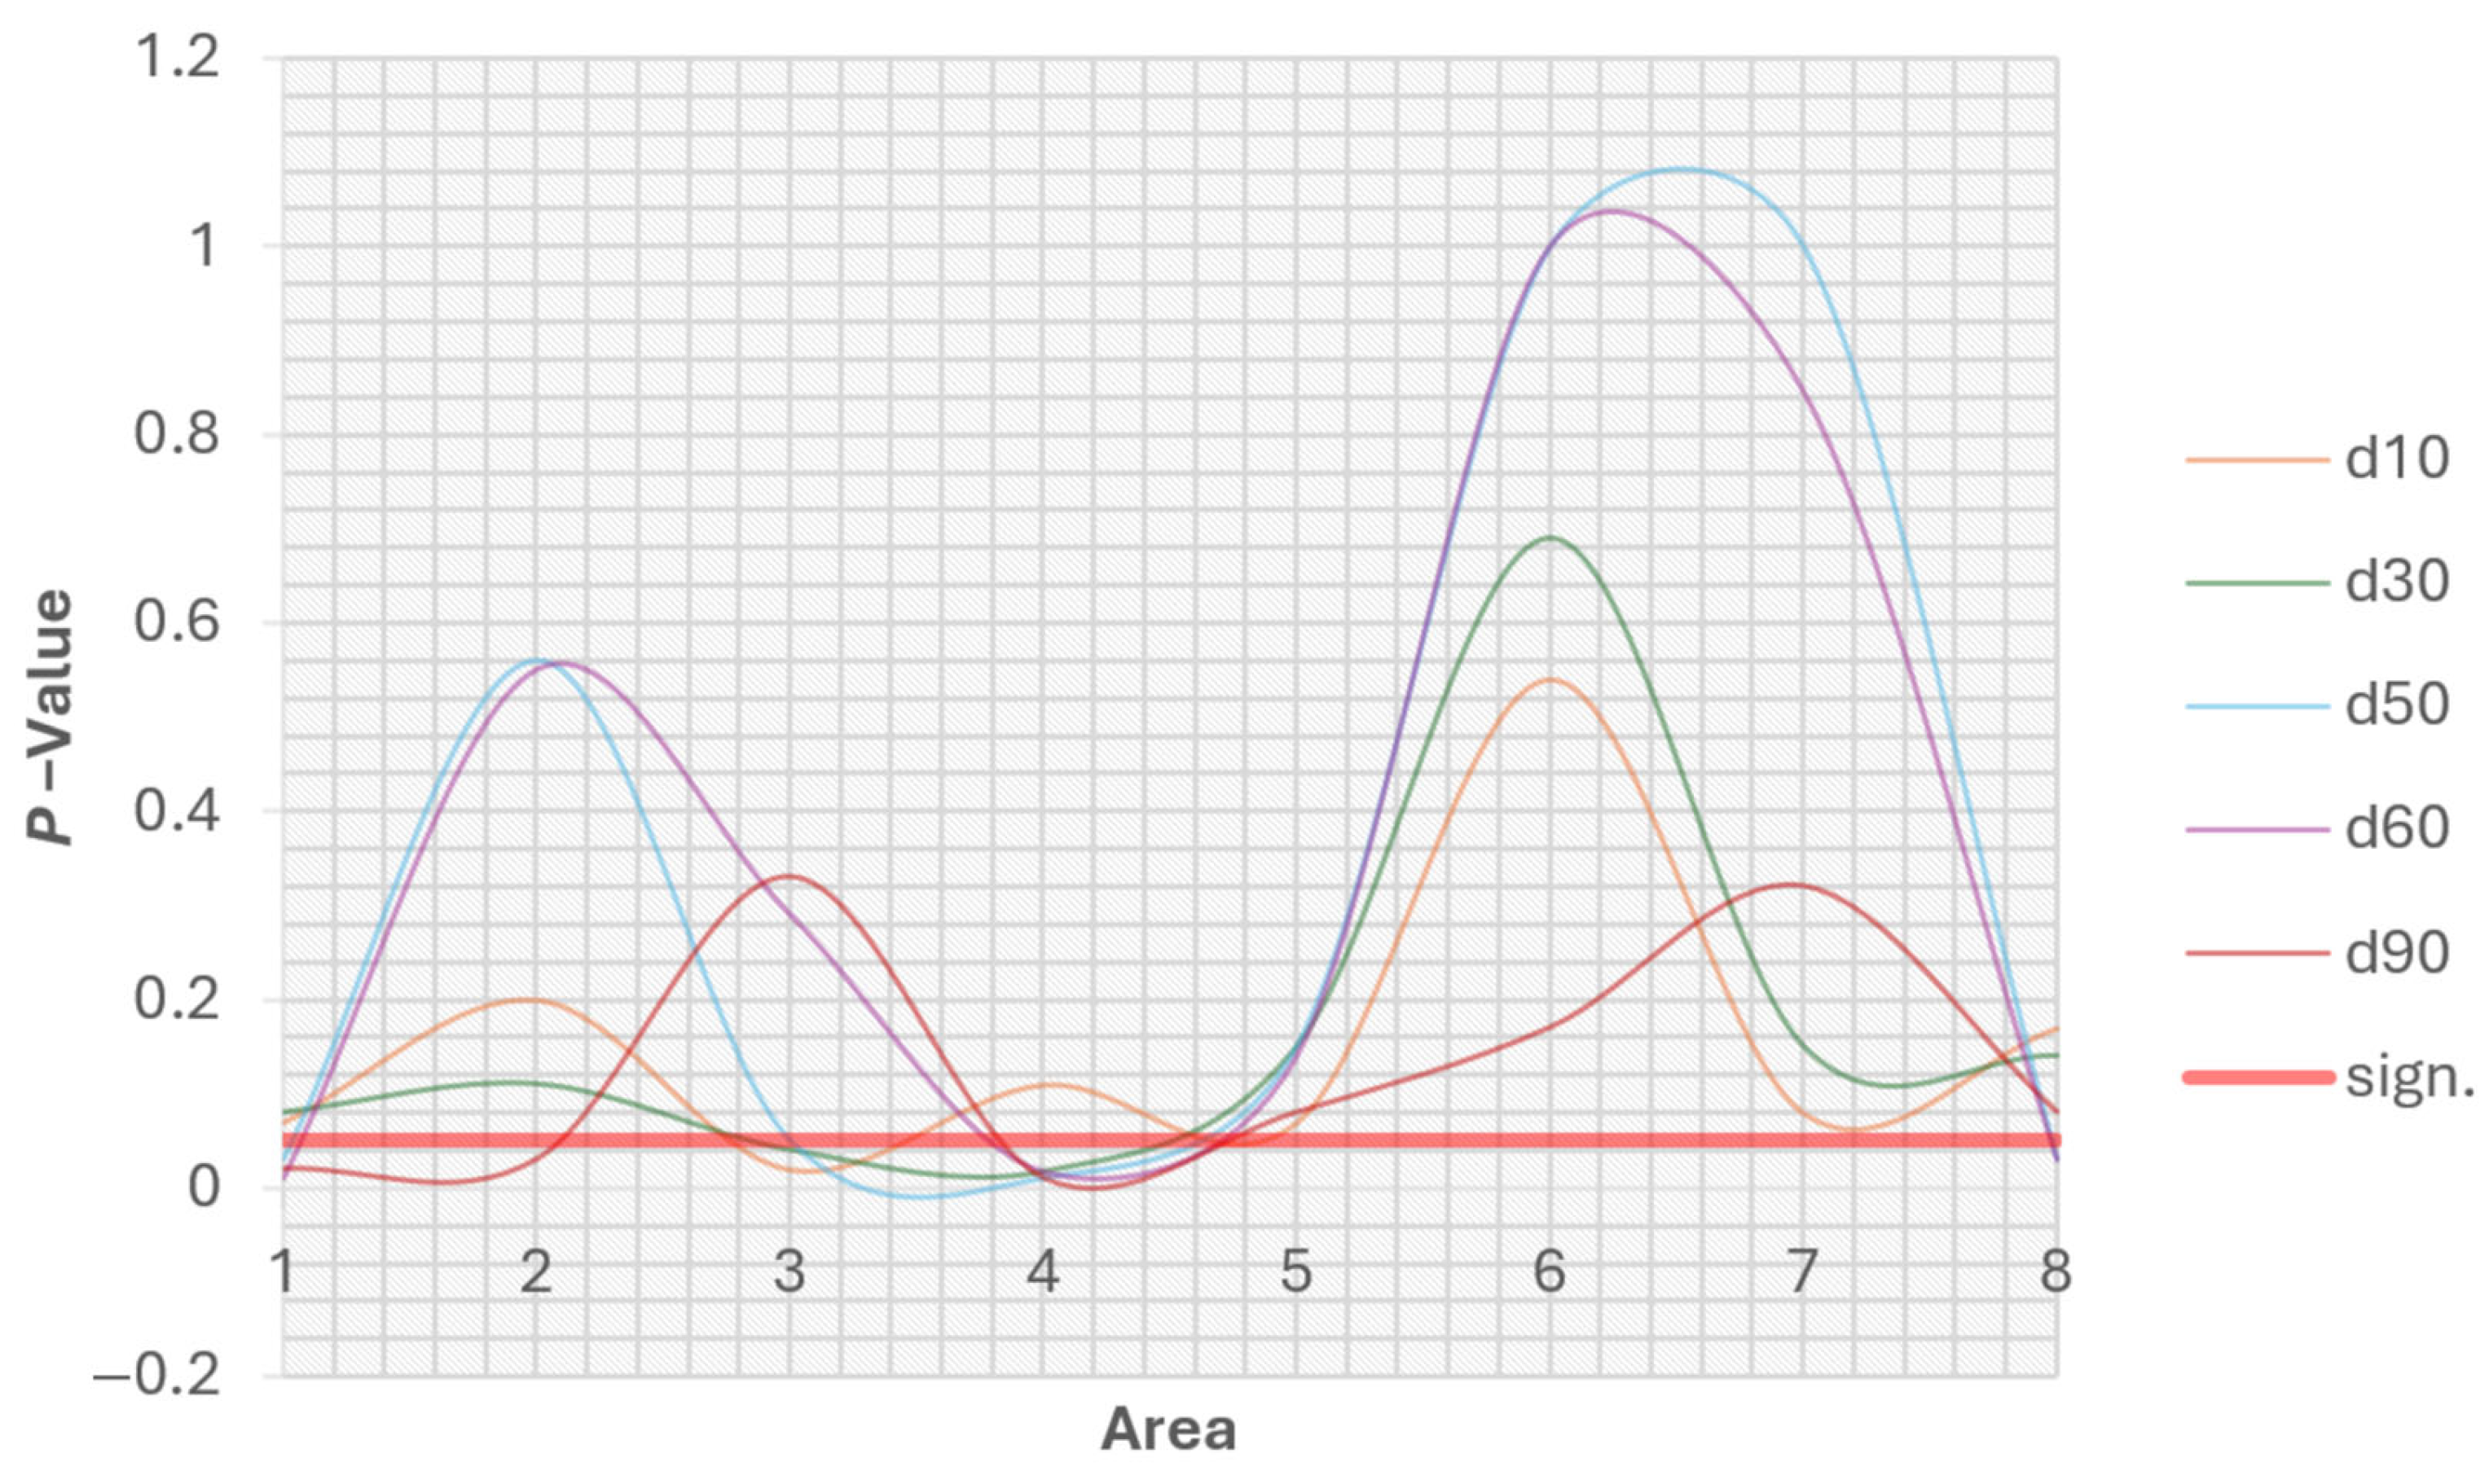
The sediment data and evaluation of soil samples according to the USCS soil classification system are tested in terms of significance level. In Figure 10, p-values of the distribution by areas are shown. The fact that most of the data points are above the significance level (p = 0.05) indicates that the majority of the data are not statistically significant. Similarly, analyzing the volumetric change by year shows a p = 0.82 value, which indicates that it is not statistically significant as well. This suggests that the observed variations may be due to random fluctuations rather than a meaningful trend. Notably, d50 and d60 values exhibit a wide range, further emphasizing the variability within the dataset. This suggests that any variations in these values may be due to random fluctuations rather than a consistent increasing or decreasing trend. Additionally, the wide range of values implies that sediment distribution is influenced by multiple factors, preventing the detection of a clear trend. Overall, the lack of statistical significance means that no strong evidence supports a long-term directional change in sediment characteristics.
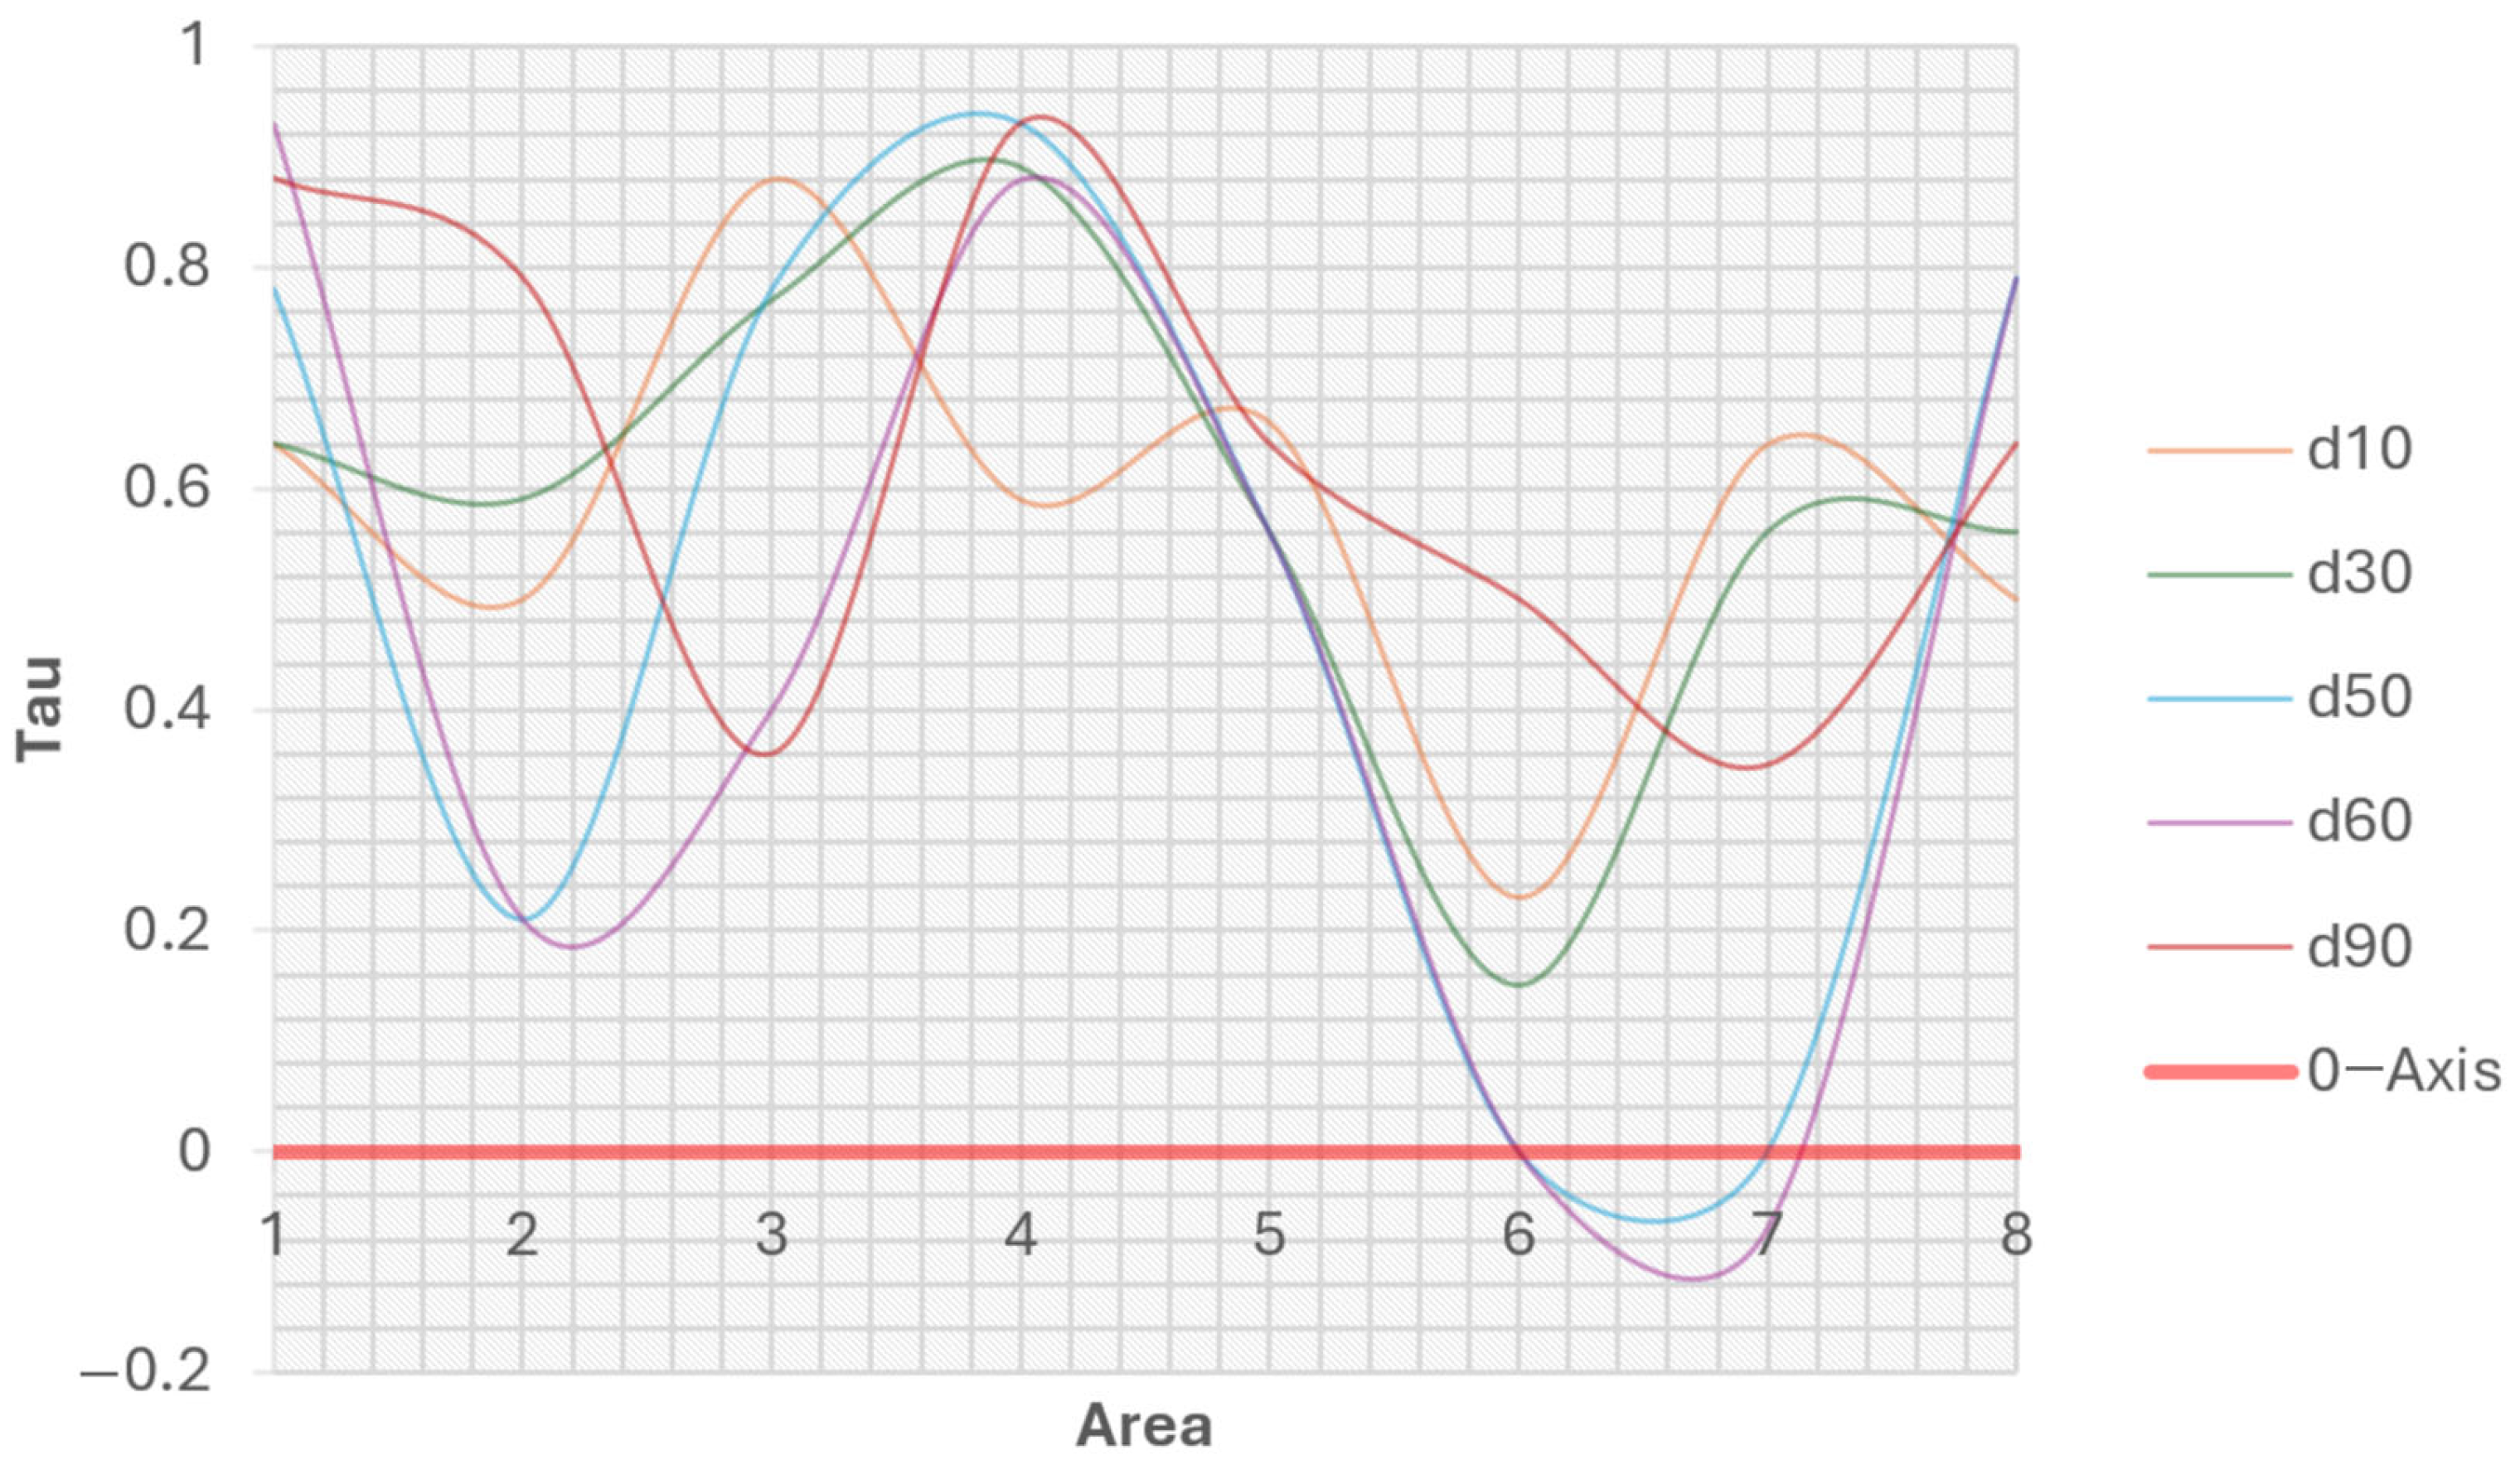
When examining the trend, the prevalence of positive Tau values indicates that an increasing trend is observed in 99% of the distribution. This suggests a strong tendency for the data to exhibit upward movement over time (Figure 11). Similarly, analyzing the volumetric changes by the year shows an increasing trend as well. The presence of an increasing trend in sediment values indicates a shift in sediment dynamics, where coarser particles are accumulating over time. This may result from changes in hydrodynamic conditions, alterations in sediment sources, or an increase in sedimentation rates due to natural or human-induced factors. Additionally, variations in erosion and transport processes could cause finer particles to be removed while larger grains settle. Understanding these trends is crucial for coastal management, infrastructure planning, and assessing ecosystem impacts.
The study of sediment transport is paramount in understanding coastal dynamics and plays a critical role in the design and implementation of coastal protection structures. A comprehensive analysis of sediment dynamics within a given region provides essential insights into the mechanics governing sediment sources, transport pathways, and depositional patterns, thereby directly influencing engineering strategies for shoreline stabilization. Systematic monitoring efforts should be undertaken to achieve a reliable assessment of sediment transport processes, with bathymetric surveys serving as the foundational step in this investigative framework. One of these methods includes remote sensing techniques. They have been employed by various researchers to derive bathymetric data [26,32,33,34,37]. While these methods offer practical advantages over direct survey techniques, they often fall short in achieving the high-resolution mapping required for precise sediment tracking. Although satellite-derived bathymetric mapping is considered a technically viable and widely accepted approach [25,30,38], its applicability remains constrained when compared to the superior seabed imaging capabilities of single-beam and multi-beam echosounders. Direct acquisition of high-resolution bathymetric data enables detailed assessments of seabed morphology; however, in the absence of continuous long-term monitoring, such measurements primarily provide a limited-time assessment rather than a comprehensive temporal understanding of sediment dynamics [46].
Efforts to monitor coastal environments and propose modifications to existing coastal structures have been documented [46,47]. Nevertheless, short-term observation periods, typically limited to one or two years, are often insufficient to fully characterize sediment transport mechanisms within a given system. Moreover, the absence of numerical modeling in certain studies introduces limitations in data reliability and constrains the formulation of sustainable sediment management strategies. Previous numerical modeling efforts differ significantly from the present study, as they lack recurrent observational data and fail to incorporate storm-induced wave effects, which are critical factors influencing sediment transport processes [3,18]. Although research-oriented studies in the Black Sea have been conducted for a long time [48], their limited scope and frequency highlight the existing gap in this field. Additionally, the absence of a systematic methodology for collecting sediment samples from onshore, nearshore, and offshore environments may lead to an incomplete and potentially misleading interpretation of erosion and deposition dynamics.

4. Conclusions

Fishery shelters are economically significant and effective coastal structures, particularly in regions where fishing activities constitute a substantial part of livelihoods. Despite being supported by various protective structures, these shelters may sometimes prove insufficient under certain conditions. This study investigates sediment dynamics and the effects of shoaling in a fishing shelter located in Rize, Eastern Black Sea (Turkey). Therefore, bathymetric surveys were performed over three years during both winter and summer seasons, focusing on the influence of dominant winds. These periodic measurements allowed for the tracking of sediment transport within the study area. Subsequently, sediment samples collected from onshore, nearshore, and offshore locations were analyzed to determine the size. The reliability of bathymetric measurements was assessed through quality testing of the generated maps, while sediment analyses were evaluated using the Mann–Kendall test to identify trends in sediment accumulation.
Based on the findings:
  • Nearly all sediment analysis results exhibited an increasing trend, with p-values higher than 0.05 for most samples. This indicates a complex sediment transport mechanism in the region, suggesting the need for further research to develop more accurate sediment prediction models.
  • Long-term measurements and analyses demonstrated that the fishery shelter undergoes continuous shoaling due to the insufficient functionality of both the main and secondary breakwaters. Despite three dredging operations conducted during the measurement period, shoaling could not be effectively prevented. Over the study period, a total sediment accumulation volume of 11,611 m3 was recorded, leading to an average reduction in water depth of 8 cm.
  • Modifying the existing breakwater by extending it in a manner that disrupts the returning wave action is expected to significantly reduce shoaling effects.
This paper presents the necessity for structural modifications and optimized sediment management strategies to ensure the long-term functionality and sustainability of the fishery shelter. The integration of real-time environmental monitoring systems (e.g., wave sensors, current meters) will allow for more precise data acquisition and enhance the currently limited dataset available for the Black Sea region. Furthermore, by examining bathymetric surveys conducted immediately before and after storm events, the direct impact of storms can be observed in areas prone to shoaling, while also validating the influence of other contributing factors.

Author Contributions

Conceptualization, H.O.M. and E.Y.; methodology, V.S.; software, R.D.; validation, P.E.; formal analysis, E.Y.; investigation, H.O.M.; resources, E.Y.; data curation, H.O.M., E.Y.; writing—original draft preparation, J.P.A.; writing—review and editing, J.P.A.; visualization, E.Y.; supervision, V.S., project administration, R.D.; funding acquisition, V.S. All authors have read and agreed to the published version of the manuscript.

Funding

This study has been supported by the Recep Tayyip Erdoğan University Development Foundation (Grant number: 02025003019368).

Data Availability Statement

The original contributions presented in this study are included in the article. Further inquiries can be directed to the corresponding author.

Acknowledgments

We would like to thank Recep Tayyip Erdoğan University for providing the material for the bathymetric surveying.

Conflicts of Interest

The authors declare no conflicts of interest.

References

  1. Bayraktar, E.A.; Bayraktar, D.; Yüksek, Ö. Effects of T Shaped Groins on Coasts in the Eastern Black Sea Region. SDÜ Sci. Inst. J. 2016, 20, 509. [Google Scholar] [CrossRef]
  2. Berkun, M.; Anılan, T.; Aras, E. Interactions of Sediment Transport and Coastal Erosion in the Eastern Black Sea Region. In Proceedings of the 8th Congress of Coastal and Marine Areas of Turkey, Trabzon, Turkey, 27 April 2010; pp. 1169–1179. [Google Scholar]
  3. Güner, H.A.A.; Yüksel, Y.; Çevik, E.Ö. Determination of Shoreline Evolution: A Case Study. In Proceedings of the Coastal Engineering Practice, San Diego, CA, USA, 21–24 August 2011. [Google Scholar]
  4. Wilson, R.; Davenport, C.; Jaffe, B. Sediment Scour and Deposition within Harbors in California (USA), Caused by the March 11, 2011 Tohoku-Oki Tsunami. Sediment Geol. 2012, 282, 228–240. [Google Scholar] [CrossRef]
  5. Mojabi, M.; Hejazi, K.; Karimi, M. Numerical Investigation of Effective Harbor Geometry Parameters on Sedimentation inside Square Harbors. Int. J. MAr. Sci. Eng. 2013, 3, 57–68. [Google Scholar]
  6. Görmüş, K.S.; Kutoǧlu, Ş.H.; Şeker, D.Z.; Özölçer, I.H.; Oruç, M.; Aksoy, B. Temporal Analysis of Coastal Erosion in Turkey: A Case Study Karasu Coastal Region. J. Coast. Conserv. 2014, 18, 399–414. [Google Scholar] [CrossRef]
  7. Weerasekara, K.A.W.S.; Jayampathi, O.M.M.D.; Hettige, N.D.; Azmy, S.A.M.; Amarathunga, A.A.D.; Wickramaarachchi, W.D.N.; Maddumage, M.D.S.R.; Jayawardena, J.K.P.C.; Narangoda, S.R.C.N.K.; Rajapaksha, R.M.G.N.; et al. Assessment of Water Pollution Status of Selected Fishery Harbours Located in the Southern Province of Sri Lanka. J. Environ. Prof. Sri Lanka 2015, 4, 36–46. [Google Scholar] [CrossRef]
  8. Gunbak, R.A.; Gokce, T.K.; Guler, I. Sedimentation and Erosion Problems of Yakakent Fishery Harbour. In Proceedings of the 23rd International Conference on Coastal Engineering, Venice, Italy, 4–9 October 1992; Volume 3. [Google Scholar]
  9. Süme, V. Grain Size and Beach Formation Characteristic at the T-Head Groins System at Kiyicik, Turkey (Eastern Black Sea). J. Civ. Environ. Eng. 2014, 4, 1000150. [Google Scholar] [CrossRef]
  10. Süme, V.; Yüksek, Ö. Investigation of Shoaling of Coastal Fishery Structures in the Eastern Black Sea Coasts. J. Fac. Eng. Archit. Gazi Univ. 2018, 33, 843–852. [Google Scholar] [CrossRef]
  11. Sharaan, M.; Ibrahim, M.G.; Iskander, M.; Masria, A.; Nadaoka, K. Analysis of Sedimentation at the Fishing Harbor Entrance: Case Study of El-Burullus, Egypt. J. Coast. Conserv. 2018, 22, 1143–1156. [Google Scholar] [CrossRef]
  12. Kudale, A.M.; Sohoni, V.S.; Patil, B.M.; Mahalingaiah, A.V. Hydraulic Modelling for the Design of Fisheries Harbours. Int. J. Civ. Eng. Technol. 2018, 9, 356–371. [Google Scholar]
  13. Klante, C. Sediment Transport and Bathymetric Change at Hornafjörður Tidal Inlet—Field Data Analysis and Mathematical Modeling. H2-. Master’s Thesis, Lund University, Lund, Sweden, 2018. [Google Scholar]
  14. Yazir, D.; Şahin, B.; Eruz, C. Evaluation of Sediment Transportation Processes in Designing Coastal Structures of Araklı. Pamukkale Univ. J. Eng. Sci. 2018, 24, 1005–1013. [Google Scholar] [CrossRef]
  15. Maiti, D.K.; Sundar, V.; Sannasiraj, S.A. Design of a Minor Fishing Harbor in India with Special Reference to Training of the Mouth of River Chapora. In Proceedings of the Fifth International Conference in Ocean Engineering (ICOE 2019), Madras, India, 28 July–1 August 2019; Volume 106 LNCE. [Google Scholar]
  16. Johnson, H.N. Sedimentation solutions for the port of Pascagoula. Master’s Thesis, Mississippi State University, Starkville, MS, USA, 2008. [Google Scholar]
  17. Süme, V.; Yüksek, Ö.; Şişik, E. The Granulometric Analysis of Sediments That Cause of Shoaling to Depositing in Fishery Harbours. Tur. J. Hyd. 2019, 3, 7–13. [Google Scholar]
  18. Süme, V.; Yüksek, T.; Kaya, A. A Case Study on the Usability of T- Head Groins as Beach at Trabzon and Rize Coasts. Gümüşhane Univ. J. Sci. Inst. 2019, 9, 610–619. [Google Scholar] [CrossRef]
  19. Fernández-Fernández, S.; Ferreira, C.C.; Silva, P.A.; Baptista, P.; Romão, S.; Fontán-Bouzas, Á.; Abreu, T.; Bertin, X. Assessment of Dredging Scenarios for a Tidal Inlet in a High-Energy Coast. J. Mar. Sci. Eng. 2019, 7, 395. [Google Scholar] [CrossRef]
  20. Liu, H.; Xu, K.; Ou, Y.; Bales, R.; Zang, Z.; Xue, Z.G. Sediment Transport near Ship Shoal for Coastal Restoration in the Louisiana Shelf: A Model Estimate of the Year 2017–2018. Water 2020, 12, 2212. [Google Scholar] [CrossRef]
  21. Hao, X.; Cao, T.; Shen, L. Mechanistic Study of Shoaling Effect on Momentum Transfer between Turbulent Flow and Traveling Wave Using Large-Eddy Simulation. Phys. Rev. Fluids 2021, 6, 054608. [Google Scholar] [CrossRef]
  22. Karasu, S.; Marangoz, H.O.; Kocapir, B.H.; Yilmaz, E.; Özölçer, İ.H.; Akpinar, A. Monitoring Sediment Transport in Certain Harbor Launches in the Southeastern Black Sea. Water 2023, 15, 3860. [Google Scholar] [CrossRef]
  23. AlMashan, N.; Al-Attar, I.; Neelamani, S. Assessment of Annual Sedimentation into Failaka Marina (Kuwait) and Possible Solutions for Reduction of Siltation. J. Coast. Res. 2024, 40, 527–553. [Google Scholar] [CrossRef]
  24. Wang, C.; Li, Q.; Liu, Y.; Wu, G.; Liu, P.; Ding, X. A Comparison of Waveform Processing Algorithms for Single-Wavelength LiDAR Bathymetry. ISPRS J. Photogramm. Remote Sens. 2015, 101, 22–35. [Google Scholar] [CrossRef]
  25. Jagalingam, P.; Akshaya, B.J.; Hegde, A.V. Bathymetry Mapping Using Landsat 8 Satellite Imagery. Procedia Eng. 2015, 116, 560–566. [Google Scholar] [CrossRef]
  26. Bergsma, E.W.J.; Almar, R.; Rolland, A.; Binet, R.; Brodie, K.L.; Bak, A.S. Coastal Morphology from Space: A Showcase of Monitoring the Topography-Bathymetry Continuum. Remote Sens. Environ. 2021, 261, 112469. [Google Scholar] [CrossRef]
  27. Fan, D.; Li, S.; Feng, J.; Sun, Y.; Xu, Z.; Huang, Z. A New Global Bathymetry Model: STO_IEU2020. Remote Sens. 2022, 14, 5744. [Google Scholar] [CrossRef]
  28. Ashphaq, M.; Srivastava, P.K.; Mitra, D. Review of Near-Shore Satellite Derived Bathymetry: Classification and Account of Five Decades of Coastal Bathymetry Research. J. Ocean. Eng. Sci. 2021, 6, 340–359. [Google Scholar] [CrossRef]
  29. Evagorou, E.; Argyriou, A.; Papadopoulos, N.; Mettas, C.; Alexandrakis, G.; Hadjimitsis, D. Evaluation of Satellite-Derived Bathymetry from High and Medium-Resolution Sensors Using Empirical Methods. Remote Sens. 2022, 14, 772. [Google Scholar] [CrossRef]
  30. Zhong, J.; Sun, J.; Lai, Z.; Song, Y. Nearshore Bathymetry from ICESat-2 LiDAR and Sentinel-2 Imagery Datasets Using Deep Learning Approach. Remote Sens. 2022, 14, 4229. [Google Scholar] [CrossRef]
  31. Lubac, B.; Burvingt, O.; Nicolae Lerma, A.; Sénéchal, N. Performance and Uncertainty of Satellite-Derived Bathymetry Empirical Approaches in an Energetic Coastal Environment. Remote Sens. 2022, 14, 2350. [Google Scholar] [CrossRef]
  32. Salameh, E.; Frappart, F.; Almar, R.; Baptista, P.; Heygster, G.; Lubac, B.; Raucoules, D.; Almeida, L.P.; Bergsma, E.W.J.; Capo, S.; et al. Monitoring Beach Topography and Nearshore Bathymetry Using Spaceborne Remote Sensing: A Review. Remote Sens. 2019, 11, 2212. [Google Scholar] [CrossRef]
  33. Janowski, L.; Wroblewski, R.; Rucinska, M.; Kubowicz-Grajewska, A.; Tysiac, P. Automatic Classification and Mapping of the Seabed Using Airborne LiDAR Bathymetry. Eng. Geol. 2022, 301, 106615. [Google Scholar] [CrossRef]
  34. Alevizos, E.; Oikonomou, D.; Argyriou, A.V.; Alexakis, D.D. Fusion of Drone-Based RGB and Multi-Spectral Imagery for Shallow Water Bathymetry Inversion. Remote Sens. 2022, 14, 1127. [Google Scholar] [CrossRef]
  35. Ludka, B.C.; Guza, R.T.; O’Reilly, W.C.; Merrifield, M.A.; Flick, R.E.; Bak, A.S.; Hesser, T.; Bucciarelli, R.; Olfe, C.; Woodward, B.; et al. Sixteen Years of Bathymetry and Waves at San Diego Beaches. Sci. Data 2019, 6, 161. [Google Scholar] [CrossRef]
  36. Cesbron, G.; Melet, A.; Almar, R.; Lifermann, A.; Tullot, D.; Crosnier, L. Pan-European Satellite-Derived Coastal Bathymetry—Review, User Needs and Future Services. Front Mar. Sci. 2021, 8, 740830. [Google Scholar] [CrossRef]
  37. Duplančić Leder, T.; Baučić, M.; Leder, N.; Gilić, F. Optical Satellite-Derived Bathymetry: An Overview and WoS and Scopus Bibliometric Analysis. Remote Sens. 2023, 15, 1294. [Google Scholar] [CrossRef]
  38. Amini, L.; Kakroodi, A.A. Bathymetry Monitoring of Shallow Coastal Environment Using Remote Sensing Data. Remote Sens. Appl. 2024, 36, 101255. [Google Scholar] [CrossRef]
  39. Thom, B.G.; Hall, W. Behaviour of Beach Profiles during Accretion and Erosion Dominated Periods. Earth Surf. Process. Landf. 1991, 16, 113–127. [Google Scholar] [CrossRef]
  40. Westoby, M.J.; Brasington, J.; Glasser, N.F.; Hambrey, M.J.; Reynolds, J.M. ‘Structure-from-Motion’ Photogrammetry: A Low-Cost, Effective Tool for Geoscience Applications. Geomorphology 2012, 179, 300–314. [Google Scholar] [CrossRef]
  41. Barnard, P.L.; van Ormondt, M.; Erikson, L.H.; Eshleman, J.; Hapke, C.; Ruggiero, P.; Adams, P.N.; Foxgrover, A.C. Development of the Coastal Storm Modeling System (CoSMoS) for Predicting the Impact of Storms on High-Energy, Active-Margin Coasts. Nat. Hazards 2014, 74, 1095–1125. [Google Scholar] [CrossRef]
  42. Brodie, K.L.; Palmsten, M.L.; Hesser, T.J.; Dickhudt, P.J.; Raubenheimer, B.; Ladner, H.; Elgar, S. Evaluation of Video-Based Linear Depth Inversion Performance and Applications Using Altimeters and Hydrographic Surveys in a Wide Range of Environmental Conditions. Coast. Eng. 2018, 136, 147–160. [Google Scholar] [CrossRef]
  43. Gesto, M.; Jokumsen, A. Effects of Simple Shelters on Growth Performance and Welfare of Rainbow Trout Juveniles. Aquaculture 2022, 551, 737930. [Google Scholar] [CrossRef]
  44. Gazioğlu, C.; Simav, Ö.; Seker, D.Z.; Tanik, A. Determining The Endangered Fields Of Turkish Coasts With Coastal Vulnerability Index. In Proceedings of the TMMOB Geographic İnformation Systems Congress, Ankara, Turkey, 11 November 2013. [Google Scholar]
  45. Dolfen Engineering Ltd.; Dolsar Engineering Ltd. Fishery Coastal Structures Situation and Needs Analysis—1; Republic of Turkey Ministry of Transportation General Directorate of Railways, Ports And Airports (DLH) Construction Dolfen Engineering Ltd.: Ankara, Turkey, 2011. Available online: https://www.uab.gov.tr/uploads/pages/kutuphane/56203e35a7c75e0-5ea041c13e035.pdf (accessed on 23 March 2025). (In Turkish)
  46. Van Vledder, G.P.; Akpinar, A. Wave Model Predictions in the Black Sea: Sensitivity to Wind Fields. Appl. Ocean. Res. 2015, 53, 161–178. [Google Scholar] [CrossRef]
  47. Karasu, S.; Marangoz, H.O.; Gülkaya, E.; Akpınar, A.; Ceylan, Y.; Yılmaz, E. Performance based assessment of a small-scale artificially nourished beach. Ocean. Coast. Manag. 2023, 244, 106827. [Google Scholar] [CrossRef]
  48. Ozhan, E.; Abdalla, S. Wind and Deep Water Wave Atlas for Turkish Coast; METU Publishing: Ankara, Turkey, 2002; SN: 9789754291902; Available online: https://books.google.com.tr/books?id=7ViNAQAACAAJ (accessed on 23 March 2025). (In Turkish)
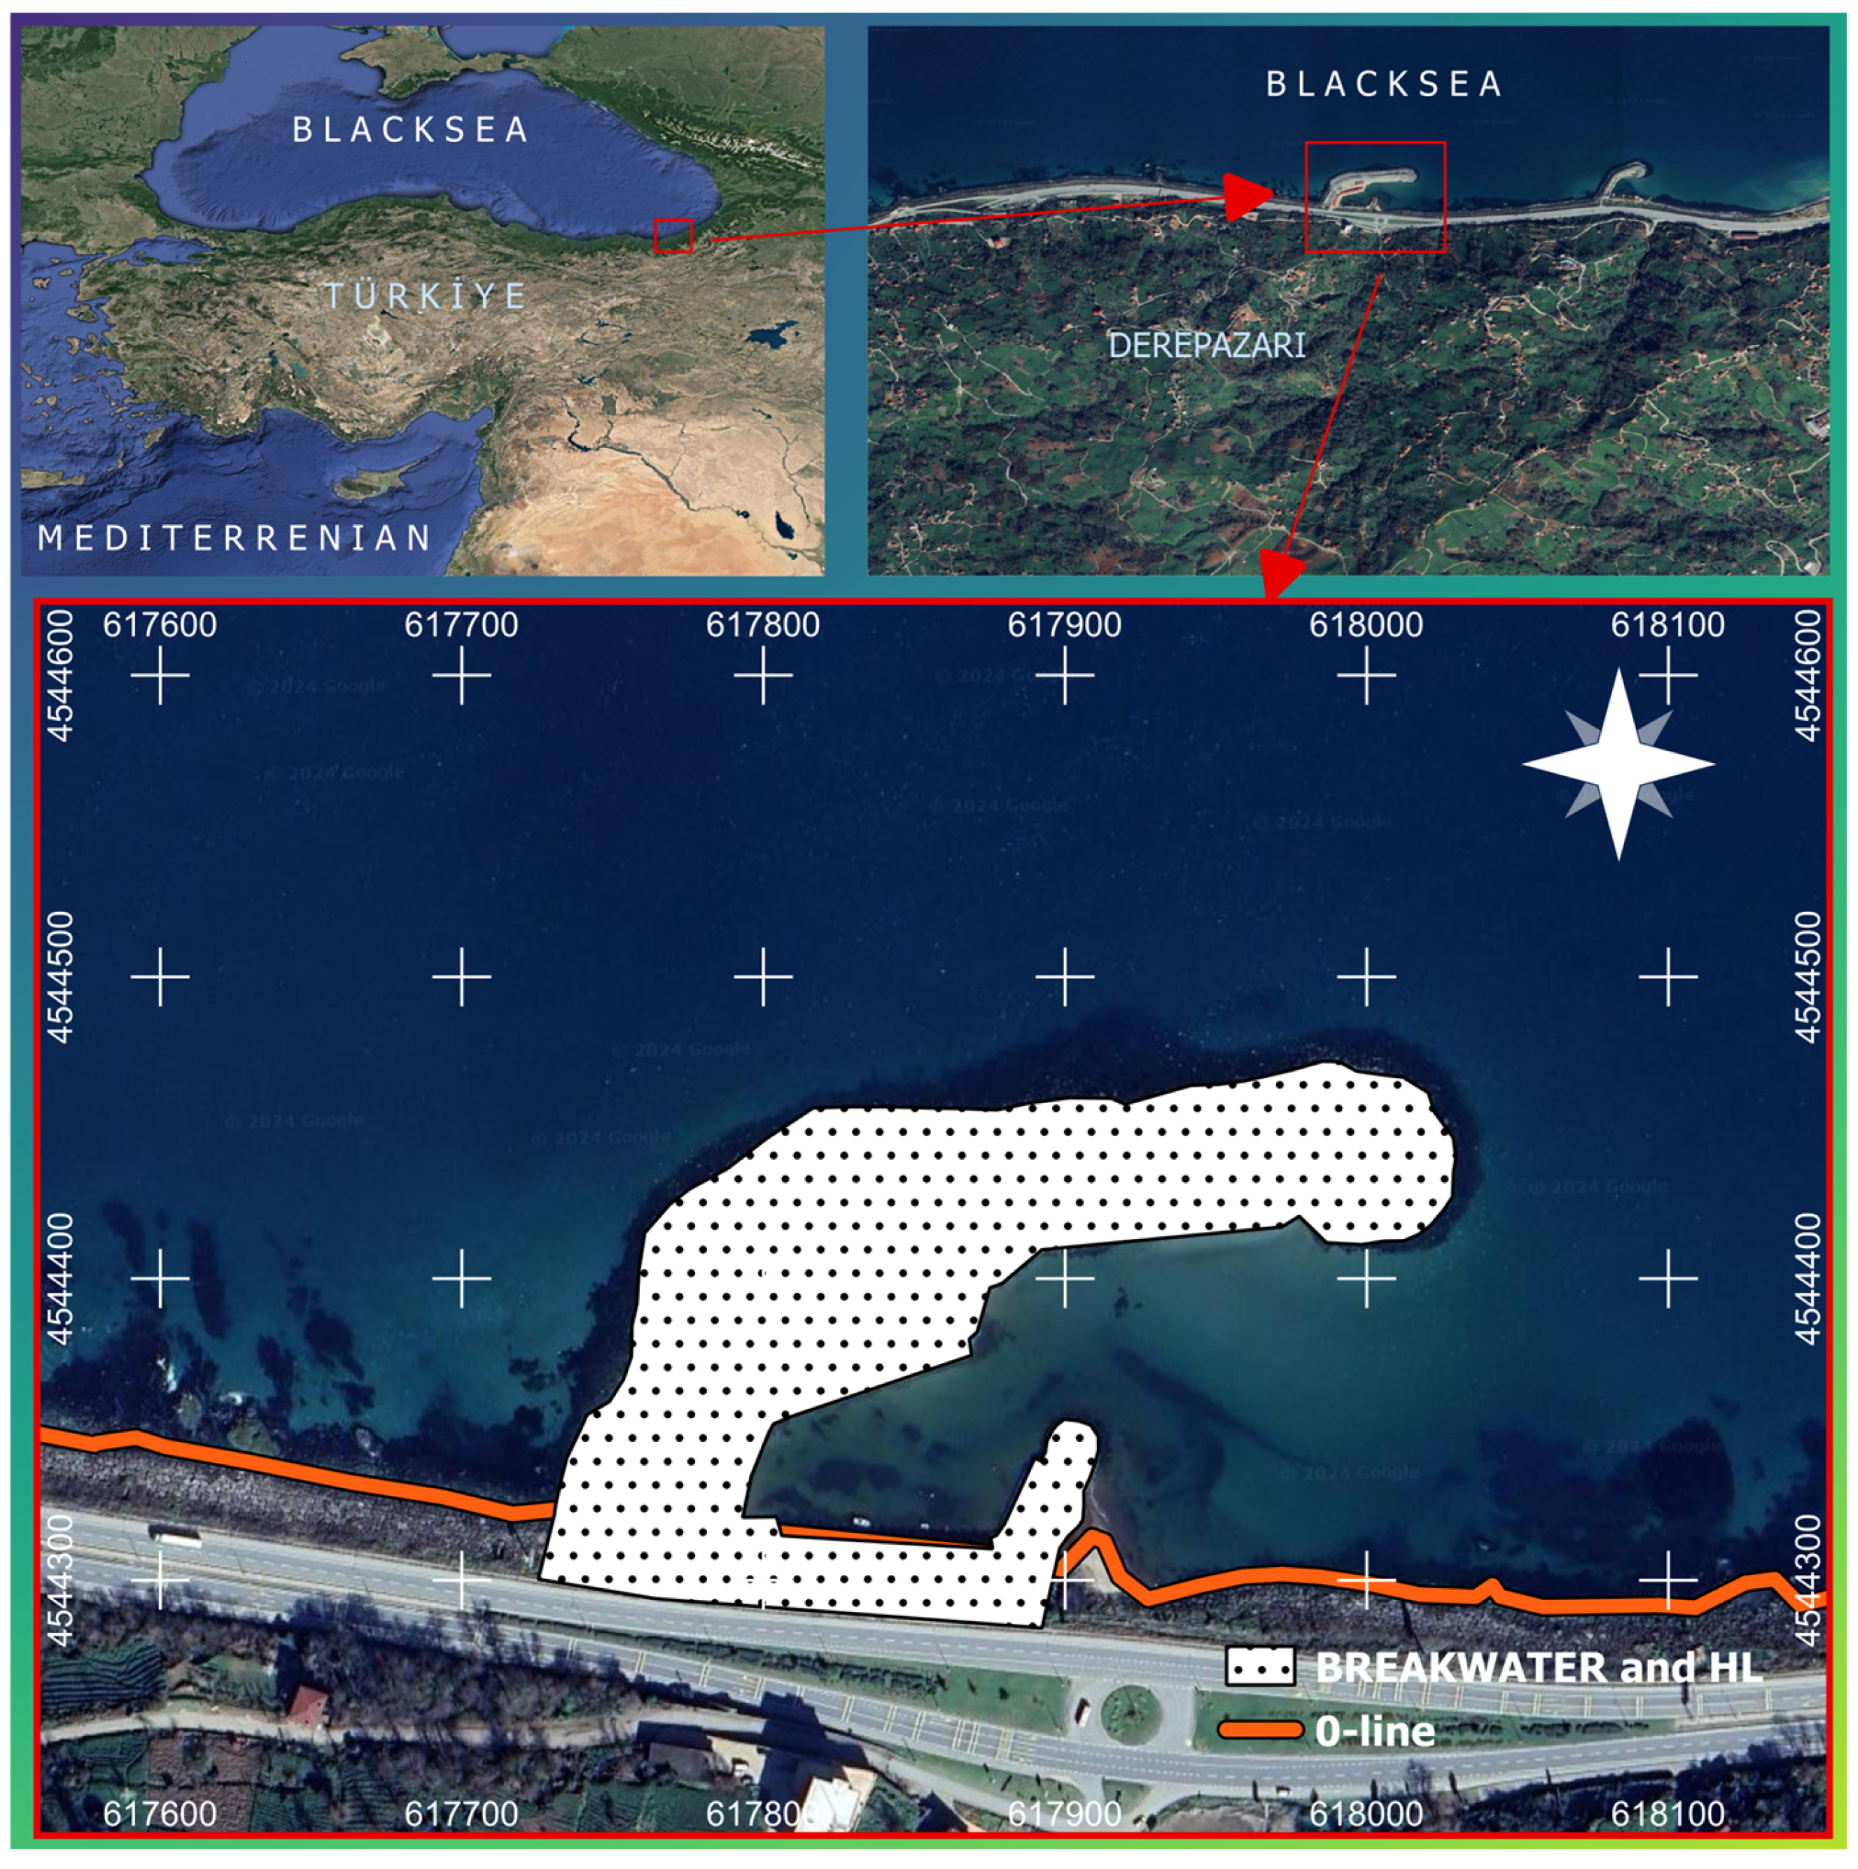
Figure 1. The study area located in Derepazarı, Sandıktaş, Rize, Turkey. HL indicates the harbor launch. The breakwater and harbor launch are both represented by black dots on a plain white background. The cross symbols (+) indicate grid intersections (graticules) spaced at 100-m intervals, which are used to reference coordinates and provide spatial orientation on the map.
Jmse 13 00779 g001
Figure 2. Twenty-year physical changes in Sandıktaş fishery shelter from 2003 to 2023. The left-most upper image is from 2003, while the right-most upper image belongs to 2009; in the same order, images are classified as 2014, 2017, 2019, and 2023 for the years. Satellite imagery source: Google Earth (accessed on 10 May 2024). Visualized and annotated by authors.
Jmse 13 00779 g002
Figure 3. A bathymetric survey in the fishery shelter (left) and vertical coordinate measurement on the cross-shore (right). In the left image, the red arrow indicates the GPS–transducer position. A is the length from the transducer to above sea level (known as transducer draft—TD). C refers to the position of GPS from above sea level. B is the total distance from the transducer to the GPS. D shows the distance from the echo-sounder to the seabed. MSL indicates the mean sea level.
Jmse 13 00779 g003
Figure 4. Surveyed area and lines for the boat route. The color legend represents the depth in meters. The cross symbols (+) indicate grid intersections (graticules) spaced at 100-m intervals, which are used to reference coordinates and provide spatial orientation on the map.
Jmse 13 00779 g004
Figure 5. Sample points in the fishery shelter of Sandıktaş. Orange triangles show the sample point, while the red outlined regions show the sample group.
Jmse 13 00779 g005
Figure 6. Granulometry curves of sediment samples (Regions A, B, C, D, E, F, G, and H).
Jmse 13 00779 g006
Figure 7. Bathymetric maps from the study area. Respectively, (af) represent the season in 2019 (winter), 2020 (winter), 2021 (summer), 2021 (winter), 2022 (summer), and 2022 (winter). Accordingly, BW denotes the “breakwater”, while HL is the harbor launch/harbor shelter. All depths are given in meters. BW and HL indicate the breakwater and harbor launch, respectively. The breakwater and harbor launch are both represented by black dots on a plain white background. The cross symbols (+) indicate grid intersections (graticules) spaced at 100-m intervals.
Jmse 13 00779 g007
Figure 8. Bathymetric difference maps obtained from the study area ((a–e)). All maps indicate the bathymetric differences from 2019 (winter). Therefore, (a)—2020 (winter), (b)—2020 (winter), (c)—2021 (summer), (d)—2021 (winter), (e)—2022 (summer), and (f)—2022 (winter). BW and HL indicate the breakwater and harbor launch, respectively. The breakwater and harbor launch are both represented by black dots on a plain white background. The cross symbols (+) indicate grid intersections (graticules) spaced at 100-m intervals.
Jmse 13 00779 g008
Figure 9. The route from which the section was taken and the A-A section. S represents the survey number, while the section location is displayed in the bottom-right corner of the map. The distance measurement starts from the top of the map. The red outline marker indicates the mean survey area across all surveys. S1 to S7 represent the survey dates of 12 November 2019, 2 September 2020, 10 October 2020, 16 July 2021, 30 October 2021, 27 April 2022, and 29 September 2022, respectively.
Jmse 13 00779 g009
Figure 10. Mann–Kendall test for the significance of the trend. The horizontal red axis defines the significance level (0.05). The area axis numbers represent the A, B, C, D, E, F, G, and H regions, respectively.
Jmse 13 00779 g010
Figure 11. Temporal trends of sediment grain size parameters are based on the Mann–Kendall test. The area axis represents the A, B, C, D, E, F, G, and H regions, respectively.
Jmse 13 00779 g011
Table 1. Surveying dates in the study area. S refers to the survey, while D denotes the dredging operations.
Survey/Dredging No.DateSeasonal Explanation
D112 July 2019Summer
S112 November 2019Winter
S22 September 2020Winter
D21 October 2020Winter
S310 October 2020Winter
S416 July 2021Summer
S530 October 2021Winter
D32 January 2022Winter
S627 April 2022Summer
S729 September 2022Winter
Table 2. Evaluation of soil samples according to the USCS soil classification system; Cu and Cc parameters are known as the coefficient of uniformity and coefficient of curvature, respectively. (SP: Poorly Graded Sand, TS EN ISO 14688-2.)
Samp. PointsDate/SeasonSample Weight (gr)d10 (mm)d30 (mm)d50 (mm)d60 (mm)d90 (mm)CuCcUSCS
Soil Class
A (1,2,3,4)2019 (winter)1336.10.160.360.480.530.883.311.53SP
2020 (winter)1168.750.210.370.490.570.882.711.14SP
2021 (summer)9400.280.40.550.661.352.360.87SP
2021 (winter)1171.60.330.480.610.680.952.061.03SP
2022 (summer)1015.60.30.440.620.914.733.030.71SP
2022 (winter)807.50.290.460.560.711.842.451.03SP
B (5,6)2019 (winter)1104.160.290.40.520.590.92.030.94SP
2020 (winter)1467.50.290.420.540.610.882.101.00SP
2021 (summer)1150.90.310.420.470.51.341.611.14SP
2021 (winter)11100.330.480.60.670.942.031.04SP
2022 (summer)1373.880.310.460.650.82.952.580.85SP
2022 (winter)1118.70.310.430.490.581.541.871.03SP
C (7,8)2019 (winter)1315.960.210.30.340.370.491.761.16SP
2020 (winter)13400.220.290.340.360.441.641.06SP
2021 (summer)285.30.220.30.340.360.481.641.14SP
2021 (winter)295.50.220.310.340.360.411.641.21SP
2022 (summer)451.980.240.330.380.40.611.671.13SP
2022 (winter)421.60.230.330.380.410.811.781.15SP
D (9,10)2019 (winter)607.20.220.260.310.340.471.550.90SP
2020 (winter)8700.180.280.340.360.52.001.21SP
2021 (summer)1037.30.220.320.40.440.792.001.06SP
2021 (winter)6870.270.350.420.460.811.700.99SP
2022 (summer)934.90.250.350.440.460.881.841.07SP
2022 (winter)724.20.280.360.430.470.911.680.98SP
E (11,12,13,14)2019 (winter)635.80.180.240.30.330.471.830.97SP
2020 (winter)998.750.210.290.350.380.651.811.05SP
2021 (summer)1115.90.230.350.430.460.982.001.16SP
2021 (winter)10510.310.410.570.671.252.160.81SP
2022 (summer)818.10.260.350.430.461.081.771.02SP
2022 (winter)797.90.260.350.430.461.061.771.02SP
F (15,16)2019 (winter)770.70.270.350.420.450.721.671.01SP
2020 (winter)956.30.30.370.450.480.871.600.95SP
2021 (summer)509.70.270.360.440.460.791.701.04SP
2021 (winter)256.50.250.340.40.440.881.761.05SP
2022 (summer)776.30.280.350.410.440.81.570.99SP
2022 (winter)936.450.30.380.450.490.91.630.98SP
G (17,18,19,20,21,22)2019 (winter)825.20.30.360.430.460.751.530.94SP
2020 (winter)818.890.310.410.480.540.951.741.00SP
2021 (summer)799.800.320.440.480.530.891.661.14SP
2021 (winter)690.840.350.470.570.640.91.830.99SP
2022 (summer)599.800.330.440.470.480.931.451.22SP
2022 (winter)632.500.340.440.470.490.941.441.16SP
H (23,24,25,26)2019 (winter)921.200.290.380.460.51.181.721.00SP
2020 (winter)979.900.310.410.490.613.641.970.89SP
2021 (summer)505.560.30.480.791.031.73.430.75SP
2021 (winter)868.750.360.540.891.3711.573.810.59SP
2022 (summer)773.200.330.480.911.4311.724.330.49SP
2022 (winter)1108.400.340.480.861.369.224.000.50SP
Table 3. Volumetric changes in the study area. Negative difference value represents erosion, while deposition is obtained in the other situation between the dates.
Measurement DatesBathymetric Change (m)Volumetric Change (m3)
ErosionShoaling (Deposition)Difference
2019 (Winter)–2020 (Winter)−0.0410,987.896631.06−4356.83
2019 (Winter)–2021 (Summer)0.097997.0821,089.2213,092.14
2019 (Winter)–2021 (Winter)0.0311,390.5515,596.224205.67
2019 (Winter)–2022 (Summer)0.0028,564.5728,266.12−298.45
Disclaimer/Publisher’s Note: The statements, opinions and data contained in all publications are solely those of the individual author(s) and contributor(s) and not of MDPI and/or the editor(s). MDPI and/or the editor(s) disclaim responsibility for any injury to people or property resulting from any ideas, methods, instructions or products referred to in the content.