Article

Transient Power Stabilization in Marine Microgrids: Improved Droop Control and Feedforward Strategies for Heterogeneous Gas Turbines with Hybrid Energy Storage

1
College of Power Engineering, Naval University of Engineering, Wuhan 430033, China
2
Shanghai Marine Diesel Engine Research Institute, Shanghai 201108, China
*
Author to whom correspondence should be addressed.
J. Mar. Sci. Eng. 2025, 13(4), 771; https://doi.org/10.3390/jmse13040771
Submission received: 27 February 2025 / Revised: 9 April 2025 / Accepted: 10 April 2025 / Published: 12 April 2025
(This article belongs to the Section Marine Energy)

Abstract

:
To address the complexity of power allocation in parallel operation systems combining single-shaft and split-shaft gas turbine generators, this paper proposes a coordinated power allocation strategy based on enhanced voltage droop control for marine power systems integrated with hybrid energy storage comprising flywheel and battery subsystems. Furthermore, to mitigate significant power sharing deviations during transient/pulsed load conditions in shipboard application, a feedforward compensation strategy is developed. Simulation results demonstrate that the improved droop control maintains power sharing deviations below 3.5% across steady-state operations and gradual load variations, ensuring system stability and balanced power distribution. However, abrupt load changes induce over 20% deviations, compromising parallel operation reliability. The proposed feedforward compensation strategy effectively restricts deviations within 4% under specified transient and pulsed load scenarios, satisfying both parallel operation criteria and grid power quality requirements. Validation is performed on a parallel system comprising two distinct gas turbine configurations.

1. Introduction

The marine DC power generation system of micro gas turbines is an independent system featuring multiple power sources and multiple loads. The system usually consists of multiple generator sets, different energy storage devices, and various types of loads. Compared with other DC micro-grids, the marine DC micro-grid is an islanded grid with low capacity and small inertia [1,2,3,4,5,6,7]. The propulsion load fluctuates frequently, and there are different forms of pulsed loads, so the stability of the system is easily affected. To improve the stability of the marine power system and to ensure the stable operation of the entire ship, one of the key issue is to coordinate the operation among the prime movers of the marine DC micro-grid, the power grid, the loads, and the energy storage device, that is, the coordinated operation of the generator, grid, load, and energy storage. In the marine DC micro-grid, the central controller monitors the dynamic power in real time and optimizes the operation of the system. The control units of each subsystem in the generator-grid-load-storage receive and execute the optimized values of the reference power. Through the coordinated cooperation between the central controller and the controllers of each subsystem, the coordinated control of the generator-grid-load-storage in the marine DC micro-grid is achieved, meeting the power quality requirements of different electrical loads and ensuring the stable operation of the marine DC micro-grid under different working conditions. Micro gas turbines, as prime movers for power generation, are characterized by high power density, reliability, and efficiency and low maintenance and emissions, capable of utilizing various energy fuels like fossil fuels and natural gas. They are widely applied in shipboard power systems, distributed energy systems, and the related fields [8,9,10,11].
Sun et al. [12] conceived a coordinated control mechanism for power sources, external loads, and energy storage devices in a DC micro-grid system. The core concept of this mechanism is to manage the system by zoning according to the fluctuation of the voltage of the DC bus. For different operating regions, dedicated control schemes for the energy storage system (ESS) and power sources are formulated to achieve the effective dispatch of the micro-grid. Van et al. [13] proposed an energy management scheme based on the model’s predictive control to optimize the energy distribution between the ESS and the generator sets under high power ramp load conditions, thereby meeting the energy demands of pulsed loads.
Most of these studies focus on the control strategies of the energy storage device. By continuously optimizing these strategies, it is possible to improve the response speed of the ESS. However, during the research process, the performance of power generating gas turbines is seldom taken into account; alternatively, the characteristics of gas turbines are greatly simplified. This leads to a disconnection between the mechanical system represented by power generating gas turbines and the backend electrical system in the power grid.
In an actual power generation system, sudden changes in external loads can also cause abrupt changes in the power output of the micro gas turbine. In this case, the stability of the micro gas turbine, as well as the performance characteristics of the micro grid, are all affected by the load changes. Therefore, for a DC power grid system, the coordinated control among the power generating gas turbine engines, the power grid, the loads, and the energy storage devices, namely, the coordinated control of the generator, grid, load, and storage, is a crucial measure to comprehensively improve power grid performance and ensure the stable operation of the system.
In existing research, some scholars have taken notice of this issue and studied the coordinated relationships among power generation prime movers, the power grid, loads, and energy storage devices from different perspectives. To solve the problem of micro gas turbines’ slow response to pulsed and high-power loads, Refs. [14,15,16] incorporated supercapacitors into the micro gas turbine power generator set (GTPGS). A fast power coordinated control method based on the output power prediction of micro gas turbine engines was proposed, enabling the reasonable distribution of sudden change power loads between micro gas turbines and the energy storage system. This predictive approach also enhanced the response speed of supercapacitors to transient power. Bellache et al. [17] applied batteries and supercapacitors to a fully electric propulsion ship driven by a diesel engine generator. They used a frequency distribution method to divide the load demand into high-, average-, and low-frequency components. The supercapacitors were assigned to handle the high-frequency components, the batteries were tasked with dealing with the average-frequency components, and the diesel engine generator was responsible for responding to the low-frequency components. By maintaining the rate of change in the diesel engine’s speed within the reference range, the good efficiency of the diesel engine was ensured. Meanwhile, this method could also reduce the impact of load changes on the diesel engine.
In a diesel engine power generation system, Xiao et al. [18] linked a hybrid energy storage system (HESS) made up of batteries and supercapacitors to the DC side of the bow-thruster drive system. Considering the fuel consumption traits of the diesel engine and the complementary features of the batteries and supercapacitors, the diesel engine generator set provided the average power required by the bow thruster. Meanwhile, the batteries and supercapacitors served as energy buffers across various time scales. To manage the bidirectional converters of the energy storage system, a hierarchical controller was put forward. Simulations verified the effectiveness of this control strategy. These studies distributed the sudden-change load power to the prime movers and the energy storage system according to their characteristics, fully utilizing the regulating characteristics of the prime movers for power generation and reducing the frequent operation of the ESS. However, they lacked active control over the external loads. Wang et al. [19] designed a power balance strategy for the coordinated operation of power sources, loads, and energy storage in an electro-thermal micro-grid system with a high penetration rate. This strategy aimed to mitigate the power fluctuations on the interconnection lines between the micro-grid and the main grid, especially the power peak–valley difference and short-term fluctuations. By adjusting the micro gas turbines, heat pump units, and supercapacitors in real time, the fluctuating power of the tie line was suppressed. Additionally, this strategy included dynamically adjusting the power balance target according to the real time operating states of various energy devices to optimize the smoothness of the tie line power. Li et al. [20] carried out an in-depth study on the control strategy and the coordinated operation of marine gas turbine power generation systems functioning under pulsed load conditions. Moreover, they put forward a brand new power allocation strategy for hybrid energy storage systems, which was founded on variational mode decomposition.
Current research efforts mainly focus on the control issues of energy storage system, with relatively little attention been paid to the coordinated control of the prime mover and the generator -grid-load-storage in the micro-grid. In the research considering the prime mover, only some components in the micro-grid are coordinated and controlled, and the coordinated control of the generator-grid-load-storage device in the micro-grid based on the prime mover has not been achieved yet. Moreover, most of the existing research uses diesel engines as the prime movers for power generation, and there is relatively little research on DC micro-grids with gas turbine engines as power generation prime movers. To sum up, when discussing the multi-source coordinated control strategy for marine DC micro-grids, it is necessary to deeply analyze the synergistic and complementary effects and the technological synergistic advantages among the generator, power supply network, loads, and energy storage devices in the marine power generation system. This is to ensure the real-time power balance in the micro-grid and that the power system can provide high-quality power supply to the loads. Based on this, this paper intends to explore the influence of sudden load changes and pulsed loads on micro-gas turbines and formulate a coordinated control strategy for the generator-grid-load-storage system in the micro GTPGS. The power distribution among generator sets is also a crucial issue in the coordinated control and operation of the marine gas turbine DC power generation system. The existing research on power distribution among generator sets in DC power systems faces the following problems:
Firstly, the existing research mainly focuses on dual-generator-set configurations composed of diesel generators [21,22,23,24], as well as those composed of diesel generators and gas turbine generators [25,26]. There is little published research regarding the power distribution for two different types of gas turbine generator sets operating in parallel in the open literature.
Secondly, the existing research either fails to pay attention to the transient power distribution deviation or the effect of improving it is not obvious. Ref. [26] adopted the method of output current negative feed forward for the generator set with a faster response speed, reducing the transient power distribution deviation. However, the tuning effect is rather limited, and it only addresses small power load mutations, without considering the cases of large-power load mutations and the switching of pulsed loads. Ref. [27] proposed a control strategy of improved droop control for average current sharing, which improved the power distribution deviation in the steady-state configuration, but did not consider the transient power distribution deviation.
Thirdly, the existing research does not take into account the influence of the different characteristics of the prime movers on power generation. Ref. [28] proposed a control strategy of droop control and virtual DC generator to address the issues of system inertia and damping, reducing the parallel voltage fluctuations. However, it did not pay attention to the current distribution between the two generator sets. Moreover, it simplified the power generation part, without considering the influence of the characteristics of the prime movers on the power distribution during the parallel operation of generator sets. Ref. [29] proposed an improved secondary control method for communication delay and line impedance, improving the current-sharing effect during step-load changes. However, the improvement effect is not significant, and it also does not consider the influence of different characteristics of the power generation prime movers.
To address the above-mentioned issues, this paper takes the marine micro GTPGS composed of a single-shaft gas turbine generator, a split-shaft gas turbine generator, and a hybrid energy storage system (HESS) as the research object. The primary research objective is to explore the overall power sharing strategy for the power system and address the problem of excessive power distribution disparities among different types of gas turbine generator sets. In addition, through simulations and experiments, the effectiveness of the control strategies proposed in this paper has been verified. Compared with Refs. [26,27,28,29], the present paper specially explored the mutation effect of high-power load and pulsed load with the combination of feedforward and droop control, where heterogeneous prime movers with different structures and different powers are considered.
The main contributions of this study can be summarized as follows:
  • To address the complex power allocation in heterogeneous single-shaft and split-shaft gas turbine generator parallel operation systems, an inter-unit power sharing strategy based on improved voltage droop control is proposed.
  • A feedforward-integrated power sharing strategy is developed to resolve the significant power mismatch in two-unit parallel-operating systems with hybrid energy storage under Sudden load and rectangular-wave pulsed load changes.
  • A comprehensive analysis is conducted on the synergistic complementarity and technical advantages among generators, power grids, loads, and energy storage devices in marine gas turbine power generation systems.
  • Good power distribution between units and reasonable distribution of system power can be achieved. In steady-state conditions, and when the propulsion load increases or decreases, the power sharing deviation between units is less than 3.5%. During sudden load changes and when a pulsed load is connected, the power sharing deviation between units is less than 4%.
The research content of this paper is arranged as follows. In Section 2, a power system model composed of two parallel-operating gas turbine generator sets and incorporating a hybrid energy storage system is introduced. Section 3 delves into the system power sharing strategy based on improved voltage droop control, and it analyzes the performance characteristics of the power generating gas turbines, the power system, and the hybrid energy storage under varied propulsion load and sudden change load conditions. In Section 4, a power sharing strategy with feedforward power for the gas turbine power generation system considering hybrid energy storage is further proposed. The performance characteristics of the two-unit parallel-operating power system under Sudden change load and rectangular-wave pulsed load conditions are, respectively, studied, and the improvement of the system power sharing deviation is comparatively analyzed. Section 5 presents the results of the experimental verification. Section 6 presents the conclusion of the full paper.

2. Model of the Power System with Two Gas Turbine Generator Sets Operating in Parallel

The fundamental architecture of the marine micro gas turbine DC power generation system investigated in this paper is depicted in Figure 1. This system primarily comprises two gas turbine generator sets, a hybrid energy storage system, external loads, and a DC distribution network. Specifically, the No. 1 gas turbine generator set is powered by a 200 kW split-shaft gas turbine engine, and the No. 2 gas turbine generator set is driven by a 100 kW single-shaft gas turbine engine.
The HESS is composed of two types of energy storage units. One is a power type unit, which is the flywheel energy storage system (FESS), and the other is an energy type unit, namely, the battery energy storage system. The FESS is connected to the DC bus through a DC/AC inverter. As for the battery pack, it is connected to the DC bus by means of a bidirectional DC/DC converter. The loads in this system can be classified into three groups as follows: daily loads, propulsion loads, and pulsed loads. Unlike the daily loads and pulsed loads, which are linked to the DC bus via DC/DC converters, the propulsion loads are connected to the DC bus with the help of an AC/DC inverter.
This paper mainly focuses on exploring the effects of improved droop control and feedforward strategies for improving the performance of marine microgrids composed of heterogeneous gas turbines with hybrid energy storage. The mathematical descriptions for the components of the DC microgrid are not given out. For more information about the mathematical descriptions either for droop control or for modeling, one can refer to Refs. [4,7,20,28]. The modeling and performance analysis of the marine microgrid are performed using the MATLAB2023B/Simulink platform. Table 1 further gives the major design parameters for the simulation model.

3. Research on Power Sharing Strategy for Parallel Generator Sets Based on Improved Voltage Droop Control

3.1. Power Sharing Strategy Between Parallel Gas Turbine Generator Sets

The stability of the DC bus voltage (DCBV) serves as a crucial metric for evaluating the operational performance and power supply stability of a marine DC power system, which needs to be given priority in the system design process. In a DC micro-grid, since reactive power is not taken into account, the DCBV becomes the only criterion for assessing the power balance within the system. The connection of high-power loads and pulsed loads can lead to transient power imbalance in the system, largely affecting the stability of the DCBV. The frequently employed voltage control methods include master–slave control [30,31,32], droop control [33,34,35,36], and etc.
In the master–slave control method, the bus voltage is usually regulated by a “master module”, while other modules are usually controlled by power control (constant power) or current control (constant current), and the stability of the system is determined by the master unit. The principle of the master–slave control is simple and easy to operate, but it has a high dependence on upper layer communication. Droop control is analogous to incorporating a virtual resistor into the circuit, which enables the distribution of load power across various energy supply units. Refs. [33,34,35], respectively, present an adaptive droop control strategy, an improved transient power allocation method, and a nonlinear droop control approach. These techniques significantly enhance power distribution accuracy, dynamic response, and stability in medium-voltage DC shipboard systems and microgrids through three key innovations as follows: dynamically adjusting droop coefficients, balancing torque impacts with speed transient responses, and generating current references based on voltage square differences. Building upon these advancements, Ref. [36] further integrates IoT technology to achieve SOC balancing control for energy storage units in multi-microgrid systems, thereby expanding the coordination capabilities and applicability of traditional droop control in complex multi-source scenarios. The droop control strategies proposed in these foundational studies provide critical theoretical support for the current research. This paper adopts the droop control methodology to regulate the DCBV, with particular emphasis on analyzing the power sharing discrepancy between two generator units.
Figure 2 illustrates the principle of droop control in the marine DC power system. The relationship between its output voltage U 1 and output current I 1 is as follows:
U 1 = U dc , ref D 1 I 1
Among them, U dc , ref is the DC bus reference voltage, and D 1 is the droop coefficient.
In this paper, there are two parallel gas turbine generator sets, and each gas turbine generator set is equipped with a droop coefficient. Then, for each excitation system that controls the DCBV, the following holds:
U i = U dc , ref D i I i , ( i = 1 , 2 ) U 1 = U 2
From Equation (2), the following can be obtained:
D 1 I 1 = D 2 I 2
From Equation (3), it can be seen that as long as appropriate droop coefficients are set, the excitation system can control the generator to output power proportionally. In the two-generator parallel operation mode of the power system, the two generators usually distribute the system load according to their respective rated powers. This is because each generator operates at the highest efficiency under its rated power. By distributing the load in proportion to the rated power, it can be ensured that each unit can operate close to its designed maximum efficiency state. The relationship between the power P i of each generator and its rated power P i , rate is as follows:
P 1 P 1 , rate = P 2 P 2 , rate
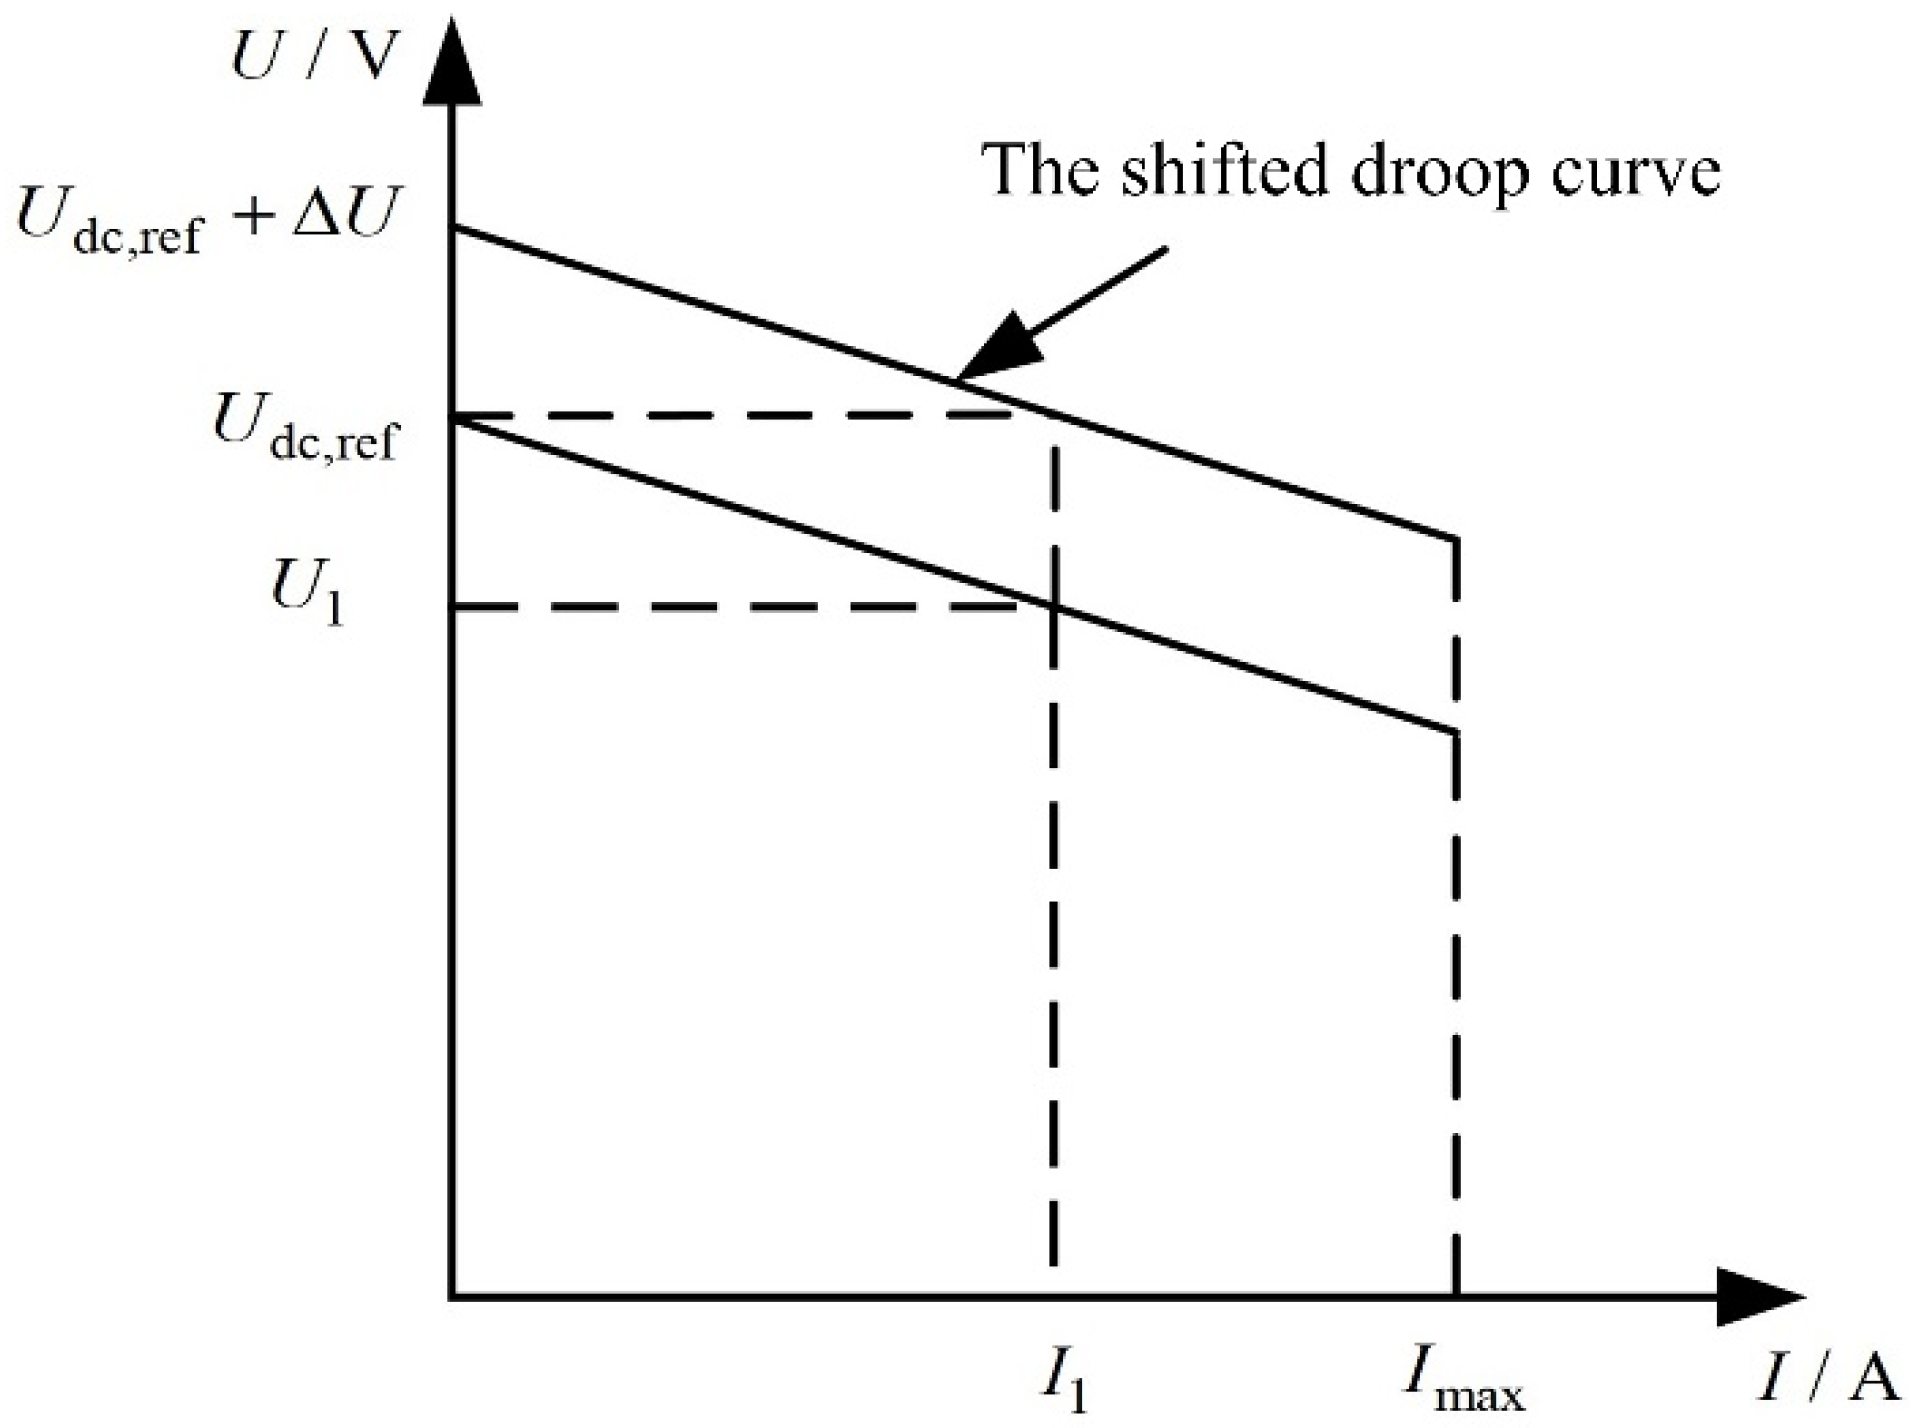
Although traditional droop control can achieve proportional power output among each power generation unit, as the current varies, the DCBV will also change accordingly. As depicted in Figure 3, in order to guarantee that the DCBV remains stable at the rated value, it is essential to shift the droop curve along the vertical axis in accordance with the deviation of the DCBV.
In order to suppress the deviation of steady state voltage, PI compensation is introduced, as shown in Equation (5).
Δ U comp = K p ( U dc , ref U dc ) + K i ( U dc , ref U dc ) d t
where Δ U comp is the amount of compensation, and K p and K i are the parameters of the PI controller.
Then, the amount of compensation obtained by the PI controller is sent to each droop controller [34]. The control structure of the DCBV proposed in this paper is shown in Figure 4. The equation of improved droop control can be expressed as follows:
U dc , i = U dc , ref + Δ U comp D i I i ( i = 1 , 2 )
where U dc , i is the improved voltage.
In this paper, the rated power of the two gas turbine generators are 100 kW and 200 kW, respectively. According to Equation (4), the proportional relationship of the droop control coefficients of each power generation unit can be obtained as follows:
100 D 1 = 200 D 2 D 1 = 2 D 2
In the shipboard power system, when only the excitation system is involved in the regulation of the DCBV, it is generally required that the fluctuation of the DCBV should not exceed ±3% of its rated value [37,38], that is, the minimum value U dc , min and the maximum value U dc , max of the DCBV are required to be 523.8 and 556.2, respectively, and the range of the droop control coefficient D i is expressed as follows [31]:
D i U dc , max U dc , min U dc , min P i , rate
Through calculation, the ranges of the droop coefficient values of the two power generation units are as follows:
D 1 0.1697
If the droop coefficient is too small, it will lead to a decline in the accuracy of current sharing. Therefore, in this paper, the droop coefficient is set as D 1 = 0.16 . According to Equation (7), the value of D 2 = 0.08 can be obtained.

3.2. Simulation Verification Research on Power Sharing Strategy Among Parallel Gas Turbine Generator Sets

3.2.1. Simulation Verification for the Increase and Decrease in Propulsion Load

Two gas turbine generator sets operate in parallel to supply the propulsion load. In the process, the effect of the energy storage system is not considered. This section focuses on analyzing the power sharing deviation and dynamic response characteristics between single-shaft and split-shaft gas turbine generators under abrupt load variations without energy storage systems.
The propulsion load undergoes a cycle where it first increases from zero load to full load and then decreases from full load back to zero load. Figure 5 presents the output power change waveforms of the No. 1 and No. 2 gas turbine generators during this process. Meanwhile, Figure 6, Figure 7 and Figure 8, respectively, display the change waveforms of the DCBV, the power turbine speed of the No. 1 gas turbine, and the power turbine speed of the No. 2 gas turbine. The calculated dynamic power sharing deviation between the generator sets is shown in Figure 8.
To simulate the slow speed regulation process of the propeller, the rates of change for the propulsion load are set at 3.33 kW/s. As shown in Figure 7 and Figure 8, throughout the whole process, the excitation system is capable of effectively sustaining the normal power output of the two generators and ensures the stability of the DCBV.
As shown in Figure 7 and Figure 8, the transient speed regulation rates (TSRRs) of the No. 1 and No. 2 gas turbines are 1.3% and 0.007%, respectively, with the former being much larger. This is mainly because the heterogeneous No. 1 and No. 2 gas turbines have different rated power and different inertia. Generally, the No. 2 gas turbine generator set is driven by a low-inertia single-shaft gas turbine (with a lower inertia coefficient) for power generation, of which the compressor and turbine of the single-shaft gas turbine are directly coupled on the same shaft. When the external sudden load is applied, the system can directly increase the fuel flow to increase the output power of the turbine, so its response speed is relatively fast. While the No. 1 gas turbine generator set is driven by a high-inertia split-shaft gas turbine (with a higher inertia coefficient) for power generation, the high-pressure and low-pressure shafts are separated. When there is an abrupt change in the load, the high-pressure shaft, which is connected to the external generator, may take more time to reach a new state of equilibrium due to the larger rotational inertia energy storage, resulting in a relatively long adjustment time.
The process from zero load to full load is divided into four stages as follows: the initial stage ( S 1 ), the early loading stage ( S 2 ), the late loading stage ( S 3 ), and the near-full-load stage ( S 4 ), as shown in Figure 9. During the initial stage (accounting for approximately 0–10% of the entire loading process), the power sharing deviation between the units fluctuates slightly within a range of 1%. In the early loading stage (about 10–40% of the entire loading process), the power sharing deviation between the units is less than 0.1%. In the late loading stage (roughly 40–98% of the entire loading process), the power sharing deviation between the units gradually increases as the propulsion load rises. When the loading reaches 98%, the power sharing deviation between the units is at its maximum, with a maximum value of 3.278%. During the near-full load stage of the loading process (about 98–100% of the entire loading process), the power sharing deviation between the units decreases, and the power sharing deviation at full load is approximately 1.5%.
The process from full load to zero load can also be divided into four stages as follows: the near-full load stage ( S 4 ), the early unloading stage ( S 5 ), the late unloading stage ( S 6 ), and the final stage ( S 7 ), as shown in Figure 10. During the near-full load stage (accounting for approximately 0–3.5% of the entire unloading process), the power sharing deviation between the units gradually increases. When the unloading reaches 3.5%, the power sharing deviation between the units is at its maximum, with a maximum value of 3.149%. In the early unloading stage (about 3.5–60% of the entire unloading process), the power sharing deviation between the units gradually decreases as the propulsion load is unloaded. When the unloading reaches 60%, the power sharing deviation between the units drops to 0.08%. In the late unloading stage (roughly 60–86% of the entire unloading process), the power sharing deviation between the units is less than 0.1%. During the final stage (about 86–100% of the entire unloading process), the power sharing deviation between the units fluctuates slightly within a range of 0.3%.
The peak phenomenon of power sharing deviation in Figure 9 originates from the coupling effect between dynamic load variations and droop control responses in a multi-unit parallel system. As shown in Figure 7 and Figure 8, the rotational speeds of No. 1 and No. 2 gas turbine generator sets stabilize toward the end of the S2 interval; meanwhile, the propulsion load continues to increase, compelling the system to dynamically adjust power allocation via droop control. The rate of load variation exceeds the dynamic adjustment bandwidth of the droop control, leading to an instantaneous increase in power sharing deviation. Additionally, the delays in speed feedback exacerbate transient oscillations during power reallocation, resulting in periodic peaks across the S3–S5 intervals. This phenomenon aligns with the inherent characteristics of droop control under sustained load variations and can be effectively mitigated by introducing feedforward compensation to suppress deviations.
During the entire load increase and load decrease process, the power sharing deviation between the generator sets is less than 3.5%. Considering that during this process, the rotational speeds of the two gas turbines and the DCBV remain relatively stable, and the output powers of the two-gas turbine generator sets change steadily. Therefore, it can be concluded that the power sharing deviation during the propulsion load-increase and load-decrease processes meet the requirements for parallel operation.

3.2.2. Simulation Verification of Sudden Load Changes

When two gas turbine generator sets operate in parallel to carry a high-power load, with an initial 60 kW propulsion load, the load power surges from 60 kW to 150 kW at 5 s, and then drops abruptly from 150 kW to 60 kW at 10 s. The simulation results of the output power, bus voltage, output current, the rotational speed of power turbine of No. 1 gas turbine, and the rotational speed of the turbine of No. 2 gas turbine are presented in Figure 10, Figure 11, Figure 12, Figure 13, Figure 14 and Figure 15, respectively. The calculated dynamic power sharing deviation between the generator sets is shown in Figure 15.
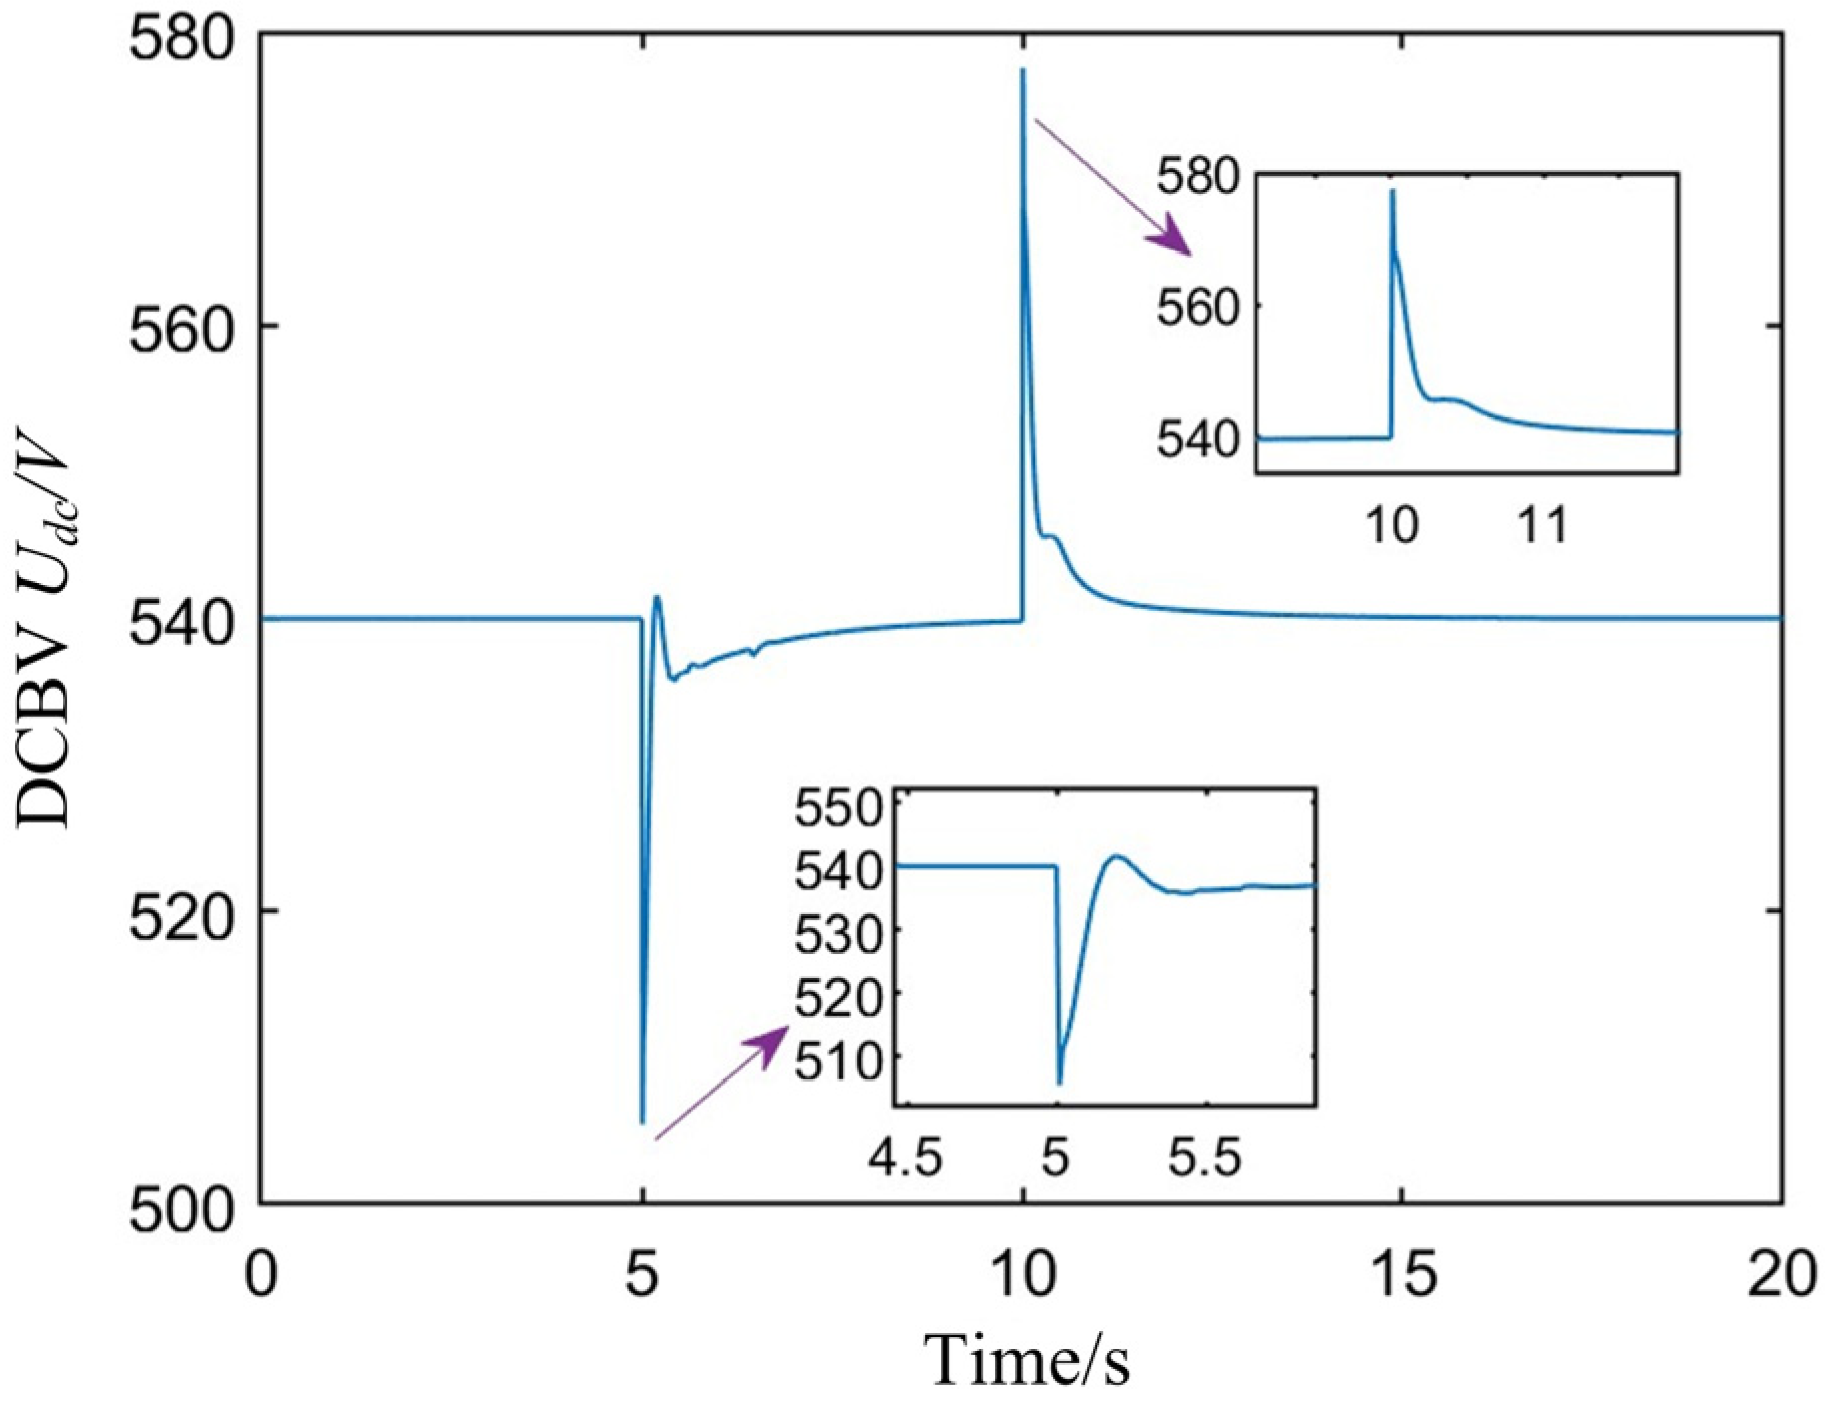
The sudden load change is a transient process. Due to the existence of the time constant, the excitation control system cannot respond promptly to voltage dips/surges and current surges/dips. As shown in Figure 11 and Figure 12, when the load suddenly increases, the DCBV instantly drops from 540 V to 505.5 V (a drop rate of 6.39%). The output current of generator No. 1 instantly surges from 73.9 A to 160.9 A (a surge rate of 117.73%), and the output current of generator No. 2 instantly surges from 37.2 A to 120.4 A (a surge rate of 223.66%). When the load suddenly decreases, the DCBV instantly surges from 540 V to 577.5 V (a surge rate of 6.94%). The output current of generator No. 1 instantly drops from 185.3 A to 94.3 A (a drop rate of 49.11%), and the output current of generator No. 2 instantly drops from 92.4 A to 20.7 A (a drop rate of 77.6%). Consequently, the transient load power cannot be distributed among the units according to the set proportion, as shown in Figure 10.
The distribution of transient power among the units mainly depends on the inertia of the generator rotor and the response speed of the controller. The generator units with a large rotor inertia can store more kinetic energy, which means they can provide/absorb more instantaneous power during sudden load changes, but this will lead to a decrease in rotational speed. The controller is responsible for adjusting the operating speed of the unit. Units with a controller that has a faster response speed can increase the fuel flow more quickly to increase the output power and thus share more of the load.
Upon a sudden load increase, the TSRRs of the No. 1 and No. 2 gas turbines are 7.97% and 0.15%, respectively. When the load suddenly drops, their TSRRs are 3.21% and 0.16%, respectively. In comparison to the No. 1 gas turbine generator set, the No. 2 gas turbine presented in this paper is characterized by lower power and a faster response speed. Figure 12 and Figure 13 illustrate the dynamic responses of the turbine speeds of the No. 1 and No. 2 gas turbines when the load experiences an abrupt change. Specifically, for the No. 1 gas turbine, it takes approximately 5.08 s for the turbine speed to decline to its lowest level and around 7.45 s to reach its peak speed. In contrast, the No. 2 gas turbine demonstrates a much swifter response, with the turbine speed dropping to the lowest point in about 0.63 s and rising to the highest point in roughly 0.68 s. Therefore, in the transient state of parallel operation and sudden load change, the power of No. 2 generator set is higher than that after droop regulation, and the power will be over-adjusted, as shown in Figure 9. This will lead to an increase in the power sharing deviation of the unit during the load mutation process.
As shown in Figure 15, when the load suddenly increases, the maximum instantaneous power sharing deviation is 20.06%, and when the load suddenly drops, the maximum instantaneous power sharing deviation is 15.5%. An instantaneous excessive power sharing deviation will reduce the reliability of the unit in parallel operation. When the system is operating under high-load conditions, a sudden load change can potentially lead to the power overload of the No. 2 generator set. This overload poses a threat to the safe operation of the gas turbine generator set. However, with the intervention of the excitation system, the deviation in power distribution between the generators gradually diminishes. Eventually, this deviation in power distribution finally falls within the range of 0.1%, which satisfies the requirements for the parallel operation of the generators.

4. Research on Power Sharing Strategies for Parallel Generator Sets with Power Feedforward

To address the issue of a large transient power sharing deviation caused by sudden load changes, as well as the problem of power distribution in a two-unit parallel operation system, this section proposes a power sharing strategy for the GTPGS with the power feedforward control strategy and the consideration of hybrid energy storage.

4.1. Research on Power Sharing Strategy for a Two-Unit Parallel Operation System Under Sudden Load Changes

4.1.1. Power Sharing Strategy Under Sudden Load Changes

Sudden load changes can affect the power sharing deviation among gas turbine generator units. However, when the propulsion load is increased or decreased with a certain slope, the power sharing deviation among the units is relatively low. In view of the aforementioned issues, this paper puts forward a power sharing strategy featuring power feedforward for the GTPGS. Hybrid energy storage systems are employed to deftly handle transient power fluctuations. In this setup, gas turbines are only tasked with managing ramp power characterized by a specific slope. This well-designed division of labor not only capitalizes on the fast-response capabilities of hybrid energy storage and the relatively stable power generation characteristics of gas turbines, but it also serves to resolve a critical issue. Specifically, it addresses the problem of significant transient power distribution disparities among gas turbine units that occur during sudden load changes, thus enabling the more efficient and stable operation of the overall power system.
In this section, the power characteristics of the flywheel energy storage system are shown in Figure 16. Region 1 in Figure 16 represents the energy released by the flywheel energy storage when the load suddenly increases. Region 2 represents the energy absorbed by the flywheel energy storage when the load suddenly decreases. The parameter a represents the moment of sudden load power increase; b represents the moment when the power release of the flywheel energy storage ends; c represents the moment when the load power suddenly decreases; d represents the moment when the power absorption of flywheel device ends; P 1 is the value of the transient load power.
Considering that the power sharing deviation of the units during the increase and decrease in the propulsion load is relatively small, the power curve borne by the gas turbine generator is set as shown in Figure 17. The item e represents the moment when the load power is fully borne by the gas turbine generator set; f represents the moment when the gas turbine generator set no longer bears this load power. From the load power curve, the power characteristics of FES, GTPGS, and the battery can be further calculated. Since the switching time and magnitude of the sudden change load are known, the parameter variables to be determined are b , d , e , and f .
Figure 16 and Figure 17, respectively, present the power response characteristics of the FESS and the GTPGS. The discharge and charge capacity thresholds of the FESS and the power response threshold of the gas turbine are determined when the load changes suddenly. These characteristics, as constraint conditions, play a restrictive role in optimizing the power sharing strategy of the system.

4.1.2. Simulation Verification of the Power Sharing Strategy of the System Under Sudden Load Changes

In this section, research on optimizing the power sharing strategy is conducted. The major objective of the optimization is to minimize the total energy change in the FESS and battery energy storage during sudden load changes. To consider both the energy and power objectives simultaneously, a linear weighting approach is adopted. A weight is assigned to each objective function, and these objective functions are then added together to form a single comprehensive objective function. The constraint conditions encompass power balance, power sharing deviation constraints, the ramp rate of gas turbine generator units, the turbine speed of the two gas turbines, constraints of the FESS, constraints of the battery device, the DCBV, etc.
To verify the effectiveness and superiority of the power sharing strategy for the two-unit GTPGS with power feedforward under Sudden load changes, this section applies the same load as that in Section 3.2.2. Before conducting the simulation verification, with the optimization objective of minimizing the total energy change in the FESS and battery device during sudden load changes, considering the above constraints, the single objective genetic algorithm is used to optimize the power output curves of each part. The variable boundaries in this section are set as b = [0.1, 1], d = [0.1, 1], e = [1, 4], and f = [1, 4]. The population size of the genetic algorithm is 10, and the maximum number of iterations is 10. The change in the fitness function value during the iteration process is shown in Figure 18. After ten iterations, the optimized optimal parameters are [0.37, 2.21, 0.14, 2.57], and the corresponding reference power curves of the FESS, GTPGS, and battery device are shown in Figure 19, respectively. The determination of the iteration count in this configuration is based on dual considerations. First, the comprehensive model architecture incorporates multiple components, including the single-shaft gas turbine generator, dual-shaft gas turbine generator, flywheel energy storage system, battery energy storage system, and load model, constituting a relatively large-scale simulation system. An excessive iteration count would result in prolonged simulation runtime without proportional analytical benefits. Second, the simulation objective focuses on validating the efficacy and superiority of the dual-unit GTPGS power distribution strategy with power feedforward under load step change conditions. Simulation verification confirmed that the ten-iteration optimization results adequately met the requirements of this study while maintaining computational efficiency. Consequently, an iteration count of ten was established for this section, with detailed simulation parameter configurations explicitly specified prior to optimization execution to ensure simulation reproducibility and result reliability.
The optimized power curves are used as the feedforward parameter input into the simulation model for simulation verification. The corresponding simulation results of the output power of No. 1 and No. 2 gas turbine generators, load power, power of energy storage system, the DCBV, and rotational speed of turbine of No. 1 and No. 2 gas turbine engines are shown in Figure 20, Figure 21, Figure 22, Figure 23 and Figure 24, respectively. The calculated dynamic power sharing deviation between the units is shown in Figure 25.
As shown in Figure 20, when the load suddenly changes, the output power of the GTPGS with power feedforward rises at a certain slope. The transient power mutation is jointly borne by the FESS and the battery energy storage system (BESS), as shown in Figure 21. The FESS bears the transient high-frequency power, while the battery bears the medium-frequency part of the power. Compared with the situation without power feedforward, when power feedforward is applied, the maximum drop of the DCBV decreases from 34.5 V (a drop rate of 6.39%) to 3.19 V (a drop rate of 0.59%), and the maximum rise decreases from 37.48 V (a rise rate of 6.94%) to 2.72 V (a rise rate of 0.5%), as shown in Figure 22. This improves the quality of the power supply.
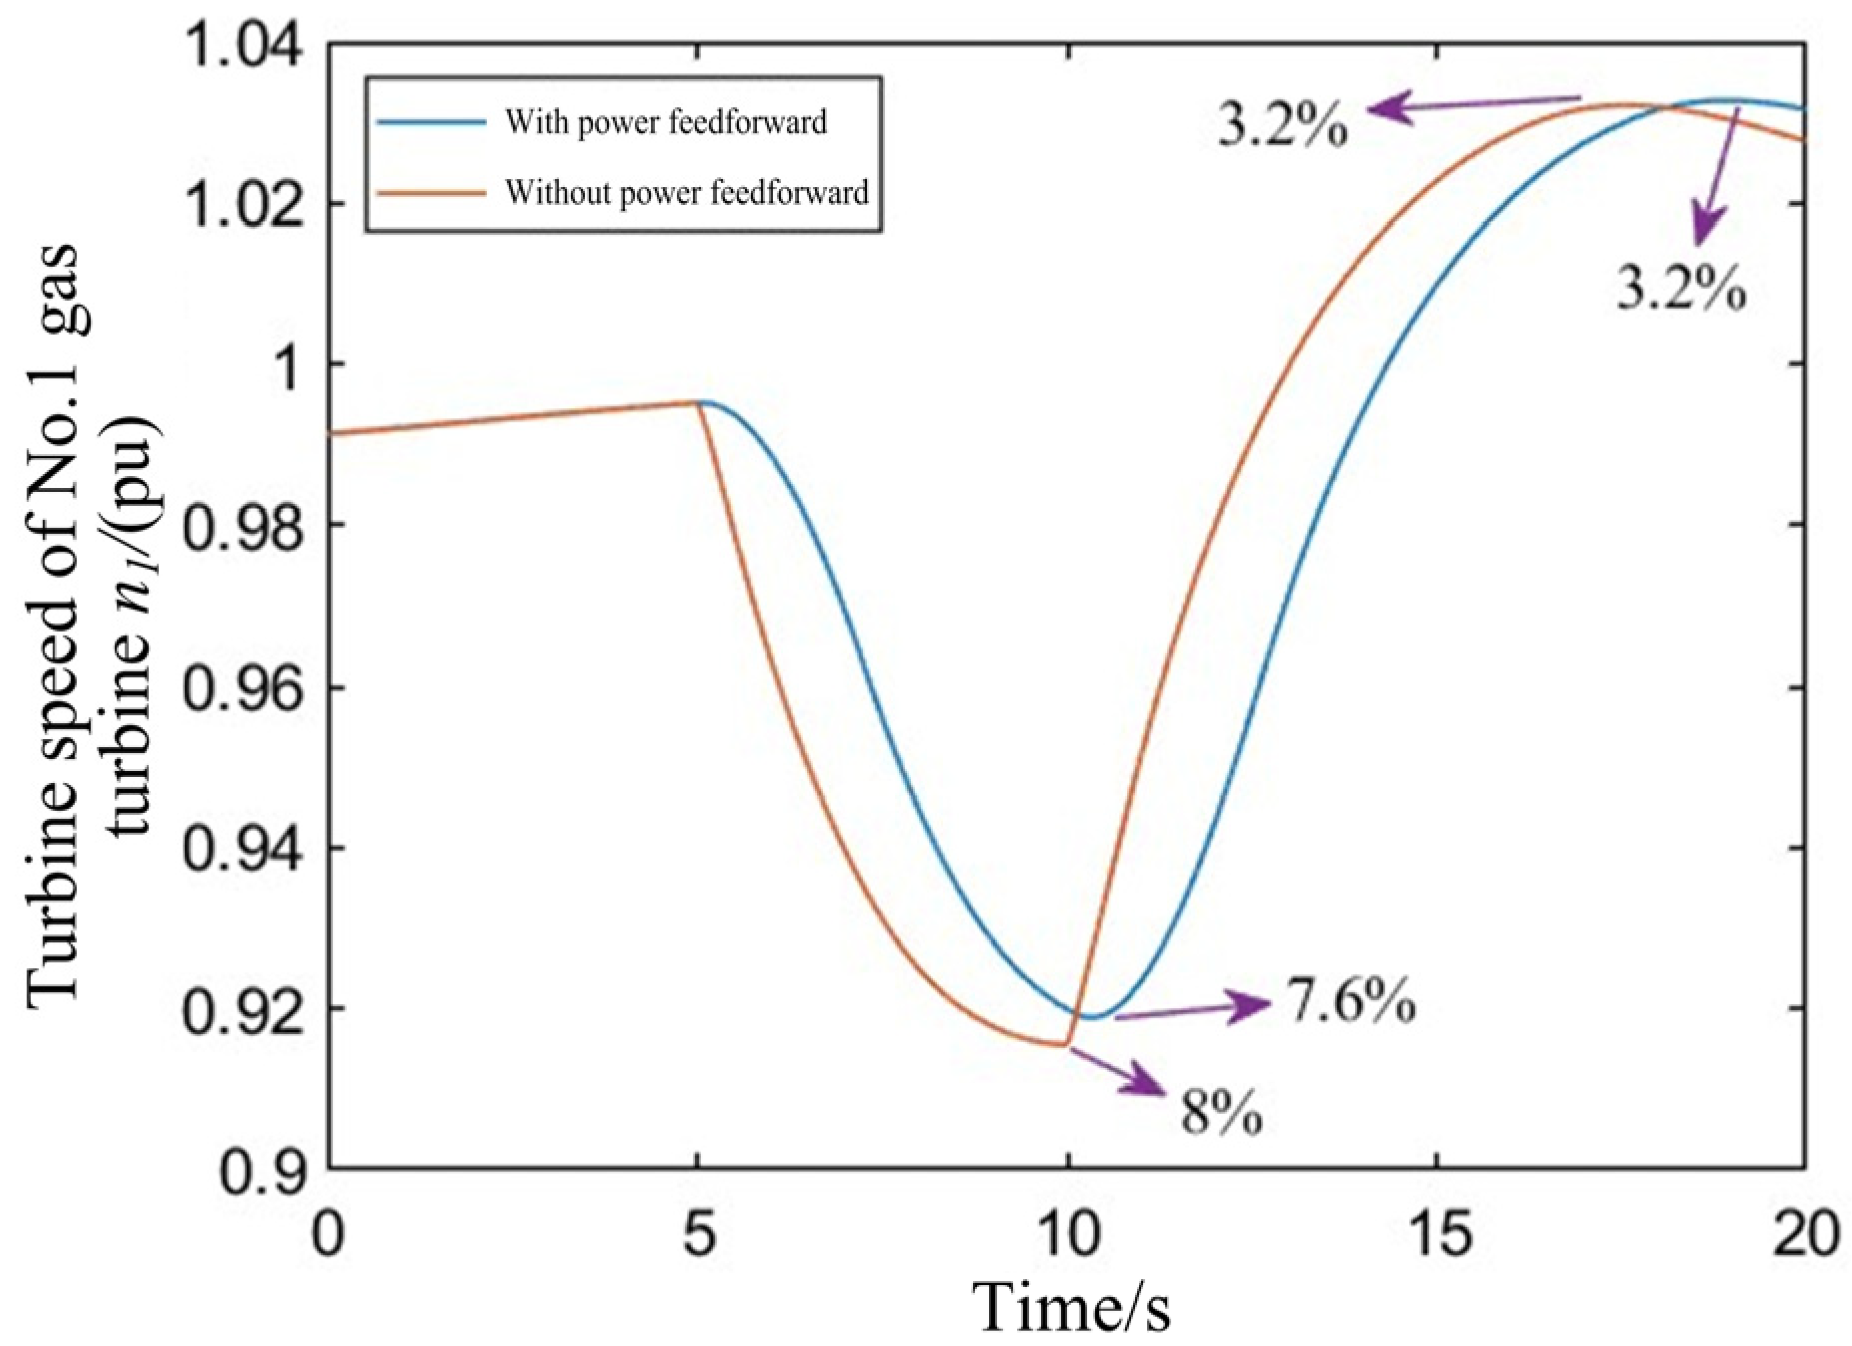
As shown in Figure 23 and Figure 24, compared with the case without power feedforward, when power feedforward is employed, during sudden load increase, the TSRR of the No. 1 gas turbine drops from 8% to 7.6%, and the time taken for the rotational speed of the power turbine to drop to the lowest speed is slightly extended. The TSRR of the No. 2 gas turbine decreases from 0.16% to 0.12%, and the time taken for the rotational speed of the turbine to drop to the lowest speed extends from 0.63 s to 2.46 s. During sudden load decrease, the TSRR of the No. 1 gas turbine remains at 3.2%, and the time taken for the rotational speed of the power turbine of the No. 1 gas turbine to rise to the highest speed is slightly extended. The TSRR of the No. 2 gas turbine decreases from 0.16% to 0.1%, and the time taken for the rotational speed of the turbine to rise to the highest speed extends from 0.68 s to 2.18 s. That is, the response time of the No. 2 gas turbine generator set is extended, and the extension is relatively significant. Since the excessively fast response time of the No. 2 gas turbine generator set is the main cause of the large transient power sharing deviation, the extension of its response time is conducive to reducing the transient power sharing deviation between the units.
As shown in Figure 25, without power feedforward, at the moment the load suddenly increases, the maximum power sharing deviation is 20.06%, and at the moment the load suddenly decreases, the maximum power sharing deviation is 15.5%. When power feedforward is applied, at the moment of sudden load increase or decrease, the maximum transient power sharing deviation does not exceed 4%, meeting the requirements for the parallel operation of the units.

4.2. Research on a Power Sharing Strategy for a Two-Unit Parallel Operation System Under Rectangular-Wave Pulsed Load

4.2.1. Power Sharing Strategy of the System Under Rectangular-Wave Pulsed Load

In the case of two-unit parallel operation, the switching of the pulsed load can also cause a sudden change in the system power, and the power sharing deviation between the units also needs to be considered. Therefore, based on the idea of power feedforward, this section conducts research on the power sharing strategy for the two-unit GTPGS under Rectangular-wave pulsed load.
This section focuses on the research of rectangular-wave pulsed loads occurring three times in a row. The period of the pulsed load is 5 s, the duty cycle is 80%, and the peak power is 120 kW.
The power curve of the FESS in this section is shown in Figure 26. There are six parameter variables to be determined for this power curve, namely a 1 , a 2 , a 3 , a 4 , a 5 , and a 6 , which represent the time intervals from the start to the end of each charge/discharge process of the FESS. Based on the conclusion obtained in Ref. [28] that the power sharing deviation of the units during the increase and decrease in the propulsion load is relatively small, the power curve borne by the GTPGS in this section is shown in Figure 27. There are six parameter variables to be determined for this power curve, namely b , c , d , e , P 2 , and P 3 . Among them, b , c , and d represent the time intervals during which the output power of the GTPGS responds to the full pulsed load power each time the pulse is input. The parameter e represents the time interval during which the output power of the gas turbine responds when the last pulsed load is cut off. P 2 and P 3 represent the changes in the output power of the GTPGS during the periods from the first and second cut-offs of the pulsed load to the next input, respectively. In summary, the set of parameter variables to be determined is [ a 1 ,   a 2 ,   a 3 ,   a 4 ,   a 5 ,   a 6 ,   b ,   c ,   d ,   e ,   P 2 ,   P 3 ] .

4.2.2. Simulation Verification of the System Power Sharing Strategy Under Rectangular-Wave Pulsed Load

In this section, the optimization method in Section 4.1.2 is used to determine the required parameter variables. The variable boundaries set before optimization are a i 0.1 , 1 , i = 1 , 2 , , 6 , b , c , d , e 2 , 4 , and P 2 , P 3 60 , 120 . The population size of the genetic algorithm is 10, and the maximum number of iterations is 10. The change in the fitness-function values during the iterative process is shown in Figure 28. After ten iterations, the optimized optimal parameters are [0.34, 0.55, 0.56, 0.46, 0.36, 0.22, 3.21, 2.60, 2.50, 2.68, 69.59, 83.94]. The reference power curves of the corresponding FESS, GTPGS, and battery device are shown in Figure 29, respectively.
The optimized power curves are feedforwarded as inputs into the simulation model for simulation verification. The simulation results of the output powers of the No. 1 and No. 2 gas turbine generators, the load power, the power of the energy storage system, the DCBV, and the rotational speed of the turbine of the two gas turbine engines are shown in Figure 30, Figure 31, Figure 32, Figure 33 and Figure 34, respectively. The calculated dynamic power sharing deviation between the units is shown in Figure 35.
As shown in Figure 30, when the rectangular-wave pulsed load is switched, the output power of the GTPGS with power feedforward rises or falls at a certain slope. The transient power mutation is jointly borne by the FESS and the BESS, as shown in Figure 31. The FESS bears the transient high-frequency power, and the battery bears the medium-frequency part of the power. In this way, the maximum drop of the DCBV is 4.8 V (a drop rate of 0.89%), and the maximum rise is 4.16 V (a rise rate of 0.77%), as shown in Figure 32, meeting the power quality requirements of the power grid.
As shown in Figure 33 and Figure 34, when the rectangular-wave pulsed load is switched, the maximum TSRR of the No. 1 gas turbine is 8.7%, and the time taken for the rotational speed of the power turbine to drop to the lowest speed is approximately 4.69 s. The maximum TSRR of the No. 2 gas turbine is 0.15%, and the time taken for the rotational speed of the turbine to drop to the lowest speed is approximately 3.39 s. The difference in response time between the No. 1 and No. 2 gas turbines is 1.3 s. As shown in Figure 35, the maximum transient power sharing deviation does not exceed 4% at this time, meeting the requirements for the parallel operation of the units. Therefore, it can be concluded from the above analysis that when the difference in response time between the No. 1 and No. 2 gas turbine generators is within 1.3 s, the requirements for the parallel operation of the units can be satisfied.

5. Experimental Verification

5.1. Experimental Objectives

This section will perform experimental research on the parallel operation of a two-unit GTPGSs with FESS in order to verify the effectiveness of the power sharing strategy between parallel-operating units in the two-unit GTPGS based on the improved voltage droop control, and to verify the effectiveness of the system power allocation strategy with power feedforward. By comparing and analyzing the experimental results of parameters—such as the power sharing deviation between units, the DCBV, gas turbine speed, pulsed load current, gas turbine generator output power, and power of flywheel energy storage—the effectiveness of the proposed power sharing strategy between units based on the improved voltage droop control and the system power sharing strategy with power feedforward will be verified.

5.2. Introduction to the Experimental Platform

The basic structure of this experimental platform is shown in Figure 36 [32]. It mainly consists of two gas turbine engines, two synchronous generators, their AVR (Automatic Voltage Regulator) systems, two rectifier cabinets, a flywheel energy storage system, two simulated propulsion loads, two simulated pulsed loads, a DC switchboard, and an energy management system. In this experimental platform, a micro gas turbine is used to simulate a large-scale marine gas turbine, and a resistive load is used to simulate the propulsion load to study the actual operation laws of the ship power system. The power supply process is as follows: The gas turbine, as the prime mover, drives the generator. The generator outputs AC 400 V/50 Hz alternating current, which is transformed into DC 540 V/50 Hz direct current through a phase-shifting transformer and a three-phase uncontrolled rectifier. The two gas turbine generator sets generate electricity in parallel on the DC side. The DC main switchboard and the energy management system distribute, monitor, and manage the output power of the two generators. In addition, the control panel of the DC switchboard plays a crucial role in the system by managing the distribution and control of electrical energy. It serves as the power source for the propulsion load, energy storage load, and pulsed load, ensuring a stable and reliable power supply to each of these components.

5.3. Result Analysis

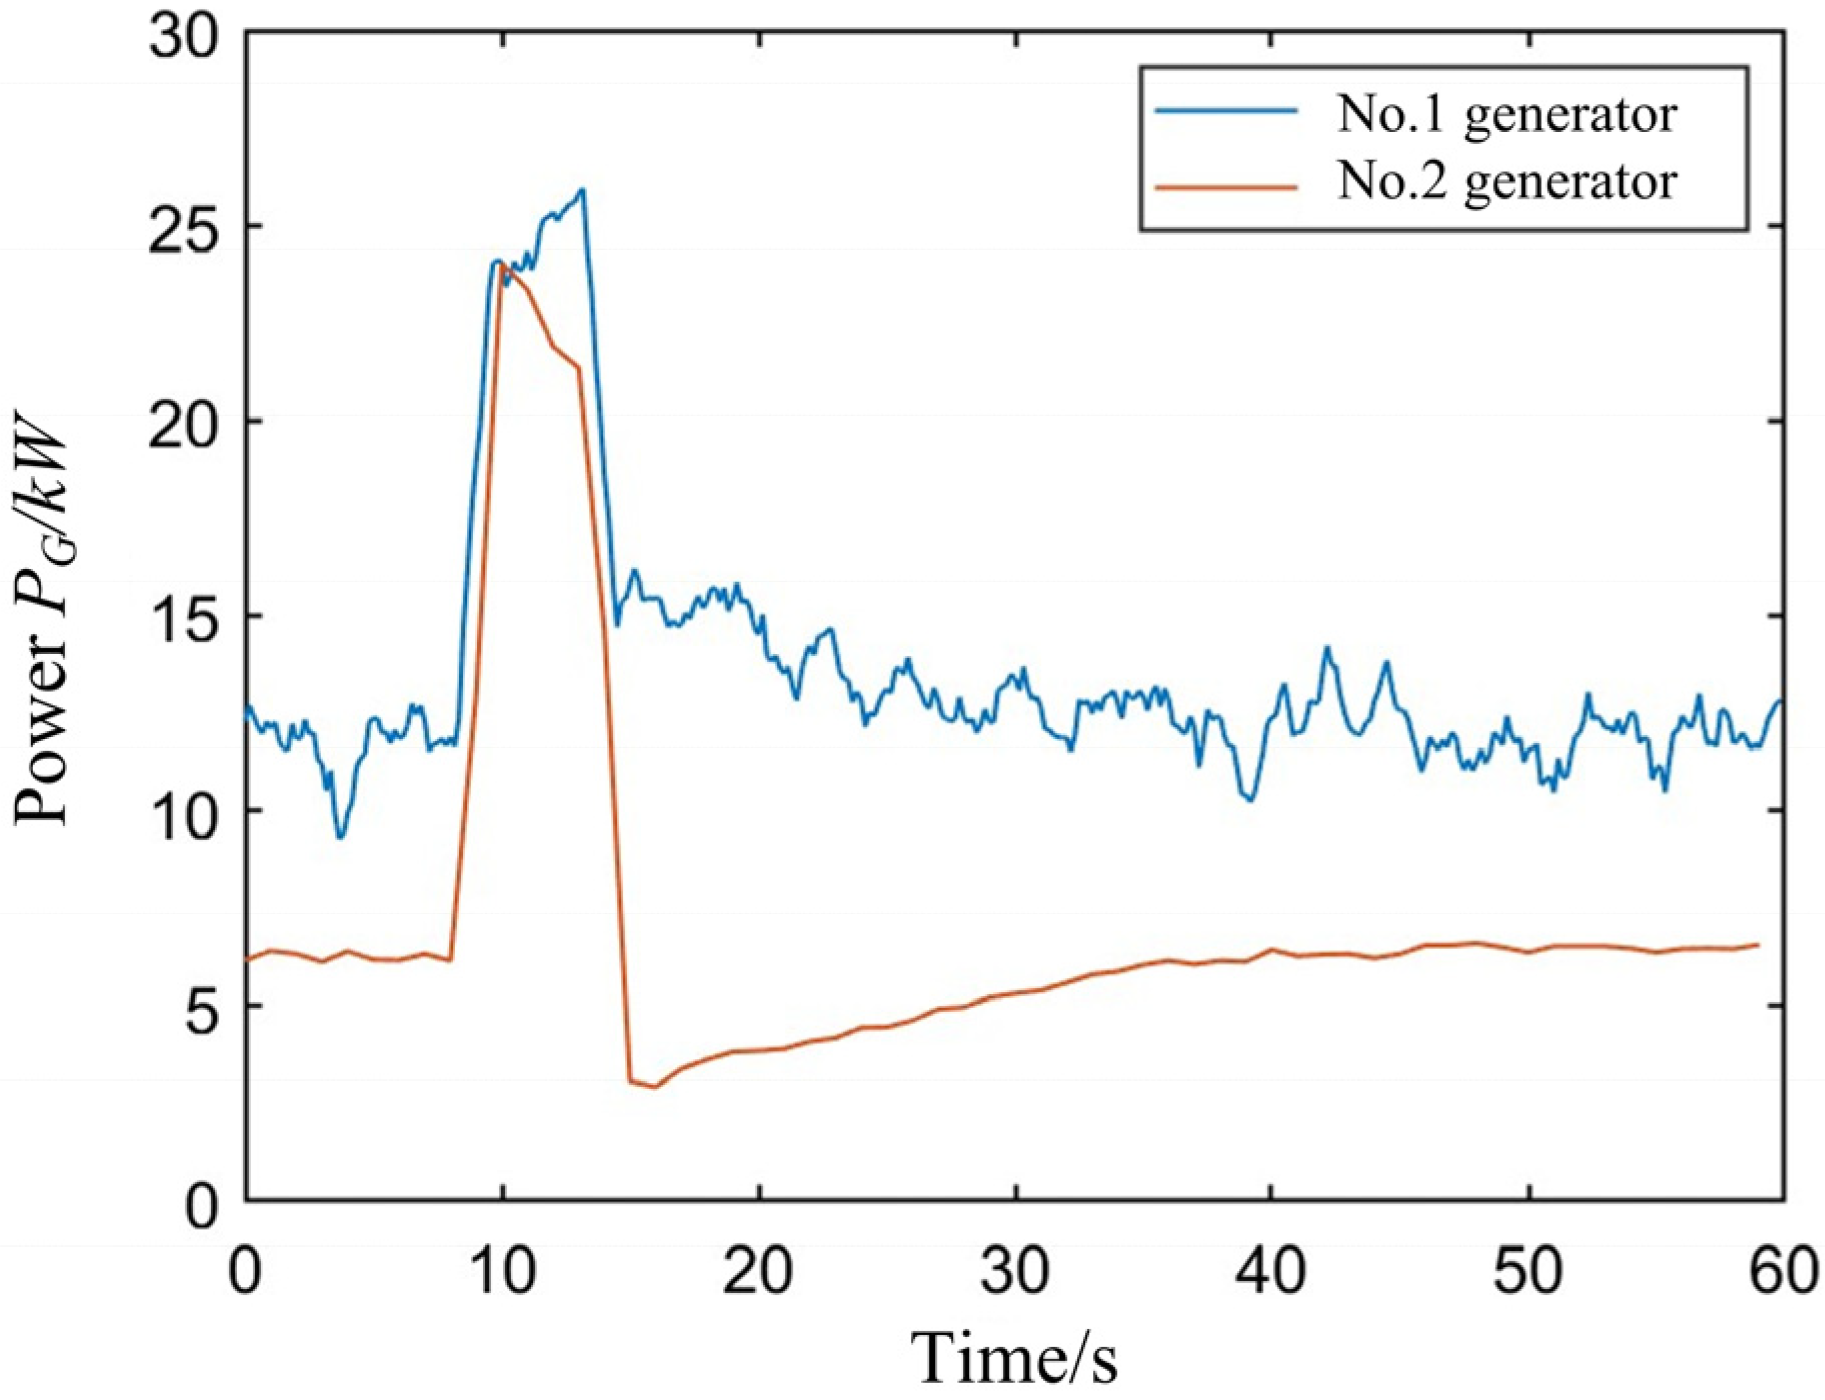
The pulse test for the parallel operation of the two-unit GTPGS was carried out according to the experimental plan. The current waveforms of the pulsed load with and without the effect of energy storage are shown in Figure 37. When there is no flywheel energy storage, the output power performance of the two GTPGSs is shown in Figure 38. When the FESS is considered, the output power waveforms of the two GTPGSs are shown in Figure 39. With and without the effects of ESS, the waveforms of the pulsed current are basically the same, as shown in Figure 37. This lays the foundation for the comparative analysis of other performance parameters. When the FESS is not considered, the power of the pulsed load is jointly borne by the two generator units. Considering that the rated powers of the No. 1 and No. 2 gas turbine generator sets used in this section are 200 kW and 100 kW, respectively, the power distribution ratio between the two units should be 2:1. However, since the No. 2 GTPGS is a single-shaft structure, it has a faster response speed to the load and can adjust the output power in a timely manner, as shown in Figure 38 and Figure 39. Therefore, when the pulsed load is switched, the power distribution ratio between the units does not meet the 2:1 standard.
During the entire process of pulsed load switching, the power sharing deviation between the units is as shown in Figure 40. The maximum power sharing deviation is 12.1%. Such a large power sharing deviation will always affect the stability of the parallel operation of the units.
Moreover, the power of the FESS, the DCBV, and the turbine speed of the gas turbine engines are shown in Figure 41, Figure 42, Figure 43 and Figure 44, respectively.
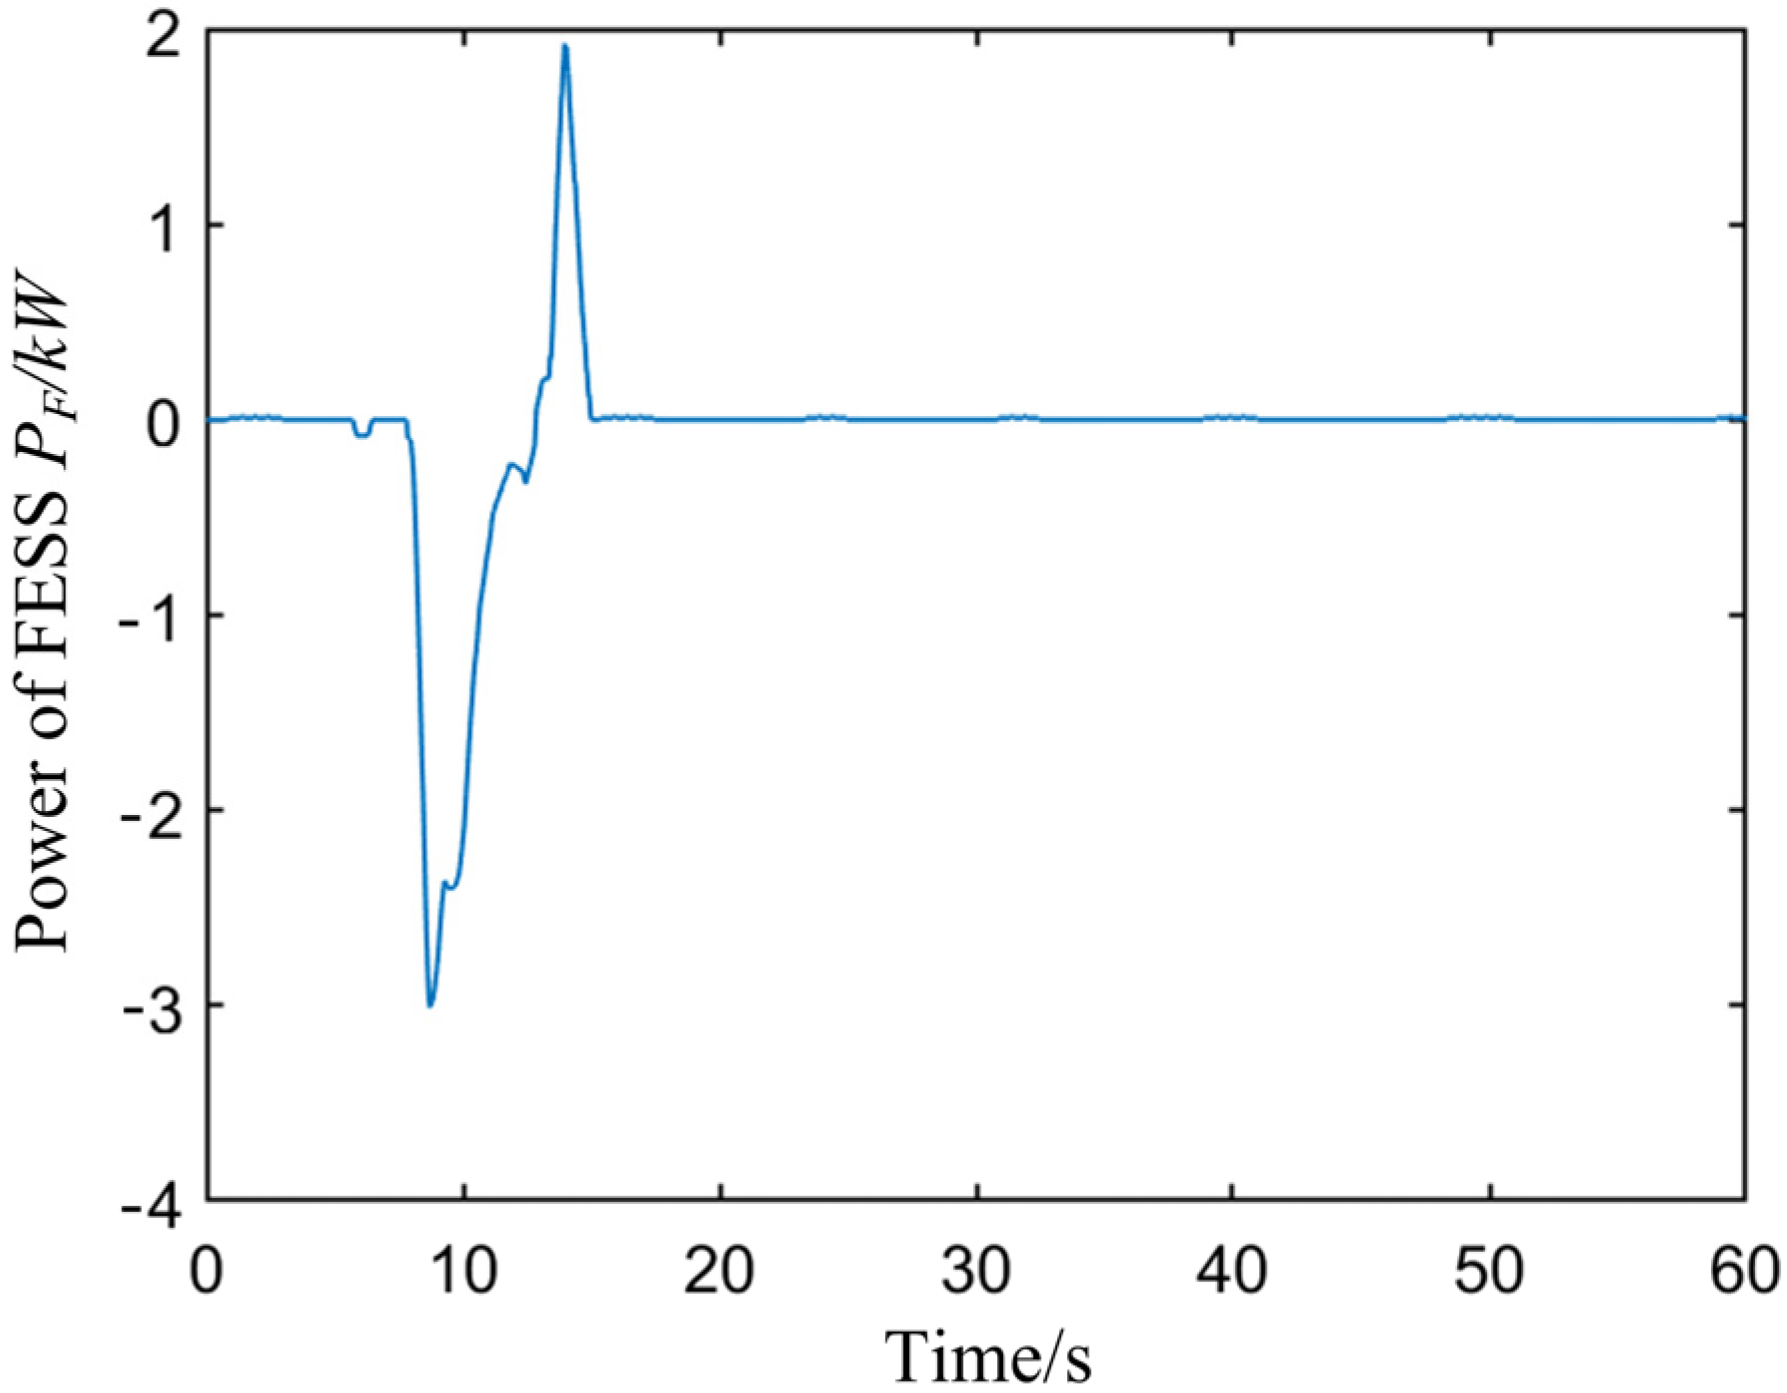
When energy storage is considered, the power of the pulsed load is jointly borne by the GTPGS and the FESS, as shown in Figure 39 and Figure 41. When the load power changes abruptly, the energy storage system responds rapidly to compensate for this part of the transient power, and the GTPGS only needs to bear the low-frequency part of the load power. Similarly to the situation without energy storage, when the pulsed load is switched, the power distribution ratio between the units also does not meet the 2:1 standard. During the entire process of pulsed load switching, the maximum power sharing deviation between the units is 11.3%, as shown in Figure 40. Compared with the case without the FESS, when the flywheel energy storage is present, the power sharing deviation between the units during pulsed load switching is reduced by 0.8%. The reduction range is relatively small, as shown in Figure 40. The reason for this is that the control mode of the outer loop of the FESS is voltage-feedback-based control. The flywheel energy storage system is primarily employed for the purpose of keeping the stable of DCBV and cannot directly control the power distribution between the ESS and the GTPGS, as well as between two different GTPGSs.
The fluctuations of the DCBV with and without the FESS are shown in Figure 42. Without the ESS, the maximum transient fluctuation of the DCBV caused by the pulsed load is 9.3 V (with a maximum fluctuation rate of 1.72%). In comparison to the case without ESS compensation, the application of ESS leads to a maximum DCBV fluctuation of 7.5 V (with a maximum fluctuation rate of 1.39%). The transient fluctuations of the bus voltage are presented in Table 2. The connection of the ESS effectively reduces the fluctuations of the DCBV. Since the power of the pulsed load applied in the experiment is relatively small, the fluctuations of the DCBV with and without energy storage are within the stable range (in this section, the stable range of the DCBV is set to ±3%).
The variation waveforms of the turbine speed of the two gas turbine engines, with and without the action of the ESS, are shown in Figure 43 and Figure 44, respectively. Without energy storage compensation, the maximum fluctuation rates of the turbine speed of the No. 1 and No. 2 gas turbines caused by the pulsed load are 2.3% and 0.4%, respectively. When there is energy storage compensation, the maximum fluctuation rates of turbine speed caused by the pulsed load are 2.2% and 0.3%, respectively. The connection of the ESS reduces the fluctuations of the DCBV. Due to the relatively small power of the pulsed load applied in the experiment, the fluctuations of the power turbine speed of the gas turbine are also small, with or without energy storage.
The experimental results show that when the rectangular-wave pulsed load is considered, under the control strategy of the two-unit parallel operating GTPGS with power feedforward, the system power can be reasonably distributed among two different types of GTPGSs and the hybrid ESS. Compared with the situation without power feedforward, when the power feedforward is considered, the power sharing deviation between different types of gas turbine generator sets is improved. The experimental conclusions obtained correspond to the simulation results, further verifying the effectiveness of the control strategy proposed in the paper.

6. Conclusions

This paper mainly focuses on the parallel operation of a two-unit marine micro gas turbine DC power generation system considering hybrid energy storage (HESS) comprising flywheel (FESS) and battery subsystems. A power sharing strategy for the parallel operation of a single-haft and a split-shaft gas turbine generator system based on improved voltage droop control is proposed. The power sharing deviation between gas turbine generator sets under steady state, propulsion load increase/decrease, and sudden load change are studied. Moreover, in order to address the issue of excessive transient power sharing deviation among different types of gas turbine generator sets during parallel operation, a power sharing strategy for the two-unit parallel-operating GTPGS with power feedforward is proposed. The power sharing deviation between units and system characteristics during sudden load change, with and without power feedforward, are compared and analyzed. The power sharing deviation between units and system characteristics under Rectangular-wave pulsed load are also studied. Finally, for the control strategies proposed in this chapter, simulation, and experimental verification of the control strategy for the parallel operation of the two-unit marine micro GTPGS are carried out, and the following results are obtained:
Under the improved voltage droop control, during steady-state conditions and as propulsion loads increase and decrease, the power sharing deviation between units is less than 3.5%, achieving good power distribution between units. Under the system power distribution control with power feedforward, during sudden load change and when a pulsed load is connected, the power sharing deviation between units is less than 4%. This not only achieves good power distribution between units but also realizes the reasonable distribution of power in the system, meeting the power quality requirements of the power grid.

Author Contributions

Conceptualization, Y.L. (Yongbao Liu); Methodology, Z.D., Y.L. (Yueming Li) and Y.L. (Yongbao Liu); Validation, Y.L. (Yueming Li); Formal analysis, Y.Y.; Investigation, Z.D.; Writing—original draft, Z.D. and Y.L. (Yueming Li); Writing—review & editing, Z.D. and Y.Y.; Funding acquisition, Y.L. (Yongbao Liu). All authors have read and agreed to the published version of the manuscript.

Funding

This paper is supported by the Basic Research for National Science and Technology Major Project of China (Grant No. J2019-XX-0012) and the Independent Scientific Research Project of Naval University of Engineering (2023DY010).

Data Availability Statement

The original contributions presented in this study are included in the article. Further inquiries can be directed to the corresponding author.

Acknowledgments

The authors wish to thank the reviewers for their careful, unbiased, and constructive suggestions, which led to this revised manuscript.

Conflicts of Interest

Yueming Li was employed by Shanghai Marine Diesel Engine Research Institute. The remaining authors declare that the research was conducted in the absence of any commercial or financial relationships that could be construed as a potential conflict of interest.

Nomenclature

a , b , e , f Time intervals for power change
D i Droop control coefficient
I Current
U voltage
P Power
S Self-defined stage for load increase and decrease
n Speed
t Time

Abbreviations

BESSBattery energy storage system
DCBVDC bus voltage
ESSEnergy storage system
FESSFlywheel energy storage system
GTPGSGas turbine power generator set
HESSHybrid energy storage system
TSRRTransient speed regulation rate

References

  1. Xu, L.; Guerrero, J.M.; Lashab, A.; Wei, B.; Bazmohammadi, N.; Vasquez, J.; Abusorrah, A. A review of DC shipboard microgrids-Part I: Power architectures, energy storage, and power converters. IEEE Trans. Power Electron. 2021, 37, 5155–5172. [Google Scholar] [CrossRef]
  2. Li, J.; Liu, F.; Shao, C.C.; Wang, G.Q.; Hou, Y.H. Resilience control of DC shipboard power systems. IEEE Trans. Power Syst. 2018, 33, 6675–6685. [Google Scholar] [CrossRef]
  3. Kim, S.; Kucka, J.; Ulissi, G.; Kim, S.-N.; Dujic, D. Solid-state technologies for flexible and efficient marine dc microgrids. IEEE Trans. Smart Grid 2021, 12, 2860–2868. [Google Scholar] [CrossRef]
  4. Li, Y.M.; Ding, Z.M.; Yu, Y.H.; Liu, Y.B. Mitigation effect of flywheel energy storage on the performance of marine gas turbine DC microgrid under high-power load mutation. Energy Rep. 2023, 9, 1380–1396. [Google Scholar] [CrossRef]
  5. Jia, K.Y.; Liu, C.; Li, S.H.; Jiang, D.X. Modeling and optimization of a hybrid renewable energy system integrated with gas turbine and energy storage. Energy Convers. Manag. 2023, 279, 116763. [Google Scholar] [CrossRef]
  6. Wu, S.; Li, T.; Chen, R.; Huang, S.; Xu, F.; Wang, B. Transient performance of gas-engine-based power system on ships: An overview of modeling, optimization, and applications. J. Mar. Sci. Eng. 2023, 11, 2321. [Google Scholar] [CrossRef]
  7. Yang, R.; Liu, Y.; He, X.; Liu, Z. An innovative online adaptive high-efficiency controller for micro gas turbine: Design and simulation validation. J. Mar. Sci. Eng. 2024, 12, 2150. [Google Scholar] [CrossRef]
  8. Ismail, M.S.; Moghavvemi, M.; Mahlia TM, I. Design of an optimized photovoltaic and microturbine hybrid power system for a remote small community: Case study of Palestine. Energy Convers. Manag. 2013, 75, 271–281. [Google Scholar] [CrossRef]
  9. Seljak, T.; Buffi, M.; Valera-Medina, A.; Chong, C.; Chiaramonti, D.; Katrašnik, T. Bioliquids and their use in power generation-A technology review. Renew. Sustain. Energy Rev. 2020, 129, 109930. [Google Scholar] [CrossRef]
  10. Escamilla, A.; Sánchez, D.; García-Rodríguez, L. Assessment of power-to-power renewable energy storage based on the smart integration of hydrogen and micro gas turbine technologies. Int. J. Hydrogen Energy 2022, 47, 17505–17525. [Google Scholar] [CrossRef]
  11. Javadi, M.A.; Khodabakhshi, S.; Ghasemiasl, R.; Jabery, R. Sensivity analysis of a multi-generation system based on a gas/hydrogen-fueled gas turbine for producing hydrogen, electricity and freshwater. Energy Convers. Manag. 2022, 252, 115085. [Google Scholar] [CrossRef]
  12. Sun, K.; Zhang, L.; Xing, Y.; Guerrero, J.M. A distributed control strategy based on DC bus signaling for modular photovoltaic generation systems with battery energy storage. IEEE Trans. Power Electron. 2011, 26, 3032–3045. [Google Scholar] [CrossRef]
  13. Vu, T.V.; Gonsoulin, D.; Diaz, F.; Edrington, C.S.; El-Mezyani, T. Predictive control for energy management in ship power systems under high-power ramp rate loads. IEEE Trans. Energy Convers. 2017, 32, 788–797. [Google Scholar] [CrossRef]
  14. Duan, J.D.; Fan, S.G.; Wu, F.J.; Sun, L.; Wang, G.L. Power balance control of micro gas turbine generation system based on supercapacitor energy storage. Energy 2017, 119, 442–452. [Google Scholar] [CrossRef]
  15. Wang, S.; Duan, J.D.; Sun, L.; Fan, S.G. Power balance control based on super-capacitor energy storage for micro-turbine power generation system. Electr. Power Autom. Equip. 2017, 37, 126–133. [Google Scholar]
  16. Duan, J.D.; Liu, J.J.; Xiao, Q.; Fan, S.G.; Sun, L.; Wang, G.L. Cooperative controls of micro gas turbine and super capacitor hybrid power generation system for pulsed power load. Energy 2019, 169, 1242–1258. [Google Scholar] [CrossRef]
  17. Bellache, K.; Camara, M.B.; Dakyo, B. Transient power control for diesel-generator assistance in electric boat applications using supercapacitors and batteries. IEEE J. Emerg. Sel. Top. Power Electron. 2017, 6, 416–428. [Google Scholar] [CrossRef]
  18. Xiao, Z.X.; Li, H.M.; Fang, H.W.; Guan, Y.Z.; Guerrero, J.M. Operation control for improving energy efficiency of shipboard microgrid including bow thrusters and hybrid energy storages. IEEE Trans. Transp. Electrif. 2020, 6, 856–868. [Google Scholar] [CrossRef]
  19. Wang, X.B.; Huang, W.T.; Tai, N.L.; Wen, L.; Fan, F. A tie-line power smoothing strategy for microgrid with heat and power system using source-load-storage coordination control. Trans. China Electrotech. Soc. 2020, 35, 2817–2829. [Google Scholar]
  20. Li, Y.M.; Ding, Z.M.; Yu, Y.H.; Liu, Y.B. Hybrid energy storage power allocation strategy based on parameter-optimized VMD algorithm for marine micro gas turbine power system. J. Energy Storage 2023, 73, 109189. [Google Scholar] [CrossRef]
  21. Park, D.; Zadeh, M. Modeling and predictive control of shipboard hybrid DC power systems. IEEE Trans. Transp. Electrif. 2020, 7, 892–904. [Google Scholar] [CrossRef]
  22. Baek, G.H.; Choi, D.G.; Choi, I.G.; Kim, T.K. Research on optimal operation plan for parallel operation of marine diesel generator. J. Korea Ind. Inf. Syst. Res. 2023, 28, 11–19. [Google Scholar]
  23. Nyrkov, A.; Sokolov, S.; Zhilenkov, A.; Chernyi, S. Complex modeling of power fluctuations stabilization digital control system for parallel operation of gas-diesel generators. In Proceedings of the 2016 IEEE NW Russia Young Researchers in Electrical and Electronic Engineering Conference (EIConRusNW), Petersburg, Russia, 2–3 February 2016; pp. 636–640. [Google Scholar]
  24. Zaccone, R.; Campora, U.; Martelli, M. Optimisation of a diesel-electric ship propulsion and power generation system using a genetic algorithm. J. Mar. Sci. Eng. 2021, 9, 587. [Google Scholar] [CrossRef]
  25. Ji, F.; Fu, L.J.; Ye, Z.H.; Xiong, Y.X.; Ma, F. Experimental research of MVDC parallel operation generator sets for vessel integrated power system. J. Nav. Univ. Eng. 2017, 29, 11–16. [Google Scholar]
  26. Zhang, G.; Khan, I.A.; Daraz, A.; Basit, A.; Khan, M.I. Load frequency control of marine microgrid system integrated with renewable energy sources. J. Mar. Sci. Eng. 2023, 11, 844. [Google Scholar] [CrossRef]
  27. Anand, S.; Fernandes, B.G.; Guerrero, J. Distributed control to ensure proportional load sharing and improve voltage regulation in low-voltage DC microgrids. IEEE Trans. Power Electron. 2012, 28, 1900–1913. [Google Scholar] [CrossRef]
  28. Wang, M.; Tang, F.; Chen, Q.Y.; Wu, X.Z.; Niu, J.K. Passivity-based control and large signal stability of DC-DC converter parallel system. Proc. CSEE 2022, 42, 6789–6803. [Google Scholar]
  29. Wang, P.B.; Lu, X.N.; Yang, X.; Wang, W.; Xu, D. An improved distributed secondary control method for DC microgrids with enhanced dynamic current sharing performance. IEEE Trans. Power Electron. 2016, 31, 6658–6673. [Google Scholar] [CrossRef]
  30. Muhammad, I.; Majid, M.G. Master-slave design for frequency regulation in hybrid power system under complex environment. IET Renew. Power Gener. 2022, 16, 3041–3057. [Google Scholar]
  31. Wang, G.; Song, Y.H.; Cao, S.X.; Duan, J. Novel adaptive power distribution master–slave control strategy for a biogas-solar-wind battery islanded microgrid based on a microturbine. Electr. Power Syst. Res. 2023, 224, 109743. [Google Scholar] [CrossRef]
  32. Zhang, B.; Gorbachev, S.; Dou, C.; Kuzin, V.; Park, J.H.; Zhang, Z.Q.; Yue, D. Source-storage-load coordinated master-slave control strategy for islanded microgrid considering load disturbance and communication interruption. IEEE Trans. Cybern. 2024, 54, 1768–1781. [Google Scholar] [CrossRef] [PubMed]
  33. Faddel, S.; Saad, A.A.; Youssef, T.; Mohammed, O. Decentralized control algorithm for the hybrid energy storage of shipboard power system. IEEE J. Emerg. Sel. Top. Power Electron. 2019, 8, 720–731. [Google Scholar] [CrossRef]
  34. Liu, Z.M.; Liu, Y.B.; Yu, Y.H.; Yang, R.; Chen, Y.Y. Improved design of transient power sharing strategy for AES multi-gensets in response to high power load mutation. Energy Rep. 2023, 9, 5323–5335. [Google Scholar] [CrossRef]
  35. Yang, C.; Gao, F.; Zhang, B. An improved nonlinear droop control strategy in DC microgrids. IEEE Trans. Power Electron. 2024, 39, 5058–5073. [Google Scholar] [CrossRef]
  36. Yehia, M.; Numair, M.; Mansour, D.A. Novel IoT-based droop control for battery SoC balancing among multiple microgrids. IEEE Trans. Smart Grid 2024, 15, 1304–1316. [Google Scholar] [CrossRef]
  37. Khersonsky, Y. New IEEE Power Electronics Standards for Ships. In Proceedings of the 2011 IEEE Electric Ship Technologies Symposium, Alexandria, VA, USA, 10–13 April 2011. [Google Scholar]
  38. Li, Y.M. Research on Control Strategies for Marine Micro Gas Turbine DC Power Generation Systems. Master’s Thesis, Wuhan Naval University of Engineering, Wuhan, China, 2024. [Google Scholar]
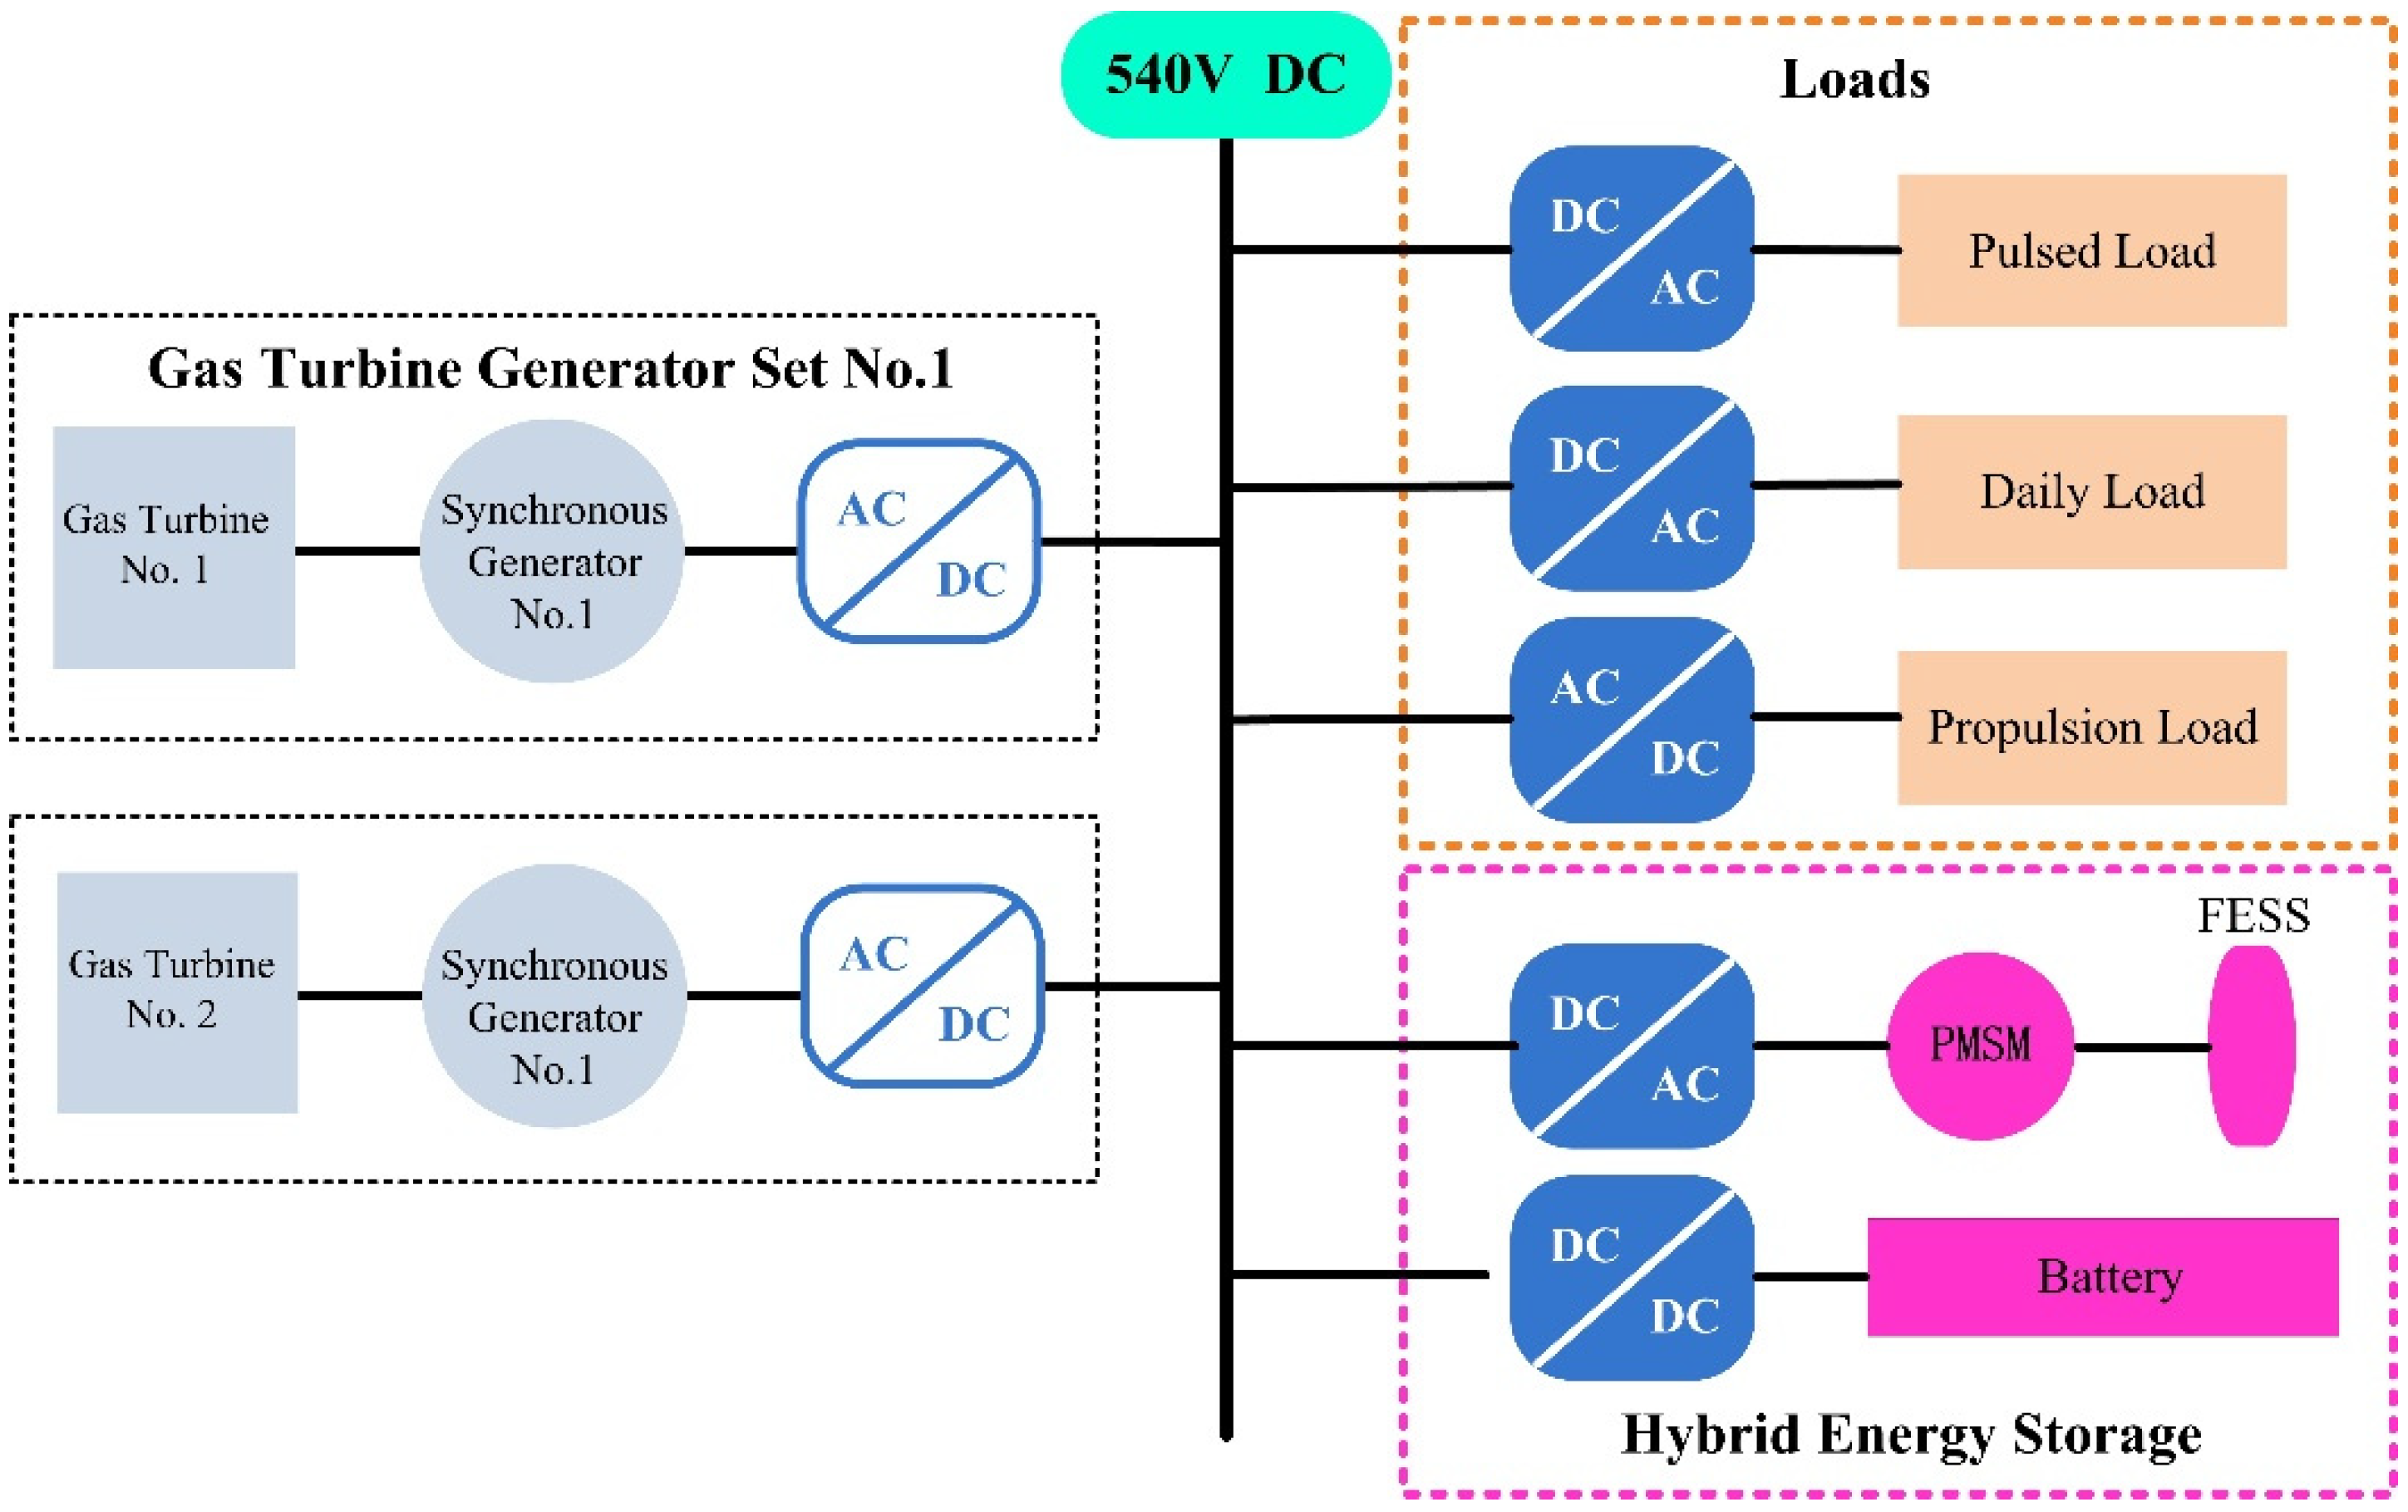
Figure 1. Basic structure of a marine micro gas turbine DC power generation system.
Jmse 13 00771 g001
Figure 2. Schematic diagram of droop control principle in marine DC power systems.
Jmse 13 00771 g002
Figure 3. Schematic diagram of improved droop control in marine DC power systems.
Jmse 13 00771 g003
Figure 4. Control structure of DCBV during the parallel operation of gas turbine generator sets.
Jmse 13 00771 g004
Figure 5. Output power variation waveform of gas turbine generator No. 1 and No. 2 under propulsion load changes.
Jmse 13 00771 g005
Figure 6. Variation waveform of the DCBV under propulsion load changes.
Jmse 13 00771 g006
Figure 7. Variation waveform of power turbine speed of the No. 1 gas turbine under propulsion load changes.
Jmse 13 00771 g007
Figure 8. Variation waveform of the turbine speed of the No. 2 gas turbine under propulsion load changes.
Jmse 13 00771 g008
Figure 9. Power sharing deviation between gas turbine generator sets under propulsion load changes.
Jmse 13 00771 g009
Figure 10. Power variation waveform of the system under Sudden load changes.
Jmse 13 00771 g010
Figure 11. Variation waveform of the DCBV under Sudden load changes.
Jmse 13 00771 g011
Figure 12. Current variation waveform of system under Sudden load changes.
Jmse 13 00771 g012
Figure 13. Variation waveform of the power turbine speed of the No. 1 gas turbine under Sudden load changes.
Jmse 13 00771 g013
Figure 14. Variation waveform of the turbine speed of the No. 2 gas turbine under Sudden load changes.
Jmse 13 00771 g014
Figure 15. Power sharing deviation between gas turbine generator sets under Sudden load changes.
Jmse 13 00771 g015
Figure 16. Power feedforward curves of FESS under Sudden load changes.
Jmse 13 00771 g016
Figure 17. Power feedforward curve of gas turbine generator sets under Sudden load changes.
Jmse 13 00771 g017
Figure 18. Fitness function curve considering sudden load changes.
Jmse 13 00771 g018
Figure 19. Optimized reference power curves of FESS, gas turbine generator sets and battery considering sudden load changes.
Jmse 13 00771 g019
Figure 20. Output power variation waveforms of gas turbine generator No. 1 and No. 2 considering sudden load changes.
Jmse 13 00771 g020
Figure 21. Power variation waveform of the energy storage system considering sudden load changes.
Jmse 13 00771 g021
Figure 22. Variation waveform of the DCBV considering sudden load changes.
Jmse 13 00771 g022
Figure 23. Variation waveform of the power turbine speed of the No. 1 gas turbine considering sudden load changes.
Jmse 13 00771 g023
Figure 24. Variation waveform of the turbine speed of the No. 2 gas turbine considering sudden load changes.
Jmse 13 00771 g024
Figure 25. Power distribution difference between gas turbine generator sets considering sudden load changes.
Jmse 13 00771 g025
Figure 26. Power feedforward curves of the FESS under Rectangular-wave pulsed load.
Jmse 13 00771 g026
Figure 27. Power feedforward curve of gas turbine generator sets under Rectangular-wave pulsed load.
Jmse 13 00771 g027
Figure 28. Fitness function curve considering rectangular-wave pulsed load.
Jmse 13 00771 g028
Figure 29. Optimized reference power curves of the FESS, gas turbine generator sets, and battery considering rectangular-wave pulsed load.
Jmse 13 00771 g029
Figure 30. Output power variation waveforms of gas turbine generators No. 1 and No. 2 considering rectangular-wave pulsed load.
Jmse 13 00771 g030
Figure 31. Power variation waveform of the energy storage system considering rectangular-wave pulsed load.
Jmse 13 00771 g031
Figure 32. Variation waveform of the DCBV considering rectangular-wave pulsed load.
Jmse 13 00771 g032
Figure 33. Variation waveform of power turbine speed the No. 1 gas turbine considering rectangular-wave pulsed load.
Jmse 13 00771 g033
Figure 34. Variation waveform of the turbine speed of the No. 2 gas turbine considering rectangular-wave pulsed load.
Jmse 13 00771 g034
Figure 35. Power distribution difference between gas turbine generator sets considering rectangular-wave pulsed load.
Jmse 13 00771 g035
Figure 36. Basic structure of the experimental platform of the marine micro gas turbine DC power generation system.
Jmse 13 00771 g036
Figure 37. Current variation waveforms of the pulsed load with or without the energy storage system.
Jmse 13 00771 g037
Figure 38. Output power variation waveform of the gas turbine generator set without energy storage.
Jmse 13 00771 g038
Figure 39. Output power variation waveform of the gas turbine generator set with energy storage.
Jmse 13 00771 g039
Figure 40. Comparison of the power sharing deviation waveforms between the gas turbine generator sets with or without energy storage.
Jmse 13 00771 g040
Figure 41. Power variation waveform of the FESS.
Jmse 13 00771 g041
Figure 42. Variation waveform of the DCBV, with or without energy storage.
Jmse 13 00771 g042
Figure 43. Variation waveform of the power turbine speed of the No. 1 gas turbine, with or without energy storage.
Jmse 13 00771 g043
Figure 44. Variation waveform of gas turbine speed of the No. 2 gas turbine, with or without energy storage.
Jmse 13 00771 g044
Table 1. Major parameters of the simulation model for the gas turbine generator set with FESS.
DeviceDesign Parameters
No. 1 GTPGSRated power/kWRated speed of turbine/(r/min)Maximum speed of turbine/(r/min)Maximum acceleration of the rotor/(r/s)Inertia constants/(s)
20039,00044,0005005
No. 2 GTPGSRated power/kWRated speed of turbine/(r/min)Maximum speed of turbine/(r/min)Maximum acceleration of the rotor/(r/s)Inertia constants/(s)
10051,00053,0005002
FESSRated speed/(r/min)Maximum speed
/(r/min)
Maximum charge/discharge work/kWMoment of inertia
/(kg⋅m2)
30,00036,0001201.83
BESSRated voltage/VCapacity/AhInitial SOC/%Rated discharge current/A
4001008044
Table 2. Variation characteristics of the DCBV under Rectangular-wave pulsed load.
CaseTransient Fluctuations of Bus Voltage/VTransient Fluctuation Rate of Bus Voltage
Without FESSWith FESSWithout FESSWith FESS
Maximum transient drop9.37.51.72%1.39%
Maximum transient jump5.954.981.10%0.92%
Disclaimer/Publisher’s Note: The statements, opinions and data contained in all publications are solely those of the individual author(s) and contributor(s) and not of MDPI and/or the editor(s). MDPI and/or the editor(s) disclaim responsibility for any injury to people or property resulting from any ideas, methods, instructions or products referred to in the content.