Abstract
Axial waterjets are widely used for marine propulsion due to their efficiency and maneuverability. However, conventional design procedures heavily rely on empirical correlations and simplified models, limiting their ability to fully exploit the hydrodynamic performance potential of these devices. The study highlights how Simulation-Based Design Optimization (SBDO) approaches, coupled with the high-fidelity simulations required to hydrodynamically characterize the complex phenomena that occur in the case of waterjets, can enable the identification of non-intuitive design improvements over a wider design space that may be missed by traditional methods. In particular, the Reynolds-Averaged Navier–Stokes (RANS) equations are used to provide accurate performance predictions, capturing complex flow phenomena such as secondary flows (i.e., leakage vortices) and pressure distributions critical to waterjet design, of systematically varied configurations using a 42-dimensional parametric model. Simplified key performance indicators, in the specific cavitation inception obtained from the non-cavitating analysis, work in conjunction with the calculated hydraulic efficiency to identify geometries capable of improving (or not worsening) efficiency while postponing cavitation. The systematic and automated analysis of thousands of different configurations, iteratively modified by a genetic algorithm, is finally able to identify better waterjets, whose performances are confirmed by dedicated cavitating RANSE analyses. This demonstrates how RANS-based simulations, integrated with optimization algorithms, can lead to superior axial waterjet designs, providing a flexible, more robust, and effective methodology compared to conventional approaches.
1. Introduction
Axial waterjets represent a widely adopted propulsion solution for high-speed marine vessels, offering a combination of efficiency, maneuverability, and reduced appendage drag compared to conventional propellers. They are particularly advantageous in applications where shallow draft, high-speed operation, and rapid maneuverability are essential, such as military vessels, high-speed ferries, and rescue boats. In recent years, much attention has been paid to this type of unconventional propulsors and to pumpjets, as they use the very similar concept of combining a rotor with one or more stator stages to recover the energy losses of the rotor wake. The most obvious difference is only the presence of a nozzle (accelerating or decelerating, depending on the type of application) in the case of pumpjets (which makes them more similar to ducted propellers), whereas axial waterjets are mainly designed to operate inside a converging pipe.
Experimental and numerical studies of the very complex phenomena occurring for this type of device evolved hand in hand. Beyond general cavitation evolution, research has primarily focused on blade Tip Leakage Vortex (TLV, originating in the gap between the rotor blade tip and the internal surface of the pipe) and the resulting TLV cavitation. Zhang et al. [1] conducted experimental investigations into TLV cavitation and the periodic collapse and interactions of the TLV-induced suction-side-perpendicular cavitating vortex with the cloud cavitation at the trailing edge of the sheet cavity at the blade tip also observed in [2,3,4,5,6,7]. This interaction, which causes the re-orientation of the cloud cavitation in a direction perpendicular to the suction side of the rotor and the downstream convection of the resulting vapor structures through the blade passage (the so-called “perpendicular cavitating vortices” of [7]) is a very peculiar cavitating feature of axial waterjets. Turbulent flows within an axial waterjet pump have been analyzed using stereoscopic particle image velocimetry measurements on both meridional planes and on the leakage vortex region [6,8,9,10] while Tan et al. [7] also experimentally investigated the pump performance breakdown in relation to large-scale cavitating vortical structures, concluding that interactions between TLV and cloud cavitation on the blade suction side of the neighboring rotor blades are the primary cause of performance degradation.
Numerical analyses were used to replicate and complement experimental observations. Lindau et al. [11] and Schroeder et al. [12] carried out RANSE calculations to investigate the performance reduction, observing that choking of axial waterjets was related to cavity bubbles extended up to the trailing edge of the rotor blades. From the same authors [13], further studies were carried out to model the cavitating flow by employing Transport Equation Models (TEMs) and the homogeneous mixture approach, combined iteratively with axisymmetric body force distributions (the “powering iteration”), to account for the blockage effect of blades not directly included in the calculations. Avanzi et al. [14] tuned the Zwart mass transfer model for cavitation and studied its interactions with several turbulence models (1-, 2-, and 4-equations models) within RANSE to identify an optimal setup to predict thrust breakdown. Huang et al. [15] similarly adopted the well-established k-omega Shear Stress Transport (STT) turbulence model and the Zwart mass transfer model to predict the unsteady cavitation when the axial waterjet of their analyses was subjected to the non-uniform inflow represented by the boundary layer of the hull after its interaction with the pipe at inlet. Guo et at. [16] modified the Zwart cavitation model and performed investigations on the tip leakage vortex evolution and its influence on induced pressure pulses. However, since experiments of Wu et al. [5,6,9,10] have shown the anisotropic nature of the TVL, which is controlled by several interacting shear layers, most of the numerical investigations aimed at accurately characterizing the dynamics of tip vortices inside axial waterjets addressed the problem by using Large Eddy Simulations (LES). Arabnejad et al. [17] proposed LES analyses of the AxWJ-2 axial waterjet pump [18] using subgrid-scale models and transport equations for the cavitation modeling from the OpenFOAM library. Han et al. [19] studied the cavitation of the tip vortex and the mutual influence with the tip vortex dynamic, while Liu et al. [20] investigated the spatio–temporal evolution of cavitating vortical structures at the tip of axial pumps employing LES with the wall-adapting local eddy (WALE) subgrid model and the Burger vortex cavitation model (BVCM), based on the Burgers vortex, to simulate the tip leakage vortex cavity [21]. Hybrid models (i.e., DES, Detached Eddy Simulations, and its variants) were employed as well, with the specific aim of analyzing the wake and tip vortex dynamics, their destabilization, and their interactions with the stator blades. It was mainly RIM-driven thrusters (with their peculiarities attributed to the completely sealed gap at the blade tip) and pumpjets, in Rotor/Stator and Stator/Rotor configurations further than conventional propellers [22,23,24,25,26,27,28,29,30], that underwent these systematic analyses showing promising results at a fraction of the computational cost of LES calculations.
In most cases, the object of experimental and numerical investigations was the AxWJ-2 propulsor [18]. In the literature, indeed, there is a lack of usable geometries of axial waterjets and that of the AxWJ-2, thanks to the availability of several experiments including cavitation observations and flow visualizations using non-intrusive laser-based techniques, that could serve as the preferred candidate for the validation of CFD methods. The scarcity of available geometries for testing and validation depends on the common applications, which are of military nature, this type of device had over the years. Only recently, indeed, were axial waterjets exploited for commercial activities, before being extensively studied for this scope. For the same reasons, design methods are not fully established, and sometimes still rely on empirical correlations, simplified potential flow models, and low-fidelity simulations. The AxWJ-2 waterjet, for instance, was designed itself thanks to a combination of different tools. As described in [18], the waterjet was the result of several steps: a preliminary parametric study, using concentrate parameters models and empirical correlation to assess the efficiency, iterations between a vortex-lattice blade design code and an Euler solver to define the shape of the rotor and stator blades, plus some manual iterations, based on full RANSE analyses of intermediate geometries, to adjust the input values (i.e., advance coefficient) of the design process based on vortex-lattice plus Euler solver to match the absorbed torques (RANSE and vortex-lattice) and ensure shock-free entry of the blades. This design strategy is mainly based on the procedure developed by Taylor et al. [31] and Kerwin et al. [32], who employed a lifting-surface design code combined with RANSE or Euler flow predictions of the flow in the passage realized by the hub and the casing of the pipe [33]. Other potential-based approaches (i.e., Boundary Element Methods, BEM), like PROPCAV [34,35] were adapted as well to deal with axial waterjets thanks to the axial flow predictions provided by finite-volume methodologies and provide slightly more accurate predictions of pressure distributions over the blades, which are potentially usable in place of vortex-lattice methods (VLMs) in the design process. However, while these methods have been successful in providing reliable designs, they often fail to fully exploit the potential performance gains achievable through more advanced numerical optimization techniques.
One of the main limitations of conventional design methodologies is their reliance on pre-defined geometric parameters and semi-empirical performance predictions, which may not fully capture the complex flow physics governing axial waterjet functioning. Additionally, the use of low-fidelity CFD models often results in suboptimal performance predictions, particularly when dealing with complex flow structures such as tip leakage vortices, secondary flow interactions, and cavitation inception. These limitations hinder the ability to explore a broader design space, thereby limiting opportunities for efficiency improvements. Moreover, conventional approaches may not adequately account for variations in operating conditions [36], leading to designs that perform well under nominal design conditions but suffer from reduced efficiency and increased cavitation risk in off-design scenarios.
To overcome these challenges, the application of optimization-based design methodologies has gained increasing attention in recent years. By leveraging more accurate flow solvers, hydrodynamic shape optimization enables the systematic exploration of a wide range of geometrical configurations, leading to performance enhancements that would be difficult to achieve through traditional approaches. This is the case for conventional propeller design [36,37,38], which was addressed in recent years using Simulation-Based Design Optimization methodologies based on BEM calculations in place of traditional lifting-line and lifting-surface codes. The same can be said for unconventional propulsors and devices [24,39,40] which, for the complexity of the involved hydrodynamic phenomena, were designed for exploiting RANS-based optimization techniques. Simulation-Based Design Optimization allows for the identification of non-intuitive design improvements by coupling advanced optimization algorithms with detailed hydrodynamic analyses. The higher fidelity of the flow solvers employed for the characterization of the key performance indicators of the design allows for a widening of the design space beyond limits usually forced by the inherent limitations of low-fidelity and simplified design methods. This usually is the most effective action towards better performance, offering new opportunities to successfully exploit improved propulsive performance, flow features, and interactions not seen or roughly approximated by low-fidelity approaches. Furthermore, optimization techniques can be employed to balance trade-offs between multiple performance criteria, such as maximizing efficiency while minimizing cavitation risk and structural loads. The integration of surrogate modeling, machine learning-based design space exploration, multi-objective optimization strategies, and space dimensionality reduction methodologies in the design process, made possible by the optimization paradigm, represents a step further towards improved and affordable designs. Especially for unconventional propulsors, for which the computational cost of RANSE-based design-by-optimization strategies is prohibitive, several surrogate-aided frameworks were developed. RIM-driven thrusters, in this respect, were extensively analyzed and designed by combining high-fidelity RANSE analyses and response surface methods [41,42], albeit applied to simplified parametric descriptions (through the expanded area ratio and average pitch) of the blade geometry. Adjoint optimization [43] was used as well to try reducing the computational cost of achieving convergence when using pure metaheuristic, genetic algorithms. Machine learning approaches—including online interactions with the designer [44]—and surrogate models at different levels of fidelity [45] for propeller and energy-saving device designs [46] provided, once included in the optimization process, interesting design trends and guidelines for further- and fully resolved investigations of the optimal geometries. Space dimensionality reduction tools, like those developed in [47,48], provided further assistance towards the reduction of the computational cost to achieve convergence in a multi-objective design problem by identifying a priori the most relevant geometrical features to be included in the exploration and exploitation of the design space of the optimization.
In this context, the paper presents an optimization-driven approach to the design of axial waterjets for marine applications, demonstrating how high-fidelity RANSE CFD can be integrated into a rigorous optimization framework to enhance the performance of the propulsor. To this aim, a geometry, derived from the AxWJ-2 waterjet, is used as a reference for the identification of the design space and the baseline performances. The optimization-based design, using some simplifications of the hydrodynamic problem (involving the use of cavitation inception criteria in place of truly cavitating analyses, mixing plane model in place of fully unsteady rotor/stator interactions, needed for the efficient use of RANSE analyses in a design process that would require thousands of CFD calculations) is carried out with the aim of reducing cavitation and simultaneously increasing (or not excessively worsening) the propulsive efficiency. Detailed CFD analyses, using the cavitation model of Schnerr and Sauer [49], are finally employed to better characterize the performances of a set of optimal geometries identified, by different balancing of the design objectives, on the Pareto front of the optimization. The results highlight the advantages and the flexibility of this methodology over conventional design techniques, which has the potential for delivering more efficient and high-performance waterjet propulsion systems, emphasizing its feasibility for real-world applications.
This discussion is organized as follows. In Section 2, the test case is described and the approximated geometry of the AxWJ-2 waterjet is presented. Section 3 introduces the numerical models adopted for the analyses and the grid sensitivity studies needed to identify the most computationally efficient setup for the systematic calculations of the optimization process presented in Section 4. In addition, the results of the initial geometry (pressure distributions and cavity extensions) are introduced to provide a reference for the design. The optimization problem (parametrization and objectives/constraints of the design) is introduced in Section 4 while results and detailed analyses of the most promising optimized configurations are provided in Section 5.
2. Test Case
Figure 1 shows the geometry of the axial waterjet used as a reference for current design activity. The geometry is a variant of the AxWJ-2 waterjet [18] since the original documents reported only the main geometrical data (chord, pitch, sectional hydrofoil shape at few radial positions) but not all the details regarding the conical/streamline adaptive surfaces used for the 3D-shaping of the rotor and stator blades.
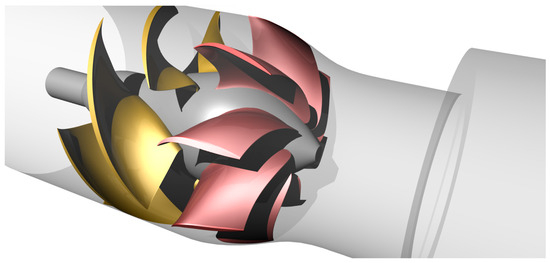
Figure 1.
Geometry of the reference waterjet (modified AxWJ-2).
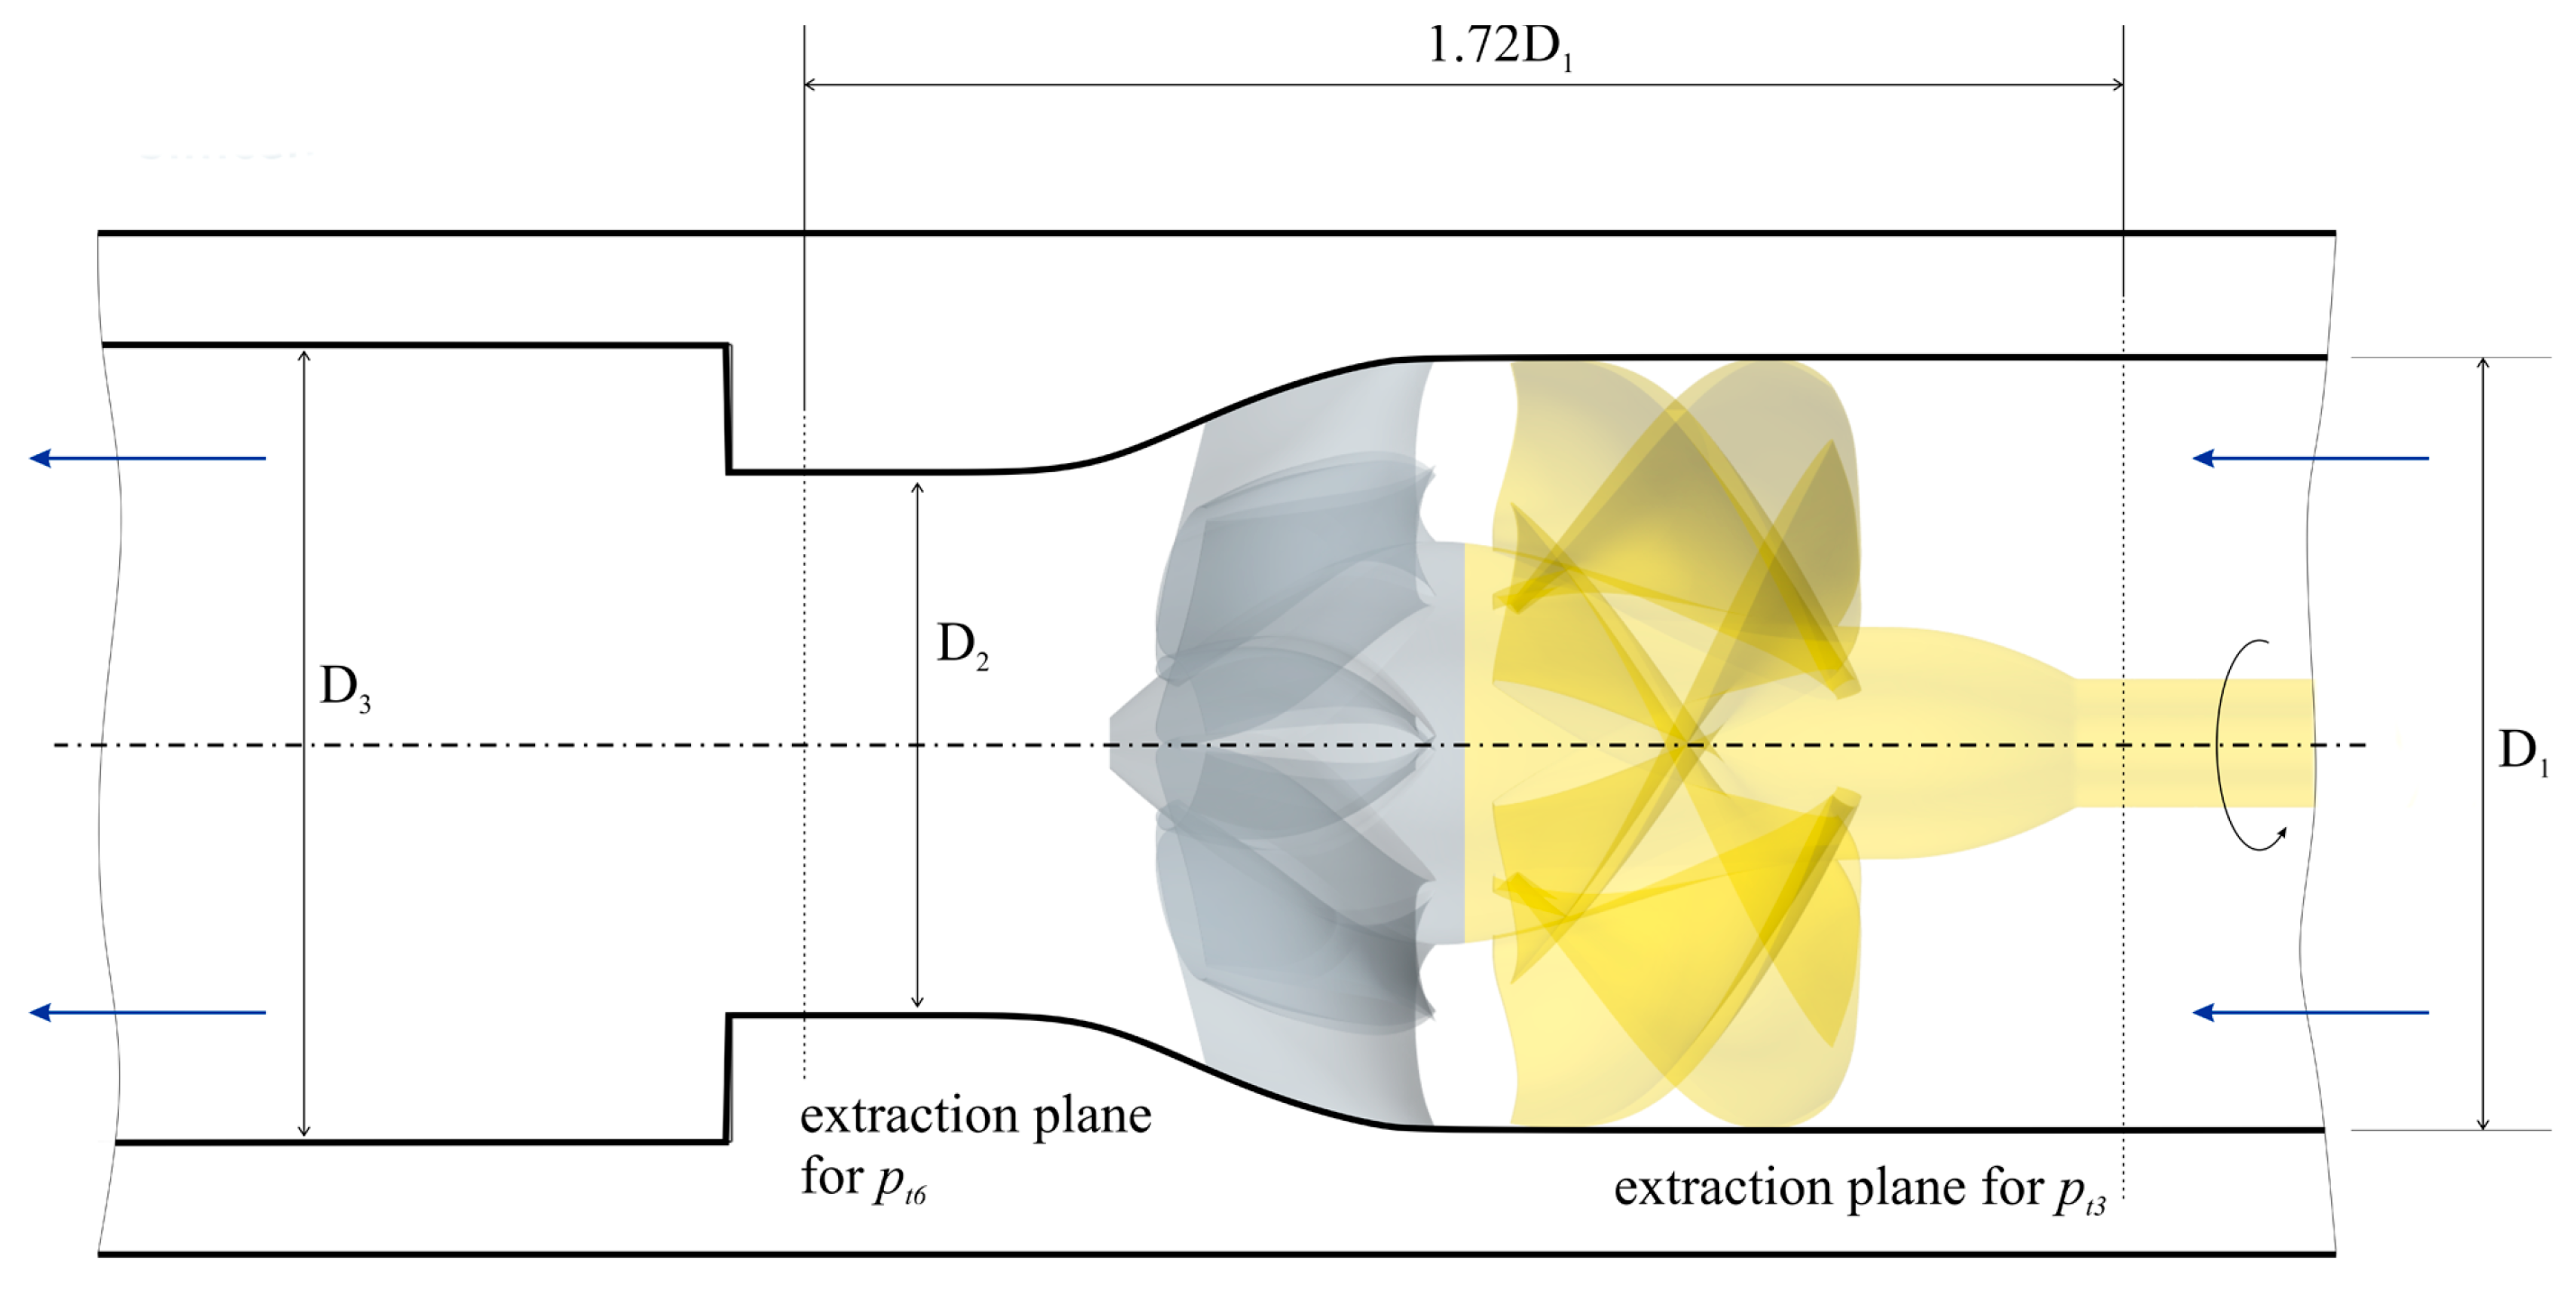
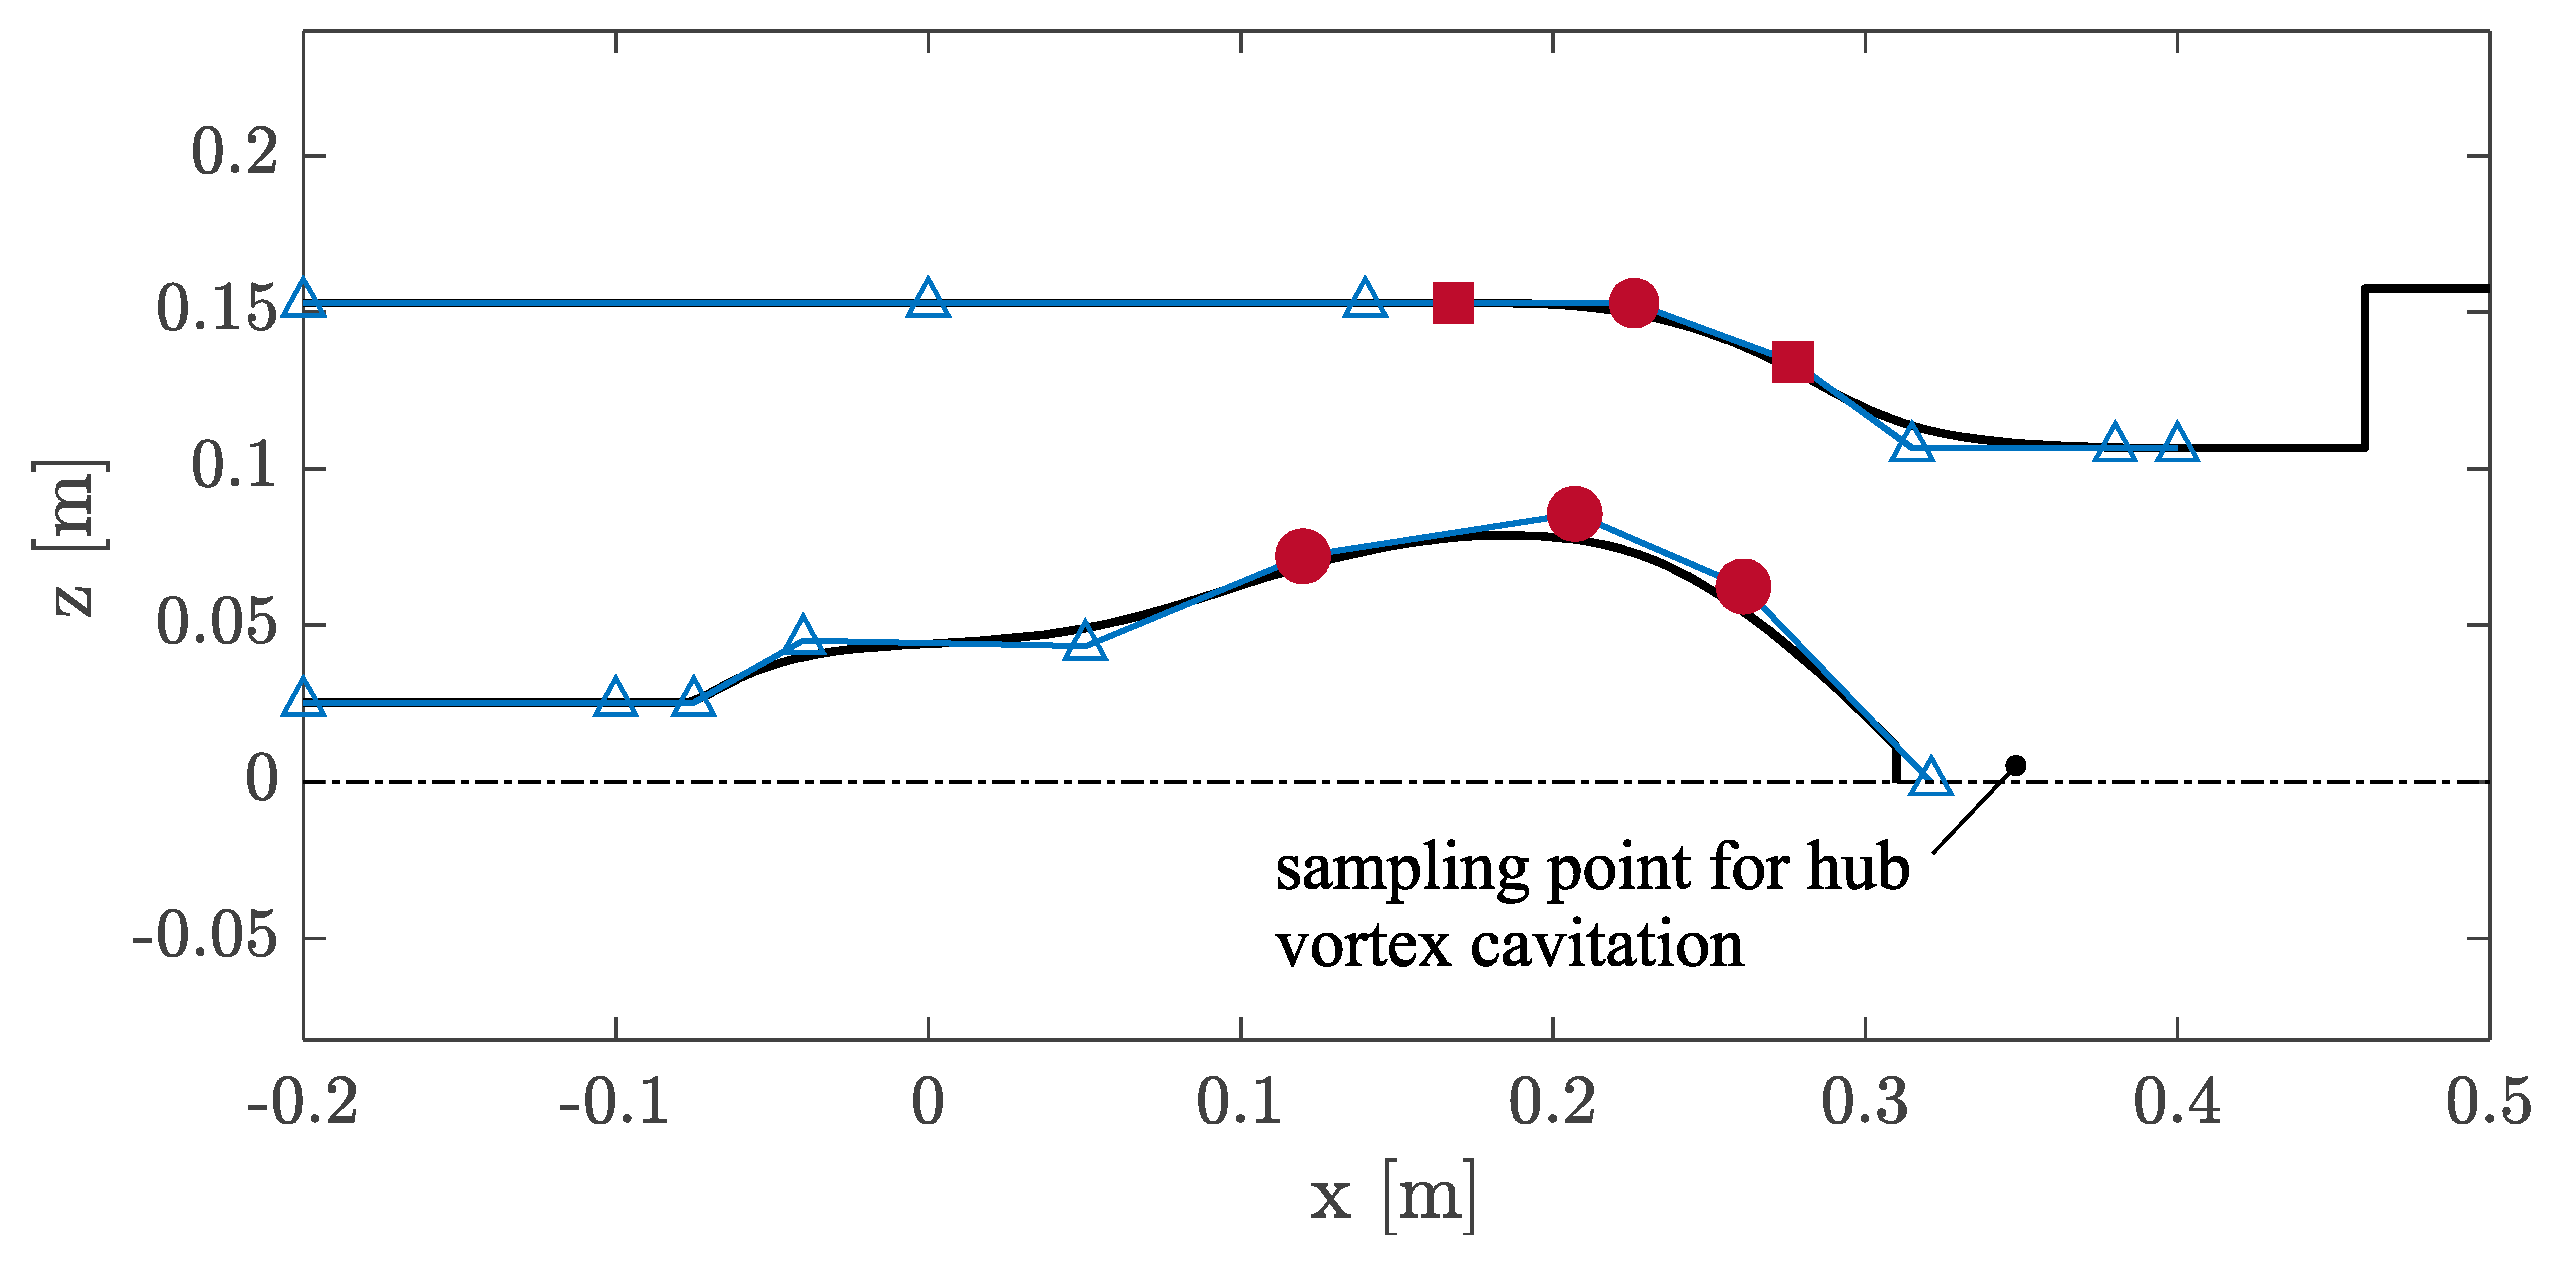
Based on available data and comparison with 3D views, the geometry was reconstructed as similar as possible to that of the AxWJ-2 waterjet. In any case, since it serves only for the shape parametrization and the definition of the design space of the optimization process, such minor variations with respect to the original geometry seem irrelevant to the scope of the work. The comparison with the experimental measurements of the real AxWJ-2 [50,51], shown in Section 3.4, reveals some differences in predicted head and absorbed power (both slightly overestimated for the reconstructed waterjet) but very similar values of efficiency that, in the end, confirm the overall reliability of the reconstructed geometry for the scope of the design activity. As the original AxWJ-2, the reference waterjet consists of a six-blade rotor (diameter DR = 0.3048 m) housed inside a cylindrical casing with a tip clearance of 0.5 mm (internal pipe diameter D1 = 0.3058 m). The nozzle, which has the shape of a revolved spline curve, houses a rectifier stator made of eight blades and has a throat diameter (D2) of 0.2134 m. The internal diameter of the outlet pipe (D3) is equal to 0.315 m. A sketched view of the pipe/nozzle arrangement [7] is given in Figure 2, which also shows the locations of the pressure transducers used to measure the head of the pump.
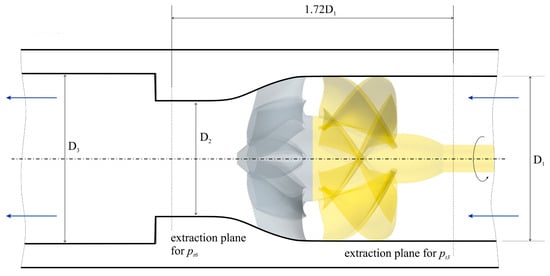
Figure 2.
Reference for main dimensions and pressure sampling locations. More details are available in [7].
Since waterjets are closer to turbomachinery than to propellers, during experiments, performances have been collected [50,51] using turbomachinery conventions and quantities. The functioning condition is controlled by the non-dimensional flow coefficient Q* which depends on the volumetric flow rate QJ. Key performance indicators of the waterjets are the head coefficient H*, the power coefficient P*, and the hydraulic efficiency η:
where n is the rate or revolution (equal to 900 rpm, as in the experiments of [7]), Q is the absorbed torque, ρ is the fluid density, and pt3 and pt6 are the total pressures measured at the inlet and outlet reference planes.
3. Numerical Models
3.1. Governing Equation
The hydrodynamic analyses required for the characterization of the waterjet performance rely on continuity and momentum equations solved under the Reynolds decomposition (Reynolds Averaged Navier Stokes Equations, RANSE). When cavitation is included in analyses, the homogeneous multiphase mixture is a common assumption: the flow field is shared between liquid (“l”) and vapor (“v”) phases (i.e., same pressure, same velocity, without relative motion between phases) and transport equations are solved for the mixture, i.e., a fictitious fluid having physical quantities (density and viscosity) from the weighted average of single phases based on their volume fractions (αl and αv):
where u and p are, respectively, the ensemble-averaged velocity and pressure fields of the mixture, and are the mixture density and molecular viscosity from the volume fractions:
and is the turbulent viscosity used to model the Reynolds stresses using the canonical Boussinesq hypothesis. Among those available, the turbulence model of Menter [52] is used in current analyses to account for these turbulence-induced stresses.
Cavitation, under the homogenous mixture approach, is included instead through a transport equation model, i.e., by adding a convective equation for the conservation of the vapor fraction. This additional equation accounts for phase changes through dedicated vaporization () and condensation () source terms which, in current analyses, are defined through the Schnerr and Sauer [49] cavitation model:
In the current paper, STAR-CCM+, v.16.04.012 [53] is used as the CFD package for all the calculations. When required, implicit first-order time-stepping, using a fixed number of inner iterations (5), is employed for discretizing the transient part of the equations.
3.2. Computational Setup
The computational model of the previous section has been adapted and simplified for the various stages of the design and final assessment of the waterjet performances. For non-cavitating performance predictions, a simpler steady model, using a moving reference frame, was sufficient. To achieve this aim, a source term is needed in the continuity equation to account for the relative motions, and some care is required for the rotor/stator coupling. Since computational efficiency is fundamental for the success of a Simulation-Based Design Optimization entirely based on RANSE, a truly unsteady coupling between the rotor and the stator stages is not feasible. Only time-averaged information through the circumferential averaging process of the velocities granted by a mixing plane [24,54] placed in-between the two stages can feed a computationally efficient design method. The computational setup is consequently realized to comply with these needs: single blade passages of rotor and stator, as shown in Figure 3, are coupled using a mixing plane while periodic boundary conditions account for the axial symmetry of the waterjet geometry. Inlet and outlet pipes are extruded for a length of 3 rotor diameters each.
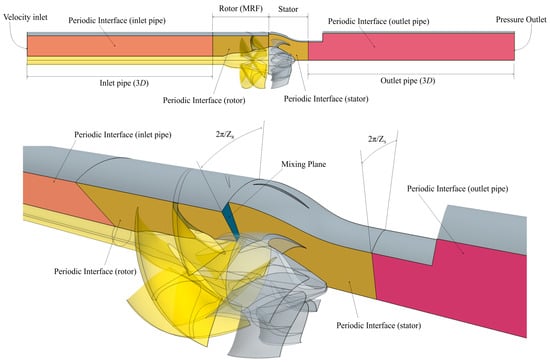
Figure 3.
Computational domain and boundary conditions.
All steady calculations, employing second-order upwind numerical schemes for computing the convective terms of the equations, were carried out using this model. The number of iterations was fixed to 1000, sufficient to achieve converged, non-oscillatory behavior, and by employing, at unchanged prism layers discretization regardless of the mesh density (Section 3.3), the appropriate wall functions of the turbulence model to deal with a non-dimensional y+ equal, on average, to 40 for any of the analyses included in the study.
Only for the final analysis of the reference geometry and the optimized configurations was the complete model, including cavitation, employed. In that case, mixing plane and moving reference frames also allowed for less computationally demanding calculations, at the cost of losing the truly unsteady interaction between rotor and stator blades. Since the cavitation model is inherently unsteady, the calculations make use of an implicit first-order numerical scheme (number of inner iterations fixed equal to 5) to discretize the transient terms of the equations. Performances were collected after 3 complete revolutions.
The computational cost of this type of analysis is not affordable in the optimization process to provide the key performance indicators related to cavitation for design purposes. To this end, the simplest cavitation risk indicator based on the monitoring of the pressure coefficient was adopted since the inception of cavitation occurs when, locally, the pressure coefficient is lower than minus the design cavitation index:
where CPN and σN are the pressure coefficient and the design cavitation index normalized with the rate of revolution n:
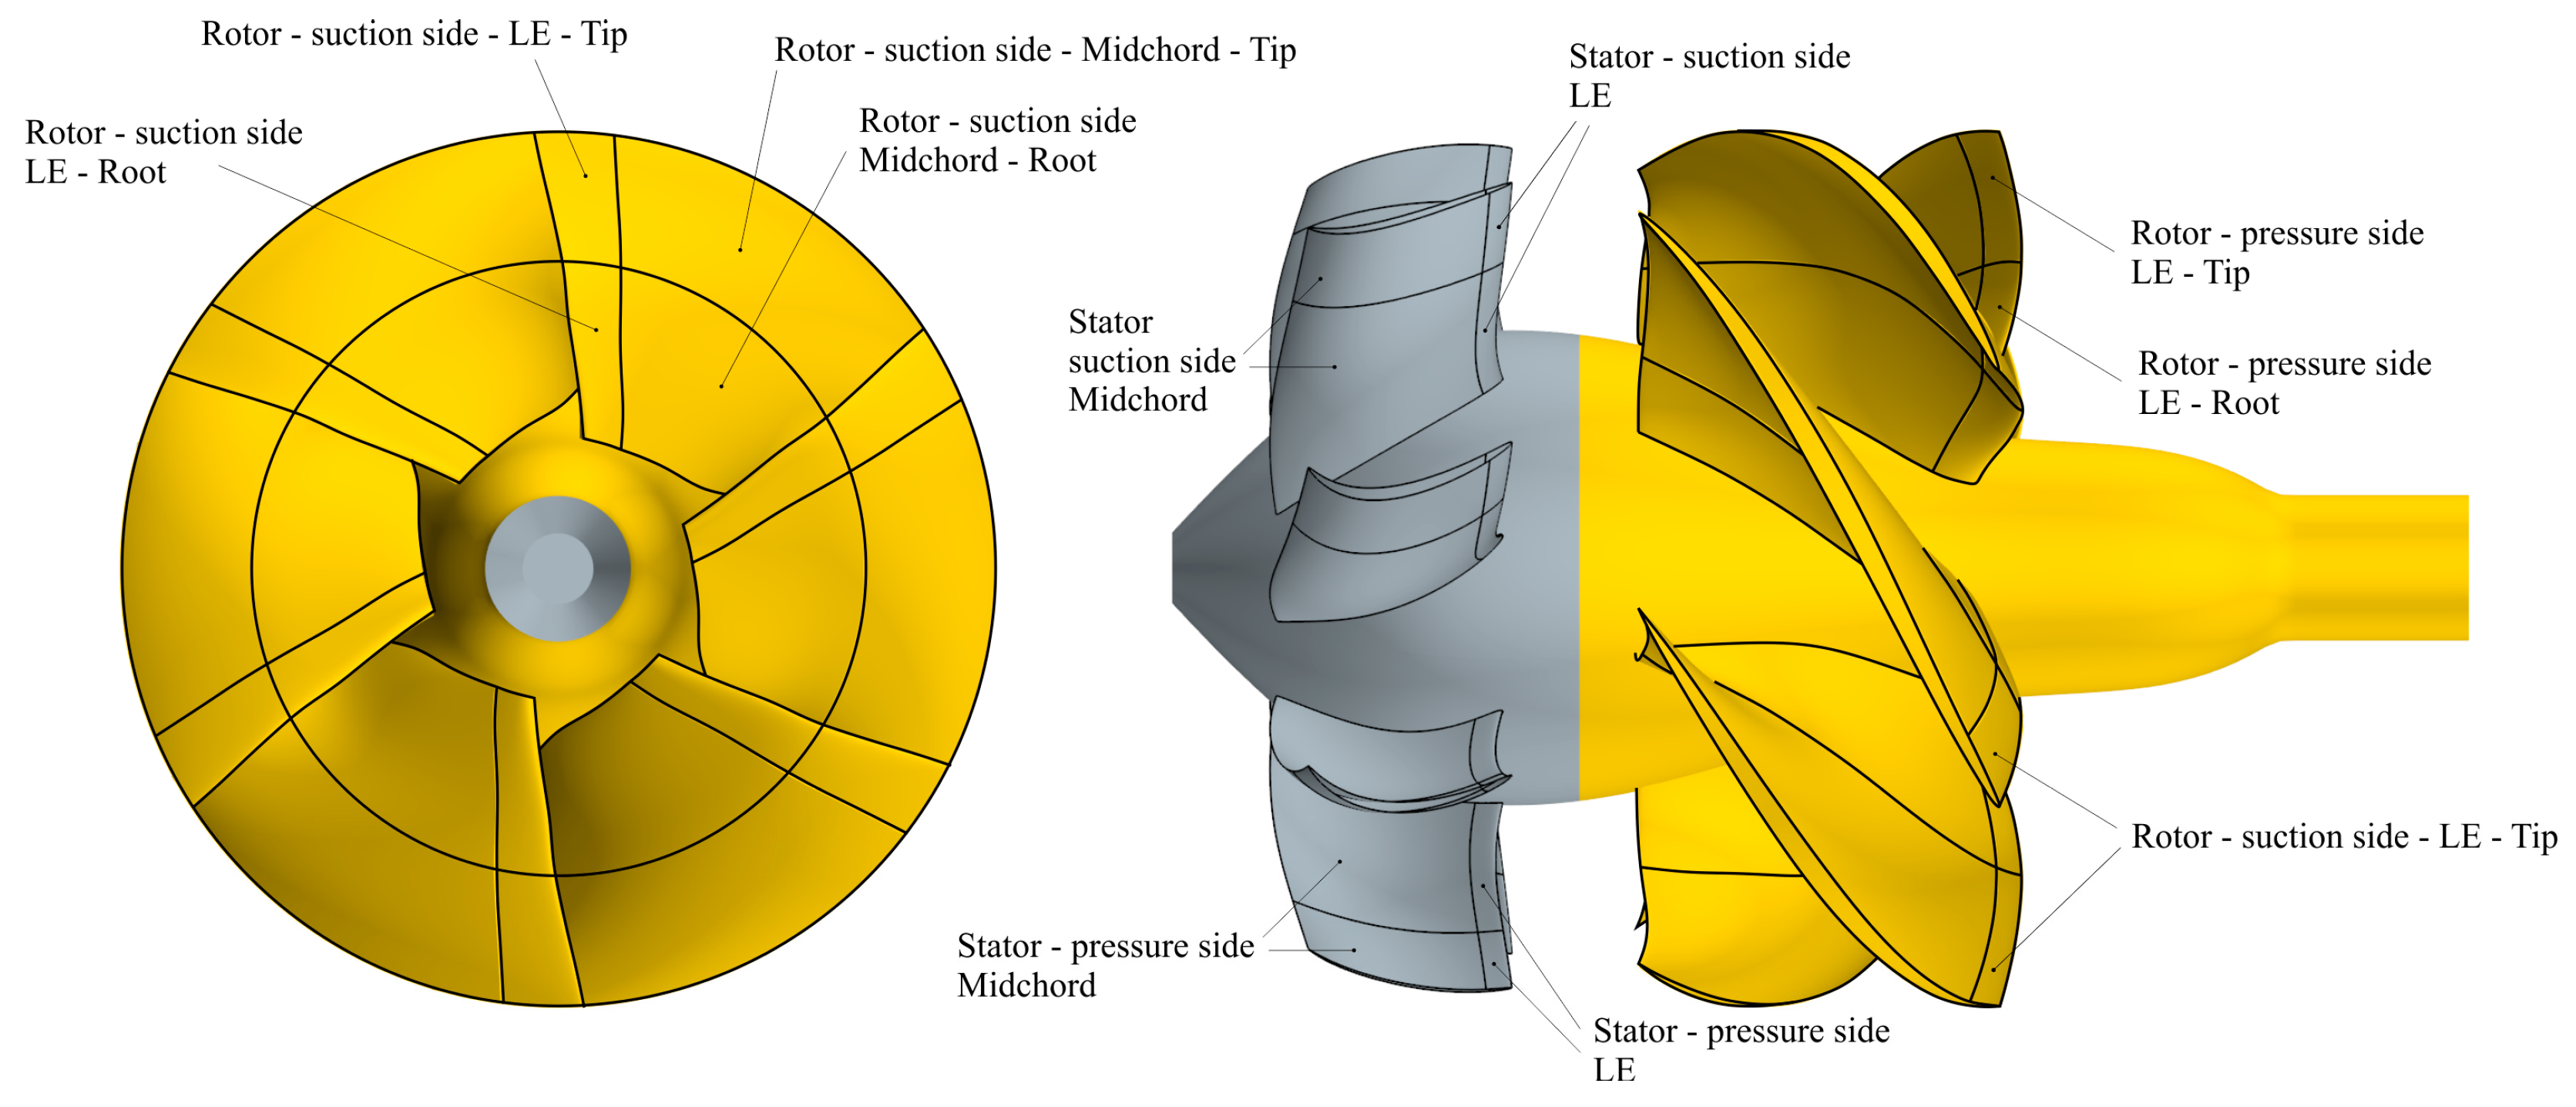
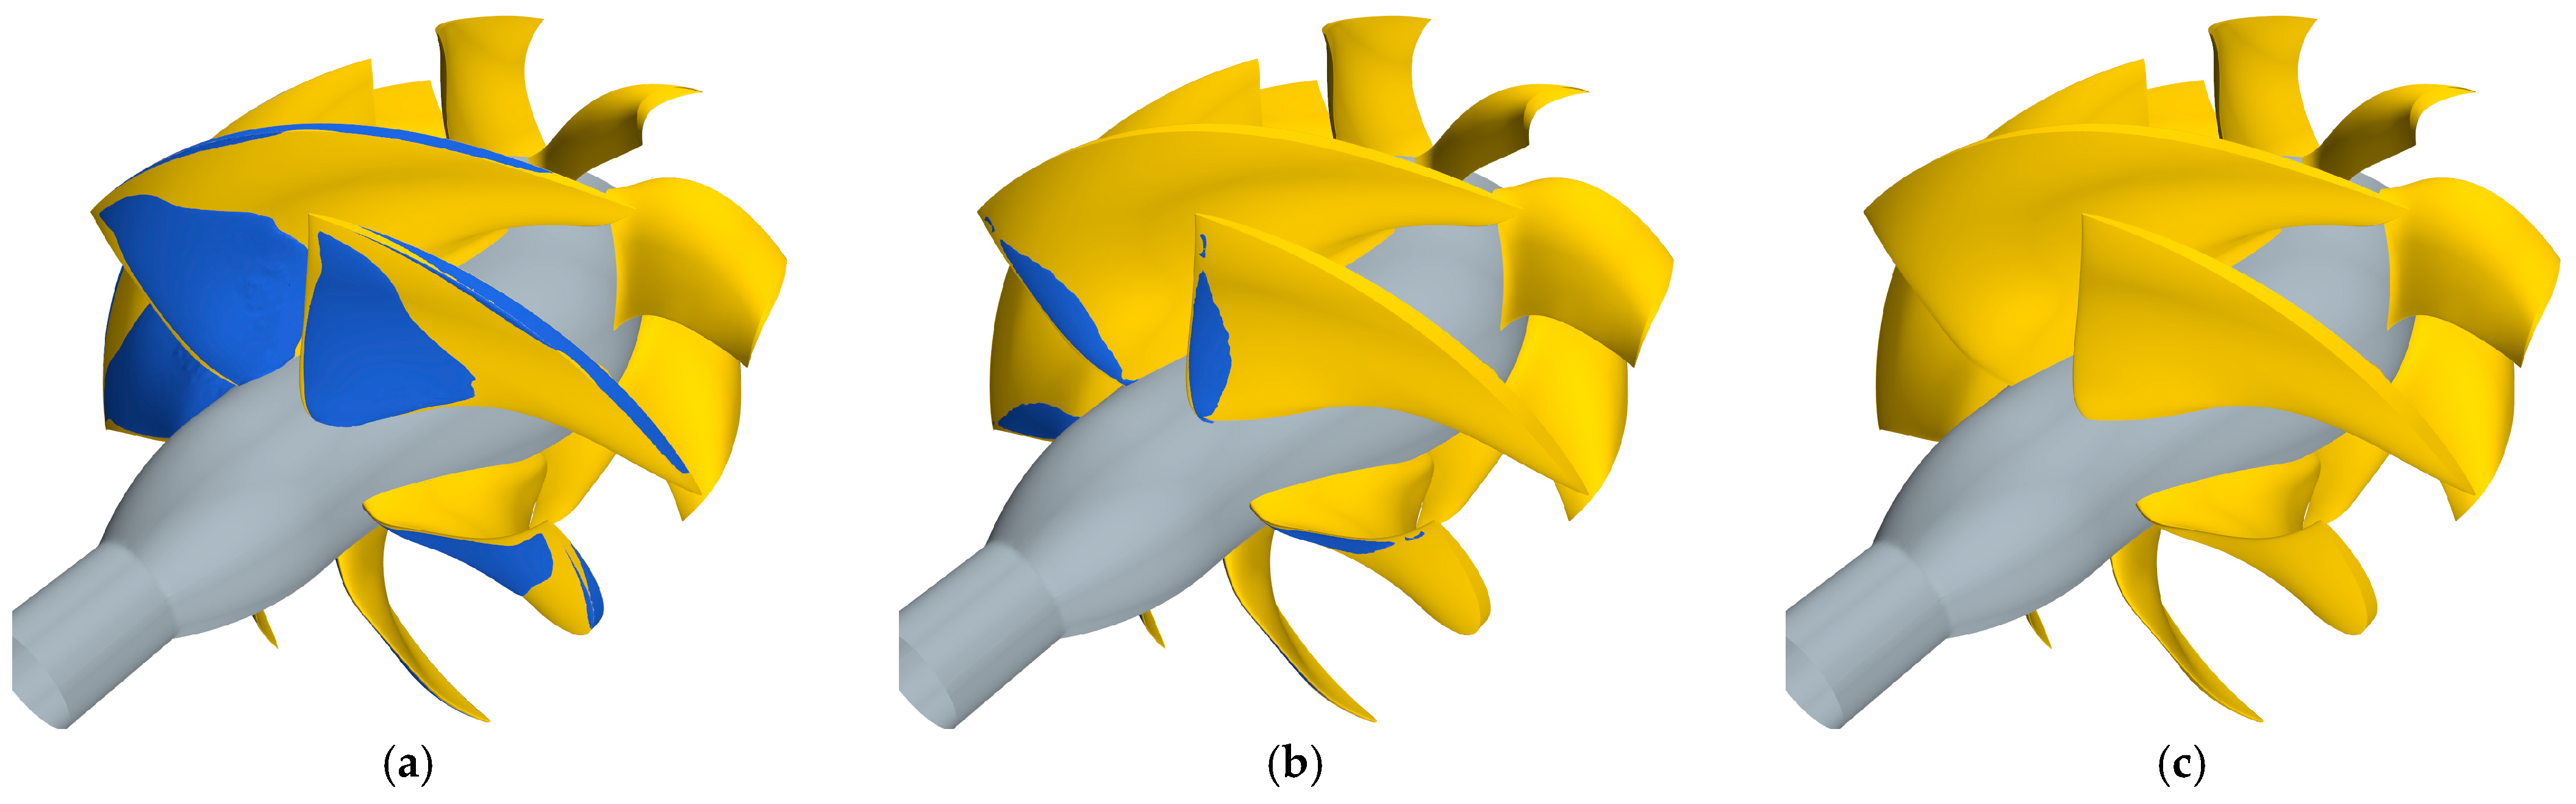
Monitoring these quantities requires only steady non-cavitating data, which can be collected more efficiently and on separate patches over the rotor and the stator blades (Figure 4). This allows, as achieved in similar RANSE-based optimizations of unconventional propulsors, to not only avoid the cost of truly cavitating analyses [24,39,40] but also to distinguish the occurrence of different types of cavitation (sheet, at leading edge, or bubble, at midchord) on both suction and pressure side based on Equation (5) as applied to the patches describing the geometry. This may guide more accurately the design process (and the selection of the optimal configurations) towards geometry capable of avoiding or mitigating the riskiest phenomena (i.e., those on the pressure side or at midchord).
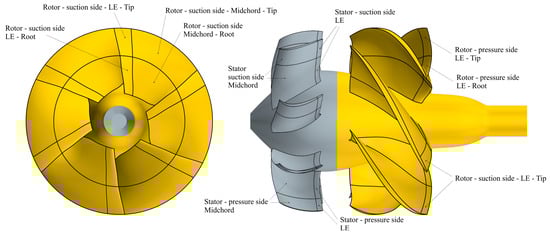
Figure 4.
Rotor and stator blade patches subdivision for pressure sampling.
3.3. Grid Sensitivity Study—Non-Cavitating Analyses
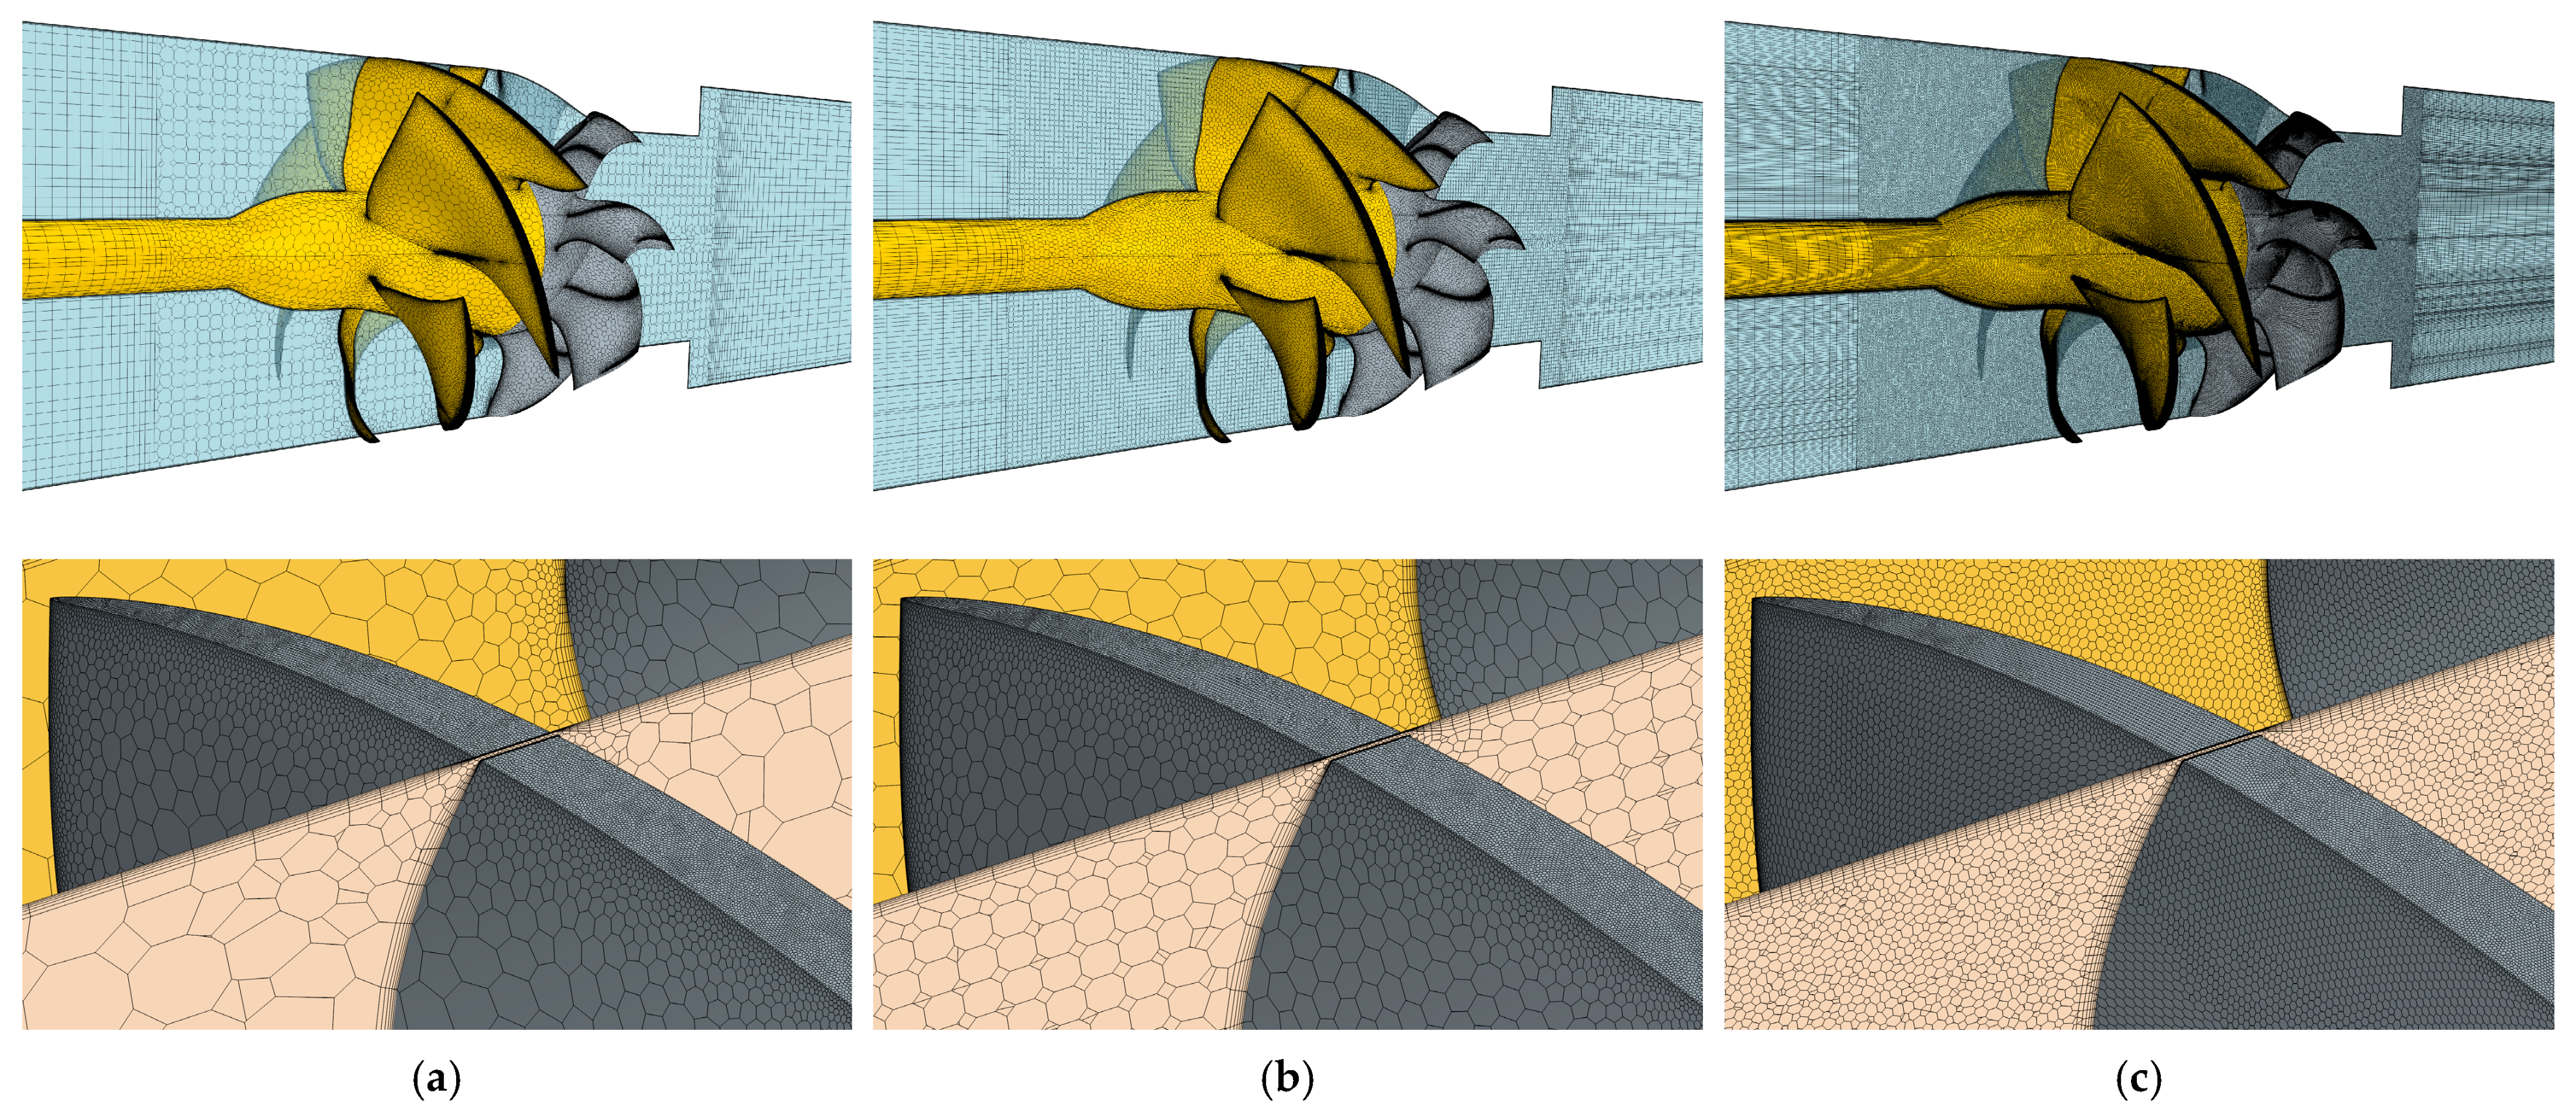
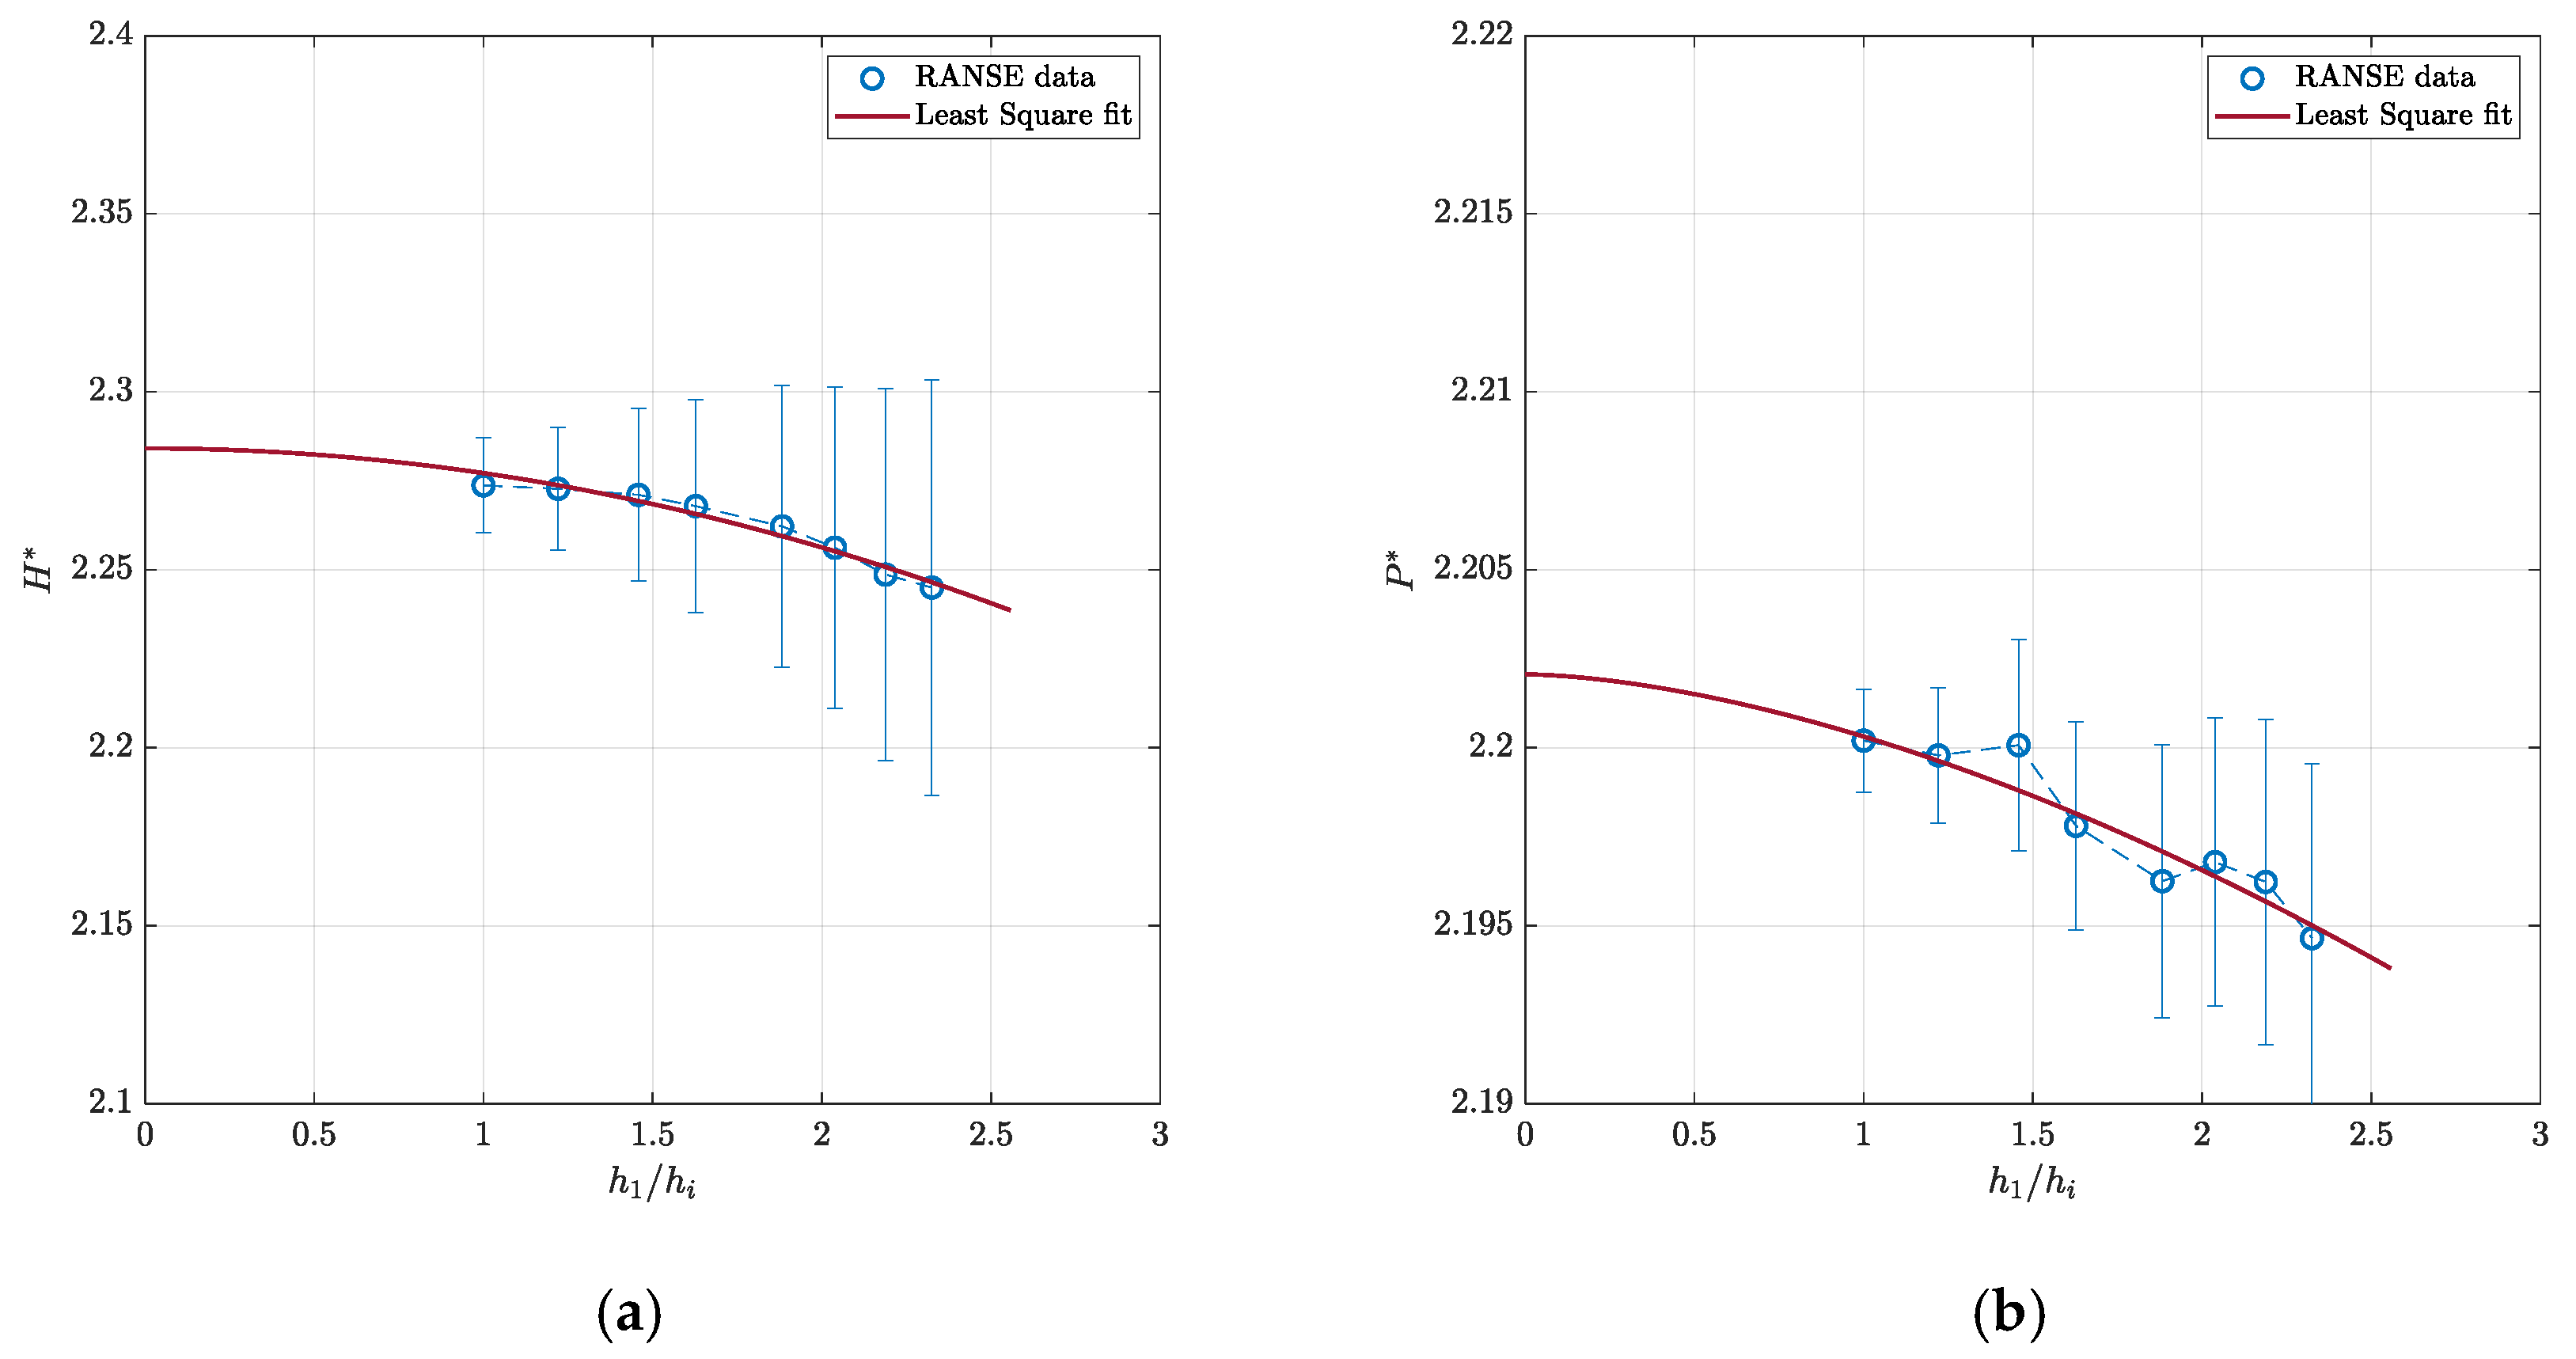
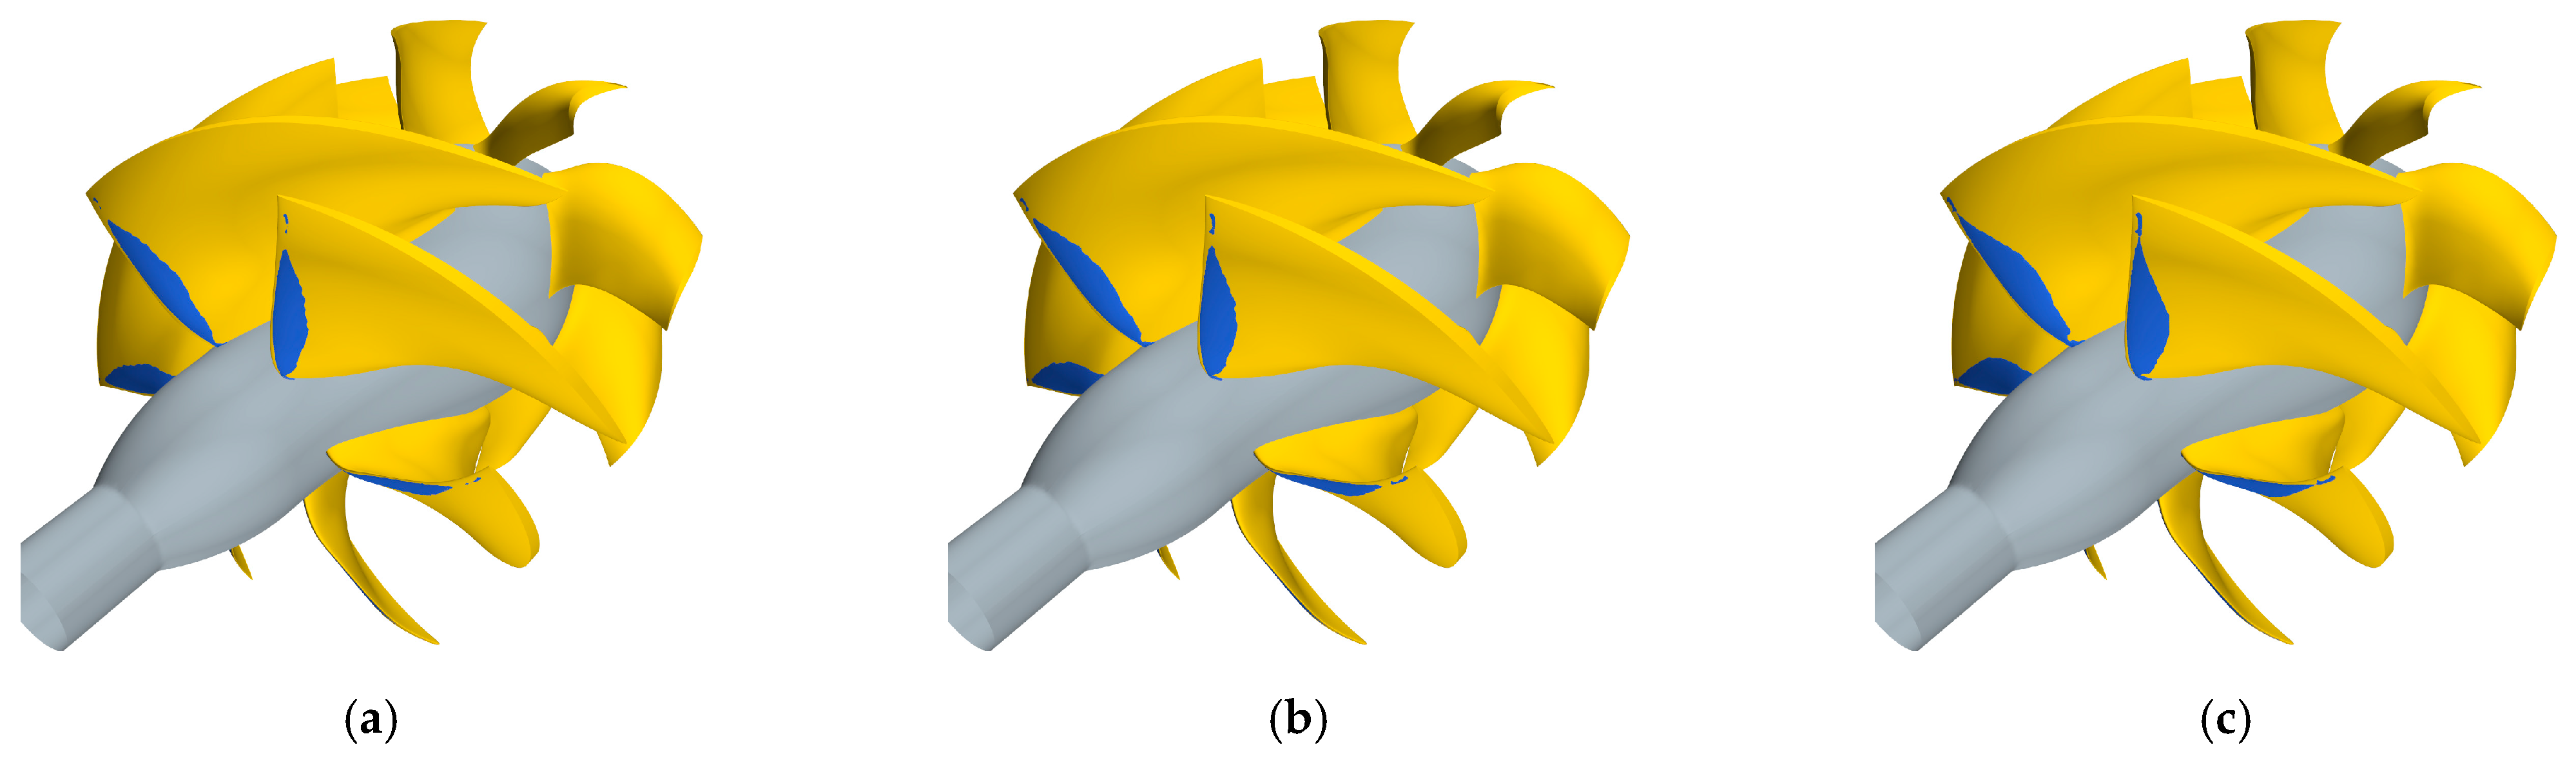
Given the nature of any design by optimization process, verification, i.e., checking the grid sensitivity of the CFD solution and the robustness of the numerical implementation of hydrodynamic analyses through convergence, is of paramount importance. Optimization, indeed, relies more on the relative comparison of different configurations than on absolute results, which, in any case, are important for satisfying design constraints. Since the design process is driven to convergence by the improvements any new designs provide with respect to the previous, assessing the uncertainty of the numerical calculations is fundamental for the correct ranking of geometries based on their predicted performances. To this end, the reference waterjet geometry has been used to assess the grid sensitivity of this very complex case, which is also in light of the simplifications (steady analyses of single rotor and stator blade passages using moving reference frames and the mixing plane approach for rotor/stator coupling) adopted for the calculations employed in the optimization process. The method of Eça and Hoekstra [55], based on the least square fits of the calculated values of the performance indicators at different grid densities, has been preferred to assess the rate of convergence and the numerical uncertainties associated with any computational grids. The grid sensitivity analysis includes 8 different grid densities, from 800 k to 10 million polyhedral cells per blade passage. Coarsest and finest grids are shown in Figure 5.
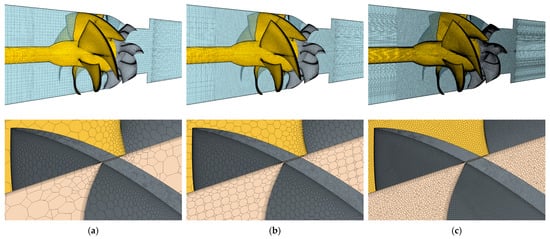
Figure 5.
Computational grids and detail at the rotor tip for the grid sensitivity study: coarsest h1/hi = 2.32 (a), intermediate h1/hi = 1.88 (b), and finest h1/hi = 1 (c) grid arrangements.
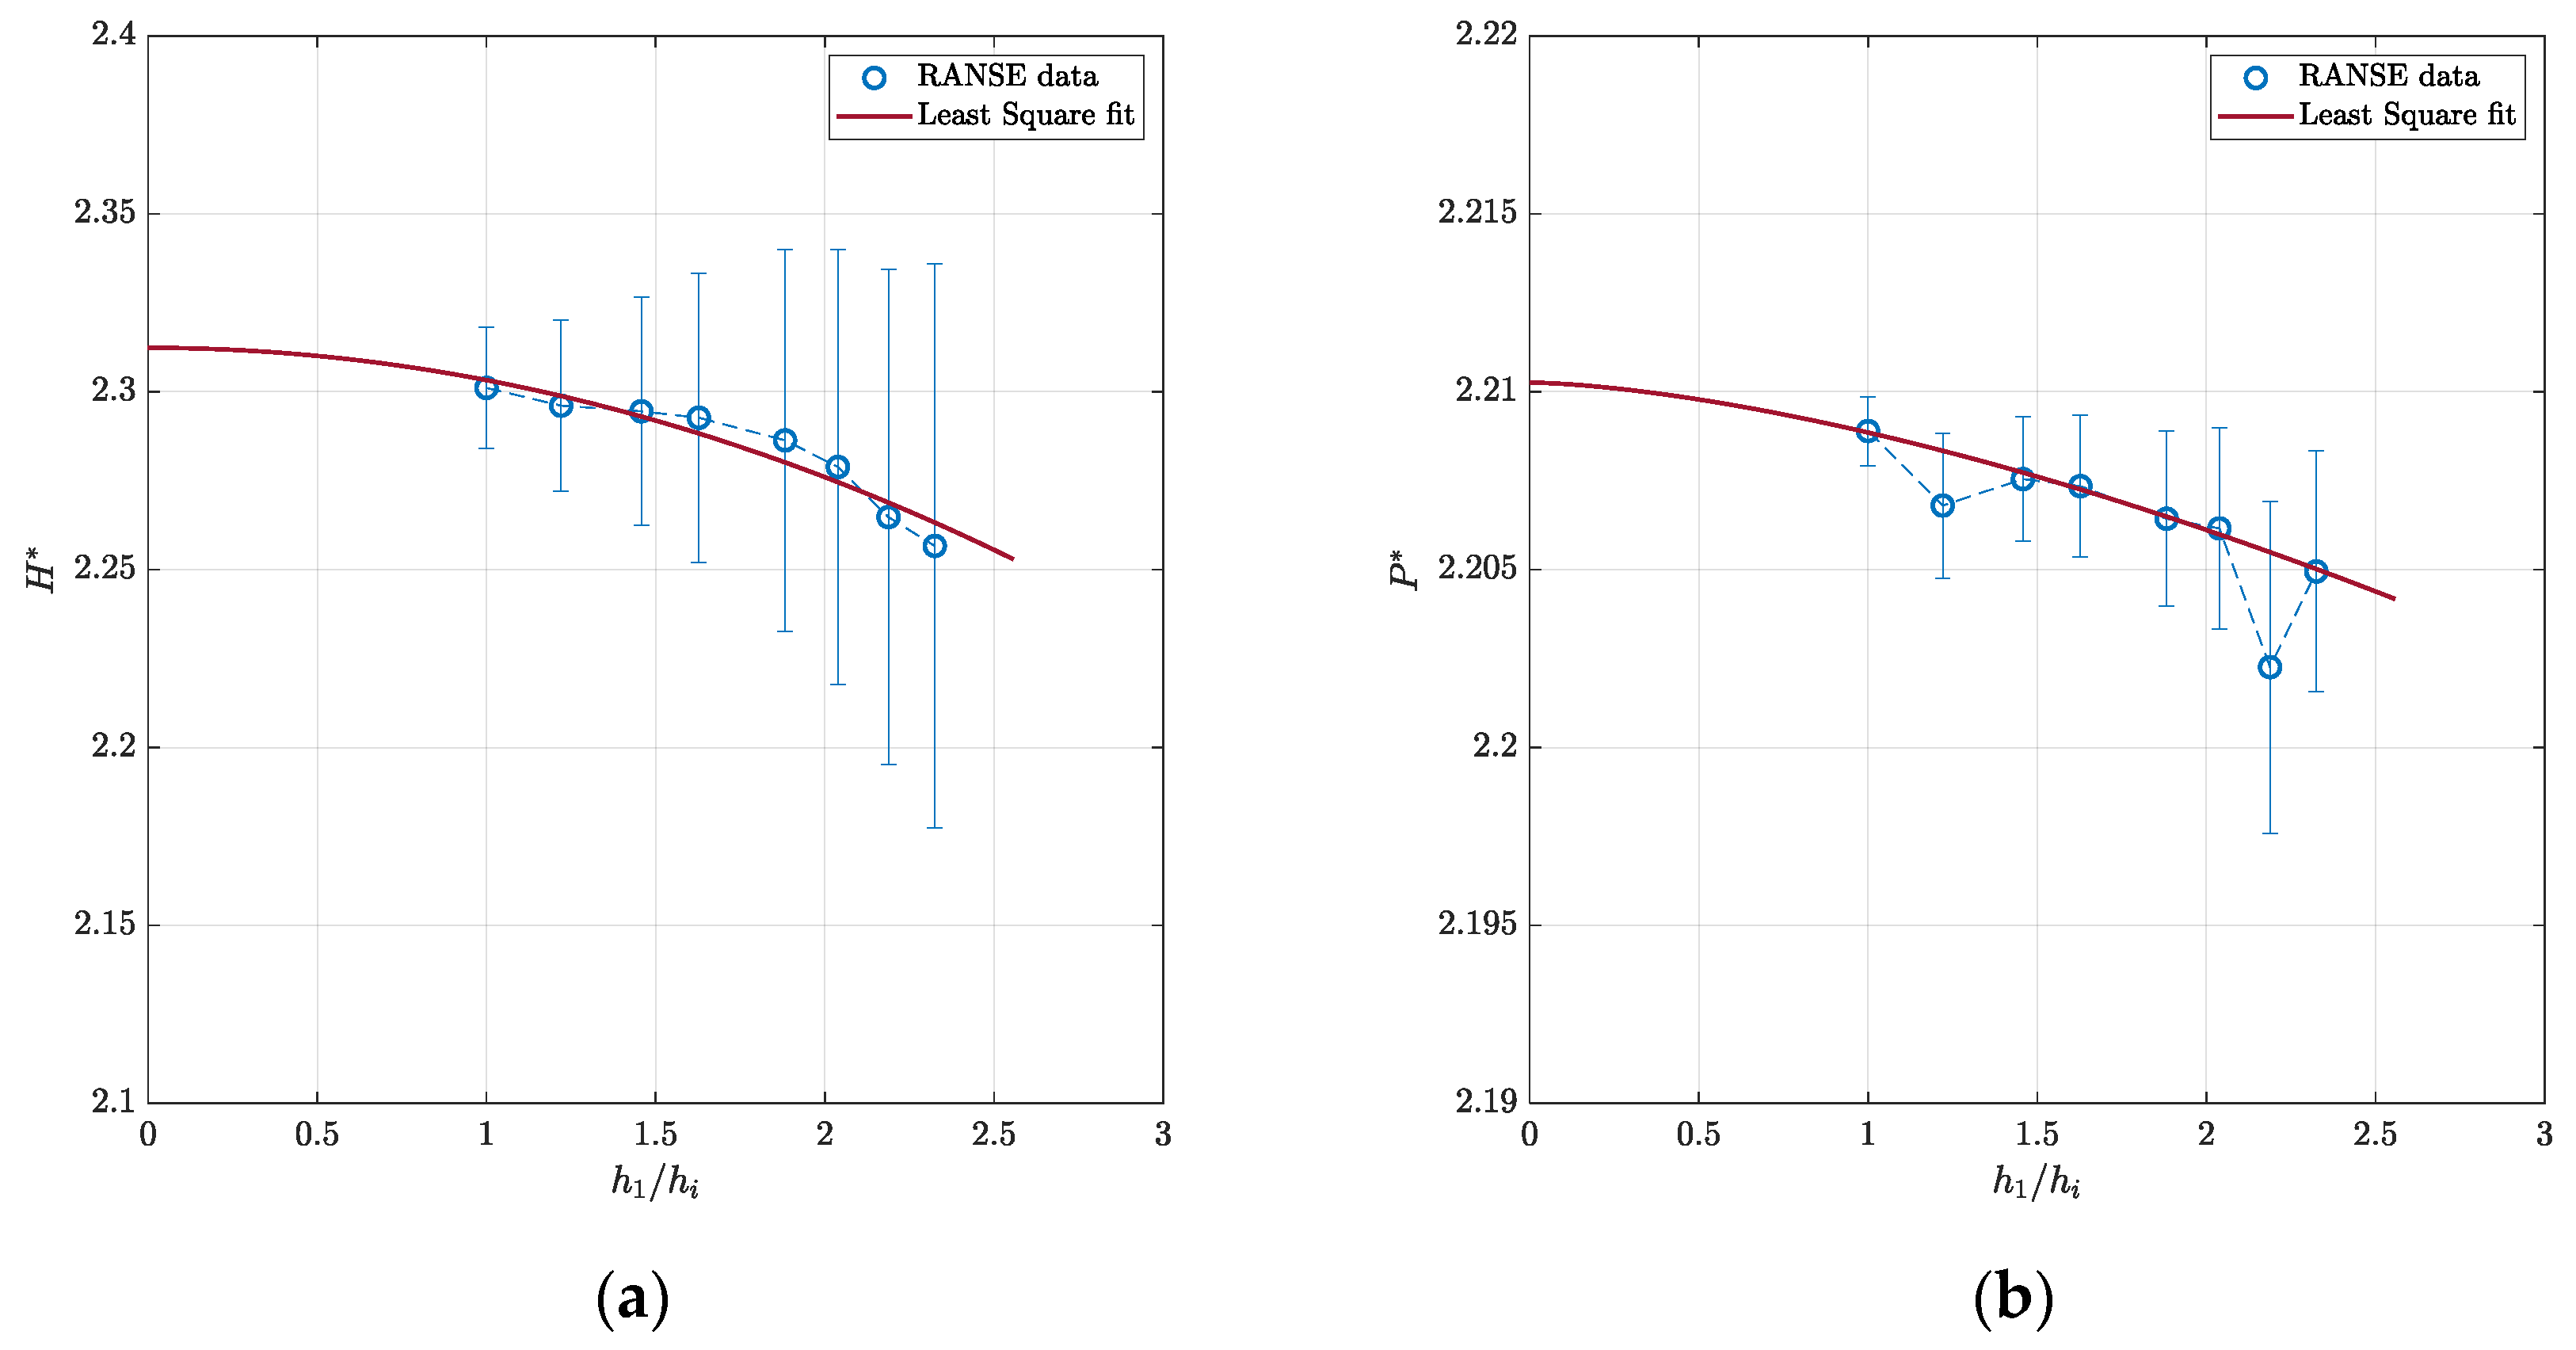
The results of the analysis (design flow coefficient Q* = 0.85) are shown in Figure 6. Calculated data obey a nice second-order convergence with respect to the grid density monitored by h1/hi, which is the cubic root of the ratio between the number of cells of the finest grid under investigation (“1”) and the number of cells of the current grid (“i”). Compared to the extrapolated data (h1/hi = 0), any grid density seems adequate. Differences, indeed, are less than 2.5% for H* and even less than 0.5% for the power coefficient regardless of the mesh. The intermediate grid (about 1.5 million cells, h1/hi = 1.88) permits errors with respect to the extrapolated values of about 1% and 0.2%, respectively, which denote very good stability of the numerical analyses at an affordable computational cost. Calculated uncertainties have a very similar trend. They are a bit higher for the head coefficient (about 4.5% for the intermediate grid, and 1.5 and 7%, respectively, for the finest and the coarsest configurations) but almost negligible (0.3% on average) for P*, confirming the intermediate grid as a well-balanced choice for all the subsequent analyses.
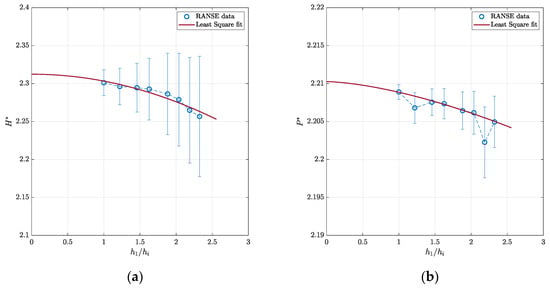
Figure 6.
Grid sensitivity and associated numerical uncertainties: head (a) and power (b) coefficients under non-cavitating conditions (Q* = 0.85).
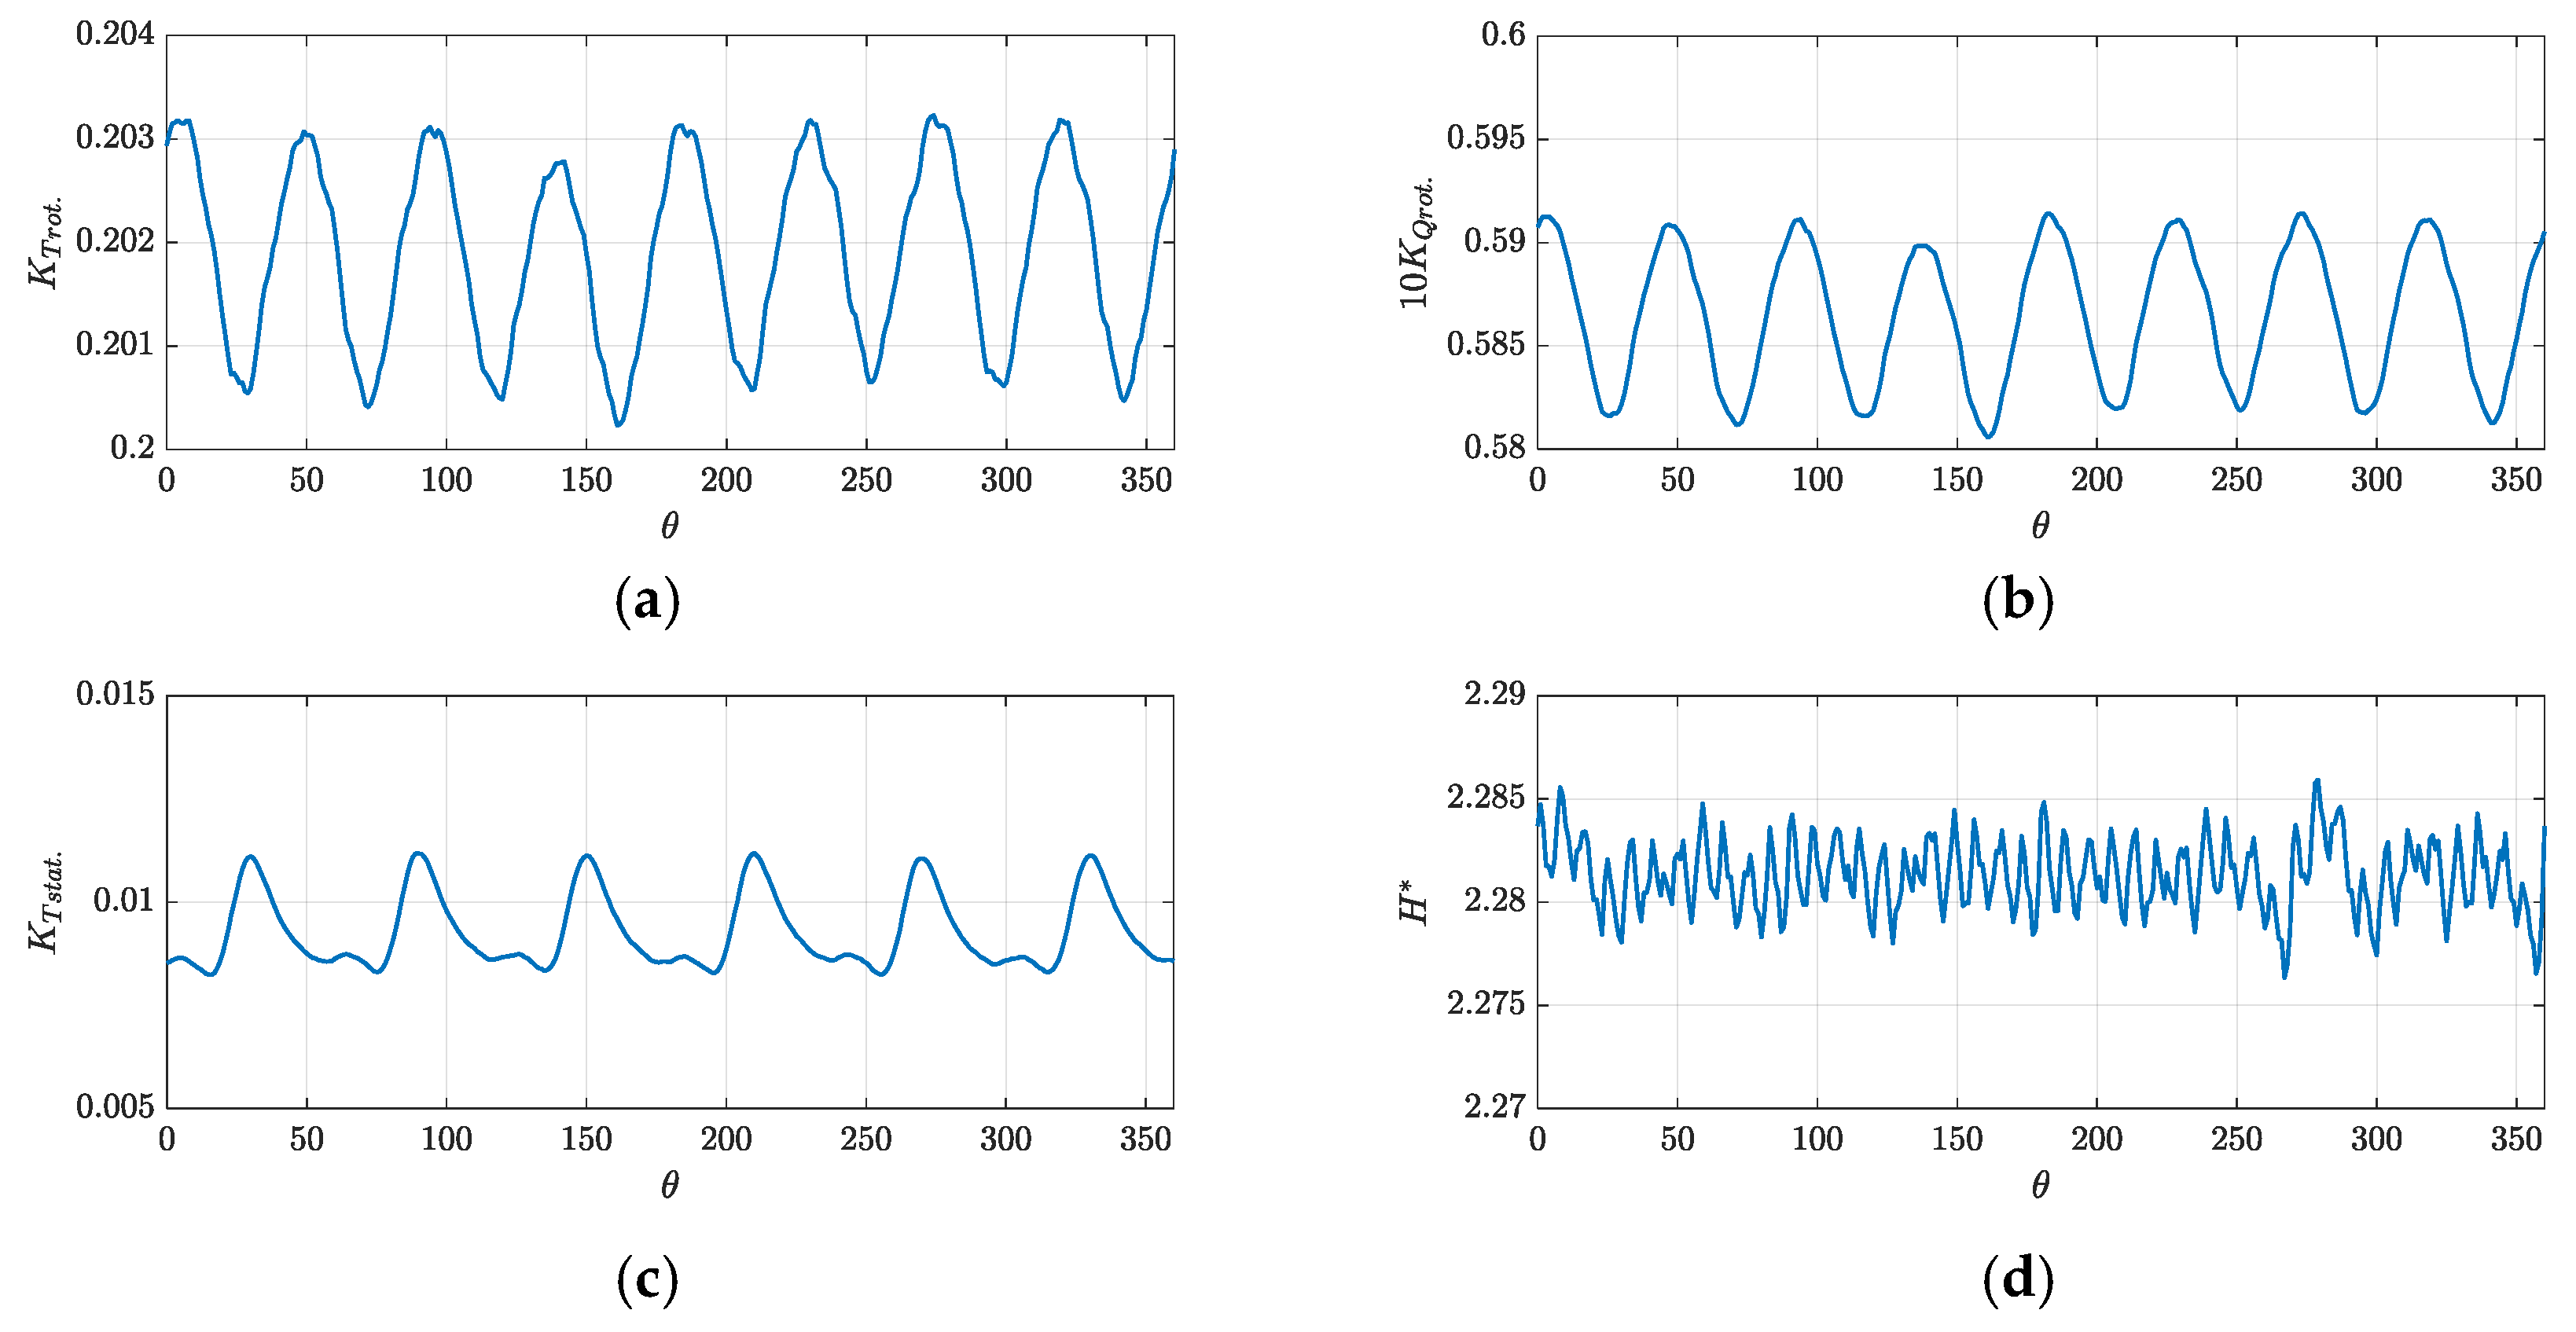
Further proofs of the reliability of the selected grid and computational model employing the mixing plane and moving reference frames are provided by the analysis of the results obtained with sliding meshes and fully unsteady calculations. Indeed, to verify the reliability of the model, already confirmed in many similar cases [24,54], the waterjet performances of Figure 6 have been compared with those obtained by fully unsteady calculations of the complete rotor and stator geometry. Figure 7 collects the unsteady performances (thrust and torque coefficient time histories of the single rotor and stator blades, total, time dependent, head coefficient) of the last (of ten, after initialization with moving reference frame) rotor revolutions.
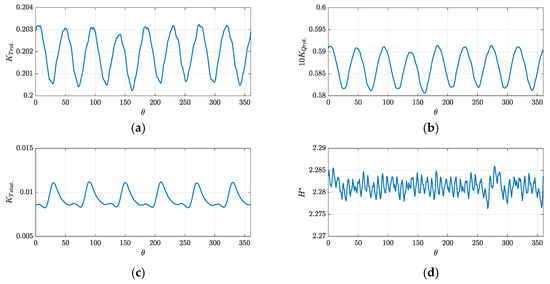
Figure 7.
Unsteady performance (Q* = 0.85) of the reference axial waterjet. Unsteady rotor (single blade) thrust coefficient KT rot. (a), unsteady rotor (single blade) torque coefficient 10 KQ rot. (b), unsteady stator (single blade) thrust coefficient KT stat. (c), and unsteady head coefficient H* (d).
Single-blade performances are evidence of the unsteady interactions between rotor and stator blades: rotor blade load (thrust and torque) fluctuates as a consequence of the blockage action of the eight stator blades; stator blades interact six times per revolution with the trailing wake of the six rotor blades. Time-averaged performances, meanwhile, are sufficiently close to those calculated with the assumption of averaged rotor-to-stator flow directly provided by the mixing plane. Differences are less than 1% (H*miximg plane = 2.286, H*fully unst. = 2.281, P*miximg plane = 2.206, P*fully unst. = 2.211), thus confirming the reliability of this simplified model.
3.4. Grid Sensitivity Study—Cavitating Analyses
Cavitating analyses, which make use of different models and require fully unsteady calculations (even if they still employ the mixing plane approach to couple, in a simplified way, the rotor and the stator), are also worthy of a sensitivity analysis, similarly addressing the influence of the time step of the unsteady analyses. To this end, the same eight grids of the non-cavitating analyses were used to assess the order to convergence and the numerical uncertainties associated with any computational grid and identify the best arrangement in terms of balance between accuracy and computational efficiency. The results of these analyses are collected in Figure 8 and Table 1. The design flow coefficient has been considered, and all the calculations are carried out at a cavitation index equal to 5.
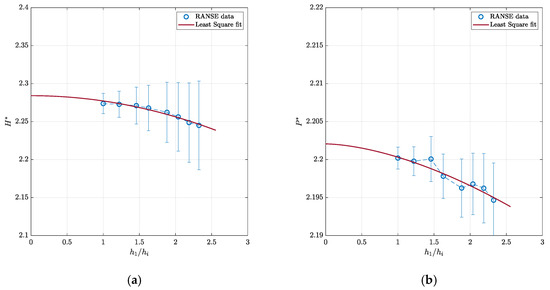
Figure 8.
Grid sensitivity and associated numerical uncertainties: head (a) and power (b) coefficients under cavitating conditions (Q* = 0.85, σN = 5).

Table 1.
Sensitivity of cavitating analyses to simulation time step.
As for the non-cavitating analyses, the rate of convergence with the grid density (fixed time-step equivalent to 0.5 deg., 9.259259∙10−5 s at 900 rpm) is very good, since a second-order for H* and a quasi-second-order convergence rate for P* is observable, with uncertainties between 1 and 5 for H* and always lower than 0.5 for P*. At any grid density, the difference with respect to the extrapolated value is also very low (1.5% for the head, 0.5% for the power), confirming the reliability of the computational setup. It is worth noting that under cavitating conditions, the waterjet suffers a certain degradation of performance of about 1% with respect to the corresponding non-cavitating cases, which is associated with a certain thrust and torque breakdown given by the presence of a sheet cavity bubble, observable in Figure 9.
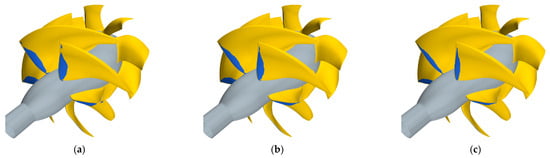
Figure 9.
Predicted cavity bubble for different grid densities: coarsest h1/hi = 2.32 (a), intermediate h1/hi = 1.88 (b), and finest h1/hi = 1 (c) grid arrangements (Q* = 0.85, σN = 5).
Also, in terms of cavity extension, even if only a qualitative comparison is provided, the convergence trend of the solution with the grid density seems good. The predicted cavity bubble with the finest grid is only slightly more extended than the intermediate (or even the coarsest) mesh. In none of the cases, however, is leakage vortex cavitation observable. The 10 million cells of the finest grid, indeed, are distributed using the same refinement zones of the non-cavitating case without special treatment or clustering of cells in the gap region. In the light of these results, and since cavitating analyses are used only for the final assessment of a limited number of optimized geometries (and then slightly more accurate grids can be employed), a slightly more refined grid with about 2.4 million cells (h1/hi = 1.6) per blade passage seems appropriate for the analyses.
This, moreover, is the computational setup employed to assess the convergence with the simulation time step that is verified for the same functioning conditions by changing, from 2 to 0.25 deg., the time discretization of the simulations. Also, in this case, the computational model seems robust since the variations of the head and power coefficients collected in Table 1 are almost negligible. The cavity bubble, qualitatively, slightly increases (Figure 10) with the decrease in the simulation time step but these variations, in the light of the use of this type of analyses for comparative purposes among the optimized geometries, seem insufficient in justifying any additional computational cost, and a conservative choice of a time step equivalent to 0.5 deg. of rotor revolution seems adequate for all the unsteady cavitating analyses.
Figure 10.
Predicted cavity bubble for different simulation time steps: 2 deg. (a), 0.5 deg. (b), and 0.25 deg. (c) (Q* = 0.85, σN = 5).
3.5. Performance of the Reference Geometry
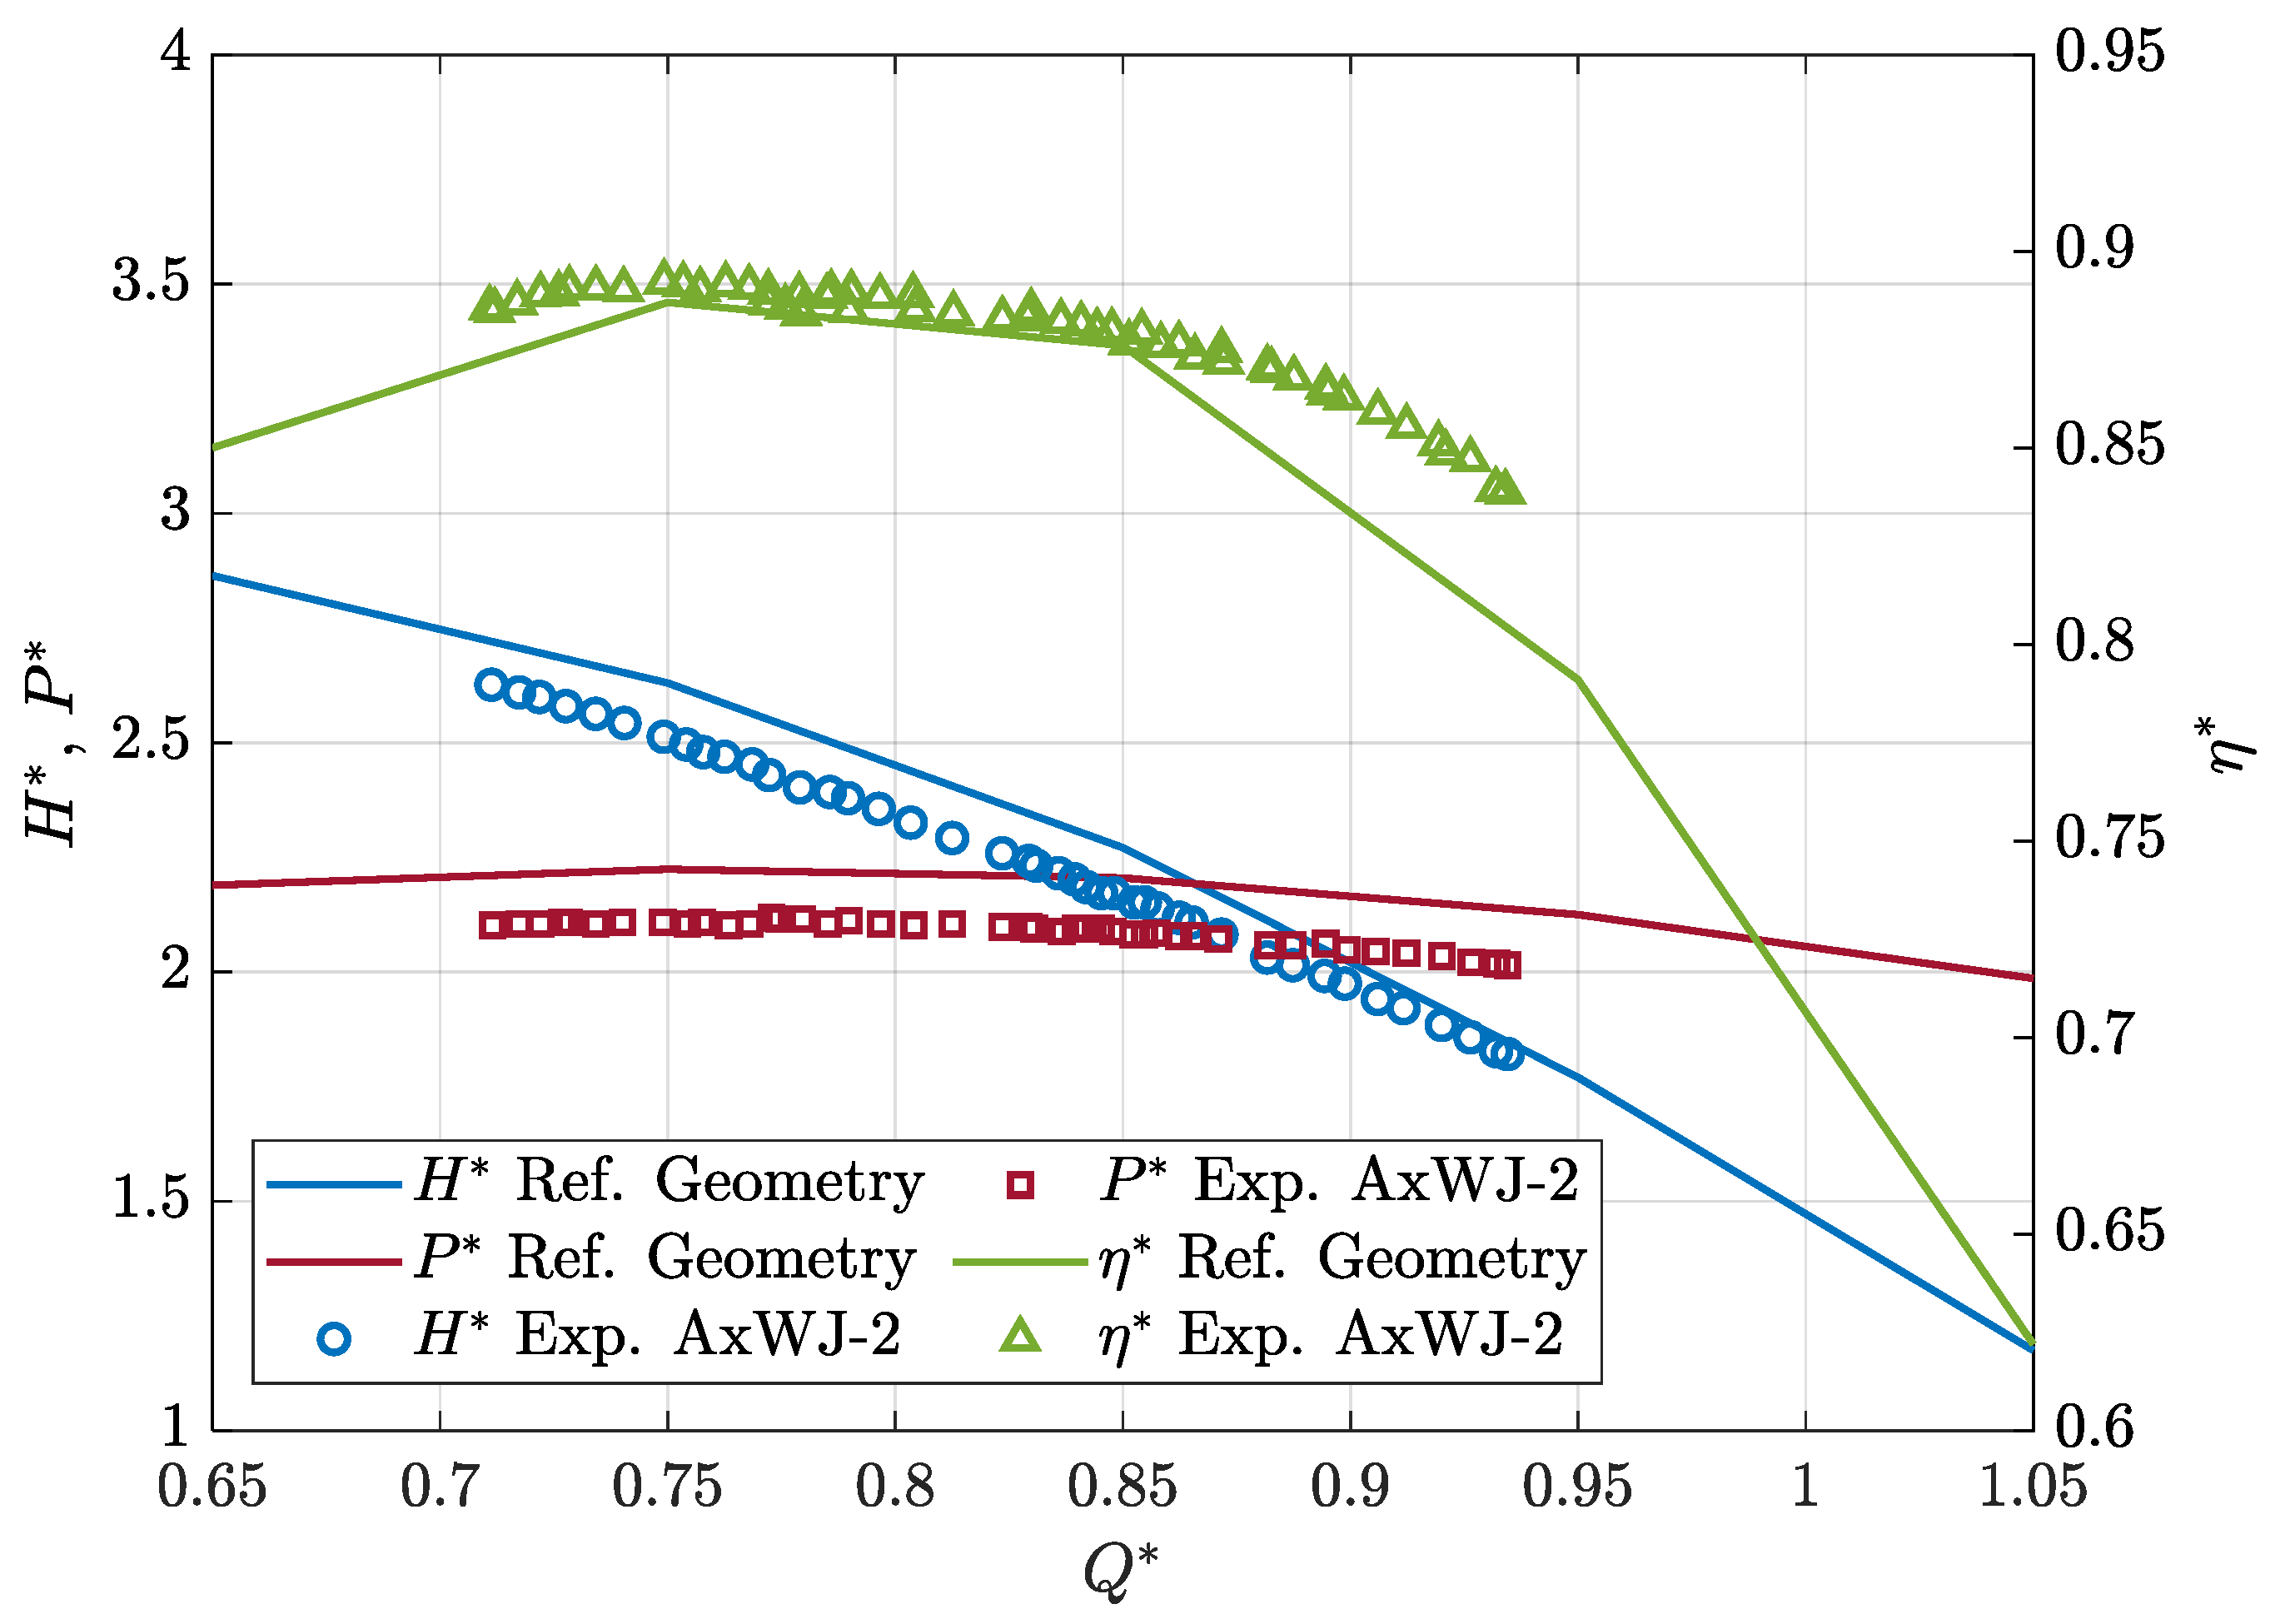
The numerical setup discussed in previous sections allows for the characterization of the performances of the reconstructed waterjet, establishing a baseline for assessing the gains achievable through the design-by-optimization approach. Results are shown in terms of total performances (head, power, and efficiency, Figure 11) as well as of local pressure distributions and cavitation bubble predictions (Figure 12, Figure 13 and Figure 14). These are the identical quantities employed, respectively, in the optimization process (local pressure to assess the risk of cavitation inception) and during the post-processing of optimal configurations (two-phase flow calculations to confirm the outcomes of the design based on simplified design objective formulation) as well as the fixing of the reference for the design and discussion of optimized configurations.
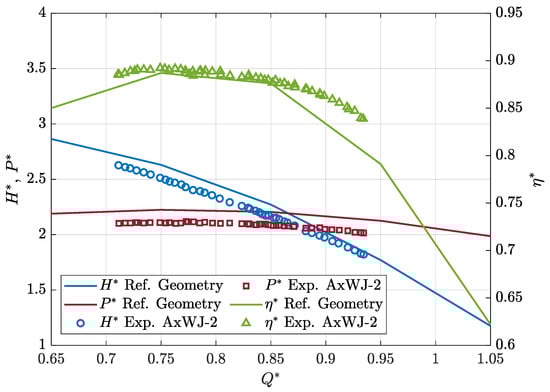
Figure 11.
Predicted open-water performances of the reference geometry compared with experiments [50] of the original AxWJ-2 waterjet.
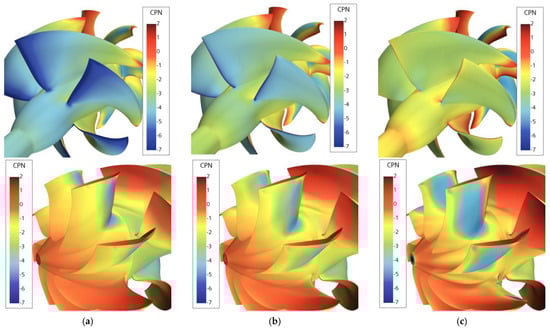
Figure 12.
Pressure coefficient (CPN) distributions over rotor and stator blades of the reference waterjet. Q* = 0.75 (a), Q* = 0.85 (b), and Q* = 0.95 (c).
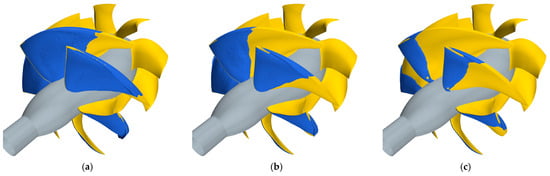
Figure 13.
Predicted vapor bubble (isosurface of Vof = 0.5) for Q* = 0.75 at σN = 4 (a), σN = 5 (b), and σN = 6 (c).
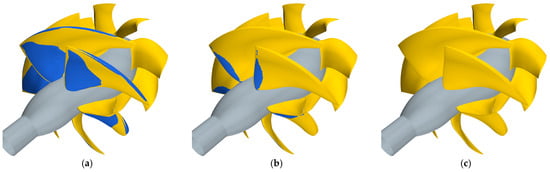
Figure 14.
Predicted vapor bubble (isosurface of Vof = 0.5) for Q* = 0.85 at σN = 4 (a), σN = 5 (b), and σN = 6 (c).
As discussed earlier, the exact reconstruction of the geometry was not perfect and this is reflected in the predicted performance, which are slightly more different from the measurements of Chesnakas et al. [50] than similar RANSE calculations performed using the real AxWJ-2 geometry [13,14].
It is worth noting that the general trends of head and power coefficients are well captured, corresponding to hydraulic efficiencies between 0.88 and 0.90 when Q* is close to the design functioning. The pressure coefficient distributions of Figure 12 highlight an important suction peak at the rotor blade leading edge as soon as the functioning condition differs from the design. At the design point itself, a certain suction (numerically not observed for the original AWxJ-2 [18]) still exists, probably again as a consequence of the approximated reconstruction process of the reference geometry and a slightly higher blade pitch. Shock-free entry, based on the pressure fields, is indeed consistent between 0.85 and 0.90, where the head coefficient of the reconstructed geometry (overestimated) matches that of the real geometry.
Cavitation inception is predicted, at the design functioning, for a cavitation index σN slightly higher than 6 on the rotor blades (leading edge) while the stator has a higher margin (σN = 4) with the risk of cavitation moved at midchord. The analyses of the cavitation model confirmed these occurrences. The cavity bubble appears, always from leading edge, on the suction side of the rotor blades at any of the cavitation indexes under investigation (σN = 4 to 6) when the waterjet is loaded (flow rate equal to 0.75). Vapor almost entirely covers the blade at the lowest cavitation index, partially highlighting a leakage vortex at the tip which is under-resolved due to the insufficient grid resolution. At the design flow rate (Q* = 0.85), the cavity bubble is well developed for cavitation indexes lower or equal to 5. Consistent with the pressure distribution of Figure 12, for this functioning condition, the cavity bubble also starts at leading edge and at the cavitation index equal to 5, affecting almost entirely, from root to tip, the blade. At a cavitation index equal to 6, the vapor bubble (identified with isosurfaces of Vof equal to 0.5) is not visible despite the suction peaks of Figure 12, which would have still suggested a certain risk of cavitation inception for this functioning condition. The vapor fraction is very weak, and with only Vof lower than 0.2, it is possible to visualize a very thin cavitation bubble, probably not sufficiently sustained in its development by the local suction.
4. Design by Optimization
4.1. Parametrization of the Geometry
Any design by optimization requires a parametric description of the geometry to handle automatically the generation of the shapes iteratively identified by the optimization algorithm. Each geometry, once fully characterized by the hydrodynamic analyses, provides the key performance indicators based on which the optimization algorithm itself identifies other configurations with better-fitting objectives and constraints until Pareto convergence is achieved. The most relevant geometrical features of the geometry under investigation should be described with the lowest possible number of parameters, ensuring at the same time the highest variability, since exploring unconventional combinations of shapes and enlarging the design space is often the easiest way to improve performance. B-Spline curves, better than Free Form deformations or B-Surfaces in the context of shape optimization of propeller blades, have shown the required flexibility to satisfy these requirements.
For this particular case of axial waterjets as well, B-Spline curves were used to parametrize the blade geometry (rotor and stator) through the coordinates of the points defining the control polygons of both radial and chordwise distributions of their most relevant geometrical features, as was already accomplished for similar geometries of RIM-driven thrusters and pumpjets [24,39]. For both rotor and stator blades, radial pitch and maximum camber distributions were considered, while in both cases the chord was simply scaled uniformly from that of the reference geometry to control the expanded area ratio of the propulsor. Given the different relevance of rotor and stator in delivering the propulsive performances, rotor blades were parametrized with more flexible polygons, using 8 parameters for the pitch (4 in the case of the stator) and 6 for the maximum sectional camber (4 in the case of the stator). At constant skew and rake distributions, taken from the reference geometry, the sectional hydrofoil shape was also included in the parametrization, using a constant NACA16 chordwise thickness and a variable camber line, described with 4 parameters for both rotor and stator blades.
Compared to conventional or ducted propellers, axial waterjets positively exploit the design of the blade passage (external casing and hub profile) to increase head and efficiency. Contraction, as well as blockage, influence the static pressure inside the pipe; both depend on the mutual interactions between the vane shape and the rotor and stator blades. Controlling the geometry of the casing and the hub, then, may contribute to a better blade design. This is achieved by a dedicated parametrization of these curves that is realized again by means of the B-Splines polygons shown in the meridian section of Figure 15.
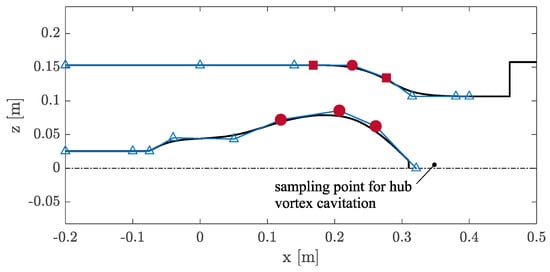
Figure 15.
Parametric description of hub and casing using B-Spline polygons on the meridian plane. Control points marked with a circle can move in both x- and z-directions on the meridian plane. Control points marked with a square can move only along the x-direction.
To maintain the straight pipe at inlet and outlet, as well as the inlet fairing of the hub which is considered less important for the functioning of the waterjet [18], only few of the points describing the sectional shape of the device are included in the design space, namely those across the rotor and the stator. The three control points of the casing correspond to 4 design parameters, since variation of the “z” coordinate is allowed only for the central control point. Control points of the hub, instead, contribute to 6 additional design parameters since they are free to move in both directions. Altogether, the final parametric description of the waterjet corresponds to a 42-dimension design space.
4.2. The Optimization Problem
The design process of the waterjet can be stated as the optimization problem that requires the minimization of the risk of cavitation and the simultaneous maximization of the hydraulic efficiency at a constantly delivered head coefficient for the selected functioning condition (in current case, Q* = 0.85). Given the simplifications needed to employ high-fidelity RANSE analyses in the process, this design statement is arranged as a multi-objective optimization involving, as multiple objectives, the maximization of the pressure on the different patches “i” composing the rotor and stator blades, representative of different types and risks of cavitation. For the rotor, the leading edge and midchord risk of cavitation is monitored separately at the blade tip and at the root of the suction side (4 objectives), while on the pressure side, only leading-edge cavitation (2 objectives, at tip and at root) is possible when the blade works efficiently. The stator blade contributes with 4 additional objectives since leading-edge (or midchord) phenomena collected at tip and root are combined (worst case). Also, the pressure in the wake of the hub is sampled (Figure 15) to monitor the risk of hub vortex cavitation, leading to a 12-objective, and 1-constraint, optimization problem:
where x is 42-dimensional vector of design parameters and the reference head coefficient (that calculated for the reference geometry at the design point) to be matched within a certain tolerance. To ease the convergence, geometries providing a head coefficient between 97 and 110% of the reference geometry were considered feasible assuming that an increase of the delivered head is more acceptable than a decrease. Optimal geometries, with some exceptions dictated by the need to discuss some interesting geometries, have been chosen accepting H* within a tolerance of 3%.
5. Results
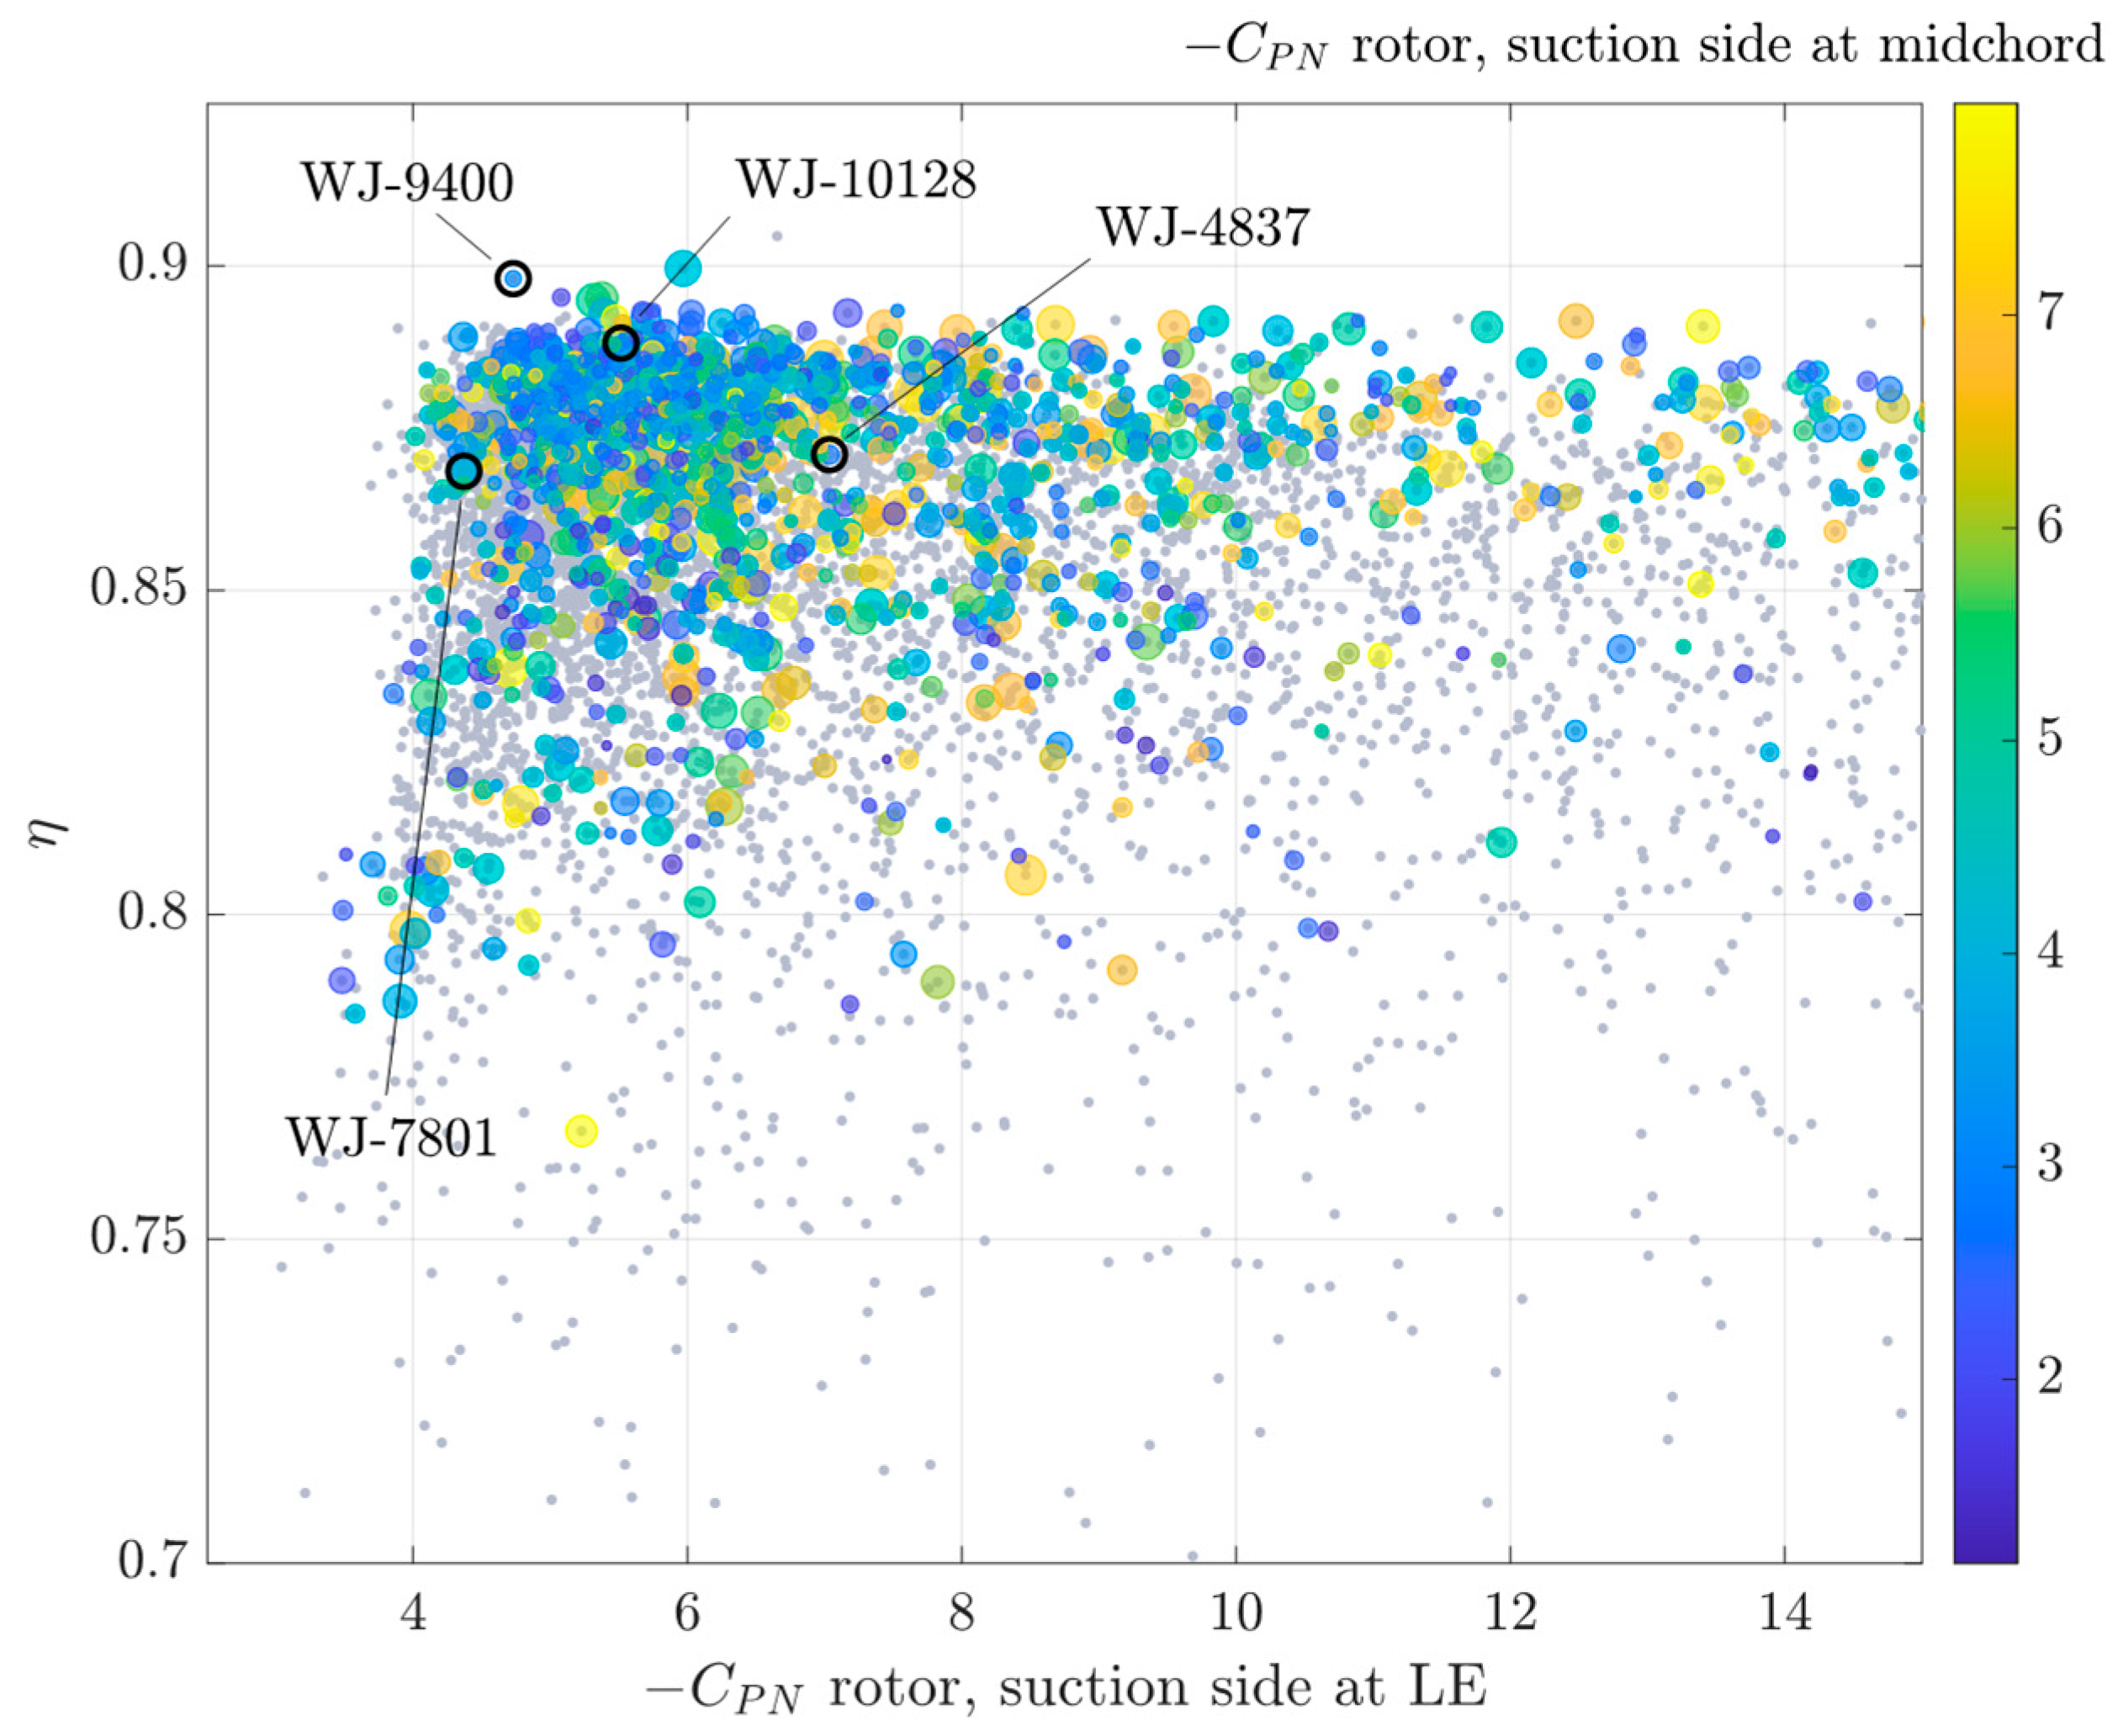
Results of the design are given in Figure 16. The design space was sampled with 600 configurations using Uniform Latin Hypercube. They evolved 20 times using a genetic process (MOGA-II [56]) to deal with the complex non-convex and non-linear nature of objectives and constraints. Of the 12,000 configurations analyzed, only those satisfying the design constraint and not subjected to rotor or stator face cavitation (precautionally assuming a cavitation index equal to 3, i.e., −CPNface > 3) were considered for the final selection. To ease the visualization of the Pareto front, suction side inceptions were merged, and the diagram shows the worst between tip and root.
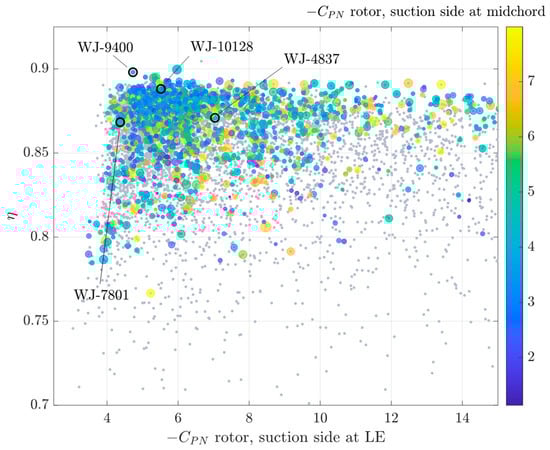
Figure 16.
Results of the optimization process. Feasible configurations (efficiency versus risk of cavitation on the suction side of the rotor at leading edge) colored with the cavitation inception at midchord. Dot dimension is proportional to the cavitation inception risk (maximum of −CPN) on the suction side and leading edge of the stator blade. Grey dots represent feasible geometries (head coefficient within the assigned range) discarded due to face rotor and/or stator cavitation.
The identification of the best trade-off configurations in the multi-dimensional space of solutions is not obvious and several criteria, also based on previous experiences or expected cavitating behaviors given by peculiar pressure distributions, could be employed as usual in the case of conventional propellers. Since the focus is on the reliability and the flexibility of this design-by-optimization approach, for well-consolidated conventional propellers, when applied to waterjet propulsors rather than (or not only) the identification of the best overall geometry, different balances between objectives were accepted for the selection of the optimal candidates.
This allows for a critical comparison among different designs and, through detailed cavitating analyses, for a discussion on the reliability of the simplified criteria employed throughout the optimization process. To this end, four geometries were considered. All complied differently with the design goals (i.e., minimum cavitation inception, maximum efficiency, or intermediate conditions) and provided a general overview of what was achievable in the given design space. The selection criteria were mainly based on cavitation avoidance, looking for geometries with the minimum overall inception; at fixed inception, those with maximum efficiency are preferred. Selected waterjets, shown in Figure 17 and Figure 18, are:

Figure 17.
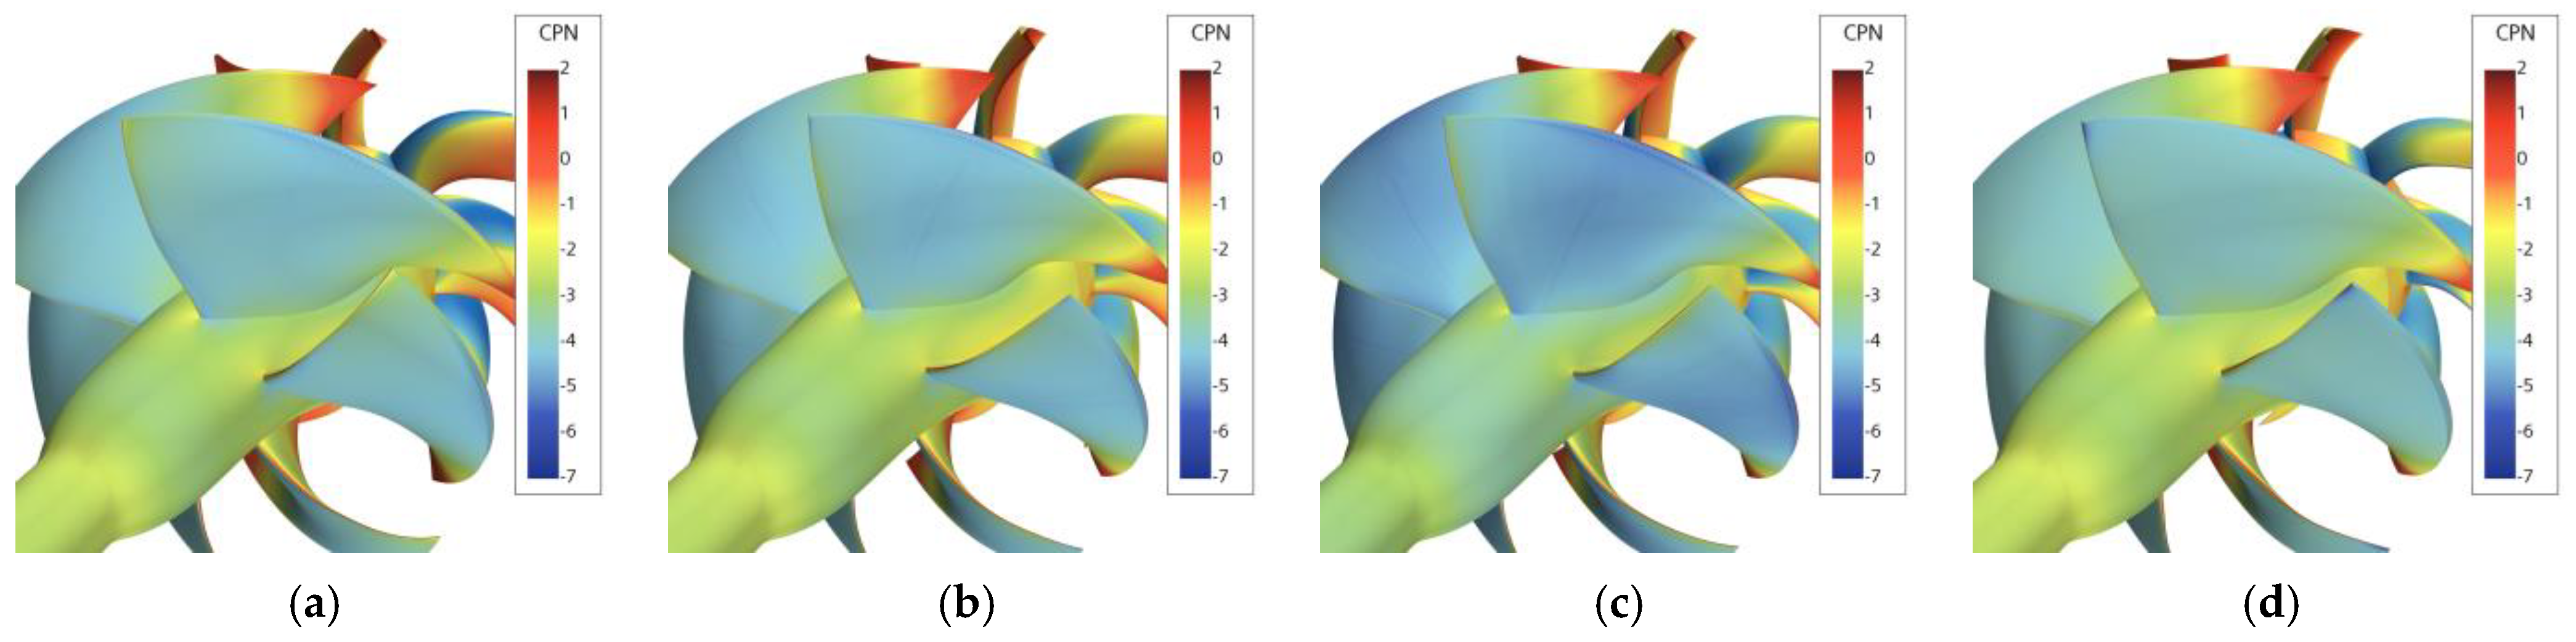
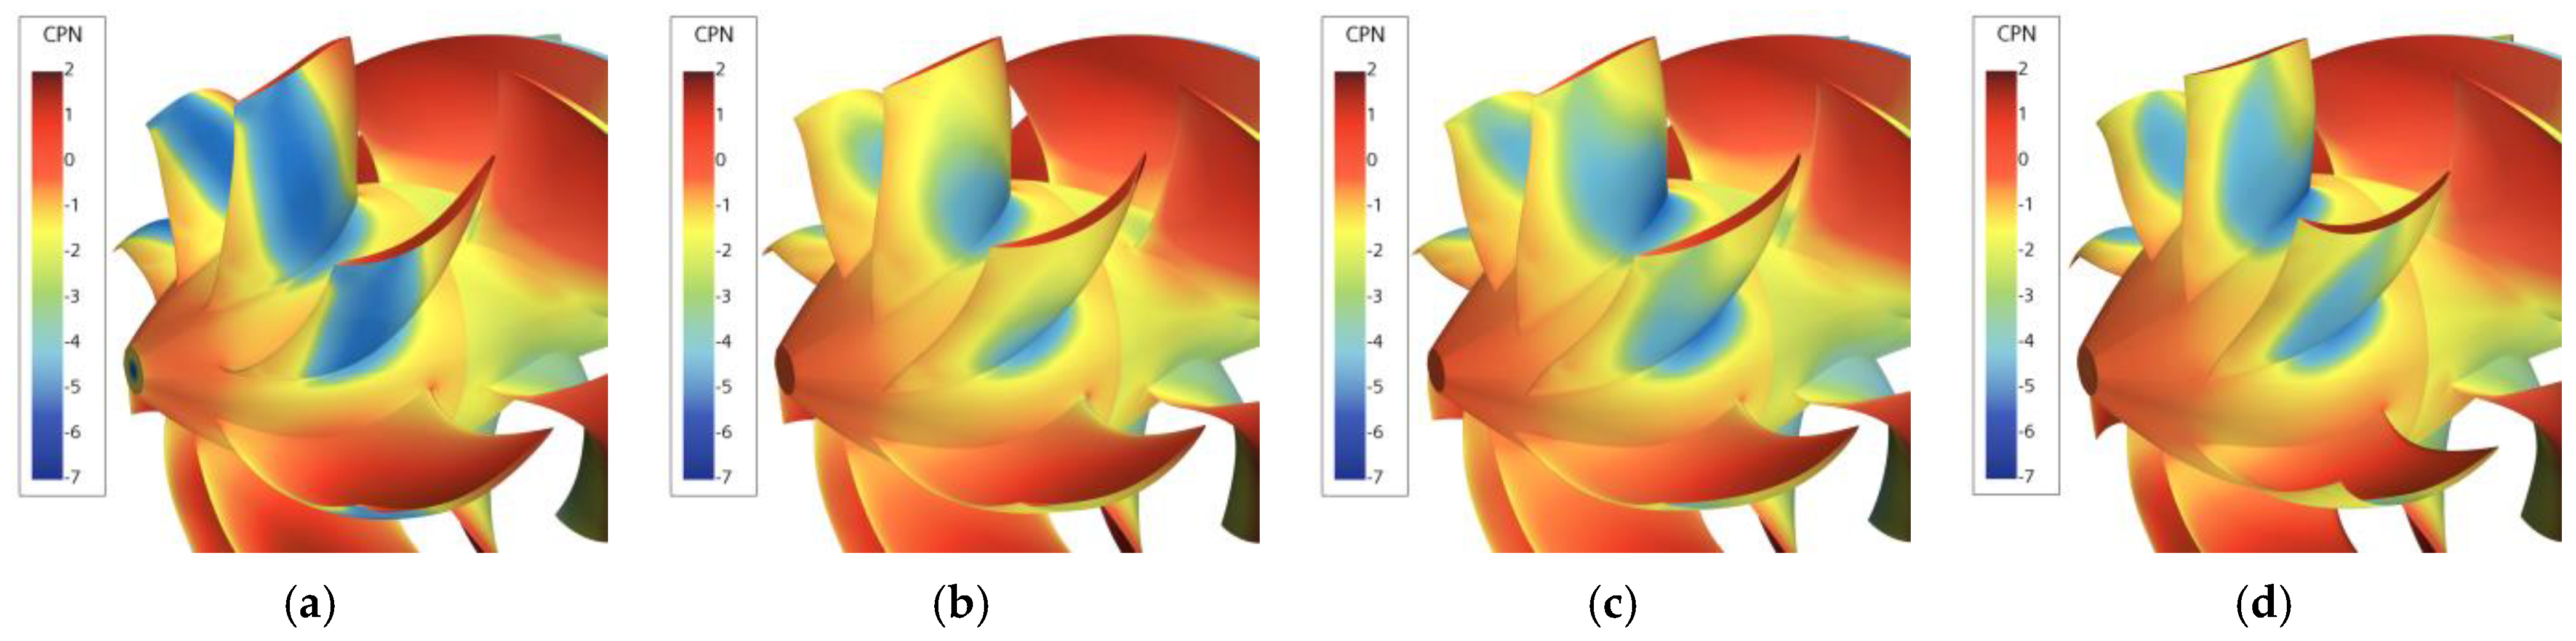
Pressure coefficient (CPN) distributions over rotor blades of the selected optimized waterjets. WJ-7801 (a), WJ-10128 (b), WJ-9400 (c), and WJ-4837 (d).

Figure 18.
Pressure coefficient (CPN) distributions over stator blades of the selected optimized waterjets. WJ-7801 (a), WJ-10128 (b), WJ-9400 (c), and WJ-4837 (d).
- WJ-7801, which provides the lowest possible inception (σN = 5.3) among all the feasible configurations. Without further observations, it can be seen as the overall best geometry. Inception at σN = 5.3 occurs on the suction side, at the tip of the rotor blade, in the midchord region. Suction side, leading-edge cavitation at rotor blade root is the second cavitation phenomenon in order of appearance (σN = 4.4), followed by midchord cavitation at the root (σN = 4.3) and leading-edge, suction side cavitation at the blade tip (σN = 3.9). On the stator blade, the first occurrence is midchord cavitation on the suction side (σN = 4.7), while on the pressure side, the risk of cavitation inception at the leading edge is postponed to σN < 2.5. At the trailing edge of the blade (pressure side) there is a zone of low pressure due to the contraction of the pipe. Efficiency is about 0.87, then slightly lower than the reference.
- WJ-10128 is the second overall best geometry. At the cost of a slightly anticipated cavitation inception, this geometry occurs at the leading edge of the tip zone on the suction side of the rotor (σN = 5.5), with the hydraulic efficiency increasing to 0.89. With respect to WJ-7801, WJ-10128 seems to have better-balanced behavior. After inception at the tip, midchord cavitation at the tip (σN = 5.2), followed by leading edge and midchord cavitation at the root (σN = 4.4), characterize this geometry. Cavitation on the stator blades is substantially postponed with respect to WJ-7801, and the first occurrence is midchord cavitation for a cavitation index of 3.95. There is a slightly higher risk of pressure side cavitation on the stator blades since the inception cavitation index is equal to 3 at the leading edge.
- WJ-9400 is the geometry with the highest efficiency (0.9) when accepting a cavitation index equal to 6. The first occurrence of cavitation is midchord at the tip of the rotor (σN = 5.95), after which the cavitation inception occurs at the root of the blade (σN = 4.9 both at leading edge and midchord) and at the tip (leading edge, σN = 4.4). For this geometry, there is a slightly higher risk of pressure side cavitation of the rotor (σN about equal to 5) corresponding to a possible local inversion of the angle of attack at the very tip of the blade. Stator cavitation is a bit better than WJ-7801 since inception at the midchord of the blade is predicted at a cavitation index of 4.4.
- WJ-4837 is the last geometry that underwent extensive analyses. The selection criteria include the acceptance of a very anticipated inception at the leading edge of the blade tip (σN = 7) to favor the delay of other cavitating phenomena. Cavitation at the blade root is postponed at σN = 4; at the tip, midchord inception starts at a cavitation index of 4.8 (the lowest inception, among the selected geometries), pressure side is always avoided. On the stator blades, suction side midchord cavitation occurs quite early since the inception is for σN = 5.2.
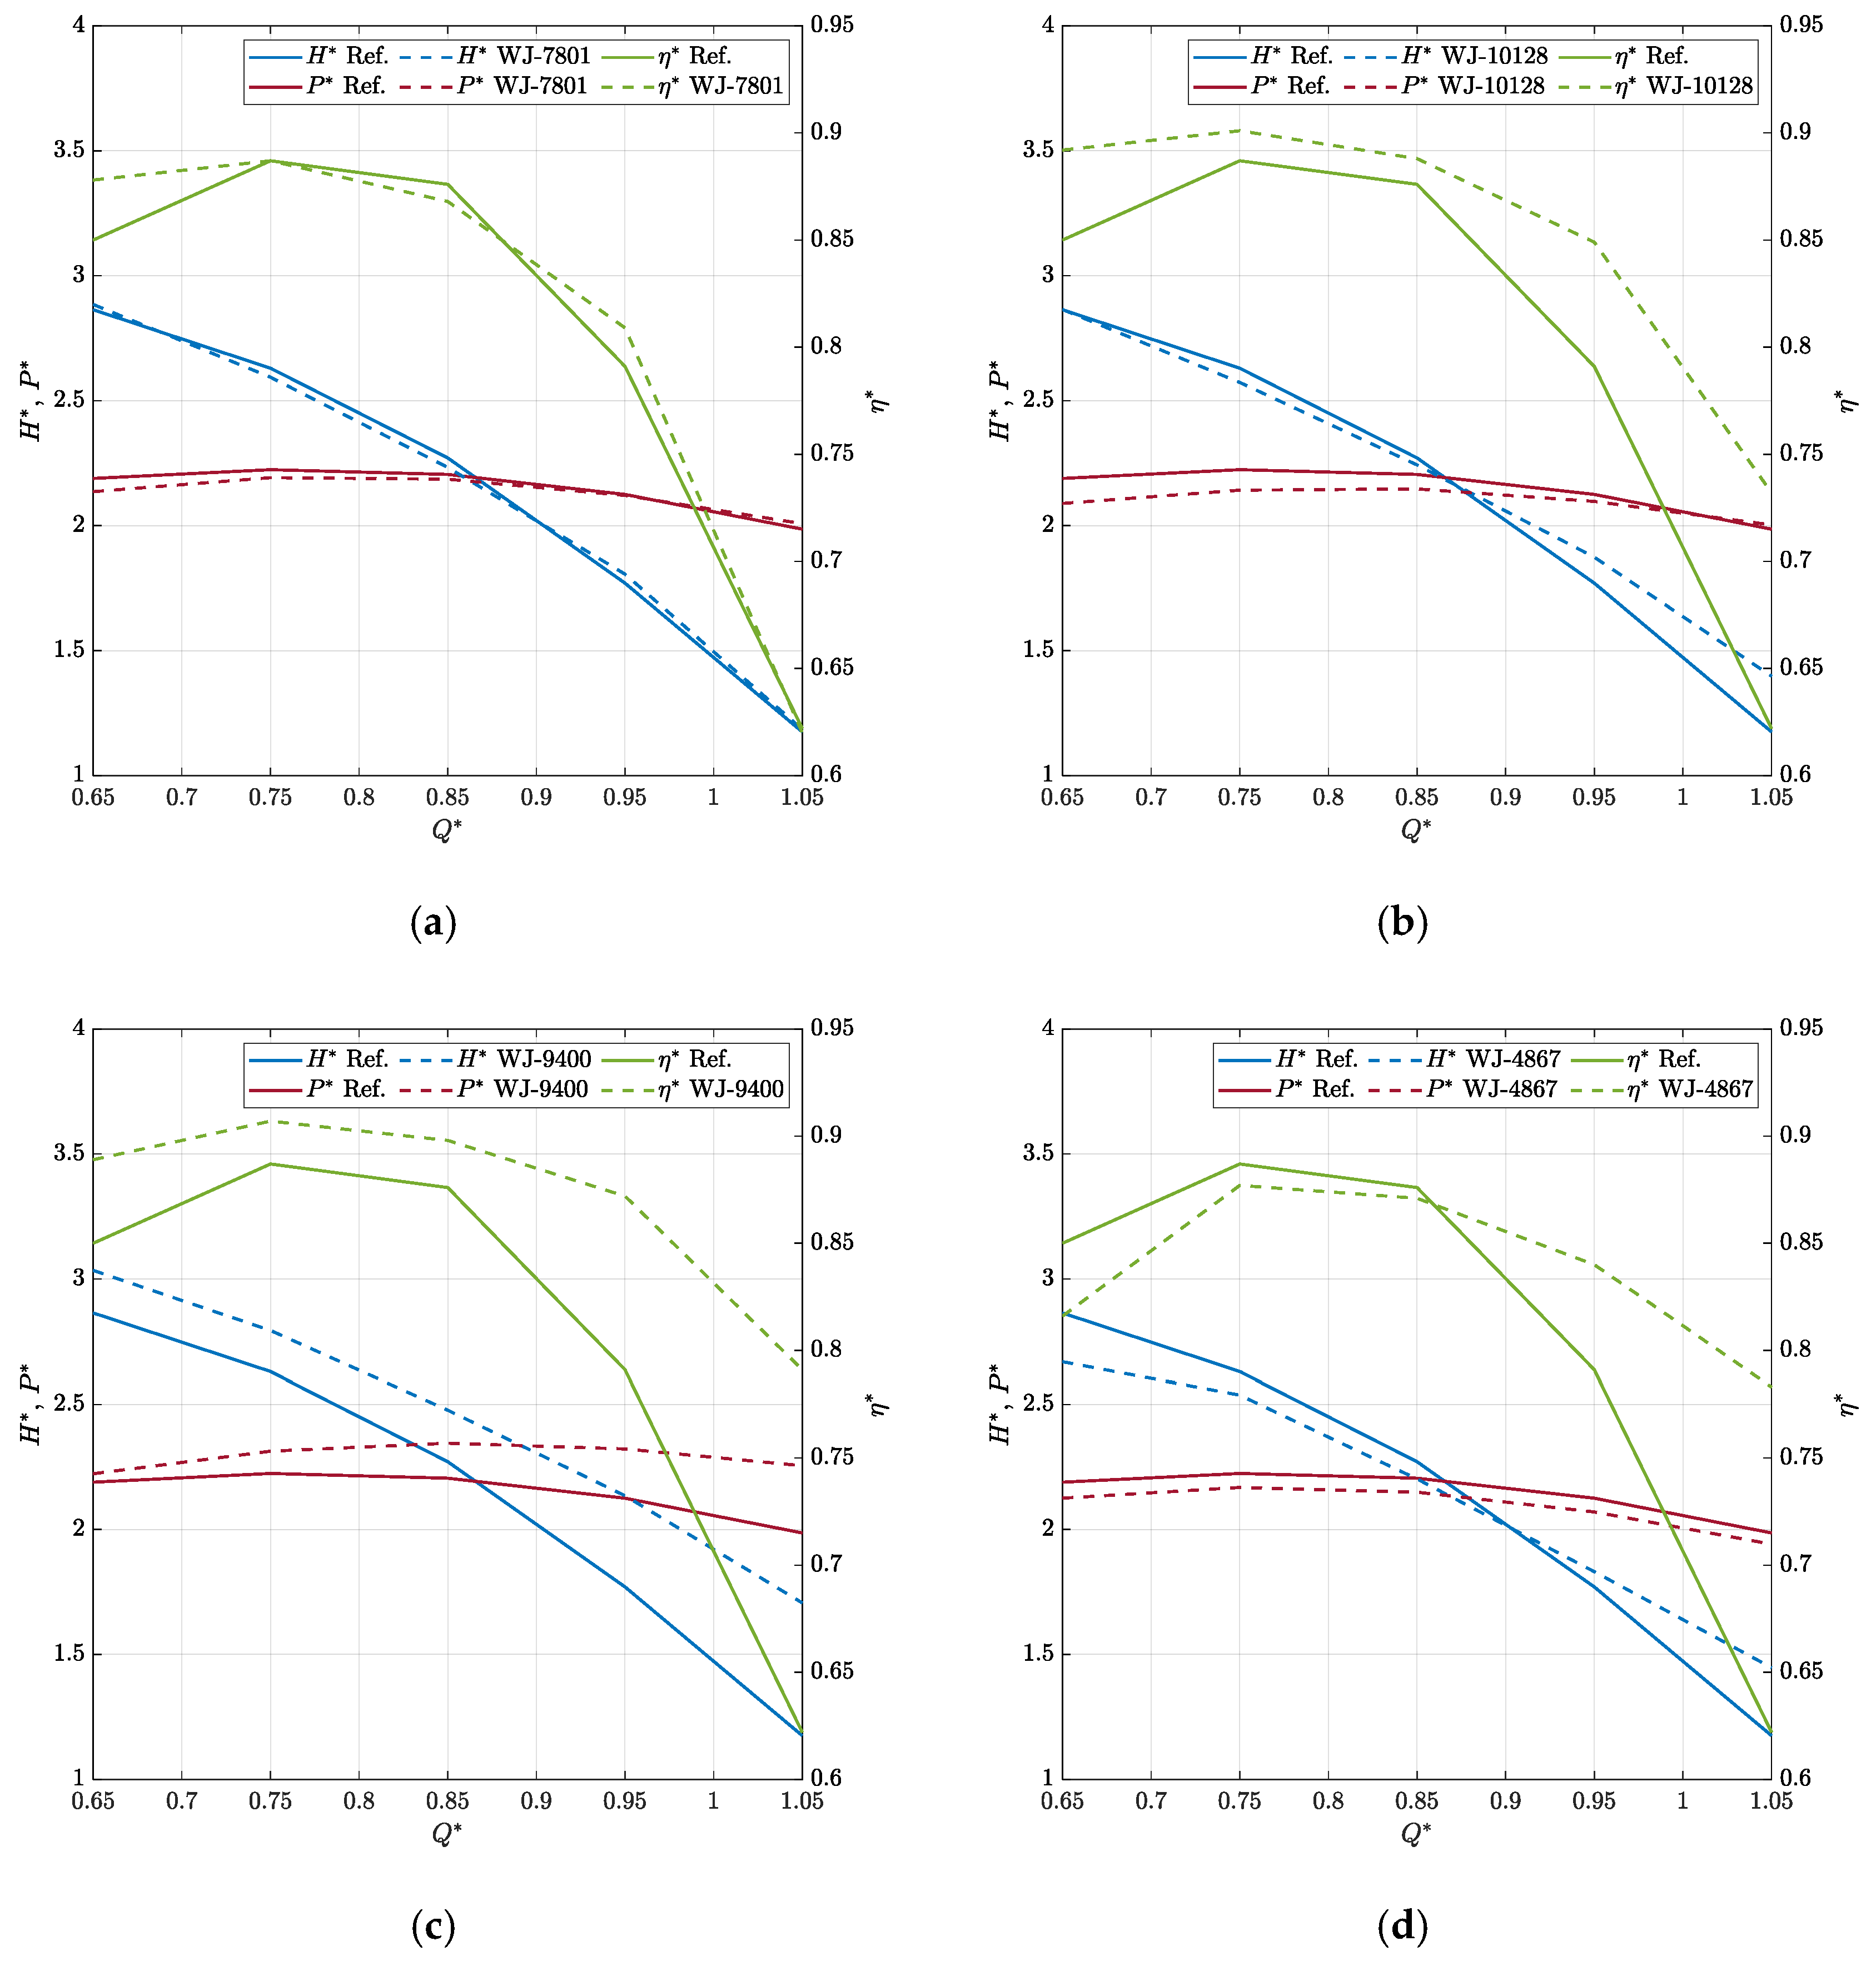
To have a broader view of the optimization results, these four geometries underwent detailed analyses, including not only open-water performance (Q* from 0.65 to 1.05) but also cavitation predictions using the cavitation model for a direct comparison with the reference geometry results of Figure 13 and Figure 14.
The open-water performances of Figure 19 highlight how the relatively small modifications (given the constraint on the head coefficient) of the geometry at the design condition (Q* = 0.85) can have heavy influences in the off-design functioning conditions. WJ-7801 and WJ-10128 are the geometries with the head coefficient at a design closer to that of the reference geometry. The trend of the head, except for very high flow rates, is very similar to the original one and not that of the absorbed power and, consequently, the hydraulic efficiency: WJ-7801 is extremely close to the reference geometry in the entire functioning range; WJ-10128 provides the same (or slightly higher) head at a much higher efficiency at any functioning condition. Combined with the better balance of cavitation inceptions and anticipated for this waterjet only at the leading edge of the tip (Figure 17), it is clear how this geometry is a valid and overall more efficient alternative to WJ-7801. WJ-9400 and WJ-4837 are, instead, the geometries which provide, within the assigned tolerance, the most different values of head coefficient at the design point: WJ-9400 increases the delivered head to 2.48; the delivered head of WJ-4837 is 2.2. For WJ-9400, the increase of the head is consistent over the entire range of functioning conditions and much higher than the increase in absorbed power. This leads to a tremendous increase in hydraulic efficiency, which is higher than 0.8 at any functioning. The increase of the head is coherent with the overall higher suction distributed quite uniformly over the back side of the blade of this waterjet (Figure 17c), which determines cavitation inception at the highest midchord cavitation index (σN = 6).
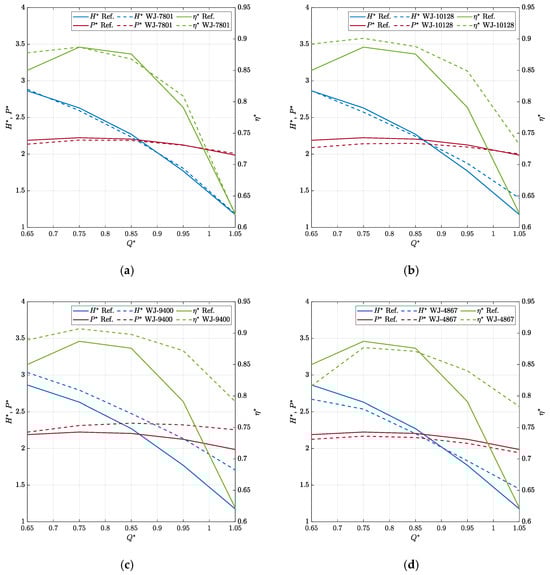
Figure 19.
Non-cavitating performances of the selected waterjets. WJ-7801 (a), WJ-10128 (b), WJ-9400 (c), and WJ-4837 (d).
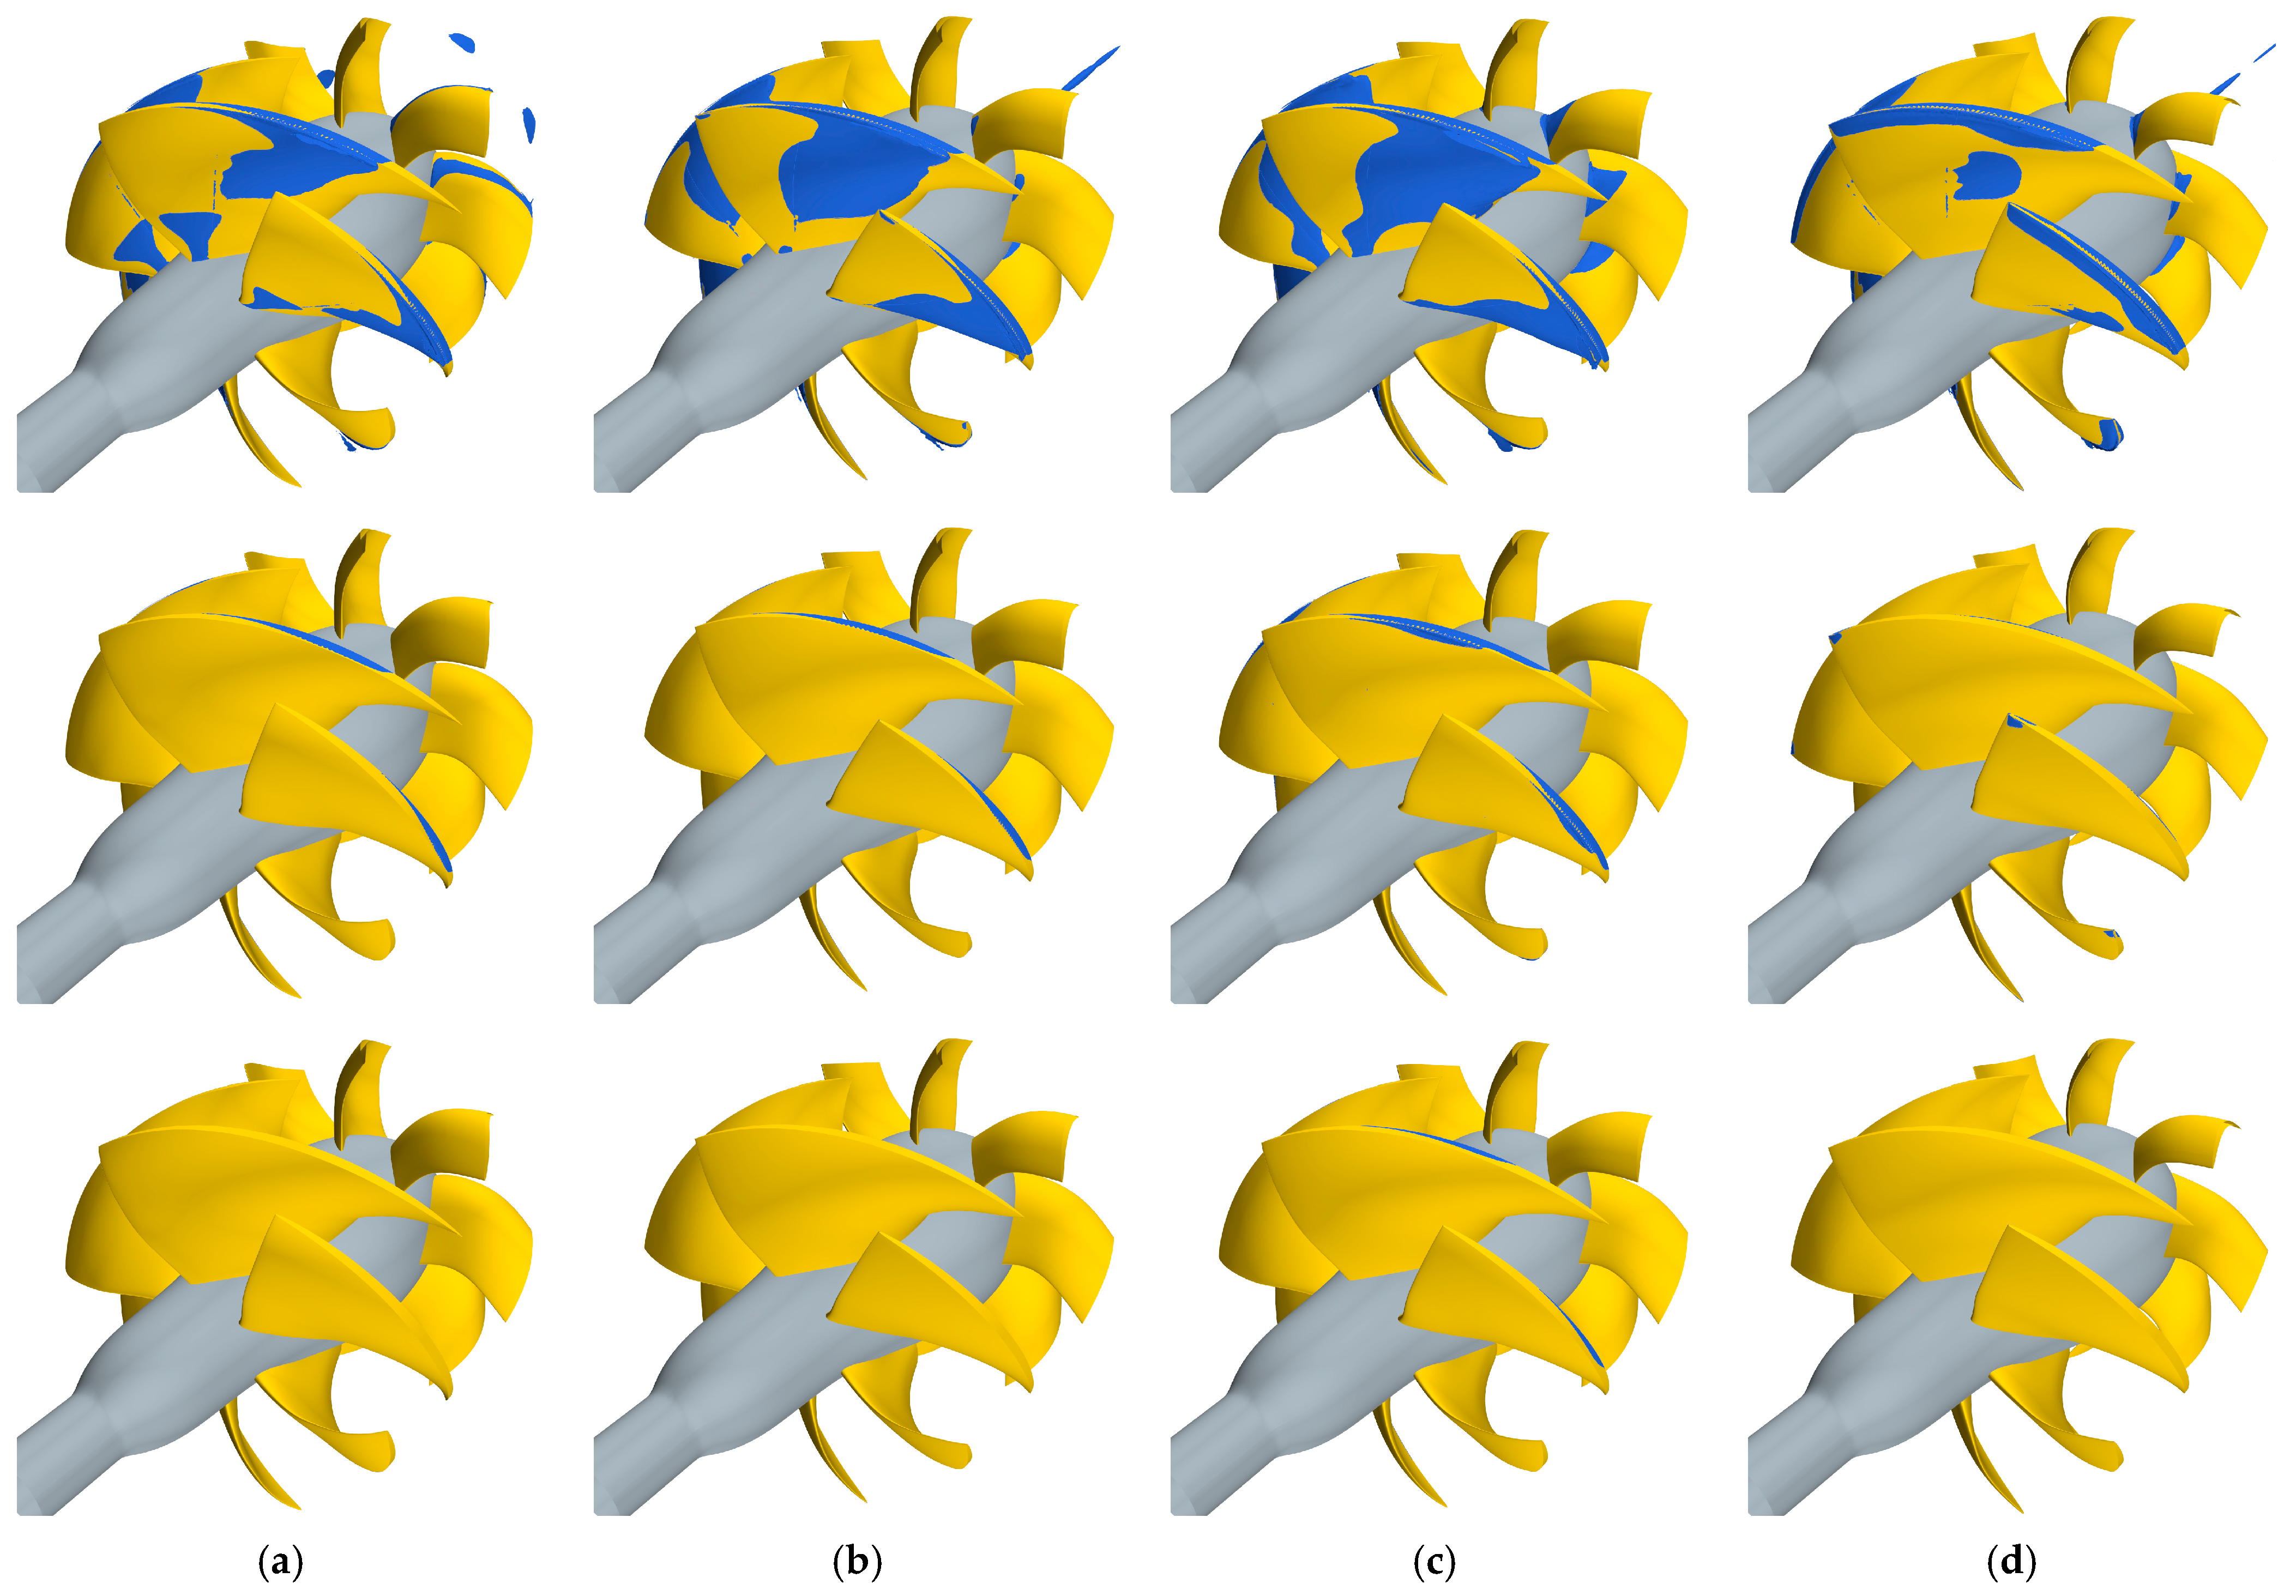
Results of the cavitation model (Figure 20 and Figure 21) obviously closely resemble the behavior discussed on the basis of pressure distributions, adding additional information of the extension, and not only the inception, of the cavitation bubbles. Two flow rates (the design condition and Q* = 0.75) and several cavitation indexes (4, 5, and 6 for the design condition, 4 and 5 only for the loaded functioning) are considered. At the design functioning, rotor blades are almost free of cavitation for cavitation indexes higher or equal to 5, which is a substantial improvement when compared to the well-developed leading-edge bubble observed for the original waterjet. The only appreciable phenomenon (except WJ-4837) is the presence of vapor in the gap between the rotor tip and the casing. This occurrence, associated with a cavitating leakage vortex that is underpredicted in these analyses due to the insufficient grid resolution at tip [17,19], is consistent with the pressure distributions of the modified geometries, which are very close to shock-free entry with most of the sectional load uniformly distributed at midchord. WJ-9400 has the thickest bubble in that zone, in accordance with the earlier inception at midchord (σN = 5.95) predicted by non-cavitating analyses.
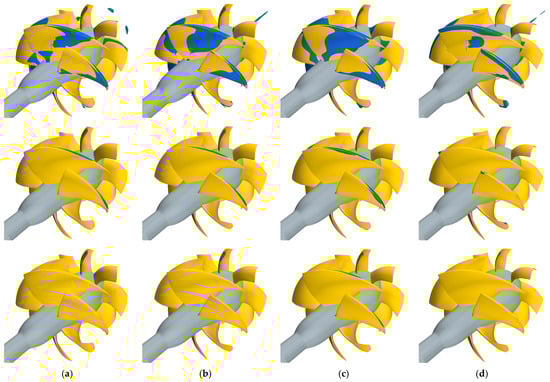
Figure 20.
Predicted vapor bubble (isosurface of Vof = 0.5) for Q* = 0.85 at σN = 4 (top), σN = 5 (intermediate), and σN = 6 (bottom) for the selected optimized waterjets. WJ-7801 (a), WJ-10128 (b), WJ-9400 (c), and WJ-4837 (d).
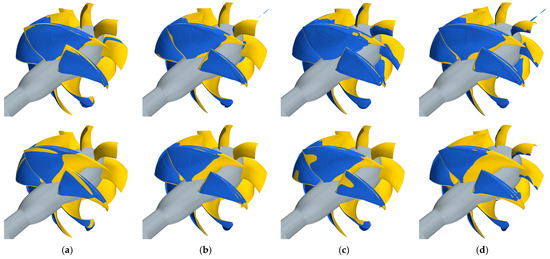
Figure 21.
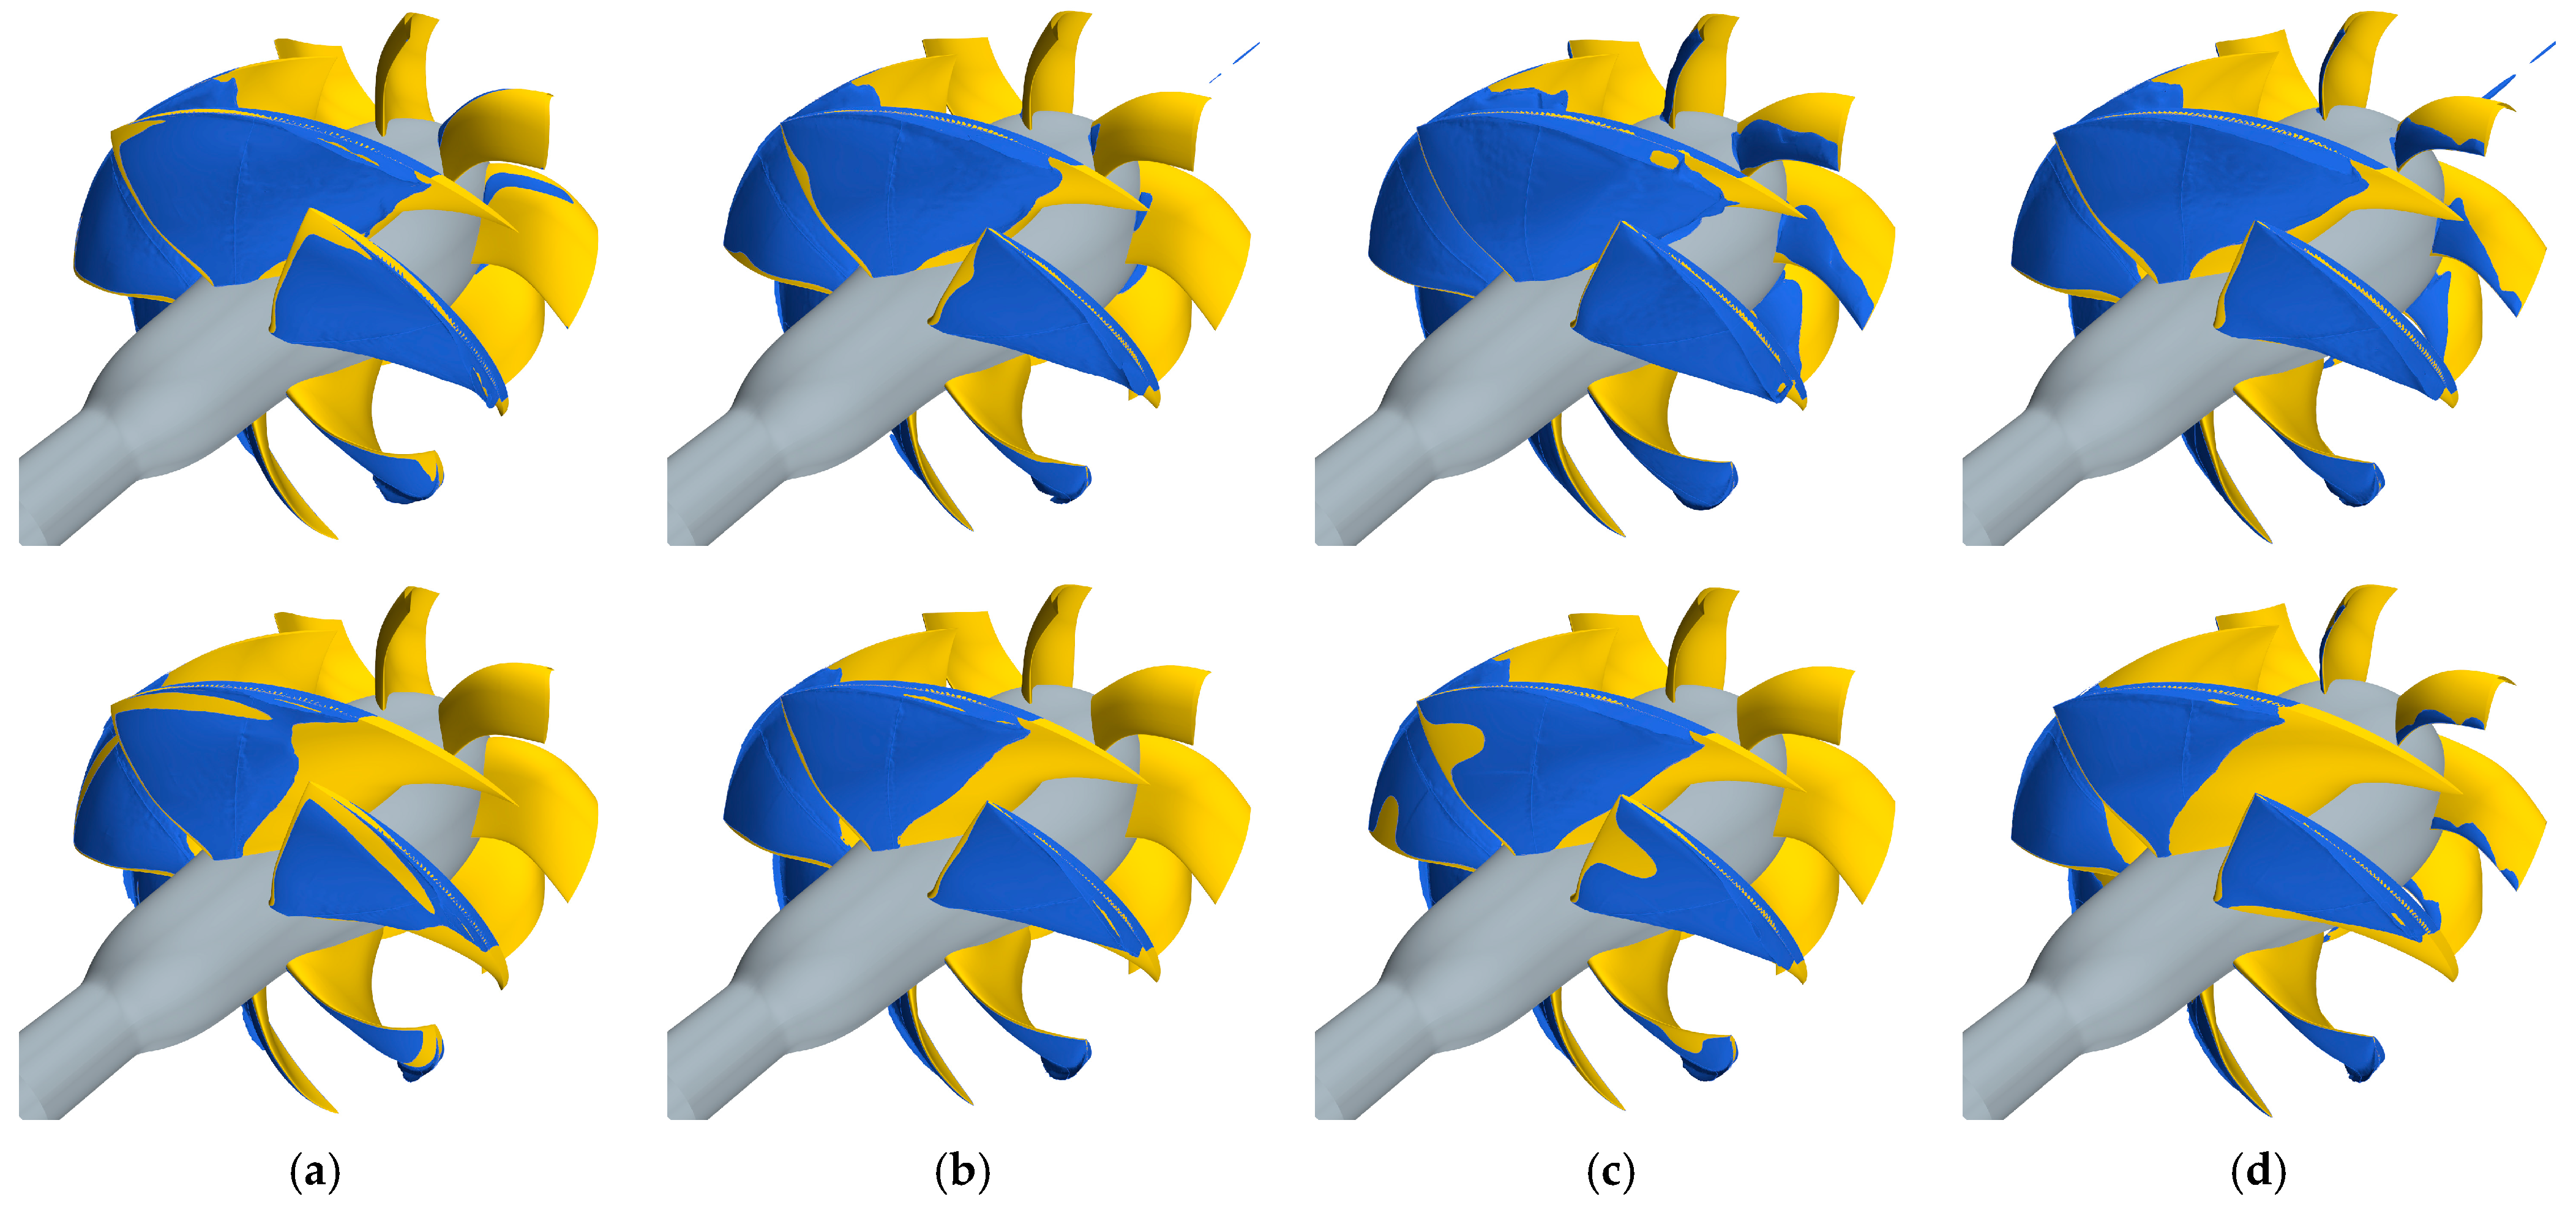
Predicted vapor bubble (isosurface of Vof = 0.5) for Q* = 0.75 at σN = 4 (top), σN = 5 (bottom) for the selected optimized waterjets. WJ-7801 (a), WJ-10128 (b), WJ-9400 (c), and WJ-4837 (d).
The absence of cavitation in the gap for WJ-4837 is itself consistent with the selection criteria of this geometry. Among the four candidates, inception at midchord is the lowest (about 4) at the cost of a leading-edge risk of cavitation substantially higher (σN = 7). This is clearly reflected in the vapor bubble, which is indeed very small, at the leading edge, which is the first occurrence of cavitation also based on the local pressure distribution of Figure 17.
Also, WJ-10128 was selected with a certain risk of leading-edge cavitation (higher than the cavitation index currently discussed for the cavitating calculations) that should correspond to the presence of some vapor at the rotor blade leading edge. This occurrence, however, is not verified. The suction peak, poorly visible in Figure 17b, is not sufficient (in intensity and local extension over the blade) to sustain a complete phase transition, and the vapor bubble, with the current threshold on the vapor fraction (0.5), is not observable (for completeness, a hint of vapor at the tip is appreciable when the vapor volume fraction is lowered to 0.1). A similar limitation of the computational model has been already discussed for the reference geometry. While calculations at σN = 6 reveal no cavitation at all for most of the cases, except confirming the risk of WJ-9400 at midchord, the analyses at the lower cavitation index (and those of Figure 21 at higher loading) magnify the functioning characteristics of the selected waterjets. Partially with the exception of WJ-4837 for the reasons discussed above, rotor blades have a dominant midchord cavity bubble (because of the absence of leading edge back or face suction peaks) which is a clear indicator of the shock-free functioning of the rotor.
WJ-7801, despite having the overall lowest inception criteria on the basis of which it was selected, shows some root and midchord bubbles which, on the other hand, are not observed to the same extent as that of WJ-4837. Tip cavitation from leading edge is confirmed as the most relevant phenomenon of this waterjet, also based on the “thickness” of the vapor bubble observable at Q* = 0.75 despite the poor spatial resolution of the computational grid. The resilience against leading-edge cavitation of WJ-7801 is shown as well, since also in correspondence with the loading condition, leading-edge cavitation at tip is avoided for cavitation index equal to 5. Leading-edge cavitation at the tip for WJ-10128 is only barely observable at σN = 6 (Q* = 0.85), confirming the “weakness” of the suction peak from the non-cavitating analyses adopted as the cavitation indicator in the optimization.
Stator blade cavitation obeys the trends observed from non-cavitating analyses. When the functioning cavitation index is equal to or higher than 5, no vapor bubble is observable on the suction side of the stator. Compared to the reference waterjet, however, the optimized configurations seem more sensitive to this occurrence. This is observable through the presence of root cavitation that characterizes, in increasing order of importance, WJ-10128, WJ-4867, WJ-9400, and WJ-7801 at the design functioning when the cavitation index is reduced to 4. For the latter, stator cavitation is a non-negligible midchord bubble, easily expected from the very intense suction of Figure 18a. For the loaded condition (Figure 21), WJ-10128 is again the less cavitating geometry, since for other waterjets, cavitation appears mainly as a large leading-edge bubble.
These results are the consequences of the geometry modifications described in Figure 22, Figure 23 and Figure 24, which correlate, also through Figure 25 and Figure 26, with the predicted performances in ways very similar to those of conventional propellers.
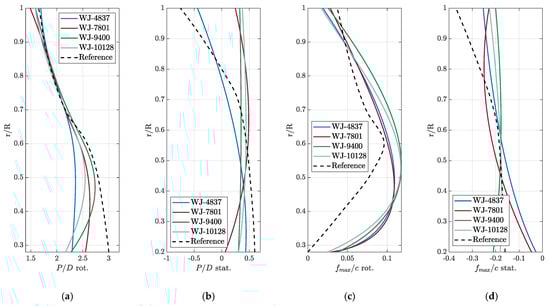
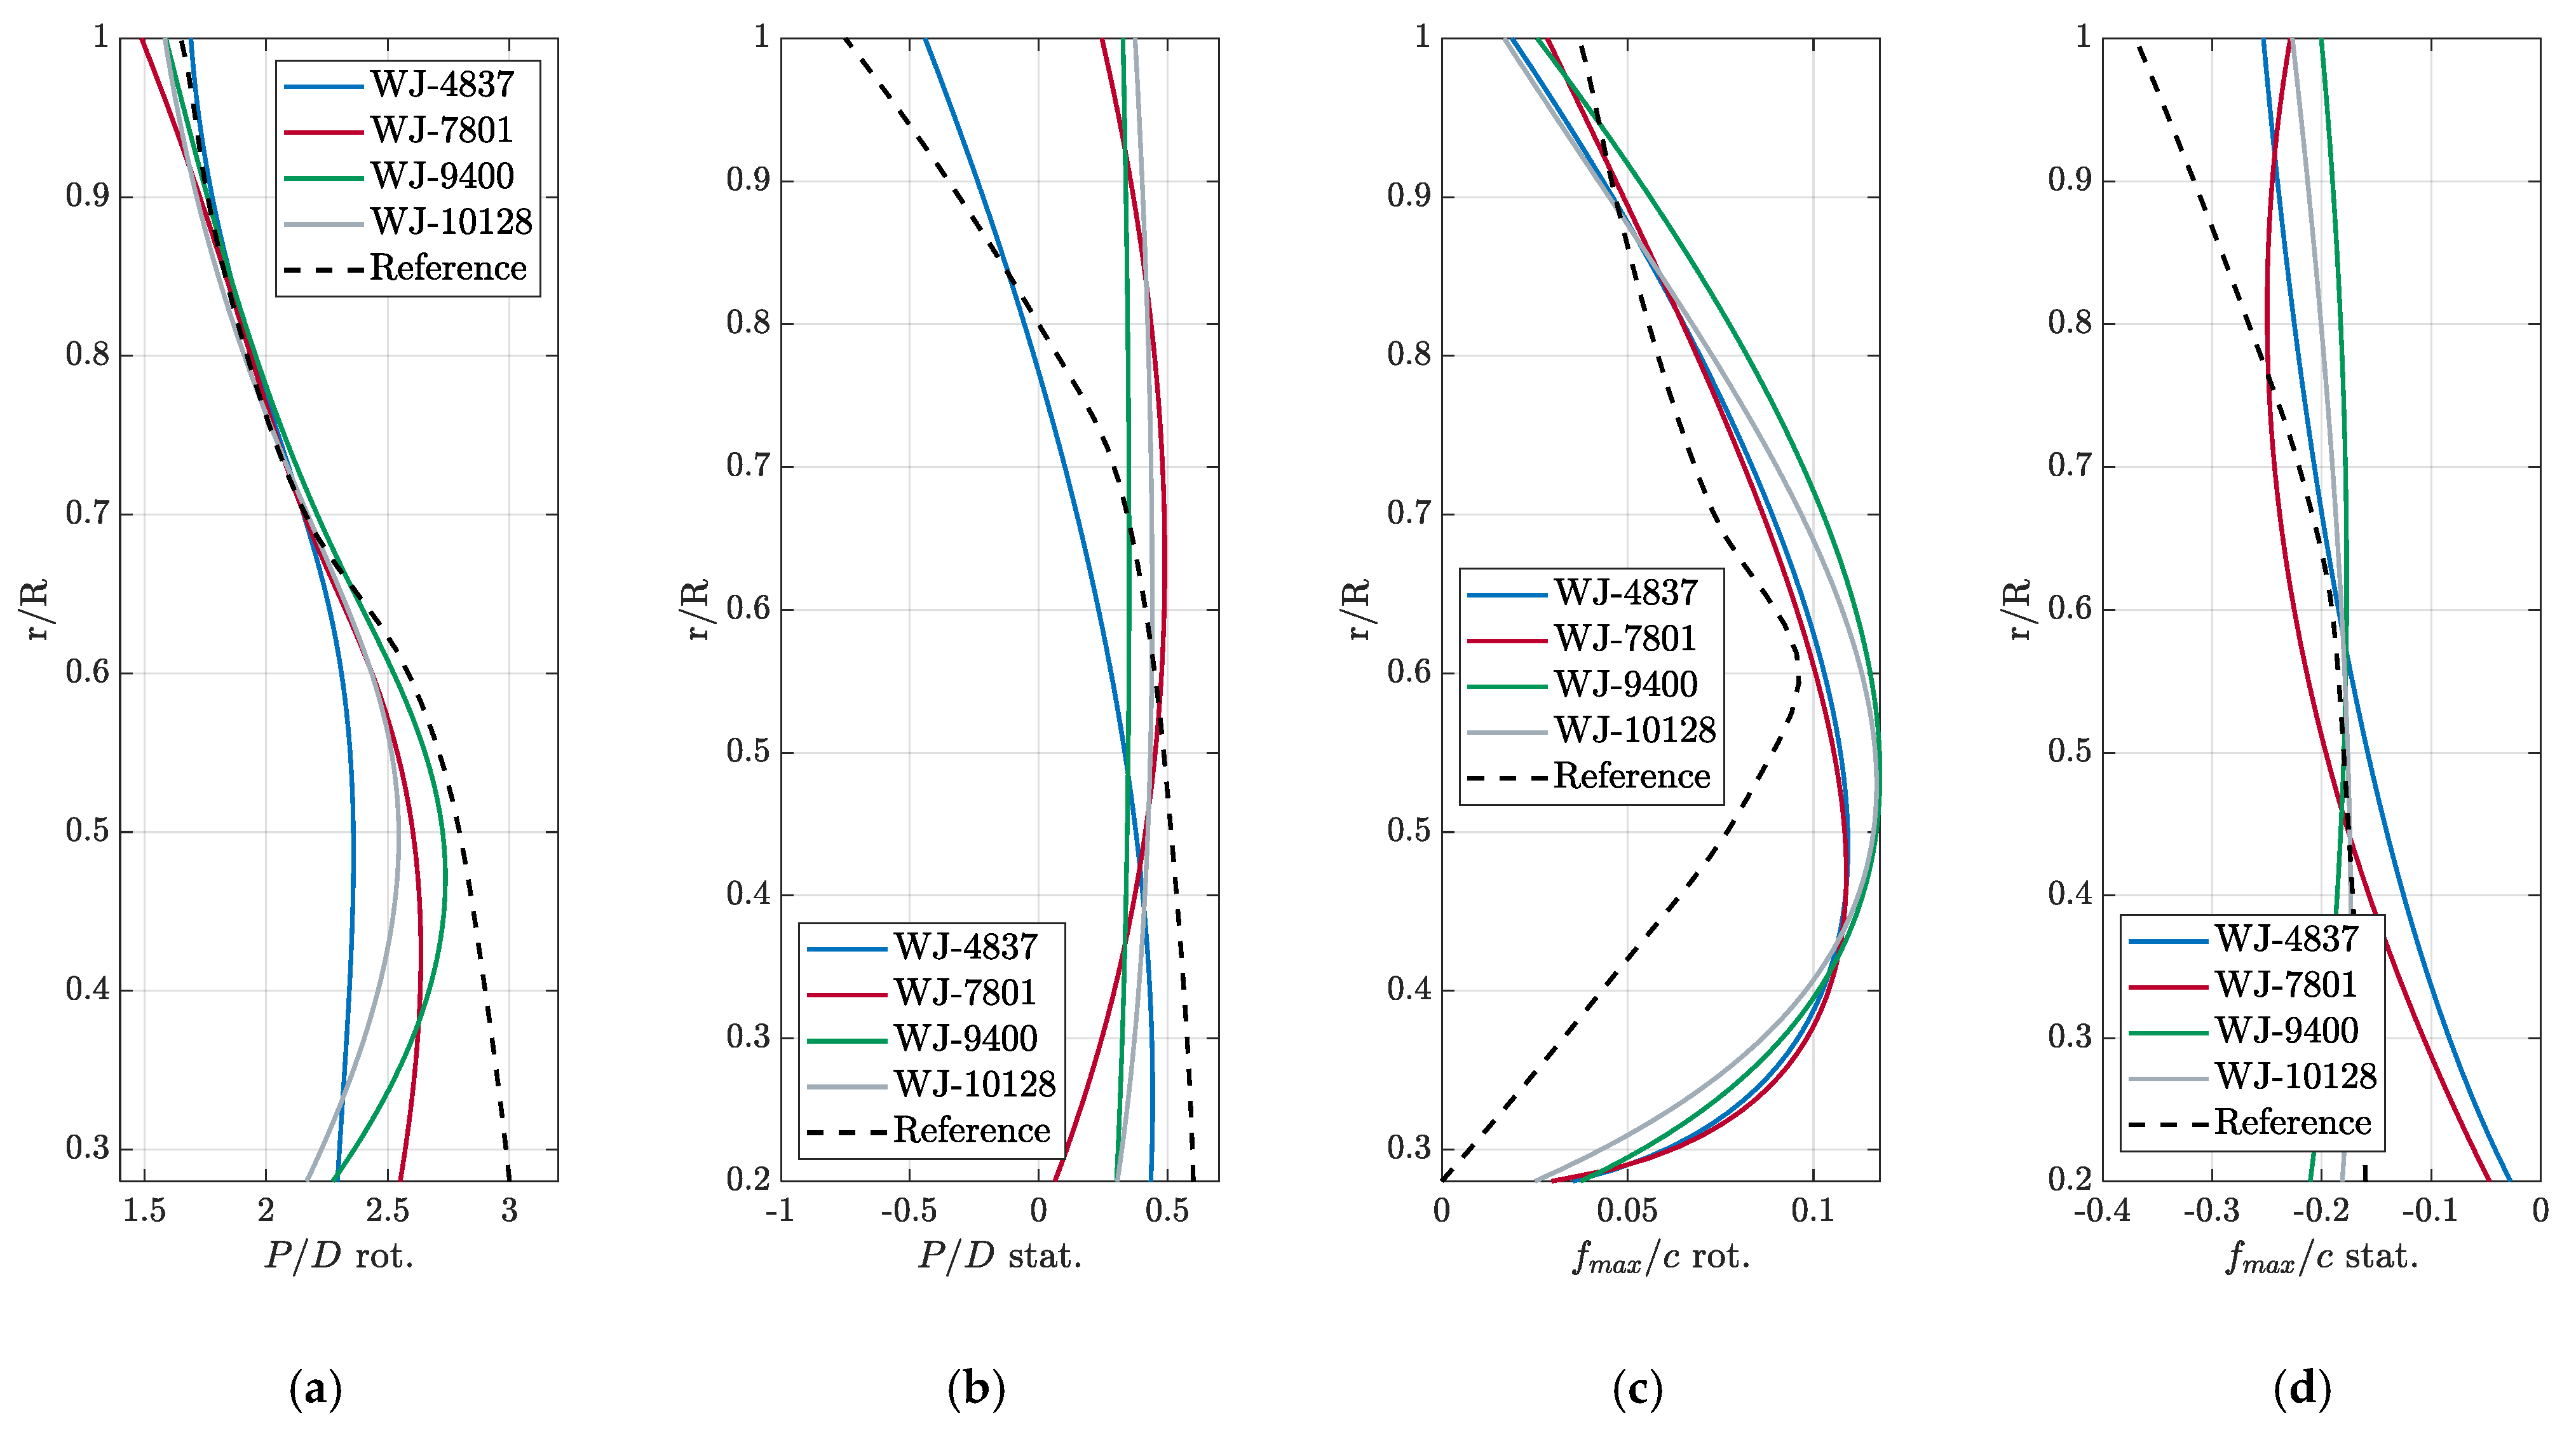
Figure 22.
Radial distributions of non-dimensional pitch, P/D (a), and non-dimensional maximum sectional camber fmax/c (b) for the rotor blade, as well as of non-dimensional pitch, P/D (c), and non-dimensional maximum sectional camber fmax/c (d) for the stator blade.
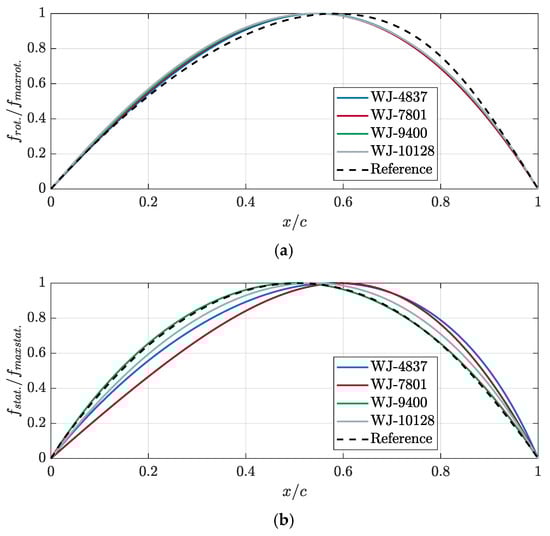
Figure 23.
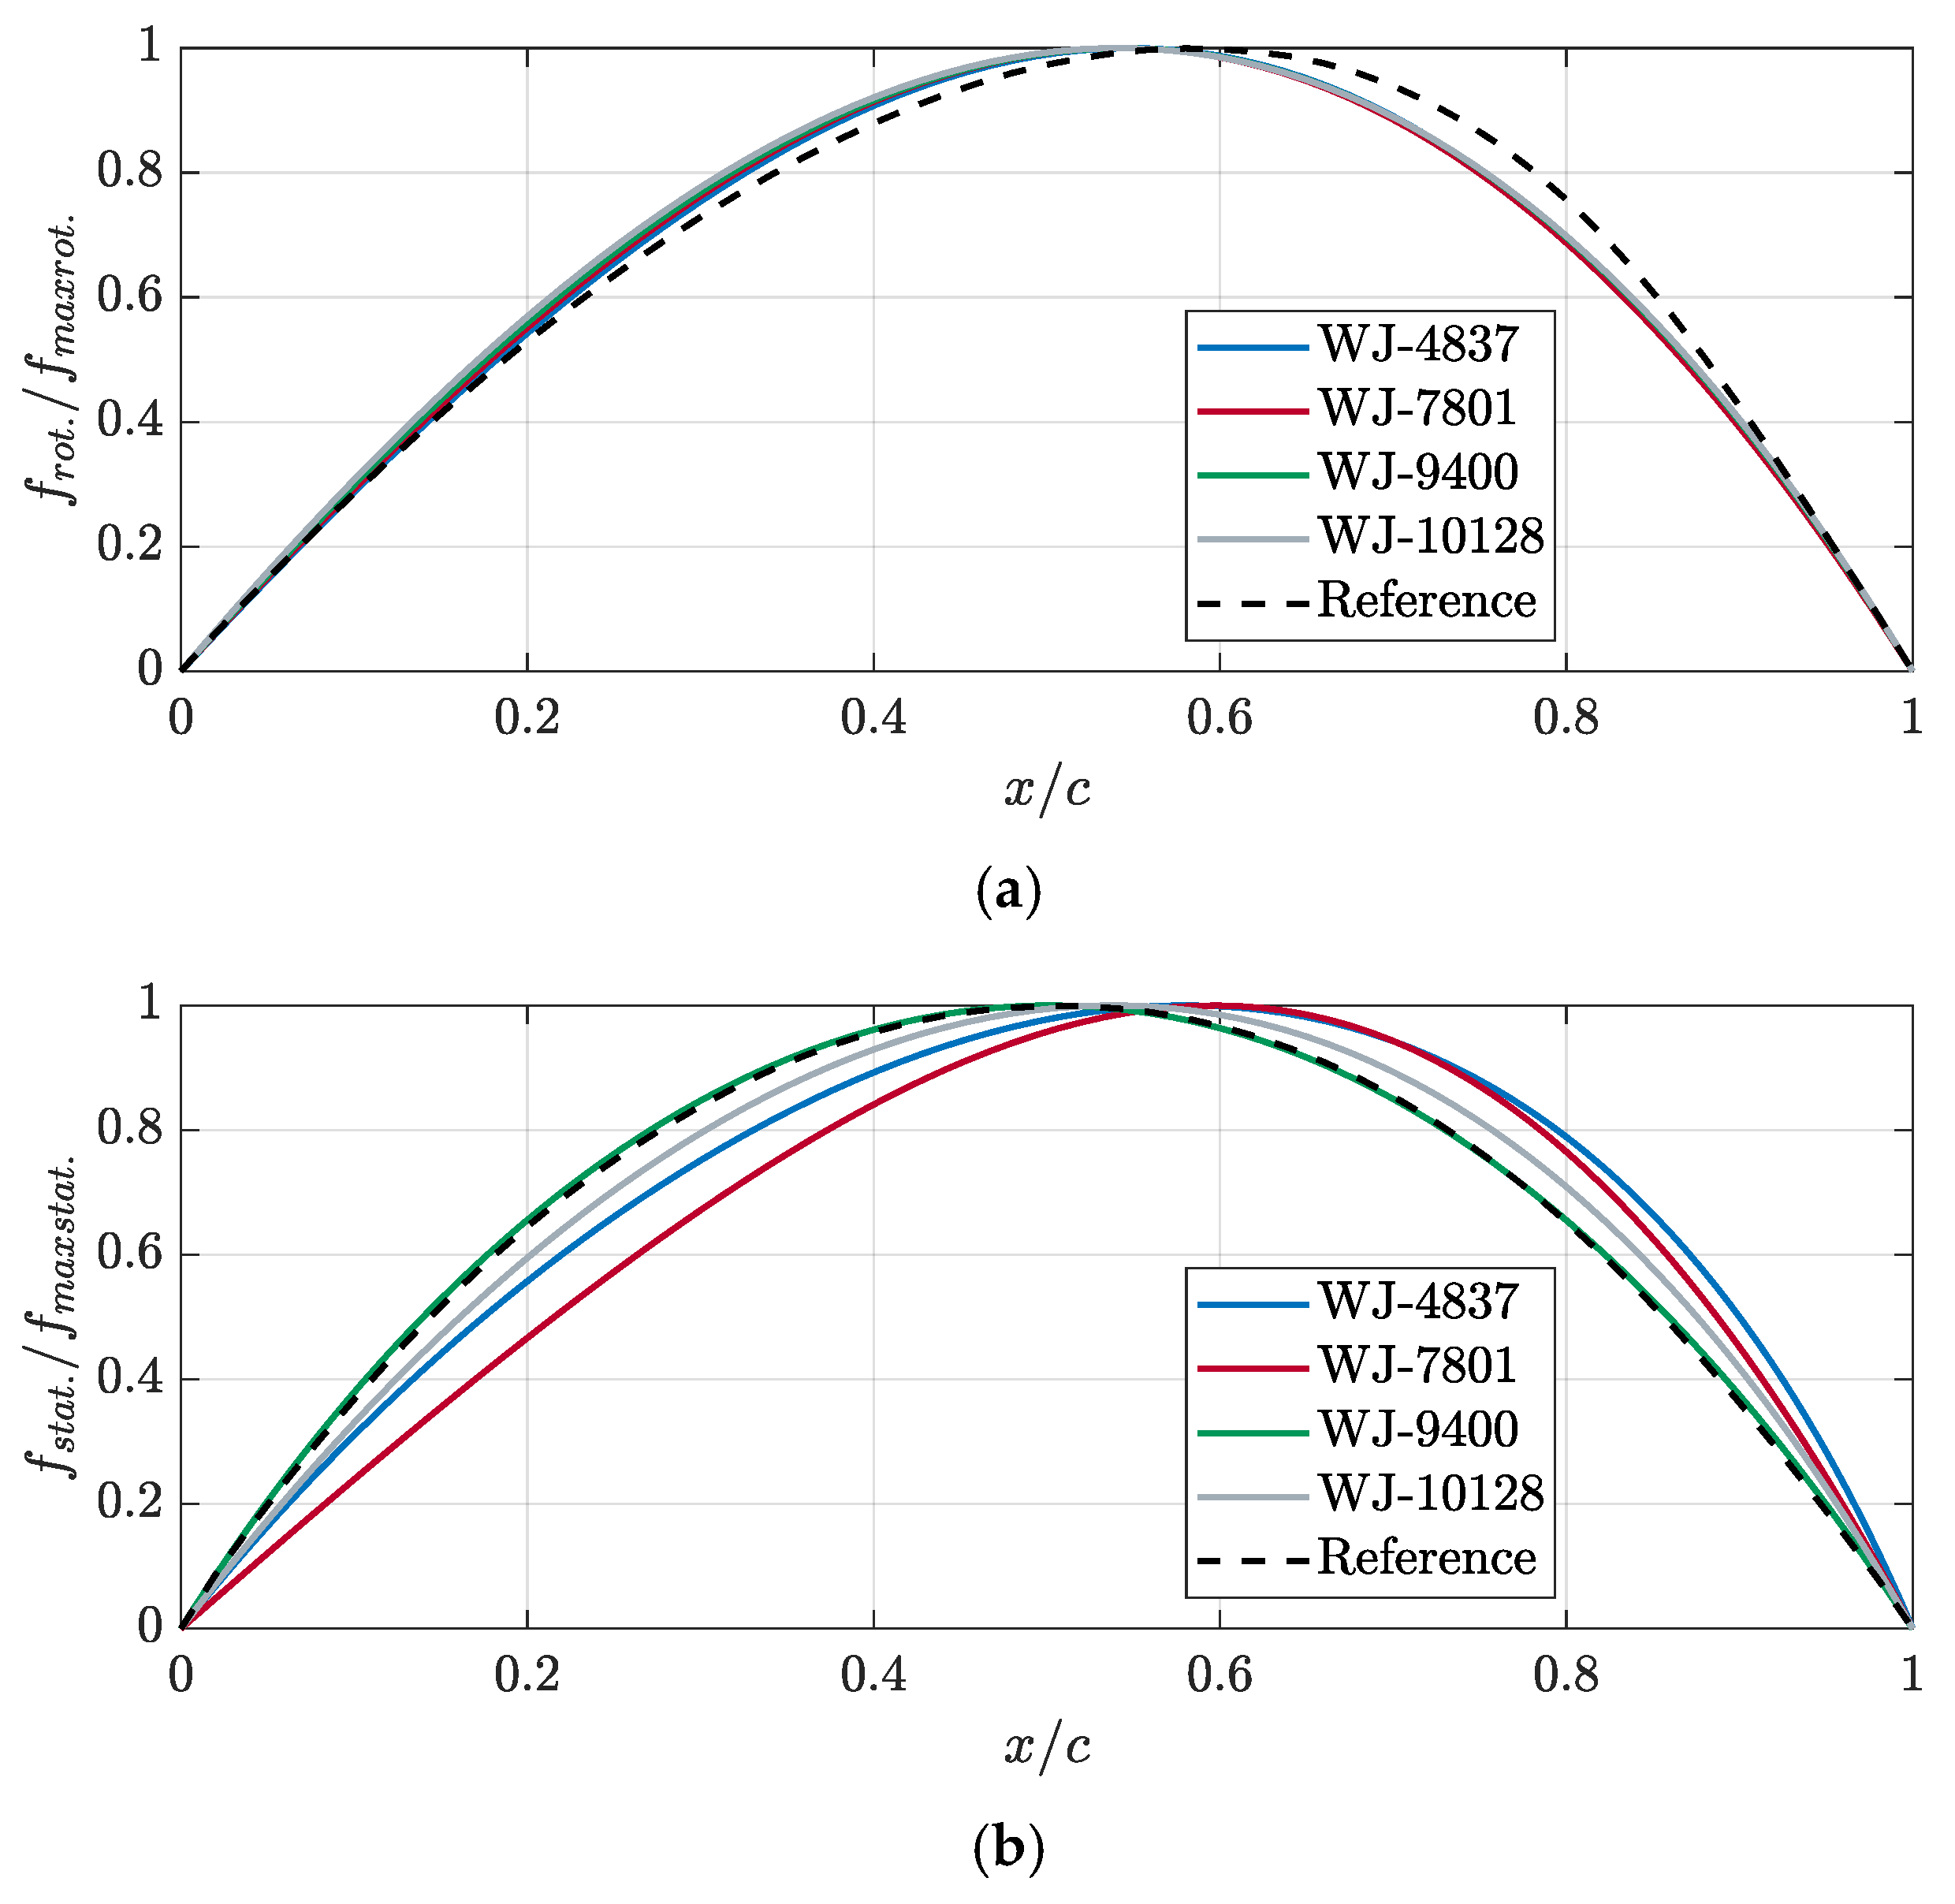
Non-dimensional camber line (with respect to the maximum sectional value, fmax) of the sectional hydrofoils of the rotor (a) and stator (b).
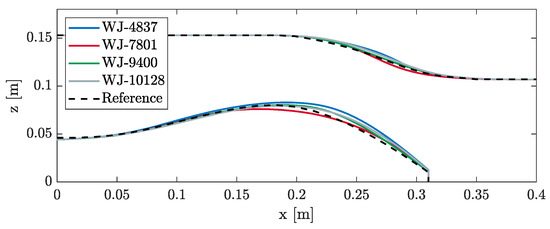
Figure 24.
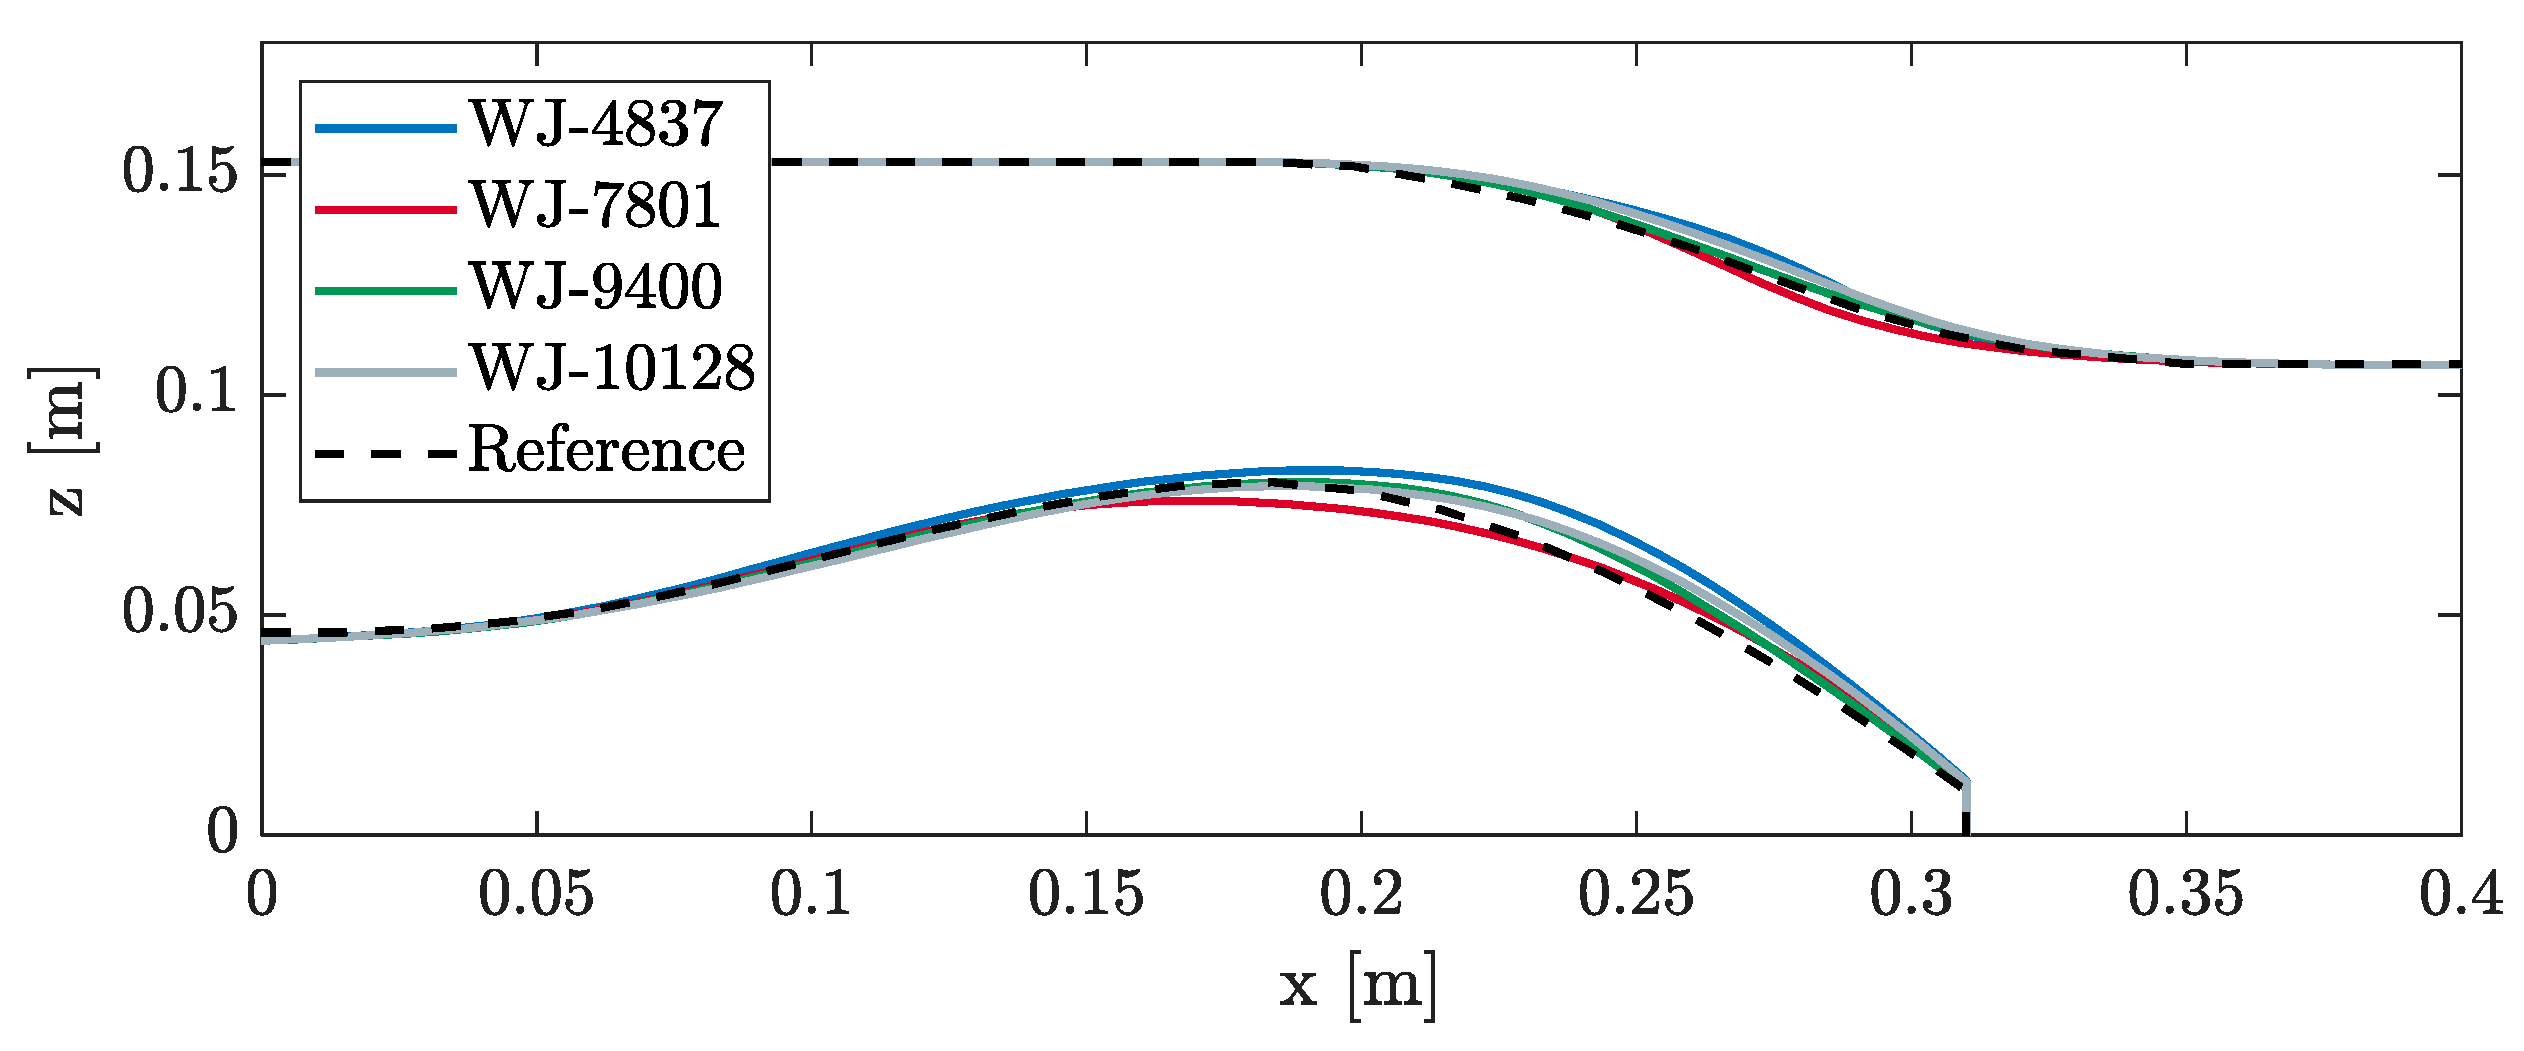
Blade passage (hub and casing meridian section) of selected optimized propellers.
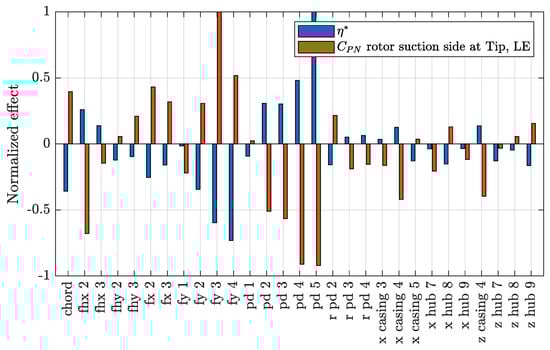
Figure 25.
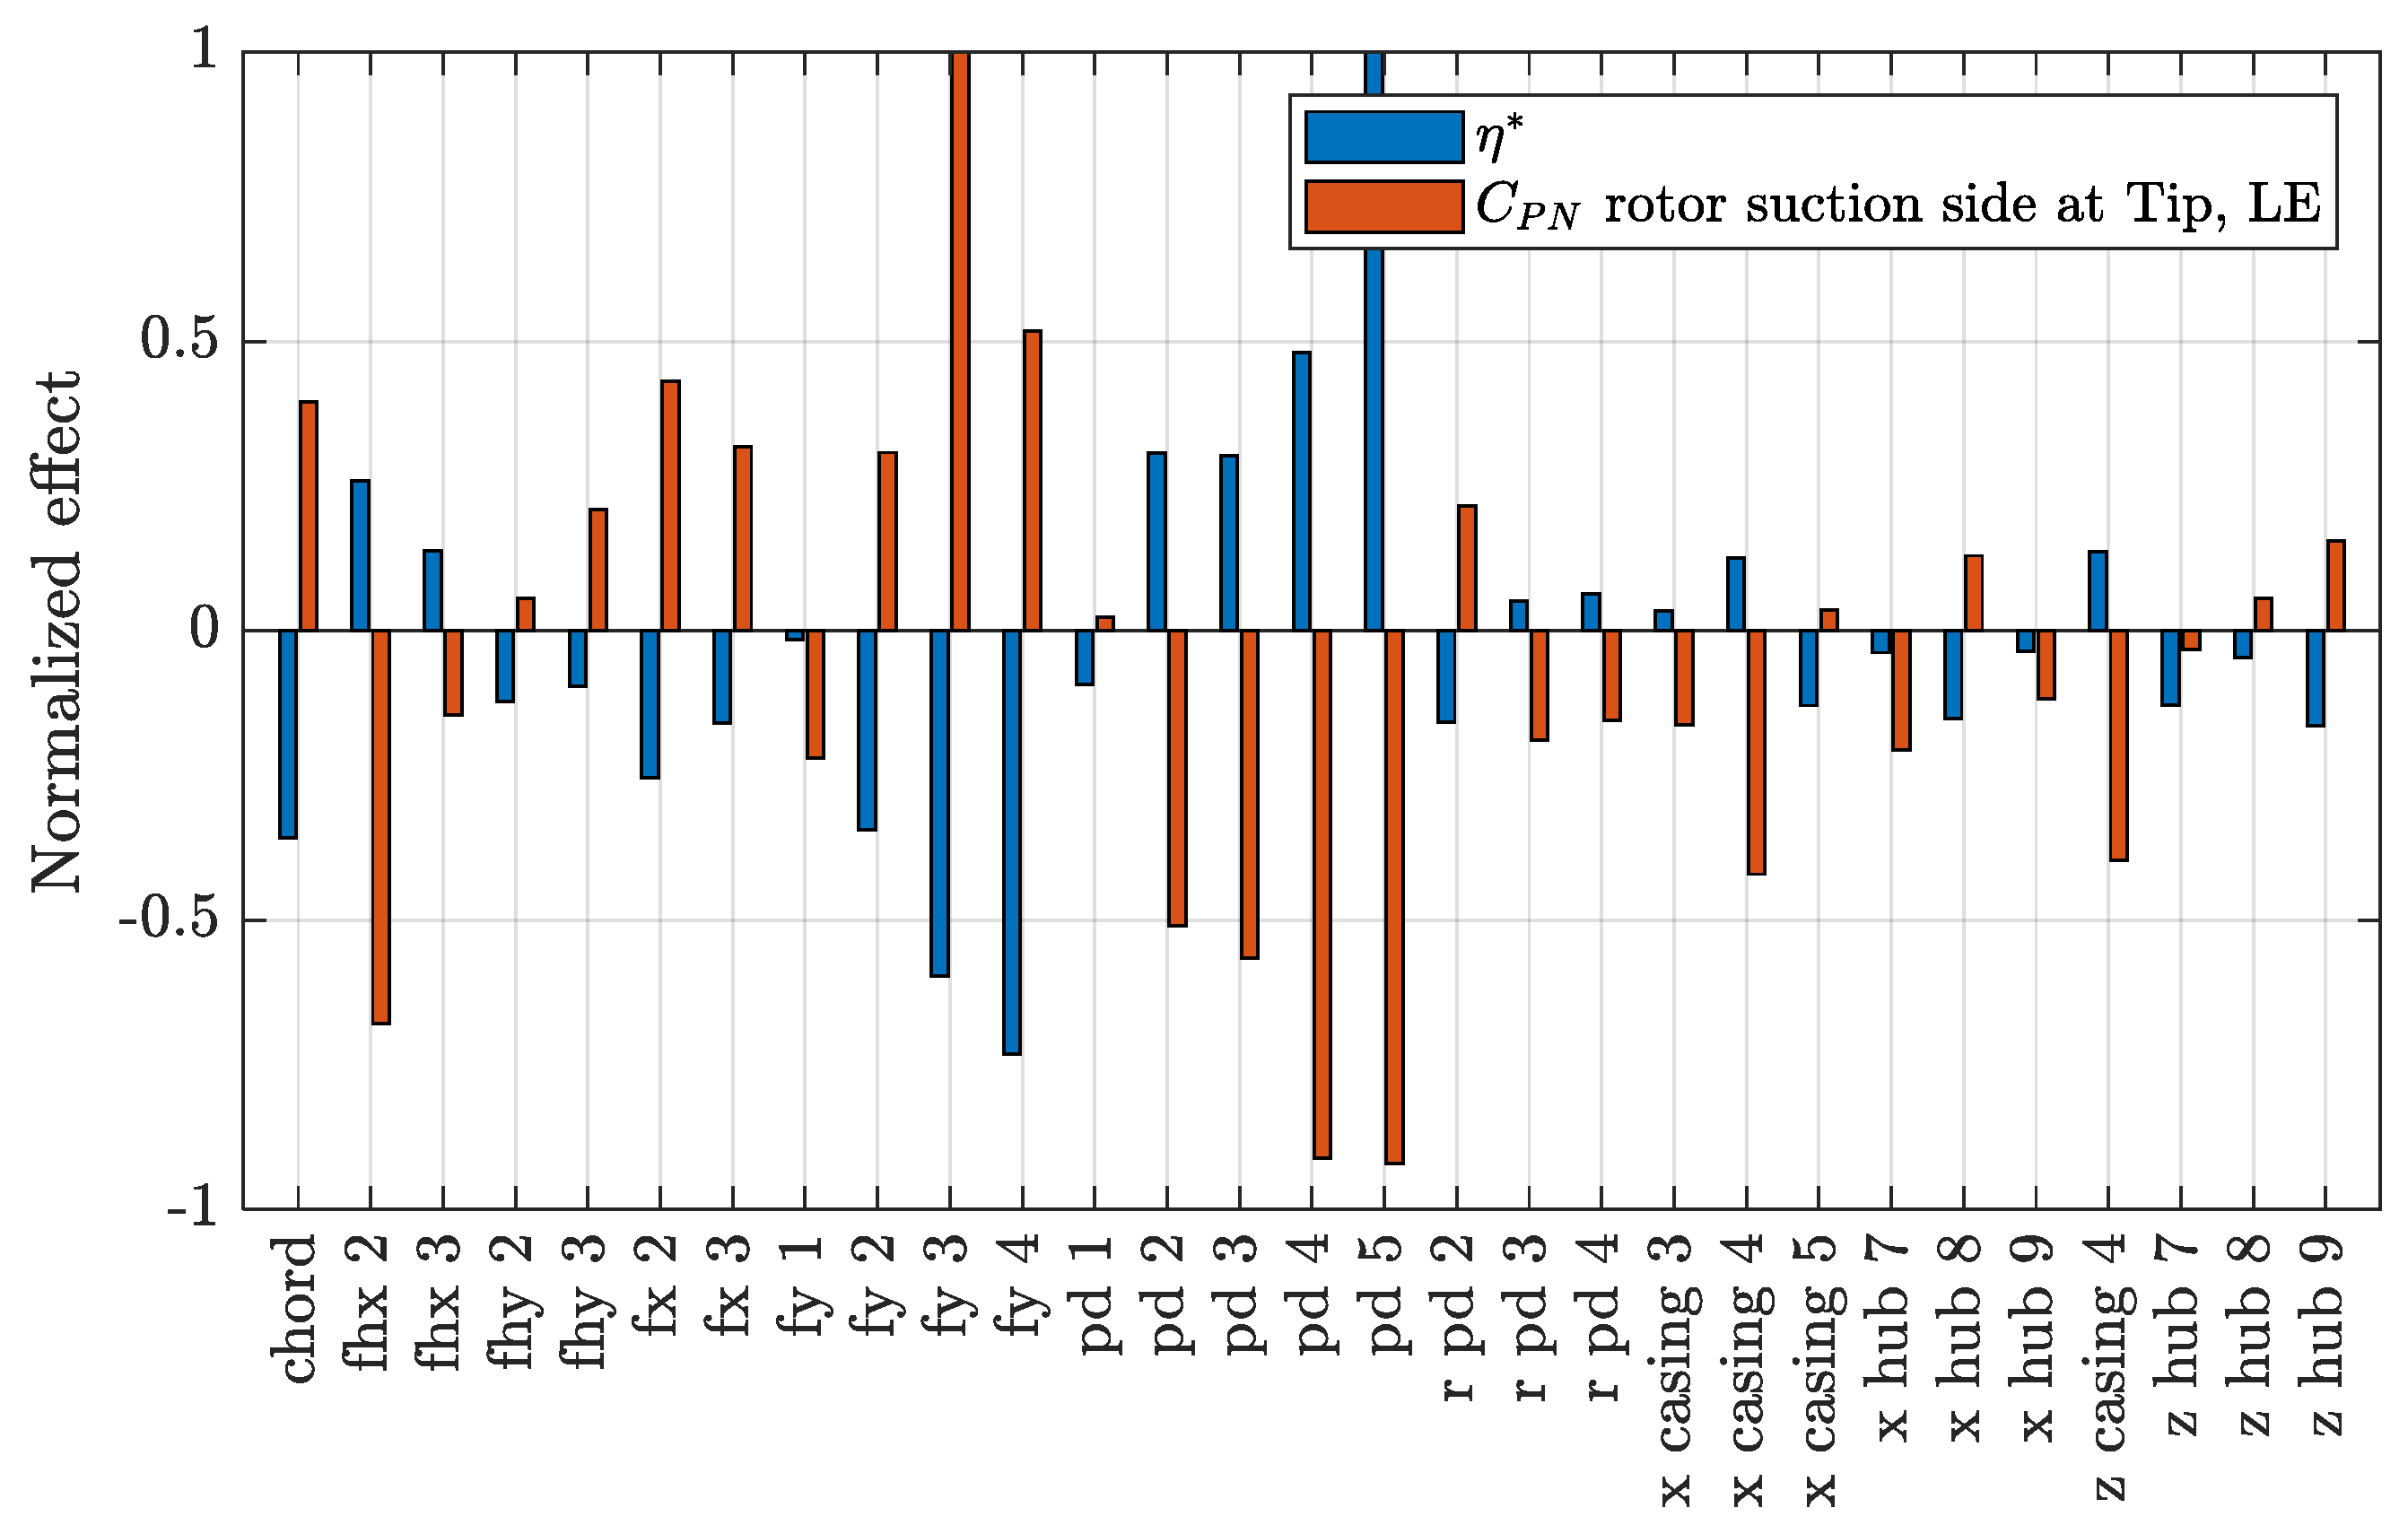
Effect (direct, positive, and inverse, negative) of factors (geometrical parameters of rotor, casing and hub) on efficiency and maximum value of the pressure coefficient on the suction side of the rotor, and the leading edge at the tip.
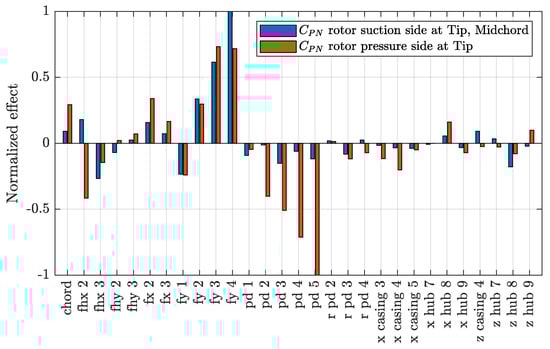
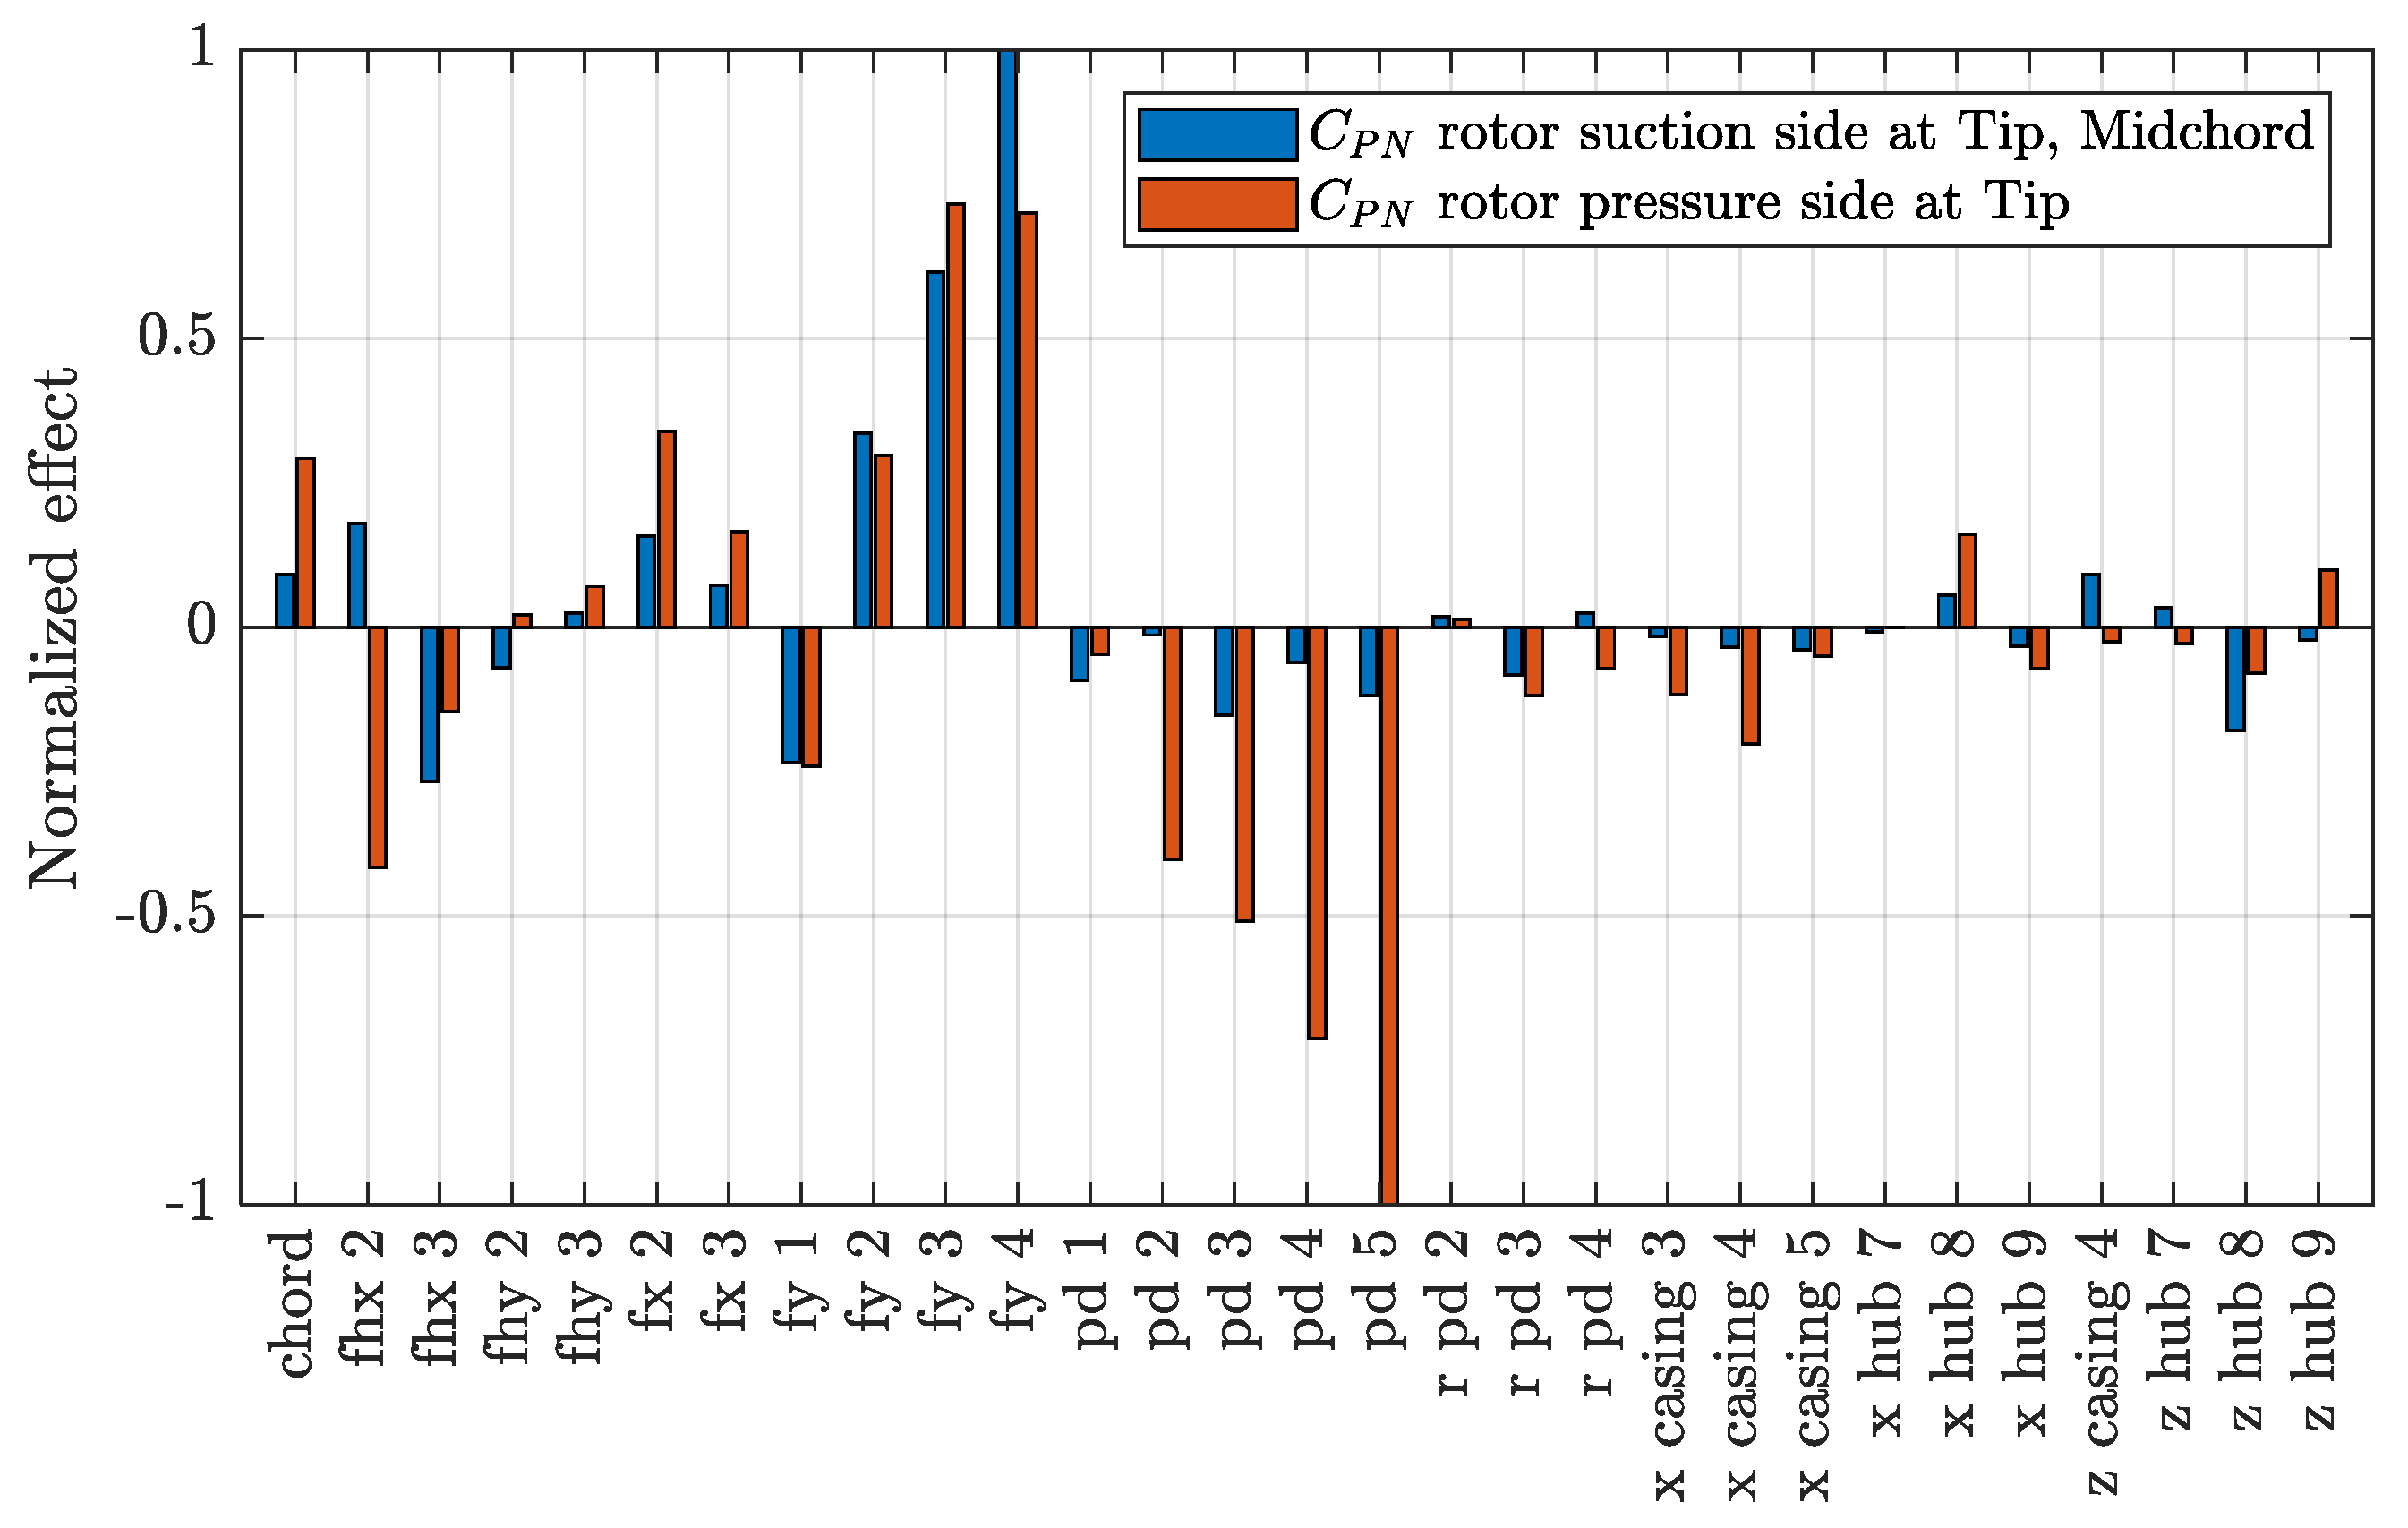
Figure 26.
Effect (direct, positive, and inverse, negative) of factors (geometrical parameters of rotor, casing and hub) on the maximum value of the pressure coefficient on the suction side of the rotor, midchord at the tip, and on the maximum value of the pressure coefficient on the pressure side of the rotor at the tip.
The lowest pitch (P/D) at the tip of WJ-7801 explains the lowest inception at the leading edge; the highest maximum camber (fmax/c) at the intermediate radial positions of WJ-9400 and WJ-10128 (combined, respectively, with the highest and relatively high values of the pitch in the same region) determines the anticipated inception at midchord. The relationship between input (geometrical parameters) and output (performances) variables, studied through the t-Student test, is indeed normal. For efficiency, direct effects (positive values of the normalized effect, i.e., an increase of the input variable causes an increase of the output variable) are ascribable to the pitch, particularly its values at the tip through the value of the last control points (pd_3 to pd_5). On the contrary, efficiency seems negatively influenced (inverse effect) by higher values of maximum sectional camber (fy_1 to fy_3). The expanded area ratio, controlled by the scaling of the chord, has the usual inverse effect on efficiency, also ascribable in the case of waterjets in relation to the increase of the wetted area and the corresponding frictional forces. Higher values of pitch, as expected, are responsible for higher values of pressure at the tip through the inverse effect on CPN in the same figures. Cavitation inception at midchord is driven by sectional camber; as with the case of conventional propellers, highly cambered hydrofoils determine higher suction in the central part of the chord. On the face side as well, when curvature is too high, the risk of suction/pressure side inversion is higher, with the obvious consequences on pressure side cavitation inception. It is worth mentioning that the almost identical shape of the non-dimensional sectional camber lines of the optimized rotor blades (frot./fmax rot. as a function of the non-dimensional chordwise position x/c, from leading to trailing edge) that establish a reference for this type of propulsive device. This is partially ascribable to the very low effect evidenced for the parameters controlling that geometrical feature (fhx and fhy), but it has to be remembered that the test has been performed using the geometries from the optimization and not those from a completely non-correlated sampling of the design space, and this can lower the statistical reliability of the results.
Discussing the influence of casing and hub shapes of the optimized geometries is not obvious. From the t-Student, however, the shape of the casing seems to have a slightly higher influence than the hub with concern to the risk of cavitation at the tip, while for efficiency and other types of cavitation its role, as that of the hub, the results are negligible. This suggests that it is opportune to neglect these design parameters, at least for the preliminary exploration of rotor and stator shapes, thus accelerating the convergence of the process.
6. Conclusions
This study has demonstrated the effectiveness of design-by-optimization methodologies in enhancing the performance of waterjet systems. By leveraging computational fluid dynamics (CFD) simulations and advanced optimization techniques, designs with improved overall performances, including the increase of efficiency and reduction of the risk of cavitation, were identified. This was possible thanks to a simplified, but reliable and verified, computational setup built upon single-blade passage, mixing plane, and moving reference frame models, which are the fundamental assumptions for the computational efficiency needed to evaluate the thousands of different configurations required for any optimization design methodology. With a simulation time between 8 and 10 min per case, using 240 computing cores and parallelization, the 12,000 designs of the optimization were completed in less than 20 days.
Since design-by-optimization methodologies provide sets of (and not single) designs, distinguished by different weighting of the objectives, the accurate analyses of a selection of these optimal geometries allowed discussing the flexibility of the design method and the reliability, and possible limitations, of the selection criteria adopted throughout the process. The reduction of the risk of cavitation (i.e., the minimization of the maximum of the suction, that is the minimization of the inception cavitation index) proved to be, in most cases, a computationally efficient way to monitor cavitation without the burden and the cost of truly cavitating analyses. Detailed cavitating calculations confirmed the overall results of the simplified analyses but pointed out some limitations of the adopted criteria, which are mainly related to the approximated information regarding the real extension of the cavitation bubble. As shown in the paper, indeed, as a consequence of the final development of the cavity bubble (influenced by the suction peak but also by the “extension” of the region under inception conditions, i.e., with a pressure lower than the cavitation index), configurations regarded as the best-performing (WJ-7801, for instance) showed actually delayed inception but not the less-extended bubble, which instead was observed for configurations having a slightly different balance between cavitating phenomena (WJ-10128). In this respect, criteria like the “inception volume” and the “inception area” from non-cavitating analyses [57] may help to discern among configurations those having similar inception characteristics. In addition, the “cavitating area” was monitored throughout the design process; but without a dedicate experience on this type of propulsors (that can be simply a trustable correlation between cavitation area and final vapor extension), this information was not completely exploited during the selection step.
In any case, the analysis of the set of optimized propellers using both non-cavitating and cavitating models shows the success of the design-by-optimization methodology. Rotor blades are shock-free oriented under the simultaneous influence of casing, and stator blades have an overall delayed cavitation inception and provide not-worsened to significantly improved hydraulic efficiencies, sometimes under off-design conditions as well. Following the strand of propellers and unconventional propulsor designs, future work should explore surrogate-aided design-by-optimization methodologies, machine learning techniques, and design-under-uncertainties which, in the end, may provide configurations less sensitive to perturbations of the functioning conditions at a lower computational cost.
Author Contributions
Conceptualization, S.G.; Methodology, S.G.; Software, S.G.; Validation, F.M.; Formal analysis, S.G. and F.M.; Writing—original draft, S.G.; Visualization, F.M.; Supervision, S.G. All authors have read and agreed to the published version of the manuscript.
Funding
This research received no external funding.
Data Availability Statement
The data presented in this study are available on request from the corresponding author.
Conflicts of Interest
The authors declare no conflicts of interest.
References
- Zhang, D.; Shi, W.; Van Esch, B.B.; Shi, L.; Dubuisson, M. Numerical and experimental investigation of tip leakage vortex trajectory and dynamics in an axial flow pump. Comput. Fluids 2015, 112, 61–71. [Google Scholar] [CrossRef]
- Shi, L.; Zhang, D.; Zhao, R.; Shi, W.; BPM, B.V. Visualized observations of trajectory and dynamics of unsteady tip cloud cavitating vortices in axial flow pump. J. Fluid Sci. Technol. 2017, 12, JFST0007. [Google Scholar] [CrossRef]
- Shi, G.; Liu, Z.; Xiao, Y.; Li, H.; Liu, X. Tip leakage vortex trajectory and dynamics in a multiphase pump at off-design condition. Renew. Energy 2020, 150, 703–711. [Google Scholar] [CrossRef]
- Zhang, D.; Shi, L.; Shi, W.; Zhao, R.; Wang, H.; Van Esch, B.B. Numerical analysis of unsteady tip leakage vortex cavitation cloud and unstable suction-side-perpendicular cavitating vortices in an axial flow pump. Int. J. Multiph. Flow 2015, 77, 244–259. [Google Scholar] [CrossRef]
- Wu, H.; Tan, D.; Miorini, R.L.; Katz, J. Three-dimensional flow structures and associated turbulence in the tip region of a waterjet pump rotor blade. Exp. Fluids 2011, 51, 1721–1737. [Google Scholar] [CrossRef]
- Wu, H.; Miorini, R.L.; Katz, J. Measurements of the tip leakage vortex structures and turbulence in the meridional plane of an axial water-jet pump. Exp. Fluids 2011, 50, 989–1003. [Google Scholar] [CrossRef]
- Tan, D.; Li, Y.; Wilkes, I.; Vagnoni, E.; Miorini, R.L.; Katz, J. Experimental investigation of the role of large scale cavitating vortical structures in performance breakdown of an axial waterjet pump. J. Fluids Eng. 2015, 137, 111301. [Google Scholar] [CrossRef]
- Miorini, R.L.; Wu, H.; Katz, J. The internal structure of the tip leakage vortex within the rotor of an axial waterjet pump. J. Turbomach. 2012, 134, 031018. [Google Scholar] [CrossRef]
- Wu, H.; Miorini, R.L.; Tan, D.; Katz, J. Turbulence within the tip-leakage vortex of an axial waterjet pump. AIAA J. 2012, 50, 2574–2587. [Google Scholar] [CrossRef]
- Tan, D.; Li, Y.; Miorini, R.; Vagnoni, E.; Katz, J.W. Role of large scale cavitating vortical structures in the rotor passage of an axial waterjet pump in performance breakdown. In Proceedings of the 30th Symposium on Naval Hydrodynamics, Hobart, Australia, 2–7 November 2014. [Google Scholar]
- Lindau, J.W.; Moody, W.L.; Kinzel, M.P.; Dreyer, J.J.; Kunz, R.F.; Paterson, E.G. Computation of cavitating flow through marine propulsors. In Proceedings of the 1st International Symposium on Marine Propulsors, Trondheim, Norway, 22–24 June 2009. [Google Scholar]
- Schroeder, S.; Kim, S.E.; Jasak, H. Toward predicting performance of an Axial flow waterjet including the effects of cavitation and thrust breakdown. In Proceedings of the First International Symposium on Marine Propulsors, Trondheim, Norway, 22–24 June 2009. [Google Scholar]
- Lindau, J.W.; Pena, C.; Baker, W.J.; Dreyer, J.J.; Moody, W.L.; Kunz, R.F.; Paterson, E.G. Modeling of cavitating flow through waterjet propulsors. Int. J. Rotating Mach. 2012, 2012, 716392. [Google Scholar] [CrossRef]
- Avanzi, F.; Baù, A.; De Vanna, F.; Benini, E. Numerical assessment of a two-phase model for propulsive pump performance prediction. Energies 2023, 16, 6592. [Google Scholar] [CrossRef]
- Huang, R.; Wang, Y.; Du, T.; Luo, X.; Zhang, W.; Dai, Y. Mechanism analyses of the unsteady vortical cavitation behaviors for a waterjet pump in a non-uniform inflow. Ocean. Eng. 2021, 1087, 23398. [Google Scholar] [CrossRef]
- Guo, Q.; Huang, X.; Qiu, B. Numerical investigation of the blade tip leakage vortex cavitation in a waterjet pump. Ocean. Eng. 2019, 187, 106170. [Google Scholar] [CrossRef]
- Arabnejad, M.; Eslamdoost, A.; Svennberg, U.; Bensow, R. Scale resolving simulations of the non-cavitating and cavitating flows in an axial water jet pump. In Proceedings of the 33nd Symposium on Naval Hydrodynamics, Osaka, Japan, 18–23 October 2020. [Google Scholar]
- Michael, T.J.; Schroeder, S.D.; Becnel, A.J. Design of the ONR AxWJ-2 axial flow water jet pump. NSWCCD Dep. Rep. 2008, 63. Available online: https://apps.dtic.mil/sti/citations/ADA489739 (accessed on 7 April 2025).
- Han, C.Z.; Xu, S.; Cheng, H.Y.; Ji, B.; Zhang, Z.Y. LES method of the tip clearance vortex cavitation in a propelling pump with special emphasis on the cavitation-vortex interaction. J. Hydrodyn. 2020, 32, 1212–1216. [Google Scholar] [CrossRef]
- Liu, X.; Chen, T.; Huang, B.; Wang, G. The spatio-temporal evolution of detailed cavitating vortex structures in an axial flow waterjet pump. Phys. Fluids 2025, 37, 013384. [Google Scholar] [CrossRef]
- Zhao, X.; Chen, T.; Liu, X.; Huang, B.; Wang, G. Characteristics and mechanisms of the tip leakage cavitating flow around a NACA66 (mod) hydrofoil under different cavitation states. Ocean. Eng. 2022, 266, 112704. [Google Scholar] [CrossRef]
- Muscari, R.; Di Mascio, A. Detached Eddy Simulation of the flow behind an isolated propeller. In Proceedings of the Third International Symposium on Marine Propulsors, Lanceston, Australia, 5–8 May 2013. [Google Scholar]
- Ahmed, S.; Croaker, P.; Doolan, C.J. On the instability mechanisms of ship propeller wakes. Ocean. Eng. 2020, 213, 107609. [Google Scholar] [CrossRef]
- Gaggero, S.; Martinelli, M. Design and analysis of pumpjet propulsors using CFD-based optimization. Ocean. Eng. 2023, 277, 114304. [Google Scholar] [CrossRef]
- Gaggero, S. A study on the wake evolution of a set of RIM-driven thrusters. J. Mar. Sci. Eng. 2023, 11, 1659. [Google Scholar] [CrossRef]
- Gaggero, S.; Ferrando, M. Wake instabilities of tip-loaded propellers: Comparison between CLT and “new generation” CLT configurations. J. Mar. Sci. Eng. 2023, 11, 112. [Google Scholar] [CrossRef]
- Qin, D.; Huang, Q.; Shi, Y.; Pan, G.; Shi, Y.; Dong, X. Comparison of hydrodynamic performance and wake vortices of two typical types of pumpjet propulsor. Ocean. Eng. 2021, 224, 108700. [Google Scholar] [CrossRef]
- Gong, J.; Guo, C.Y.; Zhao, D.G.; Wu, T.C.; Song, K.W. A comparative DES study of wake vortex evolution for ducted and non-ducted propellers. Ocean. Eng. 2018, 160, 78–93. [Google Scholar] [CrossRef]
- Li, H.; Huang, Q.; Pan, G.; Dong, X. Wake instabilities of a pre-swirl stator pump-jet propulsor. Phys. Fluids 2021, 33, 085119. [Google Scholar] [CrossRef]
- Li, H.; Huang, Q.; Pan, G.; Dong, X.; Li, F. Effects of blade number on the propulsion and vortical structures of pre-swirl stator pump-jet propulsors. J. Mar. Sci. Eng. 2021, 9, 1406. [Google Scholar] [CrossRef]
- Taylor, T.E.; Kerwin, J.E.; Scherer, J.O. Waterjet pump design and analysis using a coupled lifting surface and RANS procedure. In Proceedings of the International Conference on Waterjet Propulsion II, RINA, Amsterdam, The Netherlands, 22–23 October 1998. [Google Scholar]
- Kerwin, J.E.; Taylor, T.E.; Black, S.D.; McHugh, G.P. A coupled lifting-surface analysis technique for marine propulsors in steady flow. In Proceedings of the SNAME Propeller and Shafting Symposium, SNAME, Virginia Beach, VA, USA, 23–24 September 1997; p. D021S002R010. [Google Scholar]
- Kerwin, J.E.; Michael, T.J.; Neely, S.K. Improved algorithms for the design/analysis of multi-component complex propulsors. In Proceedings of the SNAME Propeller and Shafting Symposium, SNAME, Williamsburg, VA, USA, 12–13 September 2006; p. D021S002R007. [Google Scholar]
- Kinnas, S.A.; Chang, S.H.; Yu, Y.H. Prediction of wetted and cavitating performance of water-jets. In Proceedings of the 28th Symposium on Naval Hydrodynamics, Pasadena, CA, USA, 12–17 September 2010. [Google Scholar]
- Sun, H.; Kinnas, S.A. Performance prediction of cavitating water-jet propulsors using a viscous/inviscid interactive method. In Proceedings of the SNAME Maritime Convention, SNAME, Houston, TX, USA, 17–18 October 2008; p. D021S003R005. [Google Scholar]
- Gaggero, S. Robust simulation-based design optimization of marine propellers. Ocean. Eng. 2025, 321, 120397. [Google Scholar] [CrossRef]
- Vesting, F.; Gustafsson, R.; Bensow, R.E. Development and application of optimisation algorithms for propeller design. Ship Technol. Res. 2016, 63, 50–69. [Google Scholar] [CrossRef]
- Gaggero, S.; Gonzalez-Adalid, J.; Sobrino, M.P. Design of contracted and tip loaded propellers by using boundary element methods and optimization algorithms. Appl. Ocean. Res. 2016, 55, 102–129. [Google Scholar] [CrossRef]
- Gaggero, S. Numerical design of a RIM-driven thruster using a RANS-based optimization approach. Appl. Ocean. Res. 2020, 94, 101941. [Google Scholar] [CrossRef]
- Gaggero, S.; Villa, D.; Grassi, D.; Valdenazzi, F.; Felli, M.; Bae, C. Design and analysis of a pumpjet propulsor for a ferry ship. In Proceedings of the Eighth International Symposium on Marine Propulsors—smp’24, Berlin, Germany, 17–20 March 2024; pp. 107–116. [Google Scholar]
- Kim, M.S.; Kim, S.A. Design and experimental verification of hubless rim-driven propulsor consisting of bearingless propeller for an unmanned underwater drone. Energies 2023, 16, 7458. [Google Scholar] [CrossRef]
- Nie, Y.; Ouyang, W.; Zhang, Z.; Li, G.; Zheng, R. Multi-parameter optimization analysis of hydrodynamic performance for rim-driven thruster. Energies 2023, 16, 891. [Google Scholar] [CrossRef]
- Liu, B.; Vanierschot, M.; Buysschaert, F. Optimization design of the duct of a rim-driven thruster using the adjoint approach. Ocean. Eng. 2023, 278, 114293. [Google Scholar] [CrossRef]
- Gypa, I.; Jansson, M.; Bensow, R. Marine propeller optimisation through user interaction and machine learning for advanced blade design scenarios. Ships Offshore Struct. 2024, 19, 1659–1675. [Google Scholar] [CrossRef]
- Gaggero, S.; Vernengo, G.; Villa, D. A marine propeller design method based on two-fidelity data levels. Appl. Ocean. Res. 2022, 123, 103156. [Google Scholar] [CrossRef]
- Gaggero, S.; Martinelli, M. Pre-swirl fins design for improved propulsive performances: Application to fast twin-screw passenger ships. J. Ocean. Eng. Mar. Energy 2023, 9, 69–91. [Google Scholar] [CrossRef]
- Serani, A.; Diez, M.; Quagliarella, D. Aerodynamic shape optimization in transonic conditions through parametric model embedding. Aerosp. Sci. Technol. 2024, 155, 109611. [Google Scholar] [CrossRef]
- Gaggero, S.; Vernengo, G.; Villa, D.; Bonfiglio, L. A reduced order approach for optimal design of efficient marine pro-pellers. Ships Offshore Struct. 2020, 15, 200–214. [Google Scholar] [CrossRef]
- Schnerr, G.H.; Sauer, J. Physical and numerical modeling of unsteady cavitation dynamics. In Proceedings of the International Conference on Multiphase Flow, New Orleans, LA, USA, 27 May–1 June 2001; pp. 1–12. [Google Scholar]
- Chesnakas, C.J.; Donnelly, M.J.; Pfitsch, D.W.; Becnel, A.J.; Schroeder, S.D. Performance evaluation of the ONR axial waterjet 2 (AxWJ-2). Hydromech. Dep. Rep. 2009, 89. Available online: https://apps.dtic.mil/sti/citations/ADA516369 (accessed on 7 April 2025).
- Marquardt, M.W. Summary of Two Independent Performance Measurements of the ONR Axial Waterjet 2 (AxWJ-2). Hydromech. Dep. Rep. 2011, 16. Available online: https://apps.dtic.mil/sti/citations/ADA540499 (accessed on 7 April 2025).
- Menter, F.R. Two-equation eddy-viscosity turbulence models for engineering applications. AIAA J. 1994, 32, 1598–1605. [Google Scholar] [CrossRef]
- Siemens Digital Industries Software, STAR-CCM+, version 2021.2; Siemens: Plano, TX, USA, 2021.
- Brewton, S.; Gowing, S.; Gorski, J. Performance predictions of a waterjet rotor and rotor/stator combination using rans calculations. In Proceedings of the 26th Symposium on Naval Hydrodynamics, Rome, Italy, 17–22 September 2006. [Google Scholar]
- Eça, L.; Hoekstra, M. A procedure for the estimation of the numerical uncertainty of CFD calculations based on grid refinement studies. J. Comput. Phys. 2014, 262, 104–130. [Google Scholar] [CrossRef]
- Esteco. ModeFRONTIER Users’ Manual. 2022. Available online: https://www.esteco.com/ (accessed on 7 April 2025).
- Gaggero, S.; Tani, G.; Villa, D.; Viviani, M.; Ausonio, P.; Travi, P.; Bizzarri, G.; Serra, F. Efficient and multi-objective cavitating propeller optimization: An application to a high-speed craft. Appl. Ocean. Res. 2017, 64, 31–57. [Google Scholar] [CrossRef]


Disclaimer/Publisher’s Note: The statements, opinions and data contained in all publications are solely those of the individual author(s) and contributor(s) and not of MDPI and/or the editor(s). MDPI and/or the editor(s) disclaim responsibility for any injury to people or property resulting from any ideas, methods, instructions or products referred to in the content. |
© 2025 by the authors. Licensee MDPI, Basel, Switzerland. This article is an open access article distributed under the terms and conditions of the Creative Commons Attribution (CC BY) license (https://creativecommons.org/licenses/by/4.0/).