Gross Tonnage-Based Statistical Modeling and Calculation of Shipping Emissions for the Bosphorus Strait


Abstract
1. Introduction
2. Materials and Methods
2.1. Dataset and Characteristics of the Bosphorus
2.2. Emission Estimation Methodology for Ships Transiting the Bosphorus
2.2.1. Outlier Detection
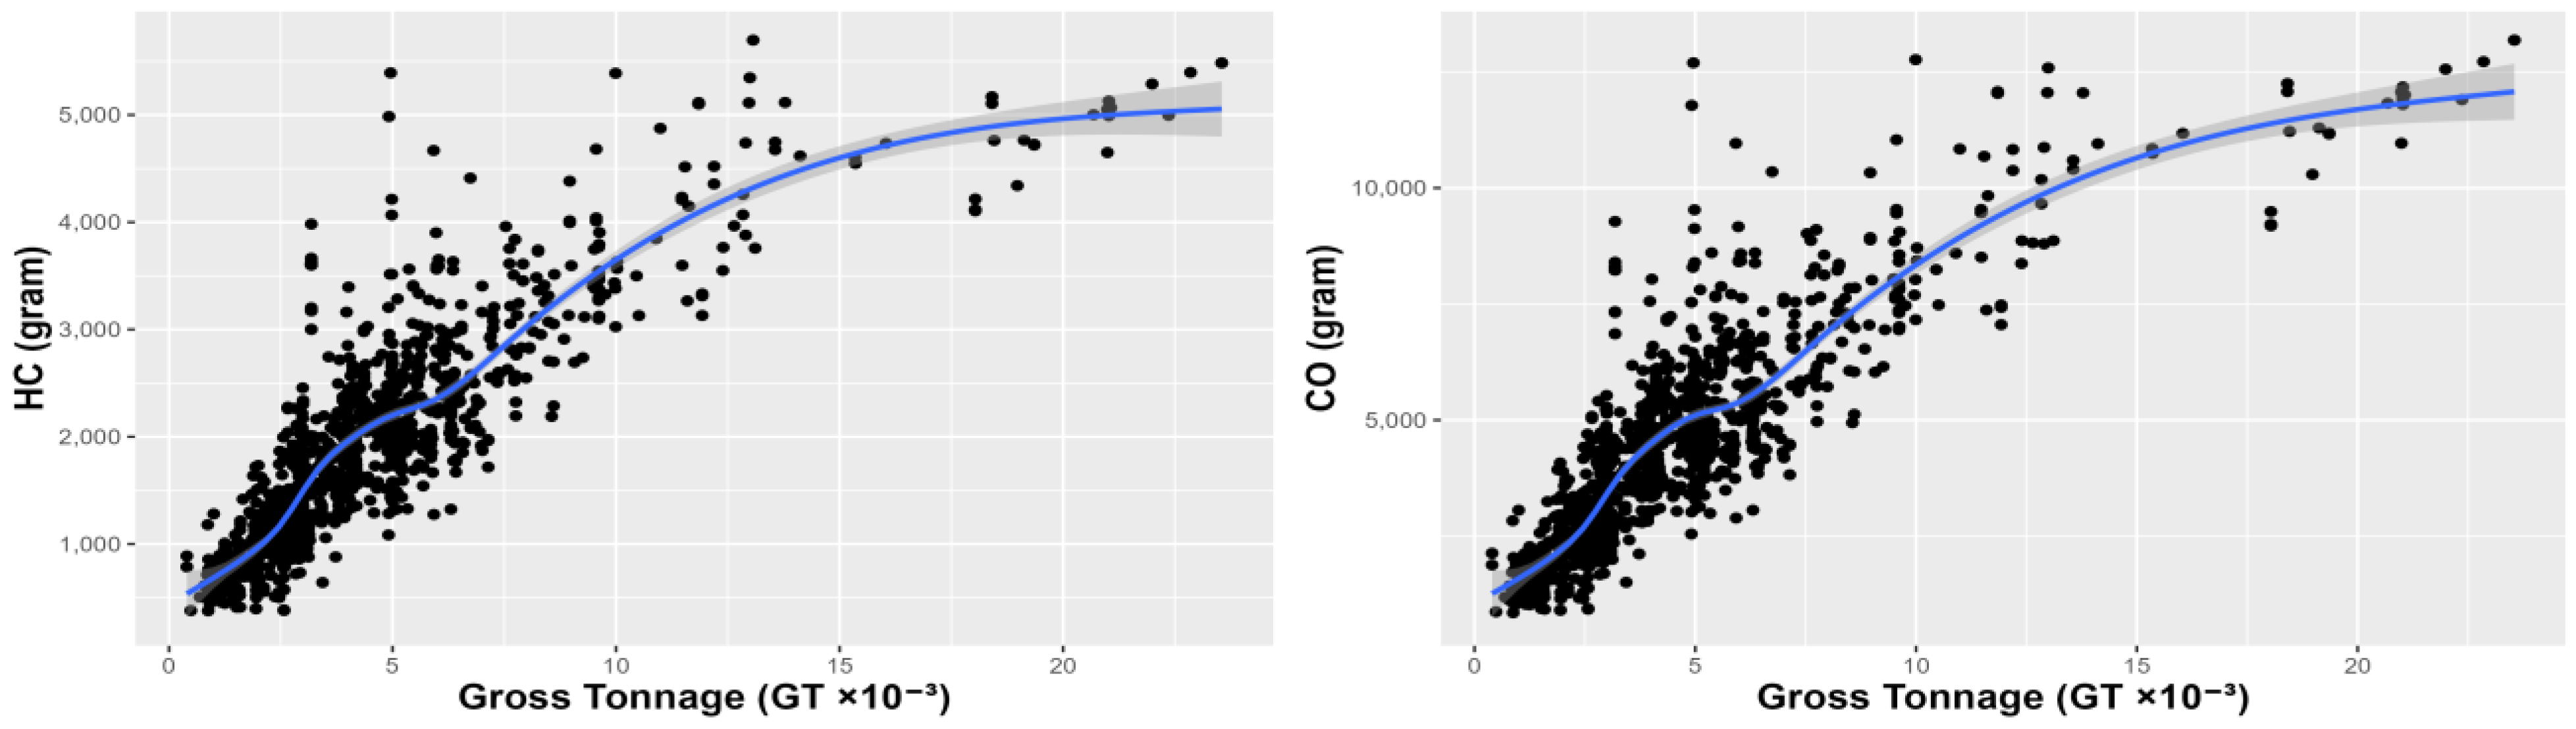
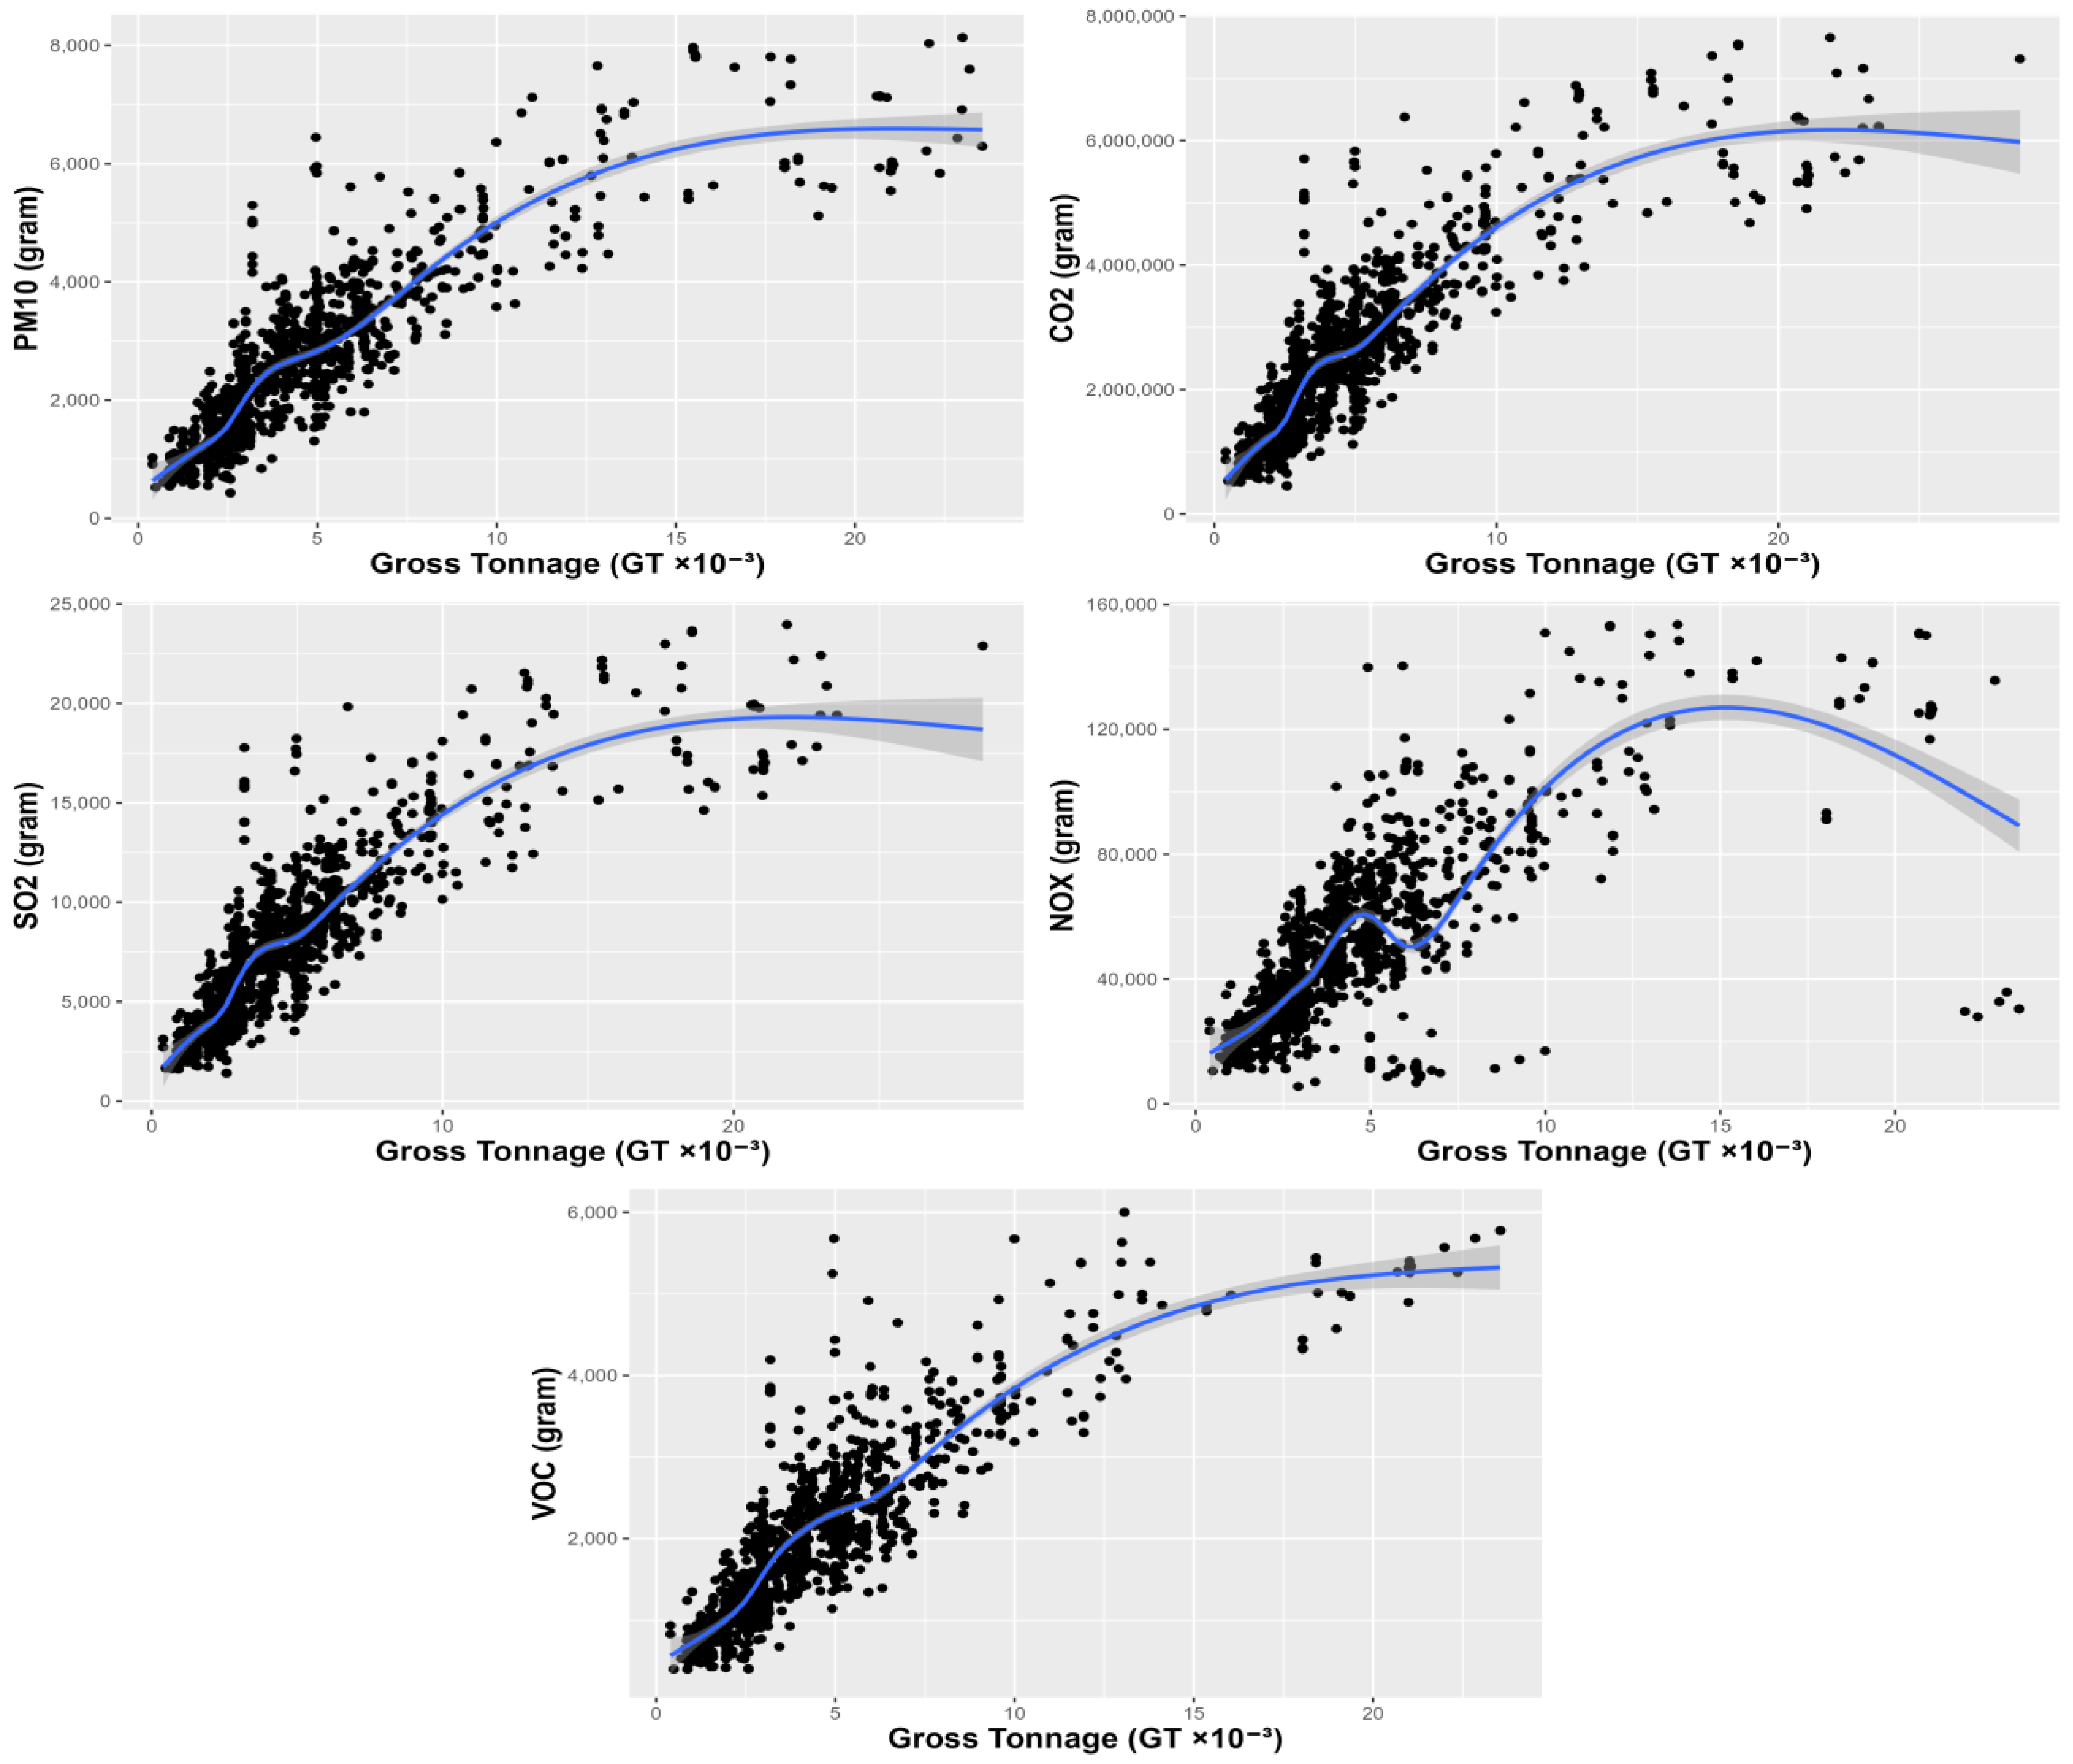
2.2.2. Fitting Linear and Nonlinear Regression Models
2.2.3. Model Comparison
3. Results and Discussion
3.1. Emissions Estimates
3.2. Statistical Modeling Results
3.2.1. Outlier Analysis
3.2.2. Regression Modeling
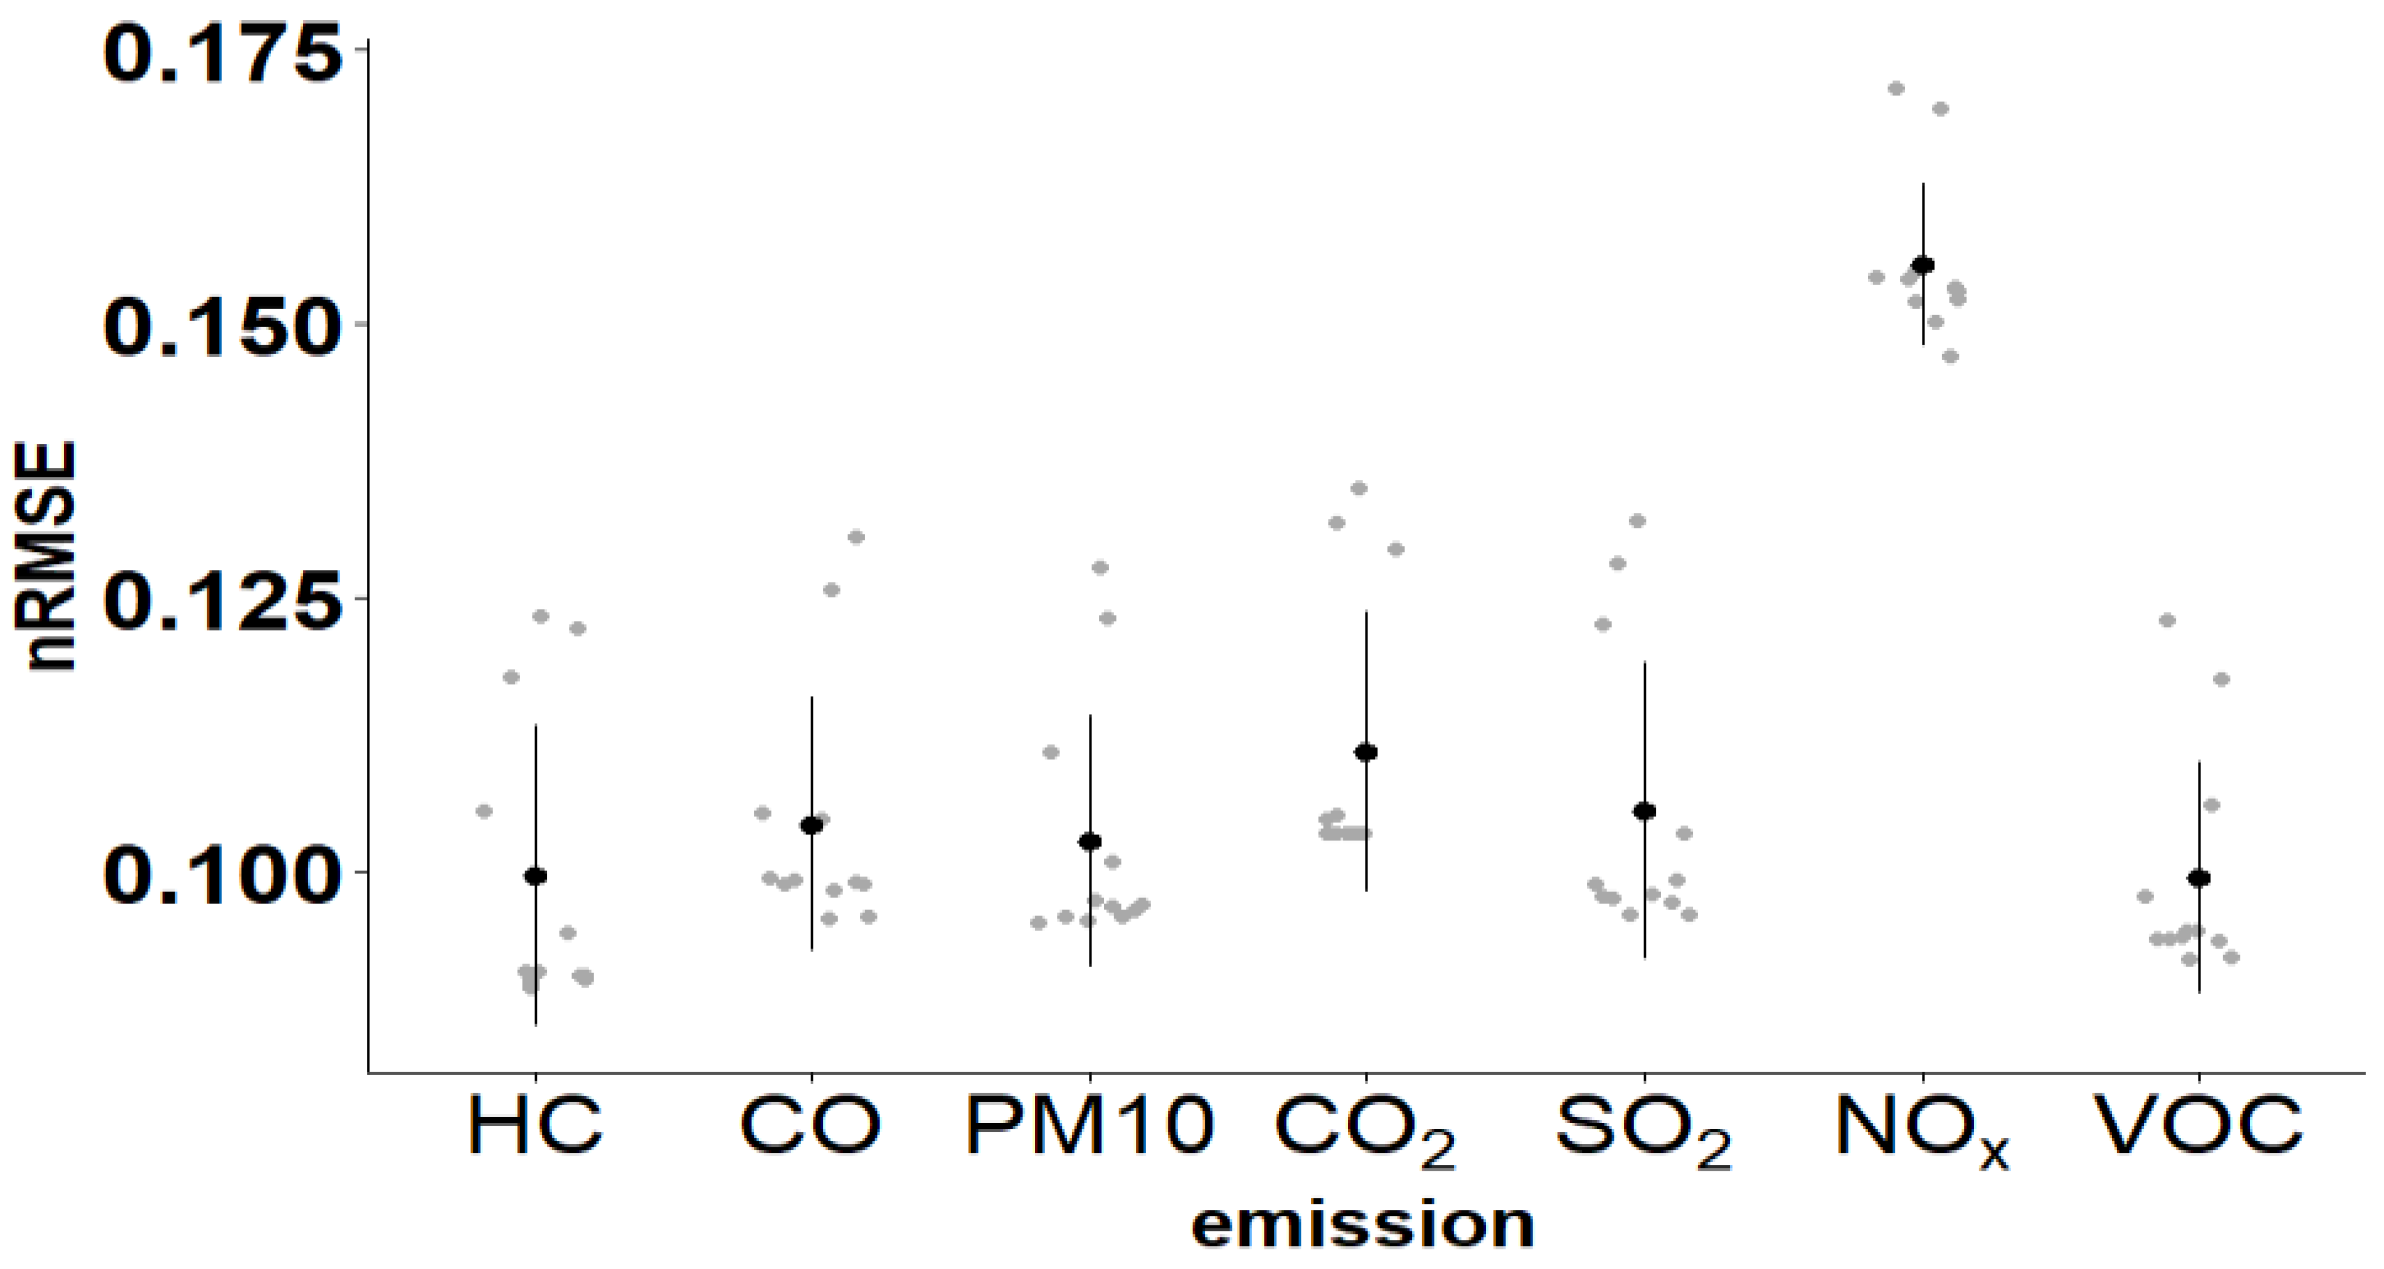
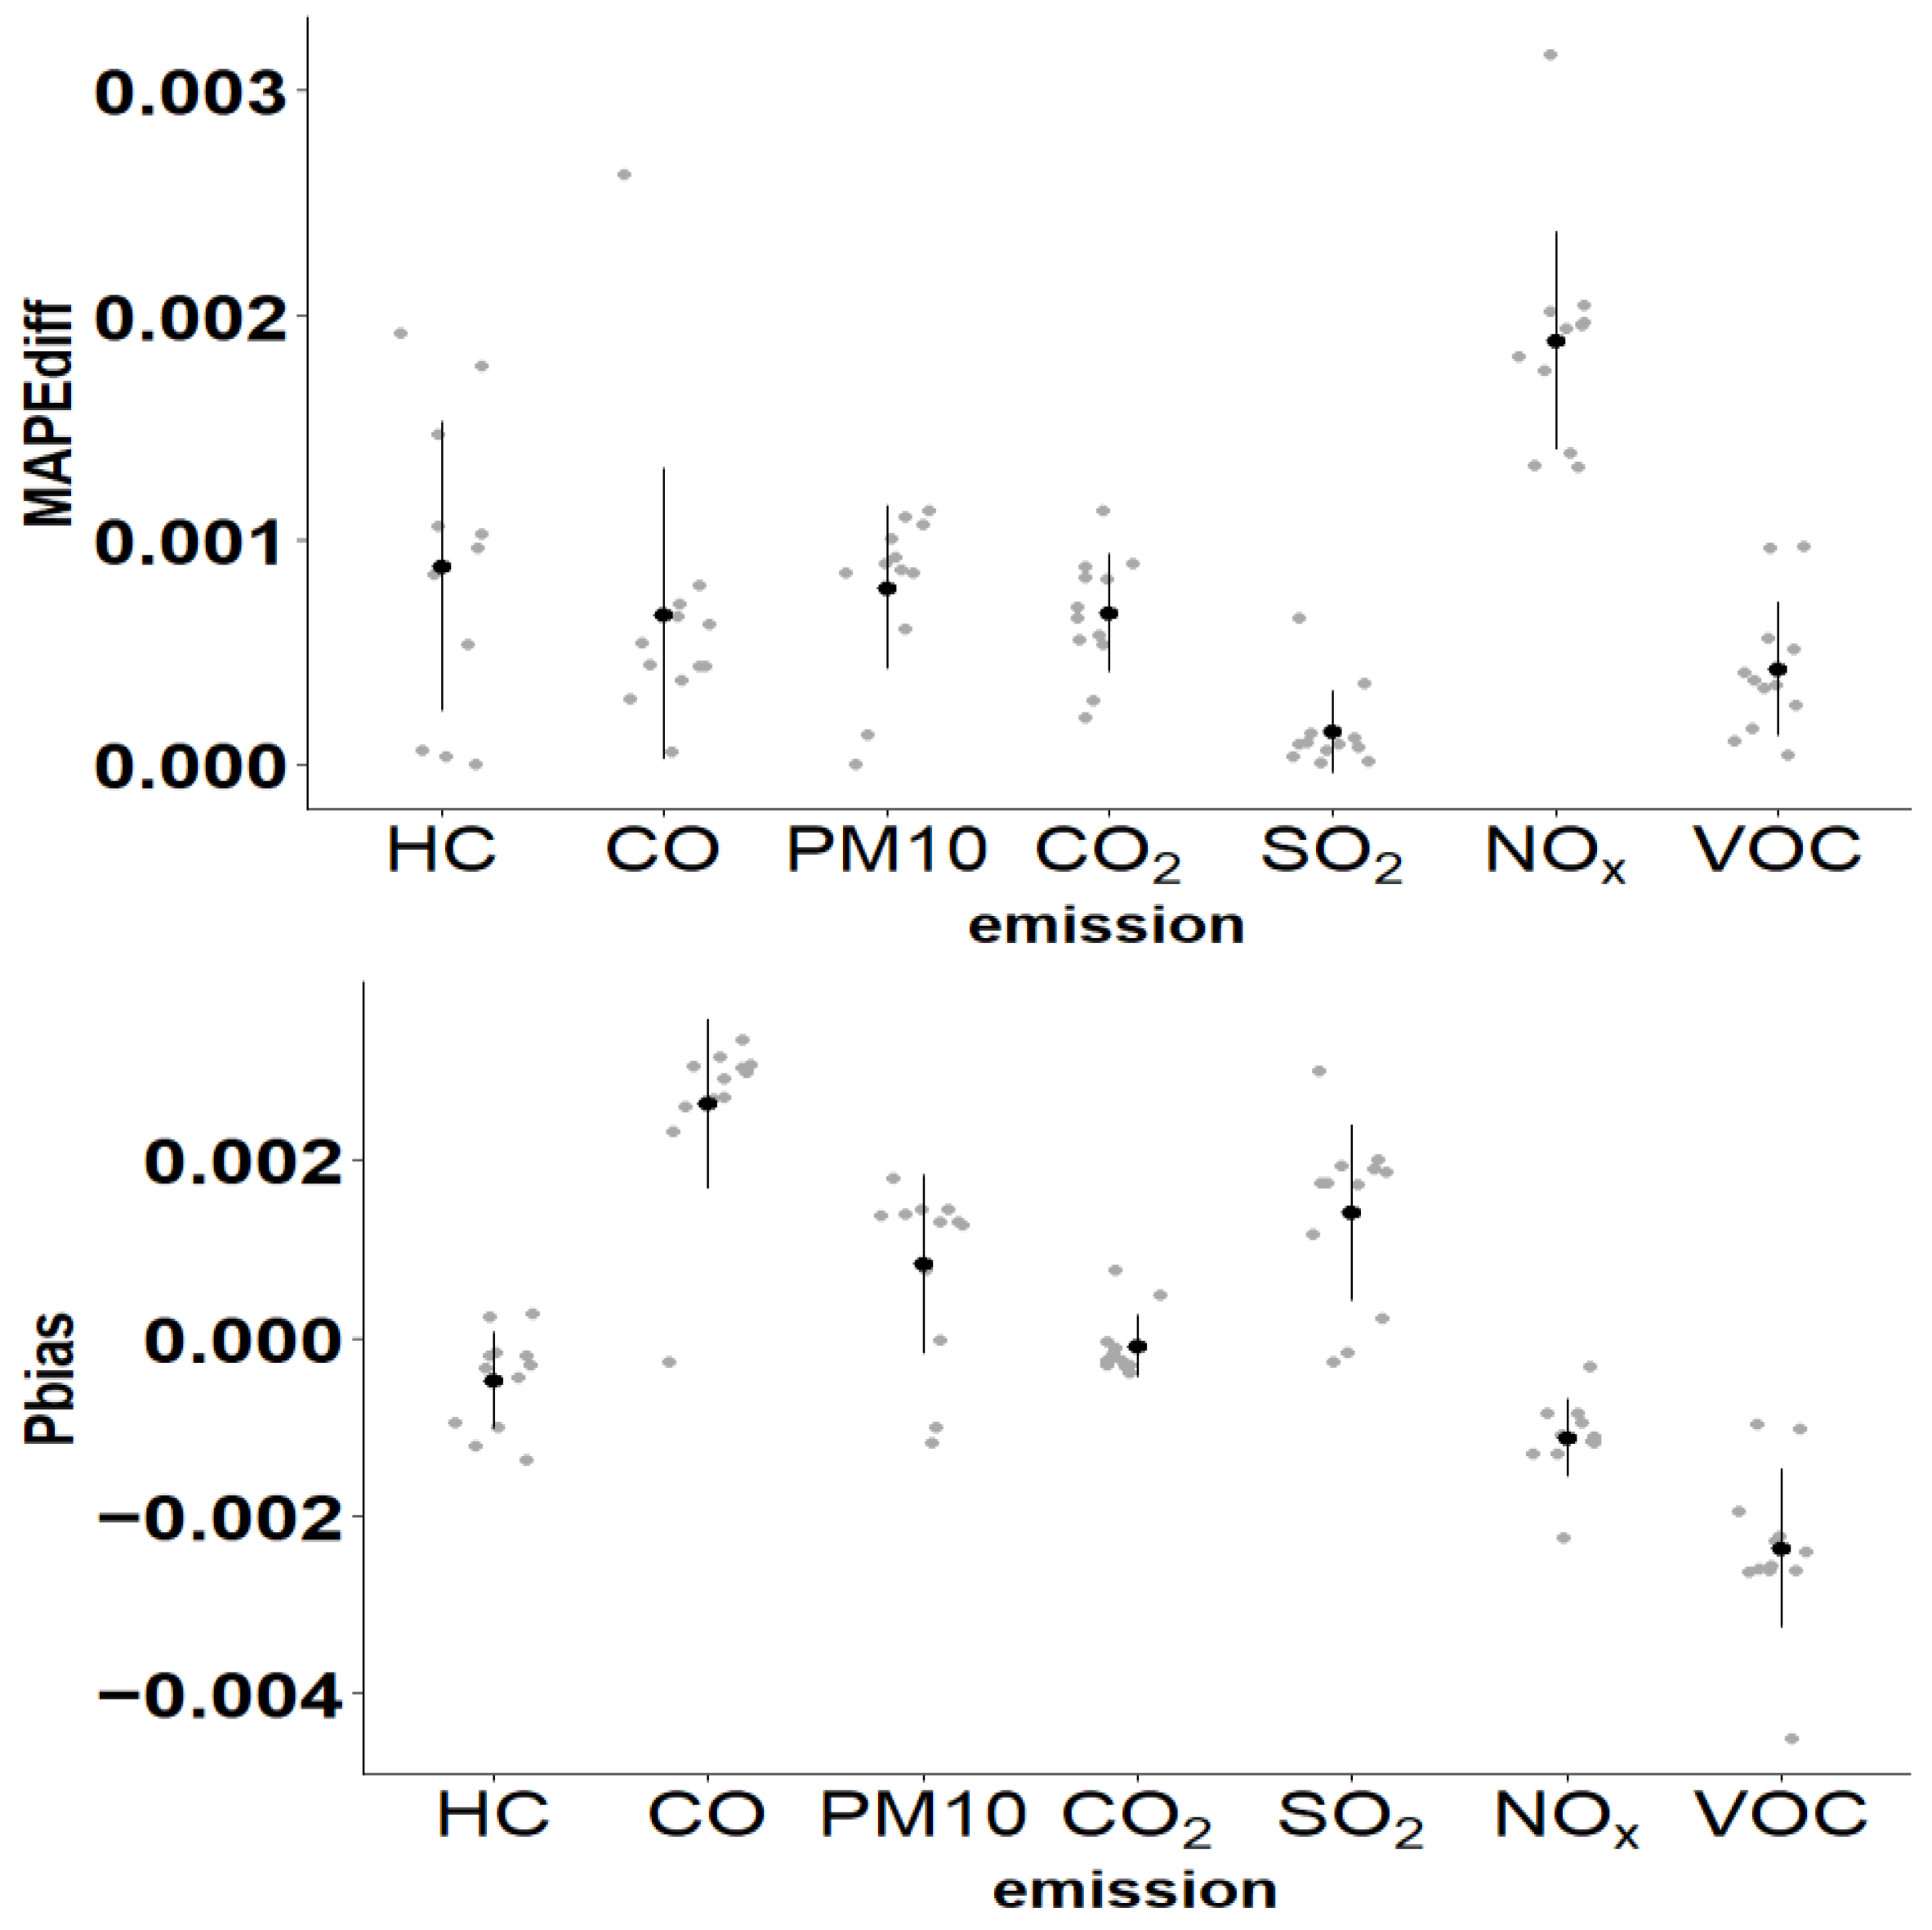
3.2.3. Performance Comparison Metrics
4. Conclusions
Funding
Data Availability Statement
Conflicts of Interest
Nomenclature
| AIS | Automatic identification system | IMO | International maritime organization |
| aomiscs | R package for statistical methods for the agricultural sciences | LOESS | Locally weighted smoothing |
| BSFC | Brake specific fuel consumption | MAPE | Mean absolute percentage error |
| Caret | R package for classification and regression Training | MDO | Marine diesel oil |
| CH4 | Methane | Metrics | R package for evaluation metrics for machine learning |
| CO | Carbon monoxide | MSD | Medium-speed diesel |
| CO2 | Carbon dioxide | N2O | Nitrous oxide |
| DECA | Domestic emission control area | nlme | R package for nonlinear mixed-effects |
| drc | R package for dose–response curves | NMVOC | Non-methane VOC |
| ECA | Emission control area | NOx | Nitrogen oxides |
| ENTEC | Environmental engineering consultancy | NRMSE | Normalized root mean squared error |
| EnvStats | R package for environmental statistics | PBIAS | Percent bias |
| EPA | Environmental protection agency | PM10 | Particulate matter with an aerodynamic diameter of less than 10 μm |
| ESD | Extreme studentized deviate | R2 | Coefficient of determination |
| ggplot2 | R package for data visualization (the grammar of graphics) | SO2 | Sulfur dioxide |
| GT | Gross tonnage | SOX | Sulfur oxides |
| HC | Hydrocarbon | SSD | Slow-speed diesel |
| HFO | Residual fuel (heavy fuel oil) | VOC | Volatile organic compounds |
| HSD | High-speed diesel | ML/AI | Machine Learning/Artificial Intelligence |
References
- Shi, W.; Xiao, Y.; Chen, Z.; McLaughlin, H.; Li, K.X. Evolution of green shipping research: Themes and methods. Marit. Policy Manag. 2018, 45, 863–876. [Google Scholar]
- Zincir, B. Slow steaming application for short-sea shipping to comply with the CII regulation. Brodogradnja 2023, 74, 21–38. [Google Scholar]
- Wan, Z.; Zhu, M.; Chen, S.; Sperling, D. Pollution: Three steps to a green shipping industry. Nature 2016, 530, 275–277. [Google Scholar]
- Eyring, V.; Isaksen, I.S.; Berntsen, T.; Collins, W.J.; Corbett, J.J.; Endresen, O.; Grainger, R.G.; Moldanova, J.; Schlager, H.; Stevenson, D.S. Transport impacts on atmosphere and climate: Shipping. Atmos. Environ. 2010, 44, 4735–4771. [Google Scholar]
- Xu, X.; Yang, H.; Li, C. Theoretical model and actual characteristics of air pollution affecting health cost: A review. Int. J. Environ. Res. Public Health 2022, 19, 3532. [Google Scholar] [CrossRef]
- Kalajdžić, M.; Vasilev, M.; Momčilović, N. Power reduction considerations for bulk carriers with respect to novel energy efficiency regulations. Brodogradnja 2022, 73, 79–92. [Google Scholar]
- Kalajdžić, M.; Vasilev, M.; Momčilović, N. Inland waterway cargo vessel energy efficiency in operation. Brodogradnja 2023, 74, 71–89. [Google Scholar] [CrossRef]
- Birpınar, M.E.; Talu, G.F.; Gönençgil, B. Environmental effects of maritime traffic on the Bosphorus. Environ. Monit. Assess. 2009, 152, 13–23. [Google Scholar]
- Chen, D.; Zhao, N.; Lang, J.; Zhou, Y.; Wang, X.; Li, Y.; Zhao, Y.; Guo, X. Contribution of ship emissions to the concentration of PM2. 5: A comprehensive study using AIS data and WRF/Chem model in Bohai Rim Region, China. Sci. Total Environ. 2018, 610–611, 1476–1486. [Google Scholar]
- Fabregat, A.; Vázquez, L.; Vernet, A. Using Machine Learning to estimate the impact of ports and cruise ship traffic on urban air quality: The case of Barcelona. Environ. Model. Softw. 2021, 139, 104995. [Google Scholar]
- Ekmekçioğlu, A.; Ünlügençoğlu, K.; Çelebi, U.B. Estimation of shipping emissions based on real-time data with different methods: A case study of an oceangoing container ship. Environ. Dev. Sustain. 2022, 24, 4451–4470. [Google Scholar]
- Nunes, R.A.; Alvim-Ferraz, M.C.; Martins, F.G.; Penuelas, A.L.; Durán-Grados, V.; Moreno-Gutiérrez, J.; Jalkanen, J.P.; Sousa, S.I. Estimating the health and economic burden of shipping related air pollution in the Iberian Peninsula. Environ. Int. 2021, 156, 106763. [Google Scholar] [PubMed]
- Viana, M.; Rizza, V.; Tobías, A.; Carr, E.; Corbett, J.; Sofiev, M.; Karanasiou, A.; Buonanno, G.; Fann, N. Estimated health impacts from maritime transport in the Mediterranean region and benefits from the use of cleaner fuels. Environ. Int. 2020, 138, 105670. [Google Scholar] [CrossRef] [PubMed]
- Gössling, S.; Meyer-Habighorst, C.; Humpe, A. A global review of marine air pollution policies, their scope and effectiveness. Ocean Coast. Manag. 2021, 212, 105824. [Google Scholar]
- Tuswan, T.; Sari, D.P.; Muttaqie, T.; Prabowo, A.R.; Soetardjo, M.; Murwantono, T.T.P.; Ridwan, U.; Yuniati, Y. Representative application of LNG-fuelled ships: A critical overview on potential GHG emission reductions and economic benefits. Brodogradnja 2023, 74, 63–83. [Google Scholar] [CrossRef]
- Ekmekçioğlu, A.; Kuzu, S.L.; Ünlügençoğlu, K.; Çelebi, U.B. Assessment of shipping emission factors through monitoring and modelling studies. Sci. Total Environ. 2020, 743, 140742. [Google Scholar]
- Yang, L.; Zhang, Q.; Lv, Z.; Zhang, Y.; Yang, Z.; Fu, F.; Wu, L.; Mao, H. Efficiency of DECA on ship emission and urban air quality: A case study of China port. J. Clean. Prod. 2022, 362, 132556. [Google Scholar] [CrossRef]
- Toscano, D.; Murena, F.; Quaranta, F.; Mocerino, L. Assessment of the impact of ship emissions on air quality based on a complete annual emission inventory using AIS data for the port of Naples. Ocean Eng. 2021, 232, 109166. [Google Scholar] [CrossRef]
- Kuzu, S.L.; Bilgili, L.; Kiliç, A. Estimation and dispersion analysis of shipping emissions in Bandirma Port, Turkey. Environ. Dev. Sustain. 2021, 23, 10288–10308. [Google Scholar]
- Kanberoğlu, B.; Kökkülünk, G. Assessment of CO2 emissions for a bulk carrier fleet. J. Clean. Prod. 2021, 283, 124590. [Google Scholar] [CrossRef]
- Kılıç, A.; Yolcu, M.; Kılıç, F.; Bilgili, L. Assessment of ship emissions through cold ironing method for Iskenderun Port of Turkey. Environ. Res. Technol. 2020, 3, 193–201. [Google Scholar]
- Endresen, Ø.; Sørgård, E.; Behrens, H.L.; Brett, P.O.; Isaksen, I.S. A historical reconstruction of ships’ fuel consumption and emissions. J. Geophys. Res. Atmos. 2007, 112, 1–17. [Google Scholar]
- Bilgili, L.; Celebi, U.B. Developing a new green ship approach for flue gas emission estimation of bulk carriers. Measurement 2018, 120, 121–127. [Google Scholar]
- Ekmekçioğlu, A.; Ünlügençoğlu, K.; Çelebi, U.B. Container ship emission estimation model for the concept of green port in Turkey. Proc. Inst. Mech. Eng. Part M J. Eng. Marit. Environ. 2022, 236, 504–518. [Google Scholar]
- Chen, D.; Wang, X.; Li, Y.; Lang, J.; Zhou, Y.; Guo, X.; Zhao, Y. High-spatiotemporal-resolution ship emission inventory of China based on AIS data in 2014. Sci. Total Environ. 2017, 609, 776–787. [Google Scholar]
- Peng, X.; Wen, Y.; Wu, L.; Xiao, C.; Zhou, C.; Han, D. A sampling method for calculating regional ship emission inventories. Transp. Res. Part D Transp. Environ. 2020, 89, 102617. [Google Scholar]
- Gunes, U. Estimating bulk carriers’ main engine power and emissions. Brodogradnja 2023, 74, 85–98. [Google Scholar]
- Ozsari, I. Predicting main engine power and emissions for container, cargo, and tanker ships with artificial neural network analysis. Brodogradnja 2023, 74, 77–94. [Google Scholar]
- Trozzi, C. Emission Estimate Methodology for Maritime Navigation; EPA: Rome, Italy, 2010. [Google Scholar]
- Álvarez, P.S. From maritime salvage to IMO 2020 strategy: Two actions to protect the environment. Mar. Pollut. Bull. 2021, 170, 112590. [Google Scholar]
- Hastie, T.; Tibshirani, R.; Friedman, J. The Elements of Statistical Learning: Data Mining, Inference, and Prediction, 2nd ed.; Springer: Berlin/Heidelberg, Germany, 2009. [Google Scholar]
- R: A Language and Environment for Statistical Computing. R Foundation for Statistical Computing, 2021. The R Project. Available online: https://www.R-project.org/ (accessed on 1 June 2023).
- Ay, C.; Seyhan, A.; Beşikçi, E.B. Quantifying ship-borne emissions in Bosphorus with bottom-up and machine-learning approaches. Ocean Eng. 2022, 258, 111864. [Google Scholar]
- Methodologies for Estimating Port-Related and Goods Movement Mobile Source Emission Inventories, 2020. EPA—Office of Transportation Air Quality. Available online: https://nepis.epa.gov/Exe/ZyPURL.cgi?Dockey=P100YFY8.TXT (accessed on 1 June 2023).
- Rosner, B. Percentage points for a generalized ESD many-outlier procedure. Technometrics 1983, 25, 165–172. [Google Scholar]
- Cudeck, R.; Toit, S.H.D. A version of quadratic regression with interpretable parameters. Multivar. Behav. Res. 2002, 37, 501–519. [Google Scholar]
- Ratkowsky, D.A. Principles of nonlinear regression modeling. J. Ind. Microbiol. 1993, 12, 195–199. [Google Scholar]
- Crawley, M.J. The R book; John Wiley & Sons: Hoboken, NJ, USA, 2012. [Google Scholar]
- Freund, R.J.; Wilson, W.J.; Sa, P. Regression Analysis; Elsevier: Amsterdam, The Netherlands, 2006. [Google Scholar]
- Fox, J.; Weisberg, S. Nonlinear Regression, Nonlinear Least Squares, and Nonlinear Mixed Models in R. Population; McMaster: Hamilton, ON, Canada, 2019. [Google Scholar]
- Huang, H.-H.; He, Q. Nonlinear Regression Analysis; Elsevier: Amsterdam, The Netherlands, 2023. [Google Scholar]
- Marquardt, D.W. An algorithm for least-squares estimation of nonlinear parameters. J. Soc. Ind. Appl. Math. 1963, 11, 431–441. [Google Scholar]
- Baty, F.; Ritz, C.; Charles, S.; Brutsche, M.; Flandrois, J.P.; Delignette-Muller, M.L. A toolbox for nonlinear regression in R: The package nlstools. J. Stat. Softw. 2015, 66, 1–21. [Google Scholar]
- Archontoulis, S.V.; Miguez, F.E. Nonlinear regression models and applications in agricultural research. Agron. J. 2015, 107, 786–798. [Google Scholar]

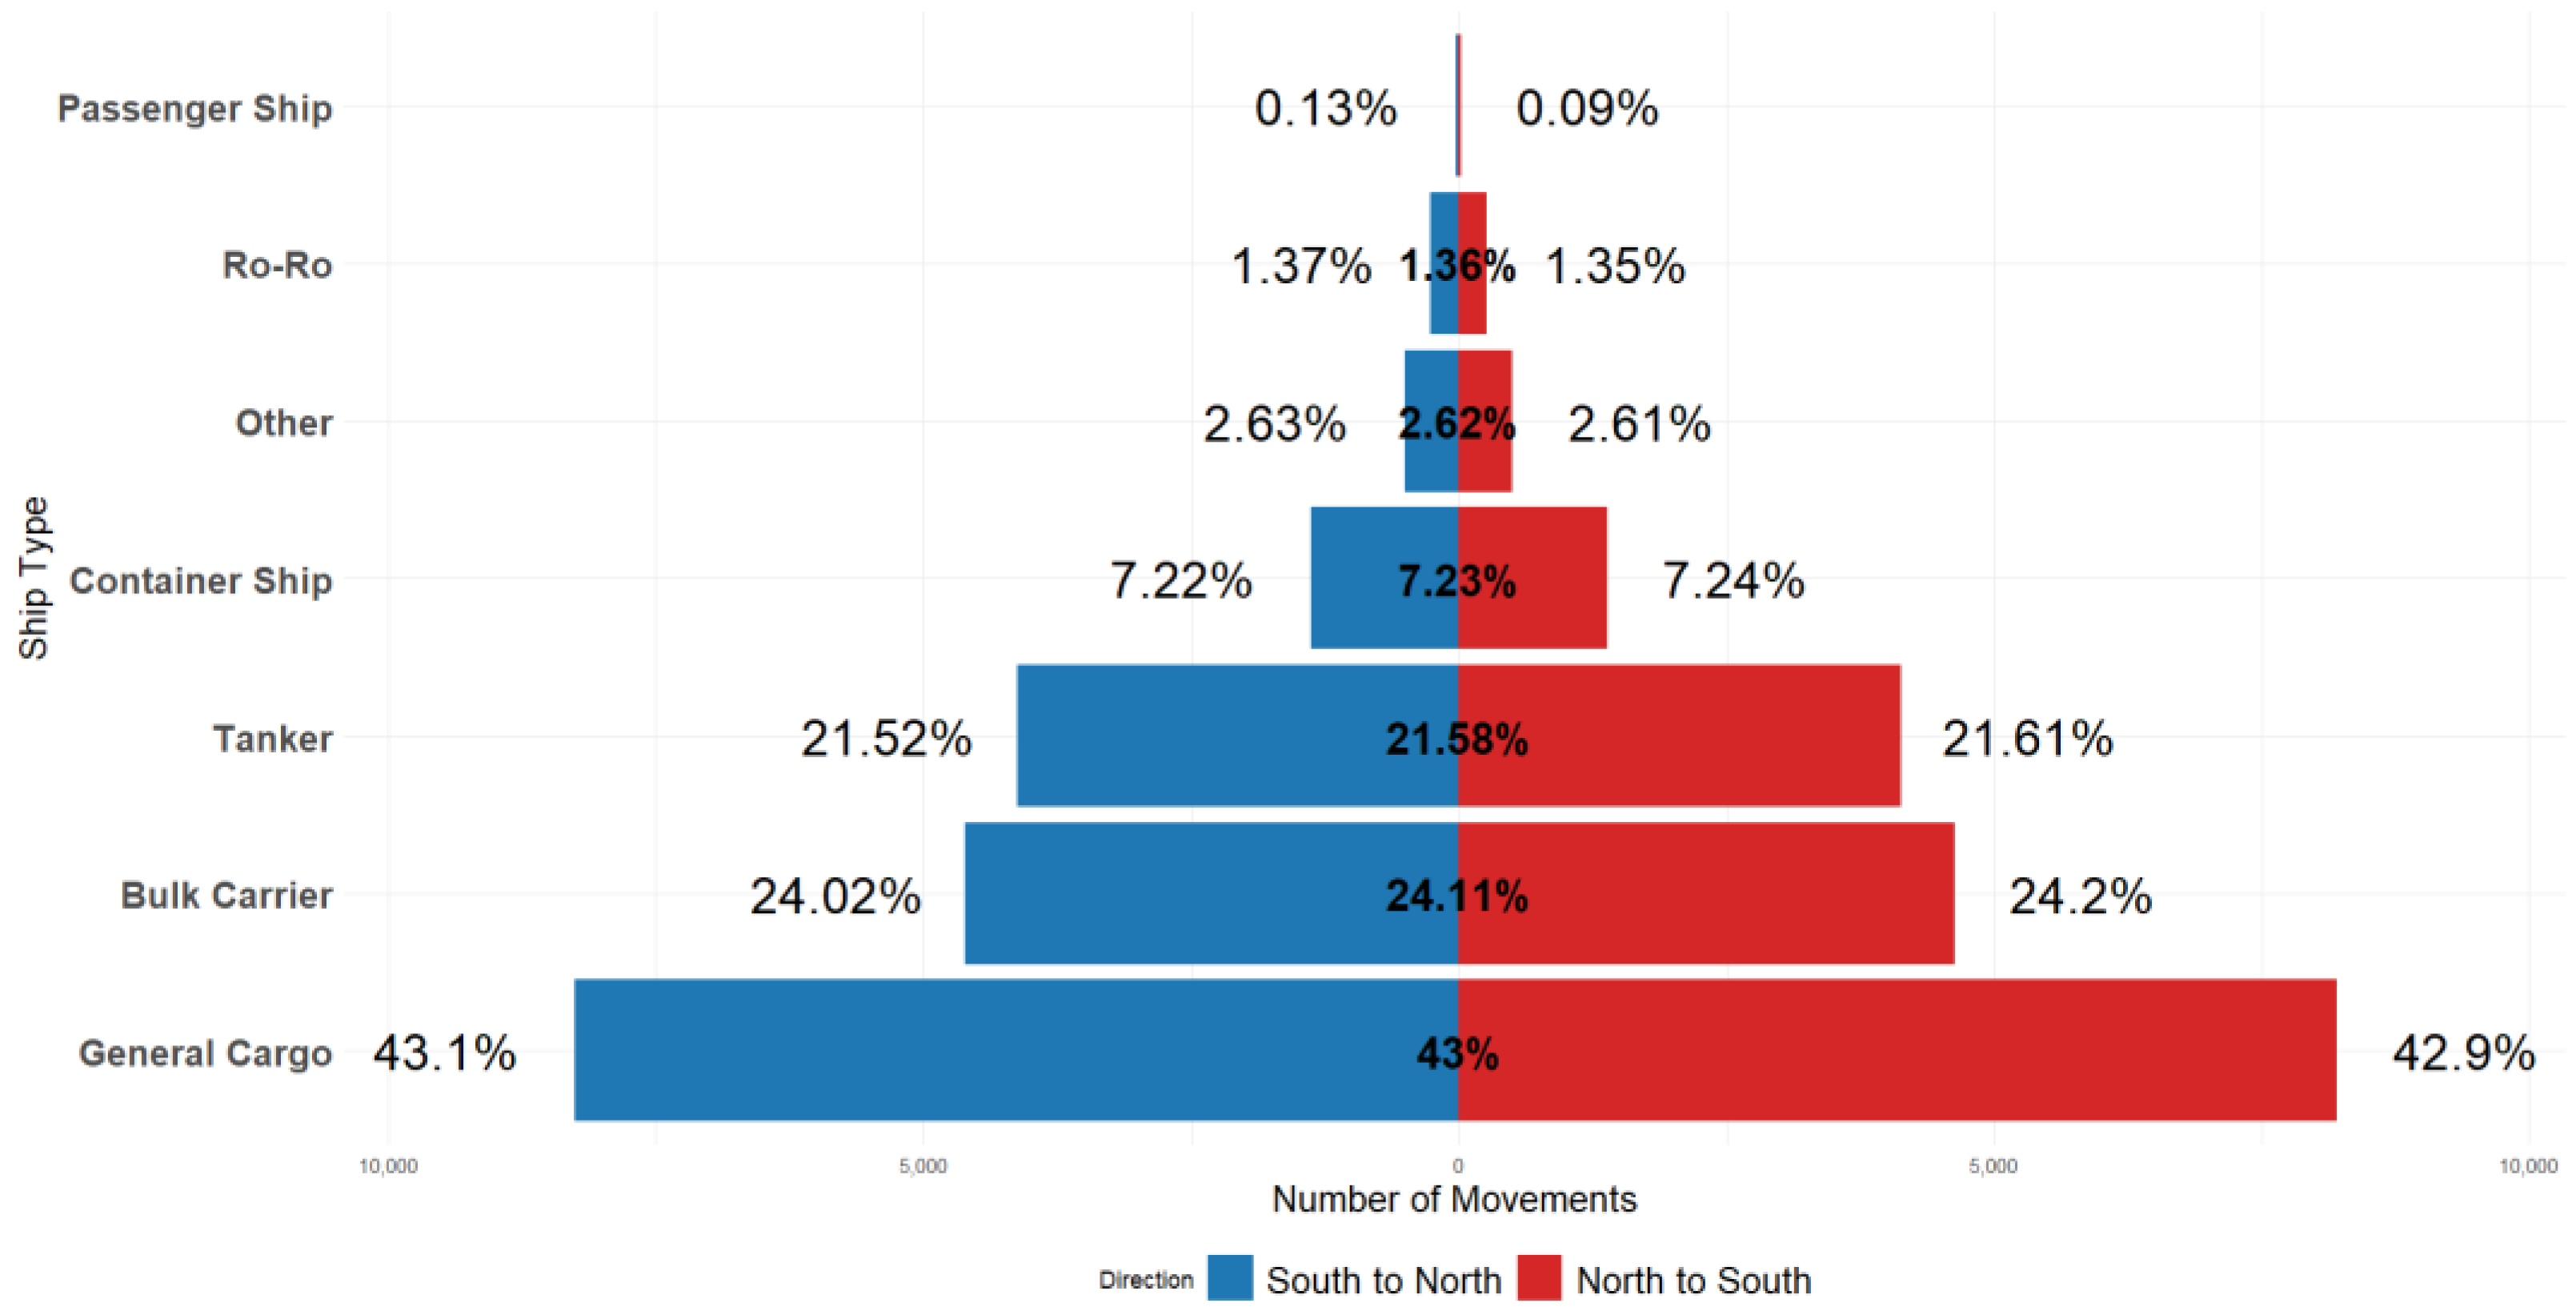
| Ship Type | S-N | N-S | Total |
|---|---|---|---|
| Bulk Carrier | 4629 | 4606 | 9235 |
| Container Ship | 1385 | 1384 | 2769 |
| General Cargo | 8208 | 8264 | 16,472 |
| Passenger Ship | 18 | 24 | 42 |
| Ro-Ro | 259 | 263 | 522 |
| Tanker | 4134 | 4126 | 8260 |
| Other | 499 | 505 | 1004 |
| Total | 19,132 | 19,172 | 38,304 |
| Engine Group | Engine Type | HC Emissions (g/kWh) | CO Emissions (g/kWh) |
|---|---|---|---|
| Propulsion | SSD | 0.6 | 1.4 |
| MSD | 0.5 | 1.1 | |
| Auxiliary | MSD | 0.4 | 1.1 |
| HSD | 0.4 | 0.9 |
| Engine Group | Fuel Type | Engine Type | BSFC (g/kWh) |
|---|---|---|---|
| Propulsion | MDO | SSD | 185 |
| MSD | 205 | ||
| HFO | SSD | 195 | |
| MSD | 215 | ||
| Auxiliary | MDO | MSD | 217 |
| HSD | 217 | ||
| HFO | MSD | 227 | |
| HSD | 227 |
| Engine Group | Fuel Type | NOx Tier | Engine Type | EF (g/kWh) |
|---|---|---|---|---|
| Propulsion | MDO | <1999 | SSD | 17 |
| MSD | 13.2 | |||
| Tier I | SSD | 16 | ||
| MSD | 12.2 | |||
| Tier II | SSD | 14.4 | ||
| MSD | 10.5 | |||
| Tier III | SSD | 3.4 | ||
| MSD | 2.6 | |||
| HFO | <1999 | SSD | 18.1 | |
| MSD | 14 | |||
| Tier I | SSD | 17 | ||
| MSD | 13 | |||
| Tier II | SSD | 15.3 | ||
| MSD | 11.2 | |||
| Tier III | SSD | 3.4 | ||
| MSD | 2.6 | |||
| Auxiliary | MDO | <1999 | MSD | 10.9 |
| HSD | 13.8 | |||
| Tier I | MSD | 9.8 | ||
| HSD | 12.2 | |||
| Tier II | MSD | 7.7 | ||
| HSD | 10.5 | |||
| Tier III | MSD | 2 | ||
| HSD | 2.6 | |||
| HFO | <1999 | MSD | 14.7 | |
| HSD | 11.6 | |||
| Tier I | MSD | 13 | ||
| HSD | 10.4 | |||
| Tier II | MSD | 11.2 | ||
| HSD | 8.2 | |||
| Tier III | MSD | 2 | ||
| HSD | 2.6 |
| Regression Model | Mathematical Function | Parameter Descriptions |
|---|---|---|
| Linear Regression | = intercept; = slope | |
| Quadratic Regression | = intercept; = linear term; = quadratic term | |
| Cubic Regression | = intercept; = linear term; = quadratic term; = cubic term | |
| Exponential Regression | = scaling parameter; = growth rate | |
| Logarithmic Regression | = intercept; = growth rate | |
| Rectangular Hyperbola Regression | = upper asymptote; = affinity parameter | |
| Three-parameter Logistic Regression | = upper asymptote; = inflection point; = growth rate | |
| Four-parameter Logistic Regression | = upper asymptote; = inflection point; = growth rate; = lower asymptote | |
| Gompertz Regression | = asymptote; = zero-response parameter; = growth rate | |
| Weibull Regression | = lower asymptote; = scaling parameter; = logarithmic rate parameter; = shape parameter | |
| Cubic Spline Regression | where | = intercept; = spline coefficient (knot coefficient); = spline basis function; = knot points |
| Natural Spline Regression | where | = intercept; = spline coefficient (knot coefficient); = spline basis function; = knot points |
| Ship Type | HC | CO | PM10 | CO2 | SO2 | NOx | VOC | TOTAL |
|---|---|---|---|---|---|---|---|---|
| Bulk Carrier (%) | 54.29 (33.71%) | 127.86 (33.89%) | 65.06 (33.14%) | 57,792.75 (32.20%) | 180.9 (32.22%) | 1308.05 (32.63%) | 57.17 (33.71%) | 59,586.08 (32.22%) |
| Container Ship (%) | 25.86 (16.06%) | 60.81 (16.12%) | 31.25 (15.92%) | 28,080.48 (15.65%) | 87.88 (15.65%) | 706.28 (17.62%) | 27.23 (16.06%) | 29,019.79 (15.69%) |
| General Cargo (%) | 28.5 (17.70%) | 65.83 (17.45%) | 37.3 (19.00%) | 35,299.39 (19.67%) | 110.38 (19.66%) | 762.11 (19.01%) | 30.01 (17.70%) | 36,333.52 (19.64%) |
| Other (%) | 2.17 (1.35%) | 5 (1.33%) | 1.34 (0.68%) | 2778.22 (1.55%) | 8.47 (1.51%) | 49.91 (1.24%) | 2.29 (1.35%) | 2847.4 (1.54%) |
| Passenger Ship (%) | 0.14 (0.09%) | 0.31 (0.08%) | 0.19 (0.10%) | 181.42 (0.10%) | 0.57 (0.10%) | 3.63 (0.09%) | 0.14 (0.08%) | 186.4 (0.10%) |
| Ro-Ro (%) | 2.5 (1.55%) | 5.79 (1.53%) | 3.24 (1.65%) | 3125.06 (1.74%) | 9.76 (1.74%) | 69.48 (1.73%) | 2.63 (1.55%) | 3218.46 (1.74%) |
| Tanker (%) | 47.58 (29.55%) | 111.72 (29.61%) | 57.92 (29.51%) | 52,227.91 (29.10%) | 163.43 (29.11%) | 1109.42 (27.67%) | 50.1 (29.55%) | 53,768.08 (29.07%) |
| Total | 161.04 | 377.32 | 196.3 | 179,485.23 | 561.39 | 4008.88 | 169.57 | 184,959.7 |
| Ship Type | Number of Multiple Transits | Average of Total Main Engine (KW) | Average of Total Auxiliary Engine (KW) | Average GT |
|---|---|---|---|---|
| Bulk Carrier | 9235 | 7731.05 | 610.36 | 29,155.43 |
| Container Ship | 2769 | 18,286.91 | 1383.12 | 23,298.96 |
| General Cargo | 16,472 | 2068.85 | 246.20 | 4057.81 |
| Other | 1004 | 2773.56 | 417.86 | 3133.79 |
| Passenger Ship | 42 | 5881.62 | 393.74 | 7545.71 |
| Ro-Ro | 522 | 8566.14 | 1149.34 | 21,310.17 |
| Tanker | 8260 | 7583.78 | 708.39 | 26,197.48 |
| Ship Type | Number of Unrepeated Passes | Average Age (Years) |
|---|---|---|
| Bulk Carrier | 2428 | 11.03 |
| Container Ship | 229 | 18.23 |
| General Cargo | 1697 | 24.72 |
| Other | 195 | 24.01 |
| Passenger Ship | 14 | 35.21 |
| Ro-Ro | 53 | 26.53 |
| Tanker | 1455 | 11.52 |
| Emission | Before Outlier Removal | After Outlier Removal |
|---|---|---|
| HC A | ||
| Overall | n = 1697 | n = 1660 |
| Mean (SD) | 1940 (1210) | 1830 (946) |
| Median [Min, Max] | 1670 [378, 13,800] | 1630 [378, 5700] |
| CO B | ||
| Overall | n = 1697 | n = 1659 |
| Mean (SD) | 4480 (2850) | 4210 (2190) |
| Median [Min, Max] | 3780 [849, 32,900] | 3720 [849, 13,200] |
| PM10 C | ||
| Overall | n = 1697 | n = 1687 |
| Mean (SD) | 2560 (1500) | 2510 (1370) |
| Median [Min, Max] | 2250 [427, 16,200] | 2250 [427, 8130] |
| CO2 D | ||
| Overall | n = 1697 | n = 1691 |
| Mean (SD) | 2,420,000 (1,380,000) | 2,390,000 (1,290,000) |
| Median [Min, Max] | 2150,000 [450,000, 15,100,000] | 2,140,000 [450,000, 7,660,000] |
| SO2 E | ||
| Overall | n = 1697 | n = 1691 |
| Mean (SD) | 7560 (4300) | 7470 (4040) |
| Median [Min, Max] | 6750 [1400, 47,100] | 6690 [1400, 24,000] |
| NOx F | ||
| Overall | n = 1697 | n = 1667 |
| Mean (SD) | 50,200 (33,500) | 47,500 (26,600) |
| Median [Min, Max] | 41,400 [5590, 413,000] | 40,800 [5590, 154,000] |
| VOC G | ||
| Overall | n = 1697 | n = 1660 |
| Mean (SD) | 2050 (1280) | 1930 (996) |
| Median [Min, Max] | 1760 [398, 14,600] | 1720 [398, 6000] |
| HC | CO | PM10 | |||||||
|---|---|---|---|---|---|---|---|---|---|
| Regression Models | NRMSE | MAPEdiff | PBIAS | NRMSE | MAPEdiff | PBIAS | NRMSE | MAPEdiff | PBIAS |
| Linear | 0.1178 | 0.0001 | 0.0012 | 0.1258 | 0.0007 | 0.0027 | 0.1231 | 0.0009 | 0.0010 |
| Quadratic | 0.0945 | 0.0005 | 0.0004 | 0.1048 | 0.0001 | 0.0027 | 0.1010 | 0.0006 | 0.0000 |
| Cubic | 0.0910 | 0.0008 | 0.0003 | 0.0994 | 0.0003 | 0.0023 | 0.0973 | 0.0010 | 0.0008 |
| Exponential | 0.1223 | 0.0000 | 0.0014 | 0.1306 | 0.0008 | 0.0033 | 0.1277 | 0.0009 | 0.0012 |
| Logarithmic | 0.0906 | 0.0010 | 0.0003 | 0.0989 | 0.0005 | 0.0026 | 0.0959 | 0.0001 | 0.0014 |
| Rect. Hyp. | 0.1055 | 0.0019 | 0.0010 | 0.1054 | 0.0026 | 0.0003 | 0.1109 | 0.0002 | 0.0018 |
| Logistic (3p) | 0.0910 | 0.0009 | 0.0002 | 0.0992 | 0.0004 | 0.0031 | 0.0970 | 0.0011 | 0.0013 |
| Logistic (4p) | 0.0905 | 0.0010 | 0.0002 | 0.0988 | 0.0004 | 0.0030 | 0.0965 | 0.0011 | 0.0013 |
| Gompertz | 0.1234 | 0.0000 | 0.0010 | 0.0990 | 0.0004 | 0.0030 | 0.0968 | 0.0011 | 0.0013 |
| Weibull | 0.0900 | 0.0011 | 0.0002 | 0.0984 | 0.0004 | 0.0029 | 0.0959 | 0.0009 | 0.0014 |
| Cubic Spline | 0.0901 | 0.0018 | 0.0003 | 0.0957 | 0.0007 | 0.0032 | 0.0954 | 0.0009 | 0.0014 |
| Natural Spline | 0.0895 | 0.0015 | 0.0002 | 0.0959 | 0.0006 | 0.0031 | 0.0955 | 0.0009 | 0.0015 |
| CO2 | SO2 | NOx | |||||||
|---|---|---|---|---|---|---|---|---|---|
| Regression Models | NRMSE | MAPEdiff | PBIAS | NRMSE | MAPEdiff | PBIAS | NRMSE | MAPEdiff | PBIAS |
| Linear Reg | 0.1294 | 0.0009 | 0.0005 | 0.1281 | 0.0001 | 0.0003 | 0.1696 | 0.0014 | 0.0010 |
| Quadratic Reg | 0.1051 | 0.0002 | 0.0002 | 0.1034 | 0.0004 | 0.0002 | 0.1542 | 0.0018 | 0.0013 |
| Cubic Reg | 0.1035 | 0.0003 | 0.0002 | 0.0989 | 0.0000 | 0.0012 | 0.1541 | 0.0018 | 0.0013 |
| Exponential Reg | 0.1318 | 0.0009 | 0.0008 | 0.1320 | 0.0001 | 0.0002 | 0.1715 | 0.0013 | 0.0008 |
| Logarithmic Reg | 0.1048 | 0.0007 | 0.0000 | 0.0993 | 0.0001 | 0.0020 | 0.1522 | 0.0020 | 0.0011 |
| Rect. Hyp. Reg | 0.1349 | 0.0011 | 0.0004 | 0.1227 | 0.0007 | 0.0030 | 0.1548 | 0.0032 | 0.0022 |
| Logistic (3p) Reg | 0.1036 | 0.0005 | 0.0003 | 0.0979 | 0.0001 | 0.0017 | 0.1533 | 0.0020 | 0.0012 |
| Logistic (4p) Reg | 0.1035 | 0.0006 | 0.0003 | 0.0976 | 0.0001 | 0.0017 | 0.1529 | 0.0020 | 0.0012 |
| Gompertz Reg | 0.1036 | 0.0006 | 0.0003 | 0.0977 | 0.0001 | 0.0018 | 0.1531 | 0.0020 | 0.0012 |
| Weibull Reg | 0.1036 | 0.0007 | 0.0003 | 0.0972 | 0.0001 | 0.0019 | 0.1521 | 0.0020 | 0.0011 |
| Cubic Spline | 0.1036 | 0.0008 | 0.0001 | 0.0962 | 0.0000 | 0.0019 | 0.1469 | 0.0013 | 0.0003 |
| Natural Spline | 0.1035 | 0.0008 | 0.0001 | 0.0962 | 0.0000 | 0.0019 | 0.1501 | 0.0019 | 0.0009 |
| VOC | |||
|---|---|---|---|
| Regression Models | NRMSE | MAPEdiff | PBIAS |
| Linear | 0.1175 | 0.0003 | 0.0010 |
| Quadratic | 0.0979 | 0.0001 | 0.0019 |
| Cubic | 0.0946 | 0.0004 | 0.0022 |
| Exponential | 0.1230 | 0.0002 | 0.0010 |
| Logarithmic | 0.0946 | 0.0006 | 0.0026 |
| Rect. Hyp. | 0.1061 | 0.0000 | 0.0045 |
| Logistic (3p) | 0.0941 | 0.0003 | 0.0026 |
| Logistic (4p) | 0.0939 | 0.0004 | 0.0026 |
| Gompertz | 0.0940 | 0.0004 | 0.0026 |
| Weibull | 0.0936 | 0.0005 | 0.0026 |
| Cubic Spline | 0.0920 | 0.0010 | 0.0023 |
| Natural Spline | 0.0922 | 0.0010 | 0.0024 |
Disclaimer/Publisher’s Note: The statements, opinions and data contained in all publications are solely those of the individual author(s) and contributor(s) and not of MDPI and/or the editor(s). MDPI and/or the editor(s) disclaim responsibility for any injury to people or property resulting from any ideas, methods, instructions or products referred to in the content. |
© 2025 by the author. Licensee MDPI, Basel, Switzerland. This article is an open access article distributed under the terms and conditions of the Creative Commons Attribution (CC BY) license (https://creativecommons.org/licenses/by/4.0/).
Share and Cite
Ünlügençoğlu, K. Gross Tonnage-Based Statistical Modeling and Calculation of Shipping Emissions for the Bosphorus Strait. J. Mar. Sci. Eng. 2025, 13, 744. https://doi.org/10.3390/jmse13040744
Ünlügençoğlu K. Gross Tonnage-Based Statistical Modeling and Calculation of Shipping Emissions for the Bosphorus Strait. Journal of Marine Science and Engineering. 2025; 13(4):744. https://doi.org/10.3390/jmse13040744
Chicago/Turabian StyleÜnlügençoğlu, Kaan. 2025. "Gross Tonnage-Based Statistical Modeling and Calculation of Shipping Emissions for the Bosphorus Strait" Journal of Marine Science and Engineering 13, no. 4: 744. https://doi.org/10.3390/jmse13040744
APA StyleÜnlügençoğlu, K. (2025). Gross Tonnage-Based Statistical Modeling and Calculation of Shipping Emissions for the Bosphorus Strait. Journal of Marine Science and Engineering, 13(4), 744. https://doi.org/10.3390/jmse13040744