Time-Frequency Feature Extraction Method for Weak Acoustic Signals from Drill Pipe of Seafloor Drill

Abstract
1. Introduction
- (1)
- A time-frequency feature extraction method based on ST is proposed for weak acoustic signals from a seafloor drill pipe, which overcomes the limitations of STFT’s fixed window length and WT’s requirement for preset basis functions;
- (2)
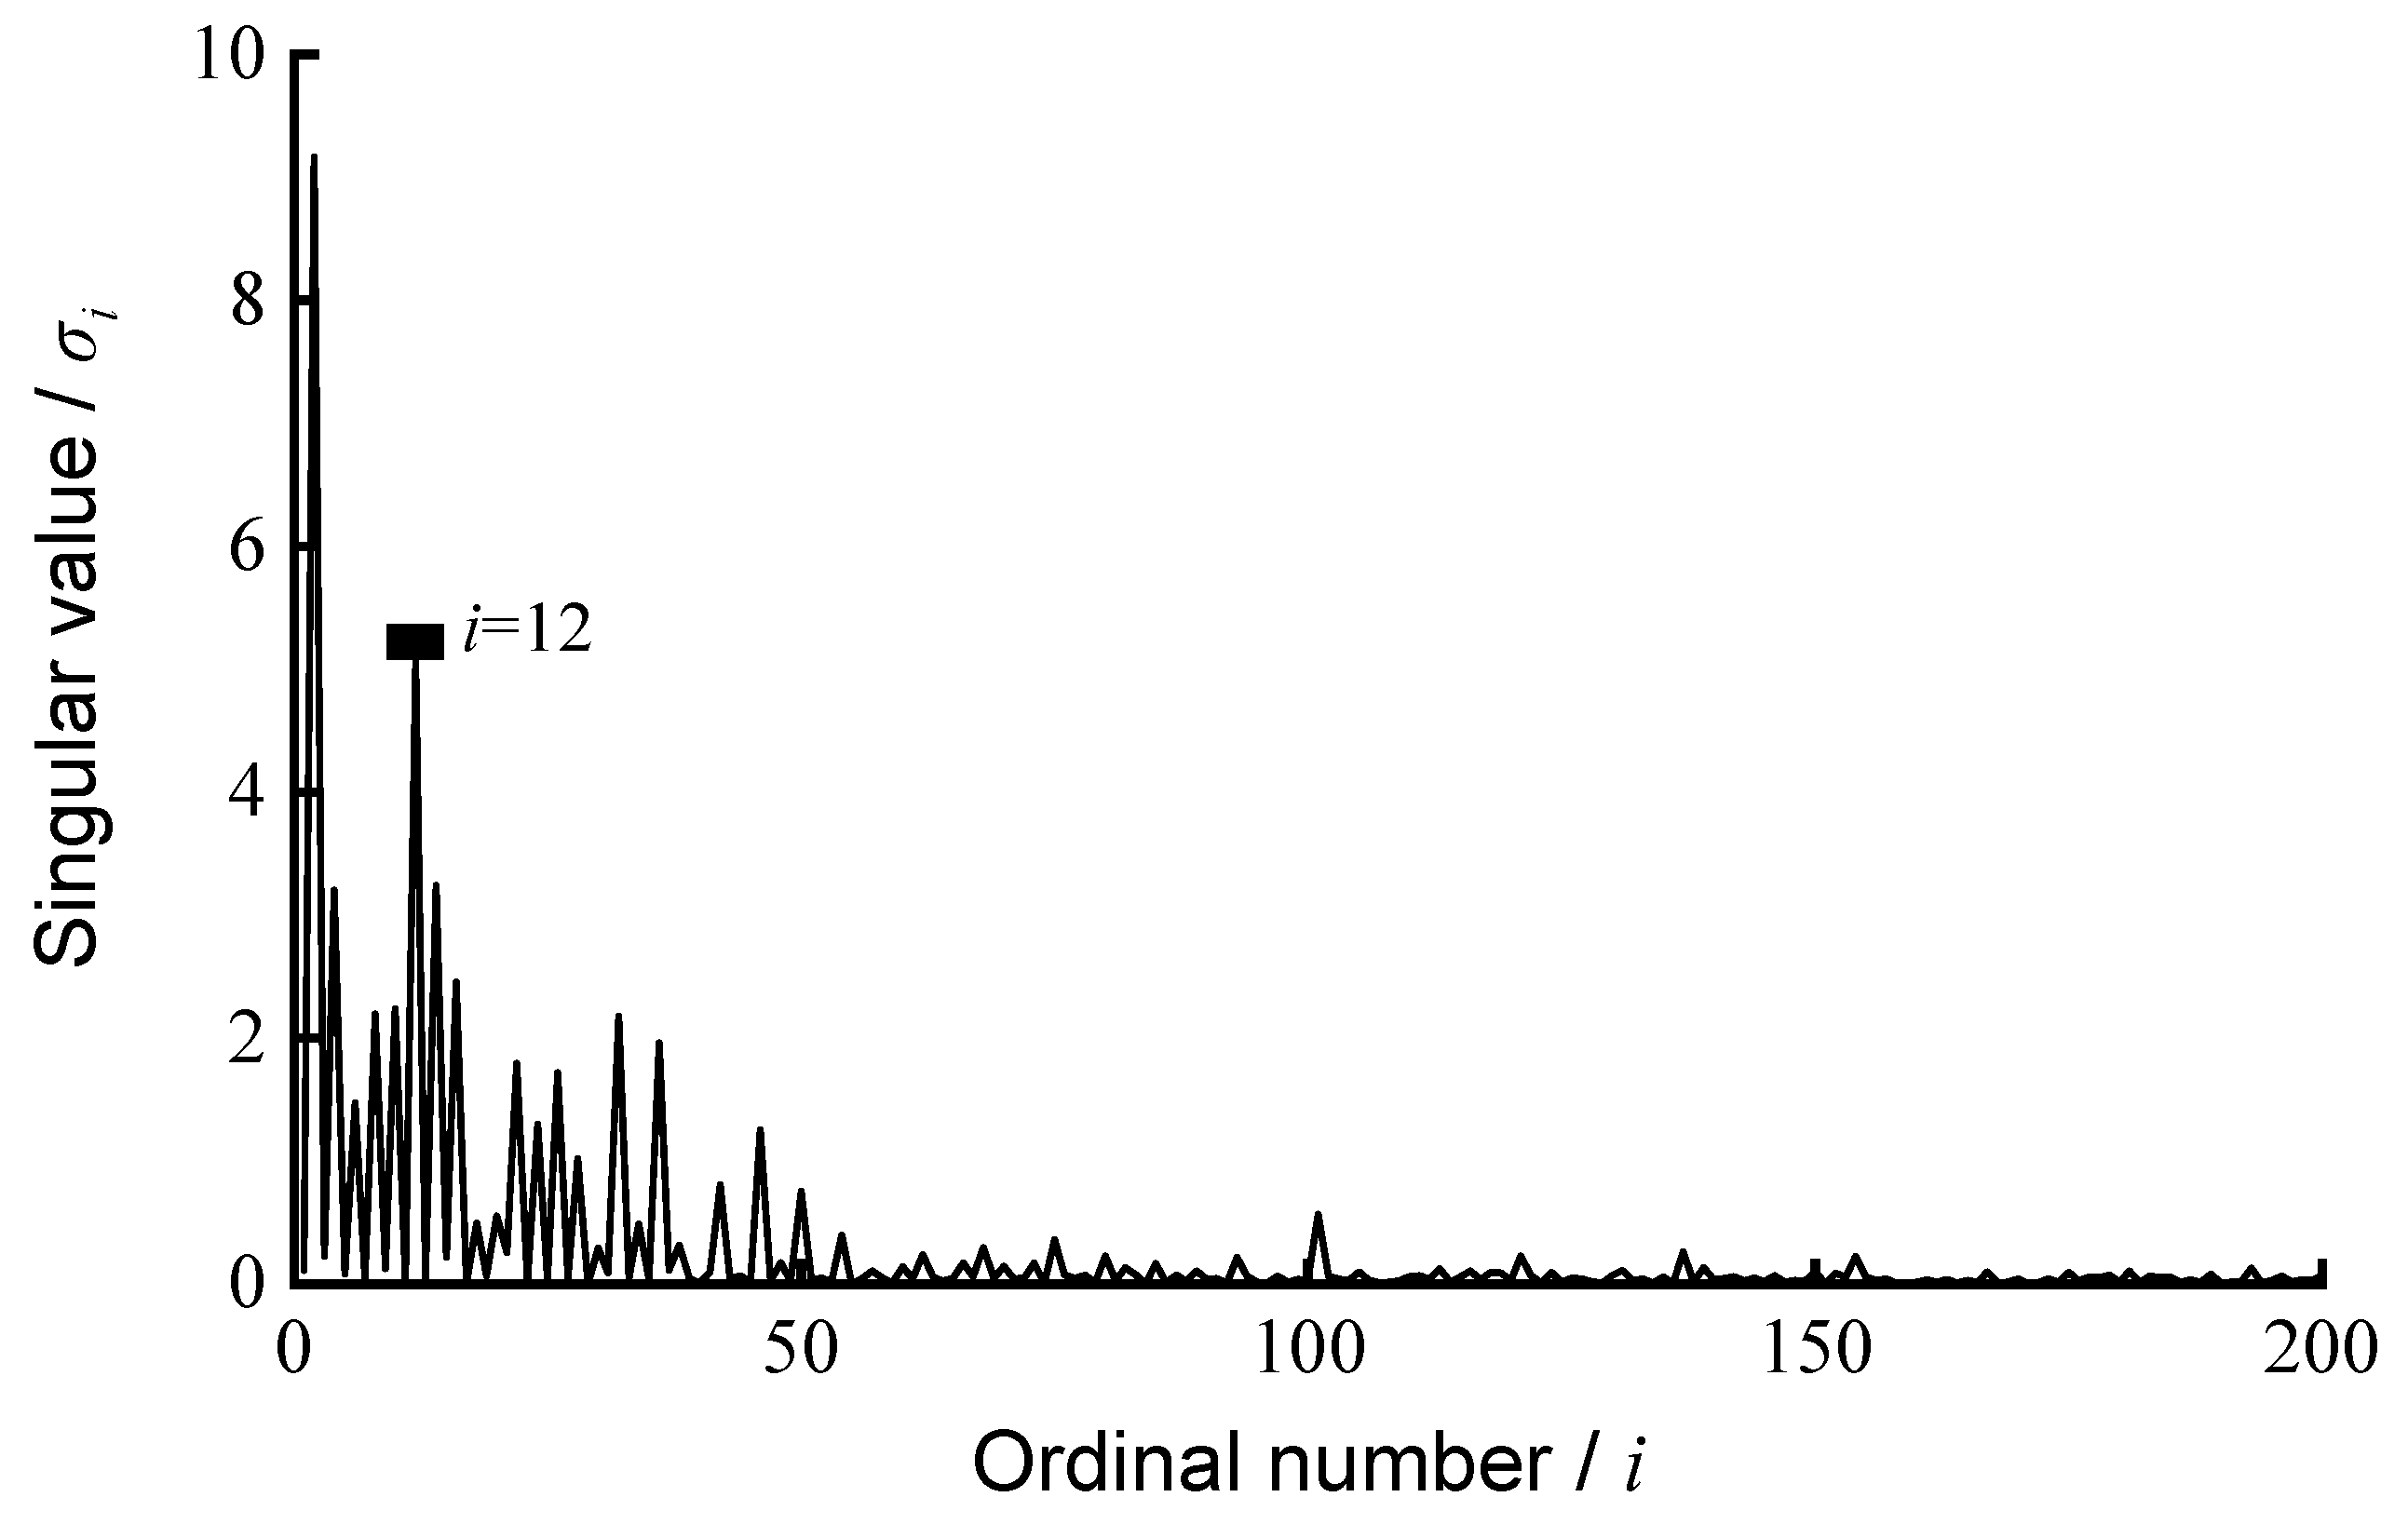
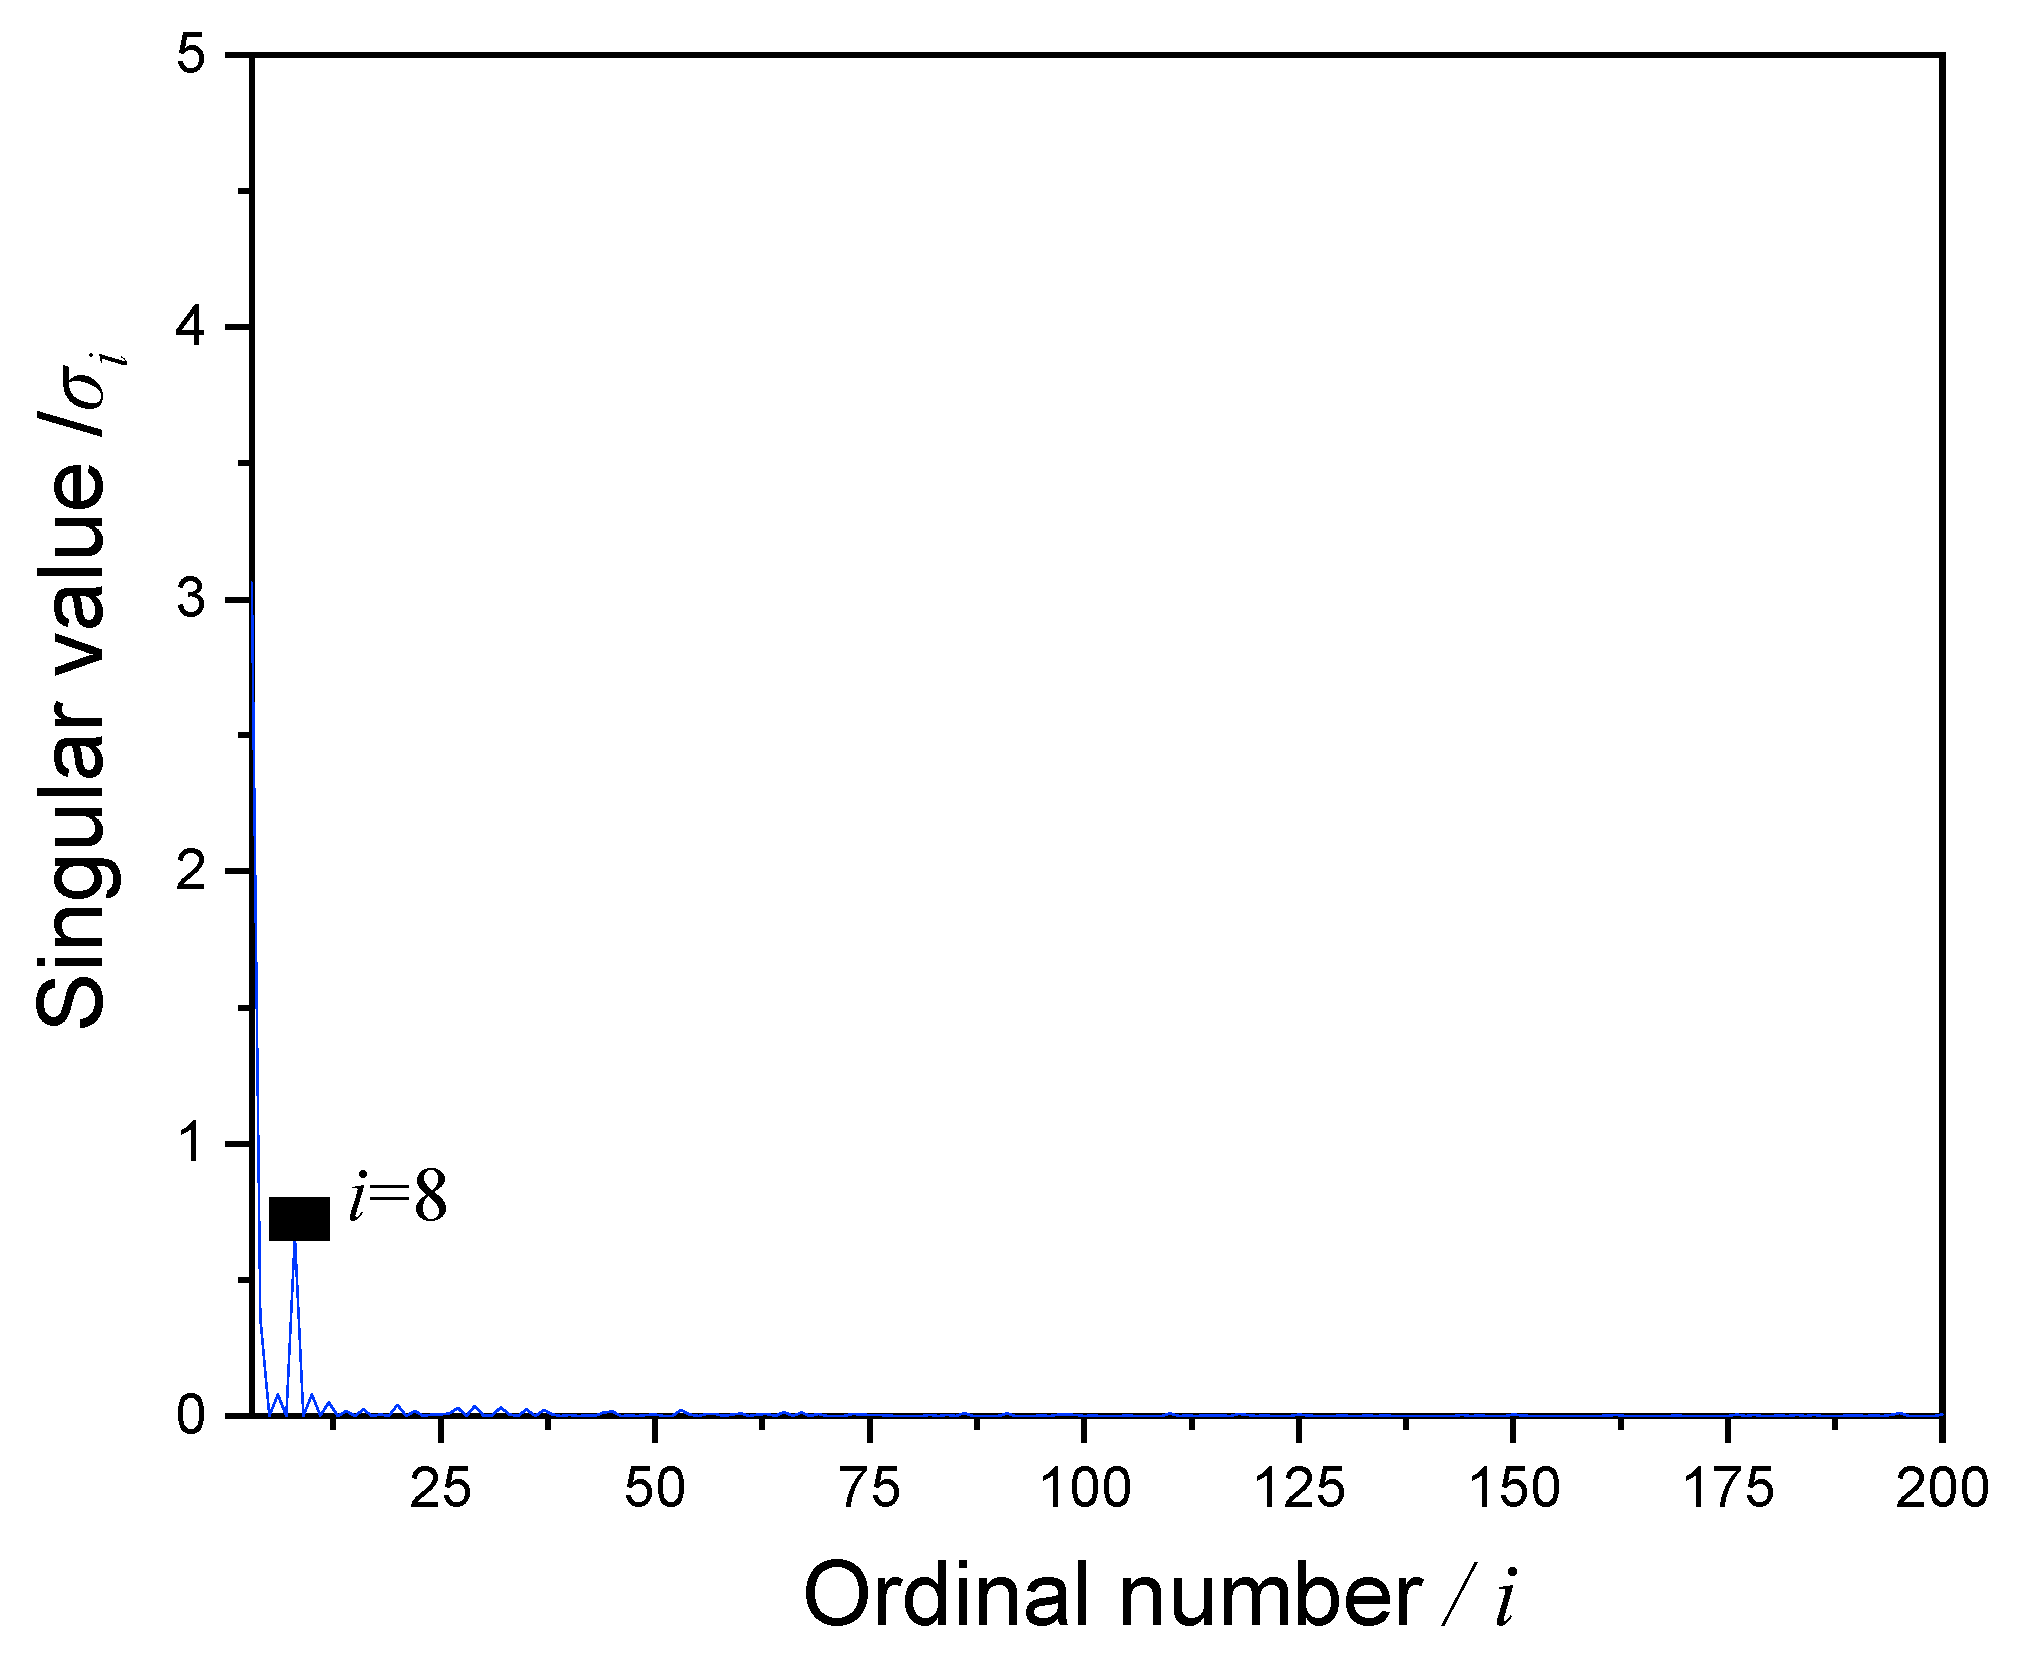
- Singular value decomposition is introduced for noise reduction of the ST time-frequency matrix, effectively improving the extraction accuracy of drill pipe acoustic signal features under strong background noise;
- (3)
- The effectiveness of the proposed method under actual seafloor drill operating conditions is verified through simulation and experiments, providing a new solution for realizing wireless acoustic transmission technology in drill pipes.
2. Methodology
2.1. Time-Frequency Analysis Methods
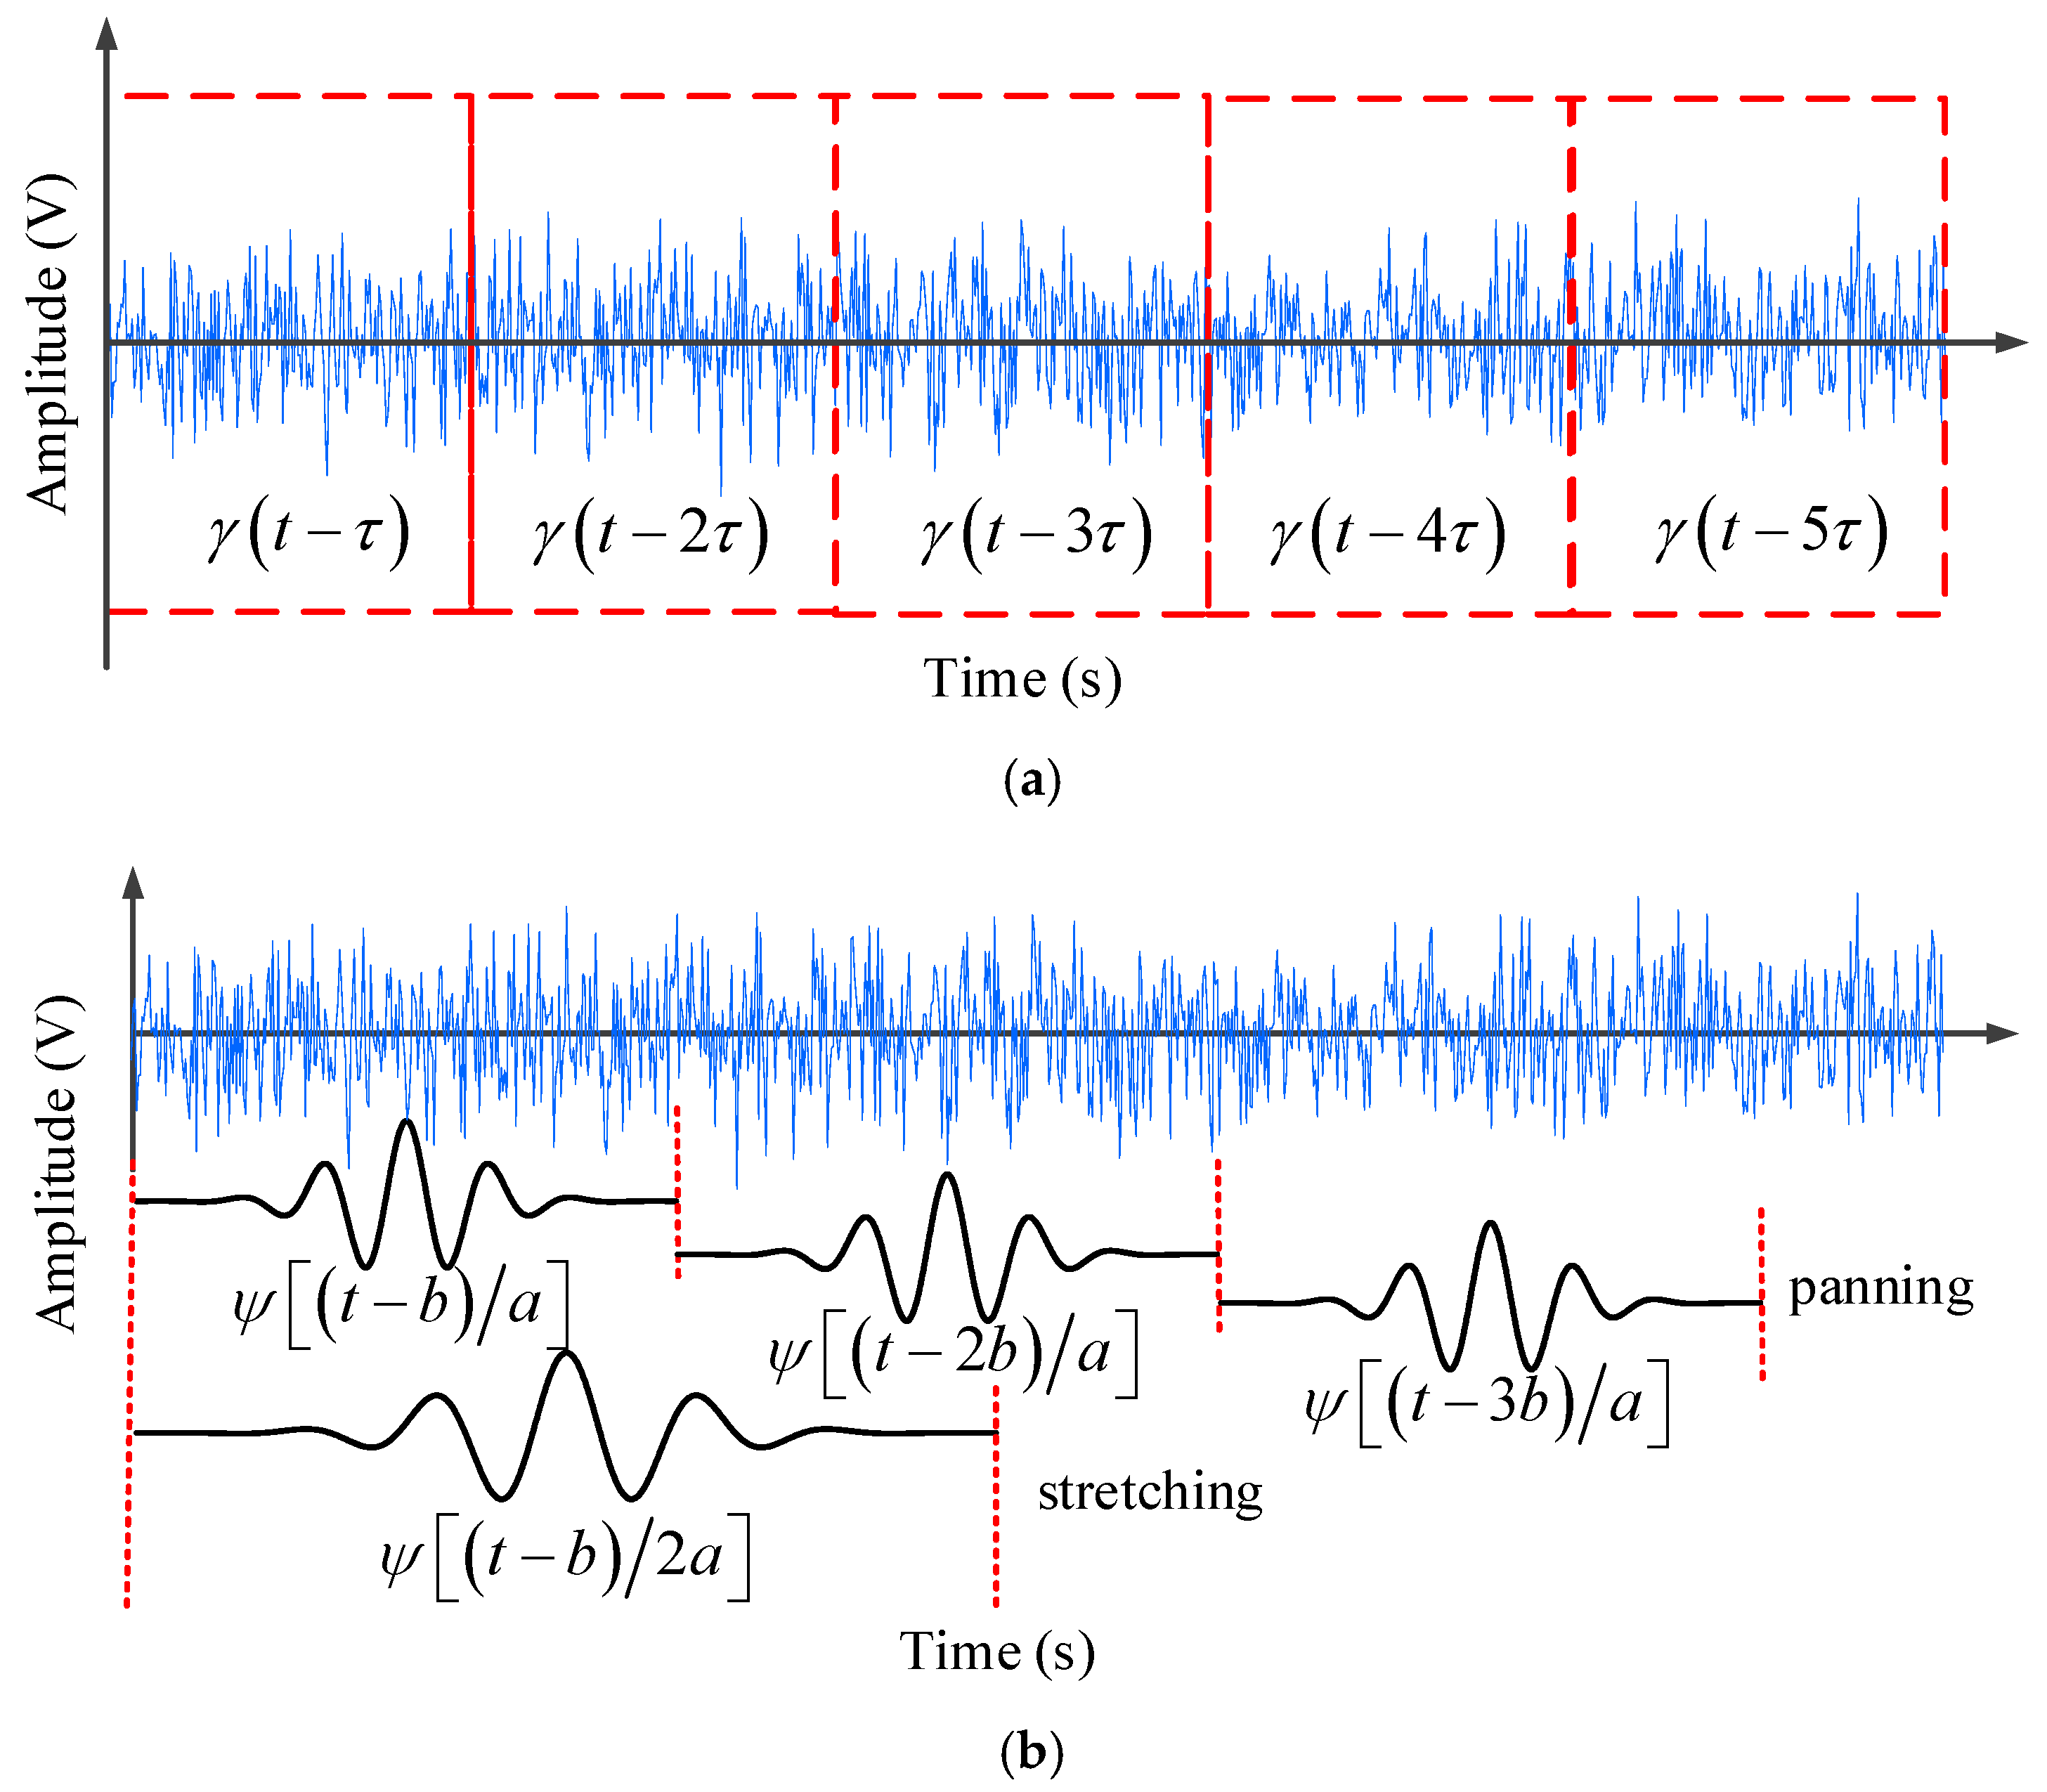
2.1.1. STFT and WT
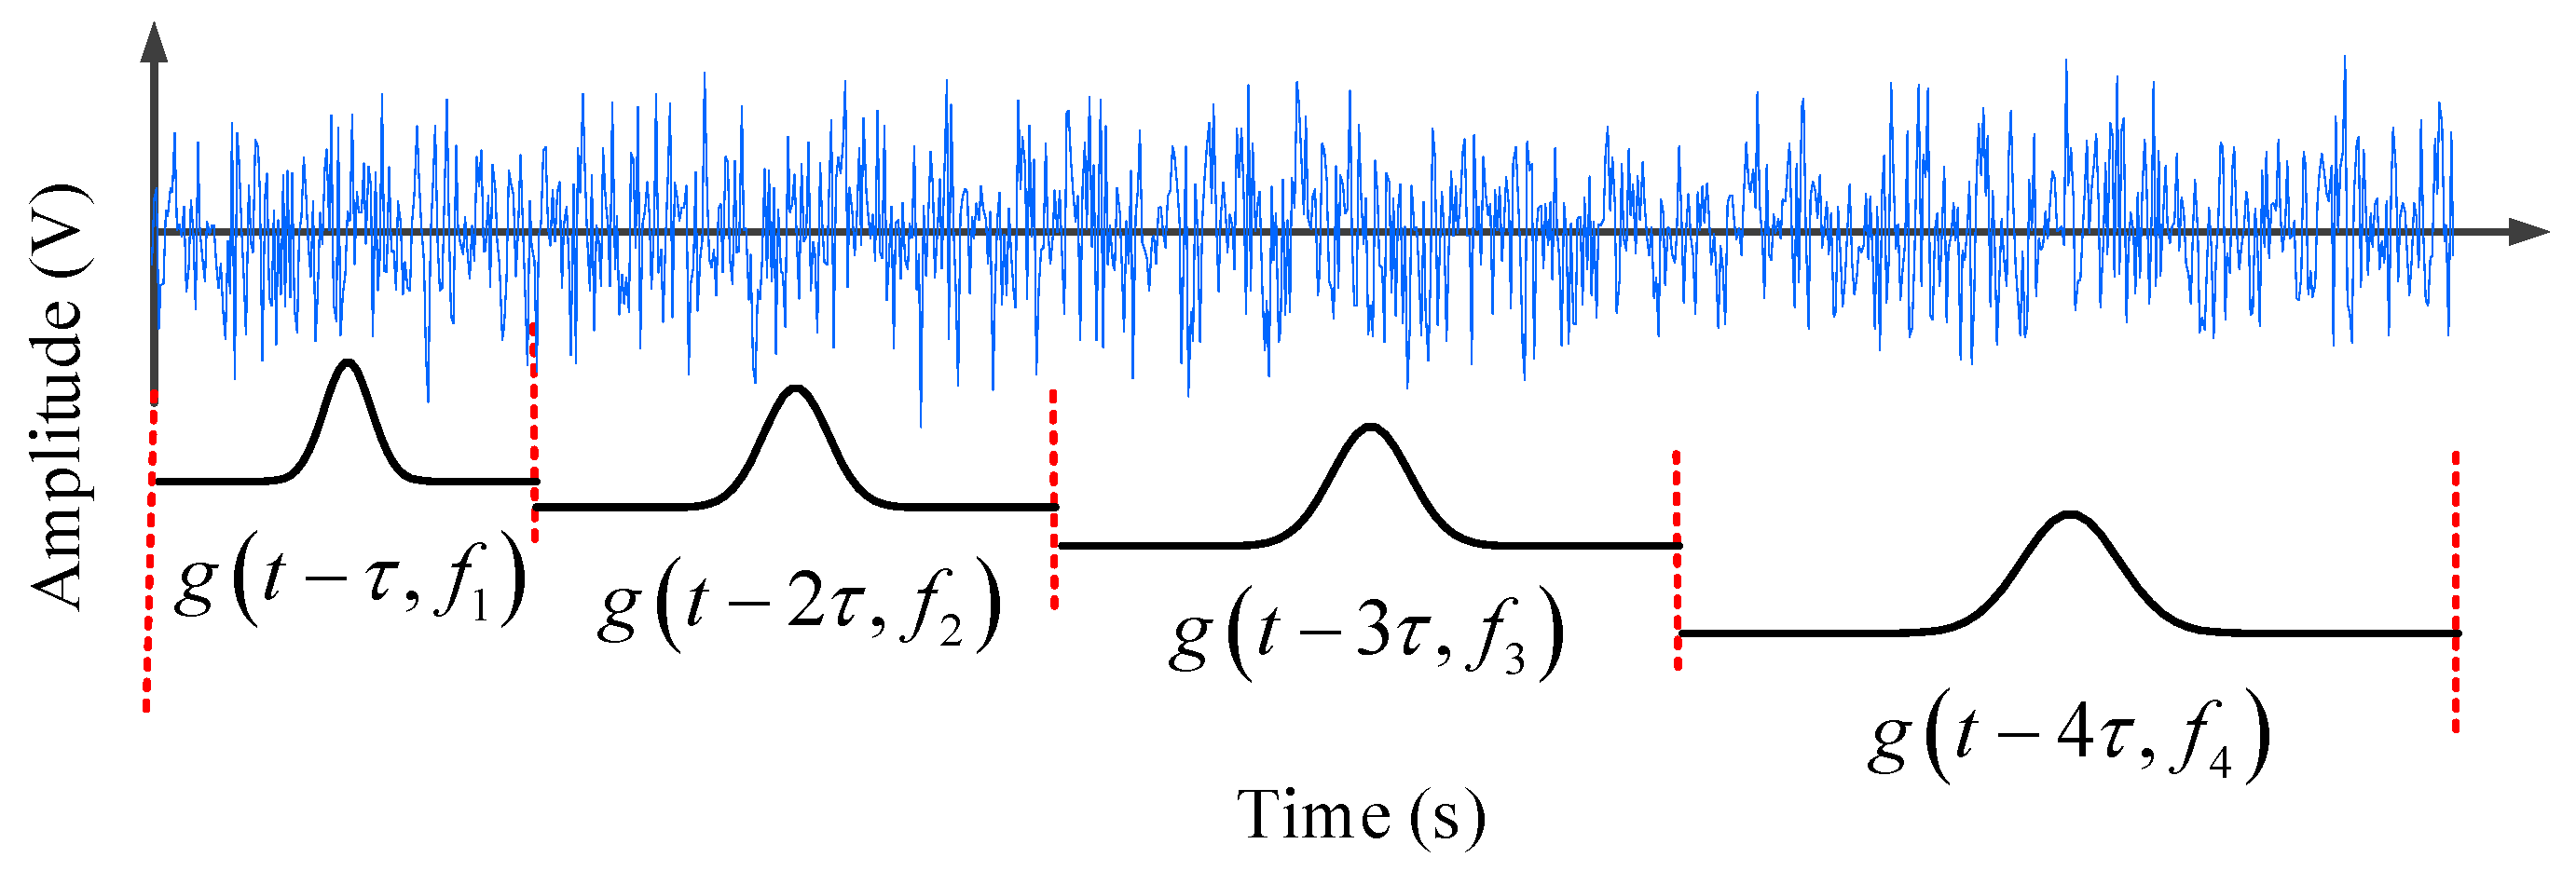
2.1.2. ST
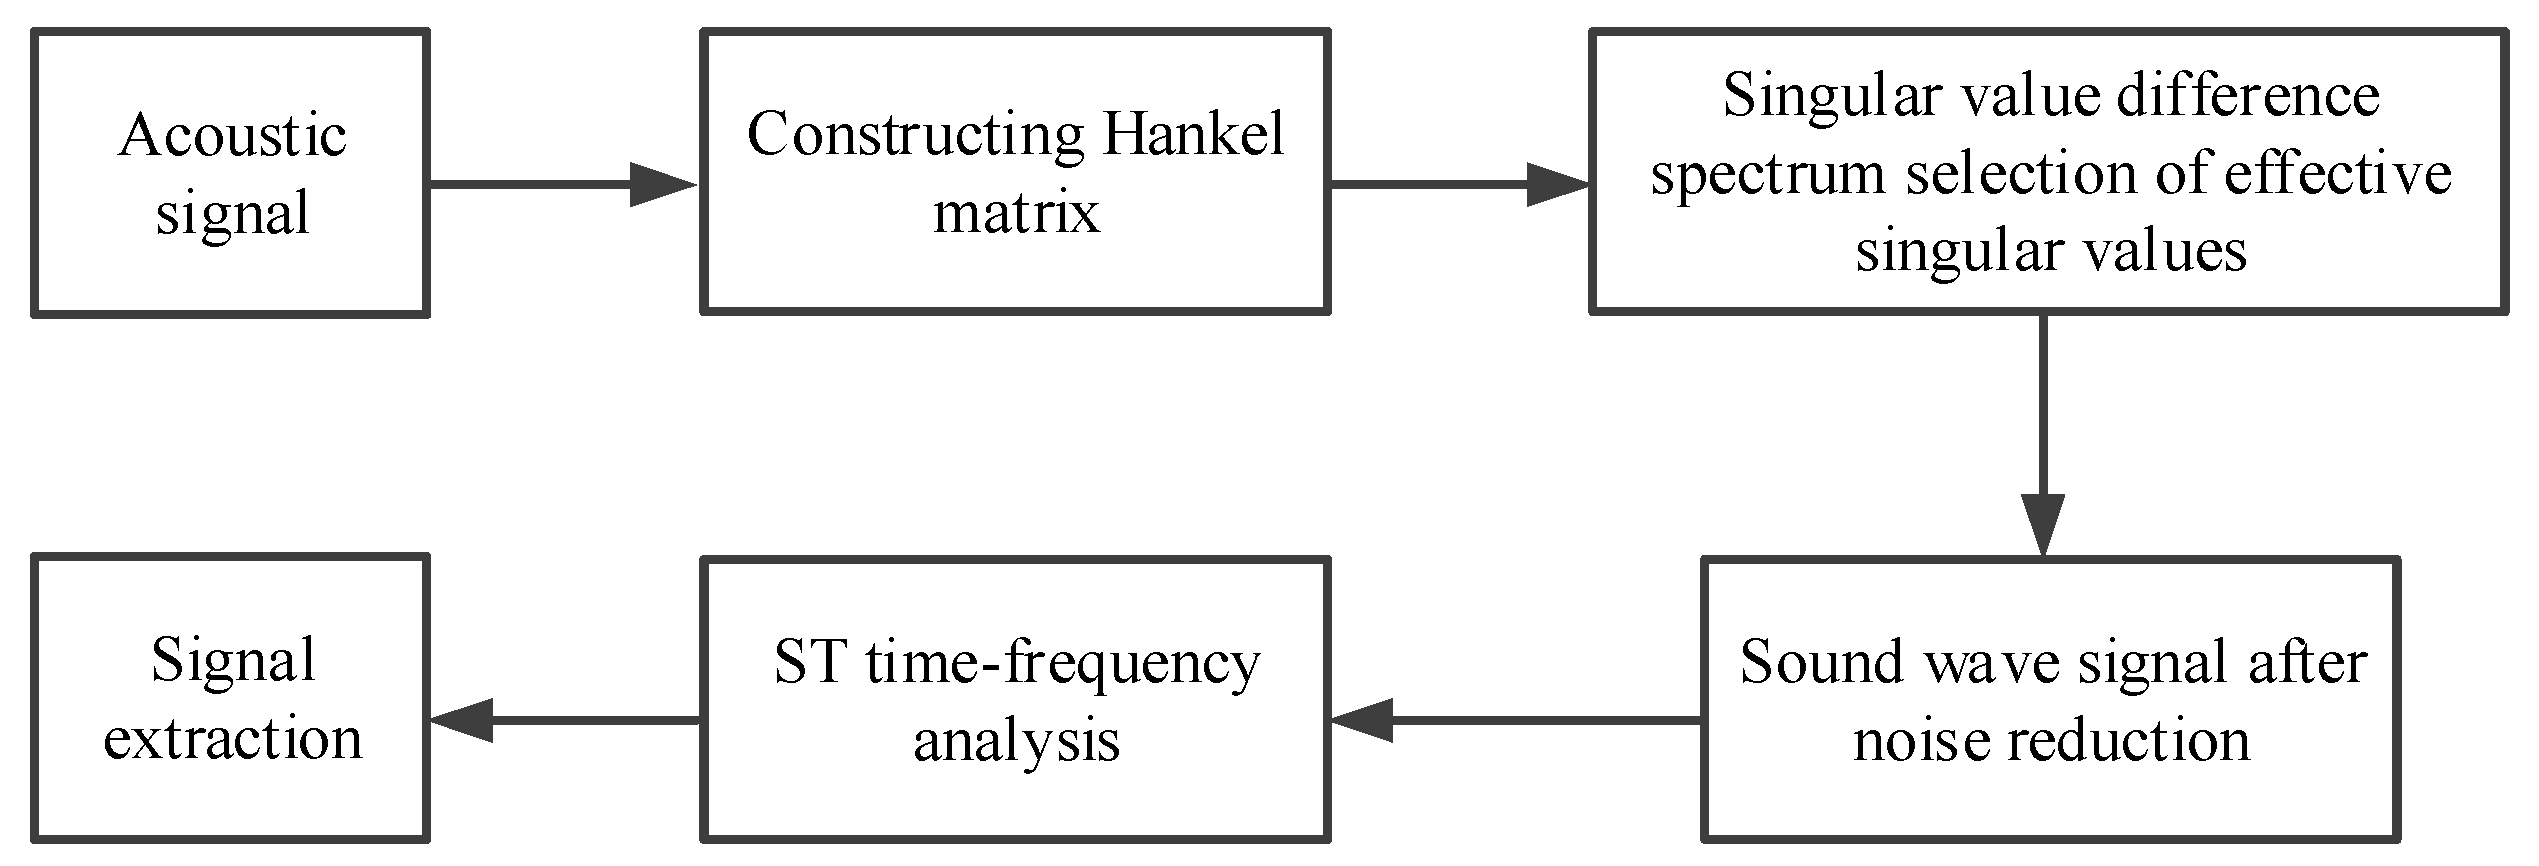
2.2. Weak Acoustic Signal Feature Extraction Based on ST
- (1)
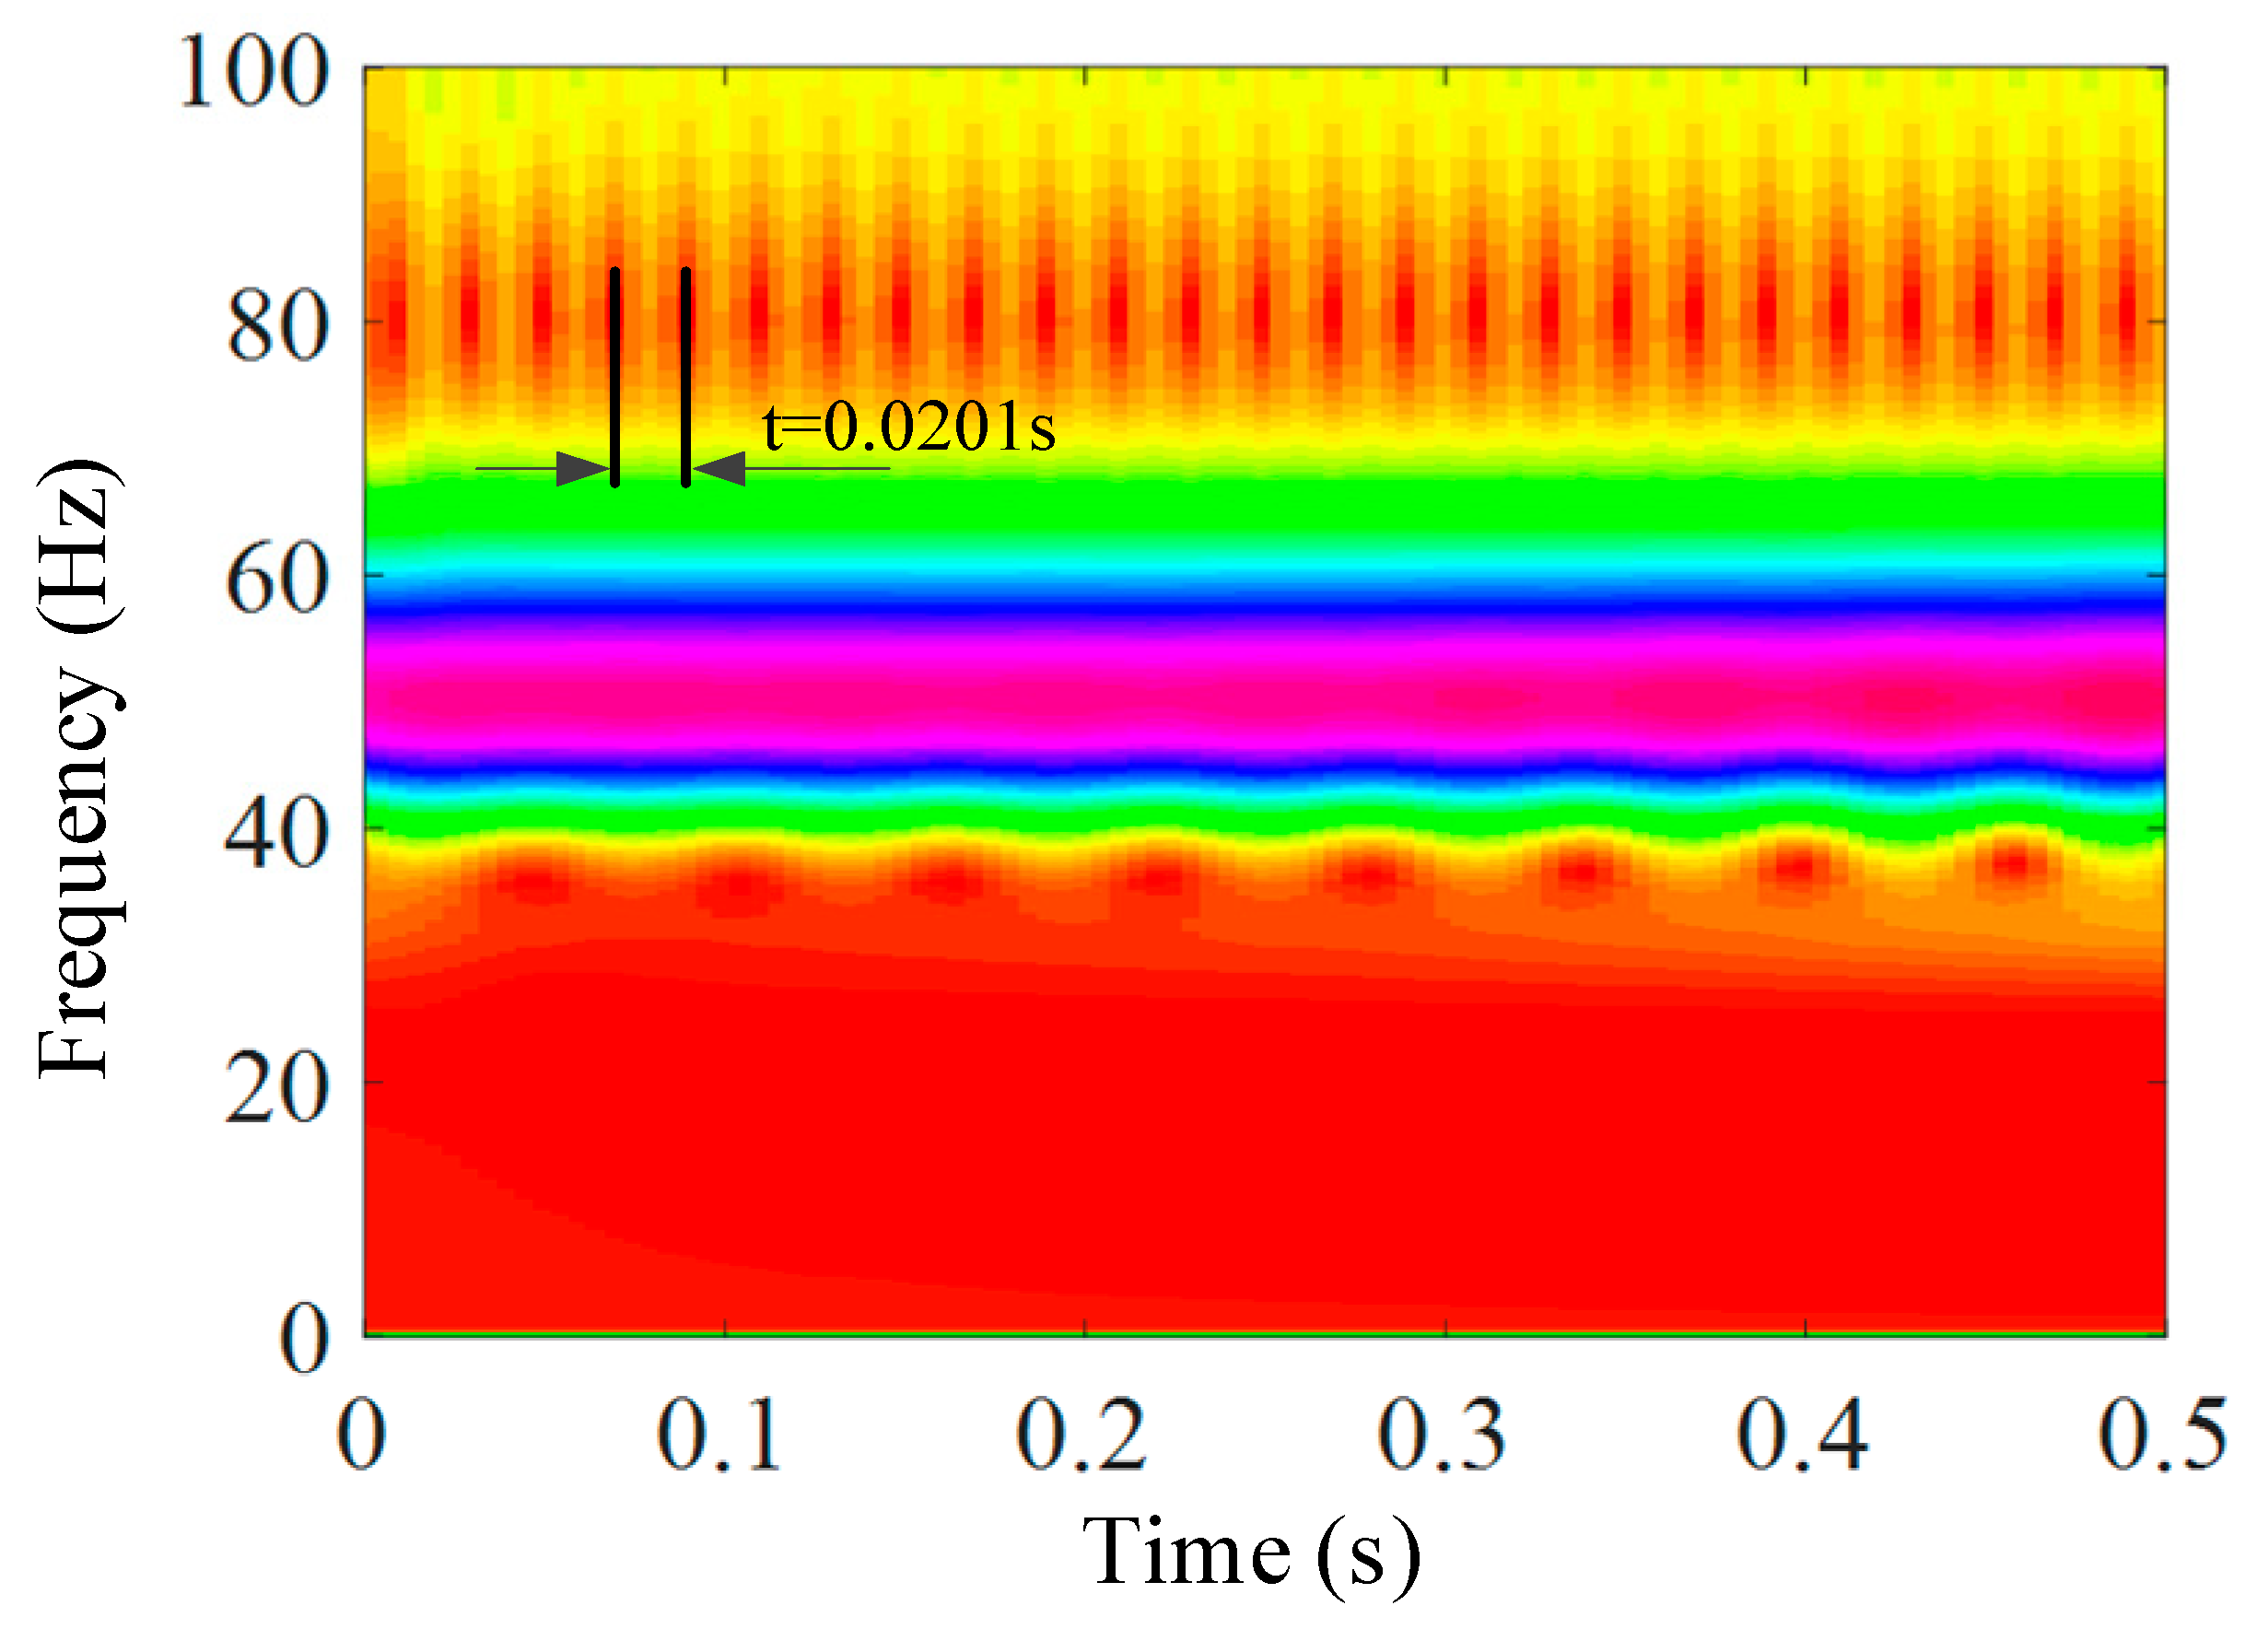
- Time-frequency analysis of drill pipe acoustic wave signals;
- (2)
- Noise reduction of drill pipe acoustic wave signals;
- (3)
- Extraction of weak acoustic wave features from the drill pipe signals.
2.2.1. Time-Frequency Analysis of Drill Pipe Acoustic Signals
2.2.2. Acoustic Signal Noise Reduction for Drill Pipe
3. Results and Discussion
3.1. Simulation Verification
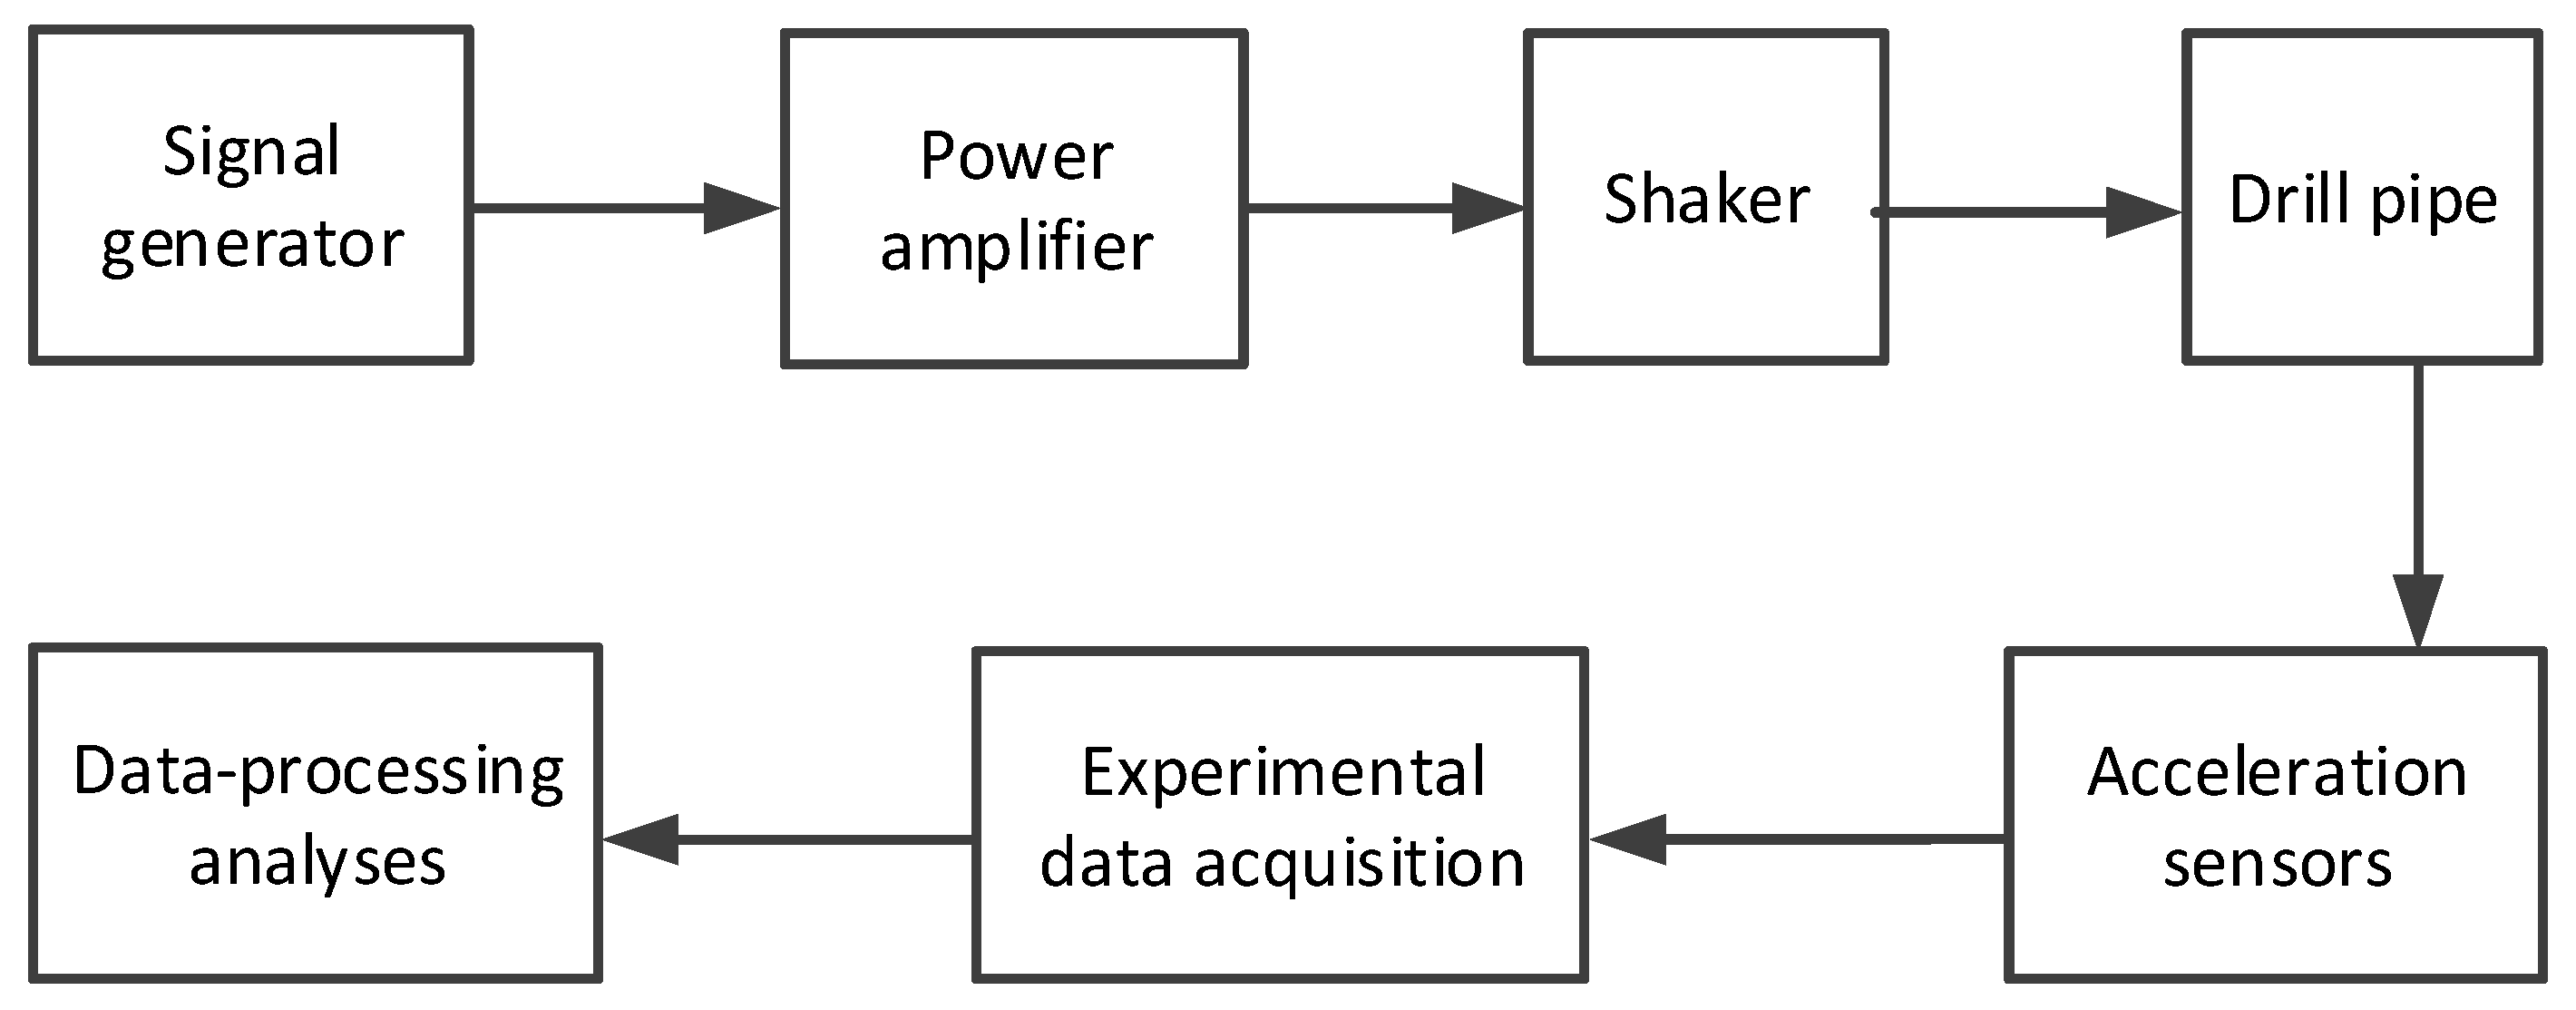
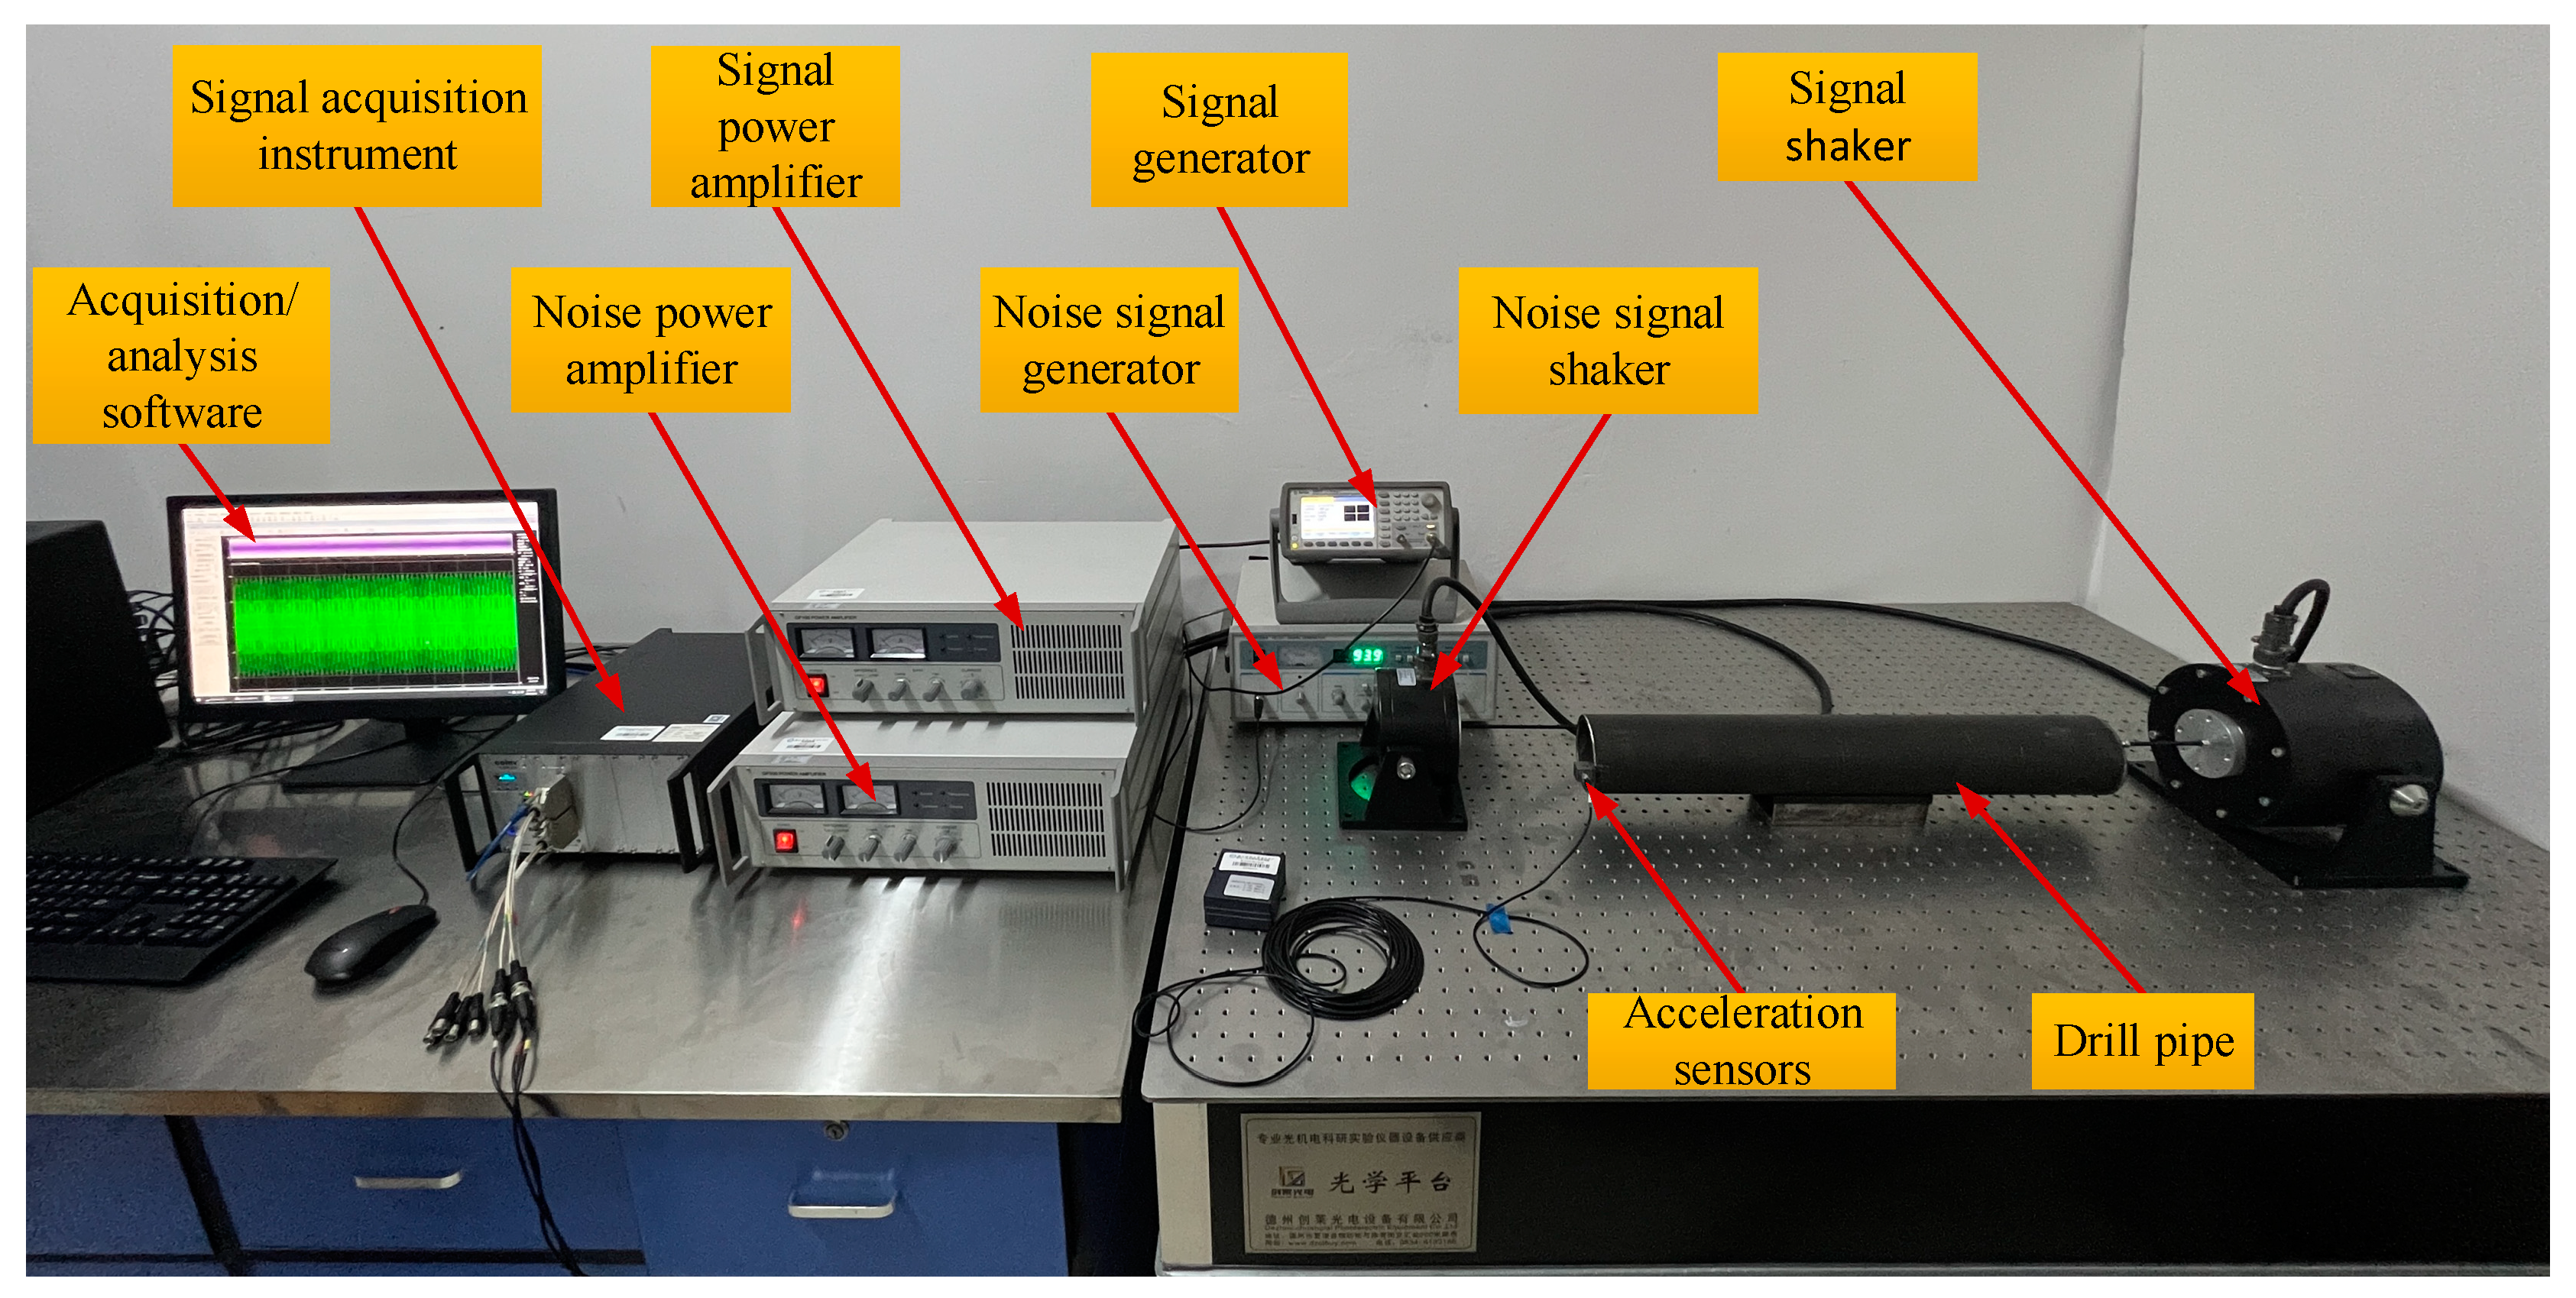
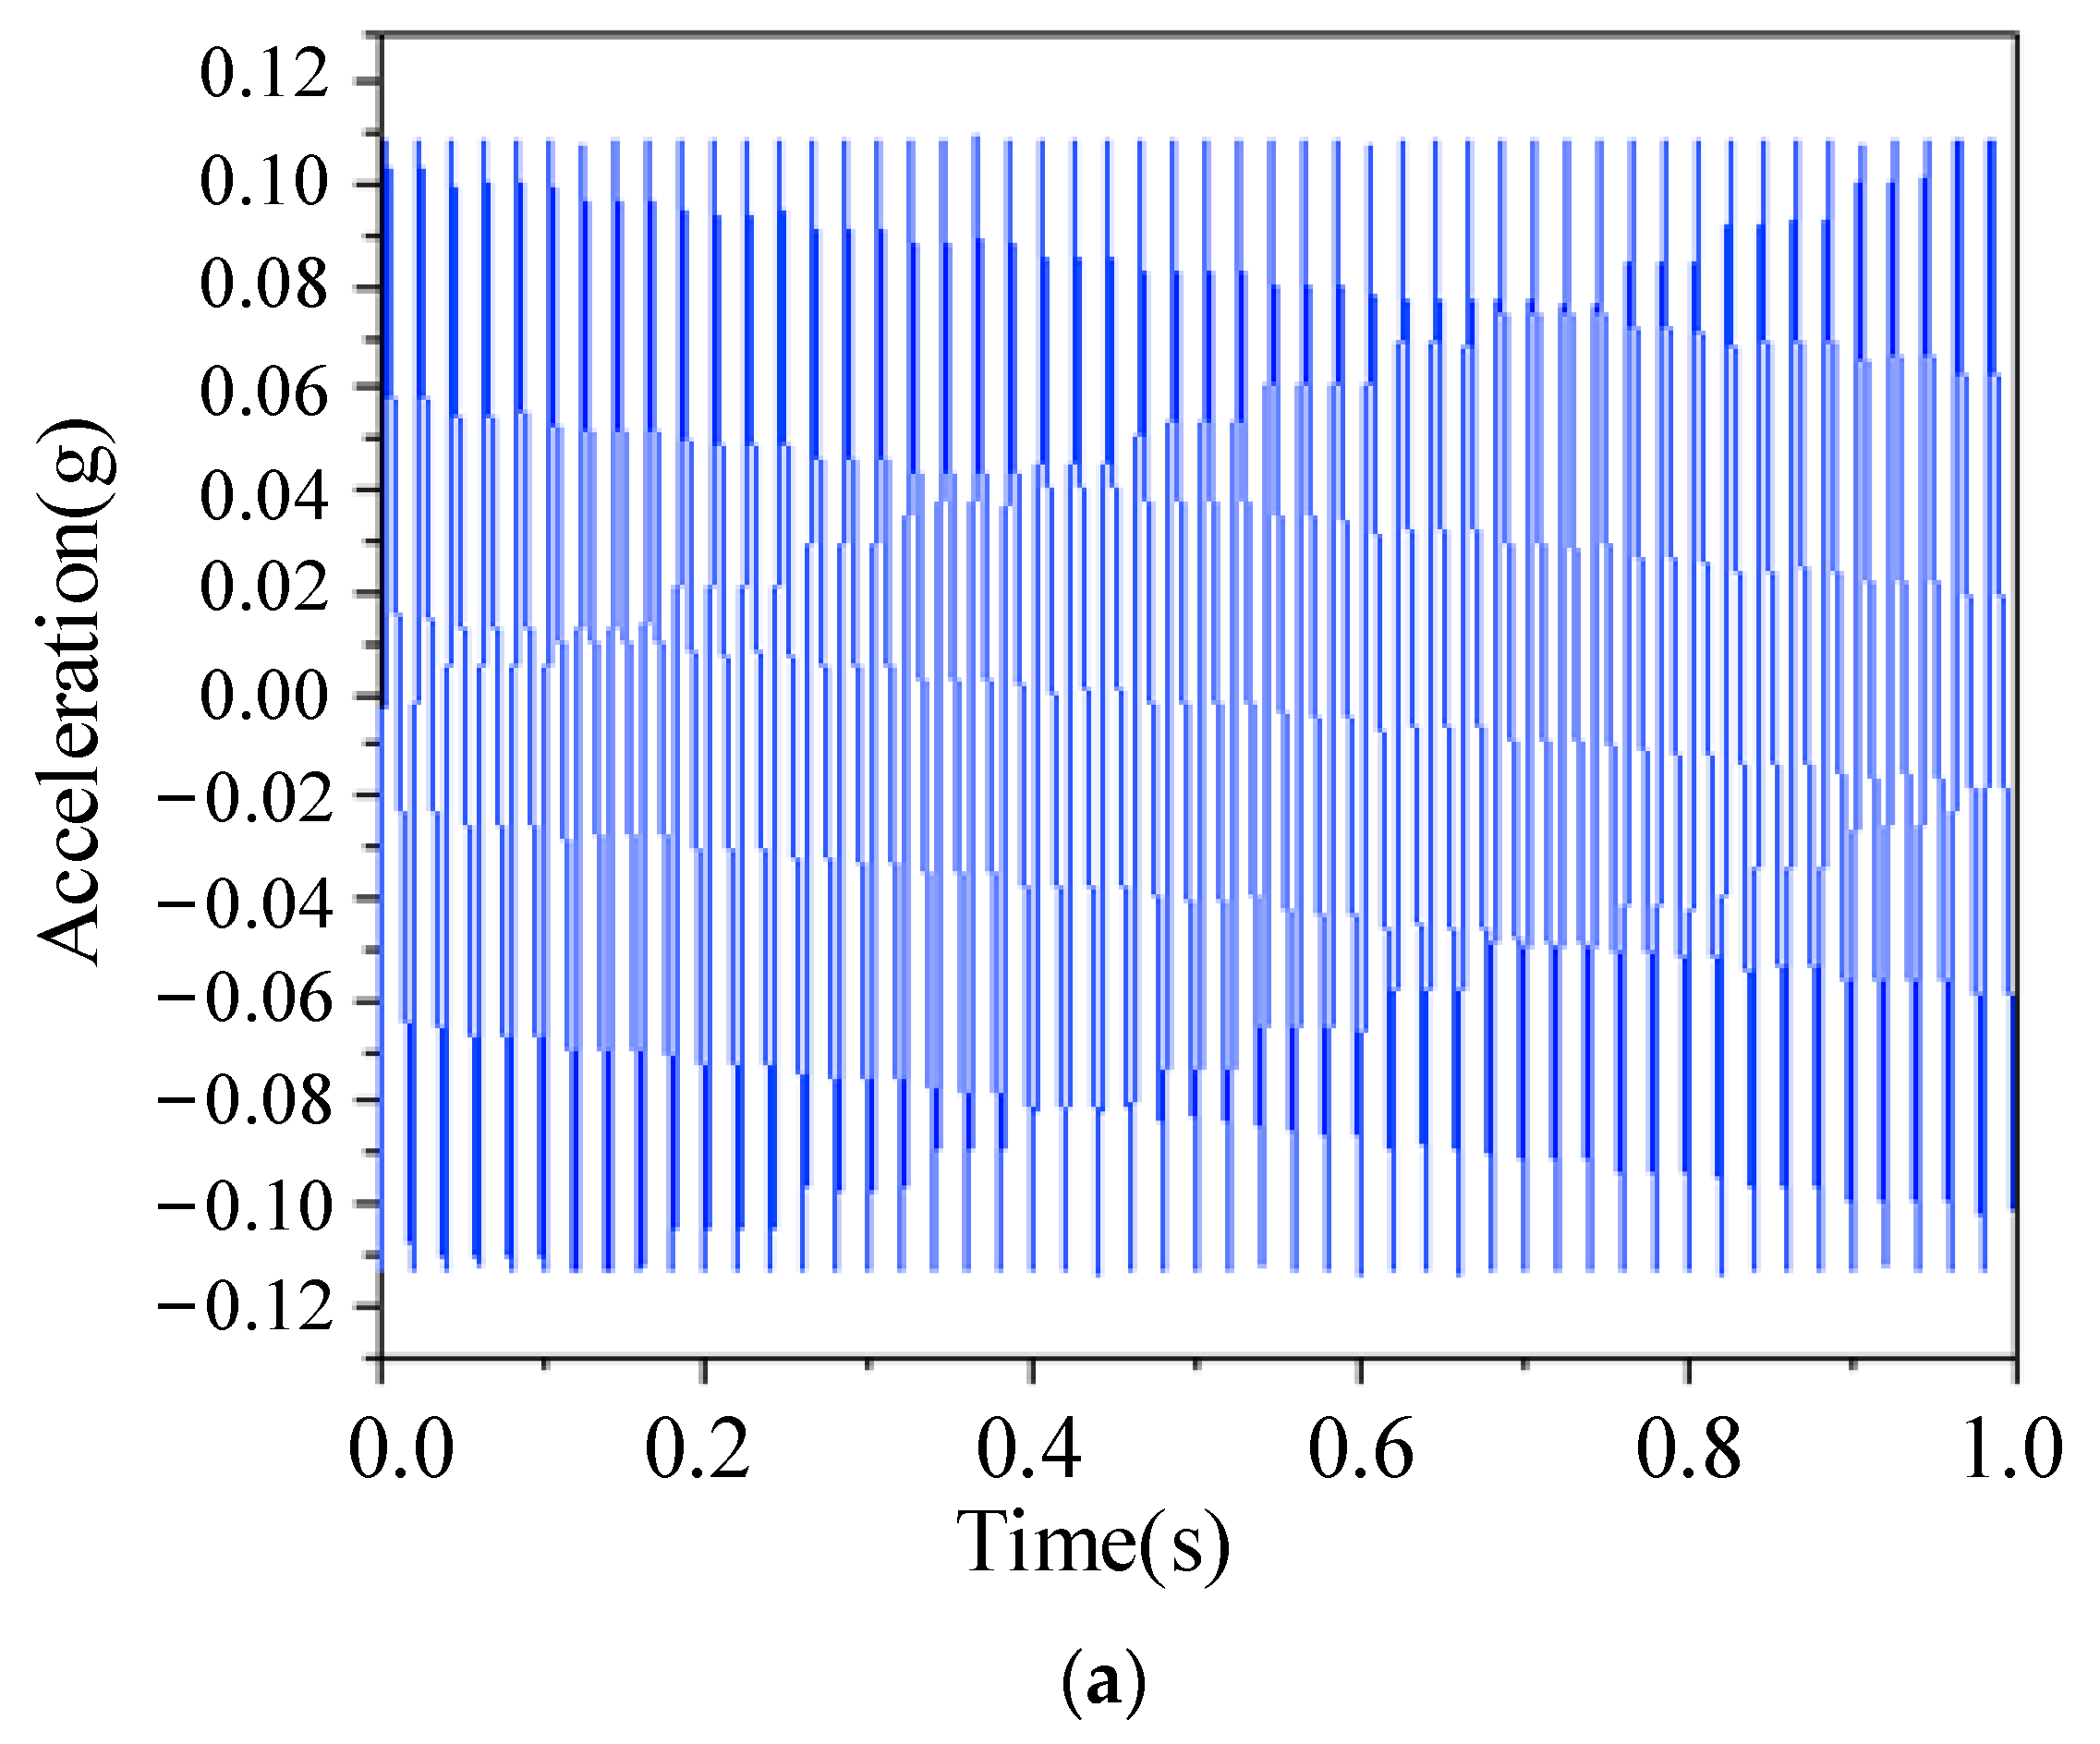
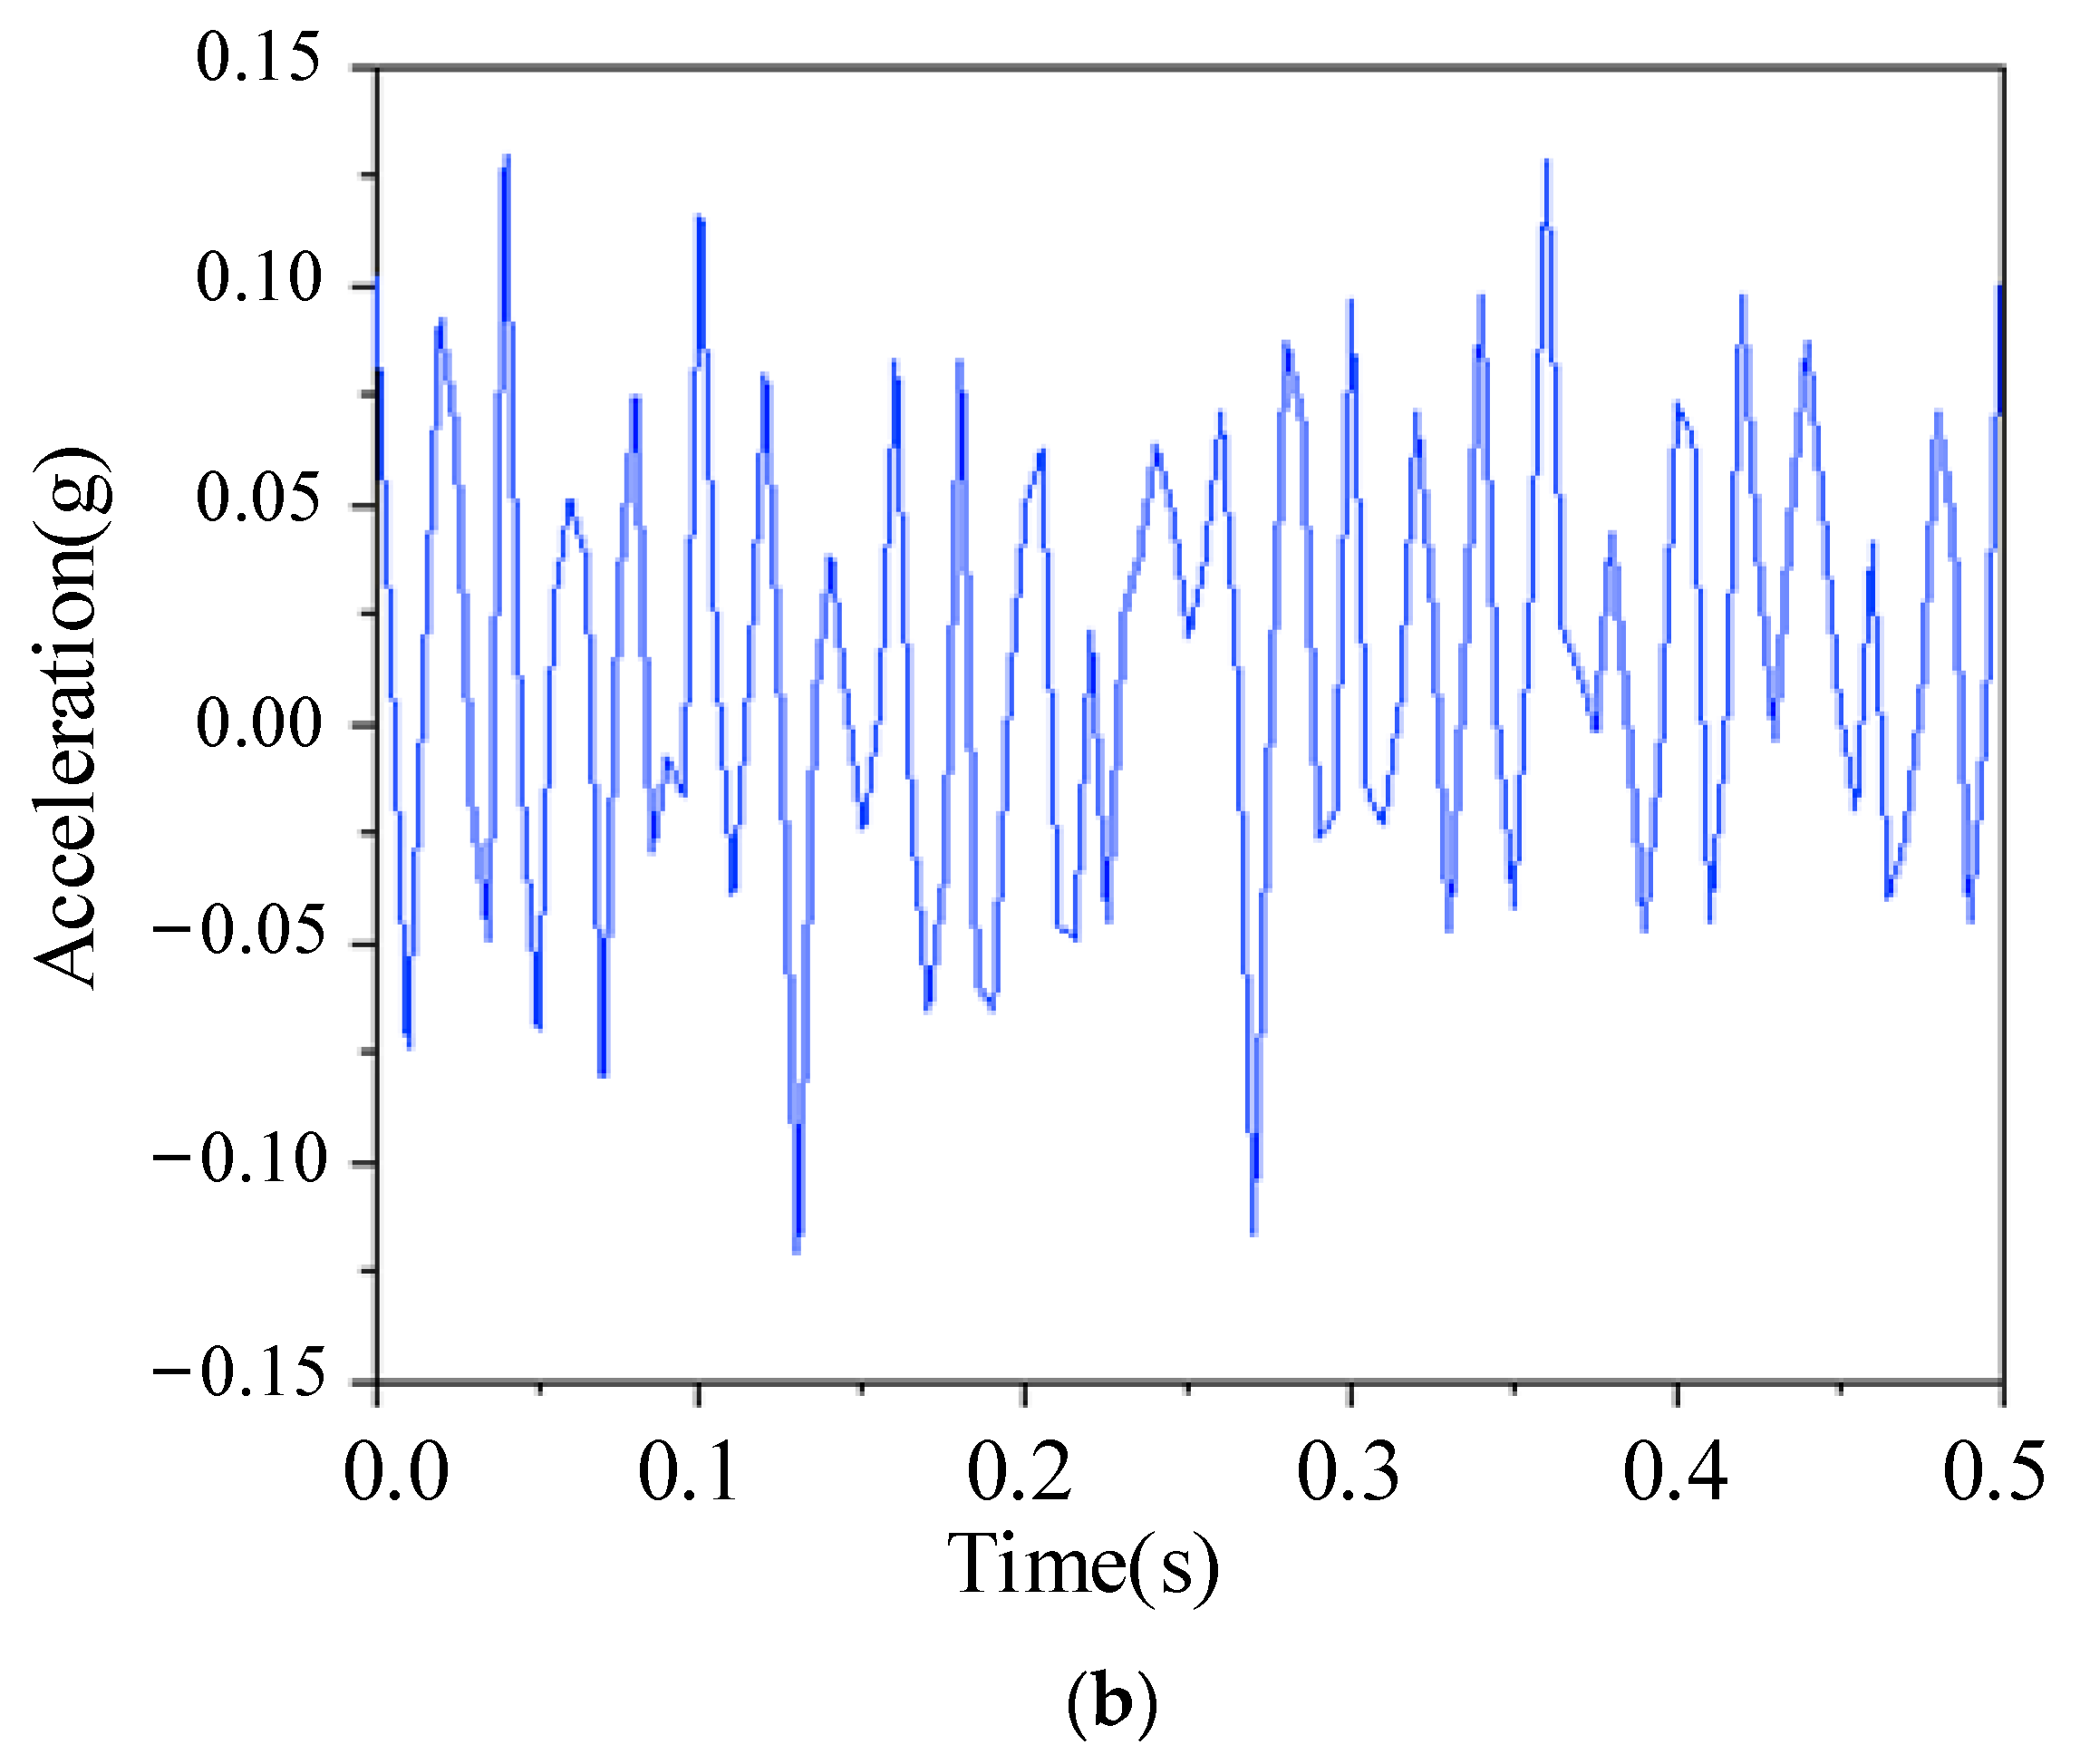
3.2. Experimental Validation of Drill Pipe Acoustic Signals
4. Conclusions
- (1)
- A time-frequency feature extraction method based on ST is proposed for weak acoustic signals from drill pipes. The method involves (a) performing time-frequency analysis of the drill pipe acoustic signal; (b) applying noise reduction using the SVD difference spectrum; and (c) performing S-inverse transformation on the noise-reduced signal, enabling the effective extraction of weak acoustic signal features from the drill pipe under strong background noise.
- (2)
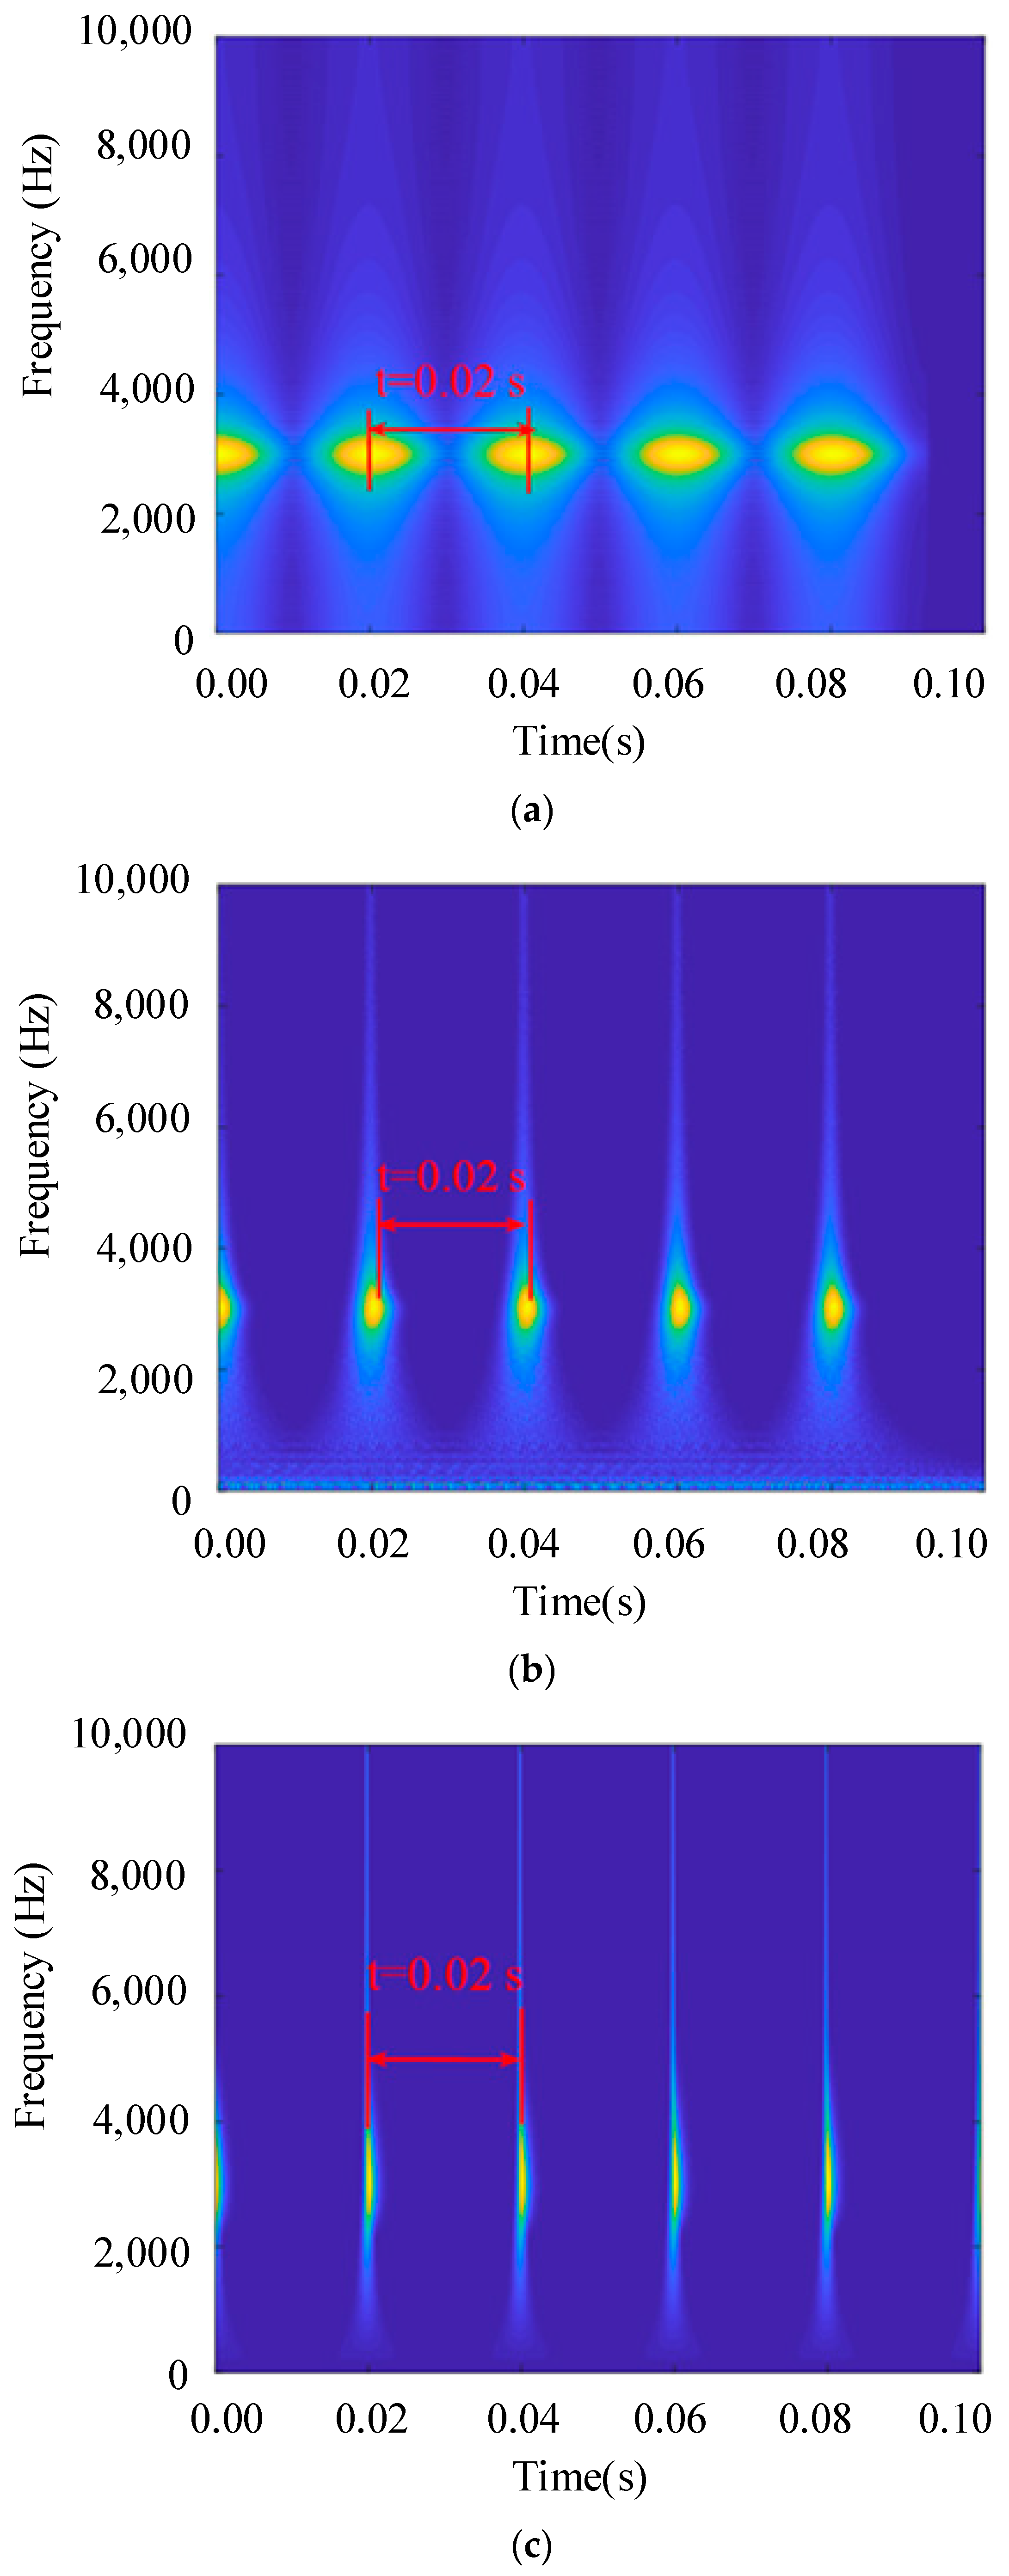
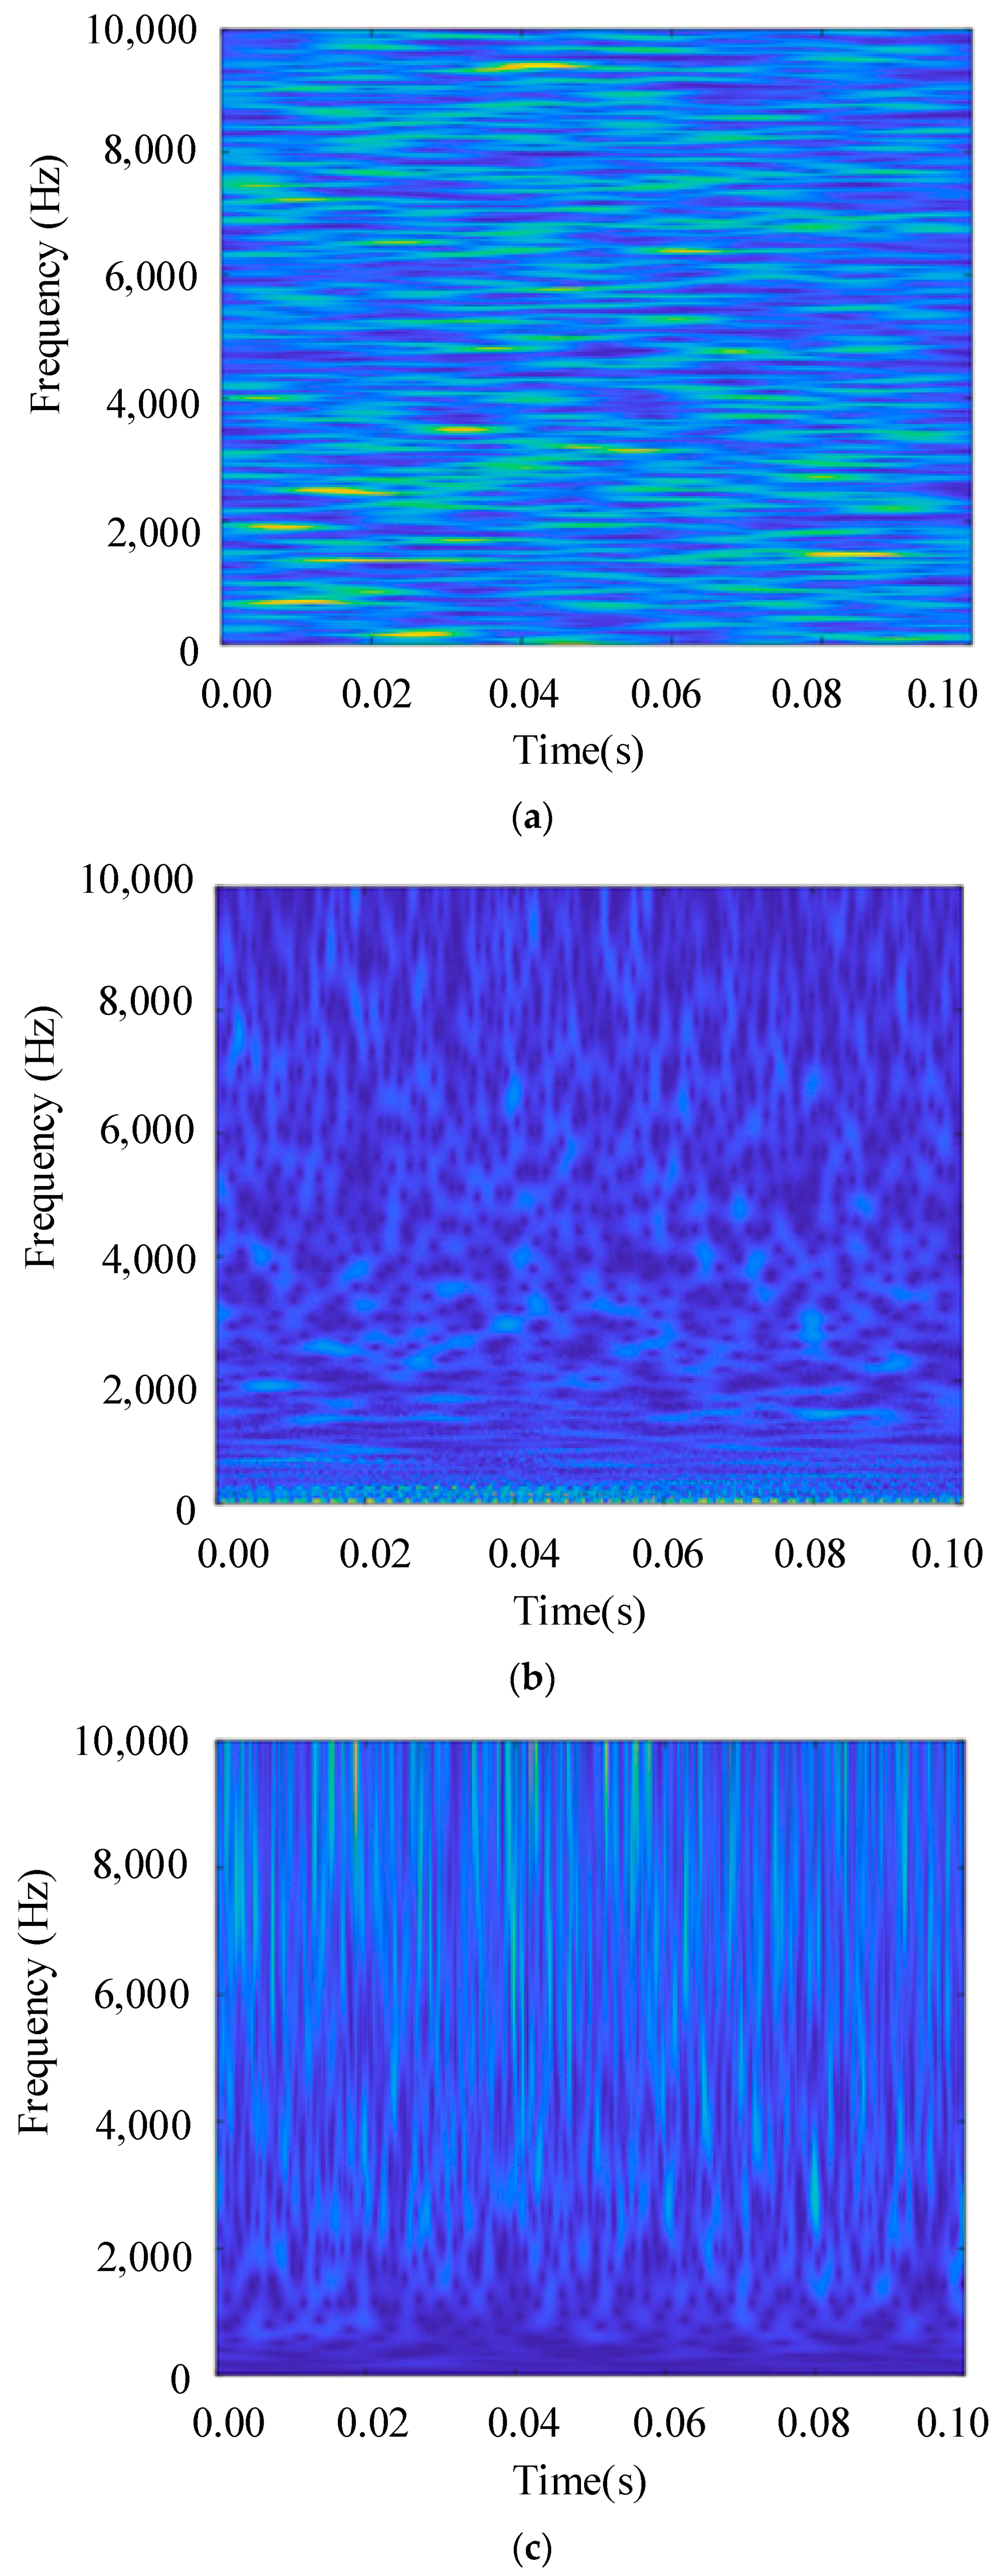
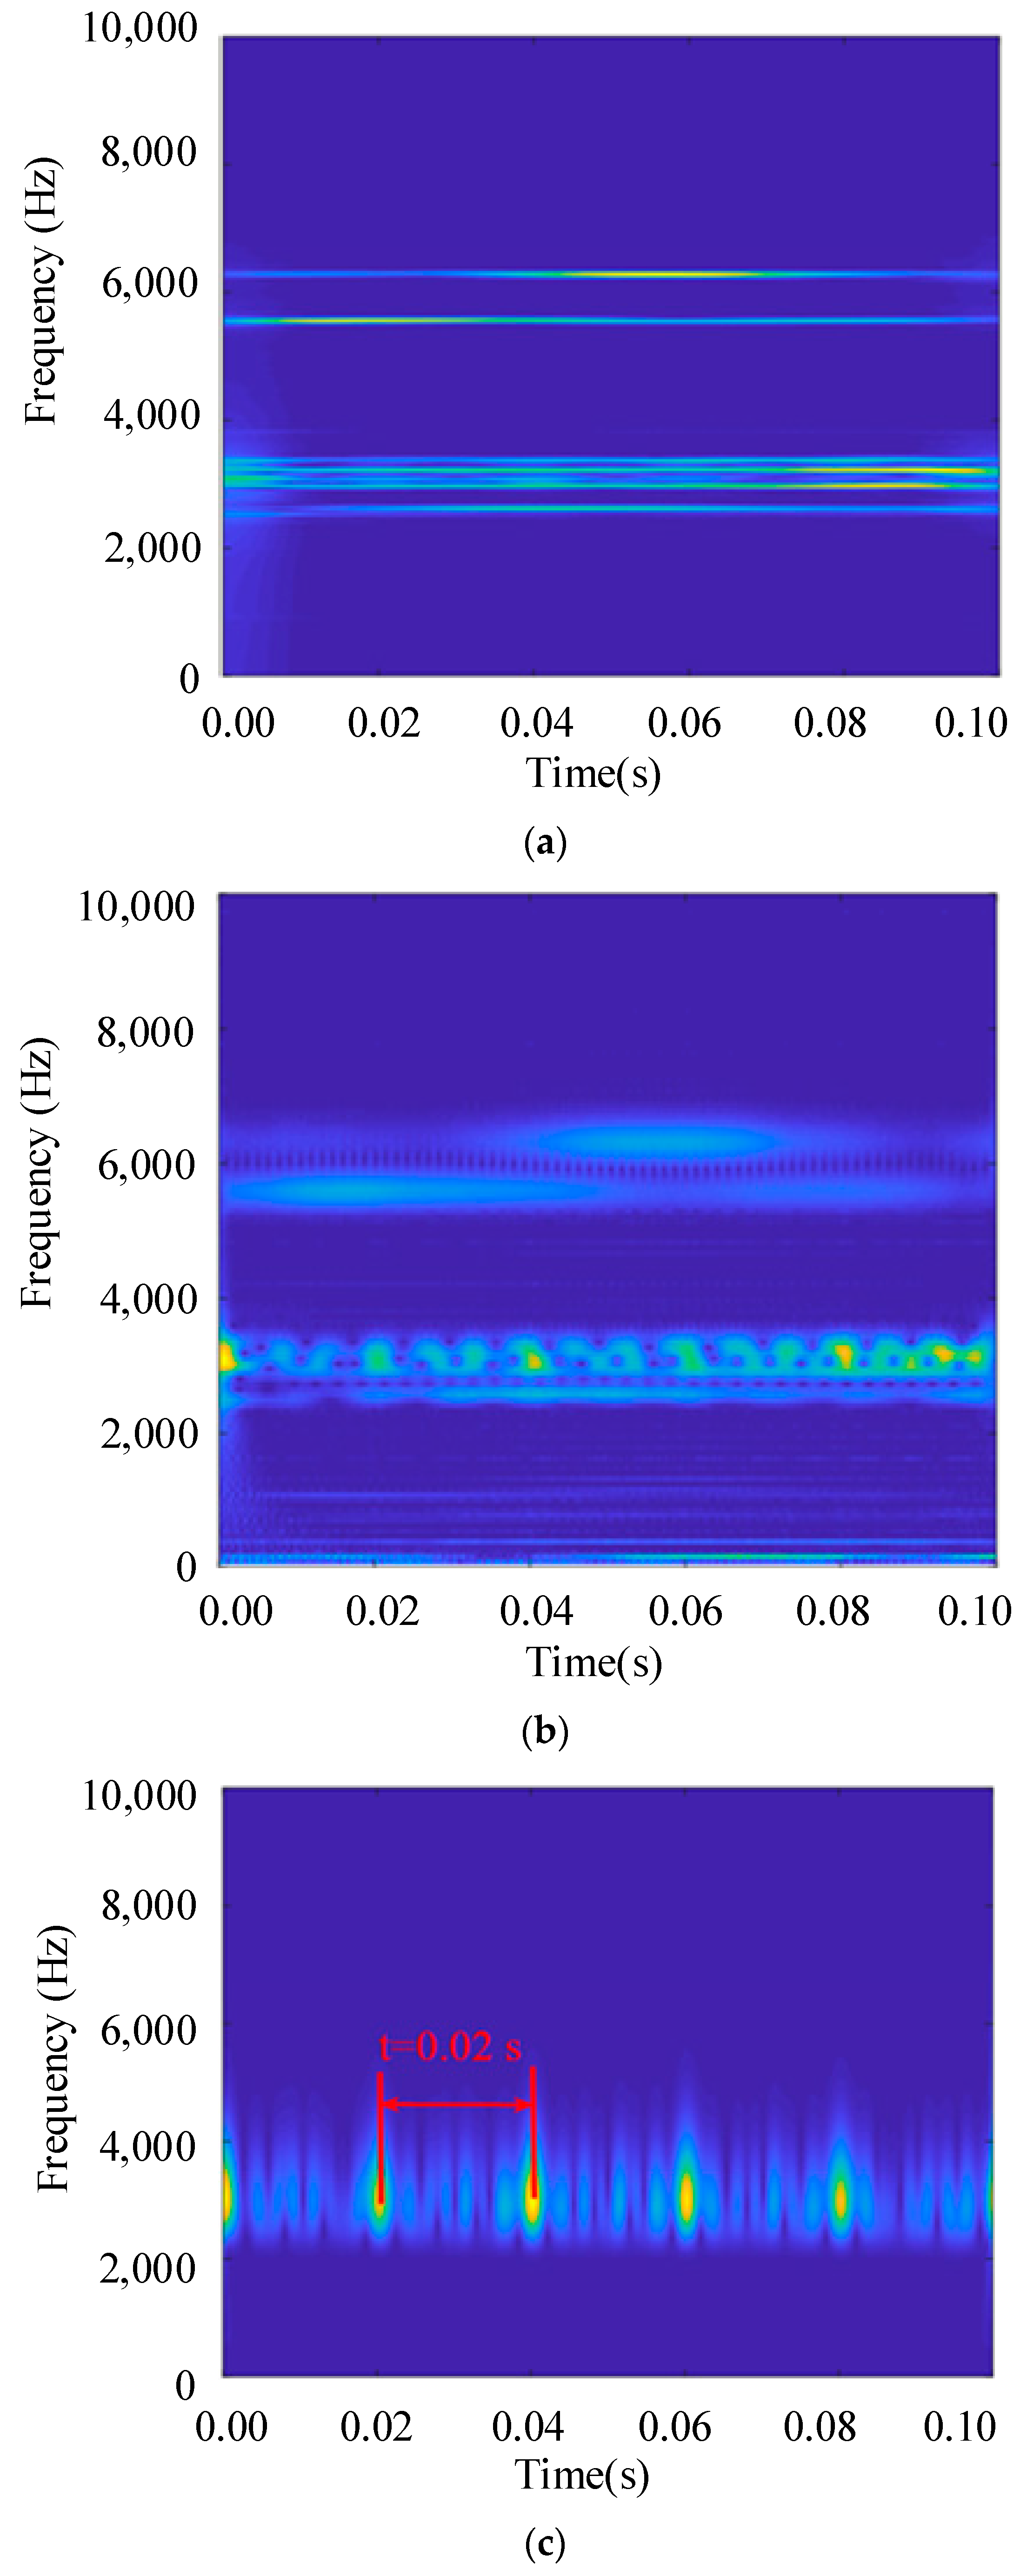
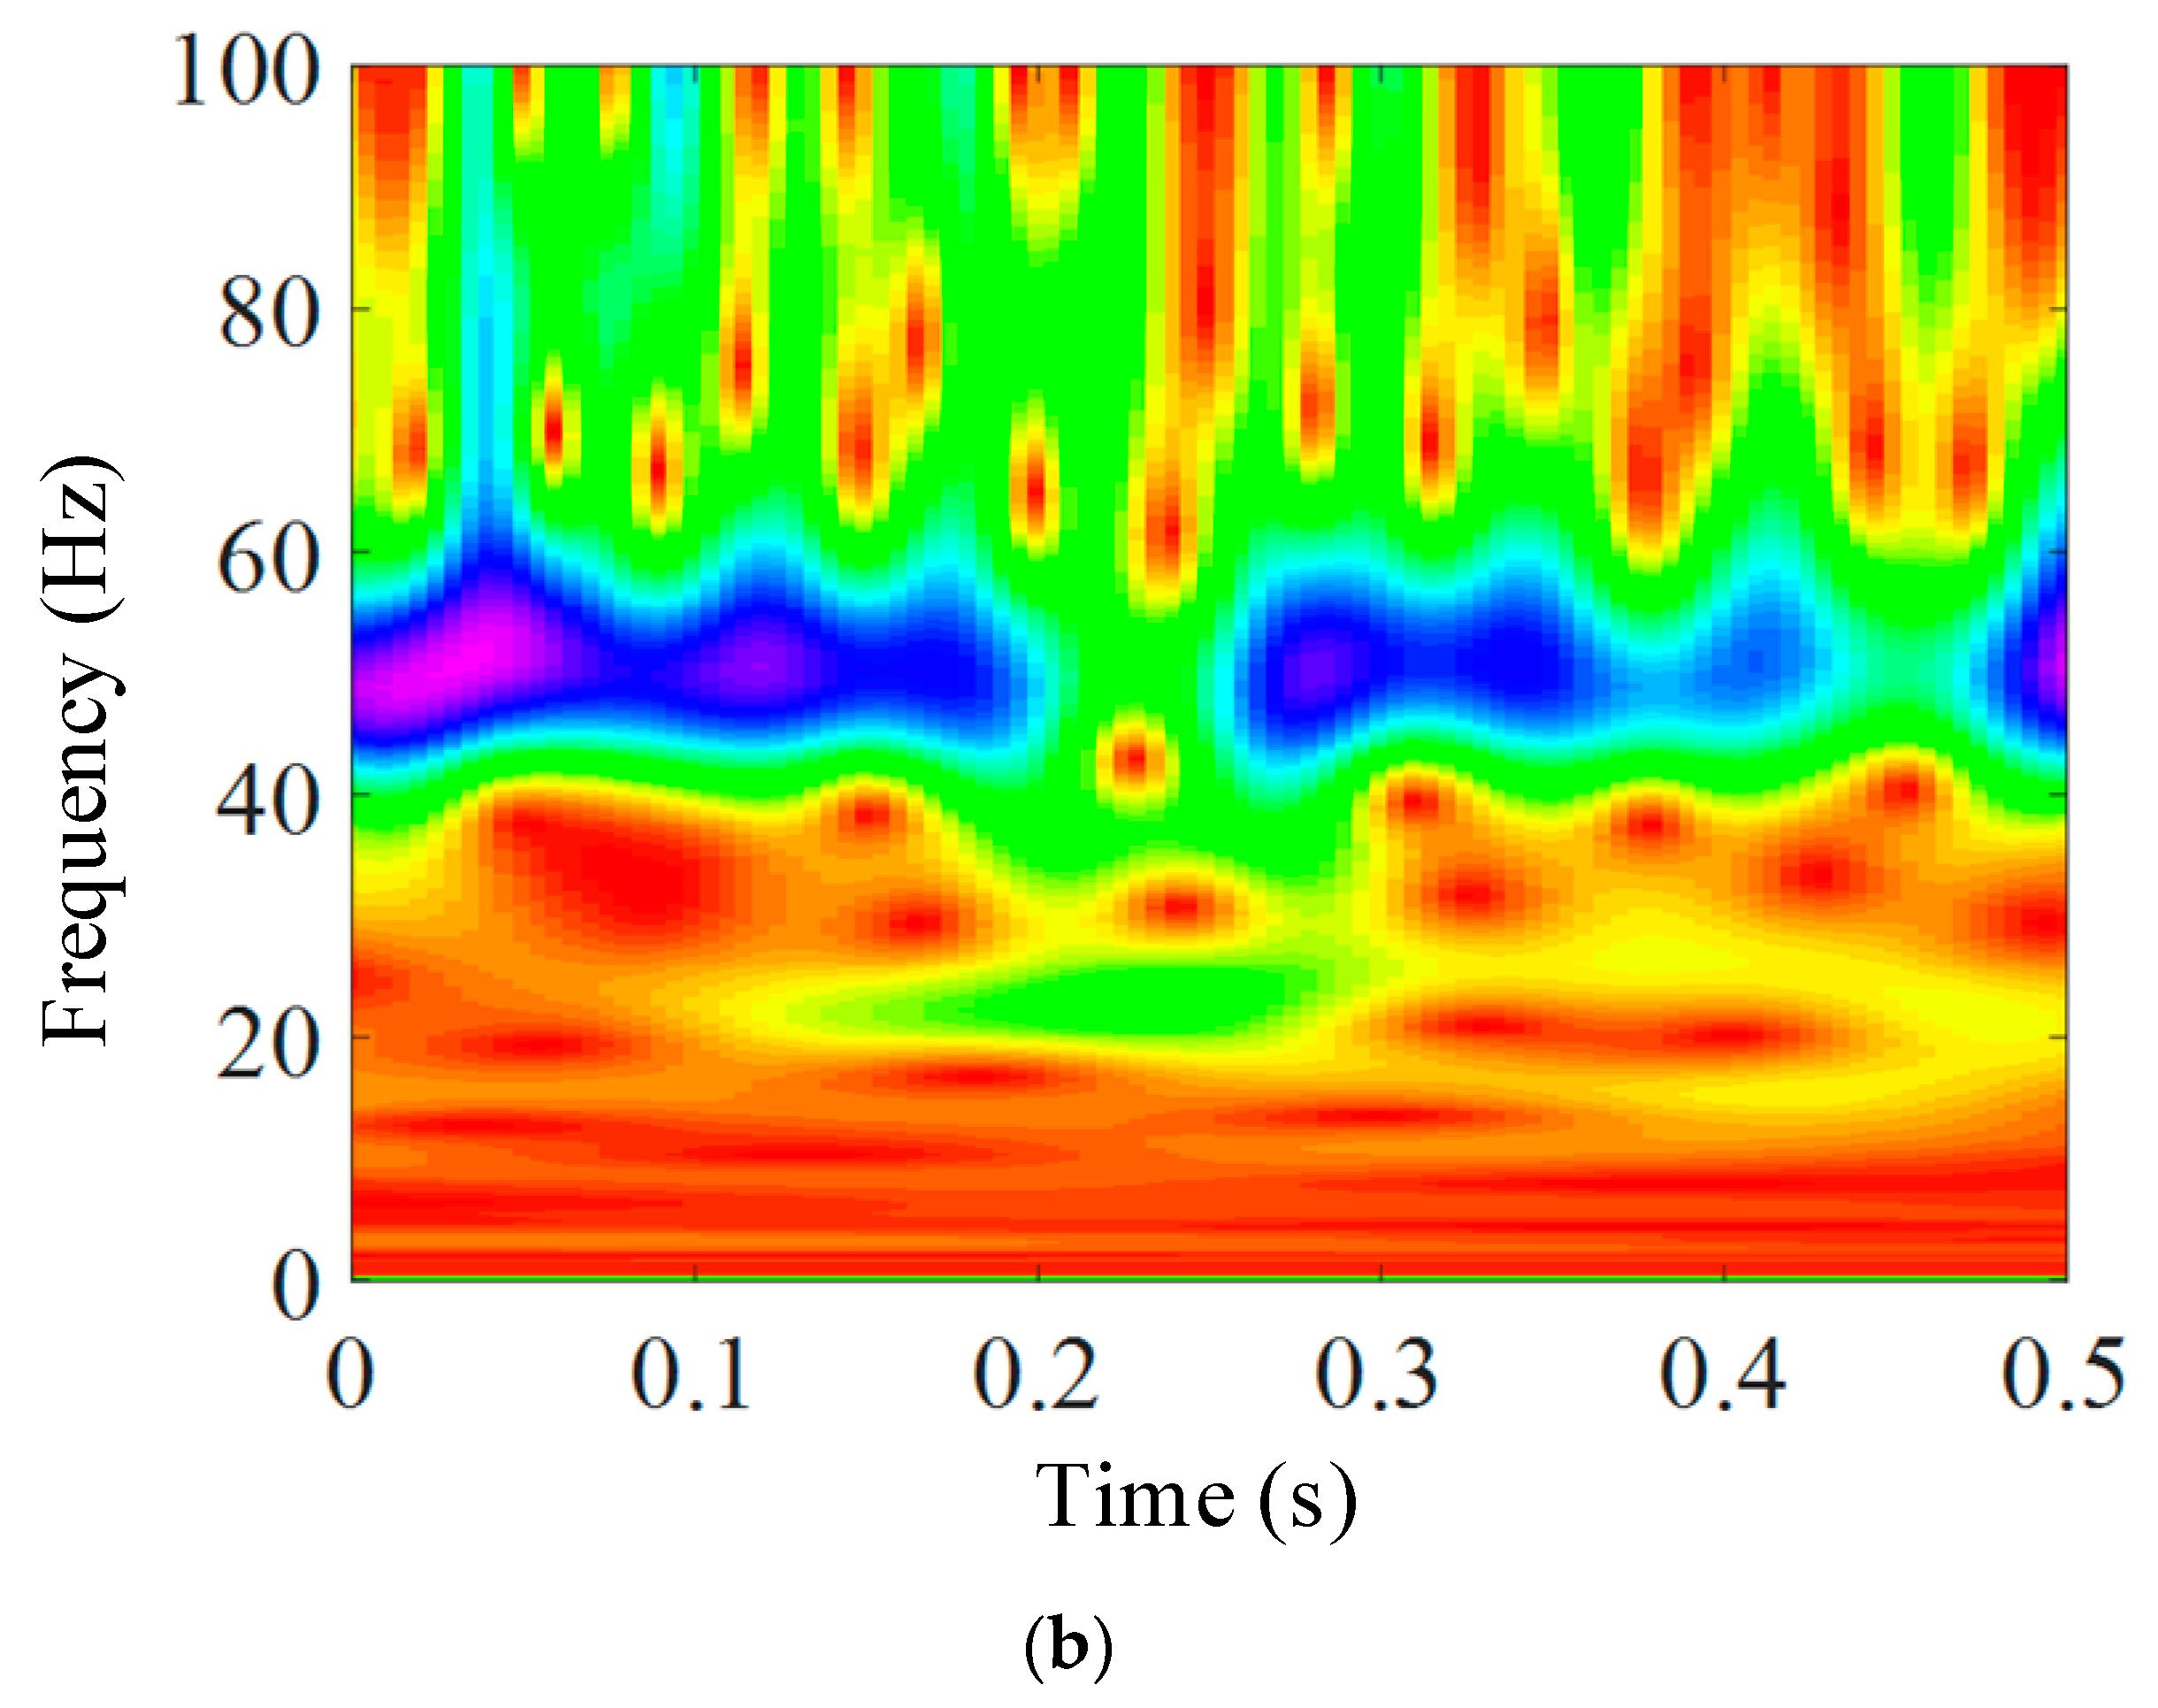
- A comparison of three methods—STFT, WT, and ST—is conducted to identify weak signal features. The simulation and experimental results reveal that (a) STFT fails to identify weak acoustic signal features; (b) WT can identify weak signal features but has poorer time-frequency resolution and aggregation compared to ST; (c) ST significantly improves time-frequency resolution and aggregation and effectively identifies weak acoustic signal features under strong background noise.
- (3)
- The effectiveness of the proposed time-frequency feature extraction method for weak acoustic signals from drill pipes, based on ST, is validated through acoustic transmission tests. The method successfully extracts the most important frequency and amplitude information from the acoustic signals, offering a novel technical approach for feature extraction of weak acoustic signals from a drill pipe.
Author Contributions
Funding
Data Availability Statement
Acknowledgments
Conflicts of Interest
References
- Liu, D.; Jin, Y.; Wan, B.; Peng, Y.; Huang, X. Review and Development Trends of Deep sea Mineral Resource Core Sampling Technology and Equipment. China Mech. Eng. 2014, 25, 3255–3265. [Google Scholar]
- Zhang, H.; Jia, Y.; Liu, X.; Ji, C. Progress in in-situ measurement of sediment mechanicai. Mar. Geol. Front. 2019, 35, 1–9. [Google Scholar]
- Eslami, A.; Heidarie, G.S.; Naghibi, M.H. Developed triangular charts; deltaic CPTu-based soil behavior classification using AUT: CPTu-Geo-Marine Database. Probabilistic Eng. Mech. 2023, 71, 103380. [Google Scholar] [CrossRef]
- Bombasaro, E.; Kasper, T. Evaluation of spatial soil variability in the Pearl River Estuary using CPTU data. Soils Found. 2016, 56, 496–505. [Google Scholar] [CrossRef]
- Yu, X.X.; Liu, S.T.; Pei, H.X. Design of cone penetration test Sdata relay transmission by magnetic communication. Sensors 2022, 22, 4777. [Google Scholar] [CrossRef]
- Li, Y.M.; Shen, Y.H.; Wang, X.Q.; Li, S.; Li, T.; Zhao, Q. Theoretical Studies and Implementation on the Temporary Data Storage Method for Cone Penetration Test. Sensors 2021, 21, 575. [Google Scholar] [CrossRef] [PubMed]
- Chen, Q.; Geng, X.; Wan, B.; Jin, Y.; Luo, B.; Shi, Z. Multi-function In-situ Tester Development Based on Seabed Drill Rig. J. Hunan Univ. Sci. Technol. (Nat. Sci. Ed.) 2017, 32, 10–15. [Google Scholar]
- Qin, M.; Wang, K.; Pan, K.; Sun, T.; Liu, Z. Analysis of signal characteristics from rock drilling based on vibration and acoustic sensor approaches. Appl. Acoust. 2018, 140, 275–282. [Google Scholar] [CrossRef]
- Li, Y.F.; Wang, J.; Shan, Y.G.; Wang, C.; Hu, Y. Measurement and analysis of downhole drill string vibration signal. Appl. Sci. 2021, 11, 11484. [Google Scholar] [CrossRef]
- Kajiwara, I.; Akita, R.; Hosoya, N. Damage detection in pipes based on acoustic excitations using laser-induced plasma. Mech. Syst. Signal Process. 2018, 111, 570–579. [Google Scholar] [CrossRef]
- Liu, X.; Yu, C.; Shi, W.; Qian, X. Load spectrum editing method for automotive ccomponents based on generalised S-transformation. J. Vib. Eng. 2024, 8, 1–8. [Google Scholar]
- Liu, Y.; Li, K.; Chen, P. Fault Diagnosis for Rolling Bearings Based on Synchrosqueezing Wavelet Transform. China Mech. Eng. 2018, 29, 585–590. [Google Scholar]
- Liu, X.; Centeno, J.; Alvarado, J.; Tan, L. One dimensional convolutional neural networks using sparse wavelet decomposition for bearing fault diagnosis. IEEE Access 2022, 10, 86998–87007. [Google Scholar] [CrossRef]
- Antoniadis, I.; Glossiotis, G. Cyclostationary analysis of rolling-element bearing vibration signals. J. Sound Vib. 2001, 248, 829–845. [Google Scholar] [CrossRef]
- Stockwell, R.G.; Mansinha, L.; Lowe, R.P. Localization of the complex spectrum: The S transform. IEEE Trans. Signal Process. 1996, 44, 998–1001. [Google Scholar] [CrossRef]
- Guo, Y.; Jin, X.; Wei, Y.; Wei, Y.; Yang, Y. Fault diagnosis method of rotating machinery using variational mode extraction guided by S transform. J. Vib. Eng. 2022, 35, 1289–1298. [Google Scholar]
- Liu, X.; He, K. A new scheme for extracting fault features of rolling element bearings. Eng. Comput. 2022, 39, 3038–3057. [Google Scholar] [CrossRef]
- Xia, J.; Liu, Y.; Len, Y.; Ge, J. Analysis of Methods of Weak Signal Detection. Noise Vib. Control 2011, 31, 156–161. [Google Scholar]
- Cai, J.; Tang, J.; Lei, L.; Wang, X. Time frequency analysis of magnetoteluric data. Geol. Explor. 2009, 45, 462–467. [Google Scholar]
- Meng, Z.; Liu, Z.; Lyu, M. Fault Diagnosis for Rolling Bearings Based on Improved Singular Value Decomposition and Spectral Kurtosis. China Mech. Eng. 2020, 31, 2420–2428. [Google Scholar]
- Jiang, H.; Chen, J.; Dong, G.; Liu, T.; Chen, G. Study on Hankel matrix-based SVD and its application in rolling element bearing fault diagnosis. Mech. Syst. Signal Process. 2015, 52–53, 338–359. [Google Scholar] [CrossRef]
- Zhao, X.; Ye, B. Similarity of signal processing effect between Hankel matrix-based SVD and wavelet transform and its mechanism analysis. Mech. Syst. Signal Process. 2009, 23, 1062–1075. [Google Scholar] [CrossRef]


Disclaimer/Publisher’s Note: The statements, opinions and data contained in all publications are solely those of the individual author(s) and contributor(s) and not of MDPI and/or the editor(s). MDPI and/or the editor(s) disclaim responsibility for any injury to people or property resulting from any ideas, methods, instructions or products referred to in the content. |
© 2025 by the authors. Licensee MDPI, Basel, Switzerland. This article is an open access article distributed under the terms and conditions of the Creative Commons Attribution (CC BY) license (https://creativecommons.org/licenses/by/4.0/).
Share and Cite
Xu, J.; Wan, B.; Quan, W.; Xi, Y.; Tian, X. Time-Frequency Feature Extraction Method for Weak Acoustic Signals from Drill Pipe of Seafloor Drill. J. Mar. Sci. Eng. 2025, 13, 740. https://doi.org/10.3390/jmse13040740
Xu J, Wan B, Quan W, Xi Y, Tian X. Time-Frequency Feature Extraction Method for Weak Acoustic Signals from Drill Pipe of Seafloor Drill. Journal of Marine Science and Engineering. 2025; 13(4):740. https://doi.org/10.3390/jmse13040740
Chicago/Turabian StyleXu, Jingwei, Buyan Wan, Weicai Quan, Yi Xi, and Xianglin Tian. 2025. "Time-Frequency Feature Extraction Method for Weak Acoustic Signals from Drill Pipe of Seafloor Drill" Journal of Marine Science and Engineering 13, no. 4: 740. https://doi.org/10.3390/jmse13040740
APA StyleXu, J., Wan, B., Quan, W., Xi, Y., & Tian, X. (2025). Time-Frequency Feature Extraction Method for Weak Acoustic Signals from Drill Pipe of Seafloor Drill. Journal of Marine Science and Engineering, 13(4), 740. https://doi.org/10.3390/jmse13040740