
Baseline Assessment of Black Sea Food Web Integrity Using a Zooplankton-Based Approach Under the Marine Strategy Framework Directive


Abstract
1. Introduction
- Microzooplankton (20–200 µm): Small protozoans and early developmental stages of larger zooplankton;
- Mesozooplankton (200–2000 µm): Medium-sized organisms such as copepods, cladocerans, and meroplanktonic larvae;
- Macroplankton (>2000 µm): Larger gelatinous organisms.
2. Materials and Methods
2.1. Description of the Study Area
- ▪
- Transitional waters: Northern marine waters influenced by the Danube, at depths ≥30 m;
- ▪
- Coastal waters: Central to southern marine waters (Portița–Vama Veche) from the baseline to 30 m isobaths;
- ▪
- Marine waters: Inner and outer shelf waters (30–100 m isobaths);
- ▪
- Offshore waters at depths >100 m.
2.2. Zooplankton Sampling and Analysis
2.3. Zooplankton Indicators

| Criteria Code | Type | Criteria | Indicators and Threshold Values | Indicator Objectives |
|---|---|---|---|---|
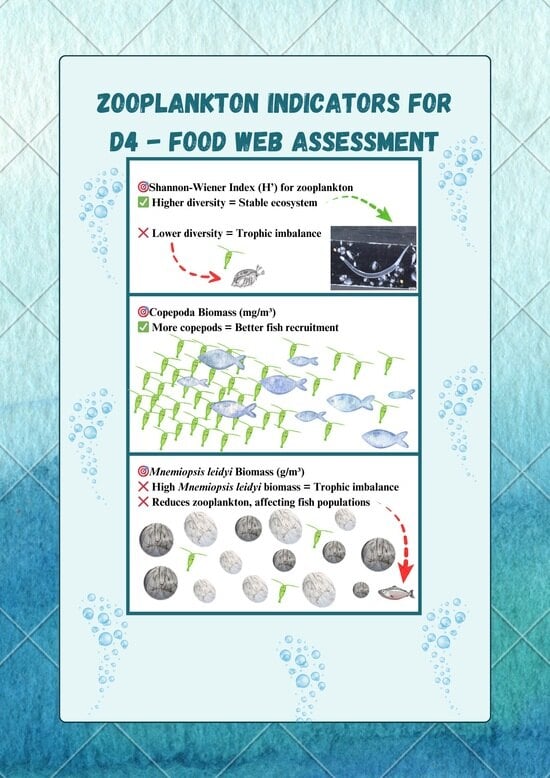
| D4C1 | Primary | The diversity (species composition and relative abundance) of the trophic guild is not adversely affected due to anthropogenic pressures. | Shannon Wiener (H’) for mesozooplankton biomass (mg.m−3) >3—Transitional and coastal waters, >2—Marine waters and offshore [59] | High values of this index indicate greater species diversity or a more even distribution of species, while low values indicate a poor species composition. |
| D4C2 | Primary | The balance of total abundance between trophic guilds is not adversely affected due to anthropogenic pressures. | Copepod biomass (mg.m−3) >45—Transitional >65—Coastal >45—Marine and offshore [39,58] | The assessment of copepod biomass is important for determining the availability of food resources for fish. Copepods are the most important group in the zooplankton community as they serve as a food source for fish larvae and commercially important fish species. Fish body condition and weight have been reported to be positively correlated with copepod abundance/biomass. |
| Mnemiopsis leidiy biomass ≤4 g.m−3 for all MRUs [57,58] | The increase in the biomass of the species M. leidyi directly affects the size and composition of the zooplankton population and, indirectly, plankton-feeding fish and primary producers in the food web. | |||
| D4C3 | Secondary | The size distribution of individuals across the trophic guild is not adversely affected due to anthropogenic pressures. | N/A | – |
| D4C4 | Secondary | The productivity of the trophic guild is not adversely affected due to anthropogenic pressures. | N/A | – |
2.4. Data Analysis
3. Results
3.1. Mesozooplankton’s Qualitative and Quantitative Structure
3.2. Analysis of Copepoda from 2018 to 2023
3.3. Analysis of M. leidyi from 2018 to 2023
3.4. Zooplankton Indicators Assessment
4. Discussion
4.1. Mesozooplankton’s Qualitative and Quantitative Structure
4.2. Analysis of Copepoda from 2018 to 2023
4.3. Analysis of M. leidyi from 2018 to 2023
4.4. Zooplankton Indicators Assessment
5. Conclusions
Supplementary Materials
Author Contributions
Funding
Data Availability Statement
Conflicts of Interest
Abbreviations
| MSFD | Marine Strategy Framework Directive |
| MRU | Marine Reporting Units |
| GES | Good Environmental Status |
| Non-GES | Not in Good Environmental Status |
| WoRMS | World Register of Marine Species |
| SIMPER | Similarity Percentage |
| ANOVA | Analysis of Variance |
| ANOSIM | Analysis of Similarity |
| GIS | Geographic Information System |
References
- Yu, I.S. The Black Sea: Ecology and Oceanography. Biology of Inland Waters; Backhuys Publishers: Leiden, The Netherlands, 2002. [Google Scholar]
- Bakan, G.; Büyükgüngör, H. The Black Sea. Mar. Pollut. Bull. 2000, 41, 24–43. [Google Scholar]
- Mihailov, M.-E.; Ştefan, S.; Diaconu, V.; Lazar, L. Longterm Variability of the Water Mass Structure on the Romanian Black Sea Shelf. Rom. Rep. Phys. 2016, 68, 377–392. [Google Scholar]
- Lazar, L.; Vlas, O.; Pantea, E.; Boicenco, L.; Marin, O.; Abaza, V.; Filimon, A.; Bisinicu, E. Black Sea Eutrophication Comparative Analysis of Intensity between Coastal and Offshore Waters. Sustainability 2024, 16, 5146. [Google Scholar] [CrossRef]
- Bisinicu, E.; Abaza, V.; Boicenco, L.; Adrian, F.; Harcota, G.-E.; Marin, O.; Oros, A.; Pantea, E.; Spinu, A.; Timofte, F.; et al. Spatial Cumulative Assessment of Impact Risk-Implementing Ecosystem-Based Management for Enhanced Sustainability and Biodiversity in the Black Sea. Sustainability 2024, 16, 4449. [Google Scholar] [CrossRef]
- Zaitsev, Y.P.; Alexandrov, B.G.; Berlinsky, N.A.; Zenetos, A. Seas Around Europe: The Black Sea: An Oxygen-Poor Sea. Europe’s Biodiversity: Biogeographical Regions and Seas; European Environment Agency: Copenhagen, Denmark, 2002. [Google Scholar]
- Cociasu, A.; Varga, L.; Lazar, L.; Vasiliu, D. Recent Data Concerning the Evolution of the Eutrophication Level Indicators in Romanian Seawater. Int. J. Electr. Power Energy Syst. 2009, 10, 701–730. [Google Scholar]
- Daskalov, G.M.; Boicenco, L.; Grishin, A.N.; Lazar, L.; Mihneva, V.; Shlyakhov, V.A.; Zengin, M. Architecture of Collapse: Regime Shift and Recovery in an Hierarchically Structured Marine Ecosystem. Glob. Change Biol. 2017, 23, 1486–1498. [Google Scholar] [CrossRef]
- Lazar, L.; Spanu, A.; Boicenco, L.; Oros, A.; Damir, N.; Bisinicu, E.; Abaza, V.; Filimon, A.; Harcota, G.; Marin, O.; et al. Methodology for Prioritizing Marine Environmental Pressures under Various Management Scenarios in the Black Sea. Front. Mar. Sci. 2024, 11, 1388877. [Google Scholar] [CrossRef]
- Daskalov, G.M.; Grishin, A.N.; Rodionov, S.; Mihneva, V. Trophic Cascades Triggered by Overfishing Reveal Possible Mechanisms of Ecosystem Regime Shifts. Rib. Gos. Ukr. 2008, 5, 36–45. [Google Scholar]
- Llope, M.; Daskalov, G.M.; Rouyer, T.A.; Mihneva, V.; Chan, K.S.; Grishin, A.N.; Stenseth, N.C.H.R. Overfishing of Top Predators Eroded the Resilience of the Black Sea System Regardless of the Climate and Anthropogenic Conditions. Glob. Change Biol. 2011, 17, 1251–1265. [Google Scholar] [CrossRef]
- Vasiliu, D.; Boicenco, L.; Gomoiu, M.T.; Lazar, L.; Mihailov, M.-E. Temporal Variation of Surface Chlorophyll a in the Romanian Near-Shore Waters. Mediterr. Mar. Sci. 2012, 13, 213–226. [Google Scholar] [CrossRef]
- Akoglu, E.; Salihoglu, B.; Libralato, S.; Oguz, T.; Solidoro, C. An Indicator-Based Evaluation of Black Sea Food Web Dynamics during 1960–2000. J. Mar. Syst. 2014, 134, 113–125. [Google Scholar] [CrossRef]
- du Pontavice, H.; Gascuel, D.; Kay, S.; Cheung, W. Climate-Induced Changes in Ocean Productivity and Food-Web Functioning Are Projected to Markedly Affect European Fisheries Catch. Mar. Ecol. Prog. Ser. 2023, 713, 21–37. [Google Scholar] [CrossRef]
- Smith, W.; Steinberg, D.; Bronk, D.; Tang, K. Marine Plankton Food Webs and Climate Change; William Mary VIMS: Gloucester Point, VA, USA, 2008; pp. 1–4. [Google Scholar]
- Lazar, L.; Boicenco, L.; Pantea, E.; Timofte, F.; Vlas, O.; Bișinicu, E. Modeling Dynamic Processes in the Black Sea Pelagic Habitat—Causal Connections between Abiotic and Biotic Factors in Two Climate Change Scenarios. Sustainability 2024, 16, 1849. [Google Scholar] [CrossRef]
- Daskalov, G.M. Overfishing Drives trophic Cascade in the Black Sea. Mar. Ecol. Prog. Ser. 2002, 225, 53–63. [Google Scholar] [CrossRef]
- Commission Decision (EU) 2017/848 of 17 May 2017 Laying down Criteria and Methodological Standards on Good Environmental Status of Marine Waters and Specifications and Standardised Methods for Monitoring and Assessment, and Repealing Decision 2010/477/EU. Off. J. Eur. Union 2017, 125, 43–74. Available online: https://eur-lex.europa.eu/eli/dec/2017/848/oj/eng (accessed on 25 March 2025).
- Loizidou, X.I.; Loizides, M.I.; Orthodoxou, D.L. Marine Strategy Framework Directive: Defining Joint Monitoring Opportunities for the Eastern Mediterranean and the Black Sea, through Dedicated Decision Making Workshops and Innovative Policy Tools. Mar. Policy 2016, 67, 76–82. [Google Scholar] [CrossRef]
- EUR 31131 EN; Marine Strategy Framework Directiv: Thresholds for MSFD Criteria: State of Play and next Steps. Publications Office of the European Union: Luxembourg, 2022. [CrossRef]
- Borja, Á. The European Water Framework Directive: A Challenge for Nearshore, Coastal and Continental Shelf Research. Cont. Shelf Res. 2005, 25, 1768–1783. [Google Scholar] [CrossRef]
- Borja, Á.; Elliott, M.; Carstensen, J.; Heiskanen, A.-S.; van de Bund, W. Marine Management—Towards an Integrated Implementation of the European Marine Strategy Framework and the Water Framework Directives. Mar. Pollut. Bull. 2010, 60, 2175–2186. [Google Scholar] [CrossRef]
- Piet, G.; Grundlehner, A.; Jongbloed, R.; Tamis, J.; de Vries, P. SCAIRM: A Spatial Cumulative Assessment of Impact Risk for Management. Ecol. Indic. 2023, 157, 111157. [Google Scholar] [CrossRef]
- Lomartire, S.; Marques, J.C.; Gonçalves, A.M.M. The Key Role of Zooplankton in Ecosystem Services: A Perspective of Interaction between Zooplankton and Fish Recruitment. Ecol. Indic. 2021, 129, 107867. [Google Scholar]
- Richardson, A.J. In Hot Water: Zooplankton and Climate Change. Int. J. Mol. Sci. 2008, 65, 279–295. [Google Scholar] [CrossRef]
- Bișinicu, E.; Boicenco, L.; Pantea, E.; Timofte, F.; Lazăr, L.; Vlas, O. Qualitative Model of the Causal Interactions between Phytoplankton, Zooplankton, and Environmental Factors in the Romanian Black Sea. Phycology 2024, 4, 168–189. [Google Scholar] [CrossRef]
- Zhao, J.; Ramin, M.; Cheng, V.; Arhonditsis, G.B. Plankton Community Patterns across a Trophic Gradient: The Role of Zooplankton Functional Groups. Ecol. Model. 2008, 213, 417–436. [Google Scholar] [CrossRef]
- Jakhar, P. Role of Phytoplankton and Zooplankton as Health Indicators of Aquatic Ecosystem: A Review. Int. J. Innov. Res. Stud. 2013, 12, 489–500. [Google Scholar]
- Bișinicu, E.; Lazăr, L.; Timofte, F. Dynamics of Zooplankton along the Romanian Black Sea Coastline: Temporal Variation, Community Structure, and Environmental Drivers. Diversity 2023, 15, 1024. [Google Scholar] [CrossRef]
- Niette, V. Huliselan The Role of Zooplankton Predator, Chaetognaths (Sagitta spp.) in Baguala Bay Waters, Ambon Island. J. Coast. Dev. 2002, 6, 9–21. [Google Scholar]
- Daskalov, G.M. Long-Term Changes in Fish Abundance and Environmental Indices in the Black Sea. Mar. Ecol. Prog. Ser. 2003, 255, 259–270. [Google Scholar] [CrossRef]
- Heneghan, R.F.; Everett, J.D.; Blanchard, J.L.; Sykes, P.; Richardson, A.J. Climate-Driven Zooplankton Shifts Cause Large-Scale Declines in Food Quality for Fish. Nat. Clim. Change 2023, 13, 470–477. [Google Scholar] [CrossRef]
- Shiganova, T.A.; Shirshov, P.P. Invasion of the Black Sea by the Ctenophore Mnemiopsis Leidyi and Recent Changes in Pelagic Community Structure. Fish. Ocean. 1998, 7, 305–310. [Google Scholar] [CrossRef]
- Shiganova, T.A.; Mikaelyan, A.S.; Moncheva, S.; Stefanova, K.; Chasovnikov, V.K.; Mosharov, S.A.; Mosharova, I.N.; Slabakova, N.; Mavrodieva, R.; Stefanova, E.; et al. Effect of Invasive Ctenophores Mnemiopsis Leidyi and Beroe Ovata on Low Trophic Webs of the Black Sea Ecosystem. Mar. Pollut. Bull. 2019, 141, 434–447. [Google Scholar] [CrossRef]
- Shiganova, T.A.; Sommer, U.; Javidpour, J.; Molinero, J.C.; Malej, A.; Kazmin, A.S.; Isinibilir, M.; Christou, E.; Siokou- Frangou, I.; Marambio, M.; et al. Patterns of Invasive Ctenophore Mnemiopsis Leidyi Distribution and Variability in Different Recipient Environments of the Eurasian Seas: A Review. Mar. Environ. Res. 2019, 152, 104791. [Google Scholar] [PubMed]
- Daskalov, G.; Shlyakhov, V. Influence of Gelatinous Zooplankton on Fish Stocks in the Black Sea: Analysis of Biological Time-Series. Mar. Ecol. 2007, 6, 5–24. Available online: https://www.researchgate.net/publication/37615302 (accessed on 20 March 2025).
- Muñoz-Colmenares, M.E.; Soria, J.M.; Vicente, E. Can Zooplankton Species Be Used as Indicators of Trophic Status and Ecological Potential of Reservoirs? Aquat. Ecol. 2021, 55, 1143–1156. [Google Scholar] [CrossRef]
- Jeppesen, E.; Nõges, P.; Davidson, T.A.; Haberman, J.; Nõges, T.; Blank, K.; Lauridsen, T.L.; Søndergaard, M.; Sayer, C.; Laugaste, R.; et al. Zooplankton as Indicators in Lakes: A Scientific-Based Plea for Including Zooplankton in the Ecological Quality Assessment of Lakes According to the European Water Framework Directive (WFD). Hydrobiologia 2011, 676, 279–297. [Google Scholar] [CrossRef]
- Bisinicu, E.; Lazar, L. Exploring Mesozooplankton Insights by Assessing the Ecological Status of Black Sea Waters Under the Marine Strategy Framework Directive. Oceans 2024, 5, 923–950. [Google Scholar] [CrossRef]
- Bisinicu, E.; Harcota, G.E.; Lazar, L. Interactions between Environmental Factors and the Mesozooplankton Community from the Romanian Black Sea Waters. Turk. J. Zool. 2023, 47, 202–215. [Google Scholar] [CrossRef]
- Jorgensen, B.B.; Richardson, K. Eutrophication in Coastal Marine Ecosystems; American Geophysical Union: Washington, DC, USA, 1996; ISBN 0875902669. [Google Scholar]
- Hays, G.; Richardson, A.; Robinson, C. Climate Change and Marine Plankton. Trends Ecol. Evol. 2005, 20, 337–344. [Google Scholar] [CrossRef]
- Harris, R.; Wiebe, P.; Lenz, J.; Skjoldal, H.R.; Huntley, M. ICES Zooplankton Methodology Manual; Elsevier: Amsterdam, The Netherlands, 2000. [Google Scholar]
- Bisinicu, E.; Timofte, F.; Tabarcea, C.; Harcota, G.E.; Lazar, L. Spatio-Temporal Distribution of Mesozooplankton Community along Romanian Shelf during 2013–2016. J. Environ. Prot. Ecol. 2019, 20, 571–578. [Google Scholar]
- Bisinicu, E.; Totoiu, A.; Timofte, F.; Harcota, G.-E.; Oprea, L. Inter-Relations Between The Mesozooplankton Community And Sprattus Sprattus From The Romanian Black Sea Area. Sci. Pap. Ser. D Anim. Sci. 2020, 63, 539–544. [Google Scholar]
- Bișinicu, E.N.V.; Țoțoiu, A.H.G.E.; Țiganov, G.C.V. Mesozooplankton in the Diet of the Black Sea Shad Alosa Tanaica (Grim, 1901) (Clupeiformes: Clupeidae) from the Northern Part of the Romanian Black Sea Waters. Acta Zool. Bulg. 2022, 74, 417–424. [Google Scholar]
- Bișinicu, E.; Harcotă, G.E.; Lazăr, L.; Niță, V.; Țoțoiu, A.; Țiganov, G. Fish Abundance and Mesozooplankton Resource: A Study on Sprattus Sprattus (Linnaeus, 1758) (Actinopterygii: Clupeidae) in the Romanian Black Sea Waters. Acta Zool. Bulg. 2024, 76, 215–224. [Google Scholar]
- Boicenco, L.; Lazăr, L.; Bișinicu, E.; Vlas, O.; Harcotă, G.; Pantea, E.; Tabarcea, C.; Timofte, F. Ecological Status of Romanian Black Sea Waters According to the Planktonic Communities. Cercet. Mar. Rech. Mar. 2019, 49, 34–56. [Google Scholar]
- Lazar, L.; Boicenco, L.; Moncheva, S. (Eds.) Impact of the Rivers on the Black Sea Ecosystem; CD Press: Constanta, Romania, 2021. [Google Scholar]
- Shapiro, G.I. Black Sea Circulation. Encycl. Ocean. Sci. 2009, 1, 318–331. [Google Scholar]
- Mihailov, M.E.; Nicolaev, S.; Buga, L.; Jelescu, S.; Boicenco, L.; Spinu, A.; Ganea, G. Identification of the Romanian Black Sea Waters Types—Assessment Related to the Marine Strategy Framework Directive Implementation. Surv. Geol. Ecol. Manag. 2014, 623–630. [Google Scholar] [CrossRef]
- Alexandrov, B.; Arashkevich, E.; Gubanova, A.; Korshenko, A. Manual for Mesozooplankton Sampling and Analysis in the BlackSea Monitoring; Black Sea Commission: Istanbul, Turkey, 2014. [Google Scholar]
- Mordukhay-Boltovskoy, F.D. (Ed.) Identification Manual on the Fauna of the Black and Azov Seas; Naukova Dumka: Kiev, Ukraine, 1968. [Google Scholar]
- Mordukhay-Boltovskoy, F.D. (Ed.) Guide of the Black Sea and the Sea of Azov Fauna; Naukova Dumka: Kiev, Ukraine, 1972. [Google Scholar]
- WoRMS Editorial Board World Register of Marine Species. Available online: https://www.marinespecies.org/ (accessed on 25 March 2025).
- Petipa, T.S. On the Mean Weight of the Principle Forms of Zooplankton in the Black Sea. Sevast. Biol. Stn. 1957, 9, 39–57. [Google Scholar]
- Shiganova, T.A.; Anninsky, B.; Finenko, G.A.; Kamburska, L.; Mutlu, E.; Mihneva, V.; Stefanova, K. Black Sea Monitoring Guidelines-Macroplankton; Seredniak: Dnipro, Ukraine, 2020; ISBN 9786178010447. [Google Scholar]
- Boicenco, L.; Abaza, V.; Anton, E.; Bișinicu, E.; Buga, L.; Coatu, V.; Damir, N.; Diaconeasa, D.; Dumitrache, C.; Filimon, A.; et al. Studiu Privind Elaborarea Raportului Privind Starea Ecologică a Eco-943 Sistemului Marin Marea Neagră Conform Cerinţelor Art. 17 Ale Directivei Cadru Strategia 944 Pentru Mediul Marin (2008/56/EC). 2018. Available online: https://www.mmediu.gov.ro/app/webroot/uploads/files/STUDIU%20MSFD%20V1.9.pdf (accessed on 25 March 2025).
- Lazăr, L. (Ed.) ANEMONE Deliverable 2.3. Black Sea State of Environment Based on ANEMONE Joint Cruise; Ed. Cd Press: Constanta, Romania, 2021. [Google Scholar]
- Clarke, R.; Gorley, R.; Somerfield, P.J.; Warwick, R. Change in Marine Communities: An Approach to Statistical Analysis, 3rd ed.; PRIMER-E: Plymouth, UK, 2014. [Google Scholar]
- TIBCO Software, Inc. TIBCO Statistica, Version 14.0.1.25; TIBCO Software, Inc.: Palo Alto, CA, USA, 2023.
- ESRI. ArcGIS Desktop, Version 10.7; Environmental Systems Research Institute: Redlands, CA, USA, 2019.
- Kamburska, L.; Schrimpf, W.; Djavidnia, S.; Shiganova, T.; Stefanova, K. Adressing the Ecological Issue of the Invasive Species Special Focus on the Ctenophore Mnemiopsis Leidy (Agassiz, 1865) in the Black Sea; Office for Official Publications of the European Communities: Luxembourg, 2006; JRC342072006. [Google Scholar]
- Oguz, T.; Velikova, V. Abrupt Transition of the Northwestern Black Sea Shelf Ecosystem from a Eutrophic to an Alternative Pristine State. Mar. Ecol. Prog. Ser. 2010, 405, 231–242. [Google Scholar] [CrossRef]
- Konsutov, A.S.; Kamburska, L.T. Ecological Determination of the New Ctenophora-Beroe Ovata Lnvasion in the Black Sea. Inst. Ocean. 1998, 2, 195–198. [Google Scholar]
- Shiganova, T.A.; Dumont, H.J.; Mikaelyan, A.; Glazov, D.M.; Bulgakova, Y.V.; Musaeva, E.I.; Studenikina, E.I. Interaction between the Invading Ctenophores Mnemiopsis Leidyi (A. Agassiz) and Beroe Ovata Mayer 1912, and Their Influence on the Pelagic Ecosystem of the Northeastern Black Sea. In Aquatic Invasions in the Black, Caspian, and Mediterranean Seas; Kluwer Academic Publishers: New York, NY, USA, 2004; Volume 35, pp. 33–70. [Google Scholar]
- Lazăr, L.; Boicenco, L.; Marin, O.; Culcea, O.; Pantea, E.; Bișinicu, E.; Mihailov, M.E. Black Sea Eutrophication Dynamics from Causes to Effects. Cercet. Mar. Rech. Mar. 2018, 48, 100–117. [Google Scholar]
- Lazăr, L.; Boicenco, L.; Beken, C.; Dzhurova, B.; Moncheva, S.; Shtereva, G.; Vasiliu, D. Western Black Sea Eutrophication Status According To the Black Sea Eutrophication Asessment Tool, Beast- Misis Cruise Results. Cercet. Mar. Rech. Mar. 2016, 46, 48–60. [Google Scholar]
- Pitois, S.G.; Graves, C.A.; Close, H.; Lynam, C.; Scott, J.; Tilbury, J.; van der Kooij, J.; Culverhouse, P. A First Approach to Build and Test the Copepod Mean Size and Total Abundance (CMSTA) Ecological Indicator Using in-Situ Size Measurements from the Plankton Imager (PI). Ecol. Indic. 2021, 123, 107307. [Google Scholar] [CrossRef]
- Shiganova, T.; Mirzoyan, Z.; Studenikina, E.; Volovik, S.; Siokou-Frangou, I.; Zervoudaki, S.; Dumont, H. Population Development of the Invader Ctenophore Mnemiopsis Leidyi, in the Black Sea and in Other Seas of the Mediterranean Basin. Mar. Biol. 2001, 139, 431–445. [Google Scholar] [CrossRef]
- Harcota, G.; Bisinicu, E.; Tabarcea, C.; Țotiou, A.; Filimon, A.; Abaza, V.; Boicenco, L.; Timofte, F. Distribution, and abundance of the macrozooplankton community in the Black Sea in 2021. Acad. Rom. Sci. Ann. Ser. Biol. Sci. 2022, 11, 57–67. [Google Scholar]
- Mutlu, E. Distribution and Abundance of Ctenophores and Their Zooplankton Food in the Black Sea. II. Mnemiopsis Leidyi. Mar. Biol. 1999, 135, 603–613. [Google Scholar] [CrossRef]
- Sommer, U.; Padisák, J.; Reynolds, C.S.; Juhász-Nagy, P. Hutchinson’s Heritage: The Diversity-Disturbance Relationship in Phytoplankton. Hydrobiologia 1993, 249, 1–7. [Google Scholar] [CrossRef]
- Uusitalo, L.; Blanchet, H.; Andersen, J.H.; Beauchard, O.; Berg, T.; Bianchelli, S.; Cantafaro, A.; Carstensen, J.; Carugati, L.; Cochrane, S.; et al. Indicator-Based Assessment of Marine Biological Diversity-Lessons from 10 Case Studies across the European Seas. Front. Mar. Sci. 2016, 3, 159. [Google Scholar] [CrossRef]
- Correia, A.M.; Lopes, L.F. Revisiting Biodiversity and Ecosystem Functioning through the Lens of Complex Adaptive Systems. Diversity 2023, 15, 895. [Google Scholar] [CrossRef]
- Pongen, R. Keystone Species: Ecological Architects of Biodiversity and Stability: Review. Int. J. Sci. Res. Arch. 2024, 11, 1137–1152. [Google Scholar] [CrossRef]
- Jordán, F. Keystone Species and Food Webs. Philos. Trans. R. Soc. B 2009, 364, 1733–1741. [Google Scholar] [CrossRef]
- Ellison, A.M. Foundation Species, Non-Trophic Interactions, and the Value of Being Common. iScience 2019, 13, 254–268. [Google Scholar] [CrossRef]
- Baum, J.K.; Worm, B. Cascading Top-down Effects of Changing Oceanic Predator Abundances. J. Anim. Ecol. 2009, 78, 699–714. [Google Scholar] [CrossRef]
- D’Alelio, D.; Montresor, M.; Mazzocchi, M.G.; Margiotta, F.; Sarno, D.; Ribeira d’Alcalà, M. Plankton Food-Webs: To What Extent Can They Be Simplified? Adv. Ocean. Limnol. 2016, 7, 1. [Google Scholar] [CrossRef]
- Gubanova, A.; Altukhov, D.; Stefanova, K.; Arashkevich, E.; Kamburska, L.; Prusova, I.; Svetlichny, L.; Timofte, F.; Uysal, Z. Species Composition of Black Sea Marine Planktonic Copepods. J. Mar. Syst. 2014, 135, 44–52. [Google Scholar] [CrossRef]
- Castonguay, M.; Plourde, S.; Robert, D.; Runge, J.A.; Fortier, L. Copepod Production Drives Recruitment in a Marine Fish. Can. J. Fish. Aquat. Sci. 2008, 65, 1528–1531. [Google Scholar] [CrossRef]
- Selander, E.; Berglund, E.C.; Engström, P.; Berggren, F.; Eklund, J.; Harðardóttir, S.; Lundholm, N.; Grebner, W.; Andersson, M.X. Copepods Drive Large-Scale Trait-Mediated Effects in Marine Plankton. Sci. Adv. 2019, 5, eaat5096. [Google Scholar] [CrossRef]
- Turner, J.T. The Importance of Small Planktonic Copepods and Their Roles in Pelagic Marine Food Webs. Zool. Stud. 2004, 43, 255–266. [Google Scholar]
- Vereshchaka, A. Navigating the Zooplankton Realm: Oceans of Diversity Beneath the Sea Surface. Diversity 2024, 16, 717. [Google Scholar] [CrossRef]
- Finenko, G.A. Population Dynamics, Ingestion, Growth and Reproduction Rates of the Invader Beroe Ovata and Its Impact on Plankton Community in Sevastopol Bay, the Black Sea. J. Plankton Res. 2003, 25, 539–549. [Google Scholar] [CrossRef]
- Petran, A.; Moldoveanu, M. Post-invasion ecological impact of the Atlantic ctenophore Mnemiopsis leidyi Agassiz, 1865 on the zooplankton from the Romanian Black Sea waters. Cercet. Mar. Rech. Mar. 1995, 135, 27–28. [Google Scholar]
- Tabarcea, C.; Bisinicu, E.; Harcota, G.E.; Timofte, F.; Gomoiu, M.T. Zooplankton Community Structure And Dynamics Along The Romanian Black Sea Area In 2017. J. Environ. Prot. Ecol. 2017, 20, 742–752. [Google Scholar]


| Groups Transitional and Coastal | |||||
| Average dissimilarity = 19.14 | |||||
| Group Transitional | Group Coastal | ||||
| Species | Av.Abund | Av.Abund | Av.Diss | Contrib% | Cum.% |
| Noctiluca scintillans | 13.86 | 25.79 | 6.43 | 33.57 | 33.57 |
| Polychaeta larvae | 12.94 | 7.28 | 3.05 | 15.91 | 49.48 |
| Oikopleura dioica | 4.06 | 6.78 | 1.47 | 7.66 | 57.14 |
| Parasagitta setosa | 12.25 | 14.64 | 1.29 | 6.73 | 63.87 |
| Bosmina longirostris | 2.01 | 0 | 1.08 | 5.65 | 69.51 |
| Pleopis polyphemoides | 2.7 | 4.09 | 0.75 | 3.93 | 73.45 |
| Groups Transitional and Marine | |||||
| Average dissimilarity = 26.18 | |||||
| Group Transitional | Group Marine | ||||
| Species | Av.Abund | Av.Abund | Av.Diss | Contrib% | Cum.% |
| Polychaeta larvae | 12.94 | 2.84 | 6.69 | 25.57 | 25.57 |
| Balanus larvae | 8.43 | 1.97 | 4.28 | 16.37 | 41.94 |
| Calanus euxinus | 1.08 | 5.43 | 2.88 | 11.01 | 52.95 |
| Acartia sp. | 7.58 | 4.62 | 1.96 | 7.5 | 60.45 |
| Penilia avirostris | 6.71 | 4.6 | 1.4 | 5.35 | 65.8 |
| Bosmina longirostris | 2.01 | 0.11 | 1.26 | 4.81 | 70.61 |
| Groups Coastal and Marine | |||||
| Average dissimilarity = 30.17 | |||||
| Group Coastal | Group Marine | ||||
| Species | Av.Abund | Av.Abund | Av.Diss | Contrib% | Cum.% |
| Noctiluca scintillans | 25.79 | 14.33 | 7 | 23.2 | 23.2 |
| Balanus larvae | 8.4 | 1.97 | 3.93 | 13.02 | 36.22 |
| Calanus euxinus | 0.5 | 5.43 | 3.01 | 9.97 | 46.19 |
| Polychaeta larvae | 7.28 | 2.84 | 2.71 | 8.98 | 55.17 |
| Acartia sp. | 8.45 | 4.62 | 2.34 | 7.75 | 62.93 |
| Pleopis polyphemoides | 4.09 | 0.93 | 1.93 | 6.41 | 69.34 |
| Penilia avirostris | 6.97 | 4.6 | 1.45 | 4.79 | 74.13 |
| Groups Transitional and Offshore | |||||
| Average dissimilarity = 51.15 | |||||
| Group Transitional | Group Offshore | ||||
| Species | Av.Abund | Av.Abund | Av.Diss | Contrib% | Cum.% |
| Polychaeta larvae | 12.94 | 0.74 | 9.29 | 18.17 | 18.17 |
| Noctiluca scintillans | 13.86 | 3.36 | 8 | 15.63 | 33.8 |
| Calanus euxinus | 1.08 | 9.45 | 6.38 | 12.48 | 46.28 |
| Balanus larvae | 8.43 | 0.09 | 6.36 | 12.43 | 58.7 |
| Acartia sp. | 7.58 | 4.34 | 2.48 | 4.84 | 63.54 |
| Parasagitta setosa | 12.25 | 9.2 | 2.32 | 4.54 | 68.09 |
| Penilia avirostris | 6.71 | 4.13 | 1.97 | 3.85 | 71.93 |
| Groups Coastal and Offshore | |||||
| Average dissimilarity = 54.87 | |||||
| Group Coastal | Group Offshore | ||||
| Species | Av.Abund | Av.Abund | Av.Diss | Contrib% | Cum.% |
| Noctiluca scintillans | 25.79 | 3.36 | 15.56 | 28.36 | 28.36 |
| Calanus euxinus | 0.5 | 9.45 | 6.21 | 11.32 | 39.68 |
| Balanus larvae | 8.4 | 0.09 | 5.77 | 10.51 | 50.19 |
| Polychaeta larvae | 7.28 | 0.74 | 4.53 | 8.26 | 58.45 |
| Parasagitta setosa | 14.64 | 9.2 | 3.77 | 6.88 | 65.33 |
| Oikopleura dioica | 6.78 | 2.22 | 3.17 | 5.77 | 71.1 |
| Groups Marine and Offshore | |||||
| Average dissimilarity = 29.31 | |||||
| Group Marine | Group Offshore | ||||
| Species | Av.Abund | Av.Abund | Av.Diss | Contrib% | Cum.% |
| Noctiluca scintillans | 14.33 | 3.36 | 10.04 | 34.24 | 34.24 |
| Parasagitta setosa | 13.57 | 9.2 | 4 | 13.66 | 47.89 |
| Calanus euxinus | 5.43 | 9.45 | 3.68 | 12.57 | 60.46 |
| Oikopleura dioica | 4.46 | 2.22 | 2.05 | 6.98 | 67.44 |
| Polychaeta larvae | 2.84 | 0.74 | 1.92 | 6.55 | 74 |
| Group Transitional | ||||||
| Average similarity: 7.23 | ||||||
| Av.Abund | Av.Sim | Sim/SD | Contrib% | Cum.% | ||
| M. leidyi biomass g.m−3 | 11.16 | 7.23 | 0.37 | 100 | 100 | |
| Group Coastal | ||||||
| Average similarity: 6.28 | ||||||
| M. leidyi biomass g.m−3 | 0.81 | 6.28 | 0.34 | 100 | 100 | |
| Group Marine | ||||||
| Average similarity: 21.13 | ||||||
| M. leidyi biomass g.m−3 | 24.04 | 21.13 | 0.73 | 100 | 100 | |
| Group Offshore | ||||||
| Average similarity: 4.38 | ||||||
| M. leidyi biomass g.m−3 | 47.44 | 4.38 | 0.28 | 100 | 100 | |
| Groups Coastal and Transitional | ||||||
| Average dissimilarity = 92.95 | ||||||
| Group Coastal | Group Transitional | |||||
| Av.Abund | Av.Abund | Av.Diss | Diss/SD | Contrib% | Cum.% | |
| M. leidyi biomass g.m−3 | 0.81 | 11.16 | 92.95 | 4.71 | 100 | 100 |
| Groups Coastal and Marine | ||||||
| Average dissimilarity = 90.01 | ||||||
| Group Coastal | Group Marine | |||||
| Av.Abund | Av.Abund | Av.Diss | Diss/SD | Contrib% | Cum.% | |
| M. leidyi biomass g.m−3 | 0.81 | 24.04 | 90.01 | 3.96 | 100 | 100 |
| Groups Transitional and Marine | ||||||
| Average dissimilarity = 88.13 | ||||||
| Group Transitional | Group Marine | |||||
| Av.Abund | Av.Abund | Av.Diss | Diss/SD | Contrib% | Cum.% | |
| M. leidyi biomass g.m−3 | 11.16 | 24.04 | 88.13 | 3.62 | 100 | 100 |
| Groups Coastal and Offshore | ||||||
| Average dissimilarity = 94.68 | ||||||
| Group Coastal | Group Offshore | |||||
| Av.Abund | Av.Abund | Av.Diss | Diss/SD | Contrib% | Cum.% | |
| M. leidyi biomass g.m−3 | 0.81 | 47.44 | 94.68 | 5.64 | 100 | 100 |
| Groups Transitional and Offshore | ||||||
| Average dissimilarity = 94.50 | ||||||
| Group Transitional | Group Offshore | |||||
| Av.Abund | Av.Abund | Av.Diss | Diss/SD | Contrib% | Cum.% | |
| M. leidyi biomass g.m−3 | 11.16 | 47.44 | 94.5 | 5.85 | 100 | 100 |
| Groups Marine and Offshore | ||||||
| Average dissimilarity = 90.76 | ||||||
| Group Marine | Group Offshore | |||||
| Av.Abund | Av.Abund | Av.Diss | Diss/SD | Contrib% | Cum.% | |
| M. leidyi biomass g.m−3 | 24.04 | 47.44 | 90.76 | 4.3 | 100 | 100 |
Disclaimer/Publisher’s Note: The statements, opinions and data contained in all publications are solely those of the individual author(s) and contributor(s) and not of MDPI and/or the editor(s). MDPI and/or the editor(s) disclaim responsibility for any injury to people or property resulting from any ideas, methods, instructions or products referred to in the content. |
© 2025 by the authors. Licensee MDPI, Basel, Switzerland. This article is an open access article distributed under the terms and conditions of the Creative Commons Attribution (CC BY) license (https://creativecommons.org/licenses/by/4.0/).
Share and Cite
Bisinicu, E.; Harcota, G.E. Baseline Assessment of Black Sea Food Web Integrity Using a Zooplankton-Based Approach Under the Marine Strategy Framework Directive. J. Mar. Sci. Eng. 2025, 13, 713. https://doi.org/10.3390/jmse13040713
Bisinicu E, Harcota GE. Baseline Assessment of Black Sea Food Web Integrity Using a Zooplankton-Based Approach Under the Marine Strategy Framework Directive. Journal of Marine Science and Engineering. 2025; 13(4):713. https://doi.org/10.3390/jmse13040713
Chicago/Turabian StyleBisinicu, Elena, and George Emanuel Harcota. 2025. "Baseline Assessment of Black Sea Food Web Integrity Using a Zooplankton-Based Approach Under the Marine Strategy Framework Directive" Journal of Marine Science and Engineering 13, no. 4: 713. https://doi.org/10.3390/jmse13040713
APA StyleBisinicu, E., & Harcota, G. E. (2025). Baseline Assessment of Black Sea Food Web Integrity Using a Zooplankton-Based Approach Under the Marine Strategy Framework Directive. Journal of Marine Science and Engineering, 13(4), 713. https://doi.org/10.3390/jmse13040713