1. Introduction
Floating offshore wind turbines (FOWTs) are a promising renewable energy solution, providing the potential to harness substantial wind resources in deeper waters where traditional fixed-bottom foundations are impractical. The semi-submersible platform, in particular, has emerged as a prevalent foundation type of FOWT because of its adaptability and cost-effectiveness. Examples of notable semi-submersible platforms include Fuyao (China Shipbuilding Group offshore wind Power Co., Ltd., Guangzhou, China), OC4 DeepCWind (DeepCWind Consortium, Orono, ME, USA) [
1], and Hywind (Equinor, Norway) [
2]. Although semi-submersible platforms demonstrate significant potential, limiting their dynamic responses in complex marine environments remains a critical challenge. Excessive surge motion, arising from the interaction between the platform and its mooring cables, poses significant risks of cable overextension or fatigue-induced failure caused by continuous cyclic loading. Similarly, the pitch motion, driven by wind–wave–current-induced moments, presents risks of structural instability and potential overturning. These challenges underscore the importance of advanced numerical modeling to evaluate and improve the performance of such platforms in a complex environment.
In recent years, numerous studies have explored advancements in the numerical modeling of integrated floating wind turbines, offering valuable insights into hydrodynamic and aerodynamic interactions, particularly the coupled effects between the floating platform and the wind turbine system (e.g., [
3,
4]). Building upon these findings, we further analyze the influence of wave–current interactions, which are also critical in determining structural stability and operational efficiency. Wave-induced forces create oscillatory motions, while currents can induce steady forces, both of which influence the overall dynamics of the platform. Accurate evaluation of these loads is essential for optimizing design parameters to ensure that the foundations can withstand harsh marine conditions. Waves and currents interact nonlinearly, creating complex wave–current interaction (WCI) phenomena that complicate the evaluation of combined wave–current loads. In recent decades, many researchers have studied the response of semi-submersibles under wave–current flow, through numerical simulation based on potential flow (e.g., [
5,
6]), experiments (e.g., [
7,
8,
9]), and high-fidelity numerical simulations based on computational fluid dynamics (CFD) (e.g., [
4,
10,
11]).
In typical ocean engineering modeling of non-slender floating bodies, wave loads are often calculated using numerical model based on potential-flow theory, while current load is calculated using the quadratic law. Potential flow theory assumes an inviscid flow and negligible turbulence fluctuations, simplifying fluid dynamics analysis. The wave–current interaction (WCI) arises from the Doppler effect, where currents can modify various wave characteristics, such as frequency and wavelength [
12,
13,
14,
15,
16]. However, potential-flow-based models may not be able to adequately capture complex WCIs, particularly in areas with strong currents or significant nonlinear wave effects.
WCI affects unsteady and steady loading due to current-induced vortex shedding. Although vortex-induced motion (VIM) for structures with circular and rectangular cross sections has been extensively studied [
17,
18,
19], analyzing VIM for semi-submersible platforms has significant challenges. This difficulty arises from their large dimensions and multi-column structures, which generate complex wake interactions [
20]. Studies have shown that the inclusion of waves sometimes has minimal impact on VIM, while in other cases, it can completely suppress VIM. This interaction alters the vortex shedding pattern and, consequently, the shedding frequency [
20,
21]. Furthermore, it has been observed that the vortex shedding frequency increases with flow velocity and is not fixed at the natural transverse frequency [
22].
There are even more mechanisms of WCI (e.g, waves change the mean loading due to current) that can contribute to the dynamic response of the FOWT platform, and their contributions may not be superimposed linearly. For instance, the catenary mooring is usually a nonlinear system, so the surge under combined loads cannot simply be treated as the sum of surges caused by wave and current separately. Thus, it is also imperative to accurately estimate the tension in the mooring line [
23]. Recent studies have highlighted that currents significantly influence tower responses and the mean tensions in mooring lines. Neglecting WCI can lead to an overestimation of the fatigue life of mooring lines [
24]. Furthermore, it has been observed that current loads reduce the oscillations of surge, heave, and pitch motions [
25]. Computational Fluid Dynamics (CFD) serves as a valuable tool for WCI studies, providing detailed insights into flow fields, such as velocity, pressure distribution, and vortex shedding [
26,
27,
28]. Therefore, utilizing CFD is essential for investigating the platform’s response under wave–current loading.
Since full-scale experimental verification in CFD studies is often impractical due to time and resource constraints, this study does not include direct experimental validation. However, numerous numerical methodologies have been validated through comparative analyses with experiments or simplified industrial models (e.g., [
29,
30]), providing a solid foundation for our research. Building on these validated methodologies, we apply CFD to simulate a newly proposed triangular semi-submersible platform for FOWT in combined wave–current flows under normal and extreme cases. The aim is to quantify key response parameters, i.e., the maximum and mean surge, pitch, and mooring line tension, and investigate how WCI affects these parameters.
Section 2 introduces the numerical model.
Section 3 presents the results of single-loading cases, while the results of wave–current-loading cases are presented in
Section 4. Since significant VIM is observed in our simulation, we further investigate the origin of the observed VIM through some fine-resolution two-dimensional simulations in
Section 5. Conclusions are drawn in
Section 6.
2. Numerical Model
In this study, we used the multi-phase flow solver, olaFlow, from the openFOAM (v2012) toolbox. olaFlow solves the incompressible Navier–Stokes equations, which are given as follows:
where
is the fluid velocity,
p is the pressure,
is the fluid density, and
is the gravity acceleration.
is the effective viscosity defined as
, where
is the dynamic viscosity and
is turbulence eddy viscosity.
(
) is the volume fraction of fluid,
is the relative velocity between fluid and air. The
turbulence closure model was utilized for describing
in our simulation.
For the simulation of multiphase flows, we adopted the Volume of Fluid (VOF) method [
31], which facilitates the modeling of liquid–gas interactions. The VOF approach dynamically tracks the interface’s location by accounting for changes in the volume fraction of the fluid. This technique enables the precise representation of the movement of the interface. The fluid properties within each computational cell are determined through a weighted average based on the volume fraction
. For example, the density used in Equation (
2) is computed as follows:
where
is the water density,
is the air density. The transport equation (Equation (
3)) of
is solved using the multidimensional universal limiter for explicit solution (MULES) [
32].
For floating structures, the primary external forces include hydrodynamic forces, gravity, and mooring tensions. In CFD simulations of large solid floating bodies, the hydrodynamic forces are determined by integrating the pressure and viscous forces across the outer surface. Consequently, the six degrees of freedom (6DoF) of the floating structures are calculated using the following governing equations:
and
where
M is the total mass of floating structure,
denotes the moment of inertia,
and
are the linear and angular velocities of the structure, respectively, and
,
,
, and
are the momentum arms for pressure forces
, viscous forces
, mooring forces
, and gravity
.
In advanced numerical simulations of moored floating structures, dynamic mooring models utilizing the lumped-mass method (MoorDyn, introduced by [
33]) have been integrated with CFD solvers to allow high-fidelity modeling of wave structure interactions. MoorDyn employs the lumped-mass method to model the dynamic behavior of mooring lines by discretizing them into
N uniform segments, which connect
nodes along the line’s length. The motion of each node
i is governed by the following equation:
where
and
are the mass and added mass of each node
i,
is the location of each node,
and
are the stiffness and damping forces in the cable segment on the either side of a node,
is the cable weight lumped at each node,
is the force due to the interaction when a node contacts the seabed, and
gives the hydrodynamic loads on the node.
2.1. Semi-Submersible Platform
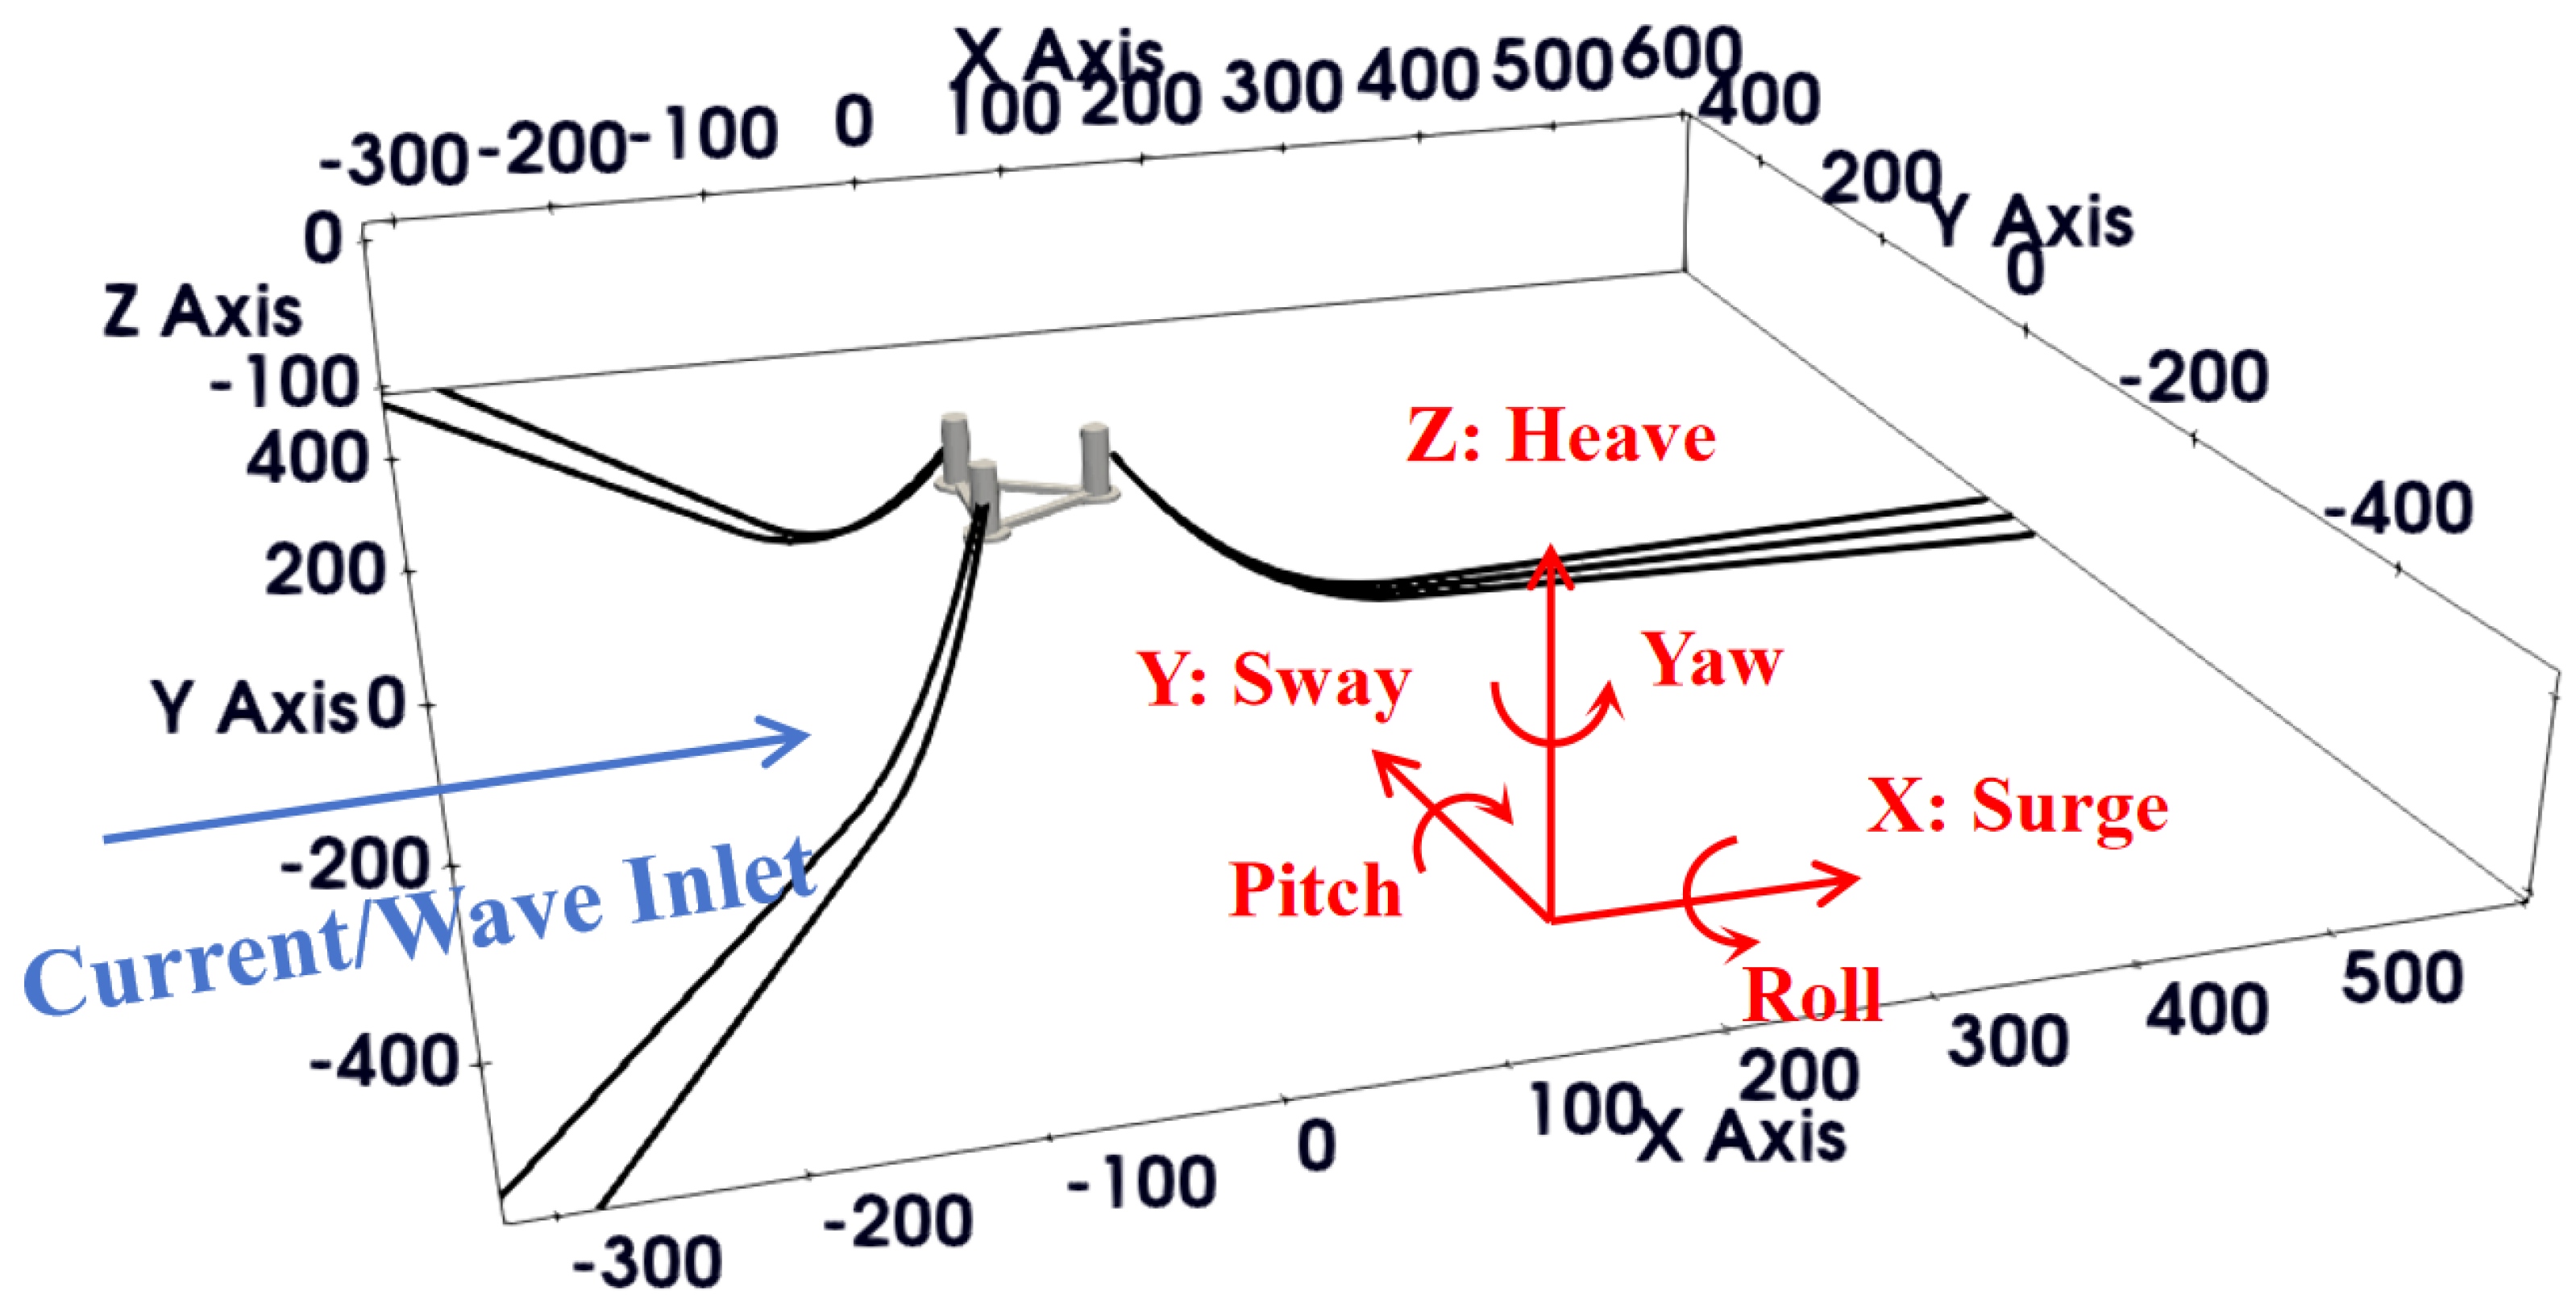
The investigated structure is a semi-submersible platform, as shown in
Figure 1. The platform comprises three vertical columns connected by horizontal crossbars, with additional base pontoons attached below the vertical columns. The turbine is mounted on the downstream side column, which is not shown in the figure. The platform is connected to seven mooring lines, four symmetrically arranged upstream of the floater and three in the downstream. Since this study aims at the hydrodynamic behavior of the platform, the aerodynamic load on the blades is not calculated, but the weight of the turbine and tower is included. The key parameters of the platform are presented in
Table 1. The natural periods of the turbine and the platform in the surge, heave, and pitch are 101.10 s, 17.90 s, and 29.86 s, respectively, determined from simulated free decay tests. These simulations used the same simulation setup as the extreme-loading case in this study, and the details are not shown here for brevity.
2.2. Test Conditions
In this study, the turbine’s dynamic behavior is simulated for both extreme and normal cases. The test-condition parameters are summarized in
Table 2. This FOWT will be deployed in the offshore regions east of Hainan Province, China. A metocean study was conducted to determine the wave and current conditions. Due to confidentiality concerns, the details of the metocean study are not provided here. The normal case has a regular wave height of 2.0 m and current speed of 1 m/s, which can be considered as strong current plus weak wave. The extreme case has a regular wave height of 12.0 m and a current speed of 2.0 m/s, which represents strong waves plus weak current. In our simulations, only regular waves are currently considered for simplicity. To better illustrate the WCI effects on the platform’s motion, numerical simulations are performed for wave-only, current-only, and wave–current cases. In this study, the aerodynamic load on the blades is not included, as the focus is primarily on the hydrodynamic and structural responses to wave and current forces.
2.3. Simulation Settings
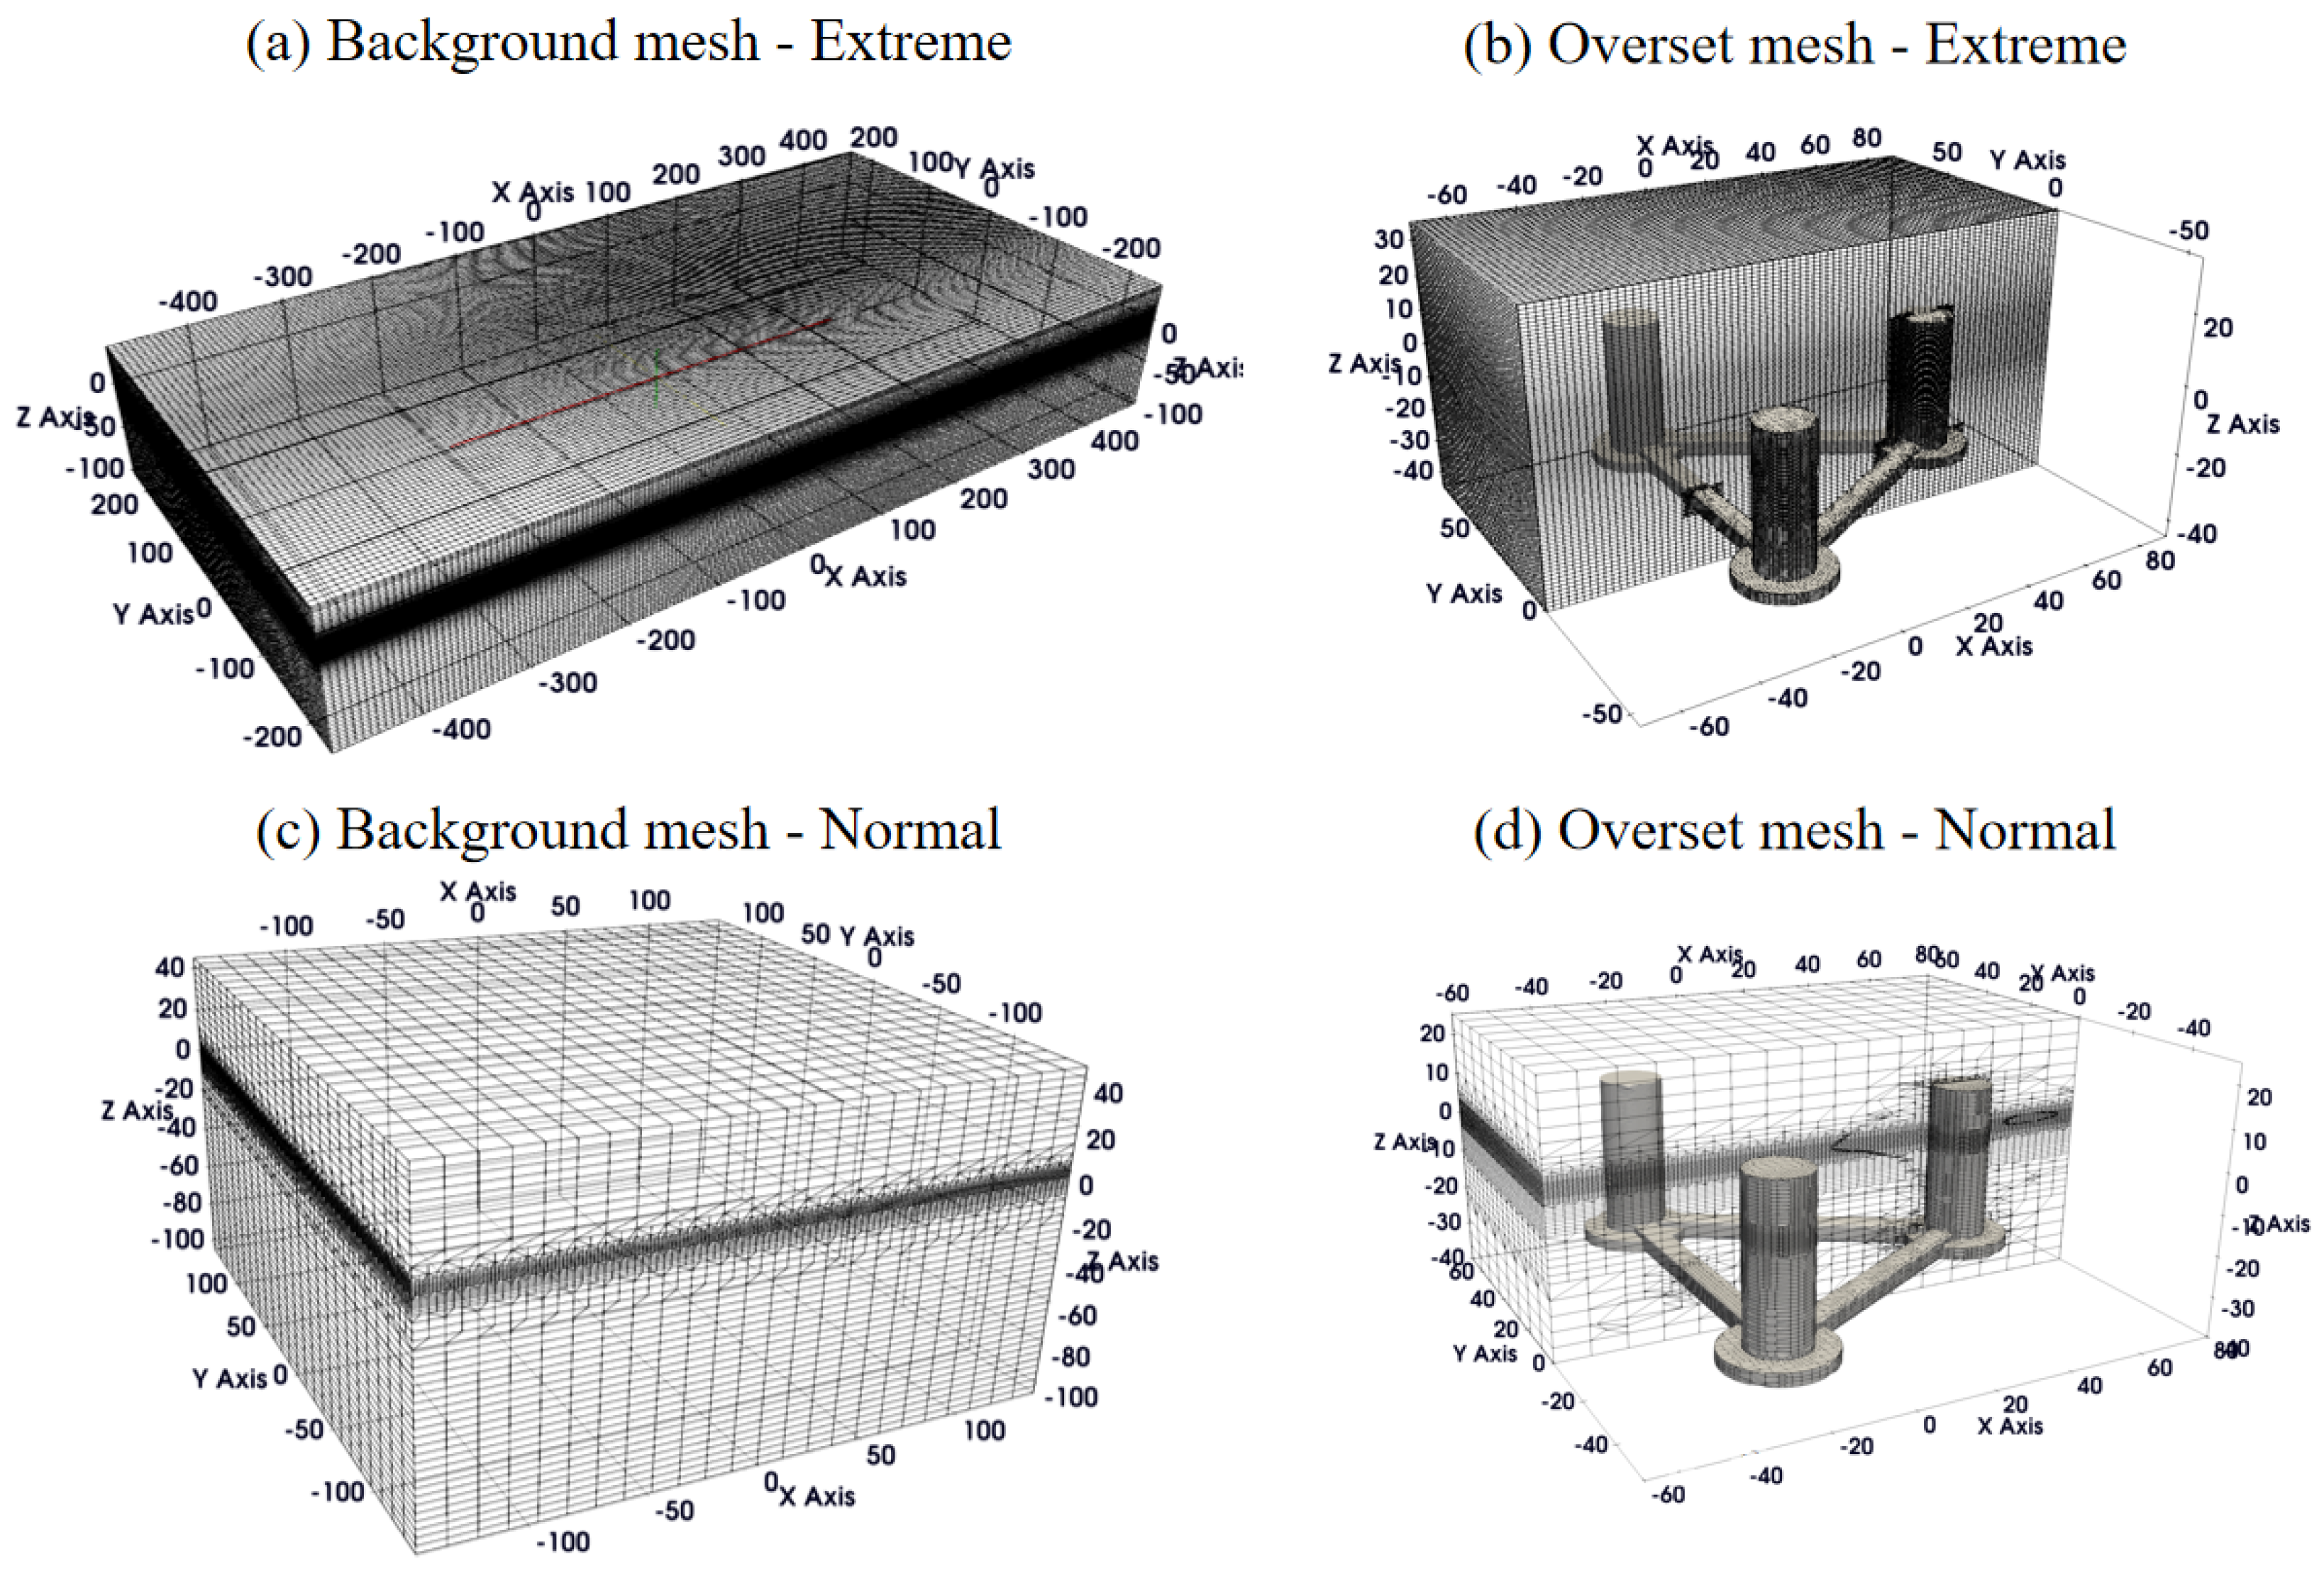
Due to the differences in wavelength and wave height between extreme and normal cases, different computation domain sizes and grid sizes are required, resulting in the use of two meshes for the simulations under each condition. The computational domain is depicted in
Figure 2. To account for the large movement of the platform, an overset mesh technique is employed to simulate the fluid–structure interaction, thereby enhancing the stability of the simulations. The background mesh is shown in
Figure 2a,c, while the overset mesh is presented in
Figure 2b,d. The boundary conditions are specified as follows. A zero-gradient pressure condition is applied at both the inlet and outlet boundaries. The inlet fluid velocity is determined by the wave and current speed, while the outlet boundary is applied at active wave absorption boundary. A non-slip wall boundary condition is applied at the bottom and floater. The initial conditions are set based on the prescribed current velocity profile. The total number of cells in the simulation ranges from approximately 1.50 million to 3.50 million for both extreme and normal cases. To accurately resolve the wave dynamics, the vertical grid resolution within a region spanning three times the wave height above and below the still water level is maintained between 1/20 and 1/10 of the wave height. The horizontal grid resolution varies between 1/100 and 1/20 of the wavelength, with a gradual refinement strategy applied from the domain boundaries toward the floating platform. Additional localized mesh refinement is implemented near the platform to enhance accuracy in the fluid–structure interaction region. The grid convergence study is presented in
Appendix A. The simulations were performed in parallel using 30 cores for each case on the HPC system of Tsinghua University, China. The average simulation time for a 300-s run is between 7 and 10 days, though this may vary depending on the specific case.
The initial and boundary conditions for turbulence play a crucial role in turbulence modeling, where the turbulent kinetic energy (
k) and specific dissipation rate (
) serve as fundamental parameters. These are defined as follows:
where
U is the mean flow velocity and
I is the turbulence intensity, which is typically defined as the ratio of velocity fluctuations to the mean flow velocity. The turbulence intensity varies depending on the flow regime: for medium-turbulence flows,
I ranges from 1% to 5%, whereas low-turbulence flows exhibit
I values below 1%. The parameter
l corresponds to the turbulent length scale, which characterizes the size of the largest energy-containing eddies responsible for mixing and momentum transfer. In the present study, turbulence is primarily generated by waves and current. Following the approach of [
29], the turbulent kinetic energy (
k) is estimated based on the combined influence of wave and current velocities, typically assuming a low turbulence intensity of 0.5%. The turbulent length scale (
l) is approximated using the wave height, as it provides a reasonable estimate of the dominant eddy structures. To accurately capture near-wall turbulence effects, the wall function approach is applied at the floater surface, ensuring appropriate boundary layer treatment while maintaining computational efficiency.
5. WCI Effects on Hydrodynamic Loading of Submerged Pontoon
In previous three-dimensional platform simulations, it was found that WCI (1) affects the mean and time-varying hydrodynamic loading in a nonlinear manner, and (2) prevents vortex-induced motion at the platform’s natural frequency (especially for the pitch motion). However, the mesh in our three-dimensional simulations is relatively coarse, with a
value greater than 5000, where
is the height of the first grid at a solid boundary normalized by the local viscous length scale. This coarse mesh cannot resolve the boundary layer and the vortex shedding accurately, so the findings on WCI require further confirmation. It is not practical to refine the mesh of 3D simulation to give
of O(10), due to prohibitively high computational cost. Thus, here, we choose to only study a key component of the platform, i.e., the upstream submerged pontoon of the proposed platform, because it gives significant vortex shedding (see
Figure 7) and time-varying lift force, which is the main driver of time-varying pitch at the pitch natural frequency. Since this pontoon directly faces the incoming waves and currents and has a large aspect ratio, the flow passing it can be regarded as two-dimensional problem, so we conducted a 2D simulations of wave–current flow passing the cross-section of the submerged pontoon, which is a rounded rectangle.
5.1. Simulation Settings for 2D Flow Passing Submerged Pontoon
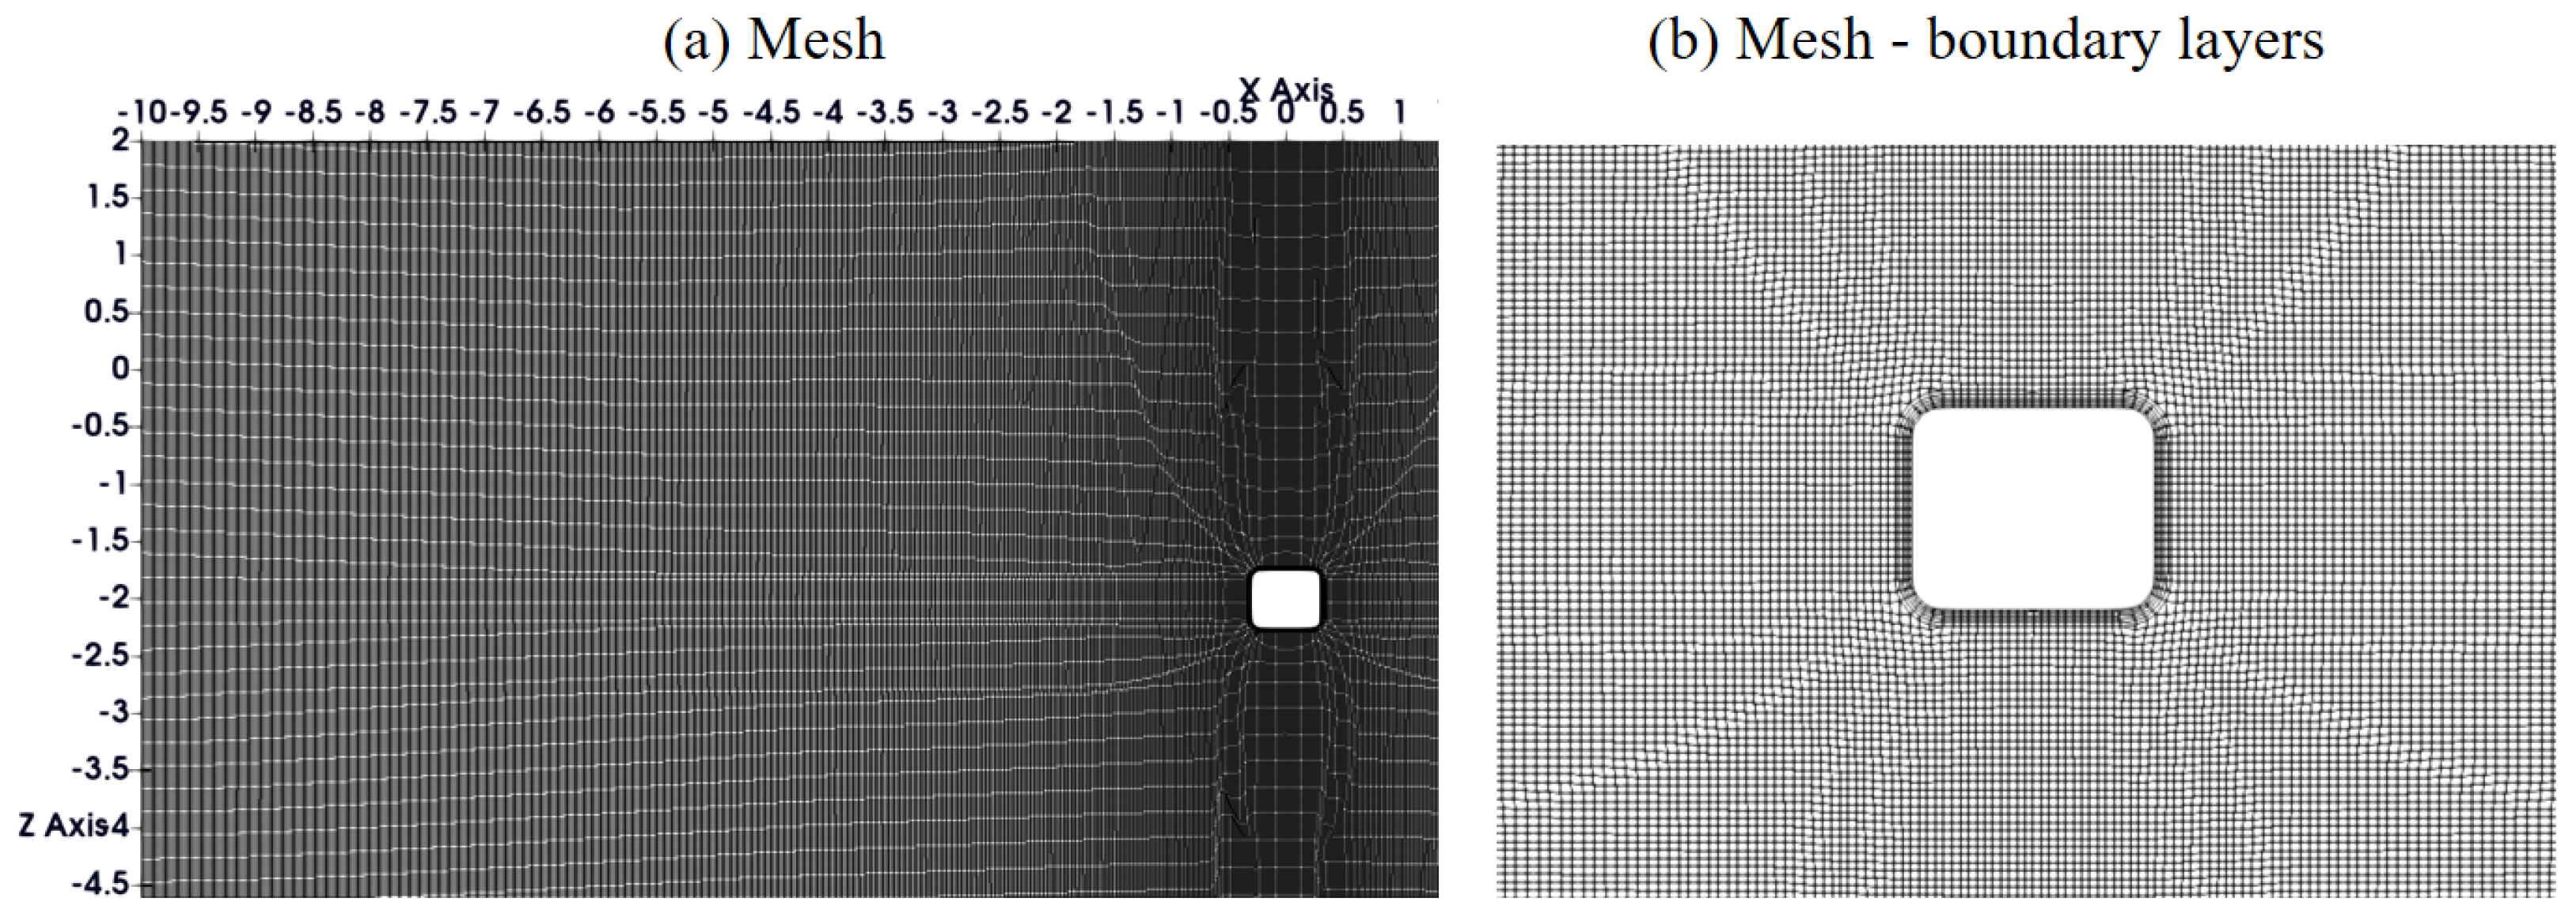
The computational domain for the two-dimensional simulation is shown in
Figure 13a, and the refined mesh around the pontoon is shown in
Figure 13b. The near-wall mesh size has a
value ranging from 30 to 50, which allows for precise resolution of the flow field. To further save computational time, the simulated structure is geometrically scaled down by a factor of 1:10 (i.e., the rectangle is 0.6 m wide by 0.5 m tall), and the wave period and current speed are both scaled by
based on the Froude number similarity. Thus, the Reynolds number is reduced from O(
) at prototype condition to O(
) in our simulation. Previous studies of flow passing a rounded rectangle showed that Reynolds number does not control the flow separation and vortex shedding if it exceeds O(
). The boundary conditions are consistent with those used in the three-dimensional simulation. Waves and current are generated from the left boundary. The pontoon is assumed stationary in this 2D simulation. The same test conditions (
Table 2) in 3D simulations were conducted here. The total number of cells in the simulation is approximately 3 million for both extreme and normal cases. The simulations were performed in parallel using 10 cores for each case on the HPC. The average simulation time for a 300-s run was between 0.5 and 1 day.
5.2. Strong Wave Plus Weak Current
In this sub-section, we discuss the hydrodynamic loads on the submerged pontoon under extreme cases, which represents strong waves plus a weak current.
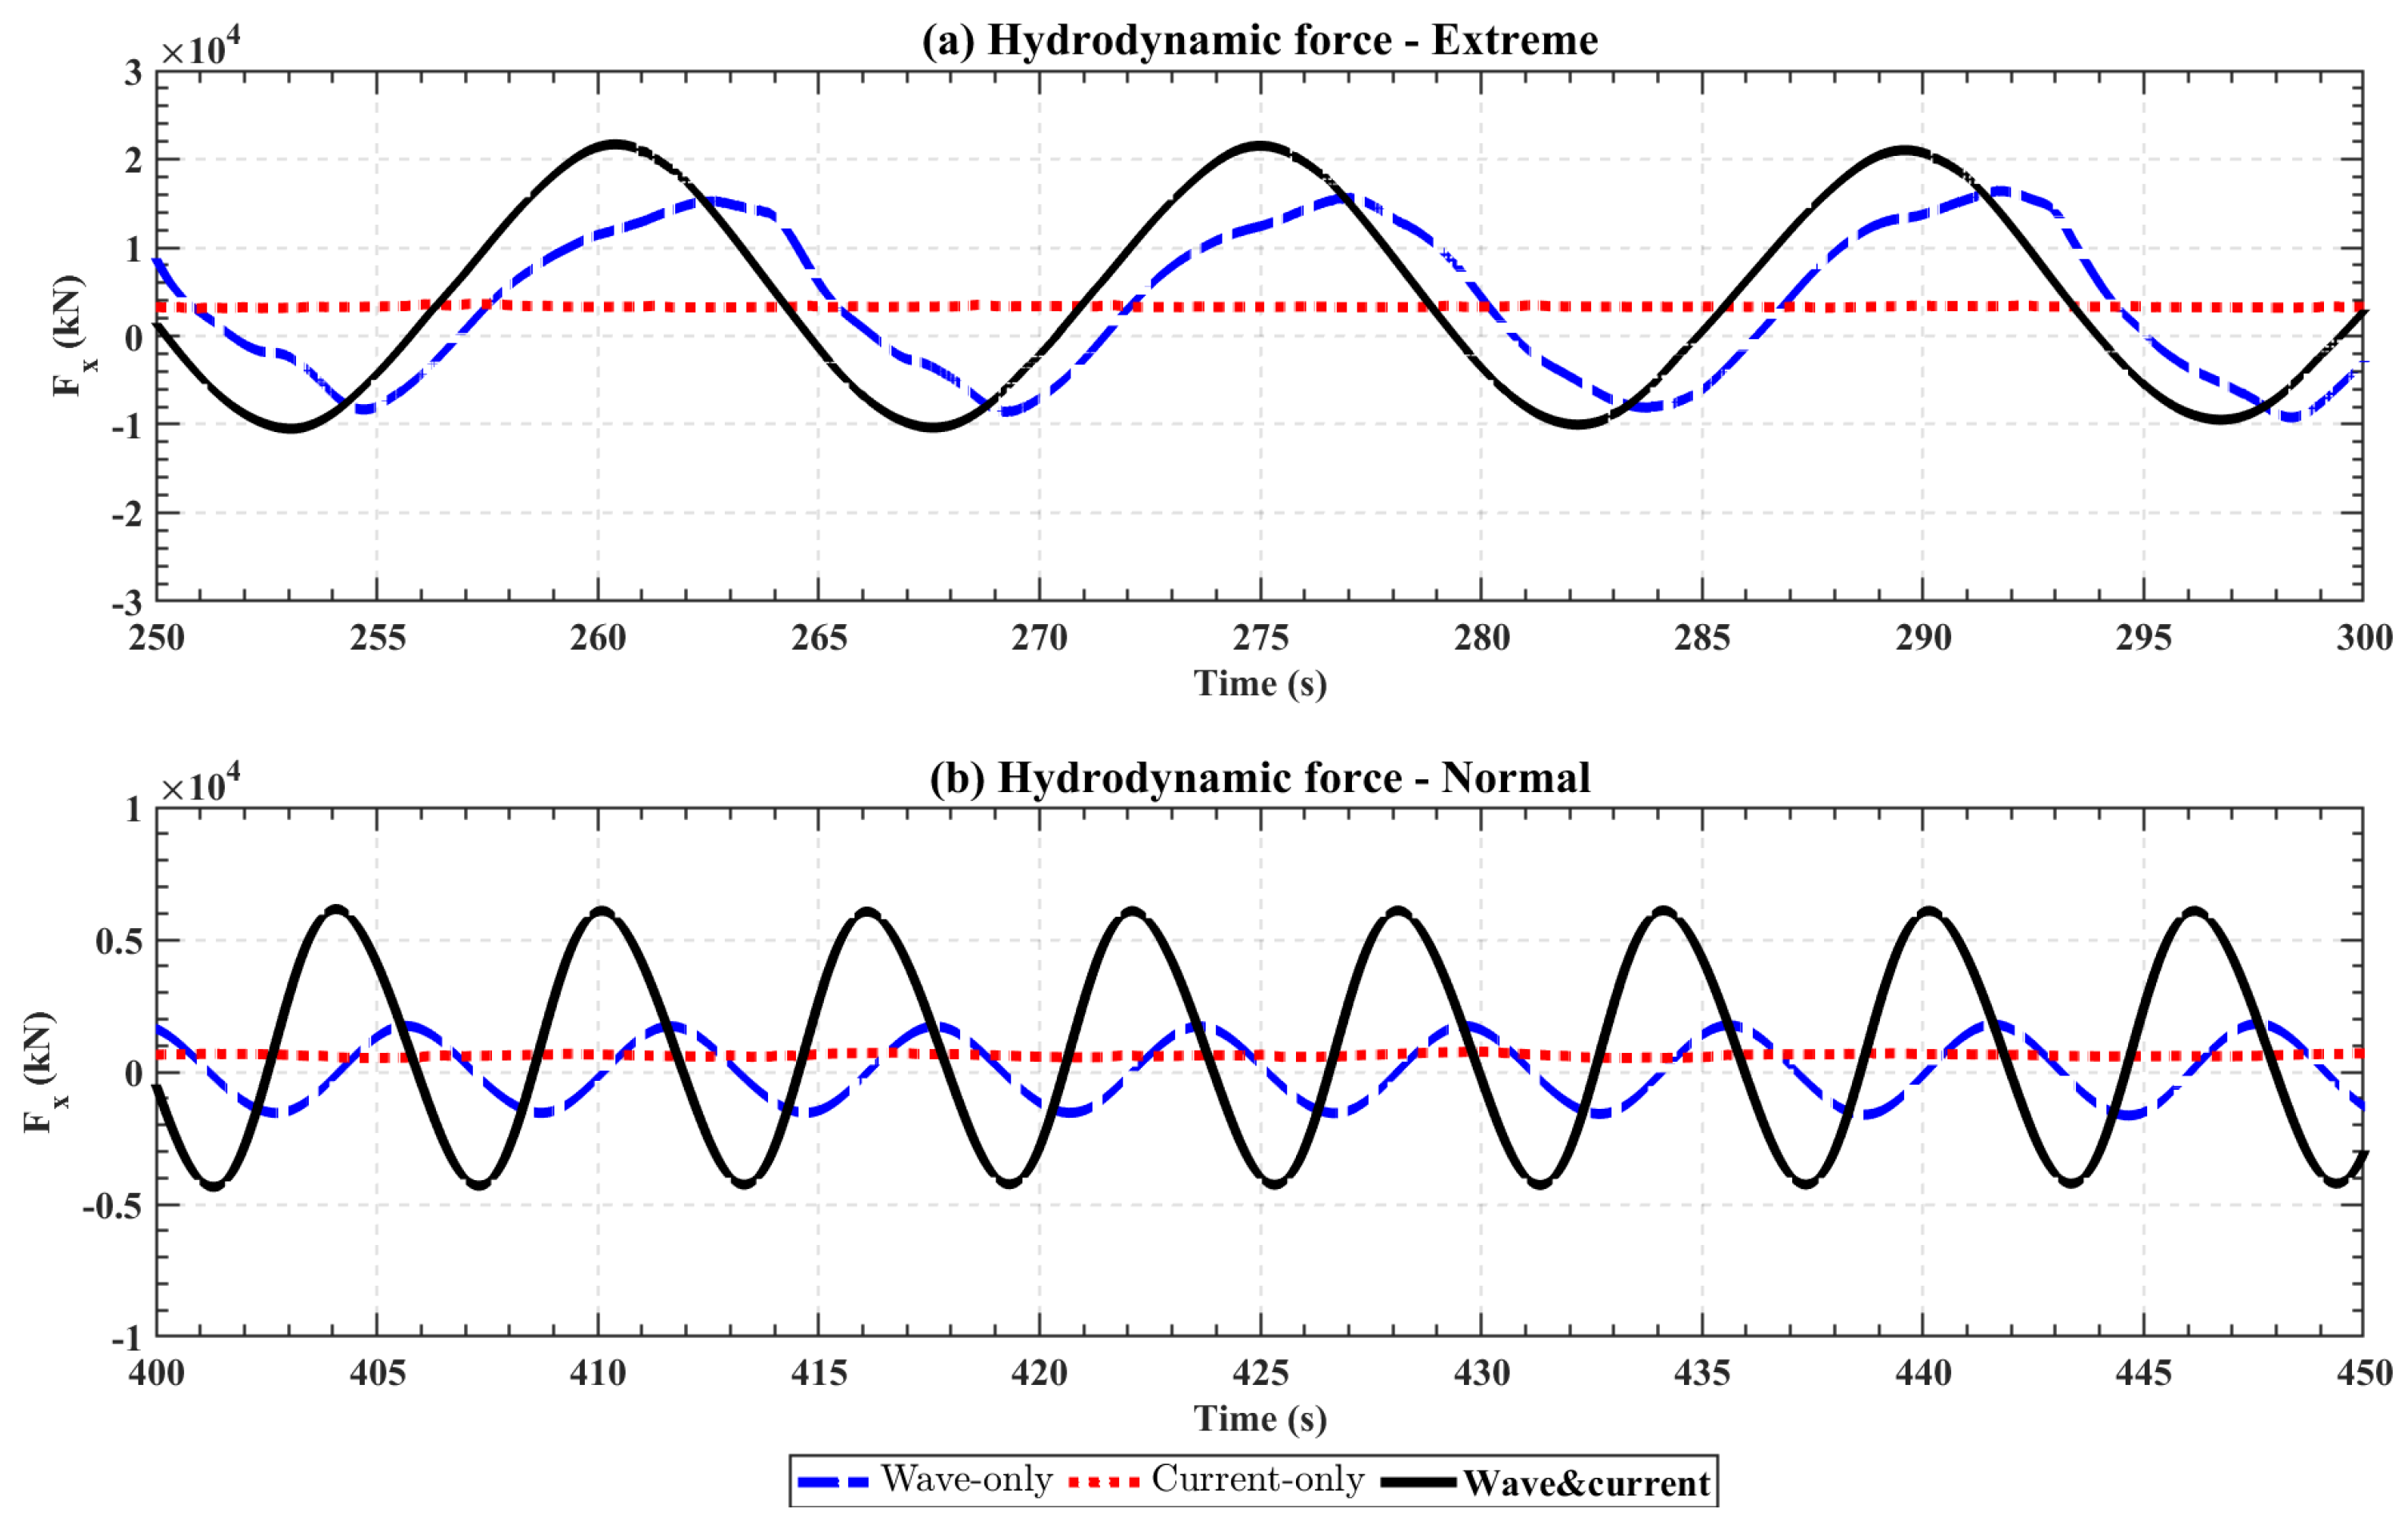
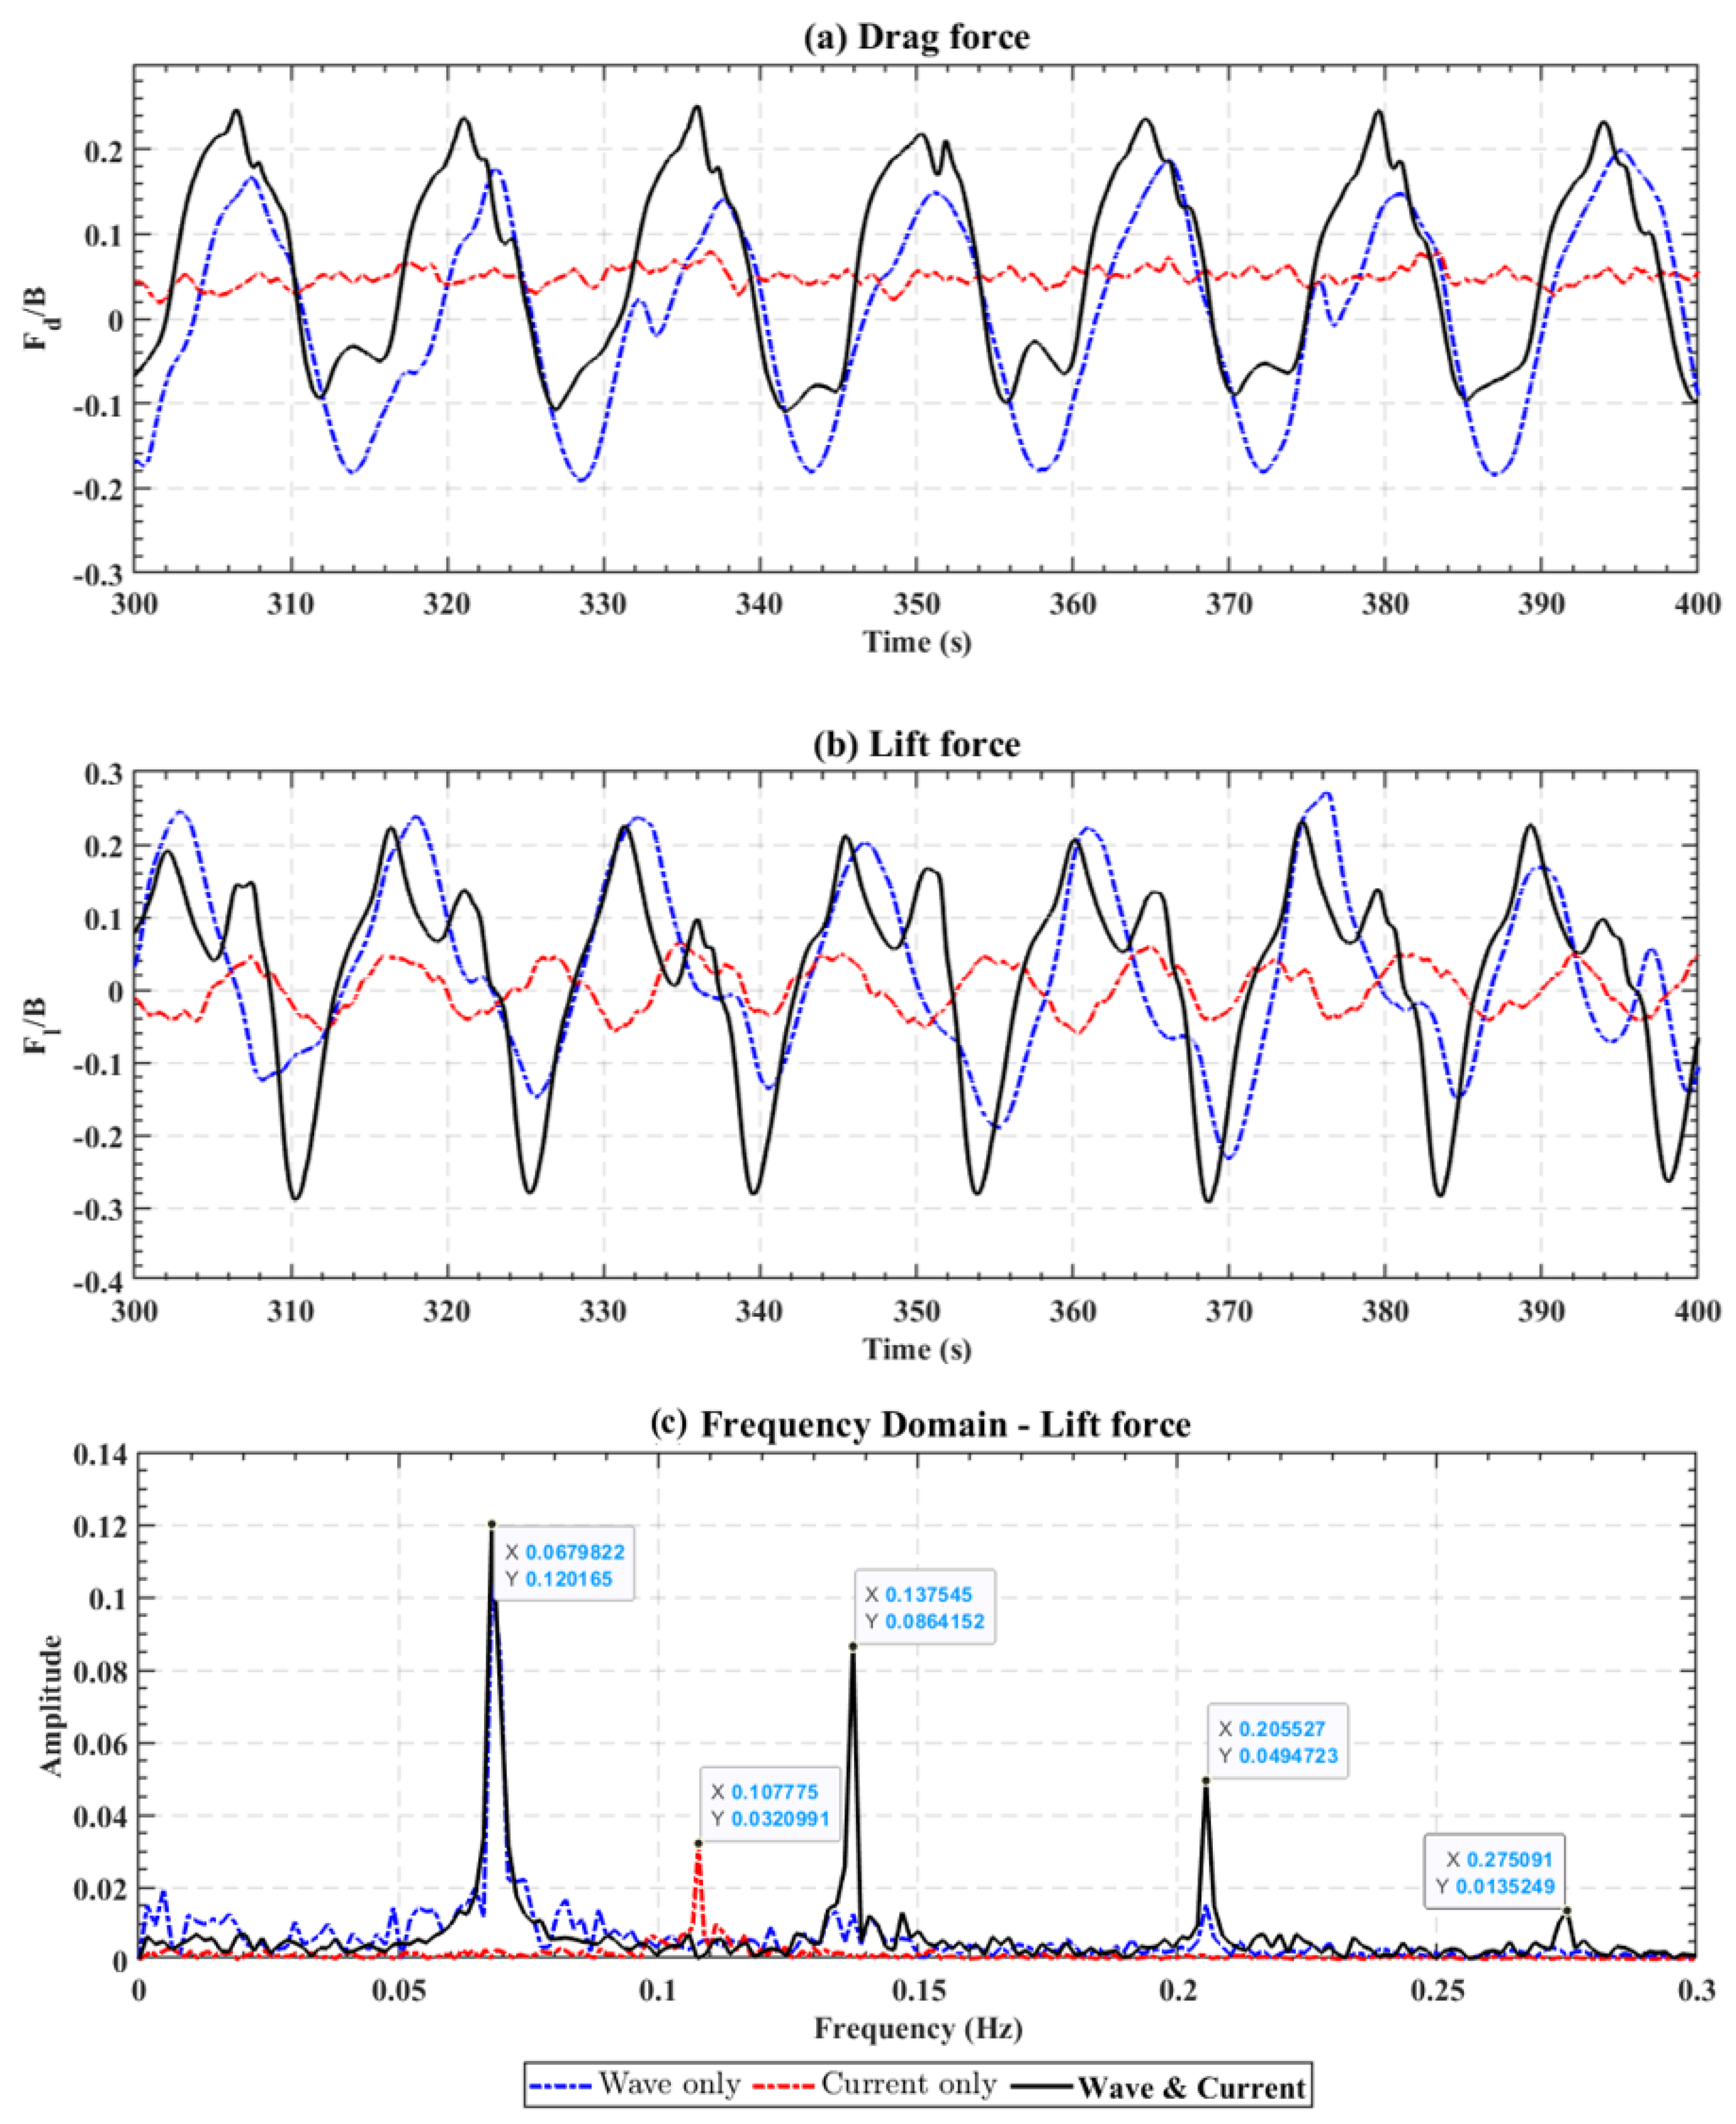
Figure 14 shows the time series of total drag force (or horizontal force), total lift force (or vertical force), and the spectra of the lift force. The mean and RMS values of drag and lift force are presented in
Table 6 (normalized by the buoyancy of the submerged pontoon).
As shown in
Figure 14a and
Table 6, the drag force in wave-only (blue line) and wave–current (red line) cases appear quite similar, except for an offset, which is due to the superimposed current. Thus, the time-varying part of drag force, which is mainly due to wave excitation, is not affected by WCI. The mean drag force divided by buoyancy of the wave–current case is 0.0691, which is larger than the sum of wave-only (−0.0027) and current-only (0.0513). Thus, the mean drag force is influenced by WCI. This nonlinear increase implies that WCI introduces additional flow interactions that enhance mean drag force, possibly due to flow separation effects.
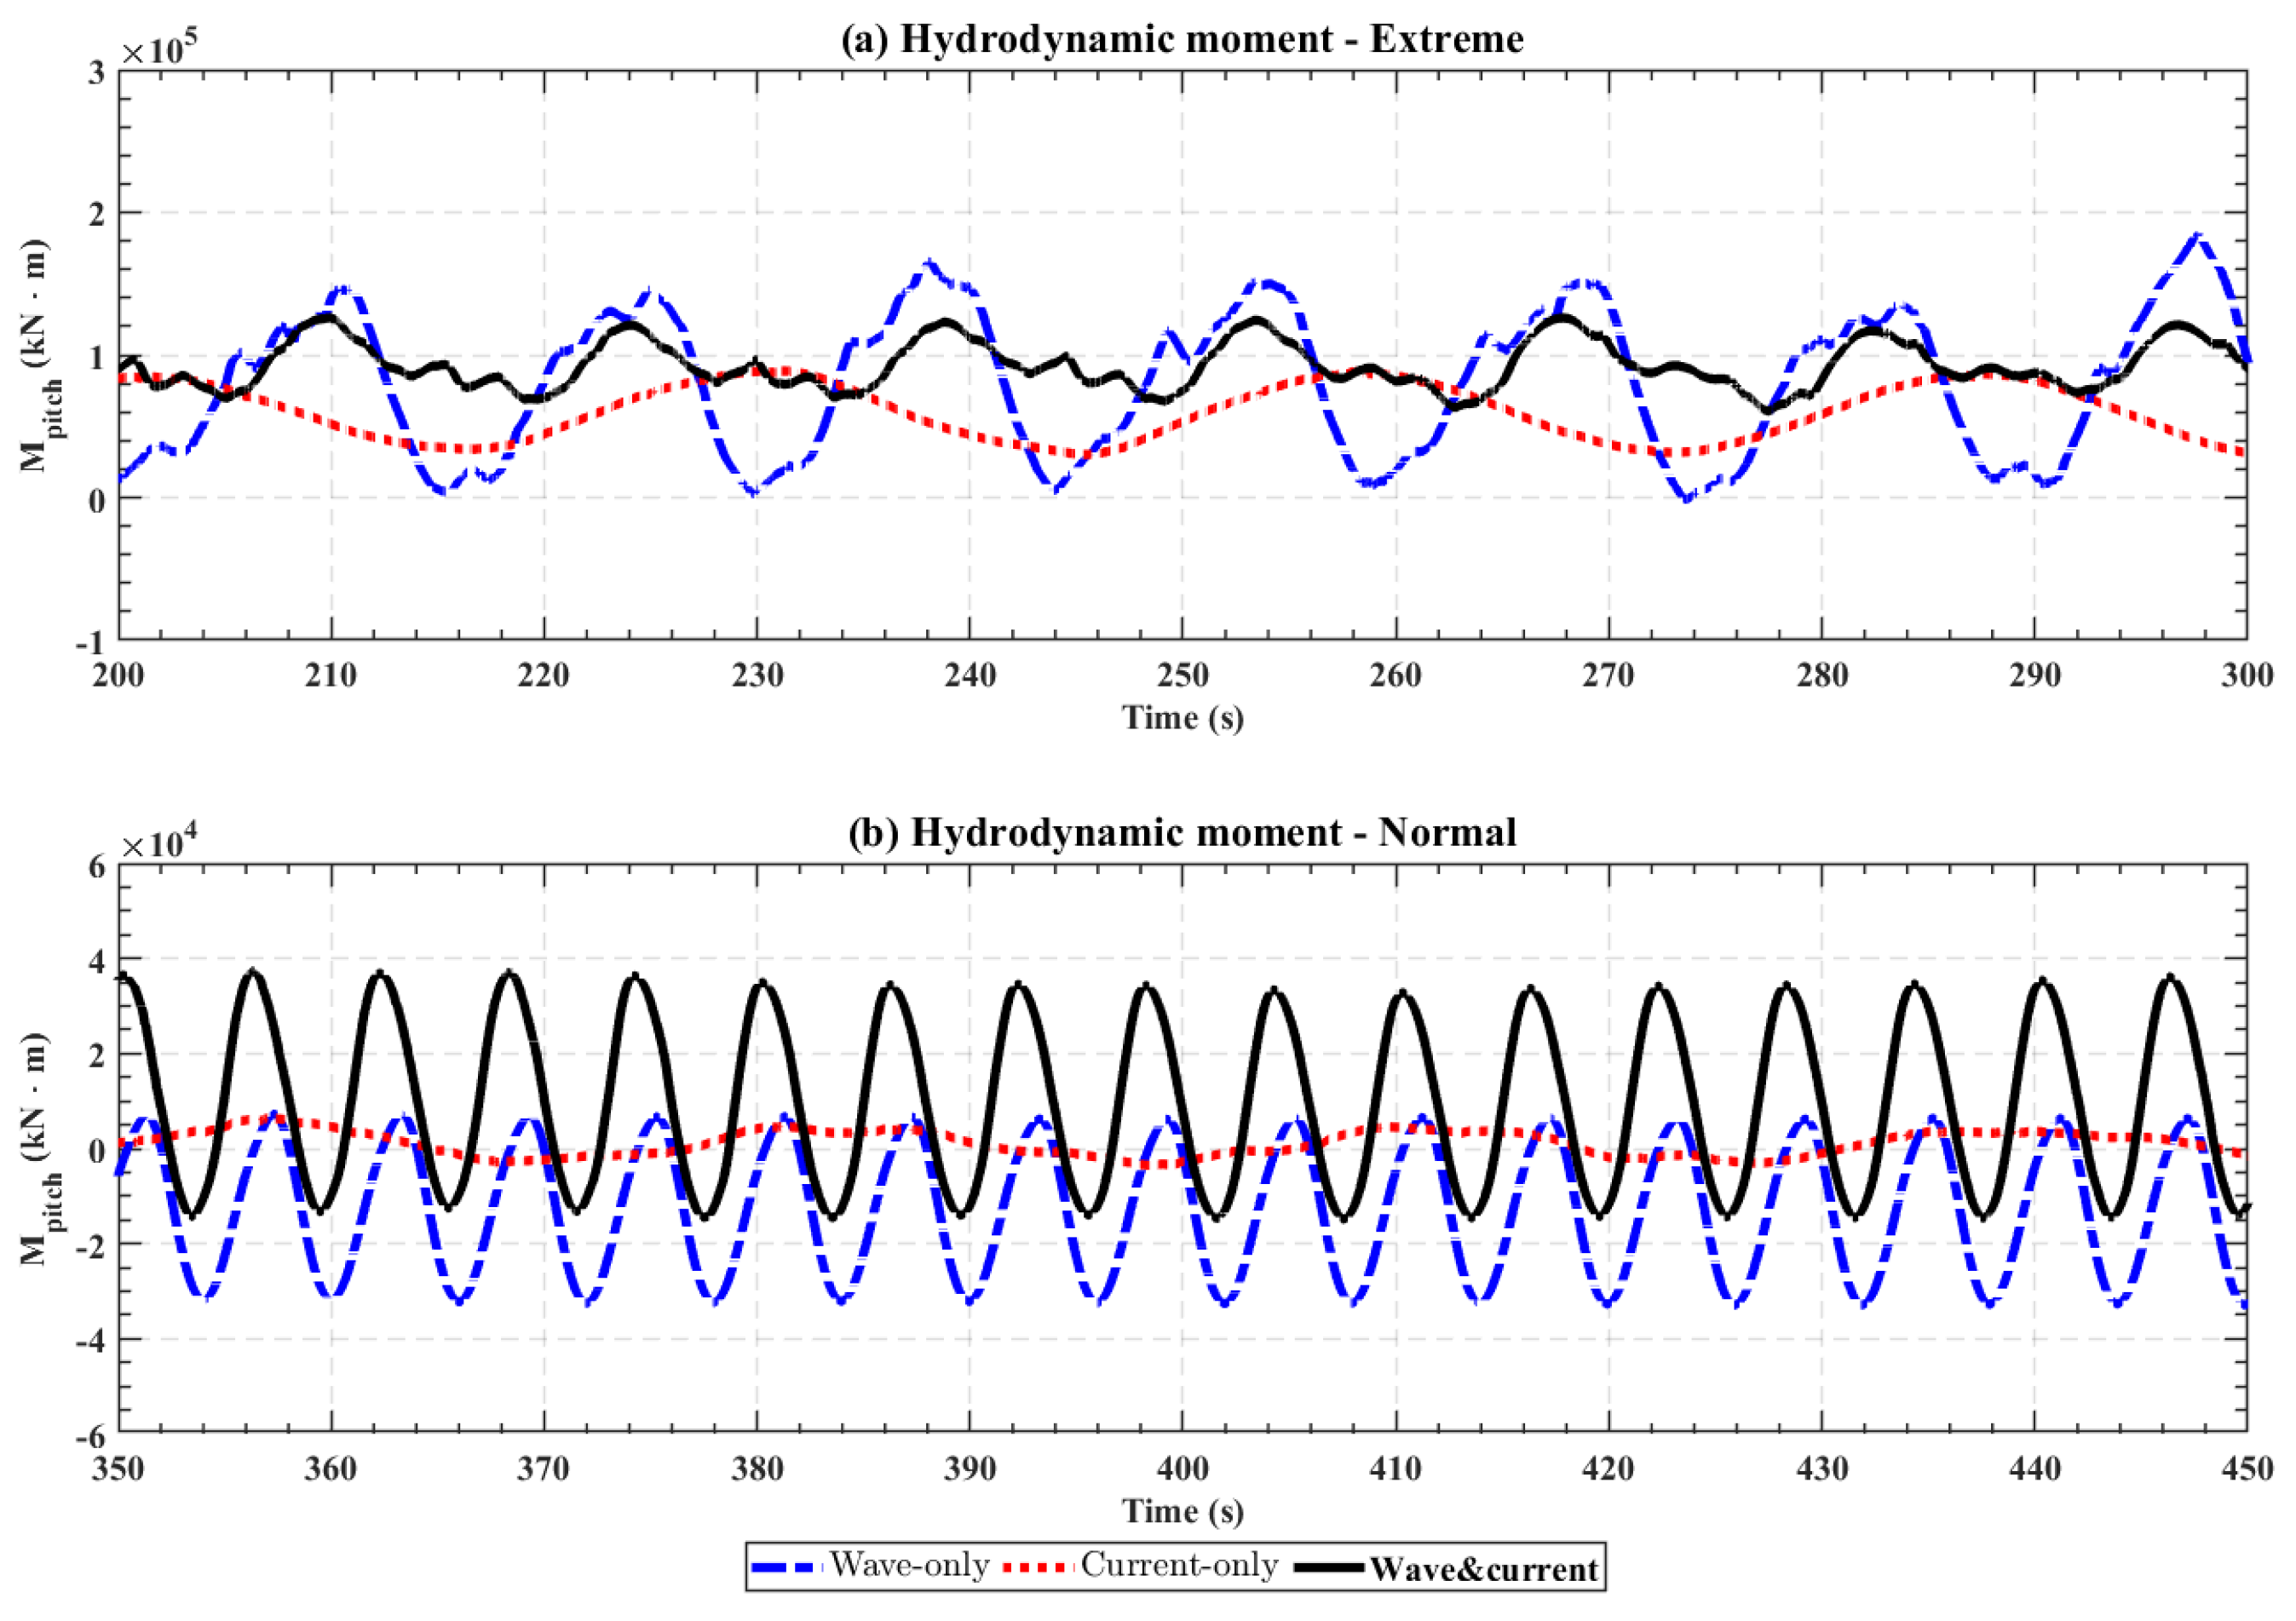
More significant WCI effects are obtained for the lift force. Comparing the time series shown in
Figure 14b and
Table 6, it can be seen that (1) the time-varying amplitude of the lift force in the wave–current case (black line, RMS: 0.1467) is larger than that in either the wave-only (blue dotted line, RMS: 0.0329) or current-only cases (red dotted line, RMS: 0.1268), and (2) a significant time-varying lift force is present in the current-only case, which is due to vortex shedding. The WCI effects on lift force can be better illustrated by comparing the spectrum shown in
Figure 14c. For the wave-only case (blue line), there is a primary spectrum peak at the wave frequency (0.068 Hz), which is referred to as the first harmonic. After adding a current (black line), the first harmonic is not changed, but some higher-order harmonics (e.g., with frequencies of 0.138 Hz, 0.206 Hz) are generated due to WCI, and their amplitudes are comparable to that of the first harmonic. These high-order harmonics increase the overall amplitude of the time-varying lift force. For the current-only case, the vortex-shedding-induced lift force gives a peak of the spectrum at 0.108 Hz, but in the wave–current case, this peak vanishes. This indicates that the periodic vortex shedding, which is dominant in the current-only case, is disrupted when strong waves are present. Overall speaking, WCI in the strong-wave–weak-current case increases the wave-induced lift force, but kills the current-induced (through vortex shedding) lift force.
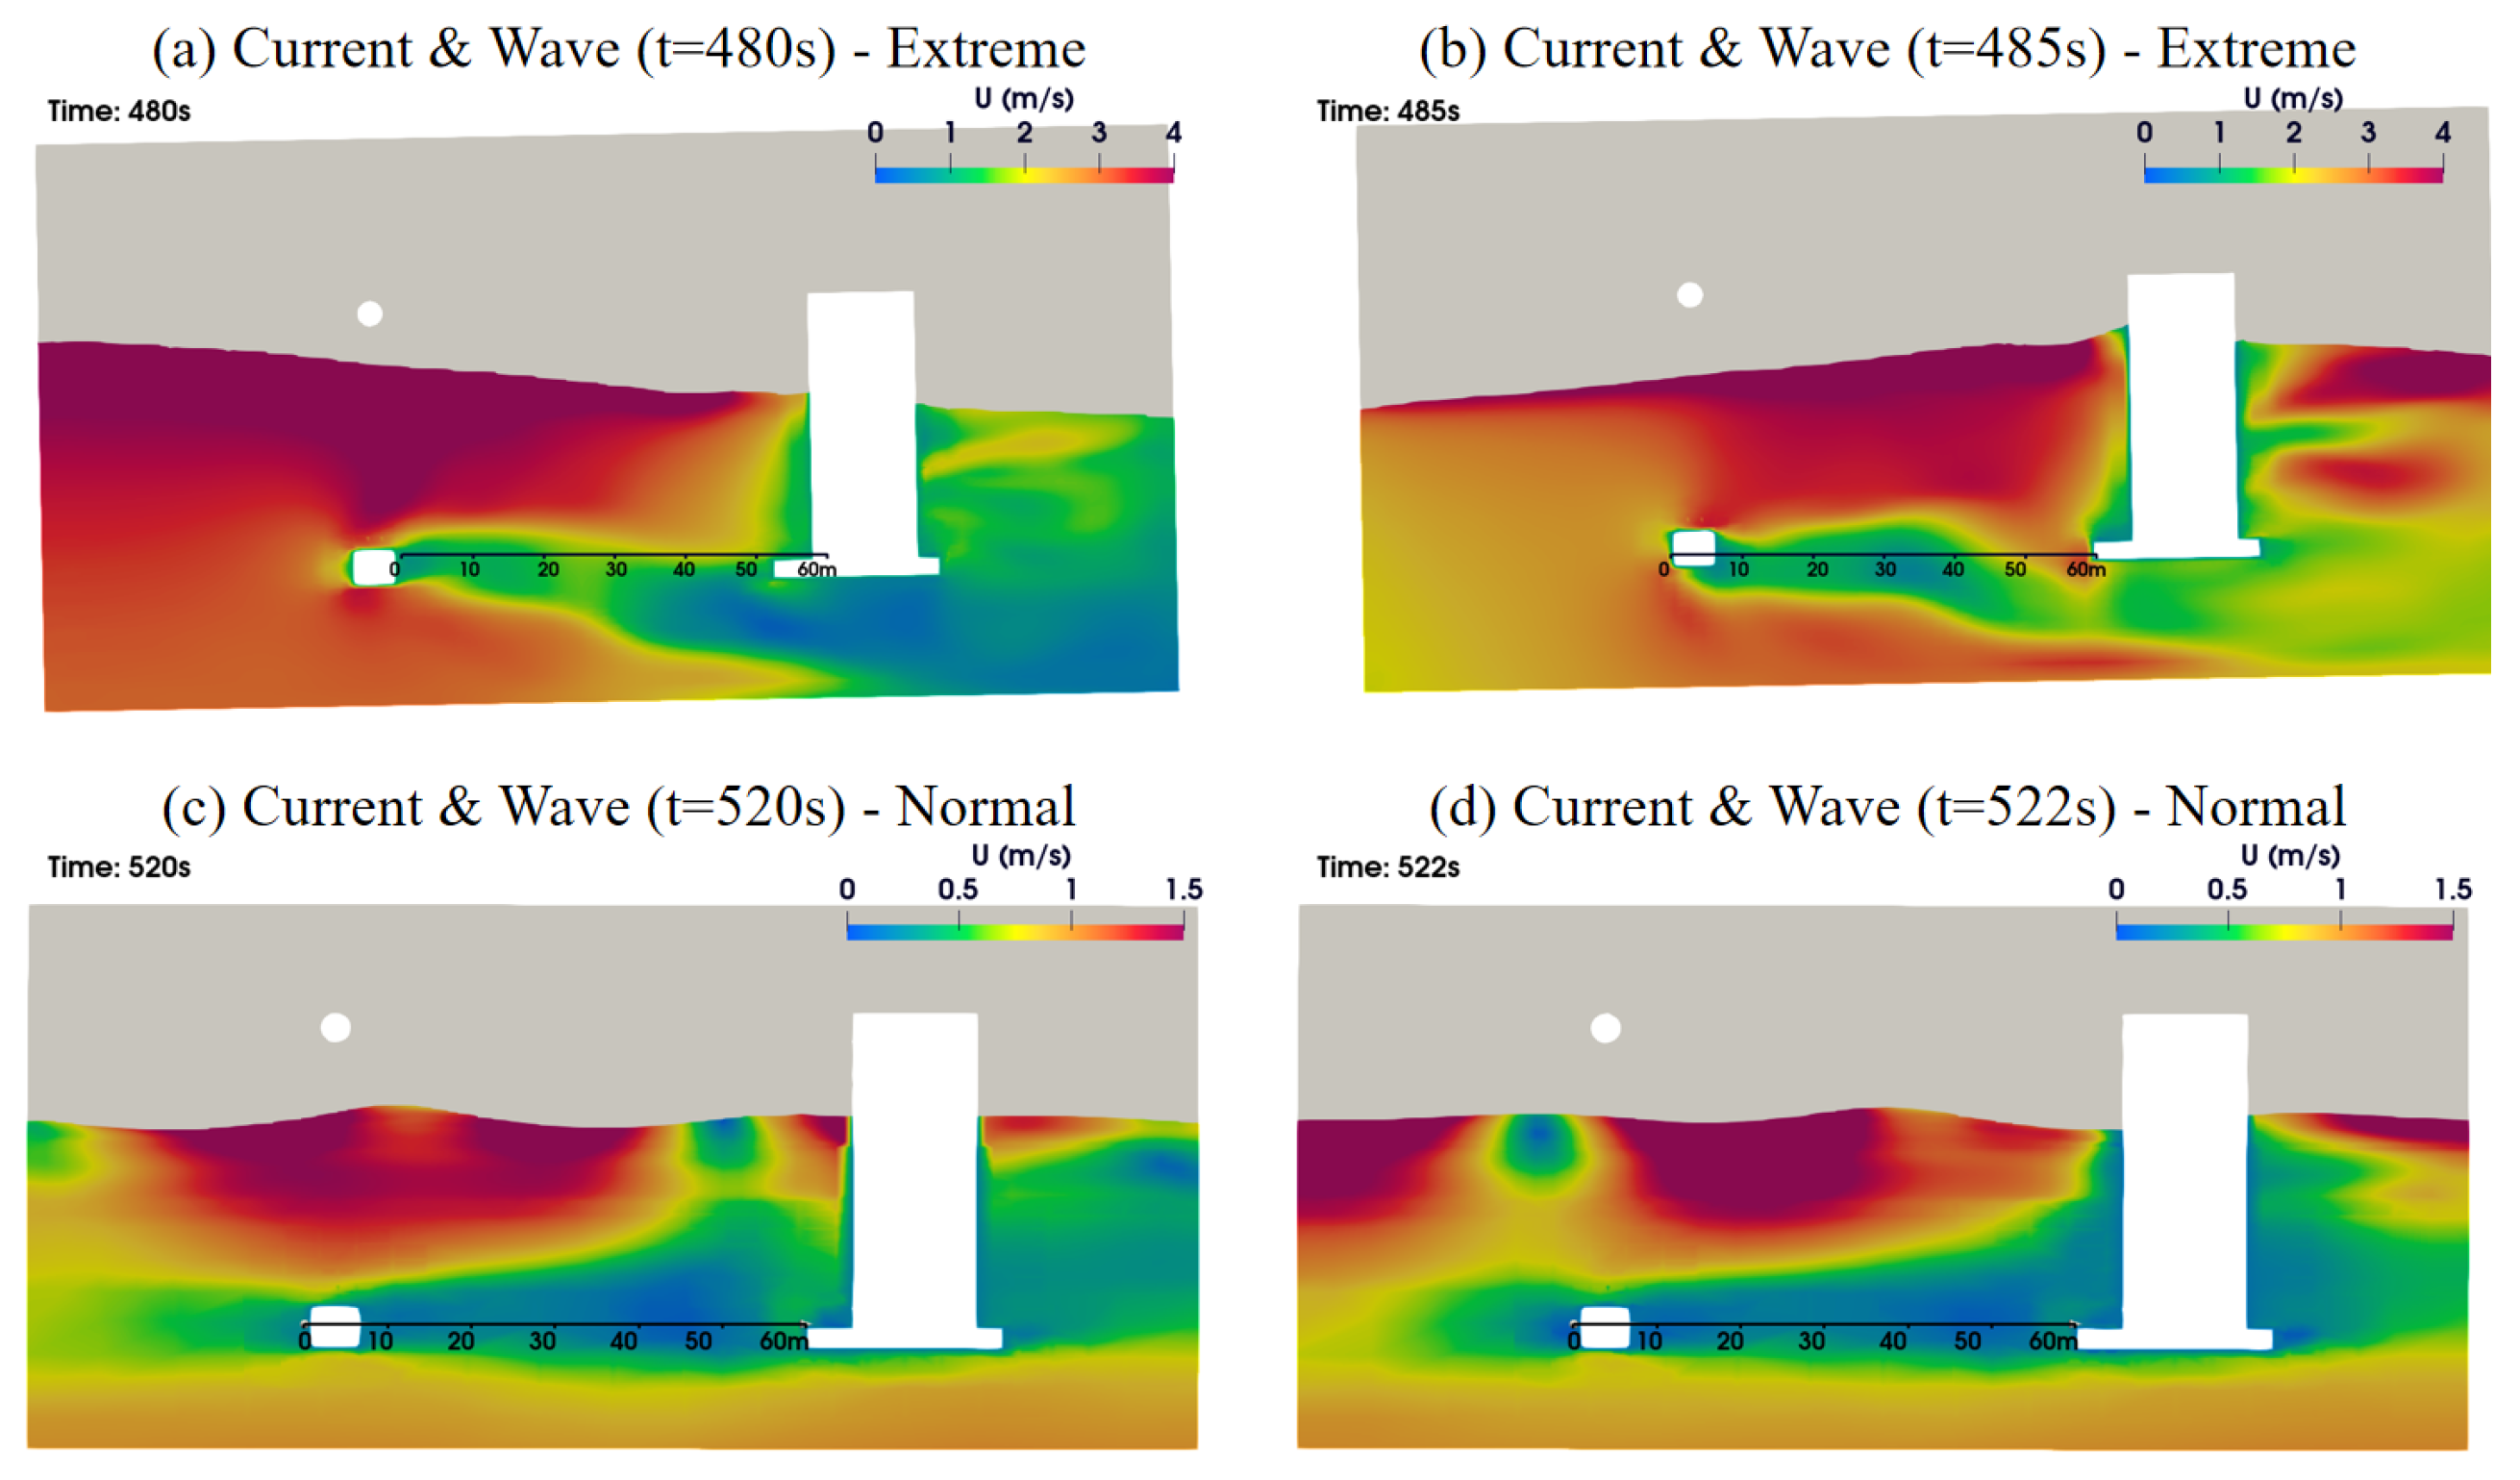
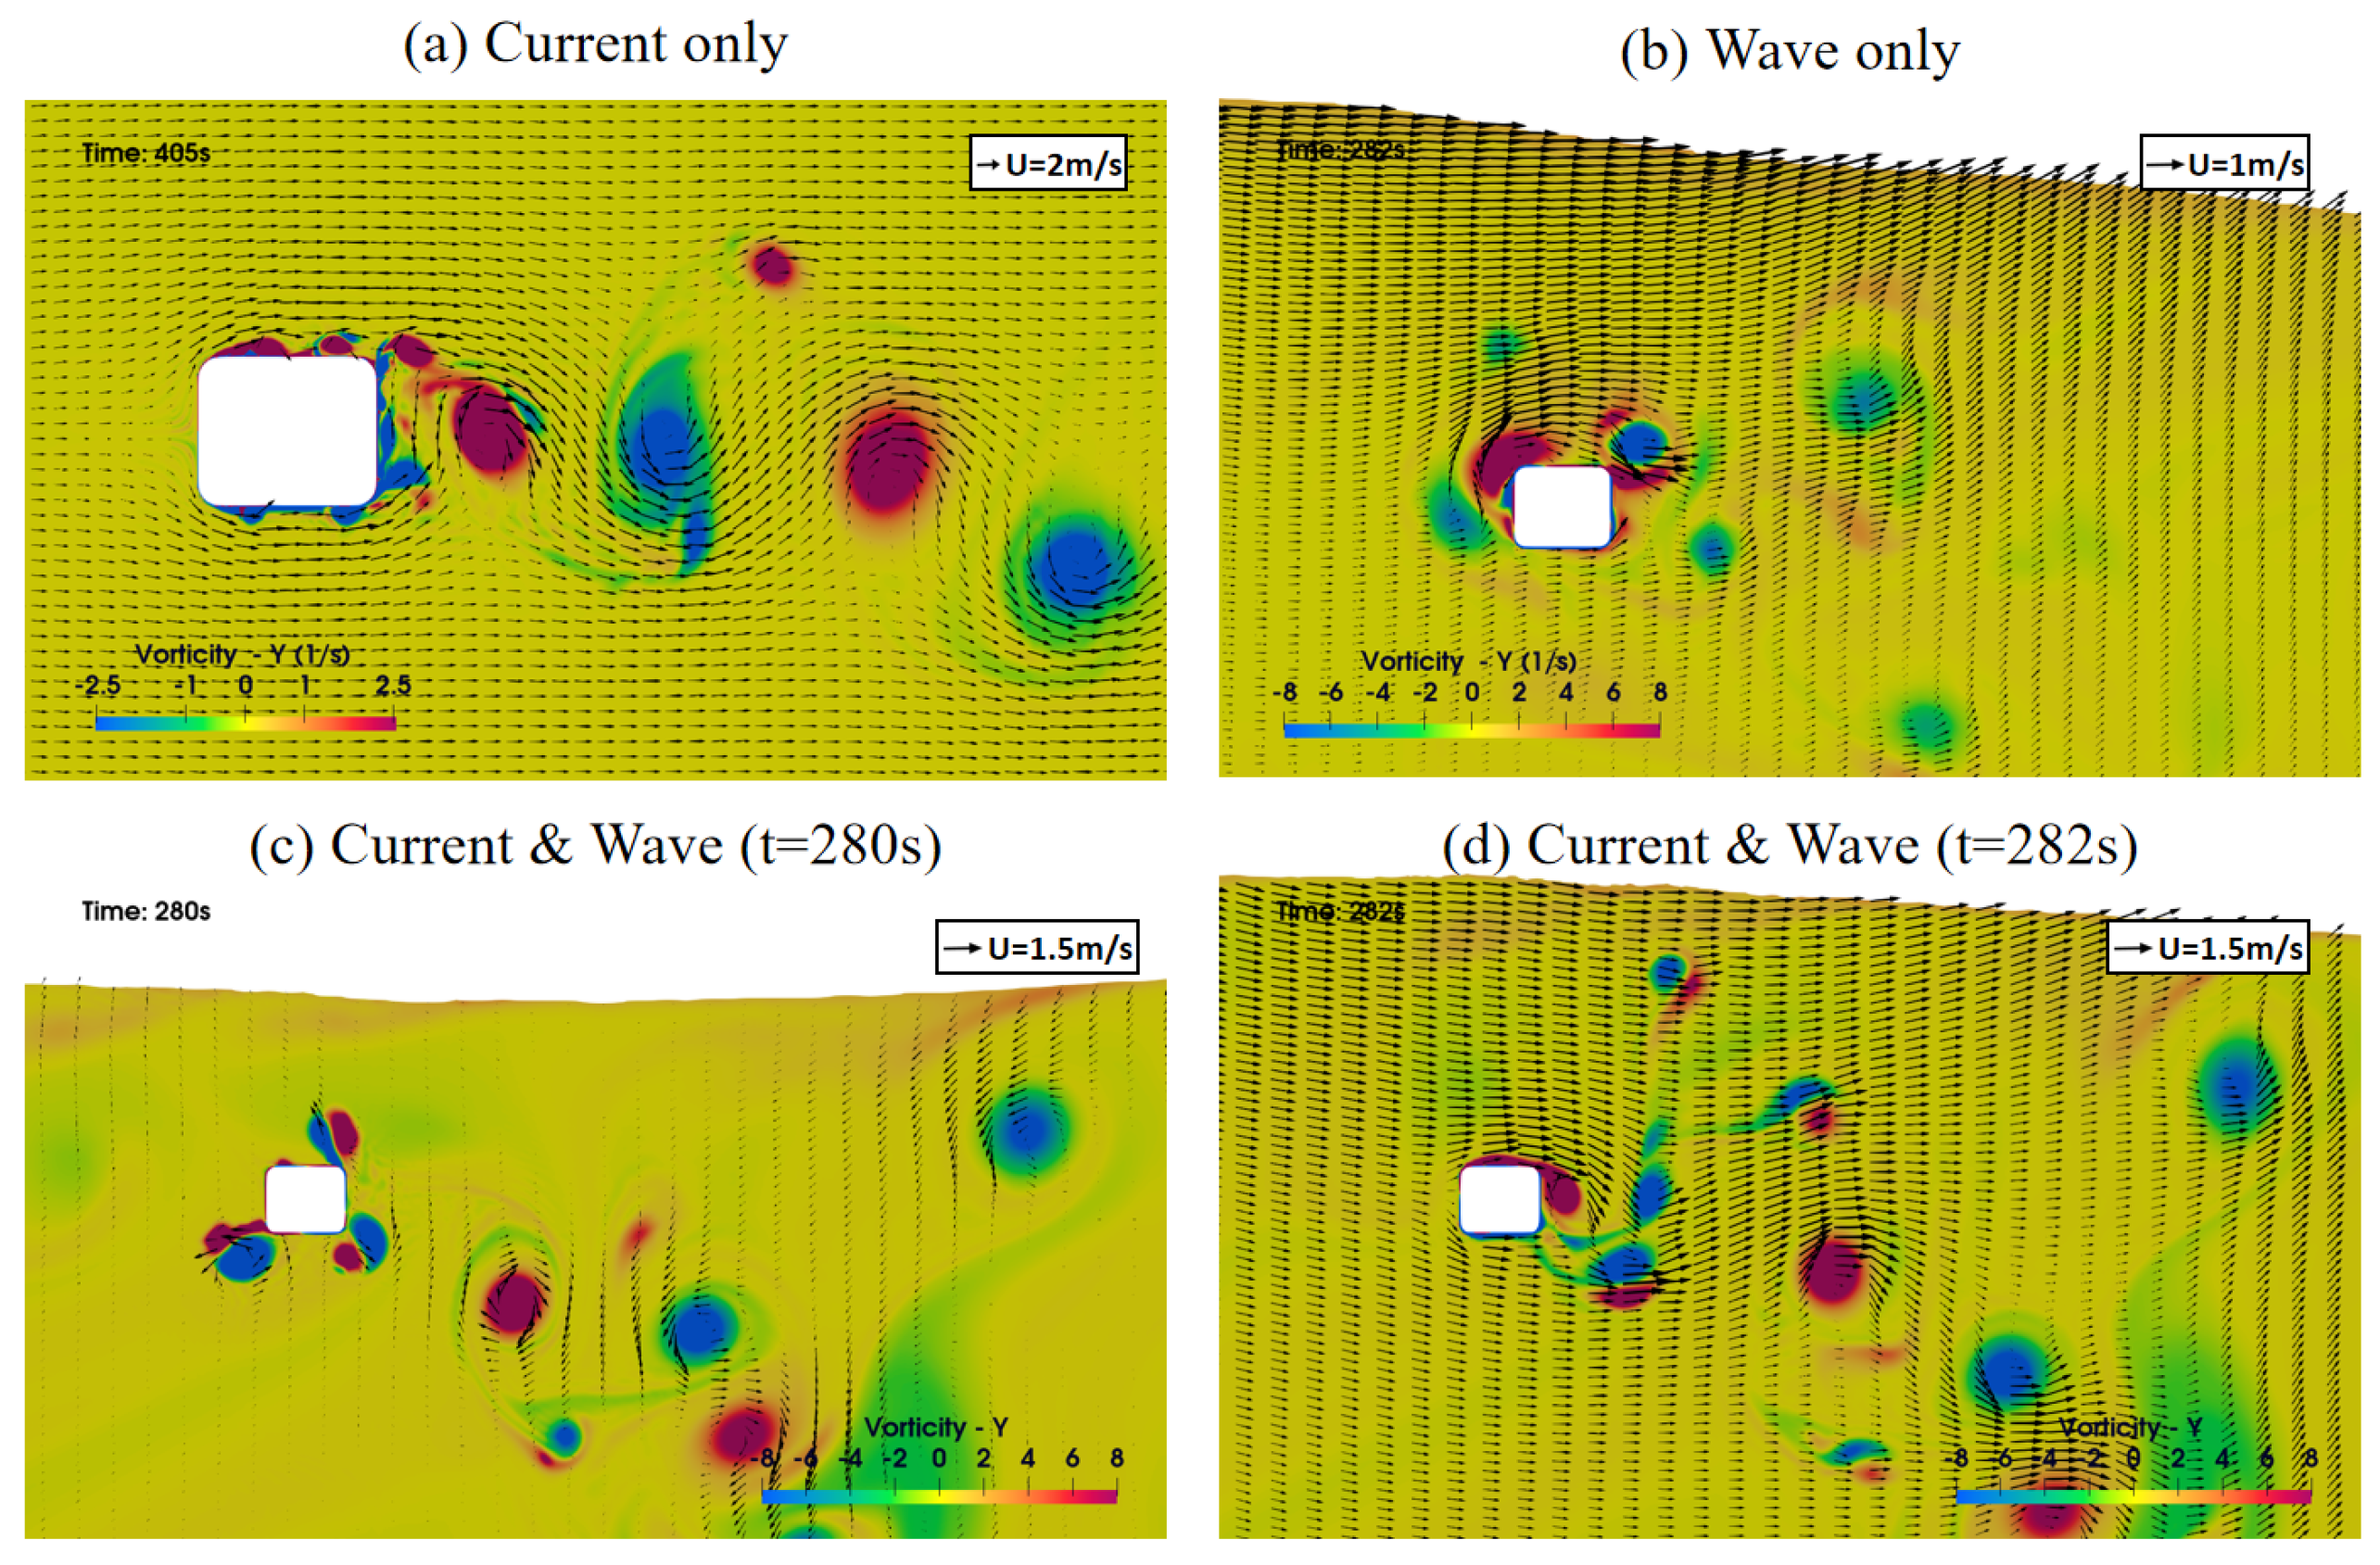
To interpret the vanishing of the vortex-shedding-induced lift force in the extreme wave–current case,
Figure 15 presents some snapshots of the flow around the submerged pontoon under three extreme cases. The background color represents vorticity, while the arrows indicate flow velocity vector. In
Figure 15a, the periodic vortex shedding under the current-only case is clearly visible at the downstream of the pontoon; the spacing between the two vortices is roughly 3∼4 m. This is characteristic of the classical vortex street, which results in periodic lift force fluctuations. In the wave-only case, as shown in
Figure 15b, the vortices are generated periodically on both upstream and downstream faces of the pontoon, and the shed vortices are much smaller and weaker than those in the current-only case. In the wave–current case, as shown in
Figure 15c, vortices also are generated on both upstream and downstream faces of the pontoon, which is similar to the wave-only case, so wave is the dominant factor for vortex generation. These vortices are carried to downstream by the current (
Figure 15d. The current velocity is 2 m/s, while the wave velocity at the depth of the pontoon is 1.8 m/s. Furthermore, the wave frequency is much higher than the frequency at which vortexes produced by current are shed into the downstream. Therefore, the oscillatory flow due to waves can reverse the flow direction at the pontoon (see
Figure 15c). The current does not have sufficient time to develop and eject a wake vortex before the waves reverse the local flow. In other words, a strong wave can heavily disrupt the vortex generation due to current, and therefore kills the lift force at the frequency of current-induced vortex shedding.
5.3. Strong Current Plus Weak Wave
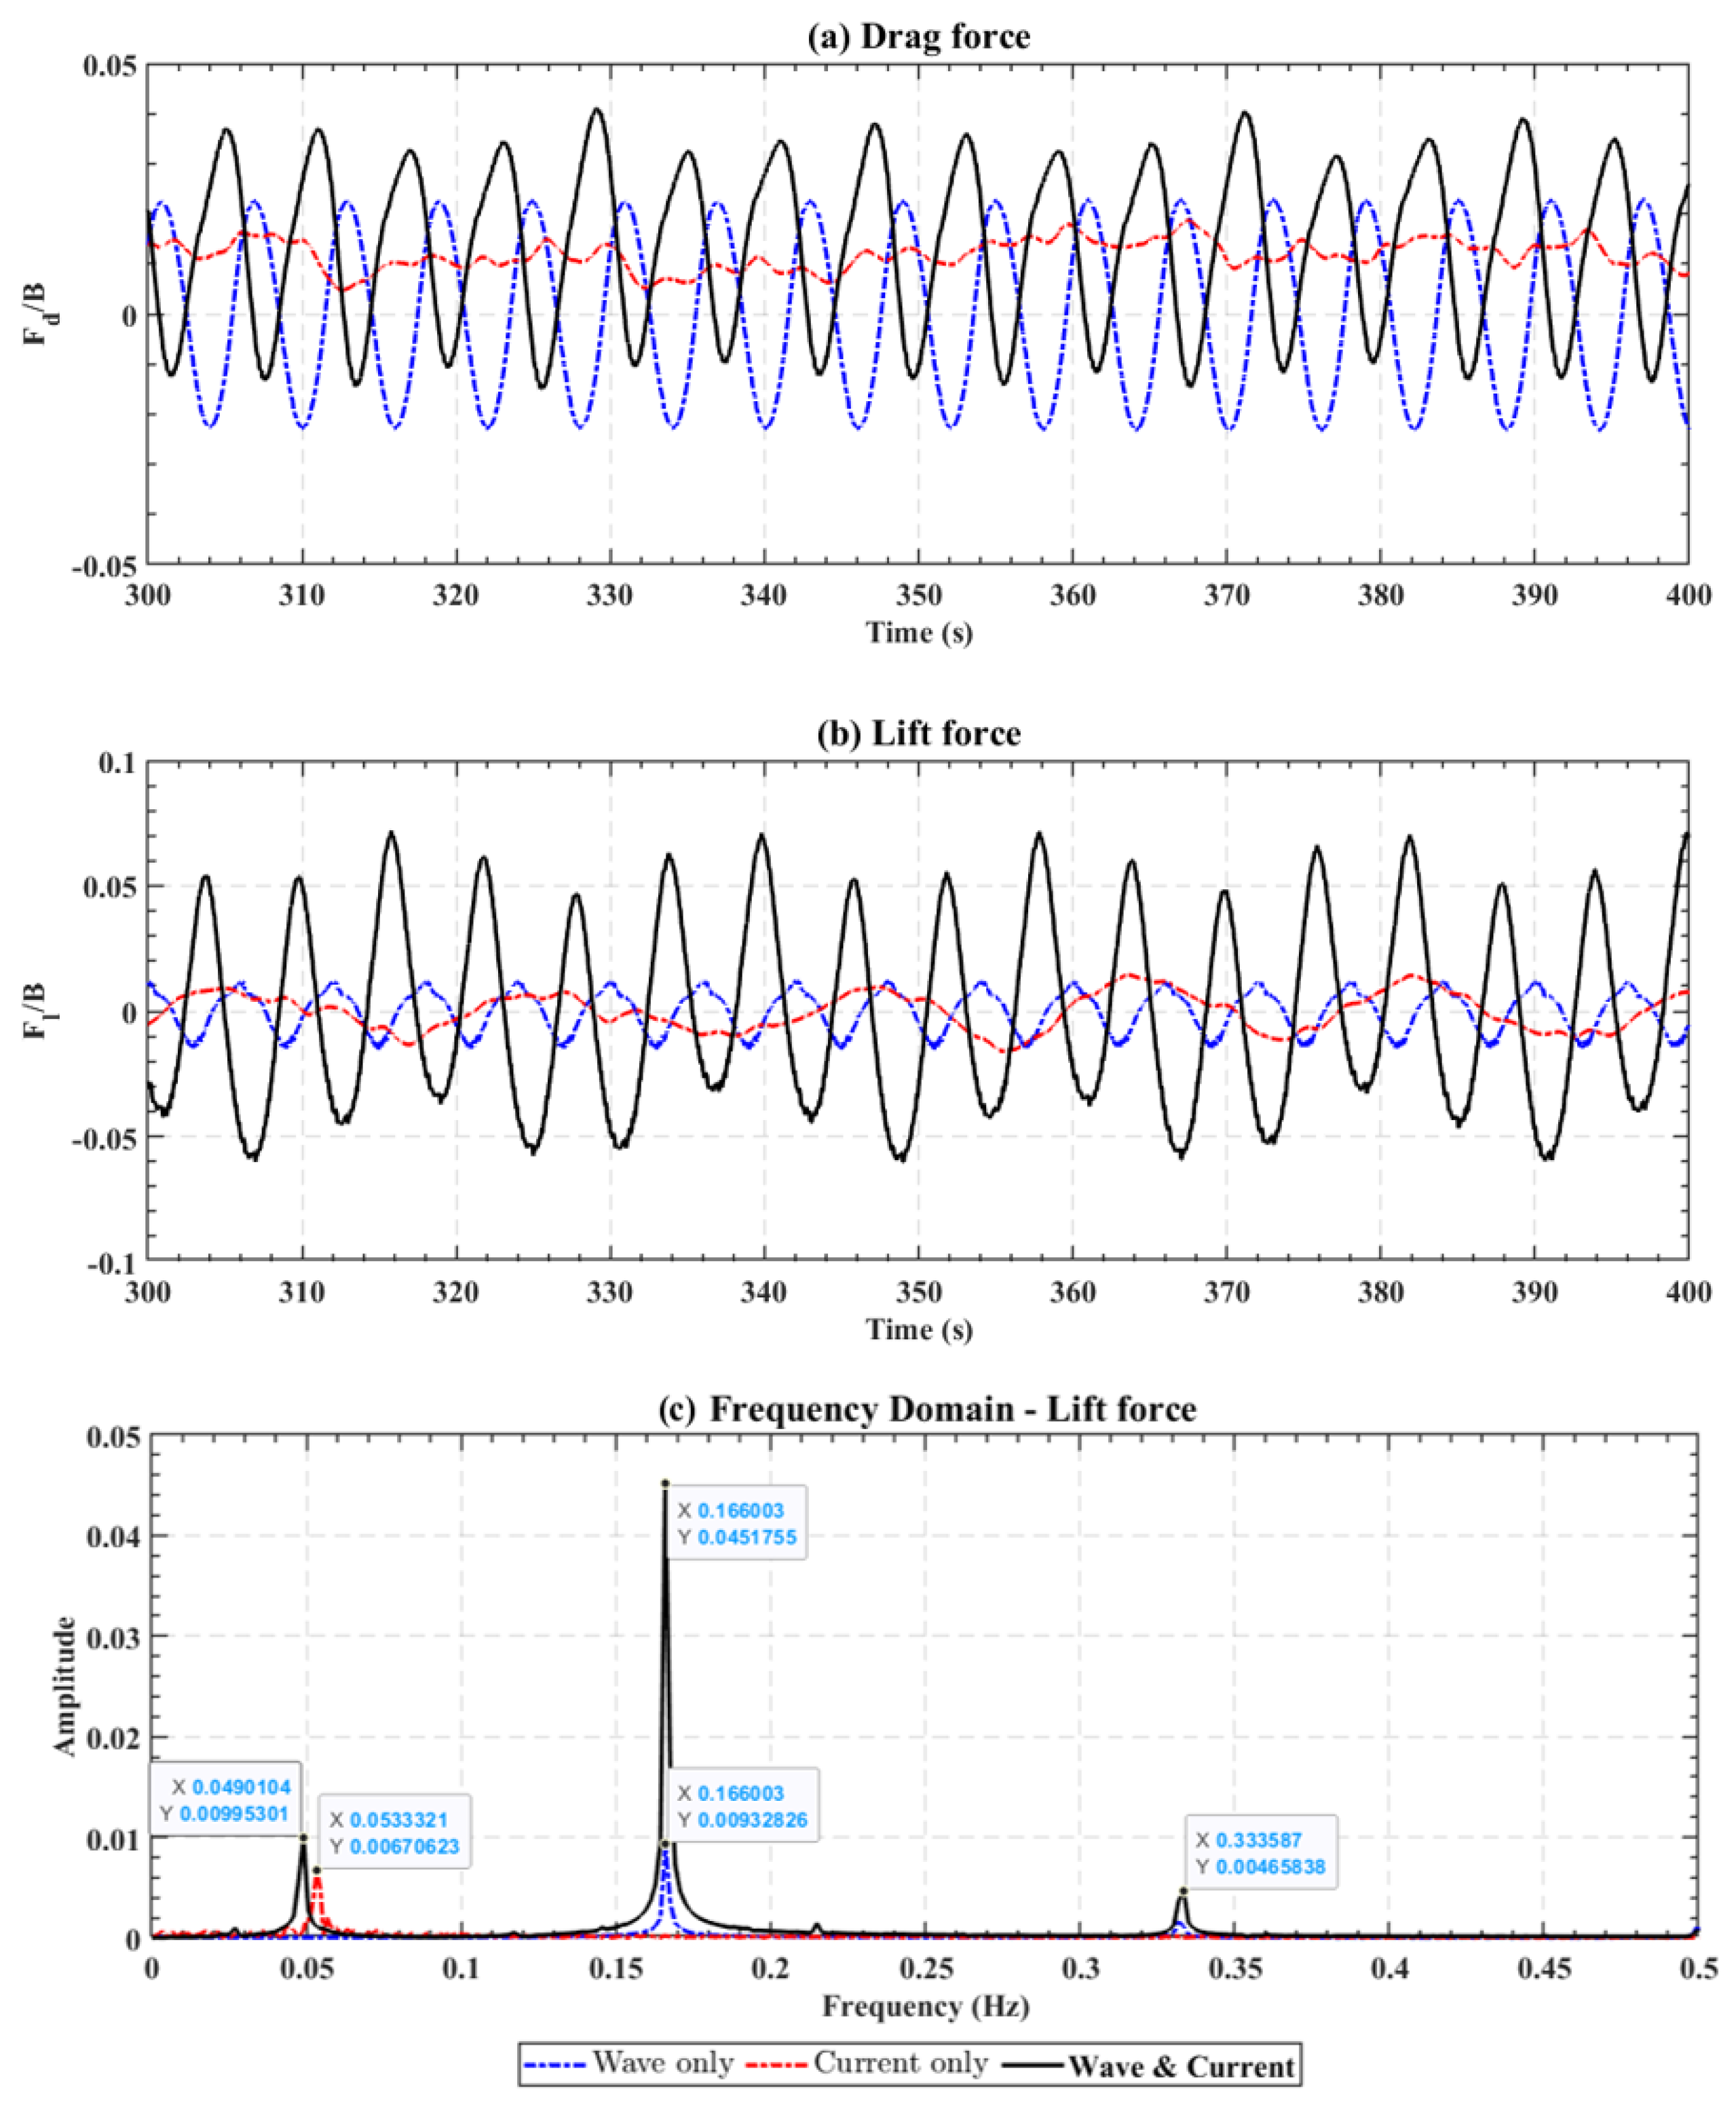
Similar to the extreme cases,
Figure 16 shows the time series of total drag force (or horizontal force), total lift force (or vertical force), and the spectra of the lift force. The mean and RMS values of drag and lift force are presented in
Table 6.
As shown in
Figure 16a and
Table 6, the WCI effects on drag force are similar to those in the extreme case. The time-varying drag force is mainly due to the wave, and the amplitude is not changed much by WCI. The mean drag force divided by buoyancy in the wave–current case is 0.0137, which is large than the sum of wave-only (−0.0002) and current-only (0.0118).
The WCI effects on lift force the the normal case are different from those under the extreme case. As shown in
Figure 16b, the lift force in the wave–current case exhibits significantly greater time variation compared to the wave-only or current-only cases. The spectral analysis reveals more details. The primary peak of the lift force spectrum, which is at the wave frequency, is greatly enhanced by the current. Also, the higher-order harmonics (e.g., at 0.334 Hz or twice the wave frequency) are also enlarged. This suggests that the interaction between the wave-induced and the current-induced vortex shedding introduces additional frequency components, amplifying the oscillations in the lift force. In contrast to the extreme-condition simulations, the local peak around the vortex shedding frequency (around 0.05 Hz) is present in both the current-only and wave–current cases. This suggests that the wave does not eliminate vortex shedding caused by the current under strong-current, weak-wave cases.
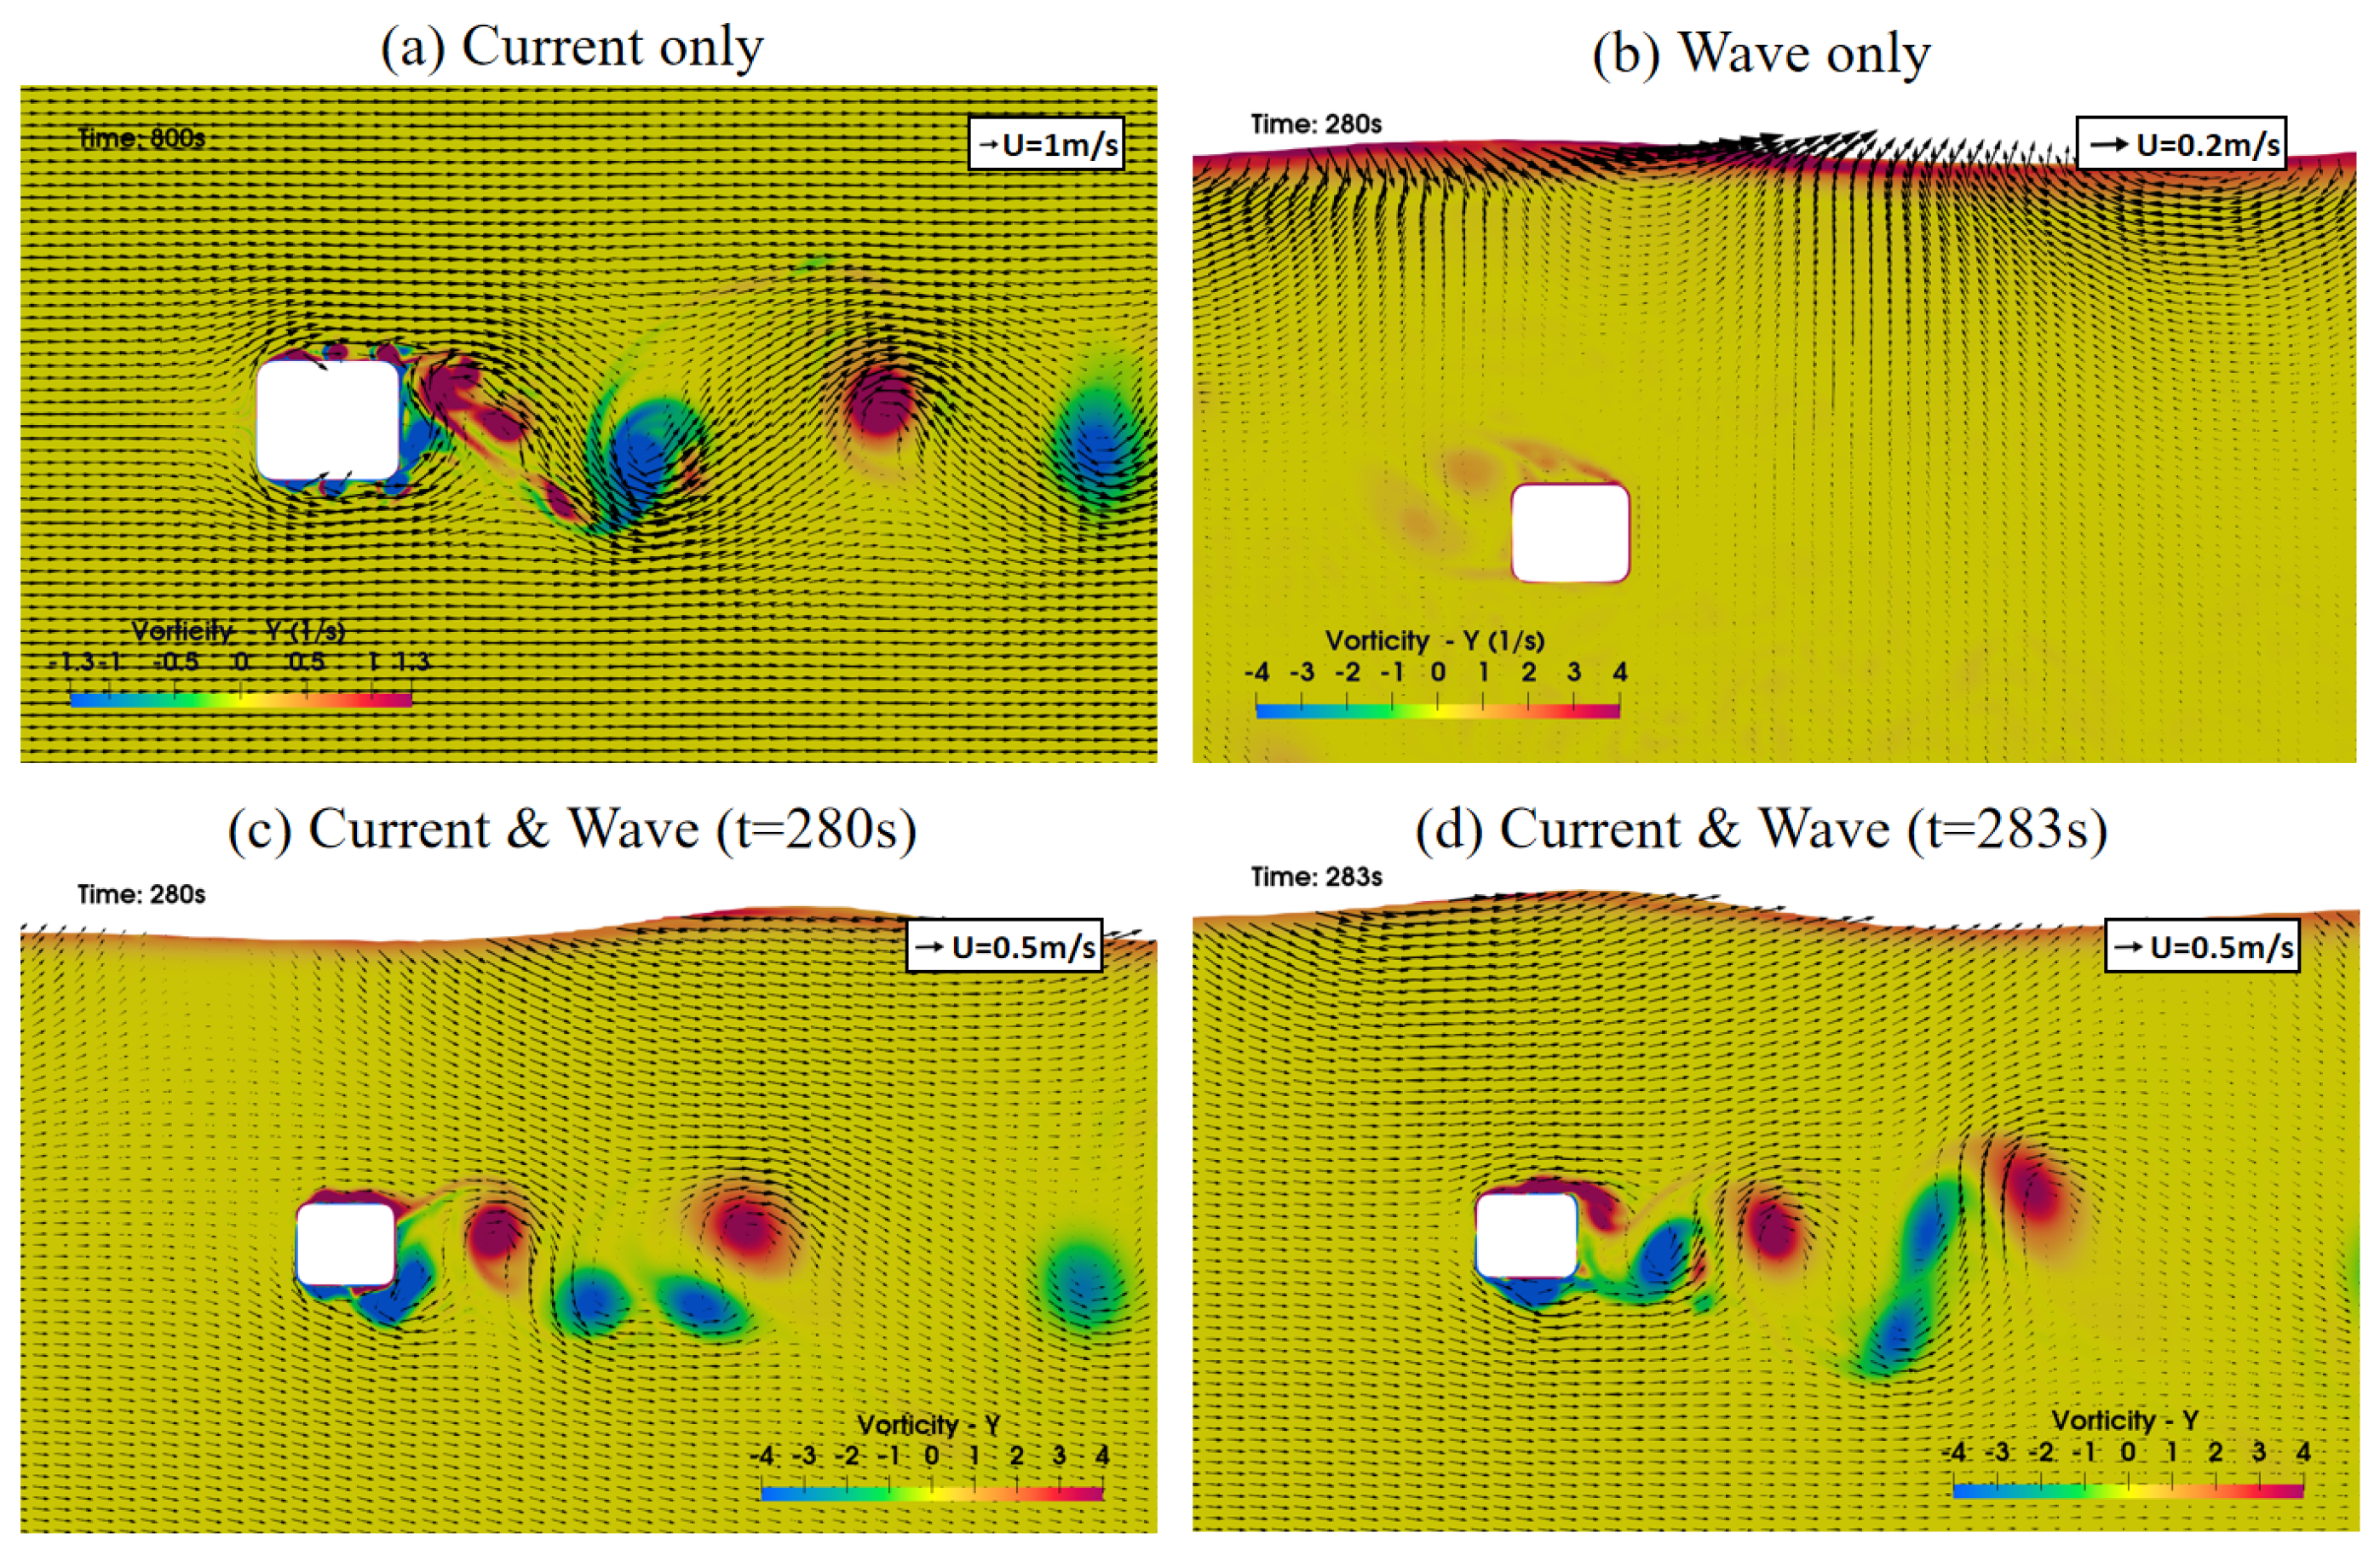
To interpret the WCI effects on lift force,
Figure 17 presents snapshots of the flow field around the submerged pontoon under the three different normal cases. In the current-only case (
Figure 17a), periodic vortex shedding is clearly visible at the downstream of the pontoon, and the spacing between the two vortexes is roughly 6∼7 m. However, in the wave-only case (
Figure 17b), almost no vortex shedding occurs, since the wave-induced velocity around the pontoon is very low in the normal case. In the wave–current case (
Figure 17c,d), vortex shedding is similar to those in the current-only case, so vortex shedding is still controlled by the current. In the normal-condition simulations, the current velocity is 1 m/s and the wave velocity is only 0.1 m/s near the pontoon, and the wave frequency is lower than the vortex shedding frequency. Thus, the vortex-generation process by the current is only slightly disturbed by the waves. This is why a peak at the vortex-shedding frequency is still present in the wave–current case.
5.4. Implications for Three Simulations
In the analysis of drag force under strong waves plus weak current cases (extreme cases) and strong current with weak wave cases (normal cases), several key observations emerge. First, the time-varying component of the drag force (corresponding with RMS values of surge in 3D simulations) is primarily influenced by the waves in both the wave-only and wave–current cases, even in strong current and weak wave cases. Second, the time-average drag force (corresponding with mean values of surge in 3D simulations), which represents the system’s long-term response, is predominantly determined by the current. However, in our simulations, the presence of waves may lead to an increase in the time-averaged drag force, while the presence of currents may also contribute to an increase in the time-varying drag force. Therefore, the influence of current and wave on force and motion cannot be linearly superimposed. Thus, in our 3D simulations, WCI simulations are necessary for accurately capturing the flow field and the forces acting on structures.
On the other hand, the analysis of lift force is as follows. For strong wave plus weak current (the extreme case), the time-varying lift force is mainly produced by the wave, and the current slightly changes the amplitude of time variation (i.e., adding higher harmonics). The vortex shedding due to current is eliminated by a strong wave, so the peak at vortex-shedding frequency is eliminated in the lift force spectrum. For strong current plus weak wave (the normal case), the current significantly increases the time-varying lift force produced by waves, and the waves have marginal effect on the vortex shedding due to current, so a local peak at the vortex-shedding frequency is present in the lift force spectrum in the wave–current case. The time-varying lift force on the submerged pontoon generate a pitch moment. In both extreme and normal cases, the 2D simulations show that the wave-frequency time variation of the lift force is dominant, due to either the elimination of current-induced vortex shedding (due to a strong wave) or significant enhancement of the wave-frequency lift force (due to a strong current). Thus, in our 3D simulations, the time-varying pitch moment in wave–current cases appears to be at the wave frequency, so the vortex-induced pitch motion observed in the current-only case seems to be eliminated by adding a wave.
In conclusion, in the three-dimensional simulation of the floating platform, several phenomena have been observed, such as the nonlinearity of WCI, the disappearance of VIM under conditions of strong waves and weak currents, and the enhancement of wave forces by currents under conditions of strong currents and weak waves. These phenomena have been validated in the two-dimensional high-resolution mesh cases. The results confirm that, despite limitations in computational resources that prevent achieving optimal mesh resolution in the three-dimensional calculations, leading to some distortion in the simulation of the flow field and vortex shedding, relatively accurate results and patterns can still be obtained, meeting engineering requirements. However, if higher precision is required for the flow field and vortex shedding points, finer meshing must be used for the simulations.
6. Conclusions
This study investigates the dynamic response of a semi-submersible floating wind turbine (FOWT) platform under wave–current flows using computational fluid dynamics (CFD) simulations. Numerical simulations with coarser three-dimensional mesh provide the same conclusions as two-dimensional fine meshes, and three-dimensional calculations can satisfy basic engineering requirements. The key findings of this research are summarized as follows.
Firstly, wave–current interaction (WCI) introduces a complex, nonlinear interaction that significantly alters the platform’s dynamic response. This nonlinearity manifests in both the motion of the platform and the hydrodynamic forces acting upon it, as the wave and current fields are not independent but rather influence one another in intricate ways. Specifically, the current primarily affects the time-averaged (mean) values, while the wave primarily impacts the time-varying (dynamic) component. The interplay between these two forces results in an amplified or diminished response that cannot be captured by linear models. As a result, traditional methods such as potential flow theory, which assume linear superposition of wave and current effects, often fail to provide accurate predictions. These methods overlook the coupled nature of wave–current dynamics, thus failing to capture the full complexity of the system’s behavior.
Second, the presence of waves in WCI can effectively suppress VIM that typically occurs in current-only cases, representing a characteristic example of WCI. This suppression results from the interaction between wave and current velocities near the platform, especially when the wave field is strong and exhibits high-frequency fluctuations. The periodic and high-frequency variations in wave speed disrupt the conditions necessary for vortex shedding, causing the VIM to disappear. Consequently, the force frequency shifts from the platform’s natural frequency in current-only cases to the wave frequency in wave–current cases, which may be beneficial for structural stability. As a result, the platform becomes more stable in rotational motion under wave–current cases compared with current-only cases. The combined effects of WCI lead to a complex and nonlinear fluid–structure interaction, where both wave-induced and vortex-induced dynamics influence the platform’s overall response.
Third, the presence of current in WCI can significantly enhance the wave dynamics, providing another characteristic example of WCI. When the wave is weak and the frequency is low, the strong current flow can lead to a pronounced effect on the wave force, altering the flow field and modifying the platform’s response. Compared to the wave-only case, the platform experiences a higher force at the wave frequency due to the synergistic influence of the current. As a result, the platform’s dynamic response is not only influenced by the wave characteristics but also significantly shaped by the current, thereby enhancing the wave force in WCI.
The results of this study provide invaluable insights for the design and optimization of floating wind turbine platforms, offering significant implications for both research and engineering applications. Unlike linear models, wave–current interactions (WCIs) introduce dynamic effects that can either amplify or dampen platform motion, leading to distinct differences in performance compared to single-condition scenarios. The findings emphasize the critical importance of integrating wave–current interactions (WCI) into the simulation process, as these interactions exhibit complex, nonlinear behaviors and sometimes more extreme loading conditions that can substantially influence platform dynamics. Moreover, this study demonstrates that simulating these intricate wave–current interactions in three-dimensional models, even with relatively coarser meshes, offers a practical solution for meeting basic engineering requirements. This approach not only significantly reduces computational costs but also maintains a high level of accuracy, making it a valuable tool for the preliminary design and optimization of floating wind turbines. Ultimately, these advancements contribute to the ongoing effort to enhance the efficiency and stability of floating wind turbines, playing a pivotal role in the global shift toward sustainable energy production.


